Article

Numerical Investigation on Heat Transfer and Flow Resistance Characteristics of Superheater in Hydrocracking Heat Recovery Steam Generator

1
Liaoning Engineering Research Center of Energy Saving and Green Low Carbon Technology for Process Industry, Northeastern University, Shenyang 110819, China
2
MODUL (Liaoning) Technology Ltd., Shenyang 110819, China
3
Suzhou Hailu Heavy Industry Co., Ltd., Suzhou 215600, China
4
Shenyang Academy of Environmental Sciences, Shenyang 110167, China
*
Author to whom correspondence should be addressed.
Energies 2023, 16(17), 6266; https://doi.org/10.3390/en16176266
Submission received: 3 July 2023 / Revised: 18 August 2023 / Accepted: 21 August 2023 / Published: 29 August 2023
(This article belongs to the Special Issue Blue and Green Hydrogen Production)

Abstract

:
The heat recovery steam generator (HRSG) was utilized to recover the waste heat resources of the catalyst’s regenerated gas with the objective to reduce the energy consumption of the hydrocracking process. In this study, the flow resistance and heat transfer performance of the superheater tube bundles in the hydrocracking HRSG were investigated via numerical simulation. The performance evaluation criterion (PEC1) was applied to characterize the comprehensive heat transfer performance of superheater tube bundles. The results showed that as the transverse tube pitch increased, the Nusselt number (Nu) showed a monotonically increasing trend, the Euler number (Eu) showed a monotonically decreasing trend, and PEC1 showed a monotonically increasing trend. As the longitudinal tube pitch increased, Nu exhibited a monotonically increasing trend, Eu showed a monotonically decreasing trend, and PEC1 showed a monotonically increasing trend. In the scope of the simulated results, as the transverse and longitudinal tube pitches were 110 mm and 95 mm, respectively, PEC1 reached the maximum value. Compared with the primary structural parameters, PEC1 increased by 2.32% and 8.50%, respectively. Finally, a new correlation was proposed to predict Nu and Eu of the superheater tube bundles in the hydrocracking HRSG.

1. Introduction

The petrochemical industry provides basic raw materials for people’s life and social production. It is an important pillar industry of the Chinese national economy. According to statistics, the petrochemical industry accounts for as much as 12% of the total industrial economy and has a pivotal position in industry [1,2,3,4]. Hydrocracking is a common process in the petrochemical industry, in which heavy oil is cracked into light oil with the conditions of hydrogen and the catalyst [5,6,7]. However, in the process of hydrocracking, coking occurs on the catalyst surface. Coking can lead to pipeline blockages, catalyst deactivation, and other issues that raise production costs [8,9,10]. According to statistics, hundreds of thousands of tons of petrochemical waste catalysts are produced every year in China [11,12,13]. The coke burning method is commonly used in industry to regenerate the catalyst, to reduce environmental hazards and improve the economic benefits of enterprises. A large amount of high-temperature regeneration gas is generated in the coke burning and regeneration process of the waste catalysts. The key strategy for reducing the energy consumption of hydrocracking in China is the waste heat utilization of the regeneration gas, which is a significant energy saving and emission reduction link in the hydrocracking process. The heat recovery steam generator (HRSG) is a commonly used piece of energy-saving equipment in industry, which is often used to recycle and utilize the waste heat resources carried by the high-temperature gas. Therefore, the heat exchange capacity of the hydrocracking HRSG directly determines the energy saving and consumption reduction performance of the hydrocracking system.
The superheater is an important part of the HRSG, which undertakes the task of heating saturated steam to superheated steam. The heat absorption of the superheater can reach 30% of the total heat transfer of the HRSG [14,15]. It can be said that the heat exchange performance of the HRSG is directly influenced via the heat exchange performance of the superheater. Thus, it is worth understanding the flow and heat transfer processes of the superheater of the hydrocracking HRSG to improve the heat exchange performance of the HRSG. To the best of our knowledge, researchers have explored flow and heat transfer processes of superheaters in boilers and HRSGs, and they have obtained many universal results. There is no study in the literature on the flow resistance and heat transfer performance of superheaters in the hydrocracking HRSG, because the research hotspots of hydrocracking are the hydrocracking technology and the catalyst. Due to the differences in process parameters, working conditions, and structural parameters, the existing research results cannot be applied to the superheater tube bundles in the hydrocracking HRSG. The following literature review is conducted in two directions: research on the flow heat transfer characteristics of superheaters and research on evaluation indexes.
Maakala et al. [16] developed a model that can predict and calculate the HRSG via computational fluid dynamics (CFD). The accuracy of the model was validated by experimental data and the 3D flow distribution and temperature distribution of the superheater of the HRSG were obtained. Qi et al. [17] integrated the one-dimensional analytical model with the 3D CFD model to analyze the superheater’s heat transfer efficiency. The influence of the thickness of the oxide on the wall temperature of the superheater tubes was obtained. Based on the control-volume-based Finite Element Method, Madejski et al. [18] explored the flow and thermal performance of the superheater of a rotating fluidized bed boiler at full load and steady state. Taler et al. [15] proposed a new method for the numerical simulation of superheaters, which has the advantages of simple calculation formula and short calculation time. Via contrasting the computed results with the CFD findings, the correctness of the novel approach was established. Bang et al. [19] studied the flow resistance and heat transfer properties of a superheater in the boiler and explored the influence of circular fins with different curvature angles on the Nusselt number (Nu), pressure drop, and steam temperature. Laubscher et al. [20,21,22] studied the platen superheater in a 620 MW boiler. A one-dimensional model was utilized to simulate the flow and heat transfer processes on the steam side, and a 3D CFD model was built based on the finite volume approach to evaluate flow resistance and heat transfer performance on the gas side. This new coupling modeling method can be used to obtain the temperature distribution of the heat exchanger under different loads while ensuring good accuracy. There are relatively few studies on the superheater of HRSGs, but more on the thermal performance and ash accumulation of superheaters in coal-fired boilers. The largest difference is the method of heat exchange between the superheater in the HRSG and coal-fired boiler. While the platen superheater in the coal-fired boiler mostly uses radiative heat transfer for heat exchange, the superheater in the HRSG primarily uses convective heat transfer [23]. Therefore, the existing research results cannot be directly applied, and it is beneficial to investigate the heat exchange process of the hydrocracking HRSG superheaters.
The scientific problem of superheater heat transfer capacity is also essentially a gas-vapor heat transfer problem, which can be further understood as the study of the flow resistance and heat transfer properties of the superheater tube bundles. The increase in the heat transfer properties of the tube bundles will be accompanied with the increase in the flow resistance, which will increase the power of the pump and the fan. In general, the overall heat transfer performance is applied to take into account the heat transfer capacity of the tube bundles and the dissipated energy of the pump and fan caused by the flow resistance. As a result, the improvement in the heat transfer performance of the tube bundle alone does not improve the overall heat transfer performance of the superheater tube bundles. The commonly used evaluation indexes based on the first law of thermodynamics are j/f [24,25,26,27] and the PEC [28,29,30]. A novel spring-blade mixed heat exchange tube was suggested by Gao et al. [31] to increase the heat transfer efficiency of the HRSG. Through the examination of the velocity field, temperature field, pressure field, and overall heat transfer properties, they concluded that its heat transfer coefficient was better than that of the spring and blade heat exchange tube. Unger et al. [32] studied the influence of Re, fin pitch, and tube orientation on the flow resistance and heat transfer characteristics of finned oval tubes and analyzed the comprehensive performance of tubes using the PEC. They found that for the finned oval tubes, the tilt angle has the largest impact on the Nu and friction coefficient. The influence of structural factors on the air-side heat transfer and pressure drop properties of 3D fin tubes was investigated by Tan et al. [33]. Based on the PEC theory, the effectiveness of fin height, fin width, axial fin spacing, and circular fin spacing was obtained. Tan et al. [34] experimentally studied the heat transfer and pressure drop performance of the tube side and shell side of heat exchangers with twisted oval tubes, and evaluated the overall performance of heat exchangers based on PEC theory.
This study intends to carry out numerical research on the flow resistance and heat transfer performance of the superheater of a hydrocracking HRSG. Computational fluid dynamics software is used to study the flow resistance and heat transfer characteristics of the superheater. According to the simulated results, the correlations between Nu and Eu of the superheater are fitted. This work can provide theoretical support for improving the comprehensive heat transfer performance of a hydrocracking HRSG.

2. Numerical Simulation

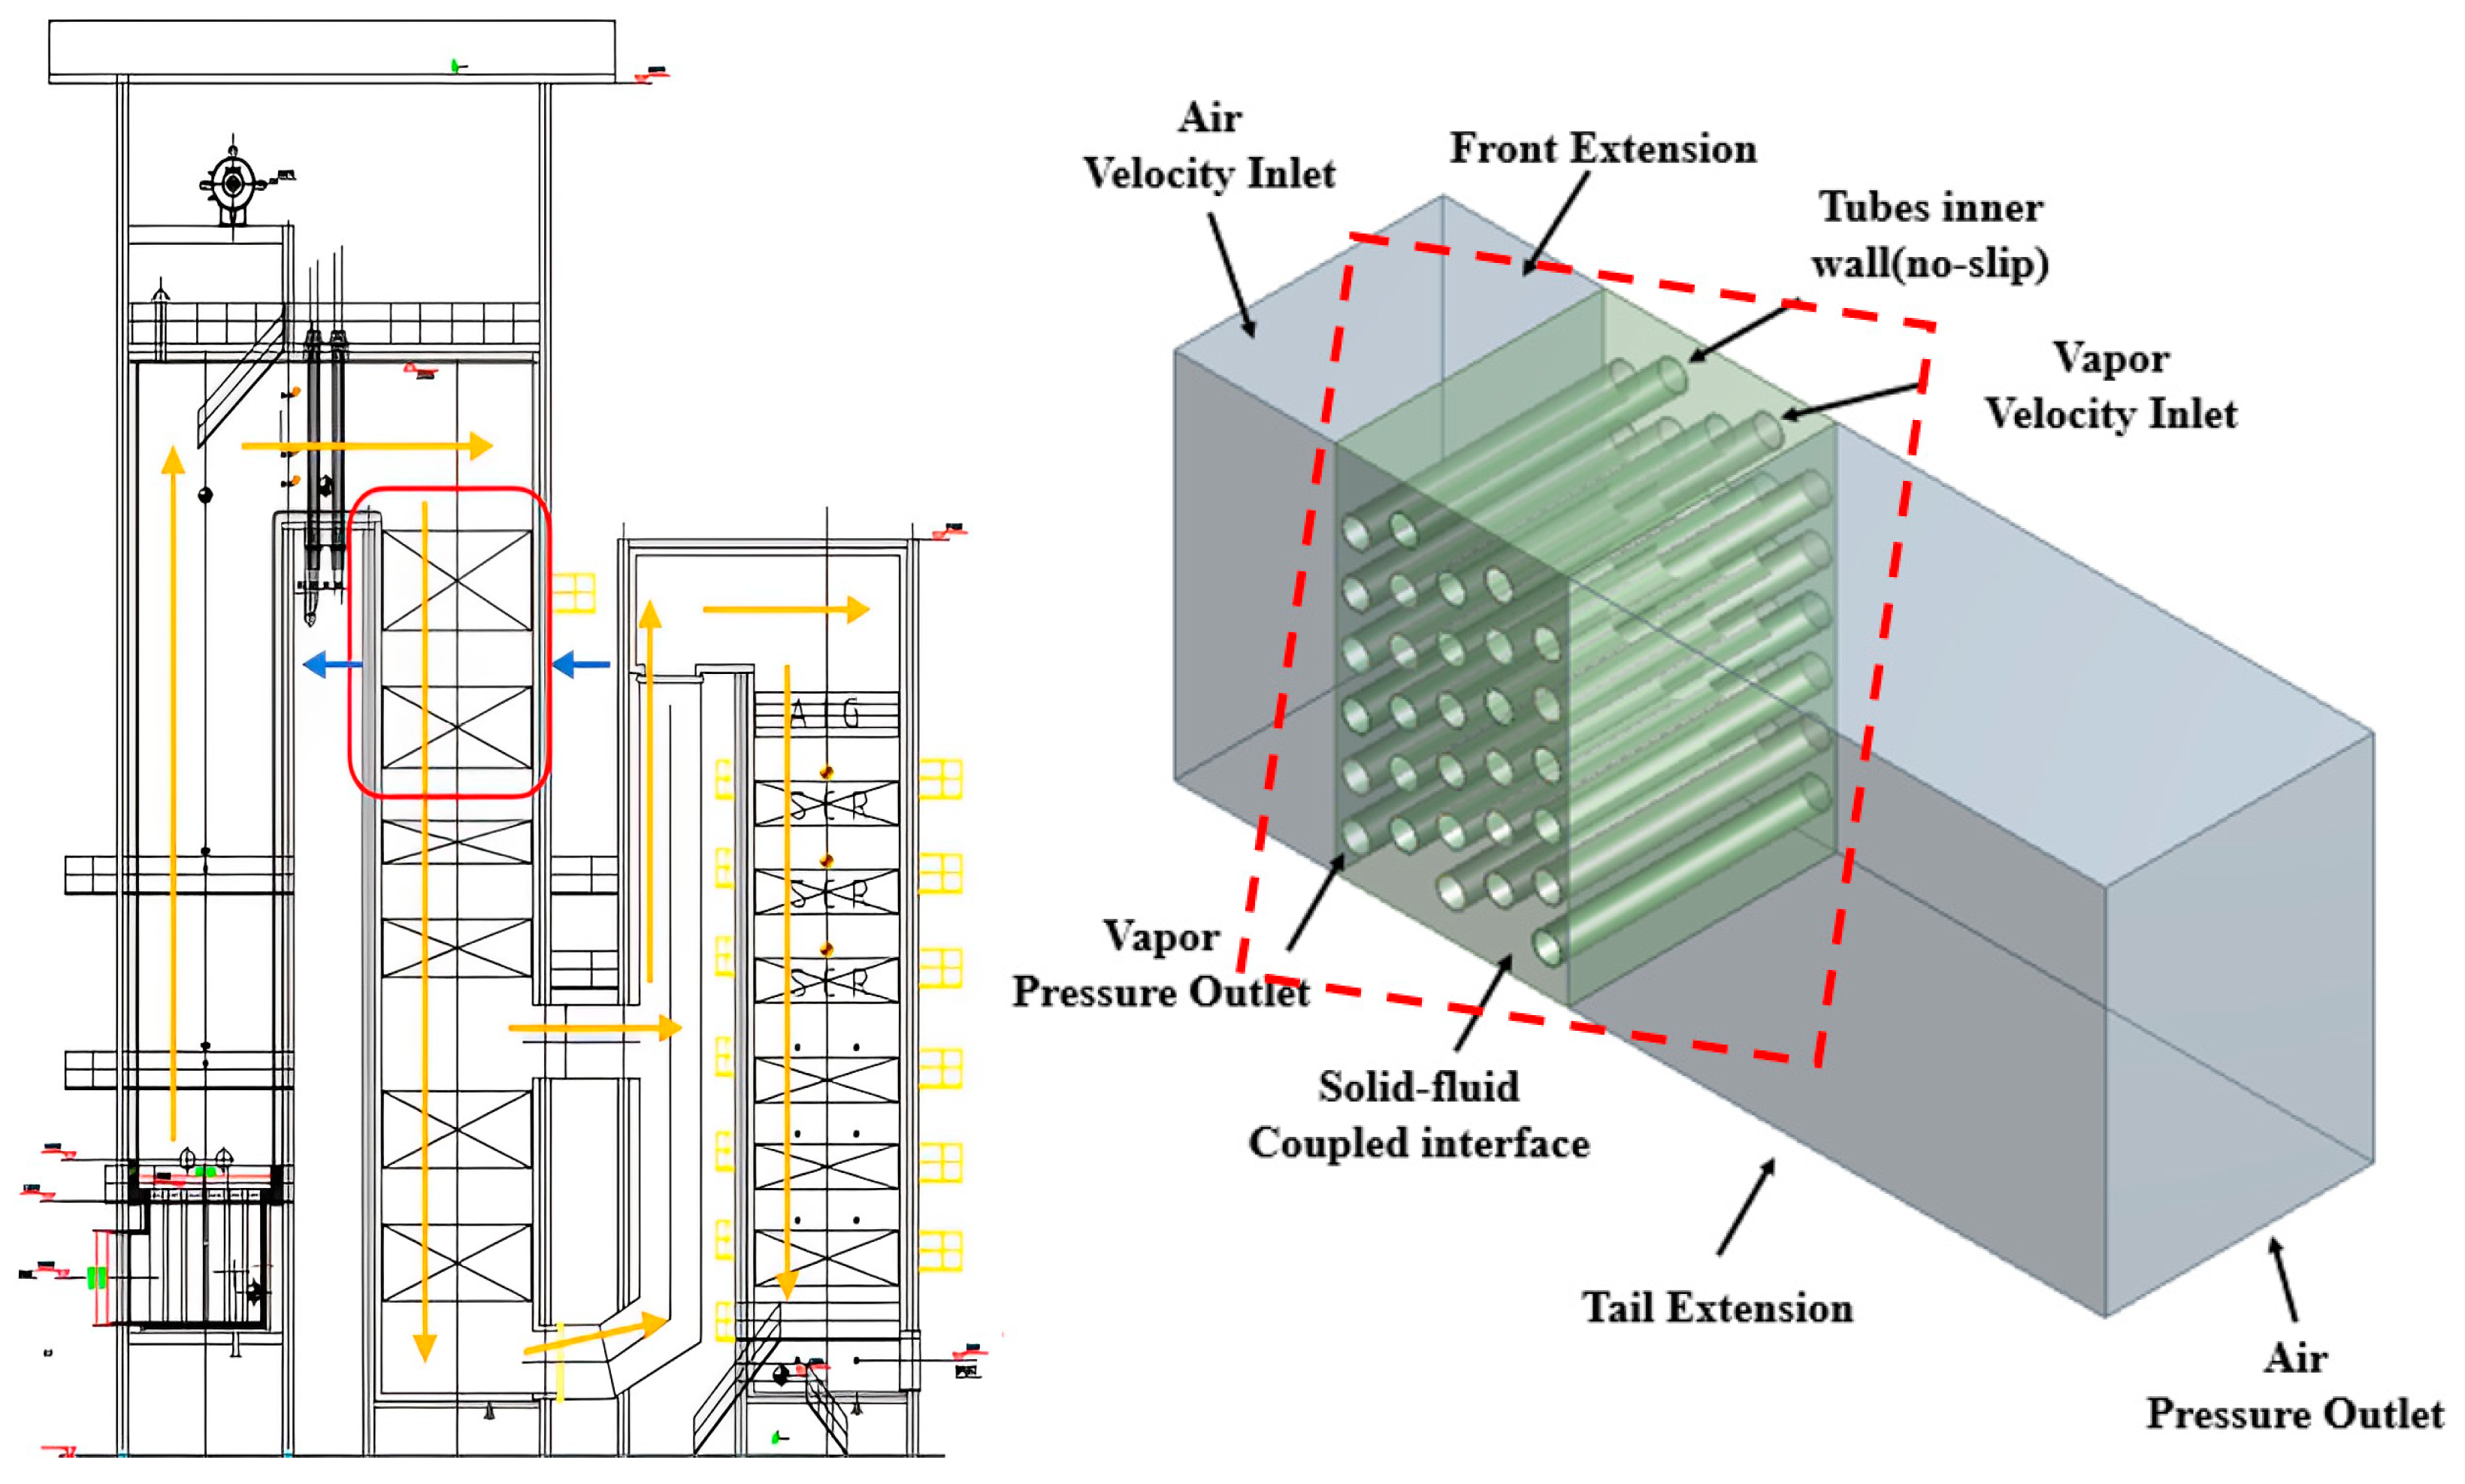
2.1. Physical Model and Boundary Condition

The hydrocracking HRSG is utilized as the research background in this study. Figure 1 shows the schematic diagram of the hydrocracking HRSG and the position of the superheater. The blue arrow is the vapor flow direction and the yellow arrow is the direction of flue gas flow. Ansys Fluent 19.2 is used to simulate the results. Design Modeler is used to create physical models, while Meshing is used to create the grid.
The middle dark area is the calculation domain. According to the actual situation, the tube bundle is set to 6 × 5, the periphery of the tube bundle is the gas domain, and the inside of the tube bundle is the fluid vapor domain. The interface of the gas field and the solid tube bundle is defined as a solid-fluid-coupled interface. The contact surface of the tube and the fluid vapor field is defined as a non-slip condition. The gas and vapor are defined as the velocity inlet condition and pressure outlet condition, respectively. To guarantee a uniform gas inlet velocity and prevent the backflow of the gas outlet, the gas inlet is lengthened 300 mm upstream and the gas outlet is lengthened 1000 mm downstream. The inside of the red frame is chosen as the computational domain of the numerical simulation in Figure 1. The purpose of the tail extension is to obviate the influence of the reflux at the outlet. As shown in Table 1, the boundary conditions and the physical properties of the parameters are obtained from the NIST database [35] and the determination coefficient of the fitting equation is greater than 0.97.

2.2. Governing Equations

The three-dimensional stationary state, heat transfer performance, and turbulent flow of the superheater tube bundle of a hydrocracking HRSG are studied via numerical simulation. The flow and heat transfer processes of the fluid are represented via the Euler method. The fundamental assumptions and simplified descriptions are as follows:
(1)
The flow and heat transfer processes of the fluid are stationary-state.
(2)
The volume force ignores gravity and buoyancy.
(3)
The external surface of the model is configured as an insulated wall condition, and the interchange of heat between the flue gas and the environment is ignored.
(4)
The influence of particles in gas on the flow and heat transfer process is ignored.
(5)
The physical parameters of the tube bundle are set as constants and the physical parameters of the gas and superheated vapor are fitted as a function of temperature.
The heat transmission processes involve the following parts: (1) The heat convection between high-temperature gas and the external wall of tube bundles. (2) The thermal conduction from the external wall of the tube bundles to the interior wall of the tube bundles. (3) The heat convection between the interior wall of the tube bundles and the vapor in the tube. (4) Radiation heat transfer of high-temperature gas to vapor.
The continuity equation:
ρ u i x i = 0
The momentum equation:
x i ρ u i u k = x i μ u k x i p x k
The energy equation:
x i ρ u i T = x i λ C p T x i + S ϕ
For solid regions:
x i λ T x i = 0
where Sϕ is the volume heat source term including radiative heat transfer. In this study, the standard k-ε model is applied because of its wide application range, high precision, and less computing resources [36].
The governing equations of k and ε in the turbulence model are as follows:
Kinetic energy equation:
( ρ u i k ) x i = x j μ + μ t σ k k x j + G k ρ ε
Dissipation rate equation:
ρ u j ε x = x j μ + μ t σ ε x j + C 1 ε k G k C 2 ε ρ ε 2 k
G k = ρ u i u j ¯ u j x i
μ t = ρ C μ k 2 ε
where σ k = 1.0 and σ ε = 1.3 [37] are the Prandtl numbers for k and ε, respectively. C = 1.44, C = 1.92, and Cμ = 0.09 are applied in the numerical simulation. In this study, the standard wall function boundary condition is chosen and the range of y+ is 22–36. The turbulent intensity is 5% and the turbulent viscosity ratio is 10.
The DO radiation model is a discrete coordinate method, which can be used to calculate the scattering medium. The DO radiation model considers the influence of boundary emissivity and the calculation accuracy is affected by the degree of discretization of the model. The DO radiation model is chosen for the advantages of wide application range and low calculation cost.
Radiation transfer equation of DO radiation model [38,39]:
I r , s s + a + σ s I r , s = a n 2 σ T 4 π + σ s 4 π 0 4 π I r , s φ s , s d Ω
where r is the position vector, s is the solid angle direction vector, s is the scattering direction vector, a is the absorption coefficient, n is the refractive index, σs is the scattering coefficient, σ is the Stefan–Boltzmann constant at 5.67 × 10⁻⁸ W/(m2 K4), I is the radiation intensity, and Ω′ is the solid angle.

2.3. Grid Independence Verification

To guarantee gas uniformity and prevent backflow at the gas outlet, the gas inlet and outlet are extended appropriately. The physical model is divided by a hexahedral mesh. The following Figure 2 shows the mesh diagram and its local magnification along the z-axis direction.
To make sure that the grid number has no bearing on the outcomes of calculations, six different grids are generated and the six grids are numerically simulated under the same conditions. The effects of different grids on Nu in the calculation domain are shown in Table 2. The results show that when the grid number is greater than 5.26 million, Nu has an indistinctive variation with the increase in the grid number, which shows that the number of grids is independent of the simulated results. For the purposes of economizing computational resources and ensuring the accuracy of calculation, case 5 is selected as the grid drawing method of the physical model in this study.

2.4. Evaluation Indexes

For purpose of illustrating the simulated results and characterizing the flow resistance and heat transfer performance of the superheater tube bundles in the hydrocracking HRSG, some dimensionless numbers are applied to appraise the properties of the superheater tube bundles. In this study, Nu is applied to represent the heat transfer capacity of the superheater tube banks. The greater the Nu, the more intense the heat transfer capacity. Eu is applied to represent the flow resistance of the superheater tube bundles. The greater the Eu, the greater the flow resistance. PEC1 is applied to represent the comprehensive heat transfer performance of the superheater tube banks. The greater the PEC1, the better the comprehensive heat transfer performance of the superheater tube bundle.
The mathematic expressions of the Reynolds number (Re), Nusselt number (Nu), and Euler number (Eu) are as follows, respectively:
R e = ρ g u g d o μ g
N u = h d o λ g
E u = 2 Δ p ρ u g , max 2 n
ρg is the gas density, ug is the gas velocity, do is the outer diameter of the superheater tube bundles, μg is the gas viscosity, h is the heat transfer coefficient, λg is the gas thermal conductivity, Δp is the gas differential pressure, Δ p = p i n p o u t , ug,max is the gas maximum velocity, and n is the number of tube rows (n = 5 in this paper).
For purpose of comparing the comprehensive heat transfer performance of the superheater tube banks, according to the PEC theory [40], PEC1 is intended to represent the comprehensive heat transfer properties of the superheater tube banks. The expression of PEC1 is as follows:
PEC 1 = N u E u 1 / 3

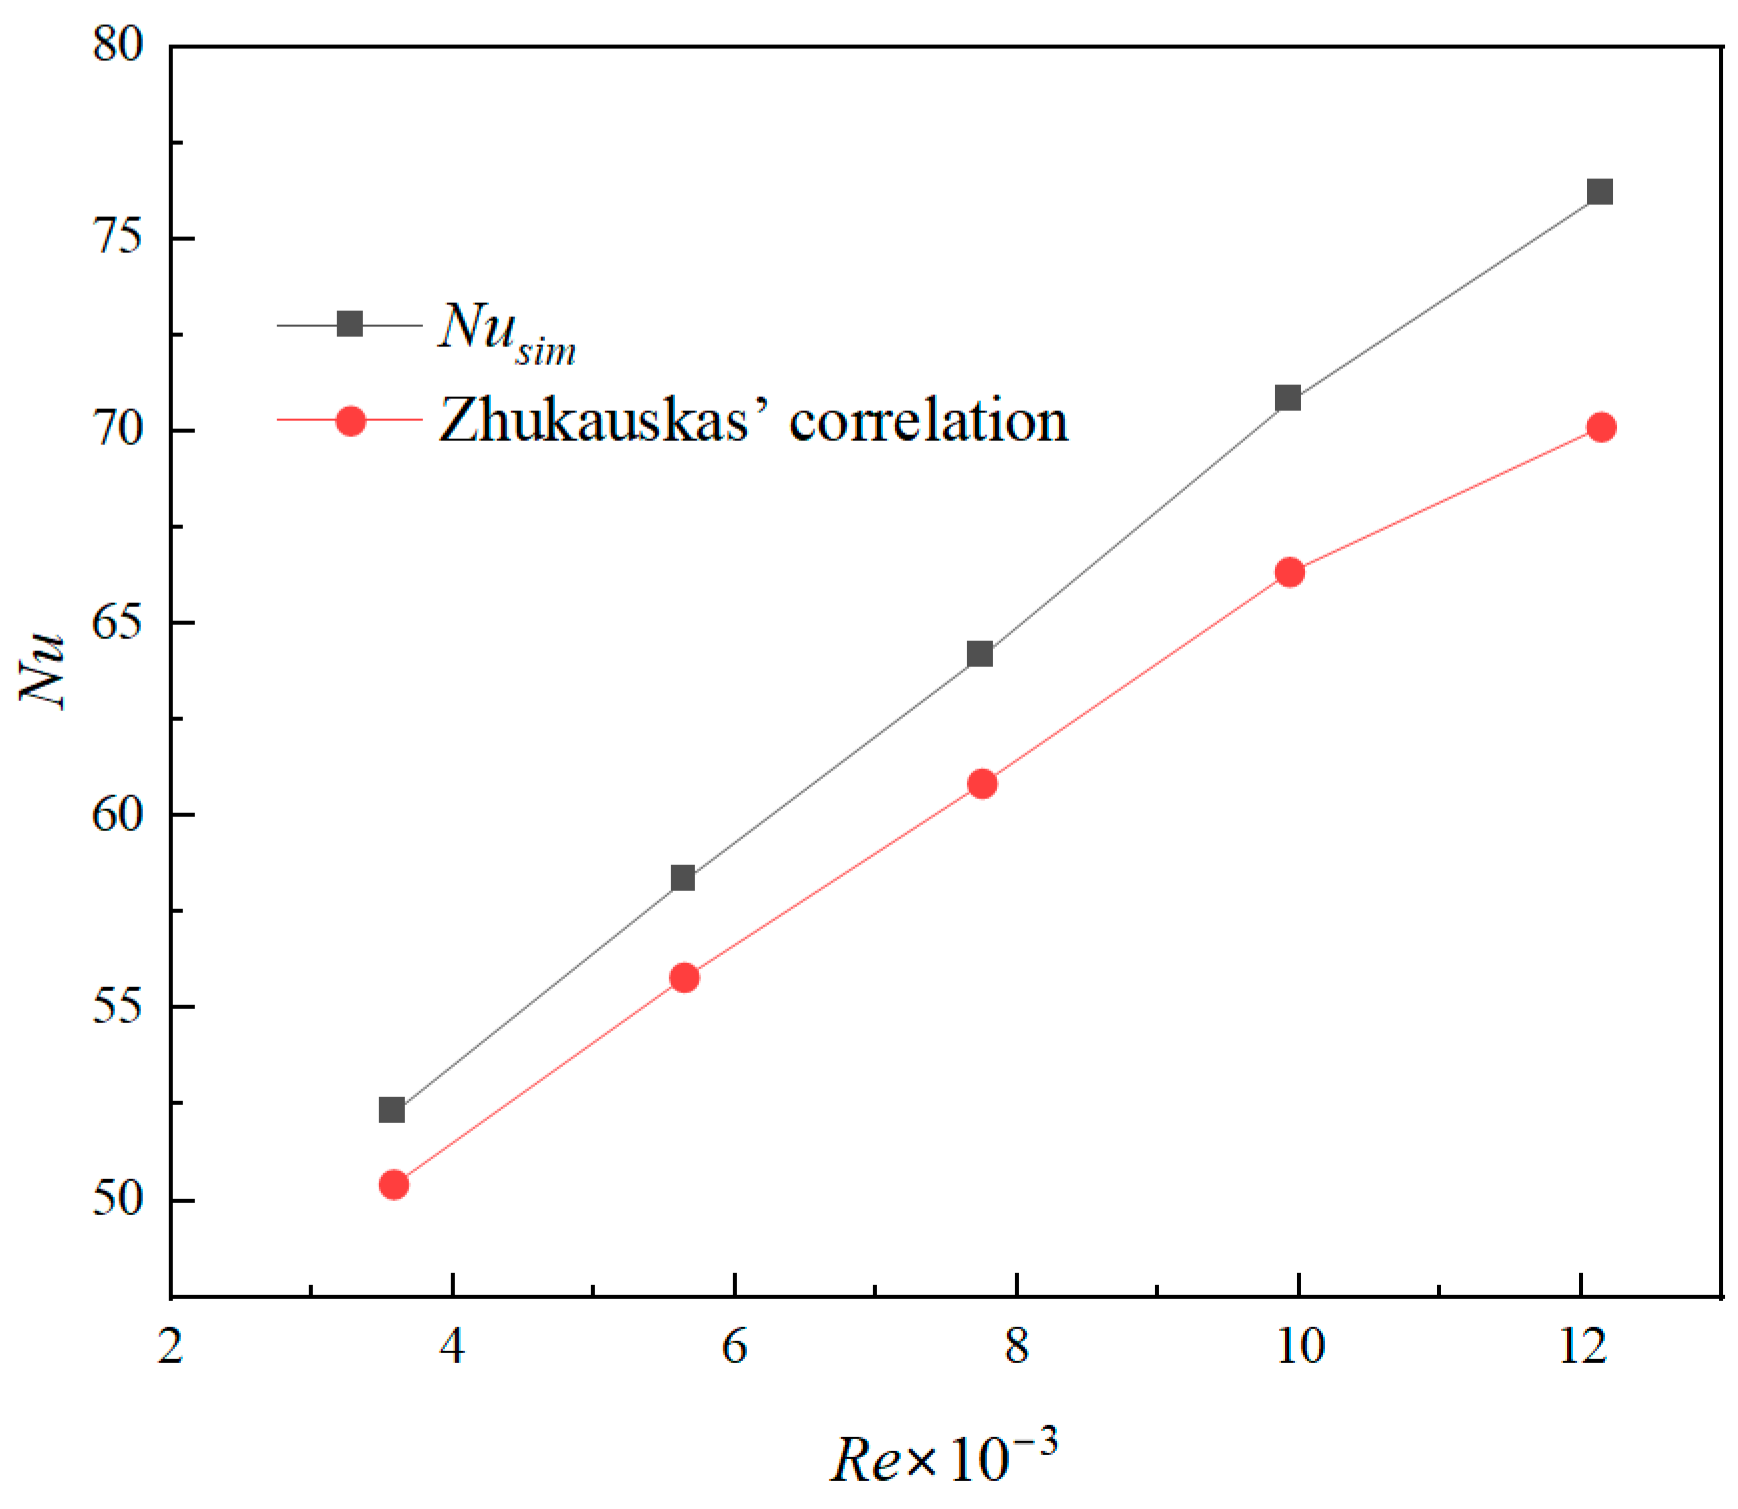
2.5. Model Validation

By contrasting the simulated results with the results of Zhukauskas’ correlation [41], the model’s correctness is determined. Figure 3 indicates the comparison of the simulated value and the correlation value. The results show that the relative error between the simulated Nu and the Zhukauskas’ correlation Nu is in the range of 3.72–8.60%, and the average relative error is 5.93%, which demonstrates that the numerical model is exact and precise. The error between the simulated and correlated values is mainly due to the heat exchange on the wall surfaces. In this study, the wall surface is set to be an adiabatic wall, and the heat exchange between the external surface of the model and the environment is ignored. The results of the correlation are obtained through the experiments, and heat exchange between the external surface of the model and the environment is inevitable.

3. Results and Discussion

This part shows and discusses the simulated results. Firstly, the flow and heat transfer process on the superheater of the hydrocracking HRSG are analyzed according to the simulated results. Then, the influence of the transverse and longitudinal tube pitch of the tube bundles on the heat transfer properties, flow resistance properties, and comprehensive heat transfer performance is analyzed. Finally, the correlation of Nu and Eu is fitted.

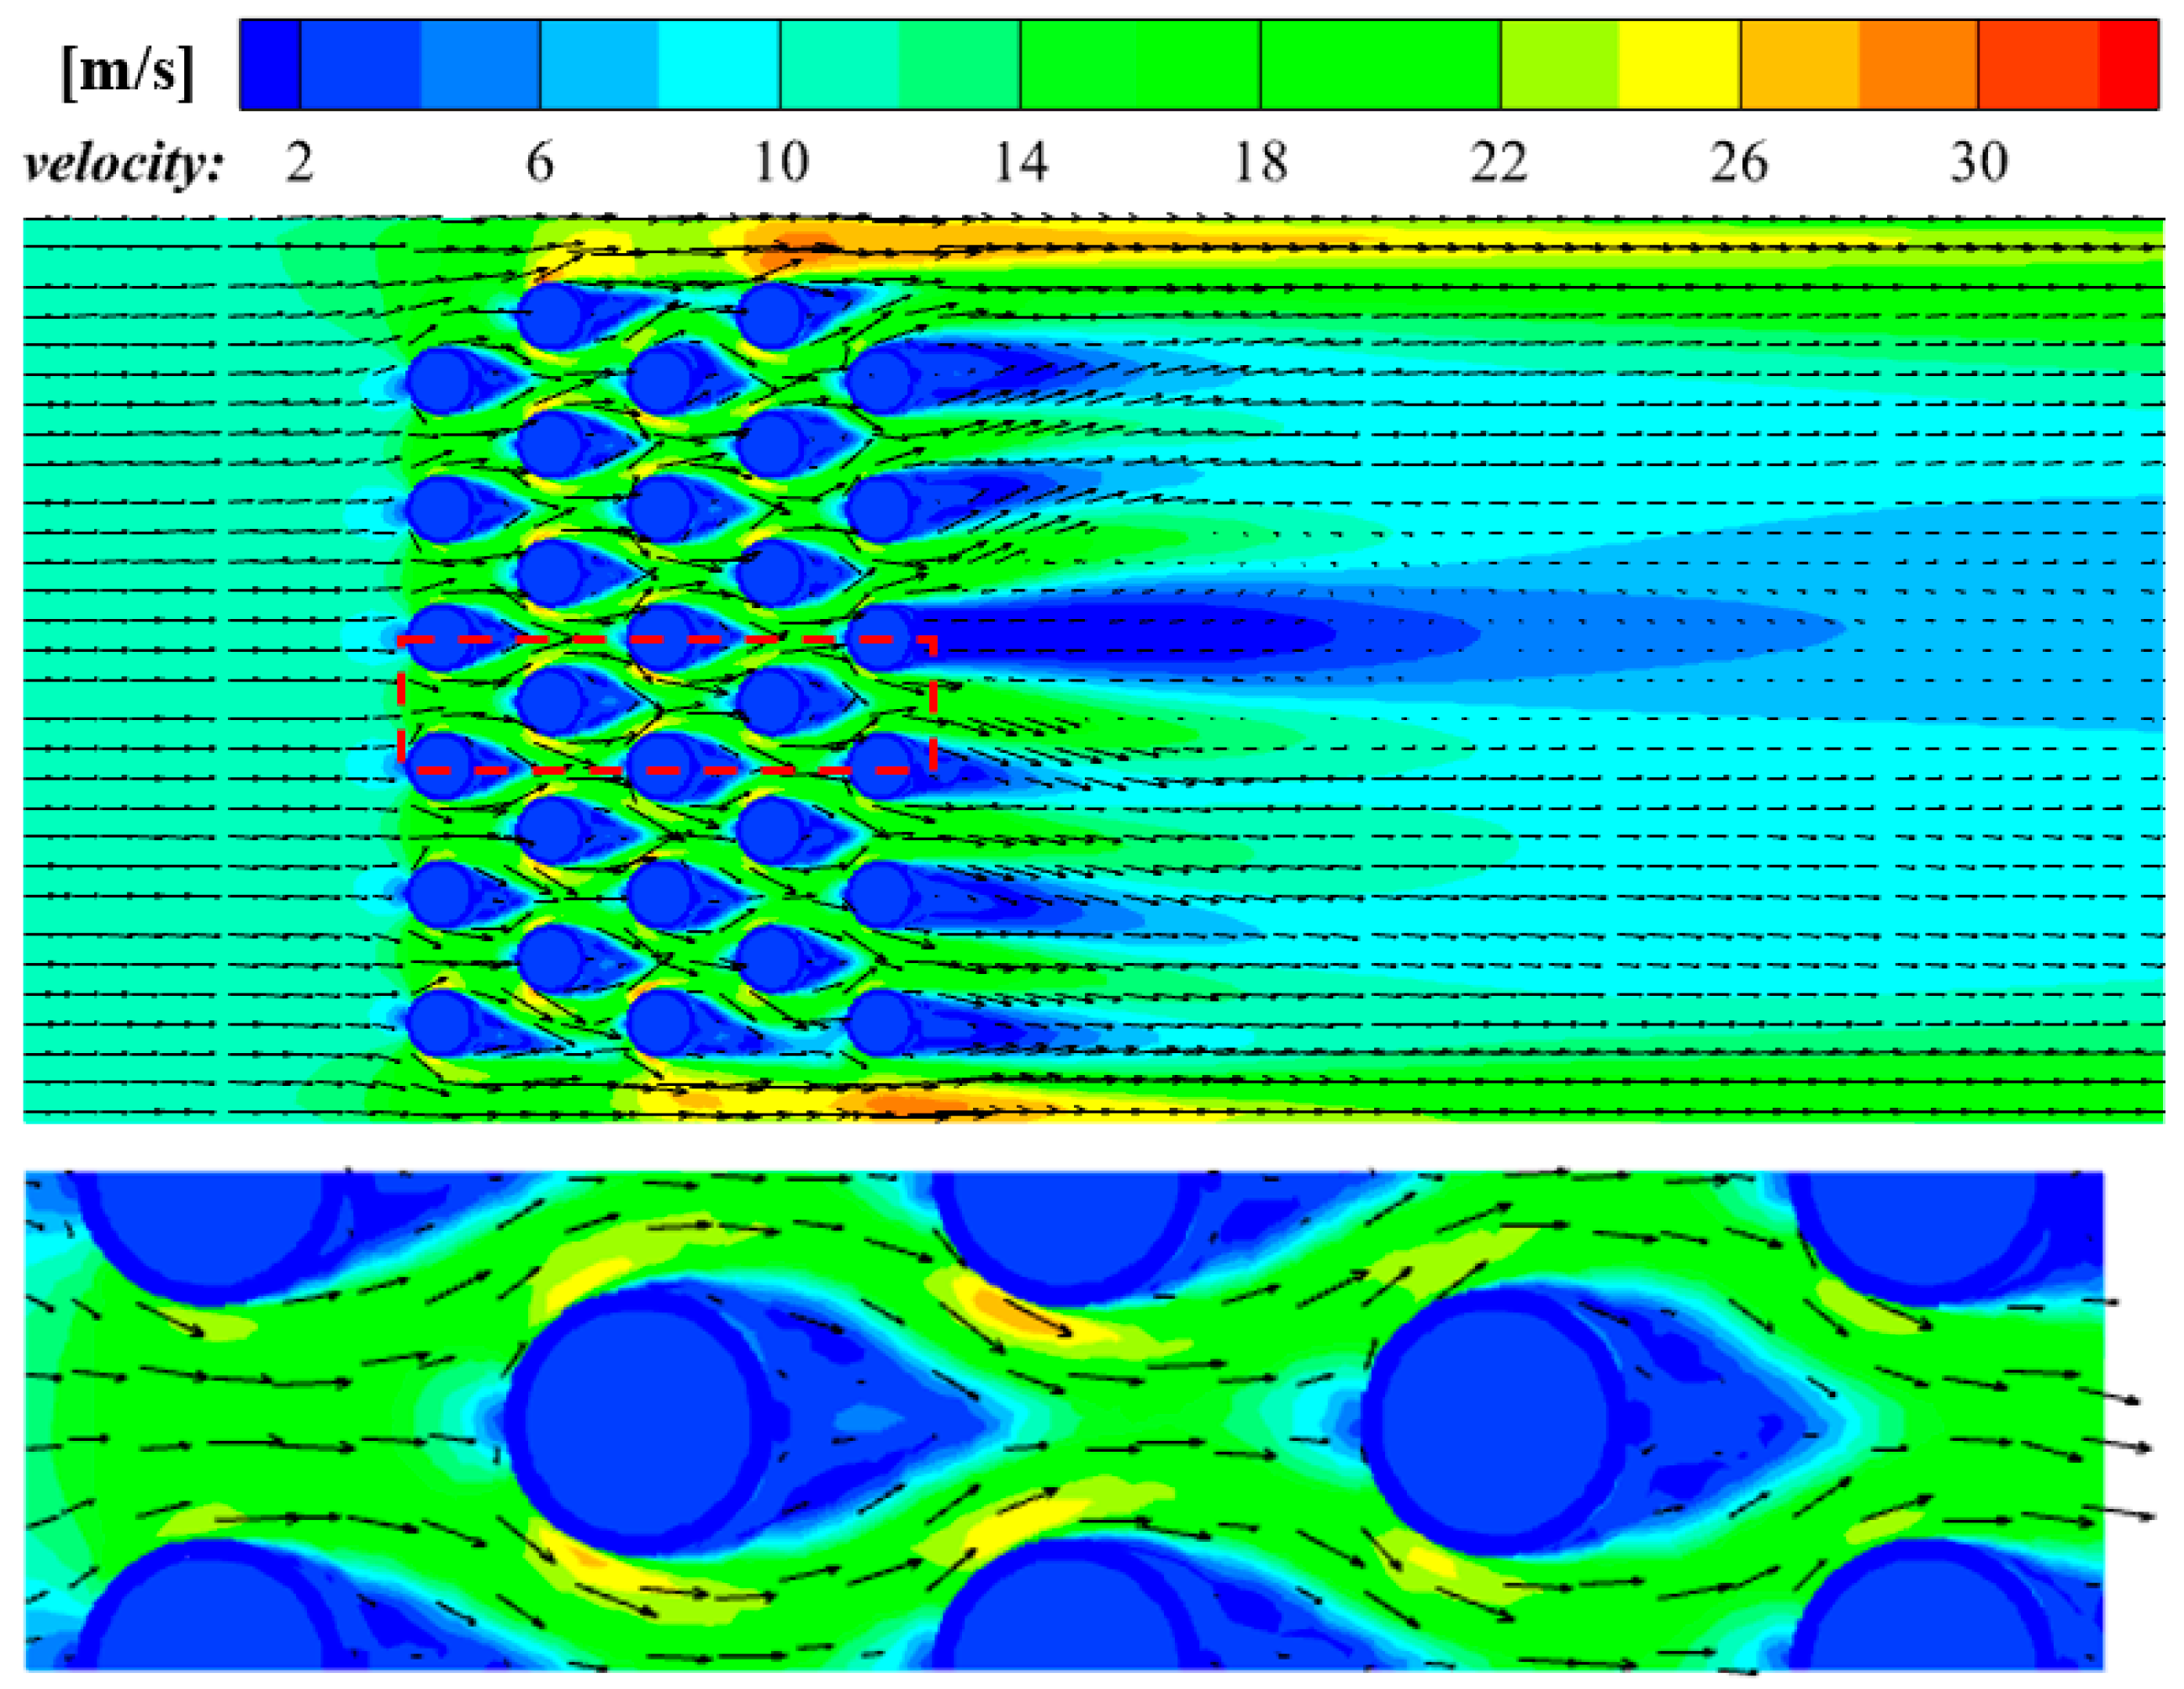
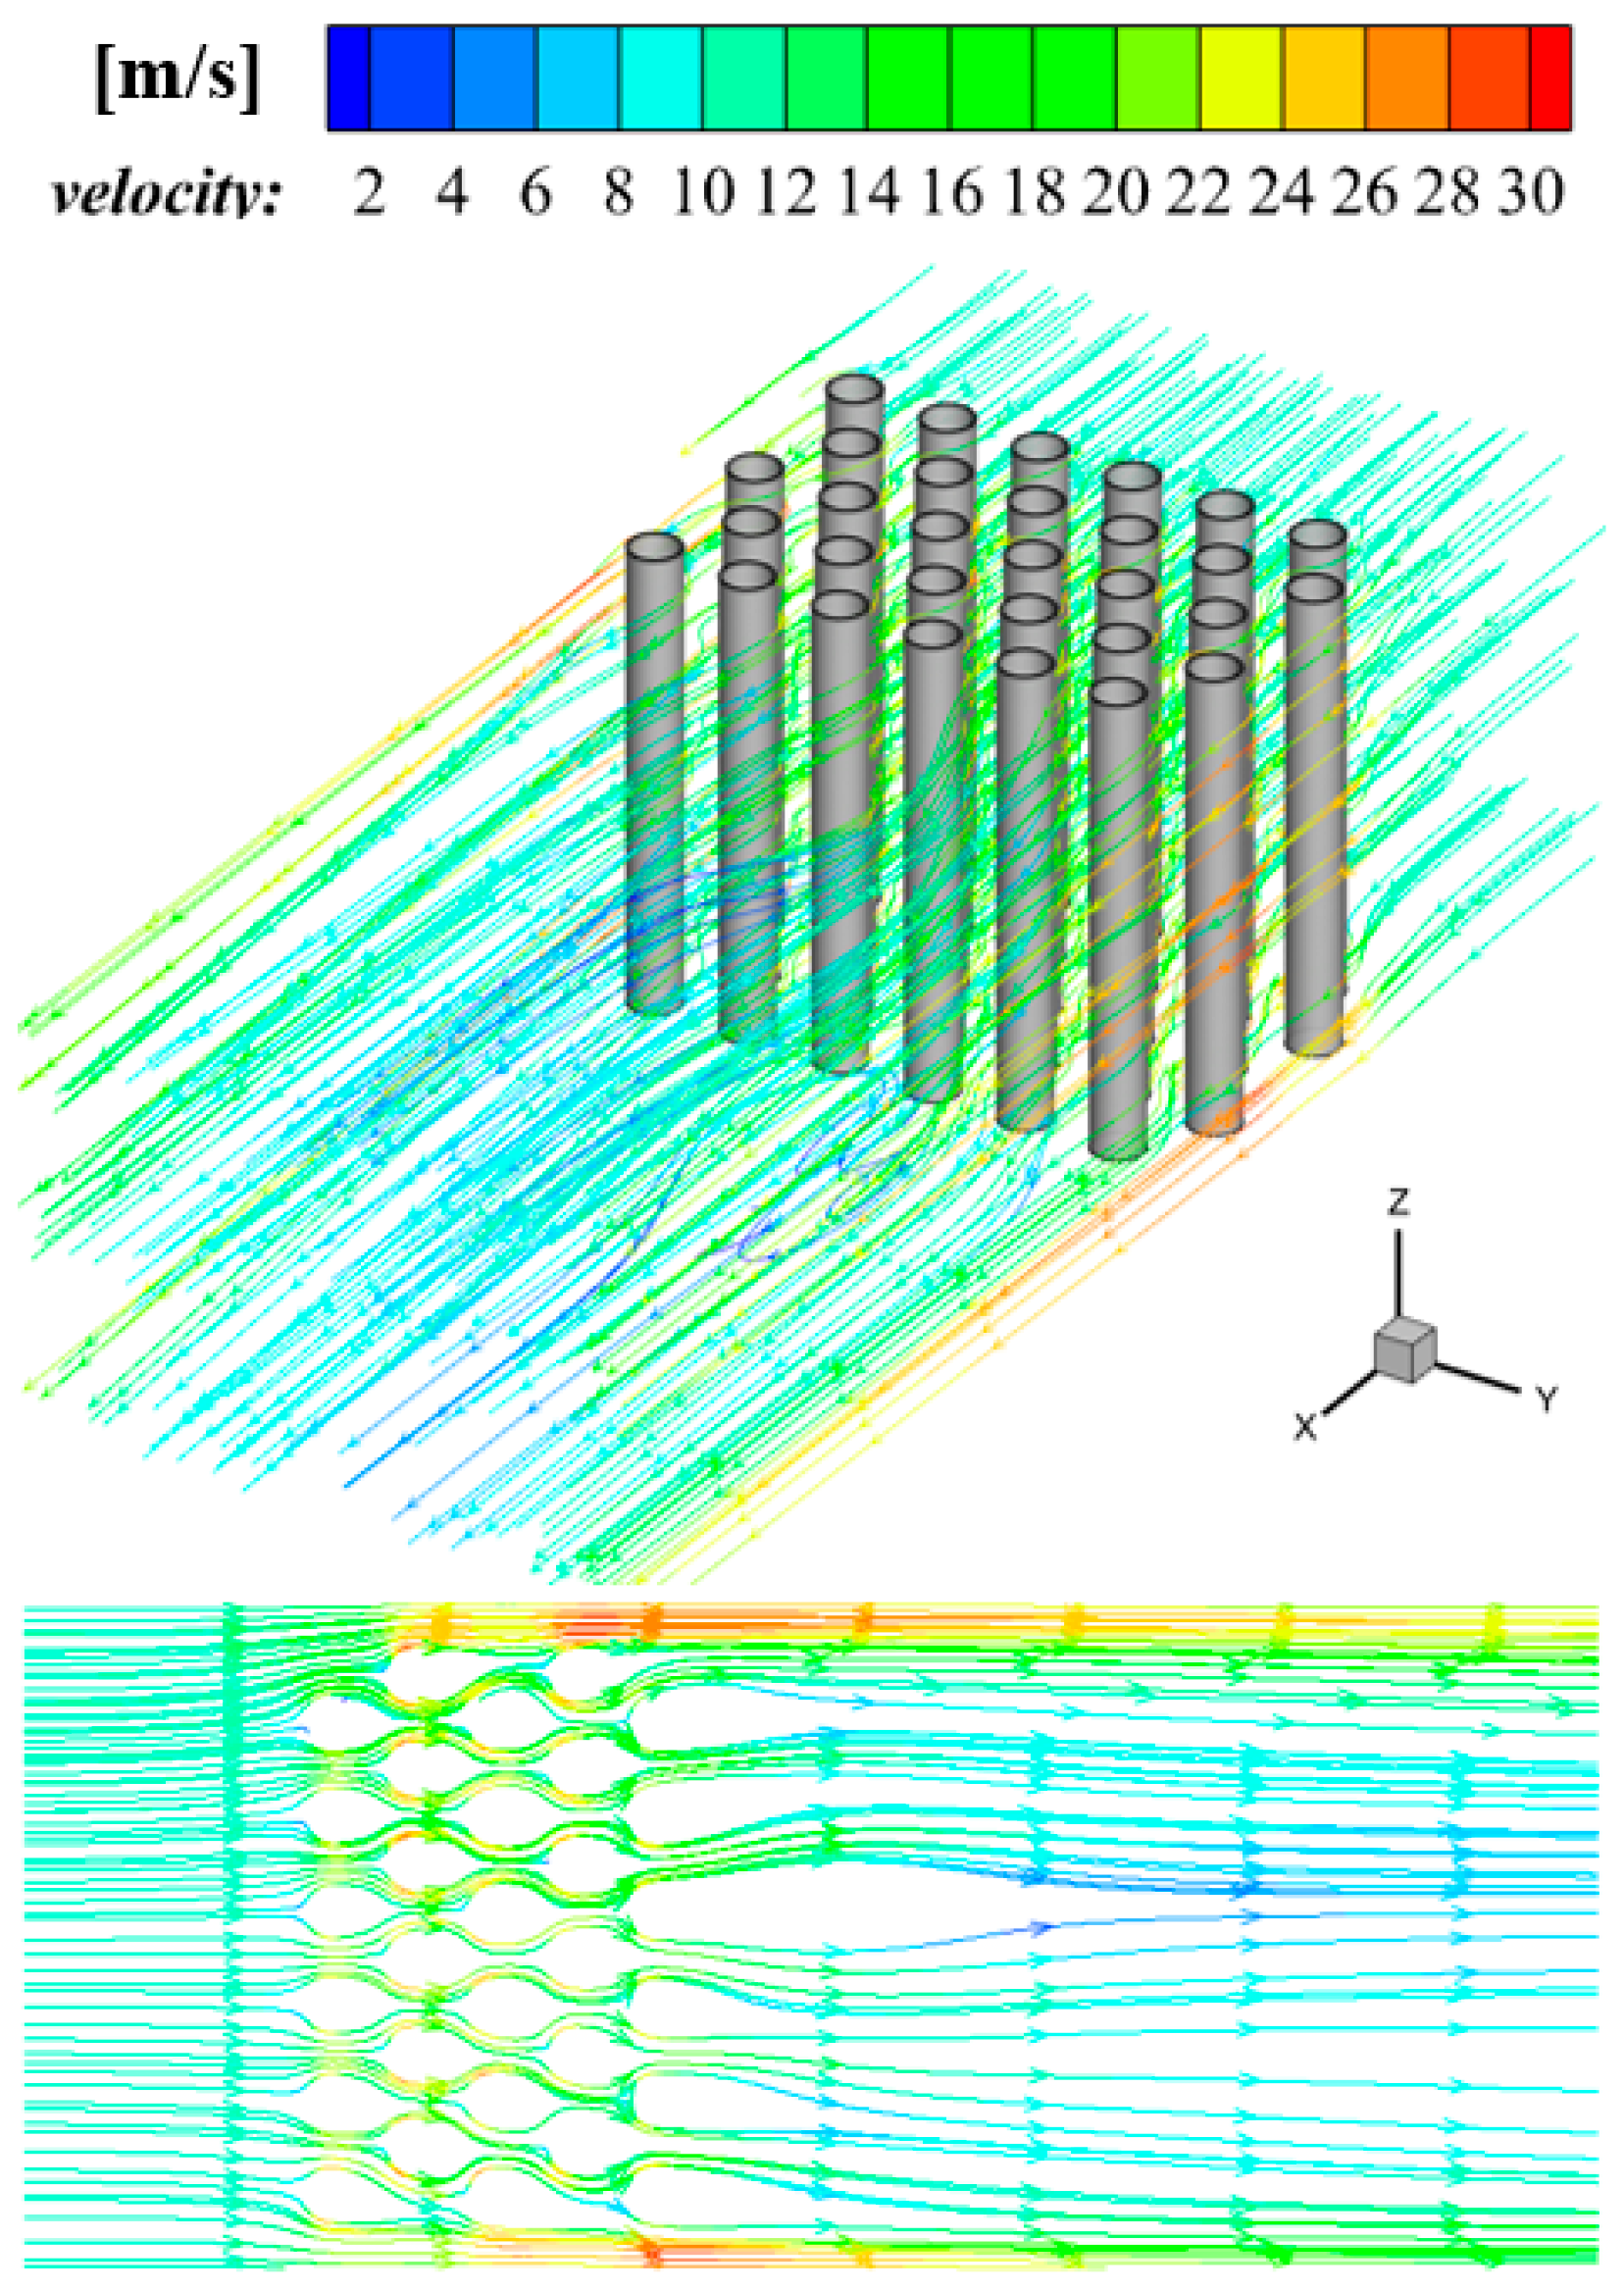
3.1. Temperature and Velocity Distribution

Figure 4 shows the temperature field and local amplification of the Z-axis cross-section. The high-temperature gas flows from the gas inlet, and the convective radiative heat transfer occurs with the outer wall of the superheater tube bundles. The temperature of gas gradually decreases. Convective heat transmission occurs between the vapor and the internal wall of the tube, whereas heat conduction occurs between the external and internal walls of the tube. When the gas flows along the outer wall of the tube, the gas velocity increases until the gas is separated from the superheater tube bundles, which will form a low-temperature wake zone at the tail of the tube bundles. This is also the reason why the temperature of the external wall and the gas at the tail of the tube banks is low. The temperature of gas at the first two rows of tube bundles decreases greatly. This is due to the fact that the variation in temperature between the vapor and the gas is greater the closer you are to the gas entrance. According to the relevant theory of heat transmission, the heat transmission at the front two rows of tube banks is more intense, and the gas temperature decreases more significantly.
Figure 5 and Figure 6 show the velocity distribution. As the gas enters and contacts with the superheater tube banks from the gas inlet, the gas velocity decreases rapidly. Then, the gas is separated along the boundary of the superheater tube bundles to both sides and the gas velocity progressively increases until the gas detaches from the tube banks. Therefore, a low-velocity wake region will appear at the rear of the tube banks. The gas at the tail intersection will repeat the previous flow mode, and the average velocity of the gas will continue to decrease. When the gas passes through the last row of tube bundles, because the flow area will not change again, the detached flue gas will cause a large low-speed wake area. The simulated results are in agreement with the references [42,43].

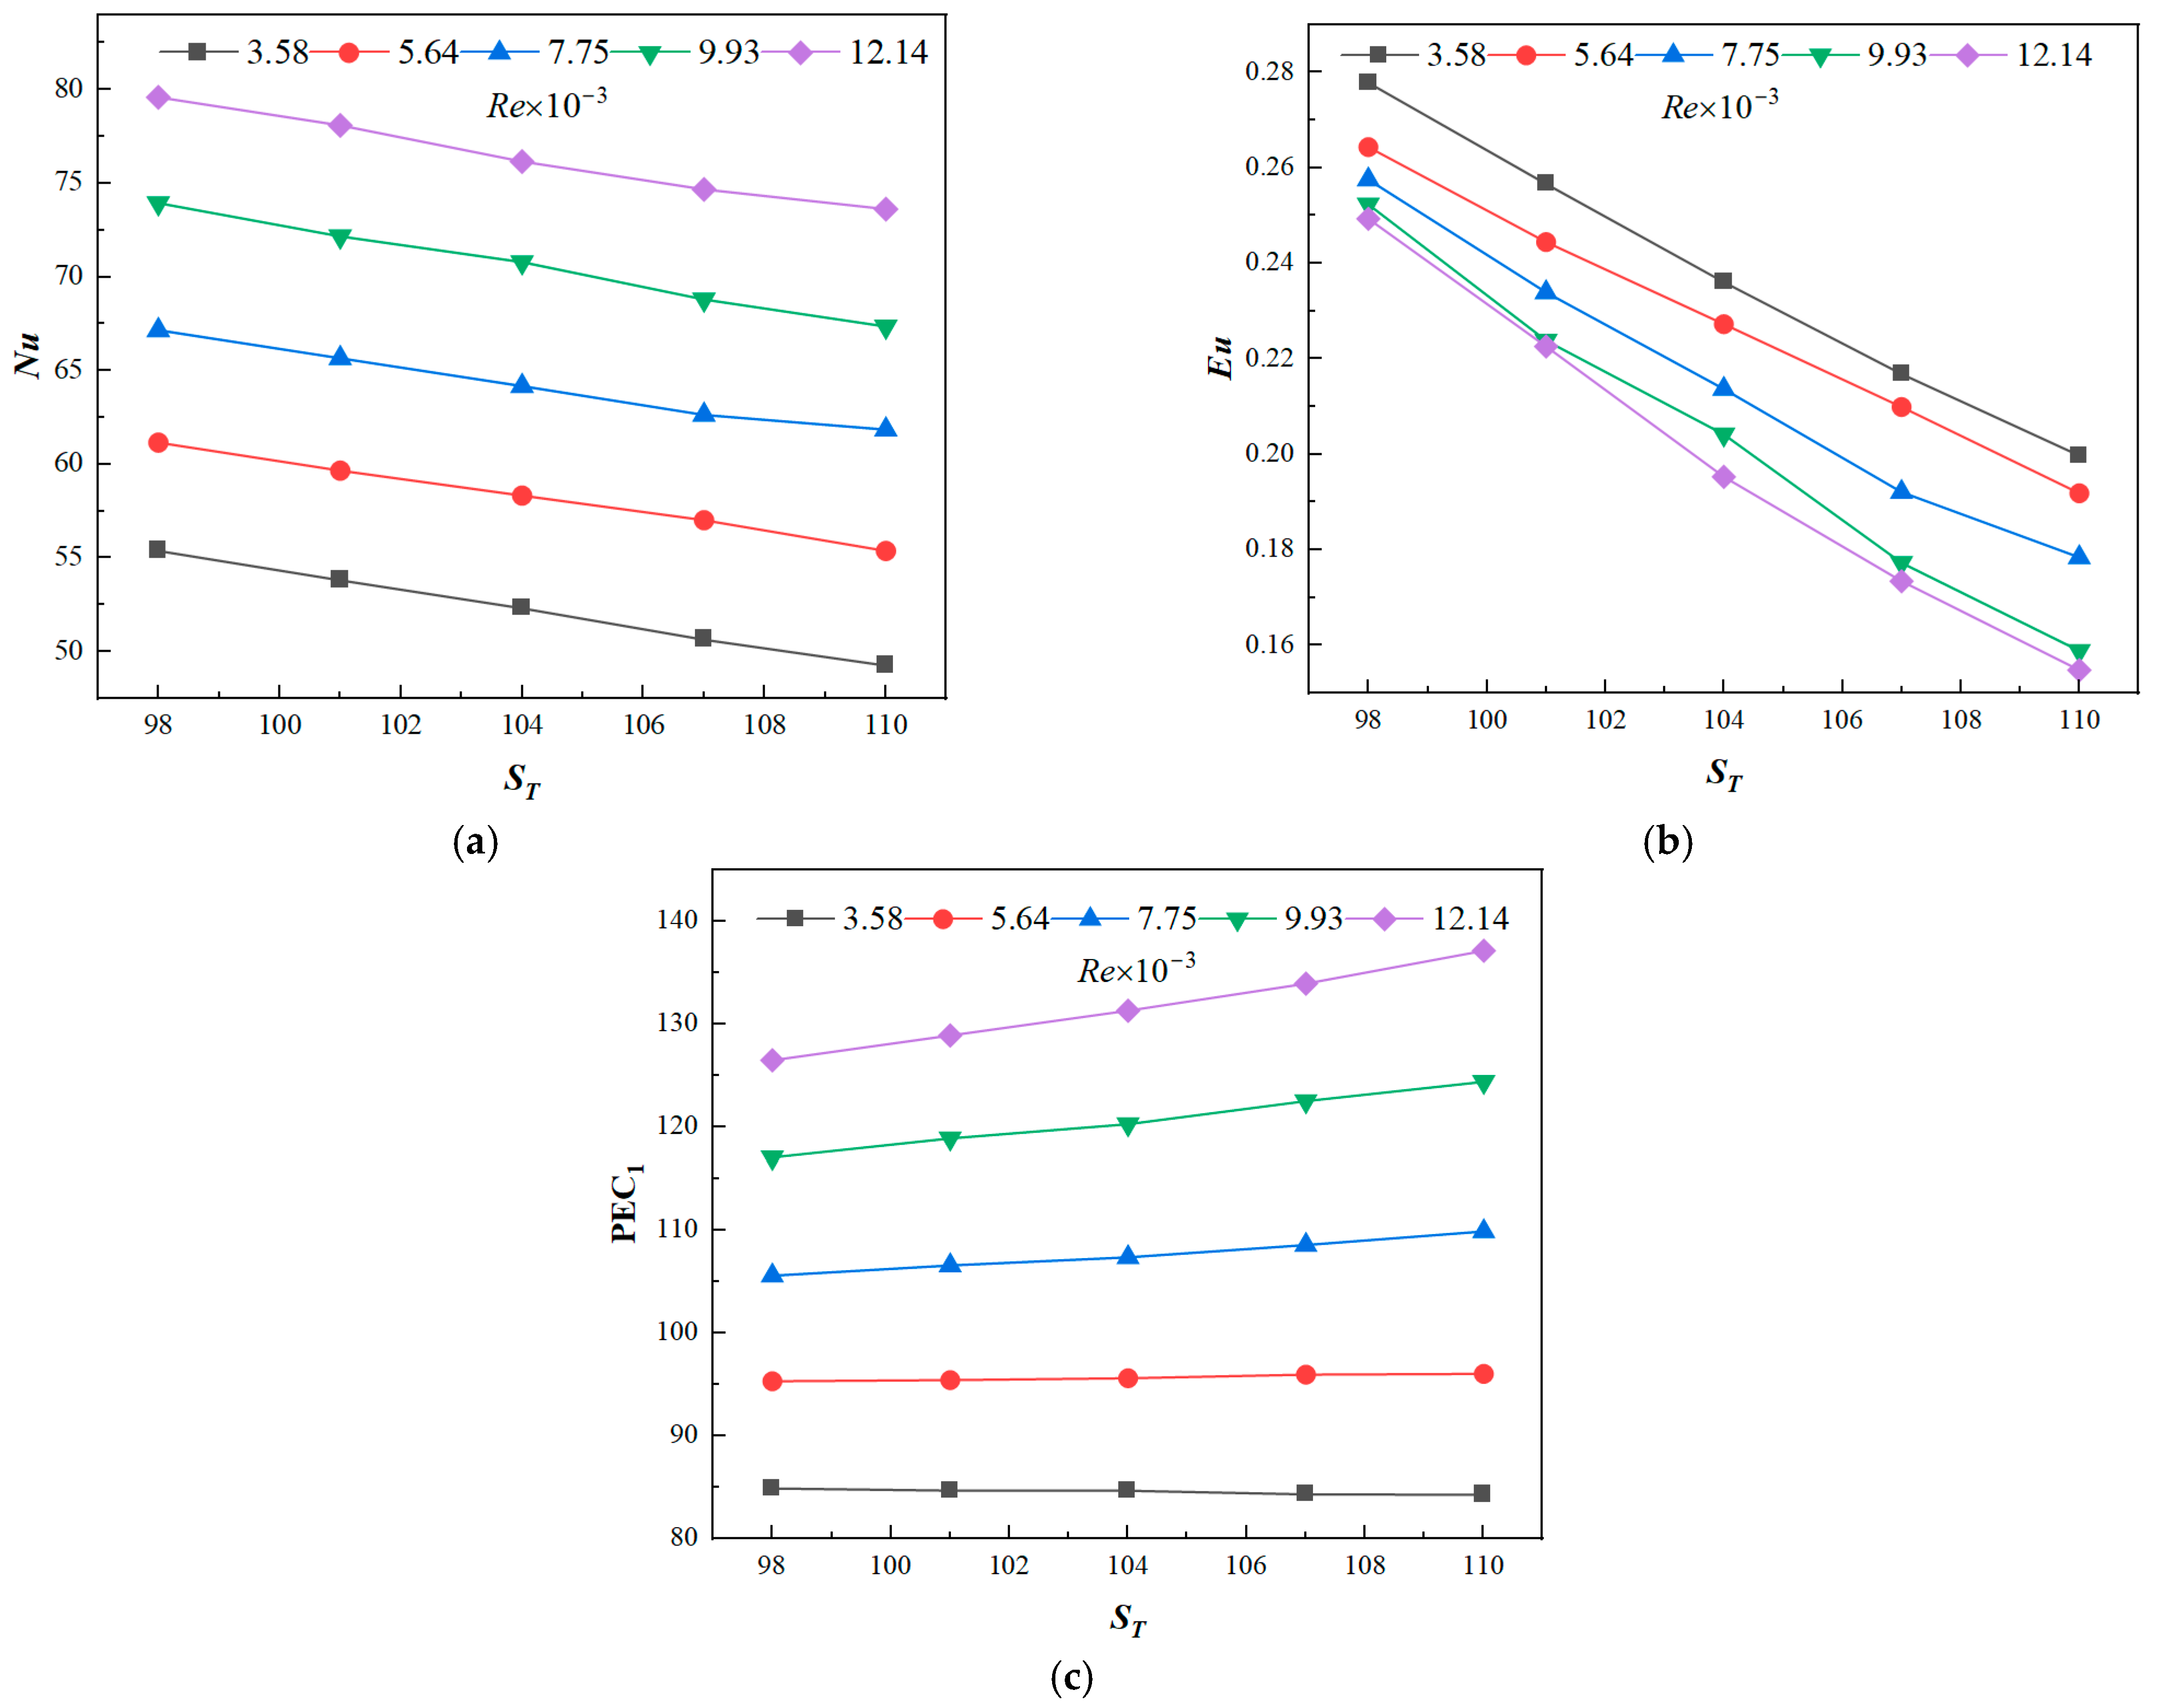
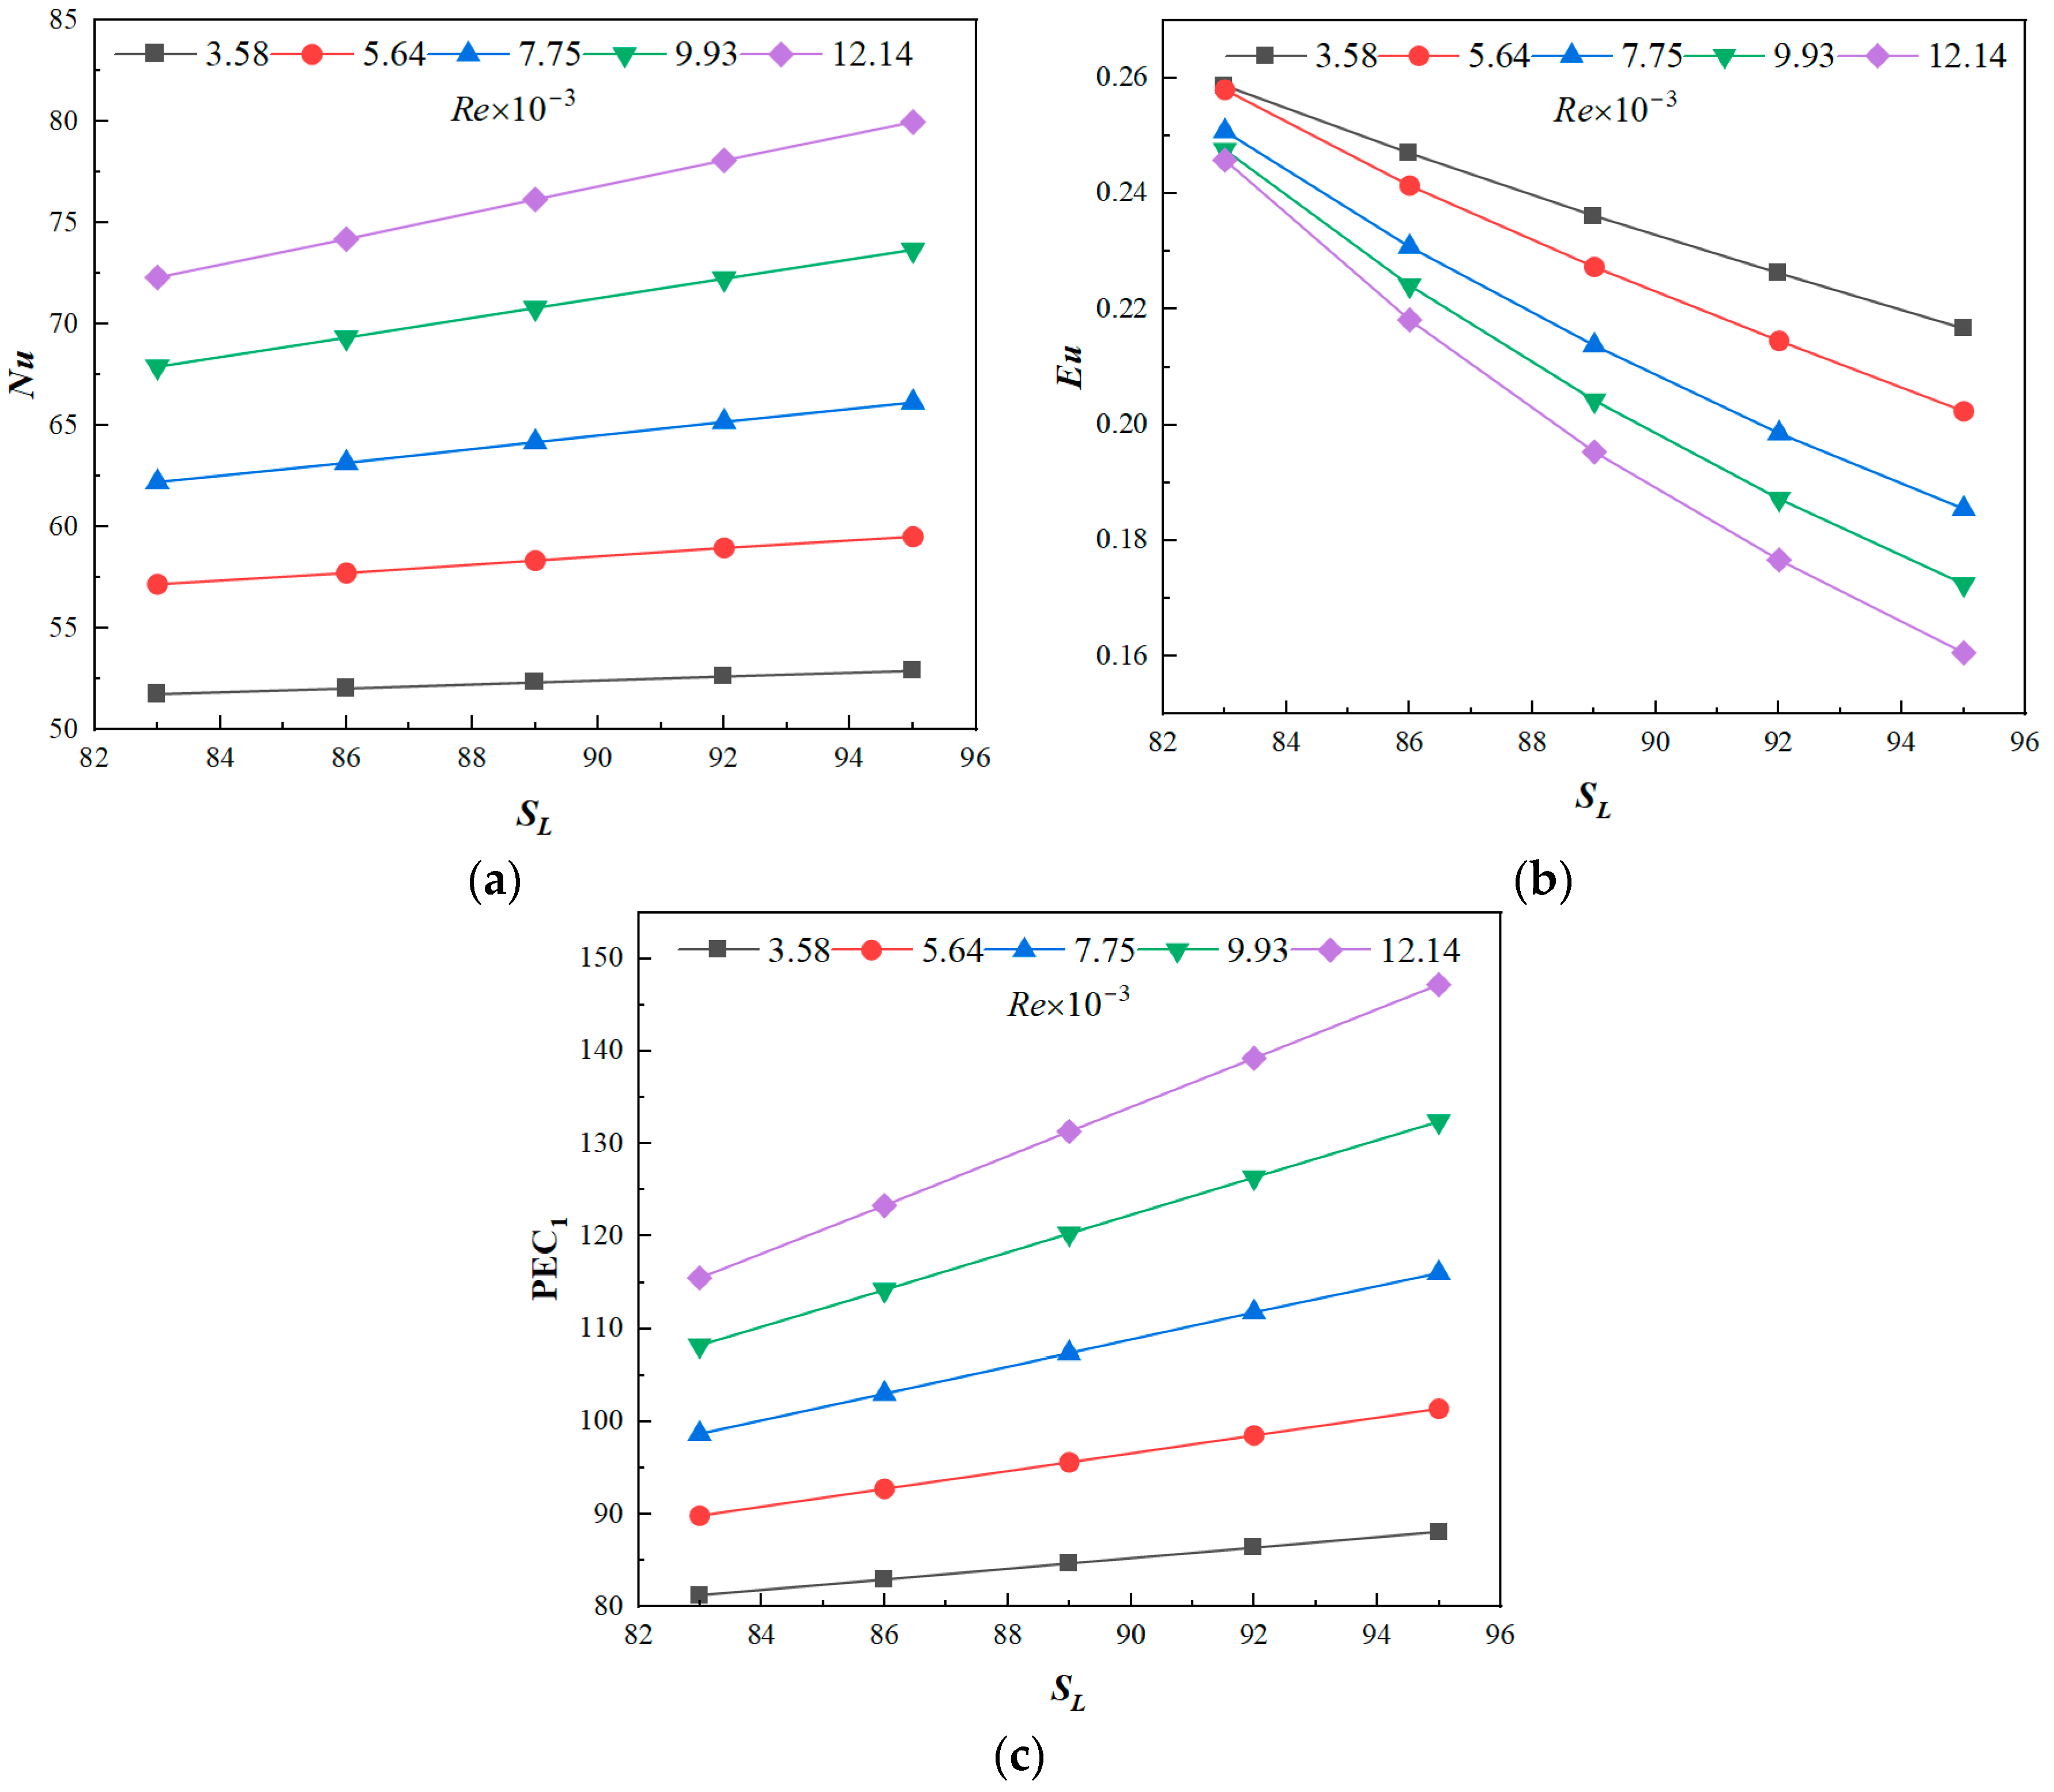
3.2. Effect on Transverse Tube Pitch and Longitudinal Tube Pitch

Figure 7 shows the influence of transverse tube pitch on Nu, Eu, and PEC1. As shown in Figure 7a, when the transverse tube pitch remains constant, Nu shows a monotonically increasing trend as Re increases. When Re remains constant, Nu shows a monotonically decreasing trend as the transverse tube pitch increases. Compared with the Nu of transverse tube pitch of 98 mm, the transverse tube pitch Nu of 101 mm, 104 mm, 107 mm and 110 mm, on average, decreases by 2.33%, 4.59%, 6.96% and 8.83%, respectively. This shows that within the scope of the simulated results, the smaller the transverse tube pitch, the stronger the heat transfer capacity of the tube bundles.
As shown in Figure 7b, when the transverse tube pitch remains constant, Eu exhibits a monotonically decreasing tendency as Re increases. When Re remains constant, Eu exhibits a monotonically decreasing tendency as the transverse tube pitch increases. The larger the transverse tube pitch, the more significant the decreasing trend of Eu. Compared with the Eu with a transverse tube pitch of 98 mm, the Eu with transverse tube pitches of 101 mm, 104 mm, 107 mm, and 110 mm, on average, decreases by 9.22%, 17.28%, 25.50%, and 32.09%, respectively. This shows that within the scope of the simulated results, the larger the transverse tube pitch, the smaller the flow resistance.
As shown in Figure 7c, when the transverse tube pitch remains constant, PEC1 shows a monotonically increasing trend as Re increases. When Re remains constant, PEC1 shows a monotonically increasing trend as the transverse tube pitch increases. Compared with PEC1 with a transverse tube pitch of 98 mm, PEC1 with transverse tube pitches of 101 mm, 104 mm, 107 mm, and 110 mm, on average, increases by 0.97%, 1.86%, 3.01%, and 4.23%, respectively. This shows that in the range of simulated results, the greater the transverse tube pitch, the more intense the comprehensive heat transfer performance of the tube banks.
Figure 8 shows the influence of longitudinal tube pitch on Nu, Eu, and PEC1. As shown in Figure 8a, when the longitudinal tube pitch remains constant, Nu increases monotonously as Re increases. When Re remains constant, as the longitudinal tube pitch increases, Nu shows a monotonically increasing trend. Compared with the longitudinal tube pitch of 83 mm, the longitudinal tube pitch of 86 mm, 89, 92 mm, and 95 mm increases by an average of 1.64%, 3.36%, 5.06%, and 6.70%, respectively. This shows that within the scope of the simulated results, the larger the longitudinal tube pitch, the better the heat transfer performance of the tube banks.
As shown in Figure 8b, when the longitudinal tube pitch remains constant, Eu decreases monotonously as Re increases. When Re remains constant, as the longitudinal tube pitch increases, Eu shows a monotonically decreasing trend. Compared with the longitudinal tube pitch of 83 mm, the longitudinal tube pitch of 86 mm, 89 mm, 92 mm, and 95 mm decreases by 7.88%, 14.59%, 20.43%, and 25.64%, respectively. This shows that within the scope of the simulated results, as the longitudinal tube pitch increases, the flow resistance of the tube banks decreases.
As shown in Figure 8c, when the longitudinal tube pitch remains constant, PEC1 shows a monotonically increasing trend as Re increases. When Re remains constant, PEC1 shows a monotonically increasing trend as the longitudinal tube pitch increases. Compared with the longitudinal tube pitch of 83 mm, the longitudinal tube pitch of 86 mm, 89 mm, 92 mm, and 95 mm, on average, increases by 4.61%, 9.28%, 13.94%, and 18.58%, respectively. This shows that within the scope of the simulated results, as the longitudinal tube pitch increases, the overall heat transfer performance of the tube banks increases.
The results of the influence of transverse and longitudinal tube pitch on the comprehensive heat transfer performance of the superheater tube bundles are shown in Table 3. When the transverse and longitudinal tube pitch are 110 mm and 95 mm, respectively, PEC1 reaches the maximum value.

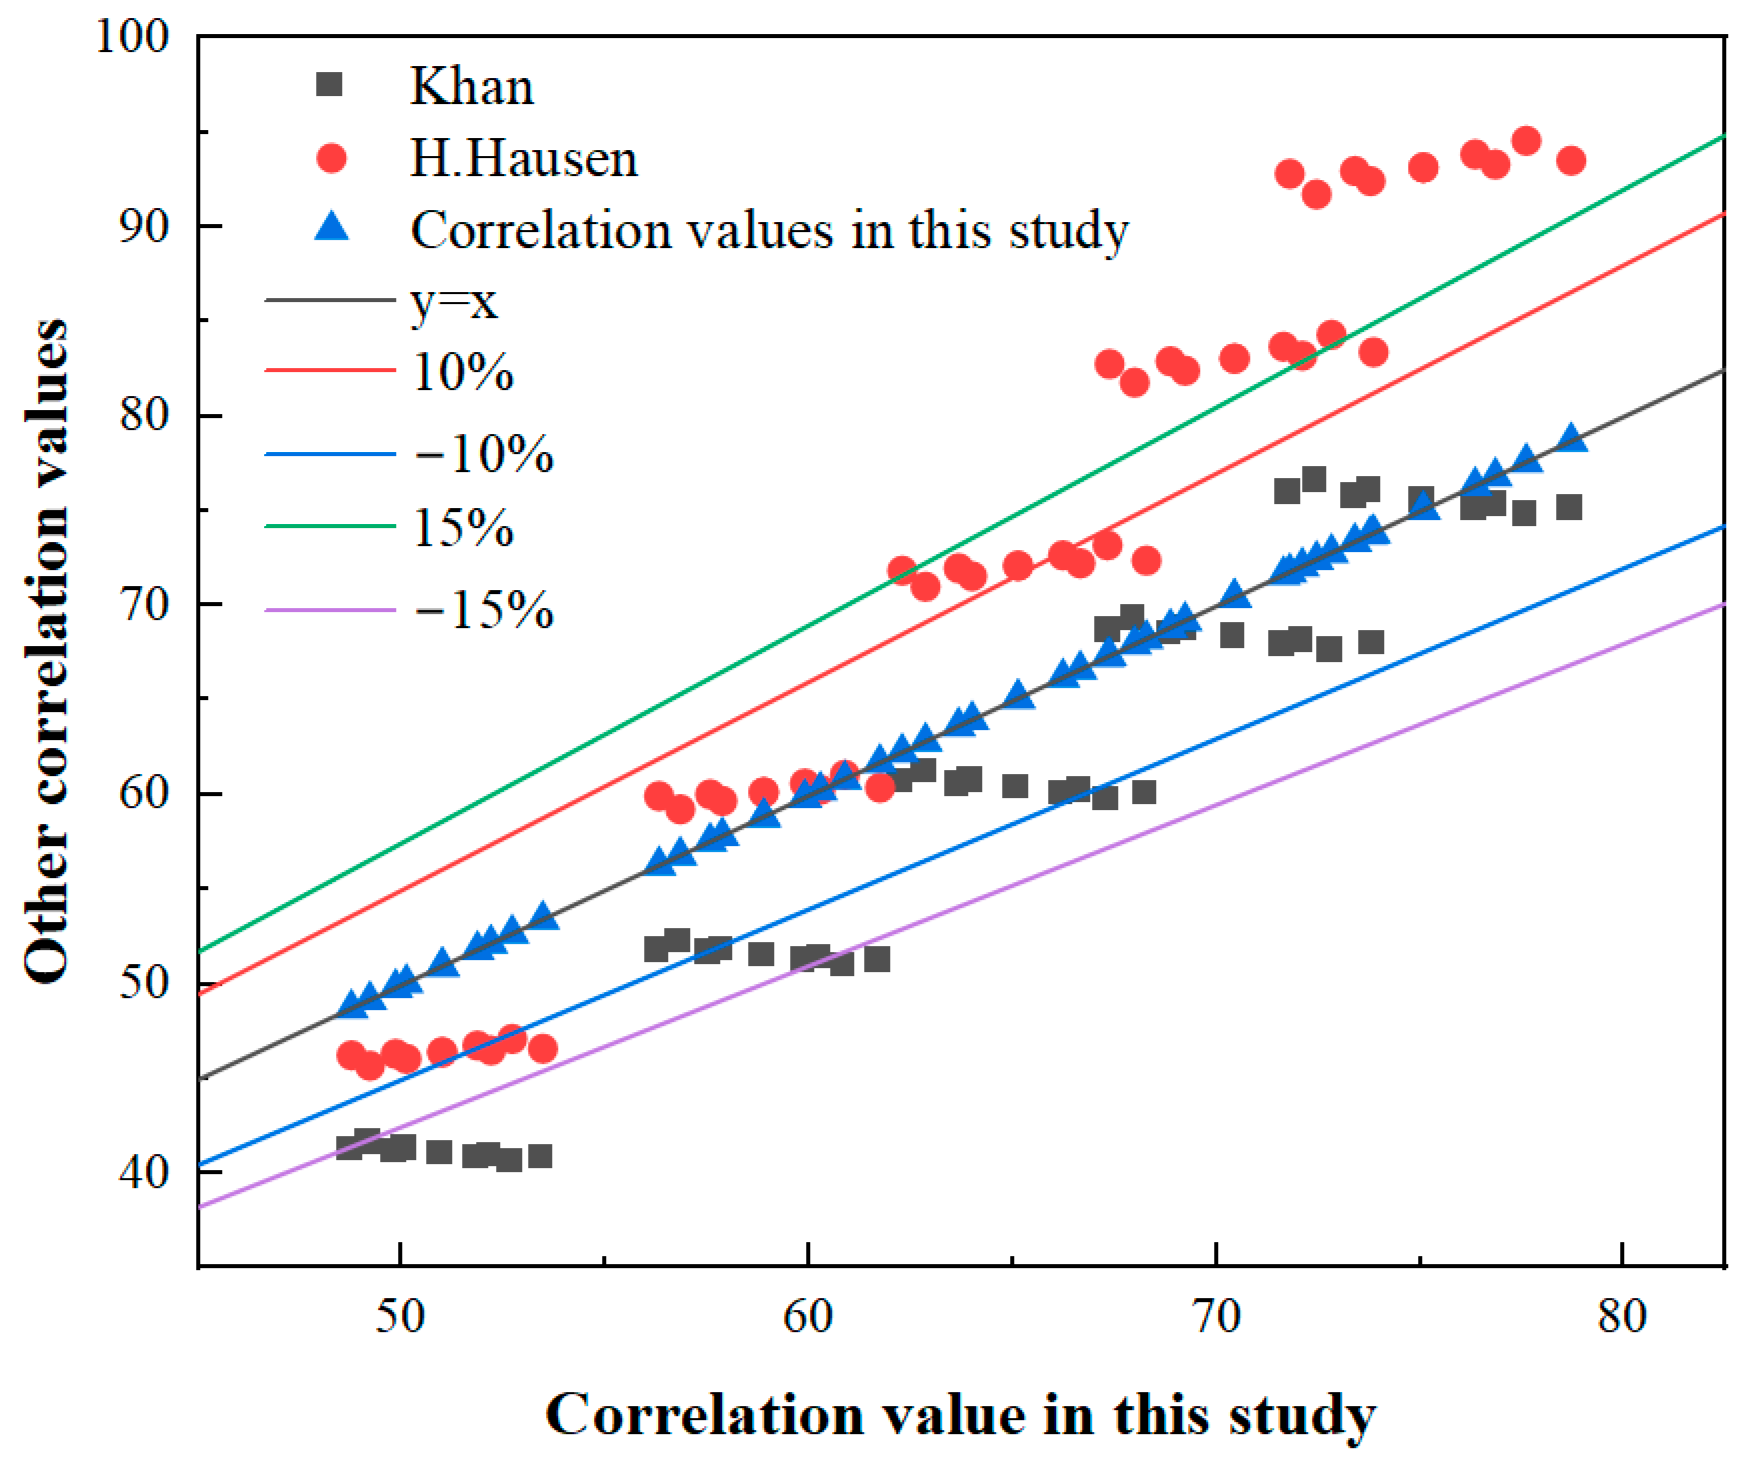
3.3. Correlation Formula of Nu and Eu

According to the simulated results, the dimensionless numbers ST/do and SL/do are applied to represent the flow and heat transfer properties of the superheater tube bundle of the hydrocracking HRSG. The simulated results are nonlinearly fitted, and the heat transfer and flow resistance correlations of superheater tube bundles are as follows:
N u = 6.832 Re 0.317 × Pr 1 3 × S T d o 0.796 × S L d o 0.509
E u = 685.717 Re 0.139 × S T d o 3.288 × S L d o 2.178
As shown in Figure 9, comparing the simulated values with the correlation values, the results show that for Nu, the coefficient of determination is 0.986, the range of proportional error is −4.95–2.24%, and the average proportional error is 1.39%. For Eu, the determination coefficient is 0.954, the proportional error range is −5.3–8.01%, and the average proportional error is 2.43%. The range of parameters is as follows: Re = 3580–12,140, ST/do = 3.5–3.93, and SL/do = 2.96–3.39.
In order to analyze the correctness of the correlation, the correlation values in this study are evaluated with the correlation values of Khan [44] and Hausen [45] in the Figure 10. The results show that compared with the correlation values of Khan, the relative error range is −26.35–5.91% and the average relative error is 9.30%. Compared with the correlation values of Hausen, the relative error range is −23.66–5.76% and the average relative error is 9.18%. The difference between different correlation values consists in the scope of application of the correlations. When the correlation is used to predict the results beyond its scope of application, the error of the correlation prediction results will increase. The difference in the prediction results of different correlations at the same data will be more significant.

4. Conclusions

For the purpose of utilizing the waste heat resources from the coking gas of hydrocracking catalysts, the flow resistance and heat transfer properties of superheaters in hydrocracking HRSGs are studied via numerical simulation in this study. The velocity field and temperature field are obtained. The effects of transverse tube pitch and longitudinal tube pitch on the flow resistance and heat transfer properties of the superheater tube bundles are analyzed. Based on the simulated results, the correlations of Nu and Eu are fitted. The main findings are as follows:
In the range of simulated results, as the transverse tube pitch increases, Nu shows a monotonically increasing trend, Eu shows a monotonically decreasing trend, and PEC1 shows a monotonically increasing trend. As the longitudinal tube pitch increases, Nu shows a monotonically increasing trend, Eu shows a monotonically decreasing trend, and PEC1 shows a monotonically increasing trend. When the transverse and longitudinal tube pitches are 110 mm and 95 mm, respectively, PEC1 obtains the maximum value. Compared with the primary structural parameters of a transverse tube pitch of 104 mm and a longitudinal tube pitch of 89 mm, PEC1 increases by 2.32% and 8.50%, respectively. A new correlation is acquired to predict Nu and Eu of the superheater tube bundles in the hydrocracking HRSG in the range of Re = 3580–12,140, ST/do = 3.5–3.93, and SL/do = 2.96–3.39.

5. Prospects

Future research could consider experimental research on flow resistance and heat transfer properties of superheater tube banks, and use optimization methods to optimize structural parameters.

Author Contributions

D.Z.: conceptualization, methodology, writing—original draft. X.W.: project administration, writing—review and editing. L.Z.: writing—review and editing. H.X.: supervision, writing—review and editing. C.G.: data curation. F.Q.: supervision, writing—review and editing. H.D.: funding acquisition, supervision. Y.H.: writing—review and editing. All authors have read and agreed to the published version of the manuscript.

Funding

The authors are grateful to financial support for this work provided by the Science and Technology Program of Zhangjiagang, China (ZKCXY2101) and the Efficient modular desulfurization and control technology of coal-fired boiler flue gas.

Data Availability Statement

Not available.

Conflicts of Interest

The authors declare that they have no known competing financial interests or personal relationships that could have appeared to influence the work reported in this paper.

Nomenclature

ST transverse tube pitch (mm)SL longitudinal tube pitch (mm)
di inner diameter (mm)do outer diameter (mm)
ug,i velocity of gas inlet (m/s)uv,i velocity of vapor inlet (m/s)
Tg,i temperature of gas inlet (K)Tv,i temperature of vapor inlet (K)
Re Reynolds numberNu Nusselt number
Eu Euler numberPEC performance evaluation criteria
Greek symbols
λv thermal conductivity of vapor (W/(m·K))λg thermal conductivity of gas (W/(m·K))
μg viscosity of gas (Pa·s)μv viscosity of vapor (Pa·s)
ρg density of gas (kg/m3)ρv density of vapor (kg/m3)
Cpg specific heat of gas (J/kg·K)Cpv specific heat of vapor (J/kg·K)

References

  1. Dickerson, T.; Soria, J. Catalytic Fast Pyrolysis: A Review. Energies 2013, 6, 514–538. [Google Scholar] [CrossRef]
  2. Min, Q.; Lu, Y.; Liu, Z.; Su, C.; Wang, B. Machine Learning based Digital Twin Framework for Production Optimization in Petrochemical Industry. Int. J. Inf. Manag. 2019, 49, 502–519. [Google Scholar] [CrossRef]
  3. Sadrameli, S.M. Thermal/catalytic cracking of liquid hydrocarbons for the production of olefins: A state-of-the-art review II: Catalytic cracking review. Fuel 2016, 173, 285–297. [Google Scholar] [CrossRef]
  4. Abuhasel, K.; Kchaou, M.; Alquraish, M.; Munusamy, Y.; Jeng, Y.T. Oily Wastewater Treatment: Overview of Conventional and Modern Methods, Challenges, and Future Opportunities. Water 2021, 13, 980. [Google Scholar] [CrossRef]
  5. Elliott, D.C. Historical developments in hydroprocessing bio-oils. Energy Fuels 2007, 21, 1792–1815. [Google Scholar] [CrossRef]
  6. Lopez, G.; Artetxe, M.; Amutio, M.; Bilbao, J.; Olazar, M. Thermochemical routes for the valorization of waste polyolefinic plastics to produce fuels and chemicals. A Review. Renew. Sustain. Energy Rev. 2017, 73, 346–368. [Google Scholar] [CrossRef]
  7. Rana, M.S.; Samano, V.; Ancheyta, J.; Diaz, J.A.I. A review of recent advances on process technologies for upgrading of heavy oils and residua. Fuel 2007, 86, 1216–1231. [Google Scholar] [CrossRef]
  8. Akcil, A.; Veglio, F.; Ferella, F.; Okudan, M.D.; Tuncuk, A. A review of metal recovery from spent petroleum catalysts and ash. Waste Manag. 2015, 45, 420–433. [Google Scholar] [CrossRef]
  9. Farias, C.B.B.; Almeida, F.C.G.; Silva, I.A.; Souza, T.C.; Meira, H.M.; Soares da Silva, R.d.C.F.; Luna, J.M.; Santos, V.A.; Converti, A.; Banat, I.M.; et al. Production of green surfactants: Market prospects. Electron. J. Biotechnol. 2021, 51, 28–39. [Google Scholar] [CrossRef]
  10. Sadrameli, S.M. Thermal/catalytic cracking of hydrocarbons for the production of olefins: A state-of-the-art review I: Thermal cracking review. Fuel 2015, 140, 102–115. [Google Scholar] [CrossRef]
  11. Vedrine, J.C. Heterogeneous Catalysis on Metal Oxides. Catalysts 2017, 7, 341. [Google Scholar] [CrossRef]
  12. Karimi, H.; Khani, M.R.; Gharibi, M.; Mahdikia, H.; Shokri, B. Plasma pyrolysis feasibility study of spent petrochemical catalyst wastes to hydrogen production. J. Mater. Cycles Waste Manag. 2020, 22, 2059–2070. [Google Scholar] [CrossRef]
  13. Wu, D.H. Advances in China’s refining and petrochemical catalysts. Catal. Today 1996, 30, 21–31. [Google Scholar] [CrossRef]
  14. Norouzi, E.; Amidpour, M. Optimal thermodynamic and economic volume of a heat recovery steam generator by constructal design. Int. Commun. Heat Mass Transf. 2012, 39, 1286–1292. [Google Scholar] [CrossRef]
  15. Taler, D.; Trojan, M.; Dzierwa, P.; Kaczmarski, K.; Taler, J. Numerical simulation of convective superheaters in steam boilers. Int. J. Therm. Sci. 2018, 129, 320–333. [Google Scholar] [CrossRef]
  16. Maakala, V.; Jarvinen, M.; Vuorinen, V. Computational fluid dynamics modeling and experimental validation of heat transfer and fluid flow in the recovery boiler superheater region. Appl. Therm. Eng. 2018, 139, 222–238. [Google Scholar] [CrossRef]
  17. Qi, J.; Zhou, K.; Huang, J.; Si, X. Numerical simulation of the heat transfer of superheater tubes in power plants considering oxide scale. Int. J. Heat Mass Transf. 2018, 122, 929–938. [Google Scholar] [CrossRef]
  18. Madejski, P.; Taler, D.; Taler, J. Modeling of transient operation of steam superheater in CFB boiler. Energy 2019, 182, 965–974. [Google Scholar] [CrossRef]
  19. Bang, Y.-M.; Park, S.R.; Cho, C.P.; Cho, M.; Park, S. Thermal and flow characteristics of a cylindrical superheater with circular fins. Appl. Therm. Eng. 2020, 181, 115895. [Google Scholar] [CrossRef]
  20. Laubscher, R.; Rousseau, P. Numerical investigation into the effect of burner swirl direction on furnace and superheater heat absorption for a 620 MWe opposing wall-fired pulverized coal boiler. Int. J. Heat Mass Transf. 2019, 137, 506–522. [Google Scholar] [CrossRef]
  21. Laubscher, R.; Rousseau, P. Coupled simulation and validation of a utility-scale pulverized coal-fired boiler radiant final-stage superheater. Therm. Sci. Eng. Prog. 2020, 18, 100512. [Google Scholar] [CrossRef]
  22. Laubscher, R.; Rousseau, P. CFD study of pulverized coal-fired boiler evaporator and radiant superheaters at varying loads. Appl. Therm. Eng. 2019, 160, 114057. [Google Scholar] [CrossRef]
  23. Zhou, Y.; Xu, T.; Hui, S.; Zhang, M. Experimental and numerical study on the flow fields in upper furnace for large scale tangentially fired boilers. Appl. Therm. Eng. 2009, 29, 732–739. [Google Scholar] [CrossRef]
  24. He, Y.L.; Han, H.; Tao, W.Q.; Zhang, Y.W. Numerical study of heat-transfer enhancement by punched winglet-type vortex generator arrays in fin-and-tube heat exchangers. Int. J. Heat Mass Transf. 2012, 55, 5449–5458. [Google Scholar] [CrossRef]
  25. Jang, J.Y.; Chen, L.K. Numerical analysis of heat transfer and fluid flow in a three-dimensional wavy-fin and tube heat exchanger. Int. J. Heat Mass Transf. 1997, 40, 3981–3990. [Google Scholar] [CrossRef]
  26. Li, J.; Wang, S.; Chen, J.; Lei, Y.-G. Numerical study on a slit fin-and-tube heat exchanger with longitudinal vortex generators. Int. J. Heat Mass Transf. 2011, 54, 1743–1751. [Google Scholar] [CrossRef]
  27. Modi, A.J.; Rathod, M.K. Comparative study of heat transfer enhancement and pressure drop for fin-and-circular tube compact heat exchangers with sinusoidal wavy and elliptical curved rectangular winglet vortex generator. Int. J. Heat Mass Transf. 2019, 141, 310–326. [Google Scholar] [CrossRef]
  28. Wen, J.; Gu, X.; Wang, M.; Liu, Y.; Wang, S. Multi-parameter optimization of shell-and-tube heat exchanger with helical baffles based on entransy theory. Appl. Therm. Eng. 2018, 130, 804–813. [Google Scholar] [CrossRef]
  29. Du, X.; Feng, L.; Yang, Y.; Yang, L. Experimental study on heat transfer enhancement of wavy finned flat tube with longitudinal vortex generators. Appl. Therm. Eng. 2013, 50, 55–62. [Google Scholar] [CrossRef]
  30. Zhang, J.; Zhao, Y.; Diao, Y.; Zhang, Y. An experimental study on fluid flow and heat transfer in a multiport minichannel flat tube with micro-fin structures. Int. J. Heat Mass Transf. 2015, 84, 511–520. [Google Scholar] [CrossRef]
  31. Gao, H.; Zhang, Y.; Liu, Y.; Wang, Y.; Sun, P.; Ma, Y.; Gu, Z.; Yu, W. Numerical simulation of heat transfer performance of different heat exchange tubes in heat recovery steam generator. Process Saf. Environ. Prot. 2022, 163, 506–512. [Google Scholar] [CrossRef]
  32. Unger, S.; Beyer, M.; Arlit, M.; Stasch, P.; Hampel, U. An experimental investigation on the air-side heat transfer and flow resistance of finned short oval tubes at different tube tilt angles. Int. J. Therm. Sci. 2019, 140, 225–237. [Google Scholar] [CrossRef]
  33. Zhang, J.-N.; Cheng, M.; Ding, Y.-D.; Fu, Q.; Chen, Z.-Y. Influence of geometric parameters on the gas-side heat transfer and pressure drop characteristics of three-dimensional finned tube. Int. J. Heat Mass Transf. 2019, 133, 192–202. [Google Scholar] [CrossRef]
  34. Tan, X.-H.; Zhu, D.-S.; Zhou, G.-Y.; Zeng, L.-D. Heat transfer and pressure drop performance of twisted oval tube heat exchanger. Appl. Therm. Eng. 2013, 50, 374–383. [Google Scholar] [CrossRef]
  35. Lemmon, E.W.; Bell, I.H.; Huber, M.L.; McLinden, M.O. NIST Standard Reference Database 23: Reference Fluid Thermodynamic and Transport Properties-REFPROP, version 10.0; Standard Reference Data Program; National Institute of Standards and Technology: Gaithersburg, MD, USA, 2018. [CrossRef]
  36. Wu, W.; Zhang, M.; Dong, H. Numerical investigation on flow and atomization characteristics of hydrated magnesium nitrate gas-liquid two-fluid nozzle. Proc. Inst. Mech. Eng. Part C J. Mech. Eng. Sci. 2023, 237, 83–94. [Google Scholar] [CrossRef]
  37. Yang, S.; Tao, W. Heat Transfer, 4th ed.; Higher Education Press: Beijing, China, 2006. [Google Scholar]
  38. Raithby, G.D.; Chui, E.H. A Finite-Volume Method for Predicting a Radiant Heat Transfer in Enclosures with Participating Media. J. Heat Transf. 1990, 112, 415–423. [Google Scholar] [CrossRef]
  39. Chui, E.H.; Raithby, G.D. Computation of Radiant Heat Transfer on a Non-Orthogonal Mesh Using the Finite-Volume Method. Numer. Heat Transf. Part B 1993, 23, 269–288. [Google Scholar] [CrossRef]
  40. Webb, R.L. Performance evaluation criteria for use of enhanced heat transfer surfaces in heat exchange design. Int. J. Heat Mass Transf. 1981, 24, 715–726. [Google Scholar] [CrossRef]
  41. Zhukauskas, A.A. Convective Heat Transfer in the Heat Exchanger; Science Press: Beijing, China, 1986. [Google Scholar]
  42. Hatipoglu, F.; Avci, I. Flow around a partly buried cylinder in a steady current. Ocean. Eng. 2003, 30, 239–249. [Google Scholar] [CrossRef]
  43. Zhang, H.; Yang, J.-M.; Xiao, L.-F.; Lu, H.-N. Large-eddy simulation of the flow past both finite and infinite circular cylinders at Re=3900. J. Hydrodyn. 2015, 27, 195–203. [Google Scholar] [CrossRef]
  44. Khan, W.A.; Culham, J.R.; Yovanovich, M.M. Convection heat transfer from tube banks in crossflow: Analytical approach. Int. J. Heat Mass Transf. 2006, 49, 4831–4838. [Google Scholar] [CrossRef]
  45. Hausen, H. Heat Transfer in Counterflow, Parallel-Flow and Cross Flow; McGraw-Hill: New York, NY, USA, 1983. [Google Scholar]
Figure 1. Schematic diagram and simplified physical model of hydrocracking HRSG.
Energies 16 06266 g001
Figure 2. Grid details of superheater tube bundles.
Energies 16 06266 g002
Figure 3. The comparison of the simulated value and the correlation value.
Energies 16 06266 g003
Figure 4. Temperature distribution and local amplification of Z-axis cross-section.
Energies 16 06266 g004
Figure 5. The velocity contour and velocity vectors of Z-axis cross-section.
Energies 16 06266 g005
Figure 6. The streamlines of 3D and Z-axis cross-section.
Energies 16 06266 g006
Figure 7. The effect of transverse tube pitch on heat transfer and flow properties. (a) Nu; (b) Eu; (c) PEC1
Energies 16 06266 g007
Figure 8. The effect of longitudinal tube pitch on heat transfer and flow properties. (a) Nu; (b) Eu; (c) PEC1
Energies 16 06266 g008
Figure 9. Comparative results of simulation and correlative prediction.
Energies 16 06266 g009
Figure 10. Comparison of correlation values.
Energies 16 06266 g010
Table 1. Parameters and boundary conditions.
Value/Unit Value/Unit
Fin parameters
do31 mmdi25 mm
Lt500 mmSL89 mm
ST104 mmFront extension300 mm
Tail extension1000 mm
Boundary conditions
ug,i10.91 m/suv,i5.3 m/s
Tg,i1123.15 KTv,i693.15 K
Parameters of the working substance
Cpg0.982 + 1.751 × 10⁻⁴ T + 1.821 × 10⁻⁷ T2 − 9.285 × 10⁻¹¹ T3 (J/kg·K)
λg−1.729 × 10⁻⁴ + 8.421 × 10⁻⁵ T + 1.086 × 10⁻⁹ T2 (W/m·K)
μg5.030 × 10−6 + 4.509 × 10⁻⁸ T − 8.061 × 10⁻¹² T2 (Pa·s)
Cpv3697.09 − 8.46 T + 1.32405 × 10⁻² T2 − 6.33368 × 10⁻⁶ T3 (J/kg·K)
λv−2.67 × 10⁻³ + 6.63499 × 10⁻⁵ T − 1.3815210−8 T2 (W/m·K)
μv−9.89223 × 10⁻⁷ + 3.6063610−8 T + 1.6469 × 10⁻¹⁴ T2 (Pa·s)
Table 2. Grid independence verification.
Case 1Case 2Case 3Case 4Case 5Case 6
Number of grids734,5821,438,8832,864,0025,262,3996,576,9157,432,313
Nu62.4863.1263.6464.6364.1964.20
Table 3. The effect of transverse and longitudinal tube pitch on the overall heat transfer performance of the superheater tube banks.
ST (mm)SL (mm)Average PEC1Increment (%)
Primary structural parameters10489107.84-
Transverse tube pitch adjustment11089110.342.32
Longitudinal tube pitch adjustment10495117.018.50
Disclaimer/Publisher’s Note: The statements, opinions and data contained in all publications are solely those of the individual author(s) and contributor(s) and not of MDPI and/or the editor(s). MDPI and/or the editor(s) disclaim responsibility for any injury to people or property resulting from any ideas, methods, instructions or products referred to in the content.

