Abstract
A thorough study of the literature suggests that greater attention has to be paid to power line noise measurements, characterization, and modeling. Several studies show that significant differences do exist, and the findings are somewhat conflicting. This may be attributed to the diverse environment under investigation, which includes volatile noise sources, differences in electrical grid structure from country to country, topology, and unknown power cable characteristics. An in-depth analysis of the approaches for measuring, characterizing, and modeling noise, as well as the descriptions of relevant components, and the environment needed to carry out the measurements, is presented. This review serves as a roadmap for academics and engineers in the deployment of power line communication systems.
1. Introduction
Power line communication (PLC) [1] technology allows information to be sent over prevailing power cables that were initially created for electrical power transmission, benefiting from the power-line infrastructure that had already been established for data communication purposes. PLC can also be regarded as a technology that provides communication services over medium- and low-voltage electrical networks [2]. The PLC approach entails superimposing a low-energy high-frequency signal (message signal, 1.6 to 30 MHz) over a 50 Hz electrical pulse [2,3]. Electrical power lines are present across the world, therefore making employing power lines for broadband communication easy and cost-effective because this removes the need for additional infrastructure costs for the system channel. It requires no additional wiring changes to allow broadband connection (it can be collected from any outlet) and uses existing power networks without installing a single new cable. Broadband powerline communication allows for simple installation with relatively low access costs. Simply plug the device into a socket and you’re connected to the Internet [4].
PLC has been around for a thousand years. In the beginning, communication took place at incredibly low frequencies. Due to the growing drive to encourage networking in, workplaces, buildings, and organizations, power lines are now a well-thought-out channel for swift data transmission (>2 Mbps) [2,3,4,5,6]. Through the installation of specific units, with the ability to transfer data through the electrical supply network, PLC broadband technology can share or spread a prevailing Internet connection using electrical connectors [7]. The installation of electrical networks, their interconnections, as well as the growing variety of electrical goods, spurred the formation of the initial network standardization groups, such as the International Electrotechnical Commission (IEC). Electrical engineering is handled by the IEC and Cenelect (European Committee for Electrotechnical Standardization), whereas telecommunications is handled by the European Telecommunication Standards Institute (ETSI). All other areas of work are covered by International Organization for Standardization (European Committee for Standardization) [2]. These international standards are targeted at minimizing wired network interfering emissions [7]. Broadband communication coverage in remote hilly regions and desert areas remains a major concern due to countries’ unequal geographical and population makeups [4]. The accessibility of broadband enhanced development, therefore, remote locations are faced with poor communication due to lack of access. Hence, broadband communication has a tremendous impact on a country’s social and economic development [4].
Power line communication technology is of two types namely: broadband and narrowband communication. Similarly, the technology can be categorized into two elements: access and in-house powerline networks [8]. Access power line technology is the medium of transferring data across low-voltage lines, whereas in-house power line communication involves the sending of information inside structures and covering all the socket outputs. The electrical power line was built only for transmitting power at a low frequency of 50 Hz or 60 Hz [9]; however, the wideband signal is characterized by high frequency [7]. The power-line channel has varying levels of noise, depending on the frequency, time, and distance between the two power lines. PLC is the largest and most accessible network owing to its availability at every home.
PLC sometimes encounters substantial hurdles due to hostile channel characteristics such as noise, attenuation, and multipath propagation [10]. Using power lines there are various technological difficulties with data transmission at high frequencies because they were built to transport power at 50–60 Hz and no faster than 400 Hz. In addition to the high attenuation, power lines are one of the most electrically polluted places, making communication challenging [11]. Unlike many other technologies, PLC faces several technical hurdles as a result of its operating environment [12]. The principal impairments of PLC channels are noise—the worst of all—and multipath and frequency-dependent attenuation. The disadvantage of PLC is that it is widely employed in broadband communication, resulting in electromagnetic interference (EMI) and noise [4]. Several studies have been carried out on PLC channels across the world. For instance, over a decade the utilization of electrical power lines for hypermedia communications has received a lot of interest [10].
Power line noise has a serious effect on data transport, thereby affecting the definition of additive white Gaussian noise (AWGN) [13]. The power line network is very different from typical media like twisted pair and coaxial cables in terms of its topology, structure, and physical characteristics [10,14]. PLC is a type of wire communication that makes use of existing electrical power lines to transmit data messages rather than the ethernet data cables or telephones coaxial cables widely used by wireless communication [14]. PLC has been widely studied and it has been observed that the characteristics and models developed in one country may not be applicable to another country. This may be attributed to the diverse environments under investigation, which include volatile noise sources, differences in electrical grid structure from country to country, topology, and unknown power cable characteristics [14]. Adopting PLC systems in Nigeria could have several advantages such as cost-effectiveness, ease of network construction, a large bandwidth accessible at the frequency of operation, minimal potential, and high dependability. This technology seems a better option for addressing broadband internet access in Nigeria [14]. PLC is a cutting-edge technology with enormous revenue potential in the telecommunications and electrical industries. The development and commercialization of PLC technologies are primarily driven by the current liberalization and deregulation of numerous industries in Nigeria [11].
The noise present in communication networks is additive white Gaussian noise. However, PLC noise is non-Gaussian, extraordinarily complex, and unpredictable [15]. As a result of these requirements, this technology has become a future research priority.
2. Review of Related Works
There have been several studies in the literature reporting noise measurements, characterization, simulations, and modeling for indoor broadband power line networks. Reference [16] presents an in-depth investigation, study, and modeling of impulse noise in broadband power line communications, where narrow-band interference and impulse noise predominate in the frequency range from several hundred kilohertz to 20 MHz. Five classes of noise were used to categorize the power line network’s noise, namely, asynchronous impulse noise, periodic impulse noise, periodic impulse noise synchronous to the mains frequency, colored background noise, and narrowband noise. Due to the accumulation of an abundance of low-power noise sources, the colored noise possesses a low power spectral density (PSD) [15]. Conversely, signals from radio transmitting stations result in narrow-band noise, which primarily comprises amplitude-modulated sinusoidal signals. Periodic impulse noise that is asynchronous to the mains frequency and periodic impulse noise that is synchronous to the mains frequency are caused by switched-mode power supplies and the switching behavior of rectifier diodes found in many electrical products. In the power network, switching transients are a result of the asynchronous impulse noise. The power spectral density (PSD), impulse width, interarrival periods, and amplitude distributions are all obtained from the time-domain and spectral analysis of the impulse noise in typical power line settings. This method is ideal for simulation and implementation in computer-based communication systems. There is a large chance of bit error because the noise power increased significantly when impulse events occurred [17]. Authors have suggested that to lessen the impact of impulse events, modern frame structures with balanced, well-adapted interleaving, forward error correction, and error detection algorithms should be used in power line communication systems [6,12,15]. The measured data’s fundamental statistical qualities were calculated and examined. The investigation of interior distribution network noise in the PLC frequency range of 10 MHz to 30 MHz is presented by reference [15]. A frequency-domain spectrum analyzer was used to record the noise samples. The 10 to 30 MHz frequency band is of particular interest, especially for indoor PLC communication systems [12]. The measured data’s fundamental statistical qualities were calculated and examined. The findings are based on measurements made in both flats and medium-sized office buildings [15]. The samples were collected and distributed over a two-month period. The findings include statistical distribution functions for interference-free frequency intervals over a specific power level threshold, statistical distribution functions for noise amplitude levels in decibels, and the mean noise power, the standard deviation of noise power, and correlation qualities between the total noise power. The results demonstrate that computers and televisions are substantial sources of noise. To model the results, the author tried several theoretic probability functions, with exponential cumulative distribution proving to be the best according to least-squares calculations shown below [15]:
where λ stands for expectation and
where the lowest power level that has been recorded, and the power level, P, are expressed In dBm The analysis revealed that additionally, a Rayleigh curve exists, but it misrepresents the true distribution. Similar noise events that follow the Rayleigh distribution were seen by the author in the same frequency band, as shown by the probability density function. The function is described as follows [15]:
Expectation, for the Rayleigh distribution [15] is given by,
Hence, the variance is:
The author concluded after extensive research and observations that the distribution of noise amplitude frequently lies between the exponential and Rayleigh curves. The maximum noise levels are distributed exponentially even though the distribution is mostly Raleigh–like. Finally, a sizable amount of non-stochastic interference is generated by nearby electronic devices that were linked to the network terminals. In [17], Iain Mann et al. present models of impulse generation with appropriate amplitude, length, inter-arrival, and spectral characteristics. These models’ parameters are based on statistics derived from measurements of impulse noise on the telephone networks of British Telecom (BT) and Deutsche Telekom (DT). The Henkel/Kessler model, a unique model technique, was suggested. All the amplitude distributions of the recorded impulse noise voltage in the DT and BT networks were found to match this model. The Henkel/Kessler model is defined as [17]:
In addition, Weibull-type density was looked into as a potential substitute, which is defined to be,
Two parameters make up the Weibull model, α and b, instead of just one parameter as in the original Henkel/Kessler model. The impulse noise generated by the Weibull density is slightly lower than that produced by the Henkel/Kessler model [18]. As a result, the HK model suits the data better than the Weibull density. In [19], Mohamed Tlich et al. investigated noise generated by electrical appliances shared with PLC modems in the same power line network. Impulse noise sources are observed directly at their origins using a novel groundbreaking modeling technique and compared to receiver noise readings. The author was able to evaluate far fewer noise sources by measuring impulse noise at the source. The in-device generator is the only source of impulse noise, so electrical switches, thermostats, plugs, and engines were found to be the four sources [19]. Following that, six impulse noise classes were suggested, with three representative impulsive noise types reflecting short, medium, and lengthy periods for each class [19]. The characterization of impulse noise at the source led to the development of an impulse noise model for an electrical device [19]. An experimental investigation on impulse noise on indoor power lines used for data connectivity is categorized and described. The study focuses on measurements of indoor noise and its statistical characteristics, which serve as the foundation for a noise model that can be used to optimize transmission schemes. The noise measurements were carried out within 48 h in a residential home. The varieties of appliances randomly connected are television sets, PC, refrigerators, and vacuum cleaners. It was done using a high-impedance voltage probe with capacitive coupling [15] to catch the impulse noise between the live and neutral lines. Interarrival time, pseudo frequency, and pulse length are the noise model parameters. Regardless of the shape of a pulse, the pseudo-frequency distribution is the same [20]. A Weibull distribution F(x) proved to be more suitable to estimate the properties that can be inferred from measurements after numerous tests; its density function is as follows [19]:
hence, a is equivalent to , and b is equal to 2. Where represents the standard deviation. To make the experimental curve and the Weibull distribution fit [21], the parameters a and b are changed. In order to improve the transmission strategy for the optimal trade-off between symbol rate and low bit error rate, calculation time, as well as the delay between decoded and transmitted signals, the empirical distribution functions for the noise characteristics are employed in a simulation tool [20]. These functions match the experimental results. In [22], a framework is described for estimating and calculating data errors in transmission systems due to impulse noise in the local loop [22]. The innovative Bernoulli–Weibull impulse noise model in the symbol domain was discovered to be related to these statistical analyses. Because of their lighter tails than Weibull distributions, noise models that assume Rayleigh impulse distributions or Gaussian distributions gave excessively optimistic error estimates when used for evaluating impulse noise in telephone lines, according to the study. In [23], a novel approach was carried out for modeling channel and temporal variations in noise in indoor power lines in the frequency range of 0.15–30 MHz’ three electrical power cables, namely, neutral, ground, and phase were modeled by an RLCG circuit. The results were validated both in the frequency and time domains [22]. The most striking finding of the model is that, in power line communication systems, intermittent impulse noise is the dominant component of noise. As a result, the synchronous and asynchronous noise with the mains is both generated by the same source and are not distinguishable due to their proximity. Ref. [24] provides an in-depth analysis of the frequency-domain approach to measure, characterize, and model the statistical variation in indoor power line noise. The authors performed modeling analysis on the background and impulse noise. The background noise model is focused on noise spectrum analysis and measurements in a laboratory and a residential home. The impulse noise model is founded on measurements taken directly from the sources from various household electrical appliances. This modeling approach was used to evaluate and examine the efficiency of single- versus multi-carrier modulation. When exposed to the observed power line noise, multicarrier modulation outperforms single-carrier modulation. Reference [25] presents power network characteristics through measurements, modeling, and characterization. In order to characterize and model the time domain noise amplitude in useful indoor power line networks, the author used a statistical technique. The findings were checked using the error analysis technique, and they were also used to redesign traditional receiver structures and modulation schemes to make them more suitable for power line communication applications.
Little work has been done to define noise amplitude because various writers have focused more on noise features including pulse duration, arrival time, and inter-arrival intervals. The authors of [25] went into greater detail on noise amplitude characterization, presenting an alternative simulation method for measuring instantaneous noise amplitude in the time domain for indoor PLC. The Kernel density method was used to statistically match the instantaneous noise amplitude. The Kernel density model was utilized as a reference model to construct a stable distribution model. The Kernel density method used is non-parametric, which means that the estimates obtained by Kernel density methods are strictly data-based and do not assume any kind of probability density function. The data has been modeled in its current state. The model established does not obey any well-known parametric distributions, such as the Gaussian, exponential, or other distributions. The choice of this modeling suggests that PLC noise is highly impulsive, with non-Gaussian distributions as a consequence. As a result, a PLC system using the Gaussian model will perform badly. For a random variable n, the kernel density estimate is given by [25]:
The amount of data points is K, the smoothing parameters are [26] h, and is the data point, K is the Kernel function. The window width or bandwidth, often known as the smoothing parameter, is the most critical in any Kernel system since it governs the shape of the density calculation. These are the main features of the kernel density approach [25,27].
From the above equation, the kernel density estimate is a true power density function (PDF). Finally, additional measurements and alternate methods may be investigated to determine the validity of this study. Hence, reference [28] presents a broadband analysis and characterization of noise for in-door power-line communication channels. The authors developed a measurement method that could record noise for actual power networks in both the time and frequency domains. Impulse noise, background noise, and narrow-band noise are a few of the elements observed. They discovered that the impulsive components of PLC noise vary with time, have a high-power spectral density, are random in nature, and can last for small time durations. The time variability of PLC noise together with statistical analysis based on numerous measurements in power line scenarios is presented. The major differences in amplitudes of the impulse noise are characterized statistically and carefully observed. The background and impulsive PSD are presented with a parametric model. The time domain parameters for the duration, amplitude, and interval time of the noise statistics are similar. In the time and frequency domain, the parameters are compared with findings from the literature elsewhere, a general agreement is observable. According to the authors’ conclusion, the statistical data from this study can help with the ongoing design and optimization projects for PLC modems. Moreover, [29] presents power line communication (PLC) channel measurement and characterization. The authors provide an in-depth analysis of the measurement procedure for indoor power line communication and performed experimental investigations on indoor noise. PLC noise from actual indoor channels was measured both in time and frequency domains. The noise in the time domain was measured using a Tektronix TDS2024B digital storage oscilloscope, and the noise in the frequency domain was measured using a Rhode and Schwartz spectrum analyzer. The interconnection between the PLC channel and measuring equipment also uses a coupling circuit. This makes it easier to receive noisy signals. The coupler consists of a transformer and voltage surge suppressors. The major function of the latter is to reduce any voltage spikes that could harm the delicate monitoring apparatus. The results of the experimental analysis show that an indoor power line network’s noise characteristic has a significant impact on a link’s capacity to attain high data rates. In the same power line network, PLC modems and other appliances produce various types of noise, with impulse noises serving as the primary source of interference that results in signal distortions and bit errors during data transmission. It was discovered that the primary reason for packet failures in PLC networks is impulse noise. Ref. [29] describes different modeling methods including impulse noise modeling. This type of noise can have a considerable impact on the operation of PLC systems, according to actual measurements [30,31]. The capacity of PLC devices and systems to often sweep entire data symbols is the main area of interest for the research community and the designers of PLC devices and systems. The frequency of the impulses (which is the reciprocal of IAT) and the impulse energy are used to describe the impulse noise’s potency [29,30,31,32]. A comprehensive summary of the related research on noise characterization and modeling methods is presented in Table 1.

Table 1.
Summary of comparison of related works on noise characterization and modeling methods.
2.1. Approaches for Noise Model
The various statistical methods that have been put forth in the literature as models and simulations of impulsive and background noise are described below.
2.2. Middleton Class A Noise Model
In [51,52] Class A, class B, and class C are the three basic categories into which Middleton divides electromagnetic (EM) noise or interference. The Middleton Class A noise model, according to a number of studies, adequately captures the statistical properties of impulse noise in PLC contexts as shown in [53,54,55]. The Middleton Class A model states that the entire noise is made up of a number of independent, evenly dispersed complex random variables with the following probability density function (PDF):
where the variance is defined as:
A is known as the impulse index. The intensity of impulsive and background noise is represented as the variances and , respectively. In addition, Γ determines the ratio of impulse noise to background noise. Hence,
Equation (12) reveals that the Middleton class A noise PDF is a weighted average of Gaussian PDFs with the mean equation set to zero. The equations listed below [30,31,32,51,52,53,54,55] can be used to determine the process’s mean and variance.
The Middleton Class A model was created to explain how impulsive behavior and man-made EM interference interact. Even though many academics have studied this model to represent impulse noise, it is still unclear if it can be used to model impulse noise in power line networks.
2.3. Bernoulli–Gaussian Model
To model impulse noise in power line networks and other communication channels, the above model is commonly used [51,52,53,54,55,56]. For impulse noise, a Bernoulli–Gaussian model has been represented using the Bernoulli process b (m). While the amplitude of the impulses is described using the Gaussian distribution (m) [52].
2.4. Poisson Model
This model is frequently used to represent impulse noise because it is both straightforward and effective [52,53,54,55,56,57]. According to [56], the Poisson distribution is matched by the arrival of impulse noise in residential power line networks [58]. The Poisson–Gaussian model allows for the following definition of the impulse noise .
where represents the Poisson-based arrival of impulses, while is a white Gaussian process that characterizes the impulse amplitudes. In conclusion, it was discovered that the amplitude, duration, and interval time in the time domain of the impulse noise statistics are consistent with those observed elsewhere [56].
3. Noise Characterization in PLC
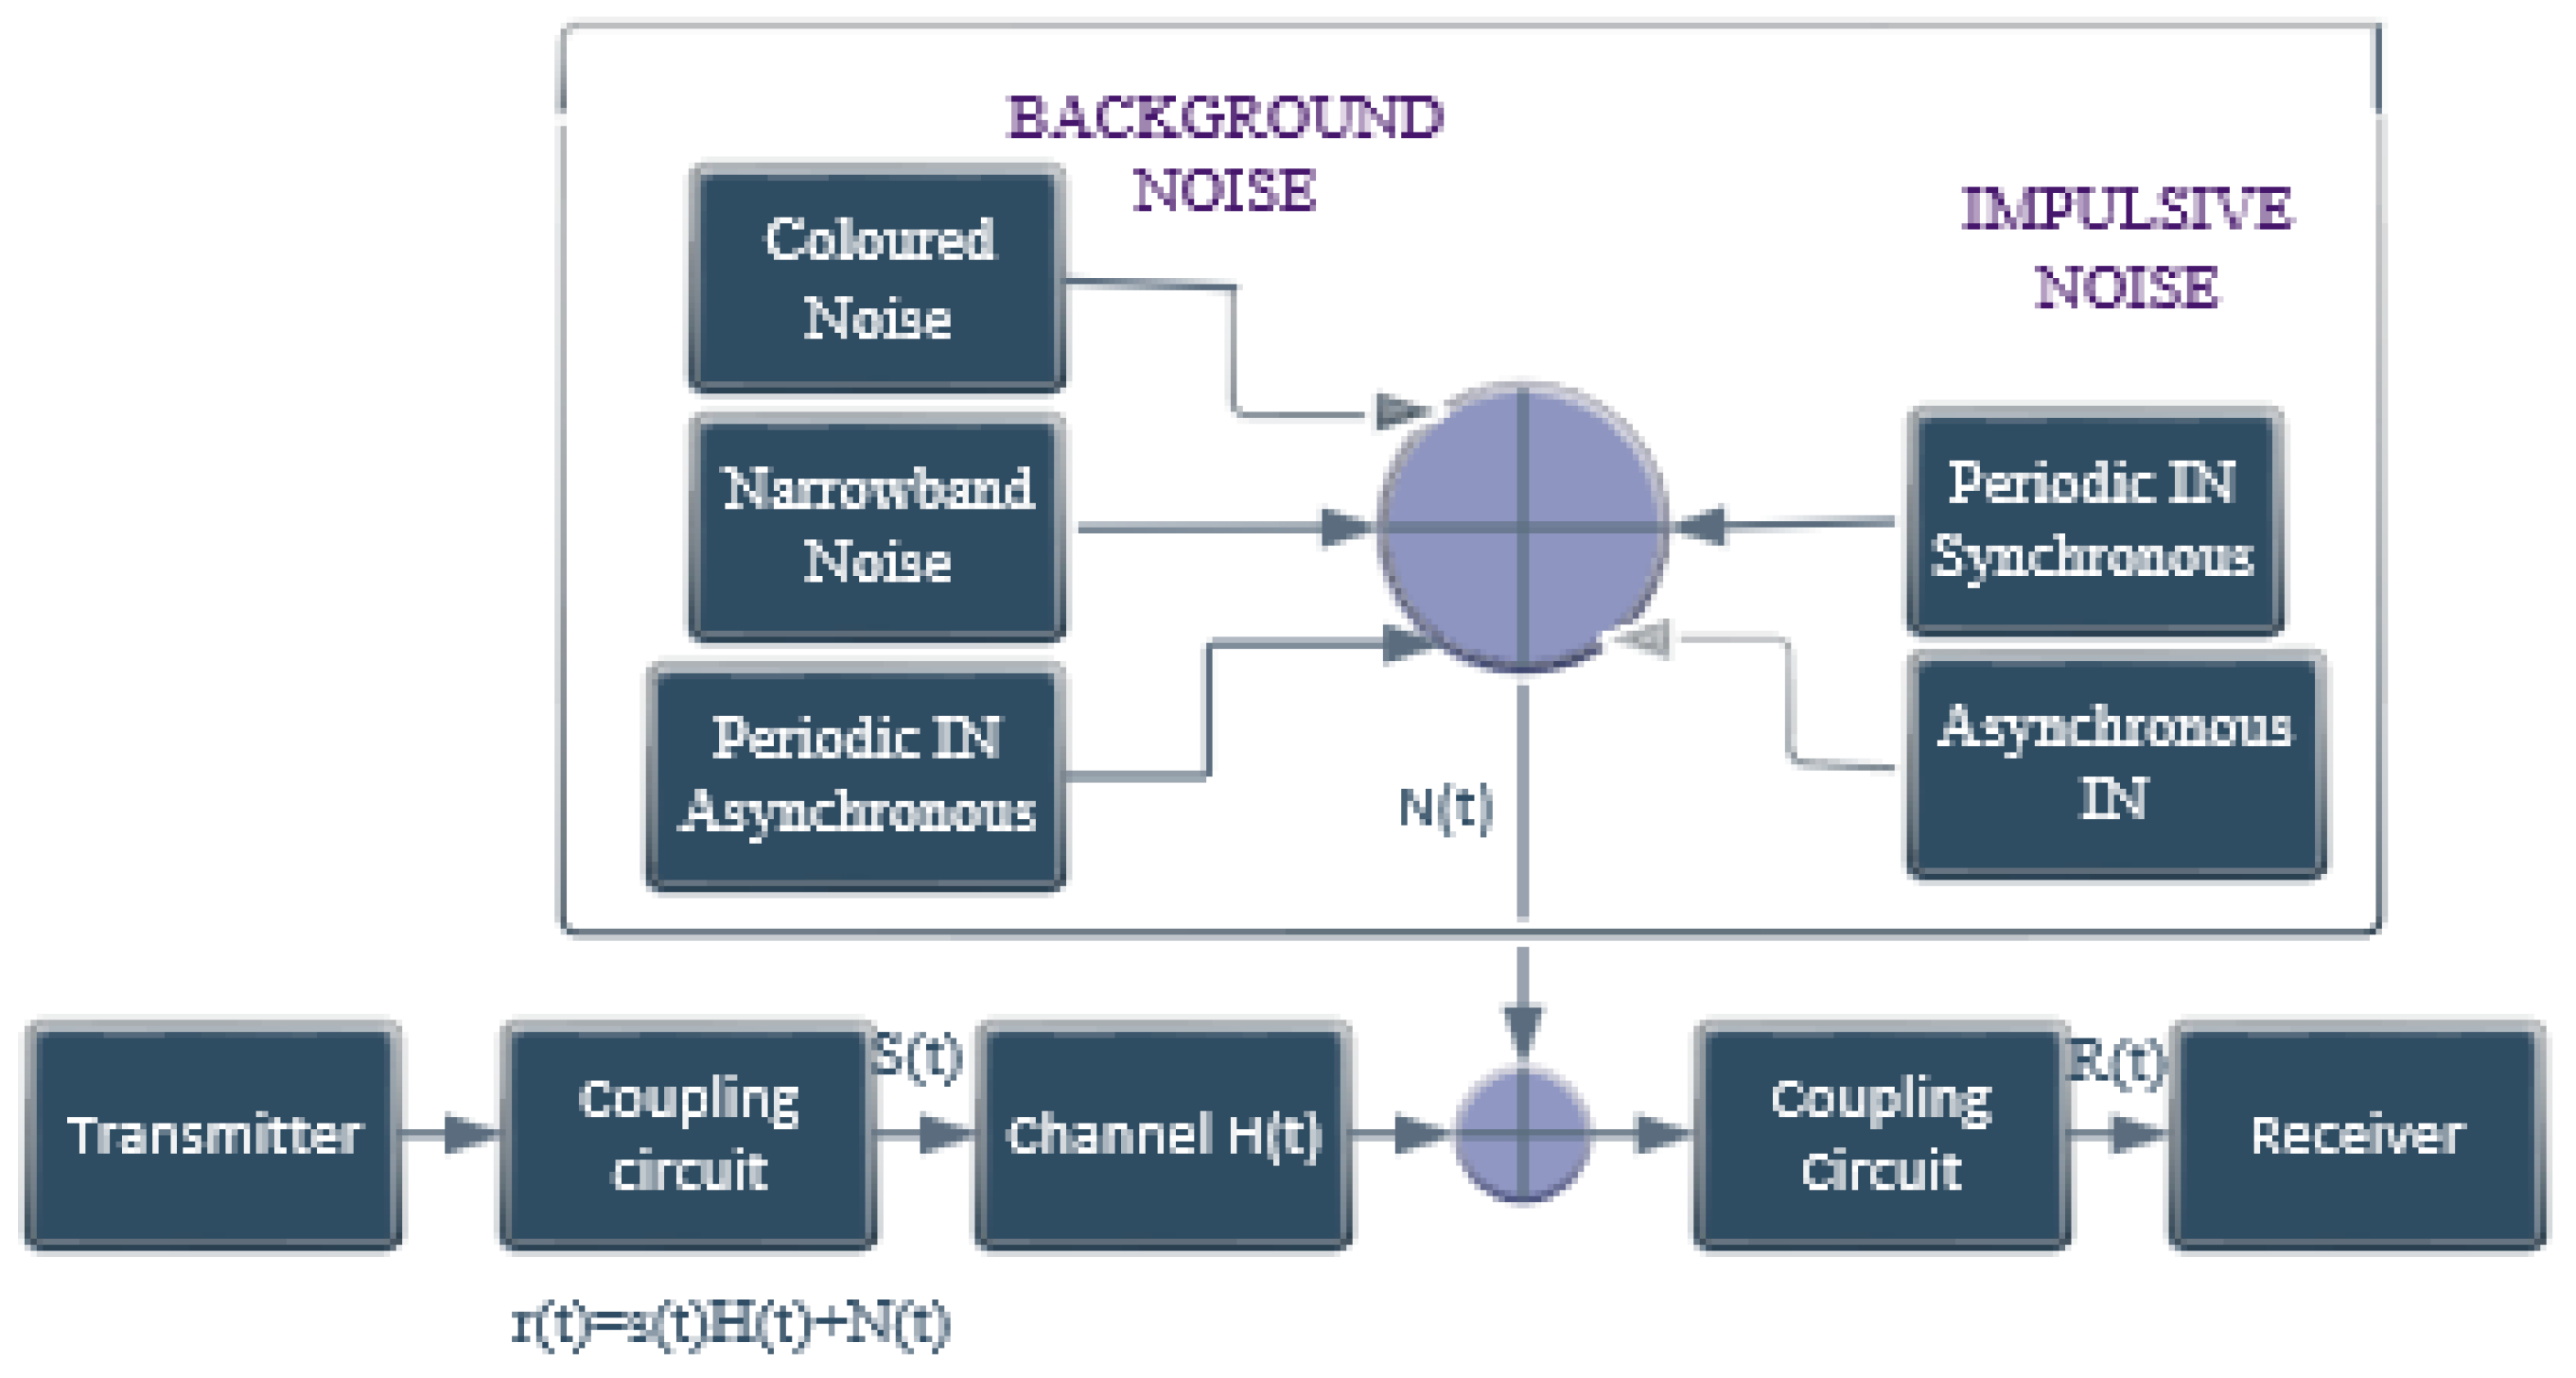
Electrical appliances that use the 50 Hz electricity supply are the main causes of noise on power lines and can produce well-extended noise components over the high-frequency range. In addition to these, certain frequency bands on power lines are significantly hampered by induced radio frequency transmissions from broadcast stations [59]. The presence of various sources of disturbance makes the noise scenario somewhat complex [60,61,62]. There are numerous classes of noise in PLC. As reported in [17], PLC generates noise in five different ways, as depicted in Figure 1.

Figure 1.
PLC noise characterization.
A PLC channel transfer function and the noise make up a PLC system. represents the transmitted signal that passes through a PLC channel, and denote the transfer function of the channel, as shown in Figure 1 [61,63]. The channel between the transmitter and receiver in a wireless communication system is characterized by reflection, diffraction, and signal dispersion, which can lead to considerably diminished signal power, or fading [64].
3.1. Background Noise
It has been discovered that background noise is brought on by typical building and home electrical equipment [61]. This type of noise results from the superimposition of many noise sources, such as hair dryers, computers, and dimmers, which can induce disruptions in the 0–100 MHz range herein considered [65]. It is typically categorized by a relatively low power spectral density that considerably rises as frequency decreases. A straightforward three-parameter model [10] is the commonly accepted model.
where f is a frequency expressed in MHz and a, b, and c are parameters [66] acquired from measurements. By entering the following values for the parameters [a, b, c]: [145, 53.23, 0.337]. The worst- and best-case scenario can be obtained. Plotting of the generated PSDs is possible when the frequency band under consideration is between 1 MHz and 30 MHz, a frequency spectrum that is suitable for broadband power line connectivity [33]. Background noise presents an exponential PSD. Contrasted with the outdoor PLC channel, it is higher in the inside PLC environment at low frequencies. Conversely, between 1 and 20 MHz, this noise is greater in medium voltage lines than it is in in-house line voltage lines Corona discharge is the source of background noise in outdoor medium voltage lines. The background noise’s PSD is represented by [67].
where, ρ, β, and γ are based on measurements and vary with location and time [67]. It is reported by [61] that the worst-case scenario is obtained for ρ = −140, β = 38.75, and γ = −0.72 [65,68].
3.2. Narrowband Noise
Narrowband noise happens at such low frequencies as a result of the switching of electrical devices such as power supplies, TVs, fluorescent lights, and computer screens [61]. Depending on the source of the noise, the power spectral density is straightforward and the noise may be described as the accumulation of several sine signals at varying frequencies and amplitudes [25].
3.3. Impulse Noise
Silicon controlled rectifiers (SCR) in power supplies frequently cause them to start pulsing. This is synchronized with the 60/120 Hz frequency in the United States (50/100 Hz in Europe) [61]. Despite the fact that the background noise is time-varying, considering how slowly it changes across timescales of seconds, minutes, and occasionally even hours, it can be said to be stationary. However, impulse noise cannot be regarded as stationary. Such impulses result in a perceptibly greater noise power, which could significantly increase the error rate [61]. Consequently, the general noise process can be stated as [61].
where the background noise is represented by the first component, and the impulse noise is represented by the second component [67].
3.4. Periodic Impulse Noise Asynchronous to the Mains Frequency
The main culprit for this type of noise is switching power supplies. These are present in a variety of home appliances and their repetition rates range from 50 kHz to 200 kHz [61]. Regardless of the electrical network’s frequency, this noise does not change. It is frequently produced by network-connected switched-mode power supplies (SMPSs). In accordance with SMPS switching frequencies, they can operate at frequencies of 200 to 300 kHz [67].
3.5. Periodic Impulse Noise Synchronous to the Mains Frequency
Isolated power network activity like turning on/off and plugging in/unplugging causes aperiodic impulse noise to occur. Although it occurs less frequently, this noise is more damaging. It has a short duration with a long interarrival time and an amplitude that can exceed 50 V. There is no periodicity in this noise, and it is independent of the mains frequency. Lighting systems also provide the PLC channel with a lot of noise. High-pressure sodium, mercury-vapor, light-emitting diodes, and compact fluorescent lamps are known to produce a lot of noise that interferes with the PLC channel [67,68,69].
4. PLC Regulations
For PLC to be compliant with regulatory authorities, standardization is required. There are numerous standards bodies, each with a unique set of well-established norms for governing and directing the operating needs of PLC systems. PLC systems’ high-frequency low-power and low-frequency high-power characteristics have grown to be the main reason for the demand for unrivaled regulatory bodies. The main purpose of the power grid cables was to transmit low-loss electrical power at frequencies of 50 Hz or 60 Hz. The use of the cables for PLC indicates that they will need to transport signals at frequencies ranging from 9 KHz to 30 MHz. A portion of the high-frequency signal power is radiated as electromagnetic radiation at these frequencies because the power lines start to leak. Power cables can be thought of as low-efficiency linear antennas in this context. When PLC signals cross the frequency bands of widely used wireless networks, interference may happen. The transmission power, distance, and particular wiring arrangement all play a significant role in how severe the interference is. For instance, if a broadcast radio receiver is put next to a power cable, a disruption is guaranteed to occur; but, at a distance of many meters, there is essentially no chance of this happening [25]. The power line channel must adhere to and function in accordance with certain operational requirements, such as electromagnetic compatibility (EMC), electric protection, and communication services, in order to prevent unwanted signals. This is because many other communication systems generate interference. IEEE1901, ITU-TG.hn, CELELEC, and Home Plug AV are some of the PLC standards that are currently in use [70]. The cables of any power network are made to transport electricity at a high-power low-frequency signal frequency of 50 Hz to 60 Hz. Power lines become electromagnetically leaky as a result of the injection of a low-power high-frequency PLC carrier signal, radiating an electromagnetic field into the environment. This field’s radiation could interact with other systems, resulting in electromagnetic interference (EMI). To accomplish EMC between contact systems and PLC systems, the electromagnetic field generated by the PLC system should not exceed such limits. EMC is thus defined as a PLC system’s capacity to cohabit with other systems in the same environment without impairing either system’s functionality or vice versa. A system must be able to perform adequately in its environment and not interfere with or cause intolerable electromagnetic disruptions to other systems in the same environment, including its own in order to meet EMC standards [25,70].
5. Track for Future Work
After an exhaustive review of the literature on PLC and suggestions for future developments, several studies coupled with recent evidence revealed that indoor PLC noise measurement has been studied to an extent. A careful study of the literature reveals that more research needs to be carried out on noise measurement, characterization, and modeling. It is necessary to have appropriate models that can accurately describe how data is transmitted through a channel. The electrical power line channel is not intended for high-speed data transmission, as was already established. As a result, modeling the channel is very challenging, and is one of the main technical obstacles for power line measurements and modeling. Previous research findings and methods used have been inconsistent. Several studies show that significant differences do exist, despite the fact that the findings are somewhat contradictory. While PLC channels have been studied in a variety of ways in several nations throughout the world, the characteristics and model(s) developed in one country cannot be applied to others [14]. This may be due to the diverse environments under investigation, which include volatile noise sources, differences in electrical grid structure from country to country, topology, and unknown power cable characteristics. So, it is necessary to do deep research and reach a clear understanding of noise measurement, characterization, and modeling, which is very essential for indoor power line communication. Our research findings point in this direction. However, the main focus is to measure indoor broadband power line noise in the time domain using an oscilloscope, and the parameters to be considered include amplitude, impulse width, inter-arrival time, durations of occurrence, standard deviation, mean, impulse noise voltage, voltage level, background noise, and power spectral density, etc. In addition, broadband noise will be measured in the frequency domain using a spectrum analyzer, and the parameters to be considered are the noise power at different frequencies, noise amplitudes at different frequencies, and mean and standard deviation of the noise power. Hence, the Alpha stable distribution of the noise, and analysis of the properties of noise in terms of its cumulative and probability distribution functions will be considered. Our main focus is on measuring and modeling power line noise in the time and frequency domains for the typical Broadband PLC, which has a bandwidth of 1–30 MHz. This model was utilized to assess how various modulation techniques fared when PL noise was present. The indexes of the lines are irrelevant in several studies on MIMO PLC. As a result, we have expanded our research to include spatial modulation-MIMO, where the line provides an advantage because it allows us to transmit more data by using the transmit power lines’ index. Finally, statistical data obtained from our measurements will be used to model the noise in both the time and frequency domains. The work will provide a ‘MODEL’ for the noise in indoor PLC. This research shall be worthy of attention because it will benefit engineers and advance the adoption of the ‘MODEL ‘in indoor PLC.
5.1. Methodology
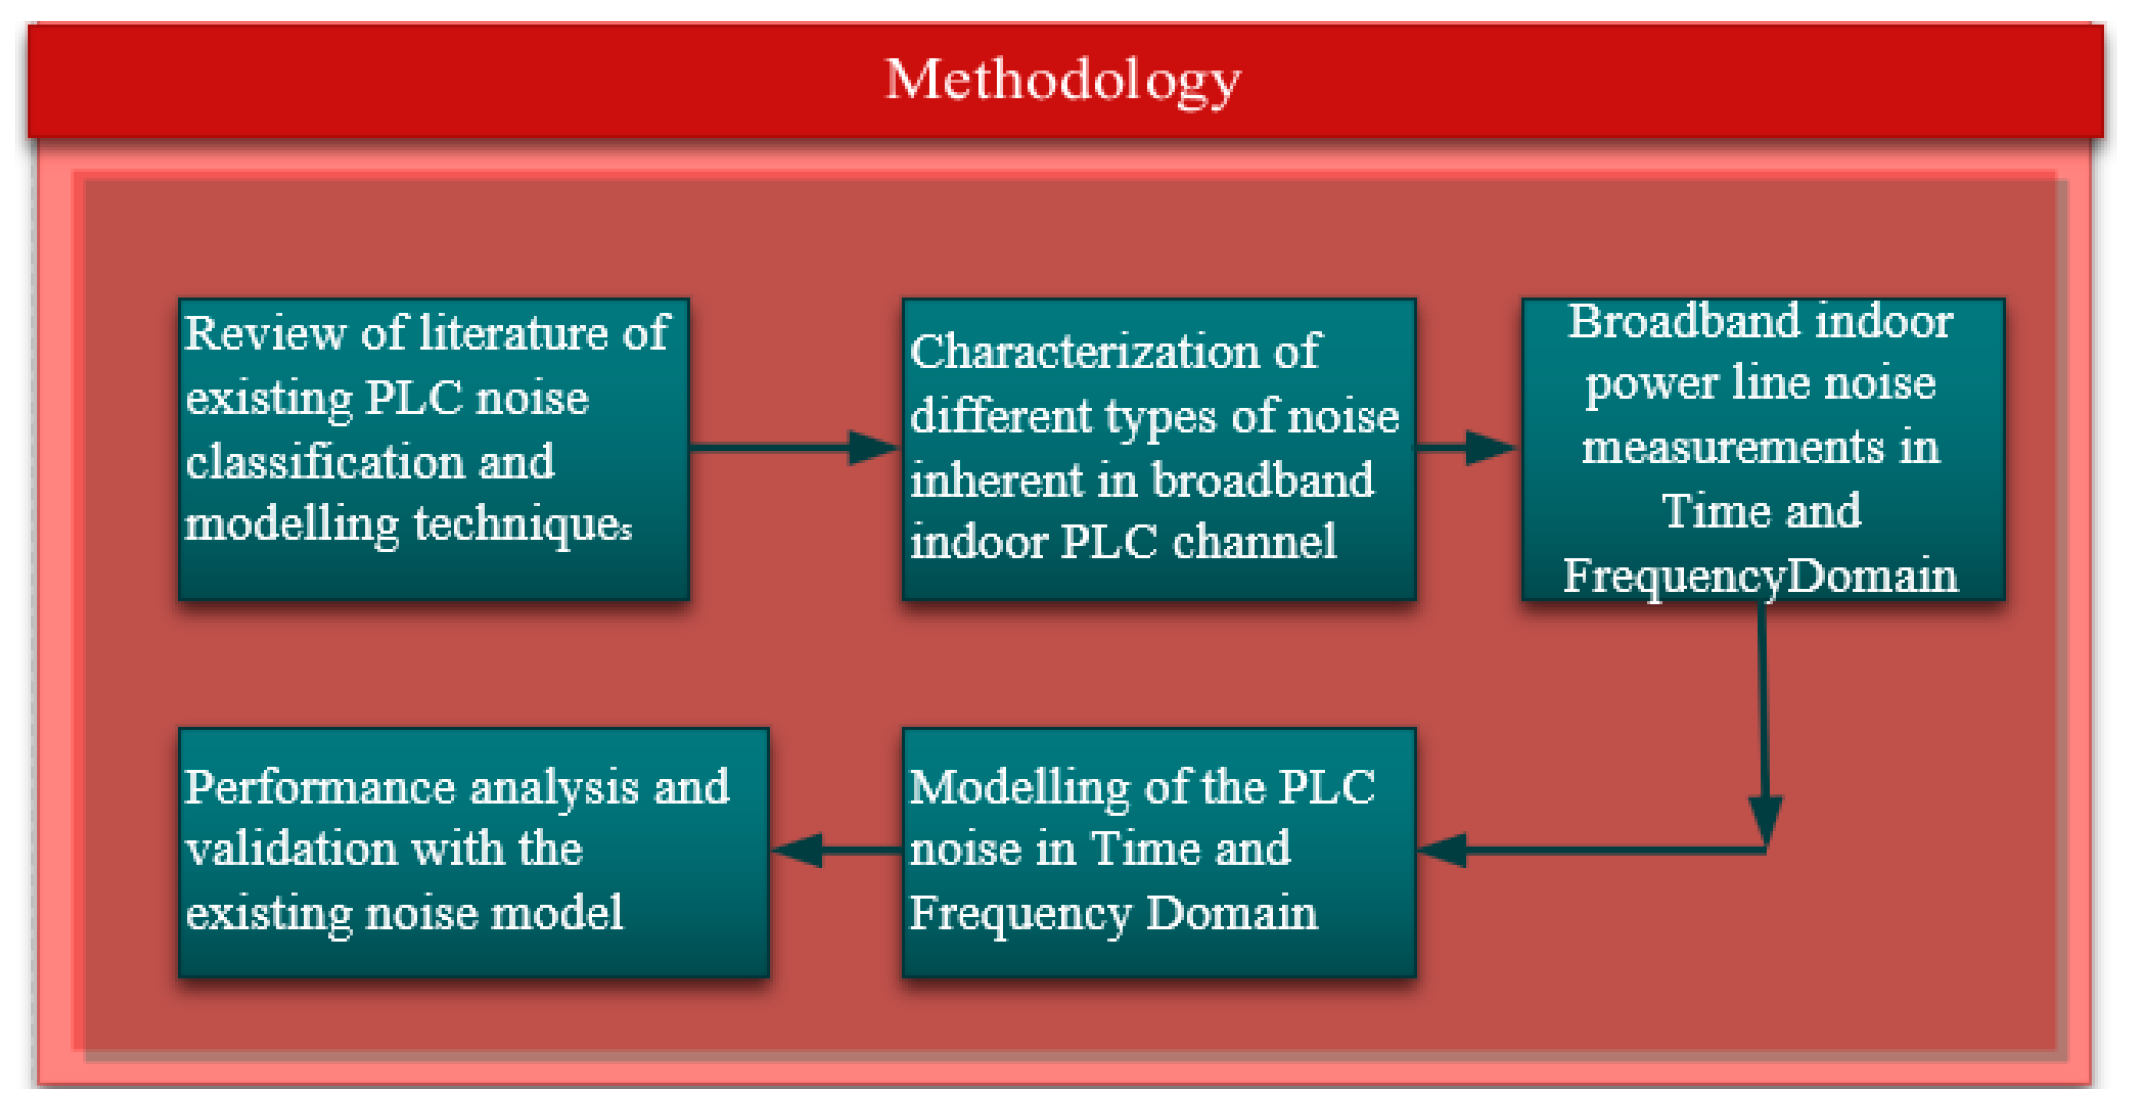
Both frequency and time domain measurements of PLC noise from broadband indoor power line channels are required. The spectrum analyzer measuring device, the coupler, and the digital storage oscilloscope, along with the peripherals such as connections and power line networks, shall be utilized for measurement. In Figure 2, the methodological approach for estimating, characterizing, and modeling noise is shown.

Figure 2.
Methodological approach.
An oscilloscope, coupling circuit, and spectrum analyzer will all be used in a thorough low-voltage noise measurement campaign. Where the measuring setup is connected in homes and offices, several classes of loads (resistive, capacitive, and inductive loads) must be connected to the same multi-socket. This means that noise measurements must be made in environments such as homes and offices with various loads and locations. A thorough low-voltage noise measurement campaign shall be carried out in different buildings at the Electrical and Computer Engineering Department, Afe Babalola University Ado Ekiti, Nigeria. The National Instruments Academy Data Acquisition Laboratory, Staff offices, Staff quarters, Electrical and Electronic Engineering laboratory, post-graduate offices, Computer hardware laboratory, Measurement and Instrumentation Laboratory, and Communication Networking laboratory are just a few of the locations that will be used for the measurements. These setups would make it easier to measure the network noise that an indoor broadband PLC might encounter when connected close to frequently used devices in homes and offices. The noise measurement must be done at random over the course of days to months, and hundreds of noise samples must be gathered from various measurements. The goal is to record various noise scenarios and develop a thorough understanding of the various noise sources in both residential and commercial settings [71]. The loads that are needed to be measured are listed in Table 2 and these loads are resistive, capacitive, and inductive in nature.
Table 2.
Classes of loads with indoor broadband noise.
5.2. Descriptions of Relevant Components
5.2.1. Steval PLC Coupler Description
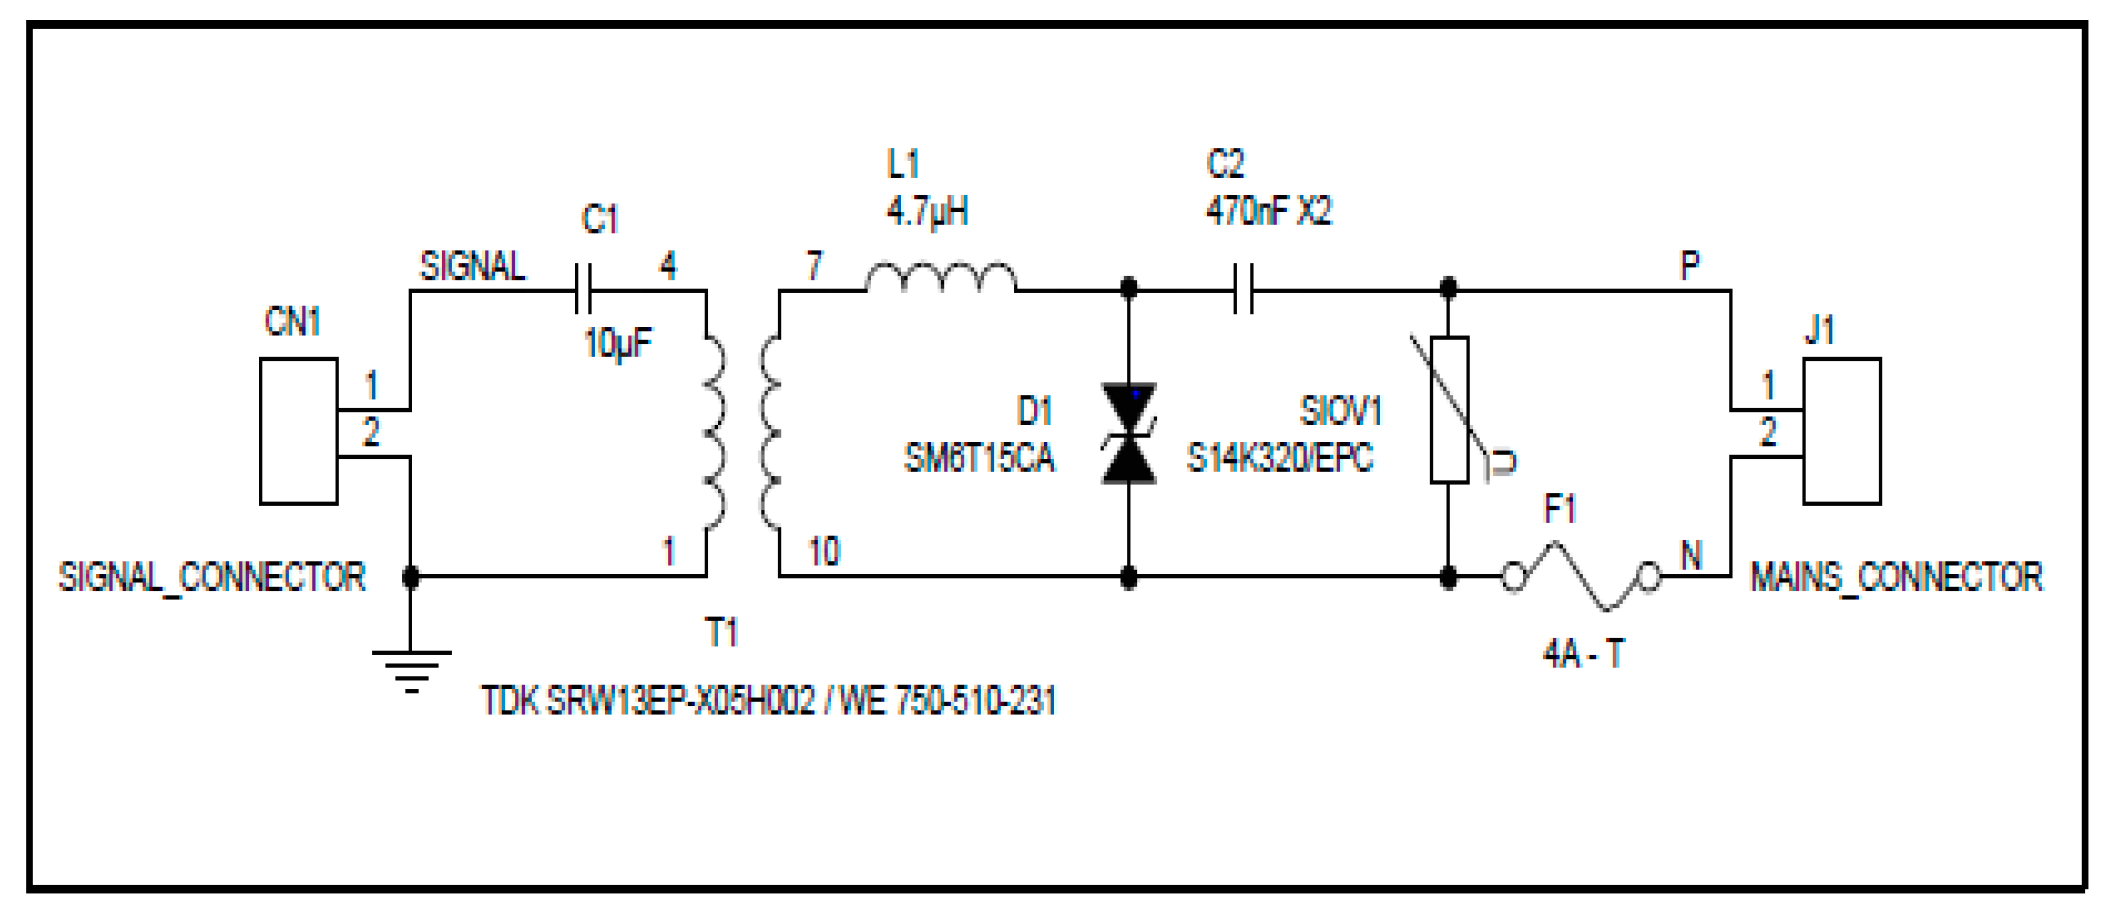
As indicated in Figure 3, a power line communication AC coupling circuit (Steval-XPLM01CPL) will be employed in this study. This is a copy of a coupler made and displayed in [72,73,74] and involves connecting one terminal to the neutral conductor and the other to the live conductor. The coupling circuit is a straightforward but extremely helpful device for testing PLC on AC power networks. It includes a common connector for an AC power cord and requires just two wires for communication with any PLC transmitter or receiver. Under typical test conditions, the coupling circuit’s frequency response is wide enough to accommodate narrowband PLC signals, but by altering merely the tuning series inductor L1, it can be quickly changed. The Steval-XPLM01CPL is appropriate for laboratory measurements utilizing tools like an isolated oscilloscope probe, a spectrum analyzer, or injecting a signal from an arbitrary function generator [12,15], unlike the PLC couplers constructed and presented in [12,15,71]. This indicates that the noise is picked up from the coupling unit’s (1–30 MHz) frequency range cut-off frequency. This coupler demonstrated transfer qualities with flat responses in the frequency region of 1–30 MHz This is the frequency band that is of particular interest for indoor PLC communications systems [6].
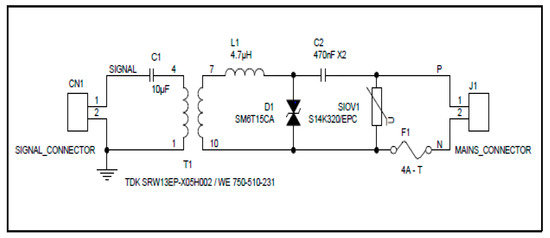
Figure 3.
Steval PLC Coupling Circuit.
The Steval-XPLM01CPL coupler has the following functions: The PLC channel and the measurement devices are interfaced with the coupling circuit. This acts as a point of entry for the electrical power supply network, into which the low-voltage high-frequency data signal is injected, and out of which, it is extracted. Galvanic isolation between the power supply and the measurement equipment is made possible by the broadband coupling circuit in addition to making it easier to receive noise signals clearly. By obstructing the 50 Hz frequency signal from the mains electrical power supply network, the coupler is also utilized to disconnect the measurement apparatus from the AC mains. To ensure the safety of the employees and the equipment, the coupler is utilized to isolate the measurement device from the mains high-voltage electrical power supply network [12,15].
5.2.2. Digital Storage Oscilloscope Description
This study will employ the GDS-1051-U- digital storage oscilloscope (DSO), as indicated in Figure 4. An electrical signal is shown as a graph on the oscilloscope, a graphing tool. Time is shown by the horizontal (X) axis, while voltage is represented by the vertical (Y) axis. This is to show how signals typically change over time in most applications. To measure power line noise in the time domain, the DSO is used in conjunction with a coupling circuit. A digital oscilloscope, unlike an analog oscilloscope, converts the measured voltage into digital data. The digital technique allows the oscilloscope to display any frequency that falls within its range with stability, brightness, and clarity. Transients are singular events that can be captured and displayed using DSOs. Since the waveform data is stored as a set of binary values in digital form, it can be analyzed, archived, printed, and otherwise processed inside the oscilloscope or by an external machine [6,12]. The waveforms are afterward saved as trace files on the external storage device (Flash drive) inserted into the oscilloscope, and MATLAB will be used to process and analyze them.
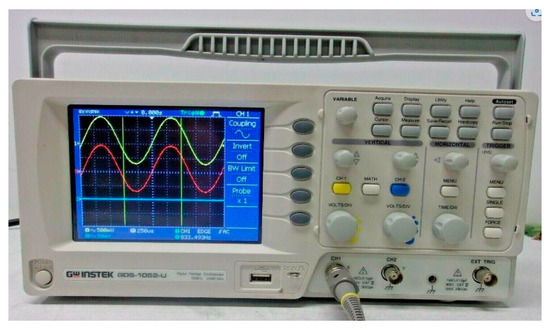
Figure 4.
GDS-1052 digital storage oscilloscope.
5.2.3. The GSP-930 Spectrum Analyzer Description
For this study, the GSP-930 Spectrum Analyzer (SA), as depicted in Figure 5, will be employed. The SA is a new-generation platform-based 3 GHz. The highly sensitive measuring foundation offered by GSP-930 has a very low noise floor of −142 dBm (Pre-amplifier on) and a high frequency stability of 25 ppb (0.025 ppm). The tracing of RF signal fluctuations over time is made easier by the combination of frequency domain and time domain information [12].
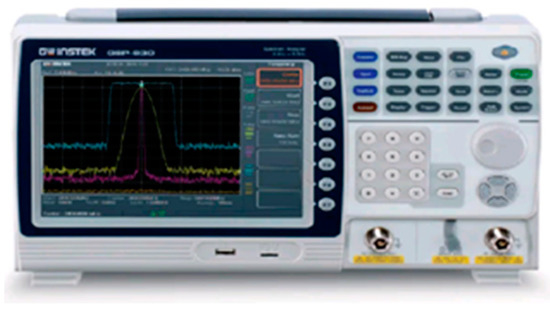
Figure 5.
GSP-930 Spectrum Analyzer.
The spectrum analyzer will be used to perform the frequency-domain measurements. With this, noise frequency responses in the frequency range of 1–30 MHz will be obtained. The following measurements can be made using the spectrum analyzer: It offers a high frequency stability of 25 ppb (0.025 ppm) and a highly sensitive measurement with a very low noise floor of 142 dBm. Several tools are available on the spectrum analyzer to set the sweep range. The analyzer analyzes the measured data in a series of steps to produce the display trace, which is then used to record and save the measured data on the external storage device (Flash drive). The mathematical processes required to create traces from the measured data are specified in the trace settings. Every trace is given a channel, which holds hardware-specific settings dictating how the spectrum analyzer gathered data. The analyzer’s universal serial bus (USB) connectors, which are intended to link external storage devices for additional processing and analysis outside of the analyzer, are utilized to retrieve the stored measurement data [12].
5.2.4. Coupling Circuit Set Up
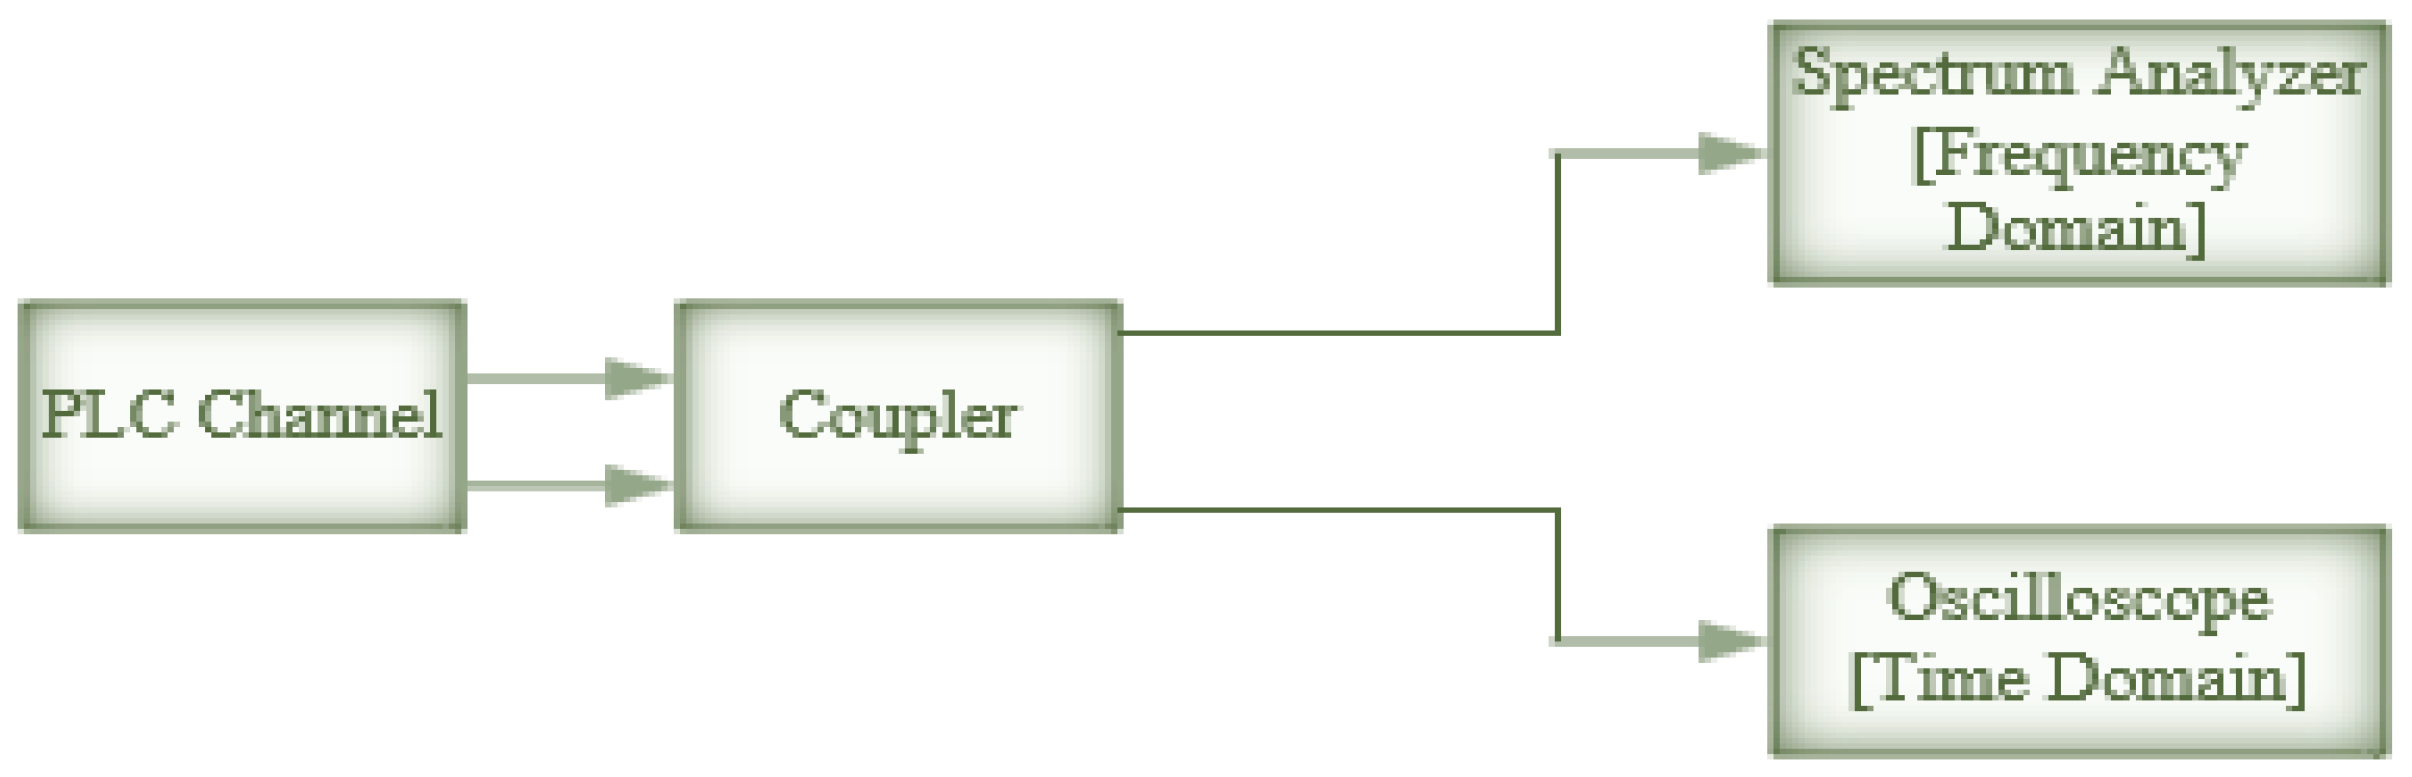
A ready-made coupling circuit will be used for the noise measurements. Figure 6 below displays the block diagram in detail [12].
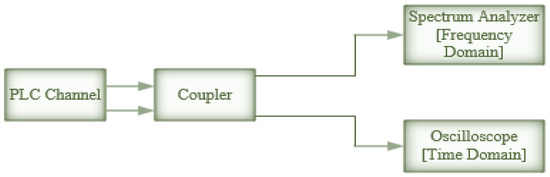
Figure 6.
Noise measurement block diagram.
The coupler is appropriate for laboratory experiments using tools like an isolated probe for an oscilloscope or spectrum analyzer or to inject a signal from an arbitrary function generator in the case of frequency-domain noise measurements. For the purpose of measuring time-domain noise, the coupler is linked to the GDS-10S1U digital storage oscilloscope (DSO). The labeled channel one and two RF inputs are linked to the BNC terminated coupler using BNC to N-connector adaptors to connect the oscilloscope to the coupler. Therefore, the coupler is connected to the electricity network using the socket outlets [12].
6. Preliminary Results and Discussion
In an indoor PLC, we can specifically categorize the noise measurements into frequency domain and time domain measurements. In this study, the spectrum analyzer GSP 930 was used to analyze noise in the frequency domain. This was done in order to obtain the noise frequency response in the range of 3–30 MHz. The measurement was done within a residence hall at Afe Babalola University, Nigeria. In order to depict the noise, a waveform representation of the preliminary results of an intense noise measurement was obtained. Furthermore, measurements were done to determine the noise amplitude. In addition, a frequency range from 3 to 30 MHz has noise power values that are determined. A limited number of the findings are displayed as shown in Table 3 and Table 4 due to space limitations.
Table 3.
Electric Iron frequency domain noise amplitude and power.
Table 4.
Electric Kettle frequency domain noise amplitude and power.
The noise amplitude and noise power for both the electric iron and the electric kettle are depicted in Table 3 and Table 4. Utilizing the max-hold capability of the measuring device, the experiment was carried out using a spectrum analyzer with span intervals of 3 and a 1–30 MHz frequency band lasting about 3 s. The resolution bandwidth of the spectrum analyzer was 1 kHz. We utilized decibels, the unit of measurement employed by the instrument with that resolution, to represent noise amplitude levels in all of our graphs. Each frequency has a different reference amplitude, which changes appropriately [28,56,75].The waveforms were afterward saved as trace files on the spectrum analyzer, and MATLAB was used to process and analyze them. Electric kettles and irons are two examples of indoor electrical appliances that are connected to wall outlets. Equation (23) is used to calculate noise power levels over a frequency range of 3 to 30 M Hz.
stands for noise power.
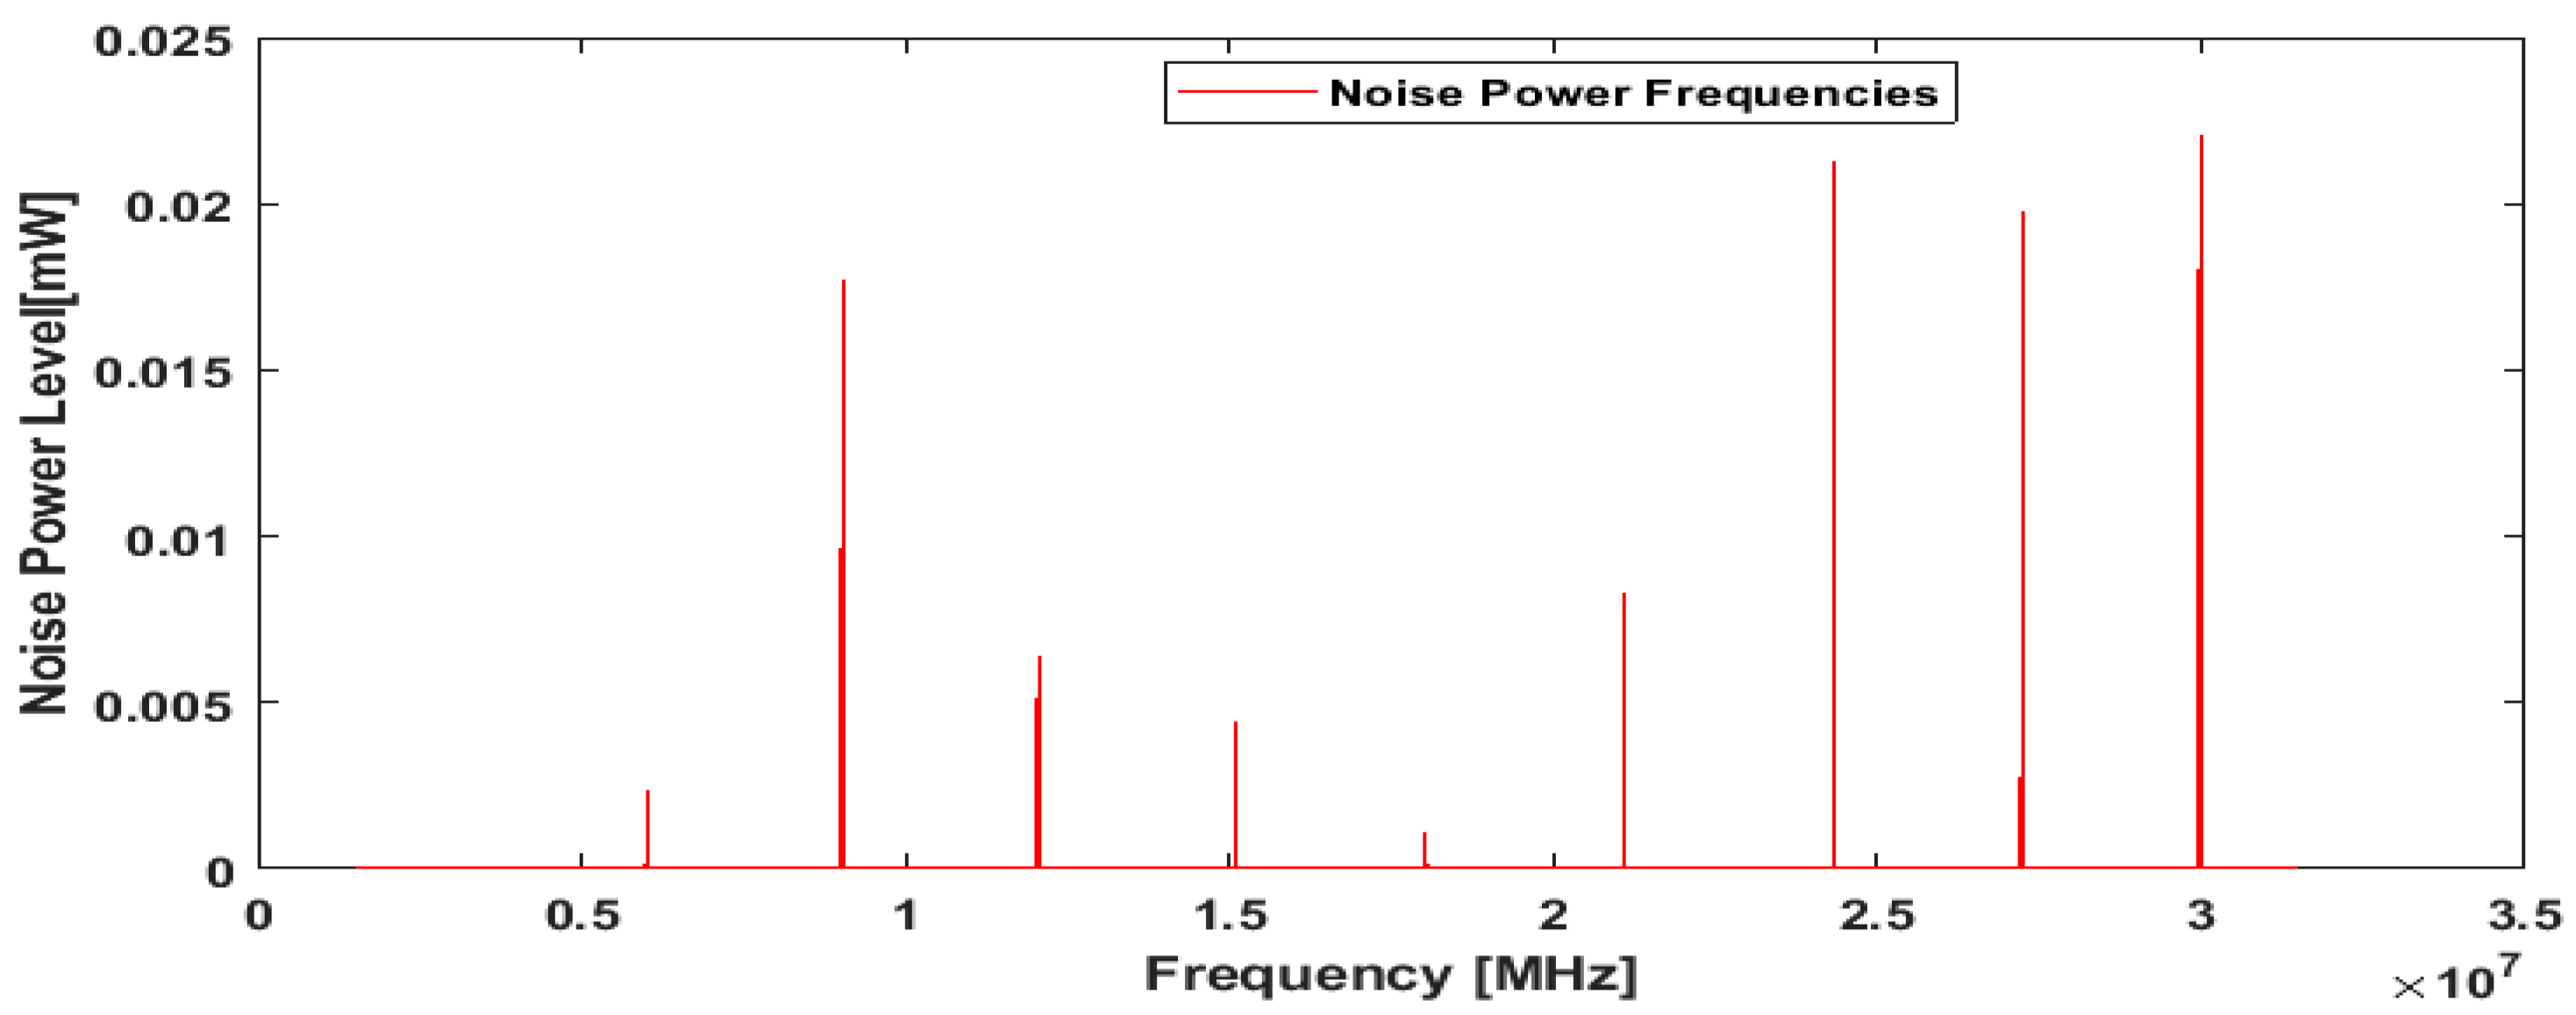
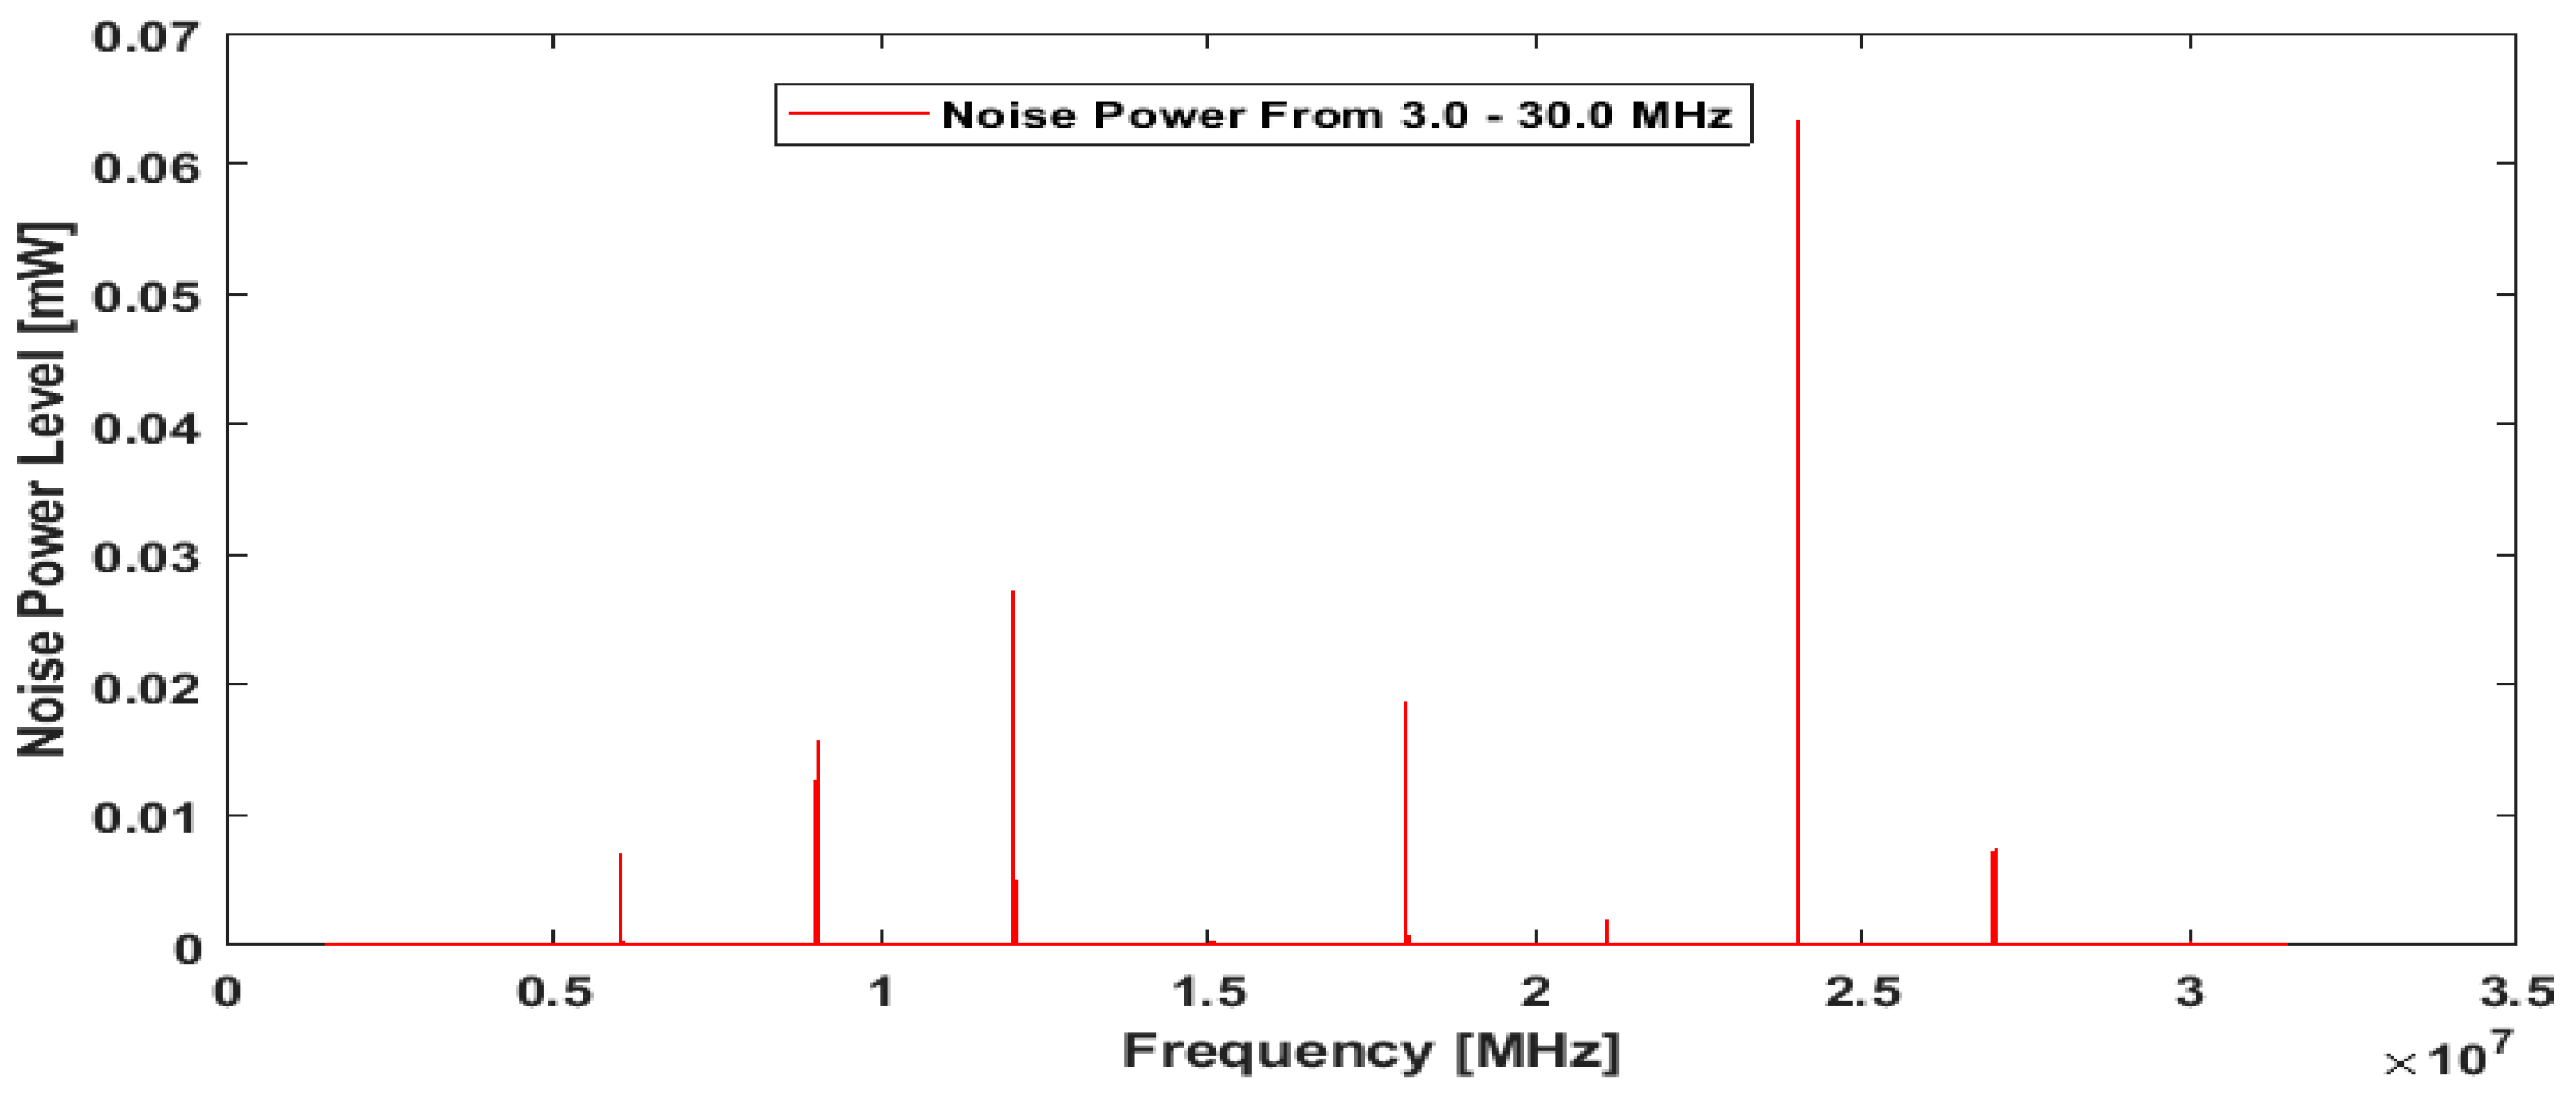
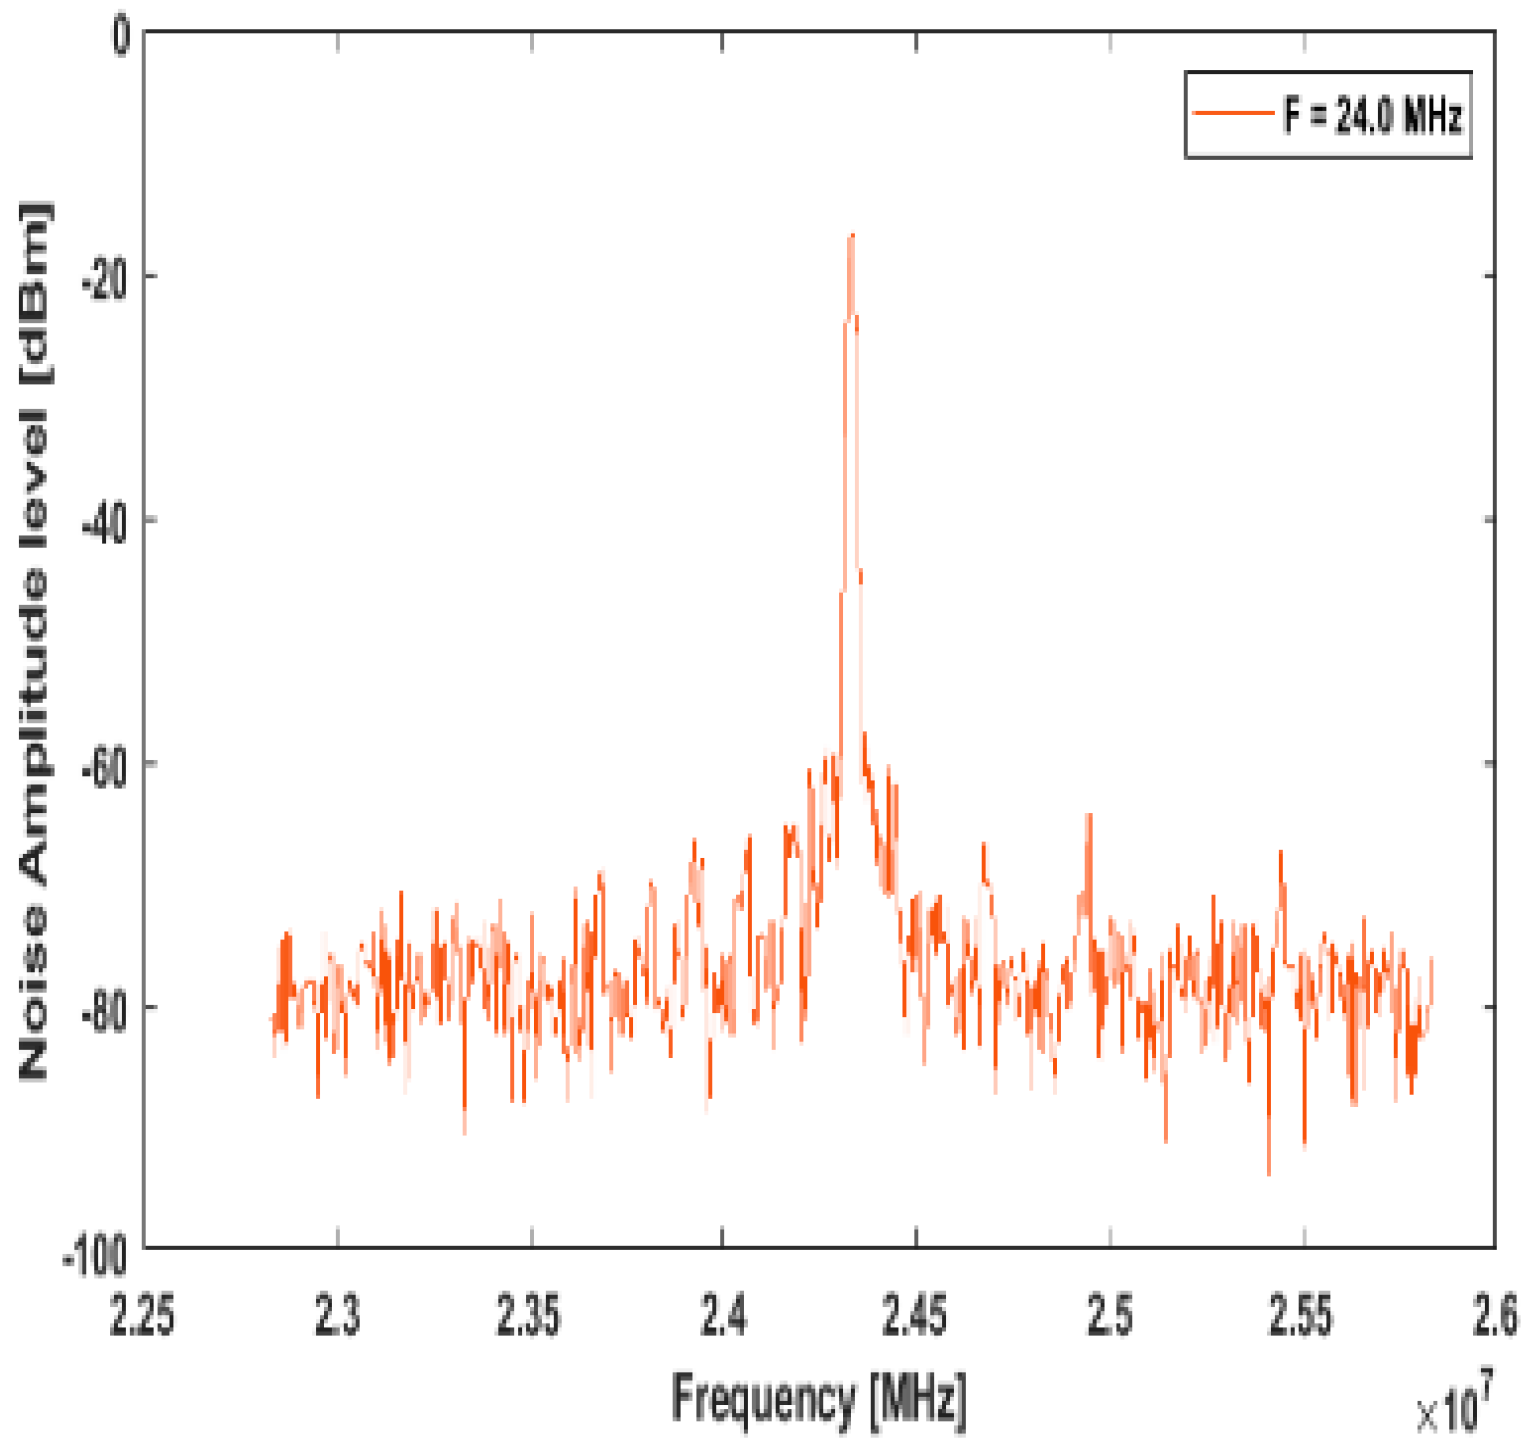
Figure 7 and Figure 8 show the waveforms and corresponding noise power for the frequency range of 3–30 MHz. Figure 7 illustrates the findings, which show that noise power is significantly higher at frequencies above 21 MHz than it is at frequencies below that range. For frequencies below 21 MHz, Figure 8 displays the low-noise power level behavior. At the 24 MHz frequency band, the electric kettle introduced more noise into the power line network.
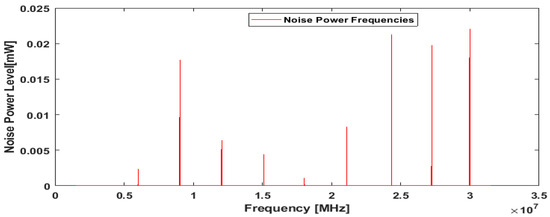
Figure 7.
Electric Iron observed noise power from 3 MHz to 30 MHz.
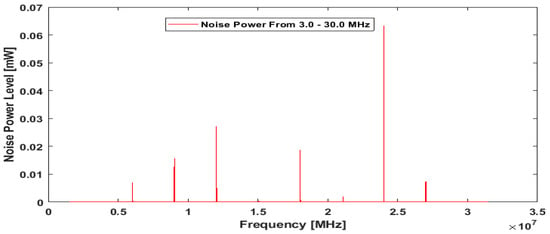
Figure 8.
Electric Kettle observed noise power from 3 MHz to 30 MHz.
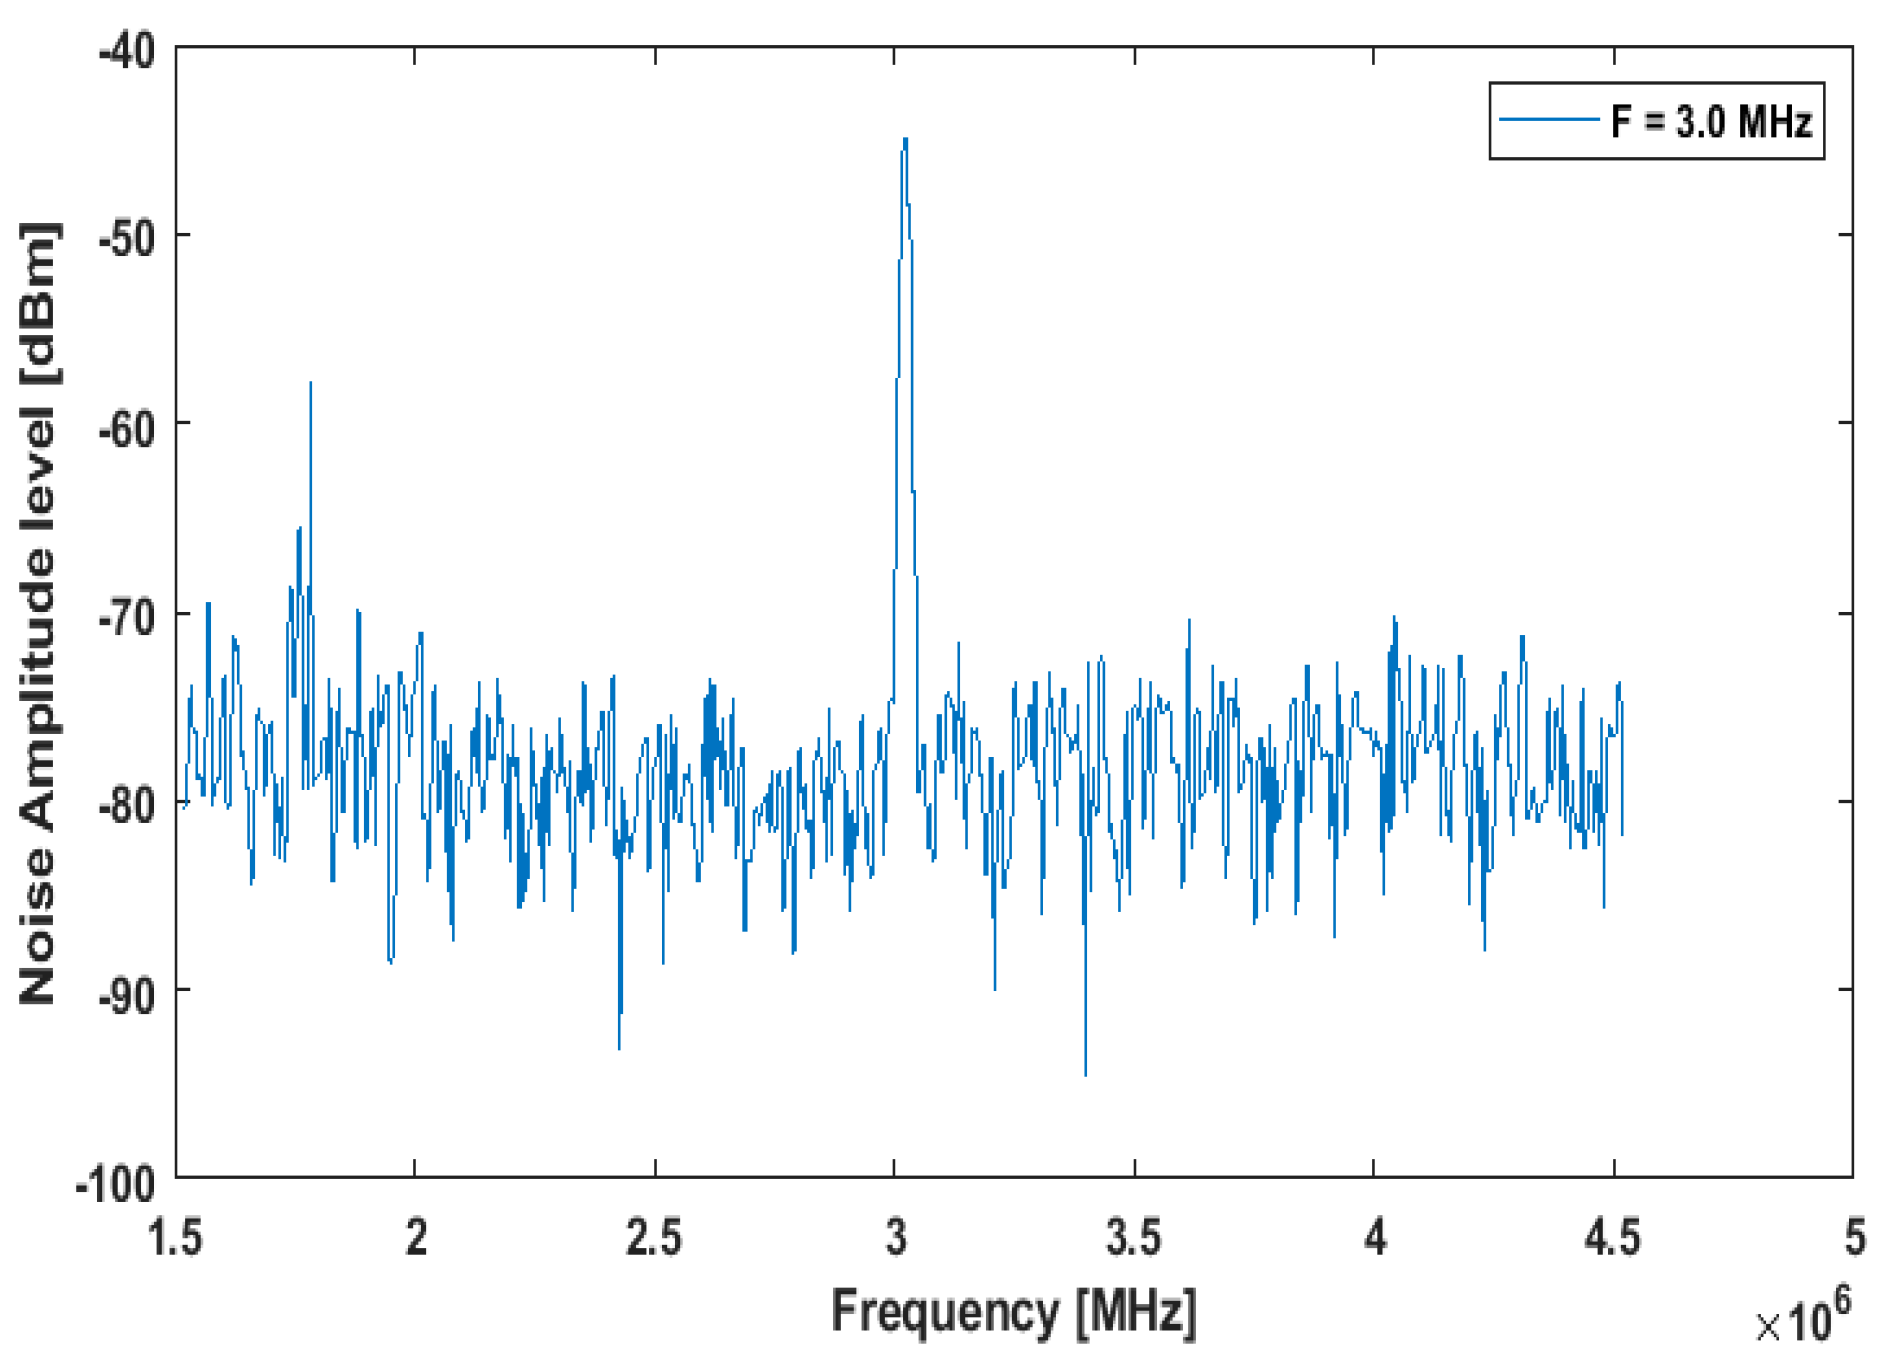
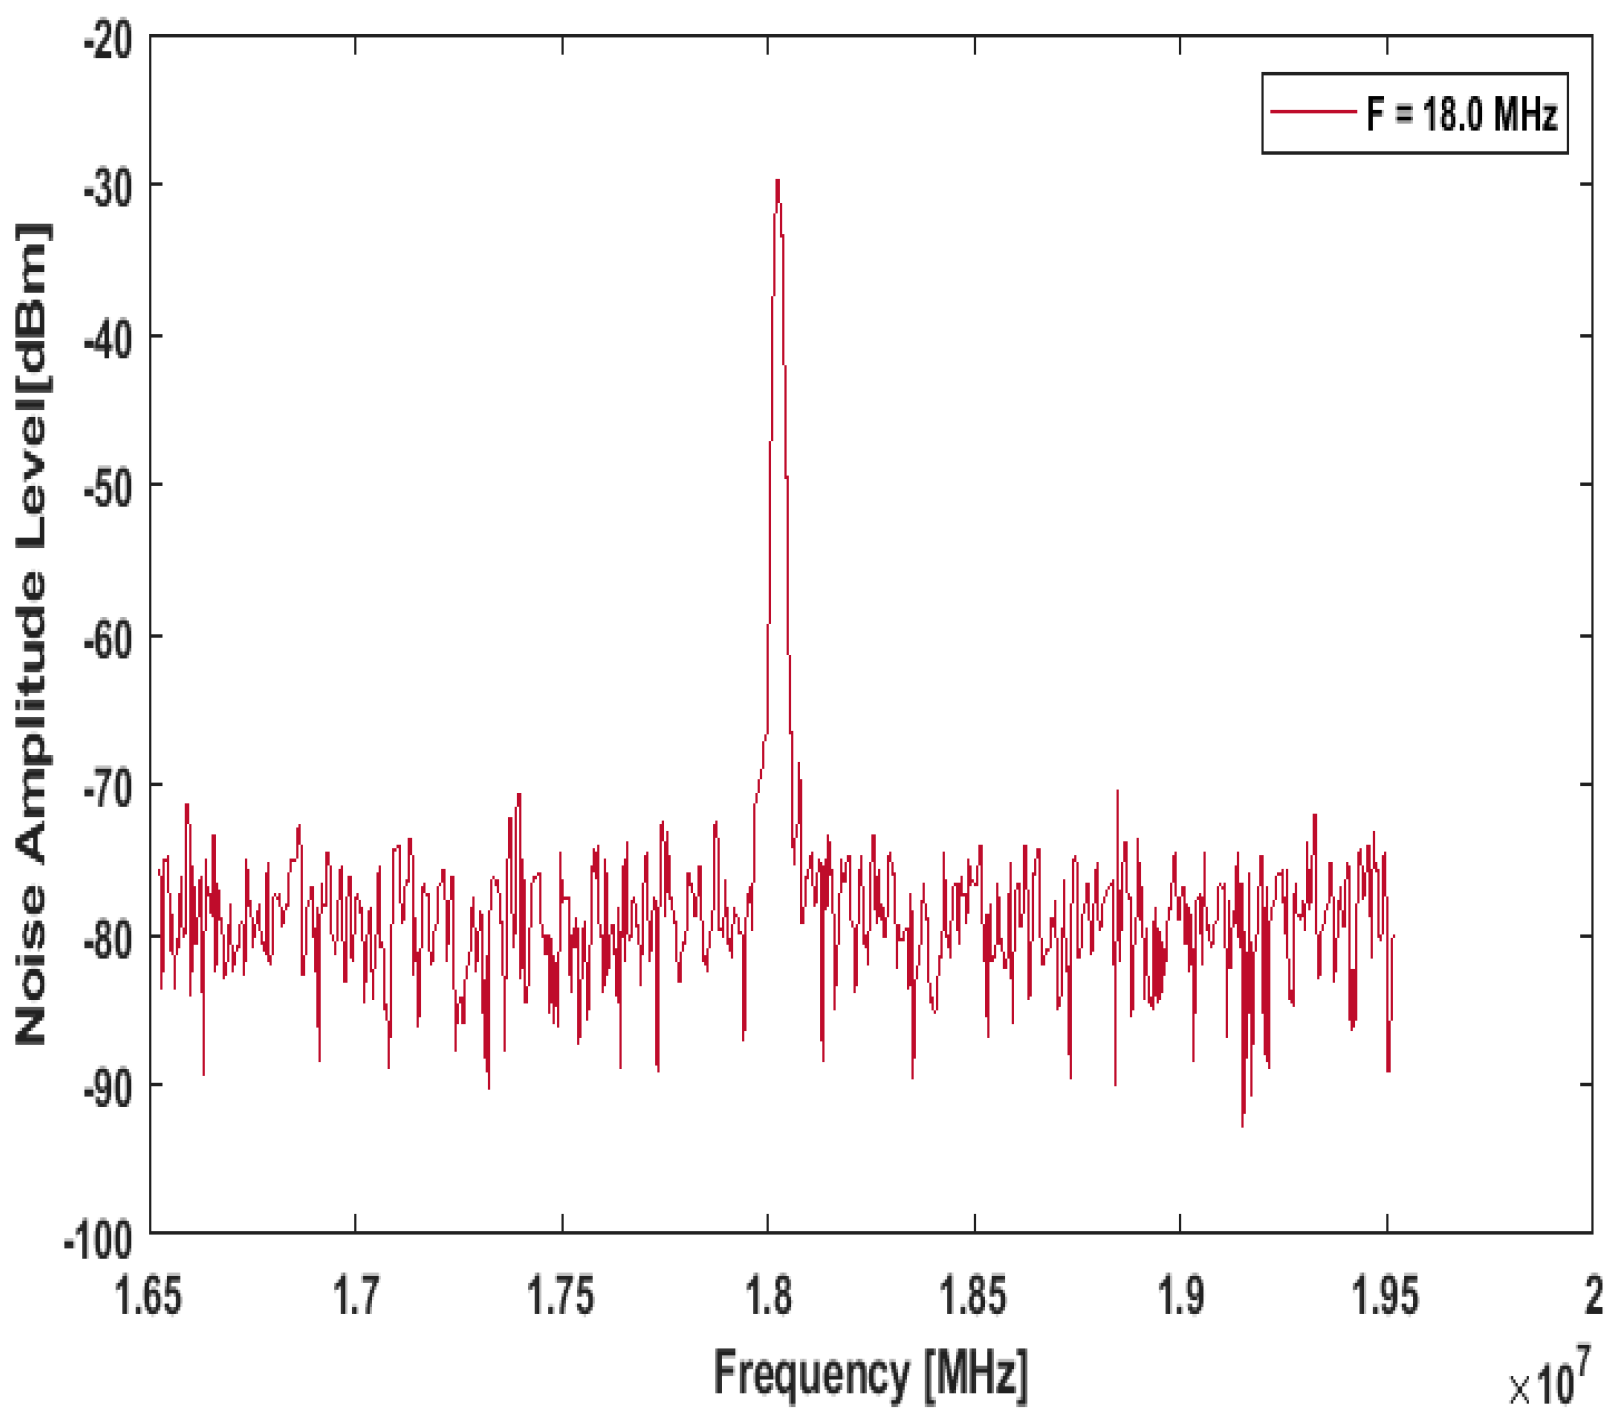
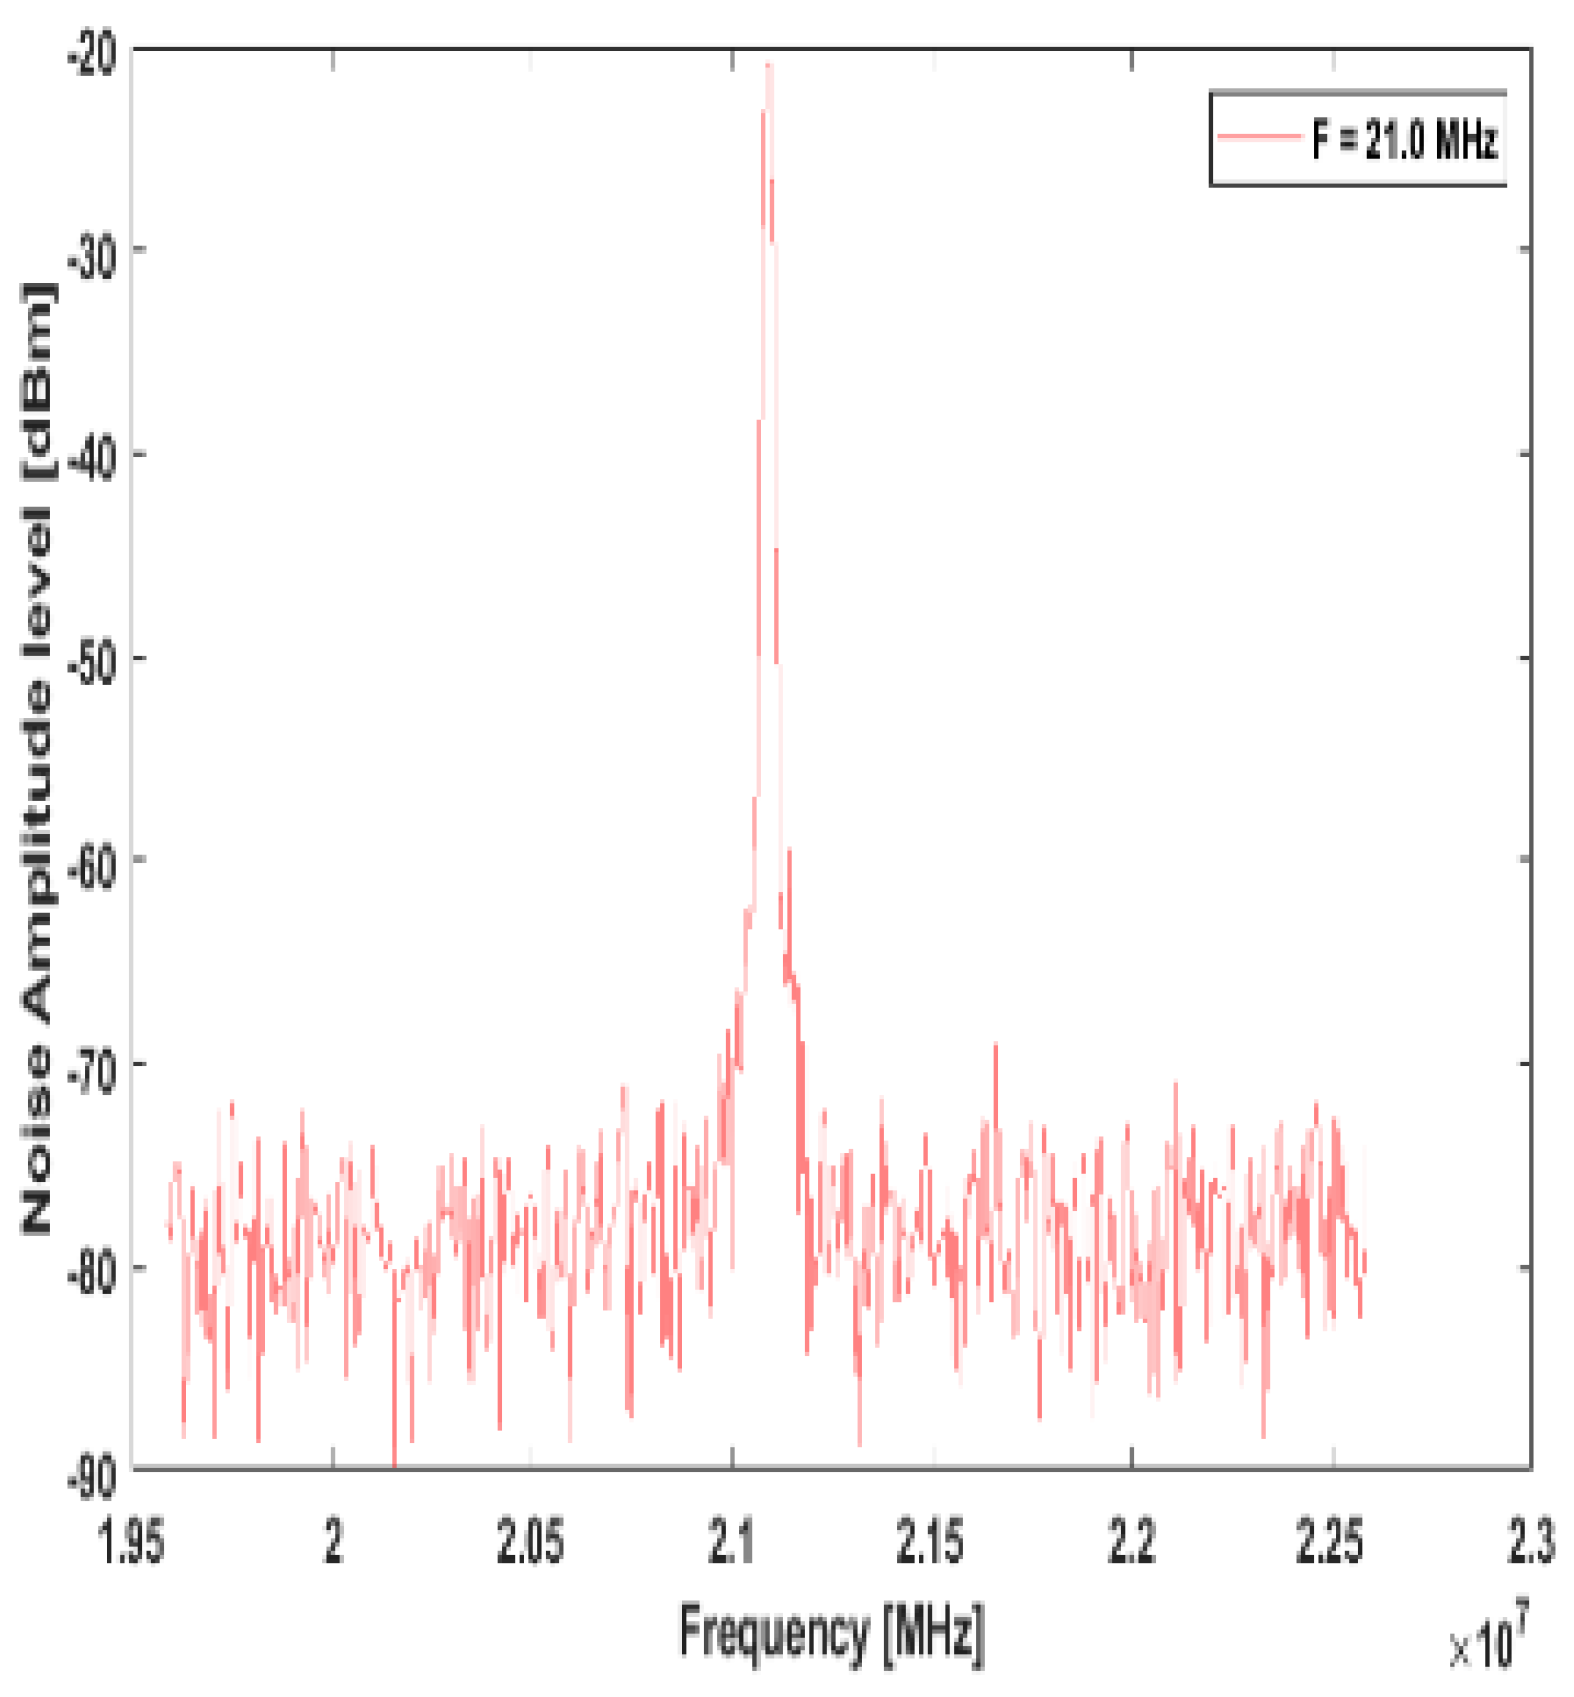
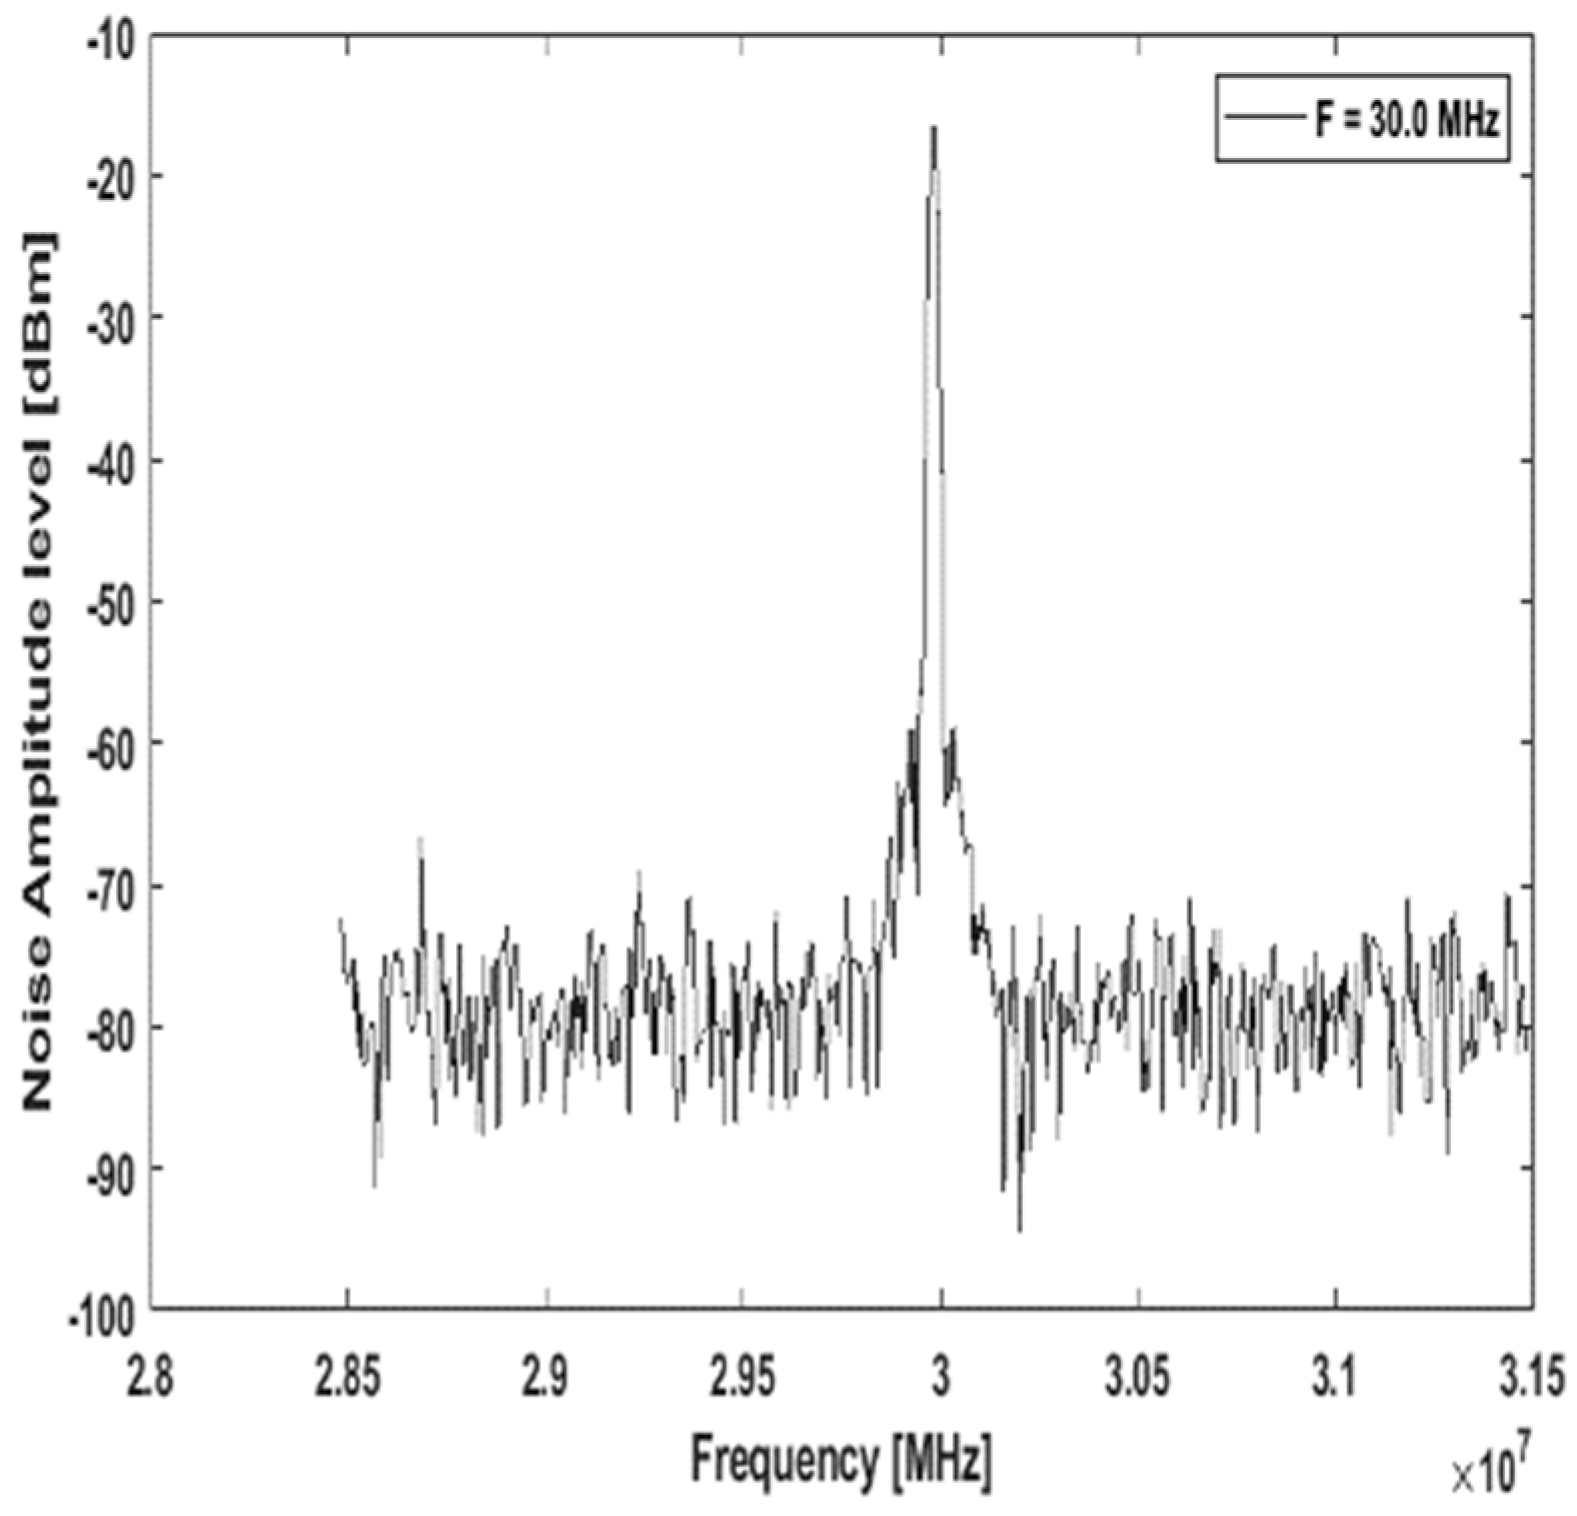
Similar behaviors can be seen in Figure 9, Figure 10, Figure 11, Figure 12, Figure 13, Figure 14, Figure 15, Figure 16, Figure 17 and Figure 18, where noise introduced into the power line network by the electric iron diminishes below 3 MHz and increases above that frequency, showing that greater pollution was seen coming from the power line network connected to this item, which is a major contributor to transmission error. For the electric iron, the noise amplitude signal steadily decreased to very low levels of −47 dBm at frequencies below 3 MHz. When the frequency is increased from 9 MHz to 30 MHz, the noise amplitude rapidly rises between −30 dB and −21 dB. This suggests that at frequencies within this range, the PLC channel’s attenuating effects on the transmitted signal become less severe and rapidly diminish.
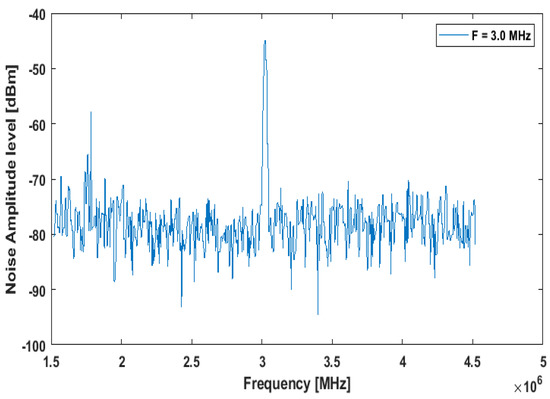
Figure 9.
Waveform at 3 MHz.
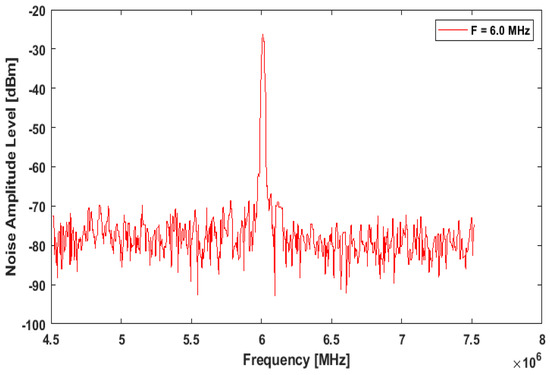
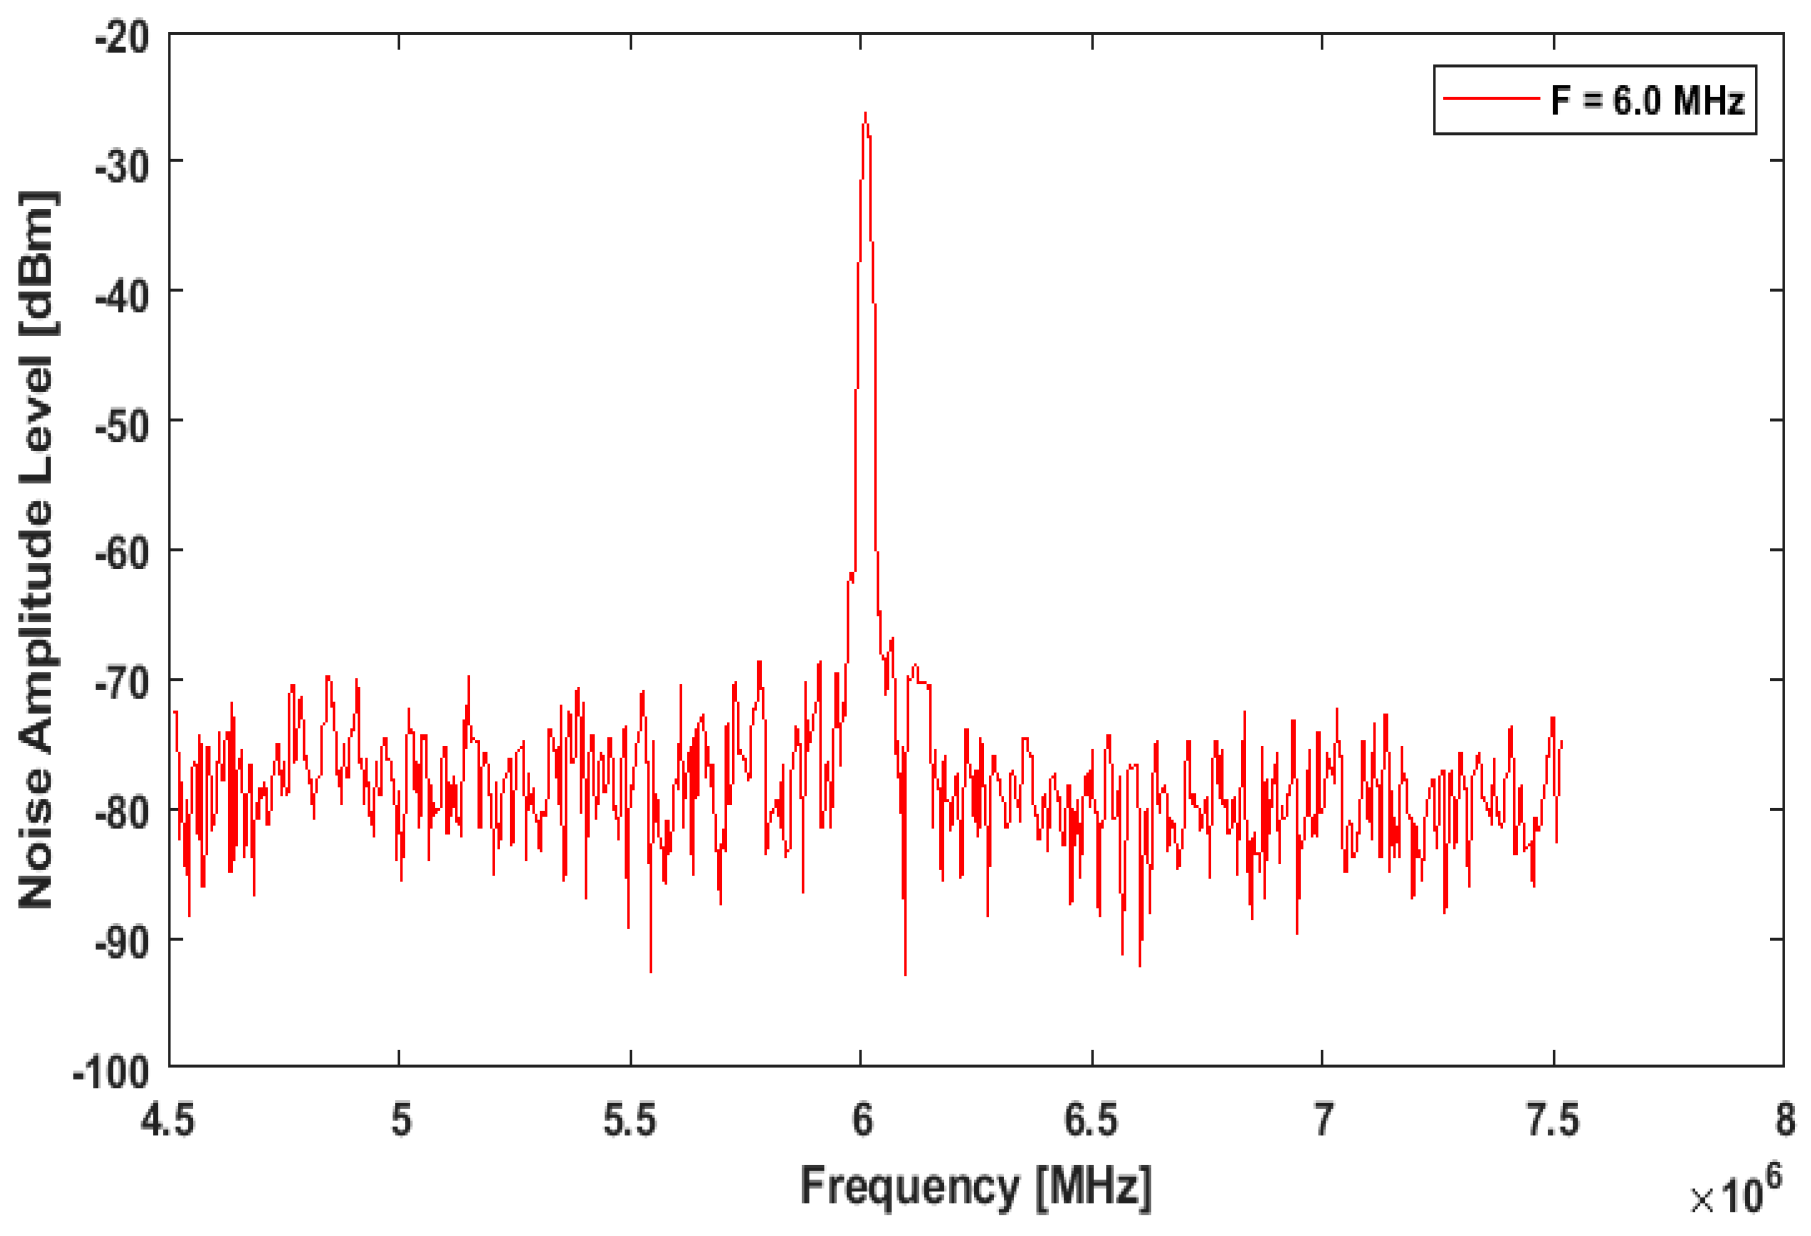
Figure 10.
Waveform at 6 MHz.
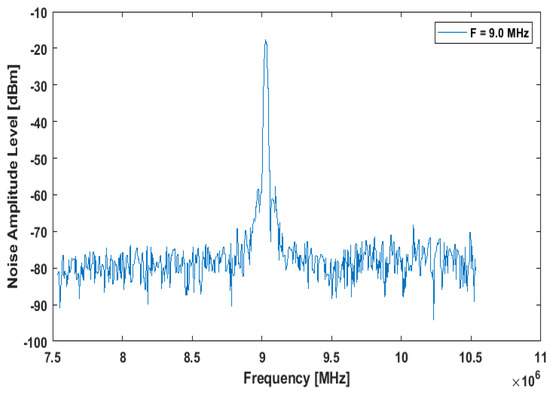
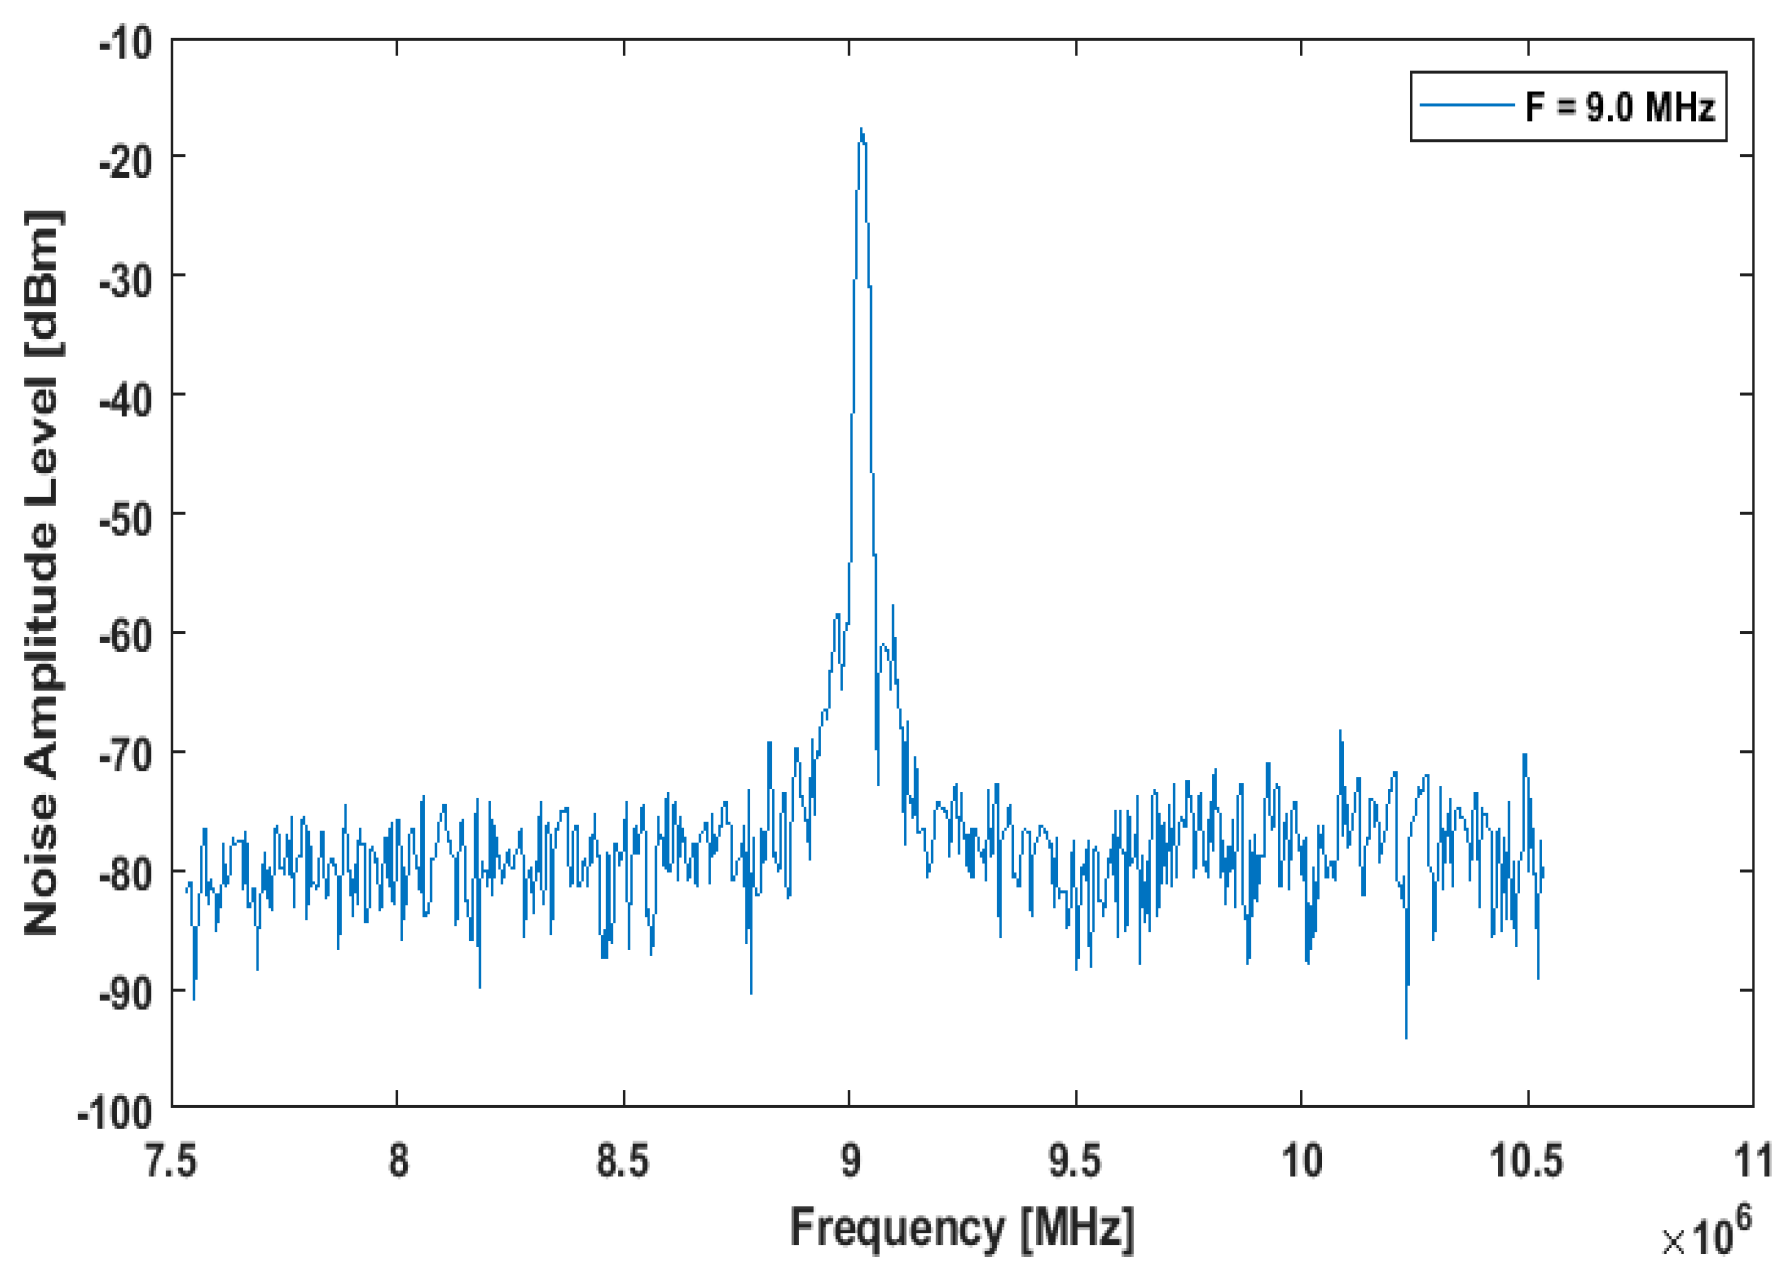
Figure 11.
Waveform at 9 MHz.
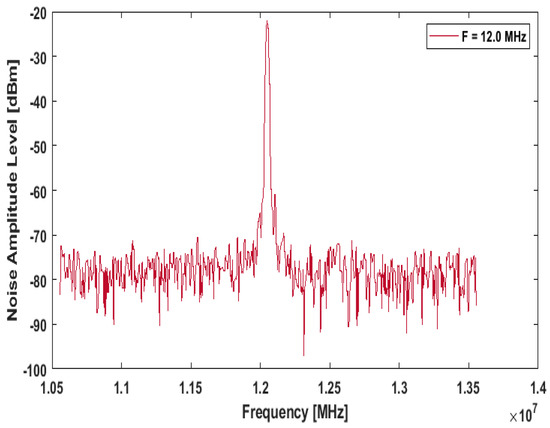
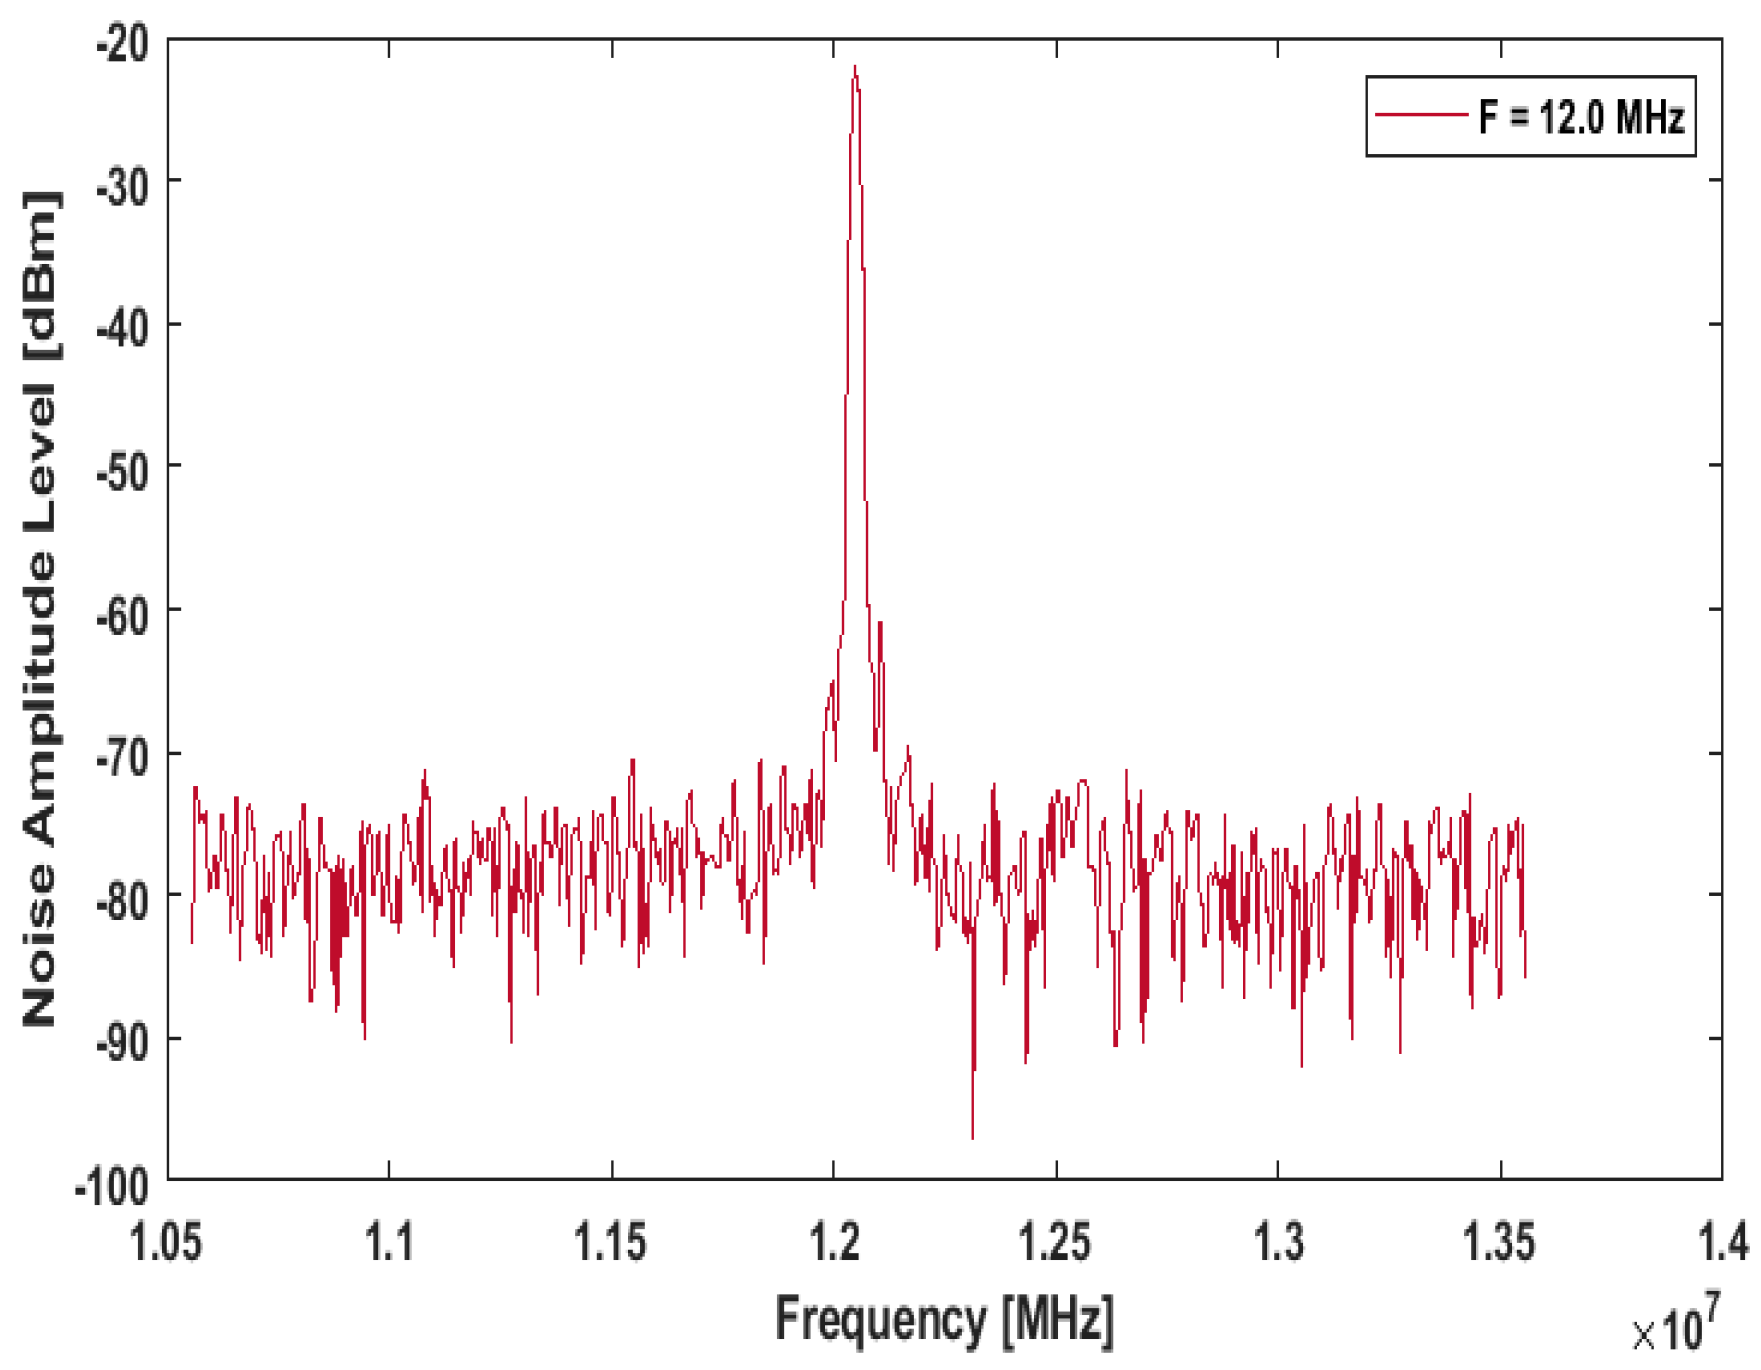
Figure 12.
Waveform at 12 MHz.
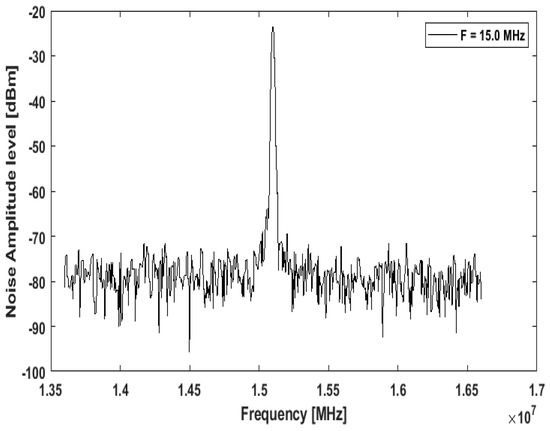
Figure 13.
Waveform at 15 MHz.
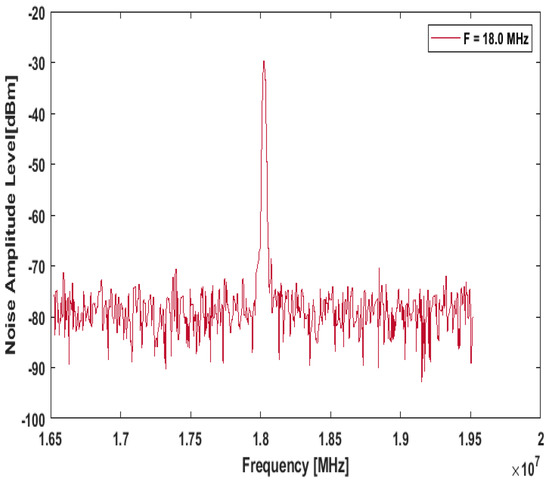
Figure 14.
Waveform at 18 MHz.

Figure 15.
Waveform at 21 MHz.

Figure 16.
Waveform at 24 MHz.
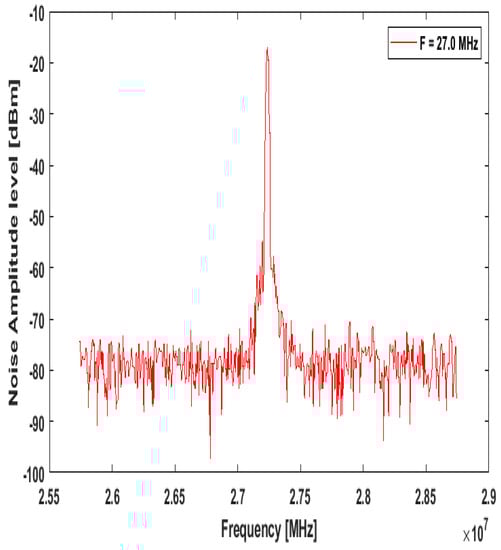
Figure 17.
Waveform at 27 MHz.
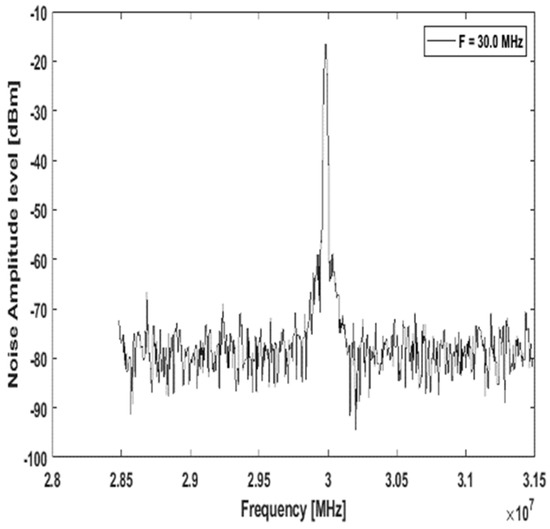
Figure 18.
Waveform at 30 MHz.
7. Conclusions
In the literature, there are a number of measurement and modeling techniques for power line noise, which are briefly covered in this paper. An in-depth analysis of the approaches for measuring, characterizing, and modeling noise, as well as the descriptions of relevant components to be used, and the environment needed to carry out the measurements, was presented. Even though PLC Noise has been studied using various methods in many different countries around the world, the traits and model(s) developed in one country cannot be used in another. Several studies show that significant differences exist, which may be attributed to the diverse environments under investigation. This paper determined that it is crucial to conduct a thorough study and have a comprehensive understanding of noise measurement, and modeling for indoor broadband communication systems. Our research findings point in this direction. The paper also suggests that, in the very near future, the measurement can be extended to access power line technology that makes use of medium and low voltages for transferring data across the power network. Finally, the statistical data obtained from our proposed future measurement campaign will be used to characterize and model the indoor broadband PLC noise. The research will be helpful for engineers in the deployment of PLC in Nigeria.
Author Contributions
Conceptualization, M.A.O. and S.L.G.; methodology, M.A.O.; software, M.A.O.; validation, M.A.O., S.L.G. and N.I.N.; formal analysis, M.A.O.; investigation, M.A.O.; resources, M.A.O.; data curation, M.A.O.; writing—original draft preparation, M.A.O.; writing—review and editing, M.A.O., S.L.G. and N.I.N.; visualization, M.A.O.; supervision, S.L.G., I.E.O. and N.I.N.; project administration, S.L.G. and N.I.N.; funding acquisition, S.L.G. All authors have read and agreed to the published version of the manuscript.
Funding
This research received no external funding.
Conflicts of Interest
The authors declare no conflict of interest.
References
- Oluwafemi, I.B.; Mneney, S.H. Improved Super-Orthogonal Space-time Trellis Coded MIMO-OFDM System. IETE J. Res. 2013, 59, 665–666. [Google Scholar] [CrossRef]
- Shukla, M.; Sharma, N.; Dwivedi, J.K. Power Line Communication: A Survey. In Proceedings of the International Conference On Recent Trends in Engineering, Technology & Management, Kochi, India, 10 March 2011; p. 499. [Google Scholar]
- Varma, M.K.; Jaffery, Z.A. Ibraheem Broadband power line communication: The channel and noise analysis for a power line network. Int. J. Comput. Netw. Commun. (IJCNC) 2019, 11, 85–92. [Google Scholar] [CrossRef]
- Shrotriya, A.; Saxena, D.K.; Singh, M.K. Noise in Power Line Communication Channel: An Overview. Int. J. Eng. Res. Dev. 2013, 9, 1–5. [Google Scholar]
- Esmailian, T.; Gulak, P.G.; Kschischang, F.R. A discrete multitone power line communications system. In Proceedings of the ICASSP, IEEE International Conference on Acoustics, Speech, and Signal Processing, Istanbul, Turkey, 5–9 June 2000; Volume 5, pp. 2953–2956. [Google Scholar] [CrossRef]
- Han Vinck, A.J.; Lindell, G. Summary of Contributions at ISPLC 1997–2001. In Proceedings of the 5th International Symposium on Power-Line Communications and Applications, Malmö, Sweden, 4 April 2001; pp. 383–413. [Google Scholar]
- Varda, V. Indoor Distribution Network Noise In The PLC Frequency Range From 10MHz To 30MHz. In Proceedings of the Seventh IASTED International Conference Power and Energy Systems, Clearwater Beach, FL, USA, 28 November–1 December 2004; pp. 249–254. [Google Scholar]
- Ishak, N.; Din, N.M.; Jamaludin, M.Z.; Thayoob, Y.H.M. Power line carrier technology and home automation. In Proceedings of the 2002 Student Conference on Research and Development, Shah Alam, Malaysia, 16–17 July 2002; pp. 505–508. [Google Scholar] [CrossRef]
- Apaza-Mamani, V.; Zenteno-Bolaaos, E. High-Speed audio communications in domestic power line channels. In Proceedings of the 2017 IEEE 24th International Conference on Electronics, Electrical Engineering and Computing, INTERCON 2017, Cusco, Peru, 15–18 August 2017; pp. 27–30. [Google Scholar] [CrossRef]
- Di Bert, L.; Caldera, P.; Schwingshackl, D.; Tonello, A.M. On noise modeling for power line communications. In Proceedings of the 2011 IEEE International Symposium on Power Line Communications and Its Applications, Australia, ISPLC 2011, Udine, Italy, 3–6 April 2011; pp. 283–288. [Google Scholar] [CrossRef]
- Adegoke, O.M.; Oluwafemi, I.B. In-home power line frequency domain noise measurement and analysis for broadband communication. ARPN J. Eng. Appl. Sci. 2021, 16, 1825–1828. [Google Scholar]
- Adegoke, O.A.O.M.; Oluwafemi, I.B. A time domain noise measurement and analysis for broadband indoor power line communications. Instrum. Mes. Metrol. 2020, 19, 103–105. [Google Scholar] [CrossRef]
- Fertonani, D.; Colavolpe, G. Theoretical limits and practical detection schemes for channels affected by Class-A impulse noise. In Proceedings of the GLOBECOM—IEEE Global Telecommunications Conference, Washington, DC, USA, 26–30 November 2007; pp. 146–150. [Google Scholar] [CrossRef]
- Al-Mawali, K.; Sadik, A.Z.; Hussain, Z.M. Joint time-domain/frequency-domain impulsive noise reduction in OFDM-based power line communications. In Proceedings of the 2008 Australasian Telecommunication Networks and Applications Conference, Adelaide, SA, Australia, 7–10 December 2008; pp. 138–142. [Google Scholar] [CrossRef]
- Zimmermann, M.; Dostert, K. Analysis and modeling of impulsive noise in broad-band powerline communications. IEEE Trans. Electromagn. Compat. 2002, 44, 248–258. [Google Scholar] [CrossRef]
- Familua, A.D.; Cheng, L. Modeling of in-house CENELEC A-band PLC channel using Fritchman model and Baum-Welch algorithm. In Proceedings of the 2013 IEEE 17th International Symposium on Power Line Communications and Its Applications, Johannesburg, South Africa, 24–27 March 2013; pp. 173–178. [Google Scholar] [CrossRef]
- Mann, T.K.I.; McLaughlin, S.; Henkel, W. Impulse Generation With Appropriate Amplitude, Length, Inter-Arrival, and Spectral Characteristics. IEEE J. Sel. Areas Commun. 2002, 20, 901–912. [Google Scholar] [CrossRef]
- Krejci, J.; Zeman, T. Analyses and modeling impulse noise generated by household appliances. Adv. Electr. Electron. Eng. 2014, 12, 20–29. [Google Scholar] [CrossRef]
- Tlich, P.P.M.; Chaouche, H.; Zeddam, A. Novel approach for PLC impulsive noise modelling. In Proceedings of the 2009 IEEE International Symposium on Power Line Communications and Its Applications, SPLC 2009, Dresden, Germany, 29 March–1 April 2009; pp. 20–25. [Google Scholar] [CrossRef]
- Nedev, N.H.; Mclaughlin, S.; Laurenson, D.I. Estimating errors in transmission systems due to impulse noise. IEE Proc.-Commun. 2006, 153, 651–657. [Google Scholar] [CrossRef]
- Degarding, P.D.V.; Lienard, M.; Zeddam, A.; Gauthier, F. Classification and Characterization of Impulsive Noise on Indoor Power Line Used for Data Communications. IEEE Trans. Consum. Electron. 2002, 48, 249–254. [Google Scholar]
- Chariag, L.D.; Guezgouz, D.; Raingeaud, Y.; Lebunetel, J.-C. Channel Modeling and Periodic Impulsive Noise Analysis in Indoor Power Line. In Proceedings of the IEEE International Symposium on Power Line Communication and Its Applications, Udine, Italy, 3–6 April 2011; pp. 277–282. [Google Scholar]
- Meng, H.; Guan, Y.L.; Chen, S. Modeling and analysis of noise effects on broadband power-line communications. IEEE Trans. Power Deliv. 2005, 20, 630–637. [Google Scholar] [CrossRef]
- Nyete, A.M.; Afullo, T.J.O.; Davidson, I.E. Power Line Noise Measurements and Statistical Modelling in the Time Domain. In Proceedings of the Progress in Electromagnetics Research Symposium, Prague, Czech Republic, 6–9 July 2015; pp. 1569–1574. [Google Scholar]
- Nyete, A.M. A Flexible Statistical Framework for the Characterization and Modelling of Noise in powerline Communication Channels. Ph.D. Thesis, University of Kwazulu-Natal, Durban, South Africa, December 2015. [Google Scholar]
- Nyete, A.M.; Afullo, T.J.O.; Davidson, I.E. Statistical analysis and characterization of low voltage power line noise for telecommunication applications. In Proceedings of the IEEE AFRICON Conference, Addis Ababa, Ethiopia, 14–17 September 2015; pp. 213–217. [Google Scholar] [CrossRef]
- Righi, M.B.; Yang, Y.; Ceretta, P.S. Nonparametric expectile regression for conditional autoregressive expected shortfall estimation. Contemp. Stud. Econ. Financ. Anal. 2014, 96, 83–95. [Google Scholar] [CrossRef]
- Mosalaosi, M.; Afullo, T.J.O. Broadband analysis and characterization of noise for in-door power-line communication channels. In Proceedings of the Progress in Electromagnetics Research Symposium, Guangzhou, China, 25–28 August 2014; pp. 719–723. [Google Scholar]
- Gotz, K.D.M.; Rapp, M. Power Line Channel Characteristics and Their Effect on Communication System Design. IEEE Commun. Mag. 2004, 42, 78–86. [Google Scholar] [CrossRef]
- Amirshahi, P.; Member, S.; Navidpour, S.M.; Kavehrad, M. Performance Analysis of Uncoded and Coded OFDM Broadband Transmission Over Low Voltage Power-Line Channels with Impulsive Noise. IEEE Trans. Power Deliv. 2006, 21, 1927–1934. [Google Scholar] [CrossRef]
- Khangosstar, J.; Zhang, L.; Mehboob, A. An experimental analysis in time and frequency domain of impulse noise over power lines. In Proceedings of the 2011 IEEE International Symposium on Power Line Communications and Its Applications ISPLC 2011, Udine, Italy, 3–6 April 2011; pp. 218–224. [Google Scholar] [CrossRef]
- Zhidkov, S. Performance Analysis and Optimization of OFDM Receiver with Blanking Nonlinearity in Impulsive Noise Environment. IEEE Trans. Veh. Technol. 2006, 55, 234–242. [Google Scholar] [CrossRef]
- Hossain, E.; Khan, S.; Ali, A. Low voltage power line characterization as a data transfer method in public electricity distribution networks and indoor distribution networks. In Proceedings of the 2008 IEEE Electrical Power and Energy Conference—Energy Innovation, Vancouver, BC, Canada, 6–7 October 2008; pp. 1–7. [Google Scholar] [CrossRef]
- Meng, H.; Chen, S.; Guan, Y.L.; Law, C.L.; So, P.L.; Gunawan, E.; Lie, T.T. Modeling of transfer characteristics for the broadband power line communication channel. IEEE Trans. Power Deliv. 2004, 19, 1057–1064. [Google Scholar] [CrossRef]
- Raponi, S.; Fernandez, J.H.; Omri, A.; Oligeri, G. Long-Term Noise Characterization of Narrowband Power Line Communications. IEEE Trans. Power Deliv. 2022, 37, 365–373. [Google Scholar] [CrossRef]
- Oyeleke, O.D.; Idowu-Bismark, O.; Andrew, A.; Dyaji, C.B.; Muhammad, I.; Adamu, T. Noise characterization and modelling for powerline communications in Nigeria. In Proceedings of the CIVEMSA 2021—IEEE International Conference on Computational Intelligence and Virtual Environments for Measurement Systems and Applications, Hong Kong, China, 18–20 June 2021; pp. 2–7. [Google Scholar] [CrossRef]
- Blazek, V.; Slanina, Z.; Petruzela, M.; Hrbáč, R.; Vysocký, J.; Prokop, L.; Misak, S.; Walendziuk, W. Error Analysis of Narrowband Power-Line Communication in the Off-Grid Electrical System. Sensors 2022, 22, 2265. [Google Scholar] [CrossRef]
- Ndolo, A.; Çavdar, İ.H. Current state of communication systems based on electrical power transmission lines. J. Electr. Syst. Inf. Technol. 2021, 8, 9. [Google Scholar] [CrossRef]
- Li, F.; Shen, H.; Shi, L.; Wang, H.; Gao, B. Noise Reduction Method for Low Voltage Power Line Carrier Communication. J. Phys. Conf. Ser. 2021, 1920, 012066. [Google Scholar] [CrossRef]
- Chariag, D.; Guezgouz, D.; Le Bunetel, J.C.; Raingeaud, Y. Modeling and simulation of temporal variation of channel and noise in indoor power-line network. IEEE Trans. Power Deliv. 2012, 27, 1800–1808. [Google Scholar] [CrossRef]
- Rajkumarsingh, B.; Prayagsing, K. Performance Analysis of Nonlinear Pre-Processors for Markov-Middleton Impulsive Noise Mitigation in OFDM Based Power-Line Communications. In Proceedings of the 2020 3rd International Conference on Emerging Trends in Electrical, Electronic, and Communications Engineering, ELECOM Proceedings, Balaclava, Mauritius, 25–27 November 2020; pp. 94–99. [Google Scholar] [CrossRef]
- Ma, Y.H.; So, P.L.; Gunawan, E.; Guan, Y.L. Analysis of Impulsive Noise and Multipath Effects on Broadband Power Line Communications. In Proceedings of the 2004 International Conference on Power System Technology-POWERCON 2004, Singapore, 21–24 November 2004; pp. 1404–1409. [Google Scholar]
- Gu, Z.T.Z.; Liu, H.; Liu, D.; Man, K.-L.; Liang, H.; Liu, D.; Man, K.; Liang, H.; Tan, Z. Modeling the Noise in NarrowBand Power Line Communication. Int. J. Control Autom. 2016, 9, 41–48. [Google Scholar] [CrossRef]
- Chen, G.; Yang, G. Empirical Noise Modelling in Power Line Communication Systems. Int. J. Comput. Commun. Eng. 2018, 7, 119–127. [Google Scholar] [CrossRef]
- Rouissi, F.; Gassara, H.; Ghazel, A.; Najjar, S. Comparative Study of Impulse Noise Models in the Narrow Band Indoor PLC Environment. In Proceedings of the Tenth Workshop on Power Line Communications, Paris, France, 10–11 October 2016; pp. 1–6. [Google Scholar]
- Cortes, J.A.; Sanz, A.; Estopinan, P.; Garcia, J.I. On the suitability of the Middleton class A noise model for narrowband PLC. In Proceedings of the 2016 International Symposium on Power Line Communications and its Applications, Spain, ISPLC 2016, Bottrop, Germany, 20–23 March 2016; pp. 58–63. [Google Scholar] [CrossRef]
- Karakuş, O.; Kuruoğlu, E.E.; Altınkaya, M.A. Modelling impulsive noise in indoor powerline communication systems. Signal Image Video Process. 2020, 14, 1655–1661. [Google Scholar] [CrossRef]
- Bai, T.; Zhang, H.; Wang, J.; Xu, C.; Elkashlan, M.; Nallanathan, A.; Hanzo, L. Fifty Years of Noise Modeling and Mitigation in Power-Line Communications. IEEE Commun. Surv. Tutor. 2021, 23, 41–69. [Google Scholar] [CrossRef]
- Shlezinger, N.; Shaked, R.; Dabora, R. On the capacity of MIMO broadband power line communications channels. IEEE Trans. Commun. 2018, 66, 4795–4810. [Google Scholar] [CrossRef]
- Masood, S.B.B.; Haider, A. Characterization of low voltage access network for narrowband powerline communications. J. Electr. Eng. Technol. 2017, 12, 443–450. [Google Scholar] [CrossRef]
- Spaulding, A.D.; Middleton, D. Optimum Reception in an Impulsive Interference Environment-Part I: Coherent Detection. IEEE Trans. Commun. 1977, 25, 911–923. [Google Scholar] [CrossRef]
- Ghosh, M. Analysis of the Effect of Impulse Noise on Multicamer and Single Carrier QAM Systems. IEEE Trans. Commun. 1996, 44, 1995–1997. [Google Scholar] [CrossRef]
- Zhidkov, S. Analysis and Comparison of Several Simple Impulsive Noise Mitigation Schemes for OFDM Receivers. IEEE Trans. Commun. 2008, 56, 5–9. [Google Scholar] [CrossRef]
- Vaseghi, S. Advanced Digital Signal Processing and Noise Reduction, 2nd ed.; Wiley and Sons Ltd.: New York, NY, USA, 2000; pp. 30–43. [Google Scholar]
- Pighi, R.R.R.; Franceschini, M.; Ferrari, G. Fundamental Performance Limits of Communications Systems Impaired by Impulse Noise. IEEE Trans. Commun. 2009, 57, 171–180. [Google Scholar] [CrossRef]
- Modisa, M. Power Line Communication (PLC) Channel Measurements and Characterization. Ph.D. Thesis, University of KwaZulu-Natal, Durban, South Africa, 2014; pp. 26–28. [Google Scholar]
- Amirshahi, P.; Navidpour, S.M.; Kavehrad, M. Performance analysis of OFDM broadband communications system over low voltage powerline with impulsive noise. In Proceedings of the 2006 IEEE International Conference on Communications, Istanbul, Turkey, 11–15 June 2006; pp. 1–6. [Google Scholar] [CrossRef]
- Ferreira, H.C.; Grove, H.M.; Hooijen, O.; Vinck, A.J.H. Power line communications: An overview. In Proceedings of the Proceedings of IEEE AFRICON ‘96, Stellenbosch, South Africa, 27 September 1996; pp. 558–563. [Google Scholar] [CrossRef]
- Carcelle, X.; Bourgeau, T. Power Line Communication Technology Overview. Pac. J. Sci. Technol. 2013, 8, 398–402. [Google Scholar] [CrossRef]
- Zimmermann, M.; Dostert, K. An analysis of the broadband noise scenario in powerline networks. In Proceedings of the International Symposium on Power Line Communications and Its Applications, Limerick, Ireland, 1 January 2000; pp. 130–137. [Google Scholar]
- Oborkhale, L.I.; Eng, M.; Shoewu, O.; Sc, M. Power Line Communication Technology. J. Sci. Technol. 2007, 8, 398–405. [Google Scholar]
- Khalil, K. Contributions to Indoor Broadband Power-Line Communications: Channel Modeling and Data Rate Optimization. Ph.D. Thesis, Université de Valenciennes et du Hainaut-Cambresis, Valenciennes, France, 2016; pp. 1–129. [Google Scholar]
- Sánchez-Martínez, J.J.; Cortés, J.A.; Díez, L.; Cañete, F.J.; Torres, L.M. Performance analysis of OFDM modulation on indoor PLC channels in the frequency band up to 210 MHz. In Proceedings of the IEEE ISPLC 2010—International Symposium on Power Line Communications and Its Applications, Rio de Janeiro, Brazil, 28–31 March 2010; pp. 38–43. [Google Scholar] [CrossRef]
- Oluwafemi, I.B.; Mneney, S.H. Review of Space-time Coded Orthogonal Frequency Division Multiplexing Systems for Wireless Communication. IETE Tech. Rev. 2013, 30, 417–418. [Google Scholar] [CrossRef]
- Ndjiongue, A.R.; Ferreira, H.C. Power line communications (PLC) technology: More than 20 years of intense research. Trans. Emerg. Telecommun. Technol. 2019, 30, e3575. [Google Scholar] [CrossRef]
- Oliveira, T.R.; De Sá, P.C.; Barbosa, S.L.D.P.; Ribeiro, M.V.; Marques, C.A.G. HOS-based impulsive noise detection technique for power line communication systems. In Proceedings of the IEEE ISPLC 2010—International Symposium on Power Line Communications and Its Applications, Rio de Janeiro, Brazil, 28–31 March 2010; pp. 125–130. [Google Scholar] [CrossRef]
- Bogdanovic, M.; Rupcic, S. Generalized background noise modeling in power line communication. In Proceedings of the 20th Telecommunications Forum (TELFOR), Belgrade, Serbia, 20–22 November 2012; pp. 241–244. [Google Scholar] [CrossRef]
- Zhang, G.A.; Gu, J.Y.; Bao, Z.H.; Xu, C.; Zhang, S.B. Joint routing and channel assignment algorithms in cognitive wireless mesh networks. Trans. Emerg. Telecommun. Technol. 2019, 25, 294–307. [Google Scholar] [CrossRef]
- Sagar, N. Powerline Communications Systems: Overview and Analysis. Ph.D. Thesis, The State University of New Jersey, New Brunswick, NJ, USA, May 2011; pp. 2–160. [Google Scholar]
- Fernandes, V.; Angelova, S.; Finamore, W.; Ribeiro, M. On modeling power-line communication noise. In Proceedings of the Simposio Brasileiro de Telecommunicacoes, Juiz de Fora, Brazil, 1–4 September 2015; p. XXXIII. [Google Scholar] [CrossRef]
- Tan, Z.; Cheng, Y.; Liu, H.; Ma, Z. Noise modelling for power line communication in harsh environment. In Proceedings of the 2017 4th International Conference on Information Science and Control Engineering, ICISCE 2017, Changsha, China, 21–23 July 2017; pp. 1559–1563. [Google Scholar] [CrossRef]
- Acakpovi, A.; Mohammed, H.; Nwulu, N.; Fifatin, F.X.N.; Nounangnonhou, T.C.; Abubakar, R. Evaluation of Noise Effects on Power Line Communication in a Narrow and Wide Band Frequency Spectrum: A Case Study of Electricity Distribution Network of Ghana. In Proceedings of the 2019 International Conference on Computing, Computational Modelling and Applications, ICCMA, Cape Coast, Ghana, 27–29 March 2019; pp. 27–33. [Google Scholar] [CrossRef]
- Akorede, M.; Eguaosa, G.; Thomas, C.; Pouresmaeil, E.; Taheri, S. Analysis and Characterization of End-User Equipment Noise Signals for Power Line Communication Applications. Jordan J. Electr. Eng. 2020, 6, 217. [Google Scholar] [CrossRef]
- Amuta, E.O.; Awelewa, A.; Olajube, A.; Somefun, T.E.; Afolabi, G.; Uyi, A.S. Power line carrier technologies: A review. In Proceedings of the IOP Conference Series: Materials Science and Engineering, Ota, Nigeria, 27–28 July 2020; Volume 1036, p. 012062. [Google Scholar] [CrossRef]
- Ajibade, A.O.; Oluwafemi, B.; Owolabi, I.E. Characterisation of signal amplitude-frequency for indoor power line communication channel in the 1–30 MHz broadband frequencies. Int. J. Electr. Comput. Eng. Syst. 2021, 12, 36–37. [Google Scholar] [CrossRef]


Disclaimer/Publisher’s Note: The statements, opinions and data contained in all publications are solely those of the individual author(s) and contributor(s) and not of MDPI and/or the editor(s). MDPI and/or the editor(s) disclaim responsibility for any injury to people or property resulting from any ideas, methods, instructions or products referred to in the content. |
© 2023 by the authors. Licensee MDPI, Basel, Switzerland. This article is an open access article distributed under the terms and conditions of the Creative Commons Attribution (CC BY) license (https://creativecommons.org/licenses/by/4.0/).