Article

Combustion of Lean Methane/Propane Mixtures with an Active Prechamber Engine in Terms of Various Fuel Distribution

Faculty of Civil and Transport Engineering, Poznan University of Technology, 60-965 Poznan, Poland
*
Author to whom correspondence should be addressed.
Energies 2023, 16(8), 3608; https://doi.org/10.3390/en16083608
Submission received: 13 March 2023 / Revised: 18 April 2023 / Accepted: 19 April 2023 / Published: 21 April 2023
(This article belongs to the Special Issue NOx, PM and CO2 Emission Reduction in Fuel Combustion Processes)

Abstract

:
The possibilities for reducing the fuel consumption of internal combustion engines focus mainly on developing combustion systems, as one such solution is a two-stage combustion system using jet ignition. The combustion of gaseous mixtures with a high excess air ratio leads to an increase in overall efficiency and a reduction in the emissions of selected exhaust components. In such a convention, gas combustion studies were conducted in the methane/propane configuration. Using an active prechamber where spark plugs were placed and direct injection through a check valve, the fuel dose was minimized into the prechamber. The tests were conducted for a constant center of combustion (CoC). The combustion process in both the prechamber and main chamber was analyzed using a test stand equipped with a 0.5 dm3 single-cylinder engine. The engine was controlled by varying the fuel supply to the prechamber and main chamber in excess air ratio λ = 1.3–1.8. The study analyzed thermodynamic indices such as the combustion pressure in both chambers, based on which the SoC in both chambers, the rate and amount of heat released, AI05, AI90 and, consequently, the indicated efficiency were determined. Based on the results, it was found that the use of CH4/C3H8 combination degraded the thermodynamic indicators of combustion more than using only the base gas (methane). In addition, the stability of the engine’s operation was decreased. The advantage of using propane for the prechamber is to obtain more beneficial ecological indicators. For the single-fuel system, a maximum indicated efficiency of more than 40% was obtained, while with the use of propane for the prechamber, a maximum of 39.3% was achieved.

1. Introduction

The development of internal combustion engines focused on reducing fuel consumption is primarily leading to improvements in lean-burn technology. Gaseous fuels are mainly becoming attractive as an energy factor due to their lower carbon content, effectively reducing carbon dioxide and particulate emissions into the atmosphere [1].
The combustion of methane in spark-ignition engines in stoichiometric mode is a relatively common solution applied in many types of propulsion systems. An expanded opportunity to improve engine ecology and reduce fuel consumption is provided using a two-stage combustion system—TJI [2,3,4,5]. This system can be classified into passive and active prechambers [6]. The passive prechamber is filled with homogeneous fuel–air mixtures from the main chamber during the compression stroke. The active prechamber system is integrated with an auxiliary fuel-metering device to accurately control the equivalence ratio of the stratified mixture. Thus, the passive prechamber and active prechamber systems are also named homogeneous prechamber and stratified prechamber systems, respectively [6]. The above shows much greater benefits when using an active prechamber system. Ignition mechanisms [7,8,9] and inter-chamber flows have been well described and explained.
Combustion with turbulent jet ignition systems is carried out over a wide range of excess air ratios. In the range of excess air ratio 1–1.5, the authors of the article [10] investigated the combustion of various fuels in a prechamber using a single-cylinder test engine. Additionally, in the range of excess air ratio from 1.5 to 1.9, the effect of the cross-sectional area of the prechamber discharge holes was studied. The tests were conducted on an engine fueled with natural gas [11]. Studies on the flammability of the air–fuel mixture using a constant-volume chamber and the TJI system were conducted. In addition to base natural gas, hydrogen was also burned [12]. On another model test stand, specifically a rapid compression machine, different configurations of the ignition system, such as PC spark plug, TJI, and a three-stage system, were compared for an excess air ratio of 1.5 [13]. In another study [14], Nanosecond Repetitively Pulsed Discharge (NRPD) ignition systems and turbulent jet ignition (TJI) were tested in a constant volume chamber with an excess air ratio of up to 1.8.
The effects of co-combustion of methane and propane are not well recognized, as evidenced by the small number of published research results. Studies of these fuels as an additive to diesel fuel have been conducted. Their use reduced fuel consumption by 21% or 15%, respectively [15]. The same reduction in NOx emissions (by 56–57%) was obtained regardless of the additive used.
The much higher density of propane than methane (1.964 versus 0.715 kg/m3) and a boiling point of −42 °C (methane −162 °C) cause difficulties in getting propane into the cylinder in gaseous form [16]. It is necessary to keep appropriate conditions such as low pressure.
One of the concepts for burning lean mixtures is the so-called hybrid combustion [17]. It uses a micro-flame-ignited (MFI) in dimethyl ether (DME) direct injection system and gasoline at a lambda excess air ratio of 2.0. Li at el. [17] conducted studies of DME combustion with the hybrid combustion of DME and gasoline. As a result, the indicated mean effective pressure (IMEP) and cyclic variation are reduced in the double direct injection conditions.
Modeling of the methane combustion process with the TJI system was conducted by Distaso et al. [18]. The research was carried out using an active prechamber at λ = 1.3. Such a value was found to be the limiting value in a standard engine. The prechamber (cylindrical in shape) was placed angular to the cylinder axis. As a result of the conducted exhaust emission analyses, it was determined that in both chambers at the exhaust valve open EVO, the mass fraction of CO2 produced is almost the same. The production of CO and HC in the prechamber is significantly higher (by two orders of magnitude). The mass fraction share of NOx in the prechamber is an order of magnitude smaller than in the main chamber.
A future direction for fueling internal combustion engines may be using ammonia. Liu et al. [19] report that using a TJI system for ammonia combustion improves the stability of engine operation and makes it possible to obtain higher IMEP values with respect to a reference engine. However, Vinod et al. list many barriers to the development of this fuel, such as long ignition delay, low flame development rate, and low reactivity [20]. The quality of the combustion process can be improved by adding methane to ammonia [21] or by using a reactivity controlled turbulent jet ignition (RCTJI) system [22]. Research by Zhang et al. [21] indicates that a 10 to 20% methane addition value leads to an increase in combustion pressure and an increase in the average rate of pressure rise.

2. Aim and Scope of the Study

Co-combustion of gaseous fuels in a two-stage combustion system is a relatively unrecognized solution. For this reason, the authors decided to conduct a comparative experimental study using a single-cylinder research engine. The TJI system used a single-fuel operation where the fuel was methane, then the strategy was changed to a dual-fuel operation, and propane was supplied to the ignition chamber instead of methane. So, the comparison subject is the effect of changing the fuel supplied to the ignition chamber. In the research program on the effect of fuel type, large changes in the dose of fuel supplied to the prechamber with varying values of the excess air ratio were realized.
The questions sought to be answered regarding the thermodynamics of the process were (1) how the excess air ratio affects the combustion process, and (2) how the dose of fuel fed into the prechamber affects combustion efficiency.

3. Materials and Methods

3.1. Test Stand

A single-cylinder AVL 5804 research engine with Eddy current engine dynamometers was used to study the combustion process. The engine has an ignition system that allows real-time control of ignition advance angle and coil charging time. The cylinder head of the engine was adapted to a two-stage combustion system (Figure 1). The adaptation involved expanding the bore to fit the prechamber along with the direct fuel delivery system and pressure sensor. An active prechamber system with fuel delivery through a check valve was used. A prechamber with a 1.7 mm diameter straight 6-hole and an M10 spark plug was employed. Prechamber volume is 5.93% of clearance volume Vc. Due to the different properties of the fuels, methane was supplied to the main chamber at a pressure of 9 bar regardless of the engine mode. In single-fuel mode, methane was supplied to the prechamber at a pressure of 3 bar, while in dual-fuel mode the propane pressure was 1 bar. Fuel injection simultaneously occurs into the intake manifold and the prechamber during the intake stroke 300 °CA before TDC. An injector located in the intake manifold delivers fuel to the main chamber (this chamber is determined by the volume of the cylinder after the intake valves are closed)—Figure 1. Under these conditions, the use of higher injection pressure is not necessary. Other engine specifications are shown in Table 1 and Figure 2.
  • Variable control parameters:
    • Excess air ratio (λ = 1.3; 1.5; 1.8);
    • Dose of fuel to prechamber: energy value of fuel for prechamber: 10; 20; 30; 40; 45; 50; and 60 J (while keeping the total energy value of fuel supplied to the engine constant).
  • Constant control parameters:
    • Engine speed: n = 1500 rpm;
    • Total fuel dose: qo = 13.5 mg (energy = 675 J).
In view of the different calorific values of the fuels (methane and propane—Table 2), the energy content of the fuel dose was determined, rather than the mass directly.
Studies of thermodynamic parameters of combustion were conducted using combustion pressure sensors for the main chamber, AVL GH14D (0–250 bar), and in the prechamber, Kistler 6081 (0–250 bar), whose signals were recorded using AVL IndiSmart (8-channel + IFEM amplifiers) together with AVL crank angle (364C01; 0.1 deg). Gas flow rates: air (Sensycon Sensyflow P; 0–400 kg/h; error < ±0.8%); combustible gases into the prechamber (Bronkhorst 111B; 0.1–100 g/h; accuracy ±0.5% RD plus ±0.1% FS) and into the main chamber (Micro Motion ELITE CMFS010M; 0.1–2 kg/h; accuracy ±0.25%). Gas feed settings were adjusted using a system for controlling the timing and start of injection (Mechatronics Control Gas Injectors). Exhaust gas analysis was carried out using an Axion RS+ analyzer (CO: 0–10% accuracy ±0.02% abs, HC: 0–4000 ppm accuracy ±4 ppm abs, NO: 0–4000 ppm accuracy ±5 ppm abs), a typical portable emissions measurement system (PEMS—Portable Emissions Measurement System) from Global MRV. Exhaust gases were measured using the following methods: CO and HC—spectrometric via analyzer (NDIR) and NO—electrochemical.

3.2. Method of Analyzing Research Results

Methane was chosen as the primary fuel supplied to the cylinder due to its lower carbon content in the molecule. The research work included feeding methane or propane into the prechamber.
By changing the value of the excess air ratio and the type of fuel, engine operating conditions change even within the range of the same test point. Controlling engine operation by keeping the ignition angle constant, the maximum pressure angle constant, or the combustion center constant is possible. The last indicator, defined as the angle at which 50% of the heat is released (its value was set at 8 deg aTDC), was chosen:
CoC = α   at   0.5 × SOC EOC dQ net d α d α ,
where SOC—start of combustion; EOC—end of combustion. In a similar way, the beginning of combustion (the angle at which 5% of the heat is exerted) and the end of combustion (the angle at which 90% of the heat is exerted) were determined.
A criterion for the stability of engine operation has also been defined as the unevenness of operation determined by the value of the coefficient of variation CoV(IMEP) < 3.0% [25]. Older sources give this indicator a value of 10% [26] or this value is given in a range [27]. This indicator was defined as
CoV IMEP = 100 × σ ( IMEP ) μ ( IMEP ) ,
where σ and μ are the standard deviation and the mean value, respectively, over a number of consecutive combustion cycles (analysis applies to 100 consecutive cycles).
Other thermodynamic indicators were determined as follows:
  • Heat release rate dQ net ( α ) d α
    dQ net ( α ) d α = γ γ 1 P ( α ) dV ( α ) d α + 1 γ 1 V ( α ) dP ( α ) d α ,
    where P is the instantaneous cylinder pressure, α is the crank angle, γ is the ratio of the specific heats, and V is the instantaneous cylinder volume.
  • Indicative power (Ni):
    N i = V s × IMEP × n τ ,
    where Vs—engine displacement, n—engine speed, and τ—cyclicality of engine operation.
  • Specific fuel consumption (gi):
    g i = G MC + G PC N i ,
    where G—fuel consumption in the main chamber (MC) and prechamber (PC), respectively.
  • Indicative efficiency (ηi):
    η i = 1 g i × L HV ,
    where LHV—heating value of methane.
  • Specific emissions of exhaust components (ei):
    e i = a i × C i × ( G a + G MC + G PC ) N i ,
    where i = CO, THC, NO, Ci—concentration; CO, THC, NO, Ga—air consumption; GMC, GPC—fuel consumption in both chambers; ai—density ratios (CO = 0.000966; CTHC = 0.000479, CNO = 0.001587) [28].
An illustrative curve of the measured quantities recorded during the tests is shown in Figure 3. In addition to the cylinder and prechamber pressures, the duration of the pulse controlling the injectors and ignition coil is also shown. Fuel was injected into both combustion chambers at different pressures. As can be seen from the figure, the dose injection time into the prechamber is significantly shorter than the fuel injection time into the main chamber.

4. Thermodynamic Analysis of System Operation Fueled by Different Fuels

4.1. Cylinder Pressure

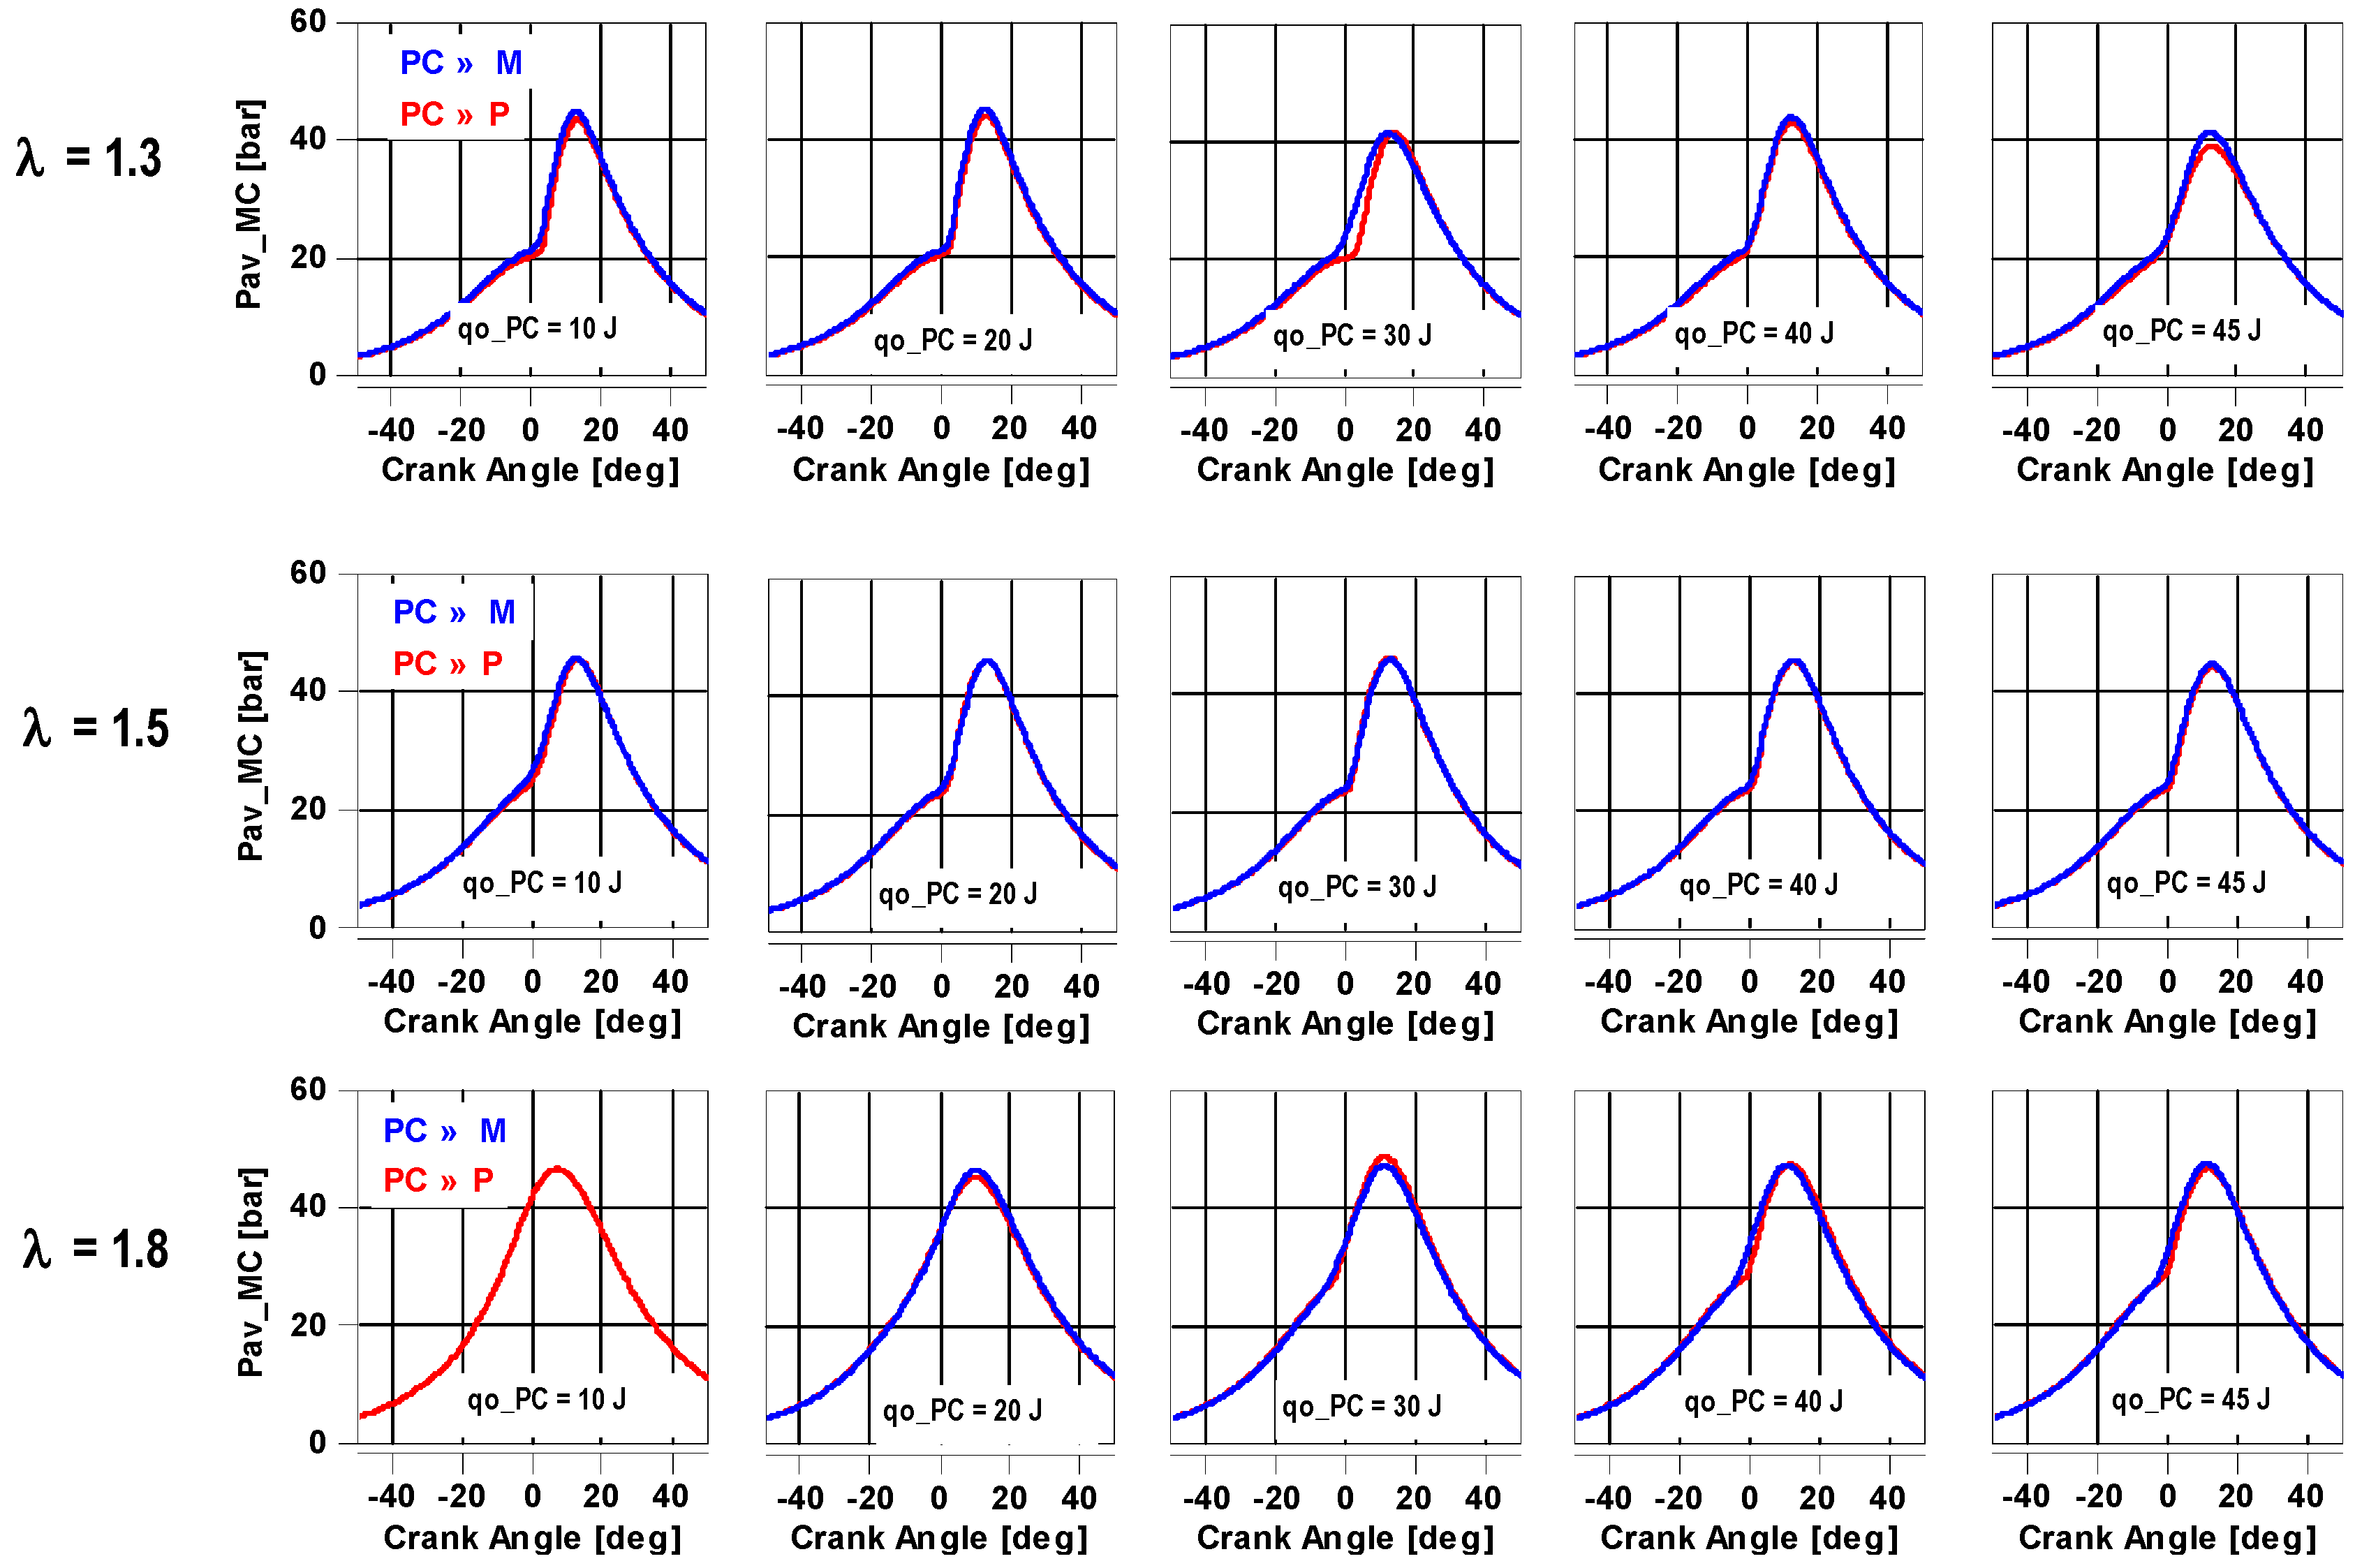
According to the conducted tests, the in-cylinder pressure curves were obtained as an average of the 100 recorded cycles. Due to the fact that methane was always injected into the main chamber, Figure 4 only shows what type of fuel was injected into the prechamber. The blue color represents the case of fueling the pre-combustion chamber with methane, while the red color represents the case of fueling it with propane. The diagrams also include information on the share of energy contained in the fuel delivered to the prechamber. With the excess air ratio with the smallest analyzed value (λ = 1.3), feeding methane into the prechamber resulted in slightly higher values of maximum pressure in the cylinder (in the main chamber). At λ = 1.5, the maximum pressure values are very similar. Operation of the engine with an excess air ratio of λ = 1.8 results in the smallest dose of methane fed into the prechamber not igniting the fuel in the cylinder (no line in Figure 4). Only at a dose of qo_PC = 30 J and λ = 1.8 is the value of the maximum pressure during propane combustion in the PC greater than that of methane combustion.

4.2. Analysis of Engine Operation Stability

For all engine operating points, the coefficient of variation of the indicative mean effective pressure CoV(IMEP) was determined according to Equation (2). The data presented (Figure 5) show that the largest values of the engine’s operating irregularity are related to a large dose of fuel fed into the prechamber at λ = 1.3, independent of the fuel type in the prechamber. As mentioned earlier, the misfire of the fuel in the cylinder, shown by the large CoV(IMEP) value, also occurs at λ = 1.8 and a low fuel dose. At this point, CoV(IMEP) = 12% was obtained during propane combustion, while no combustion occurred during methane combustion (in the prechamber), which is why there is no point in Figure 5b.
As shown in Figure 5, the most stable engine operation is at λ = 1.5 over the entire range of changes in the fuel dose to the prechamber qo_PC. The greatest unstable operation is observed with a large value of λ = 1.8 and a low dose of propane to PC (Figure 5a). A large excess air ratio and a low fuel dose do not promote the ignitability of the charge. The same is true for methane combustion—with the above conditions (λ = 1.8, qo_PC = min) there is no ignitability of the main charge.
Therefore, the next figure shows the conditions that are the most (Figure 6a) and least favorable (Figure 6b) for ignition of the charge. The most favorable conditions for combustion (most stable engine operation) occur at the average value of the fuel dose to the PC (qo = 30 J). The value of CoV(IMEP) is below 0.8%. The least favorable conditions result in CoV(IMEP) values well above 5% and above 9%. It can be considered that at CoV(IMEP) = 9.3%, the peak pressure differences are almost 100%. At CoV(IMEP) = 5.8%, the maximum variations are 26 bar, or about 75%.
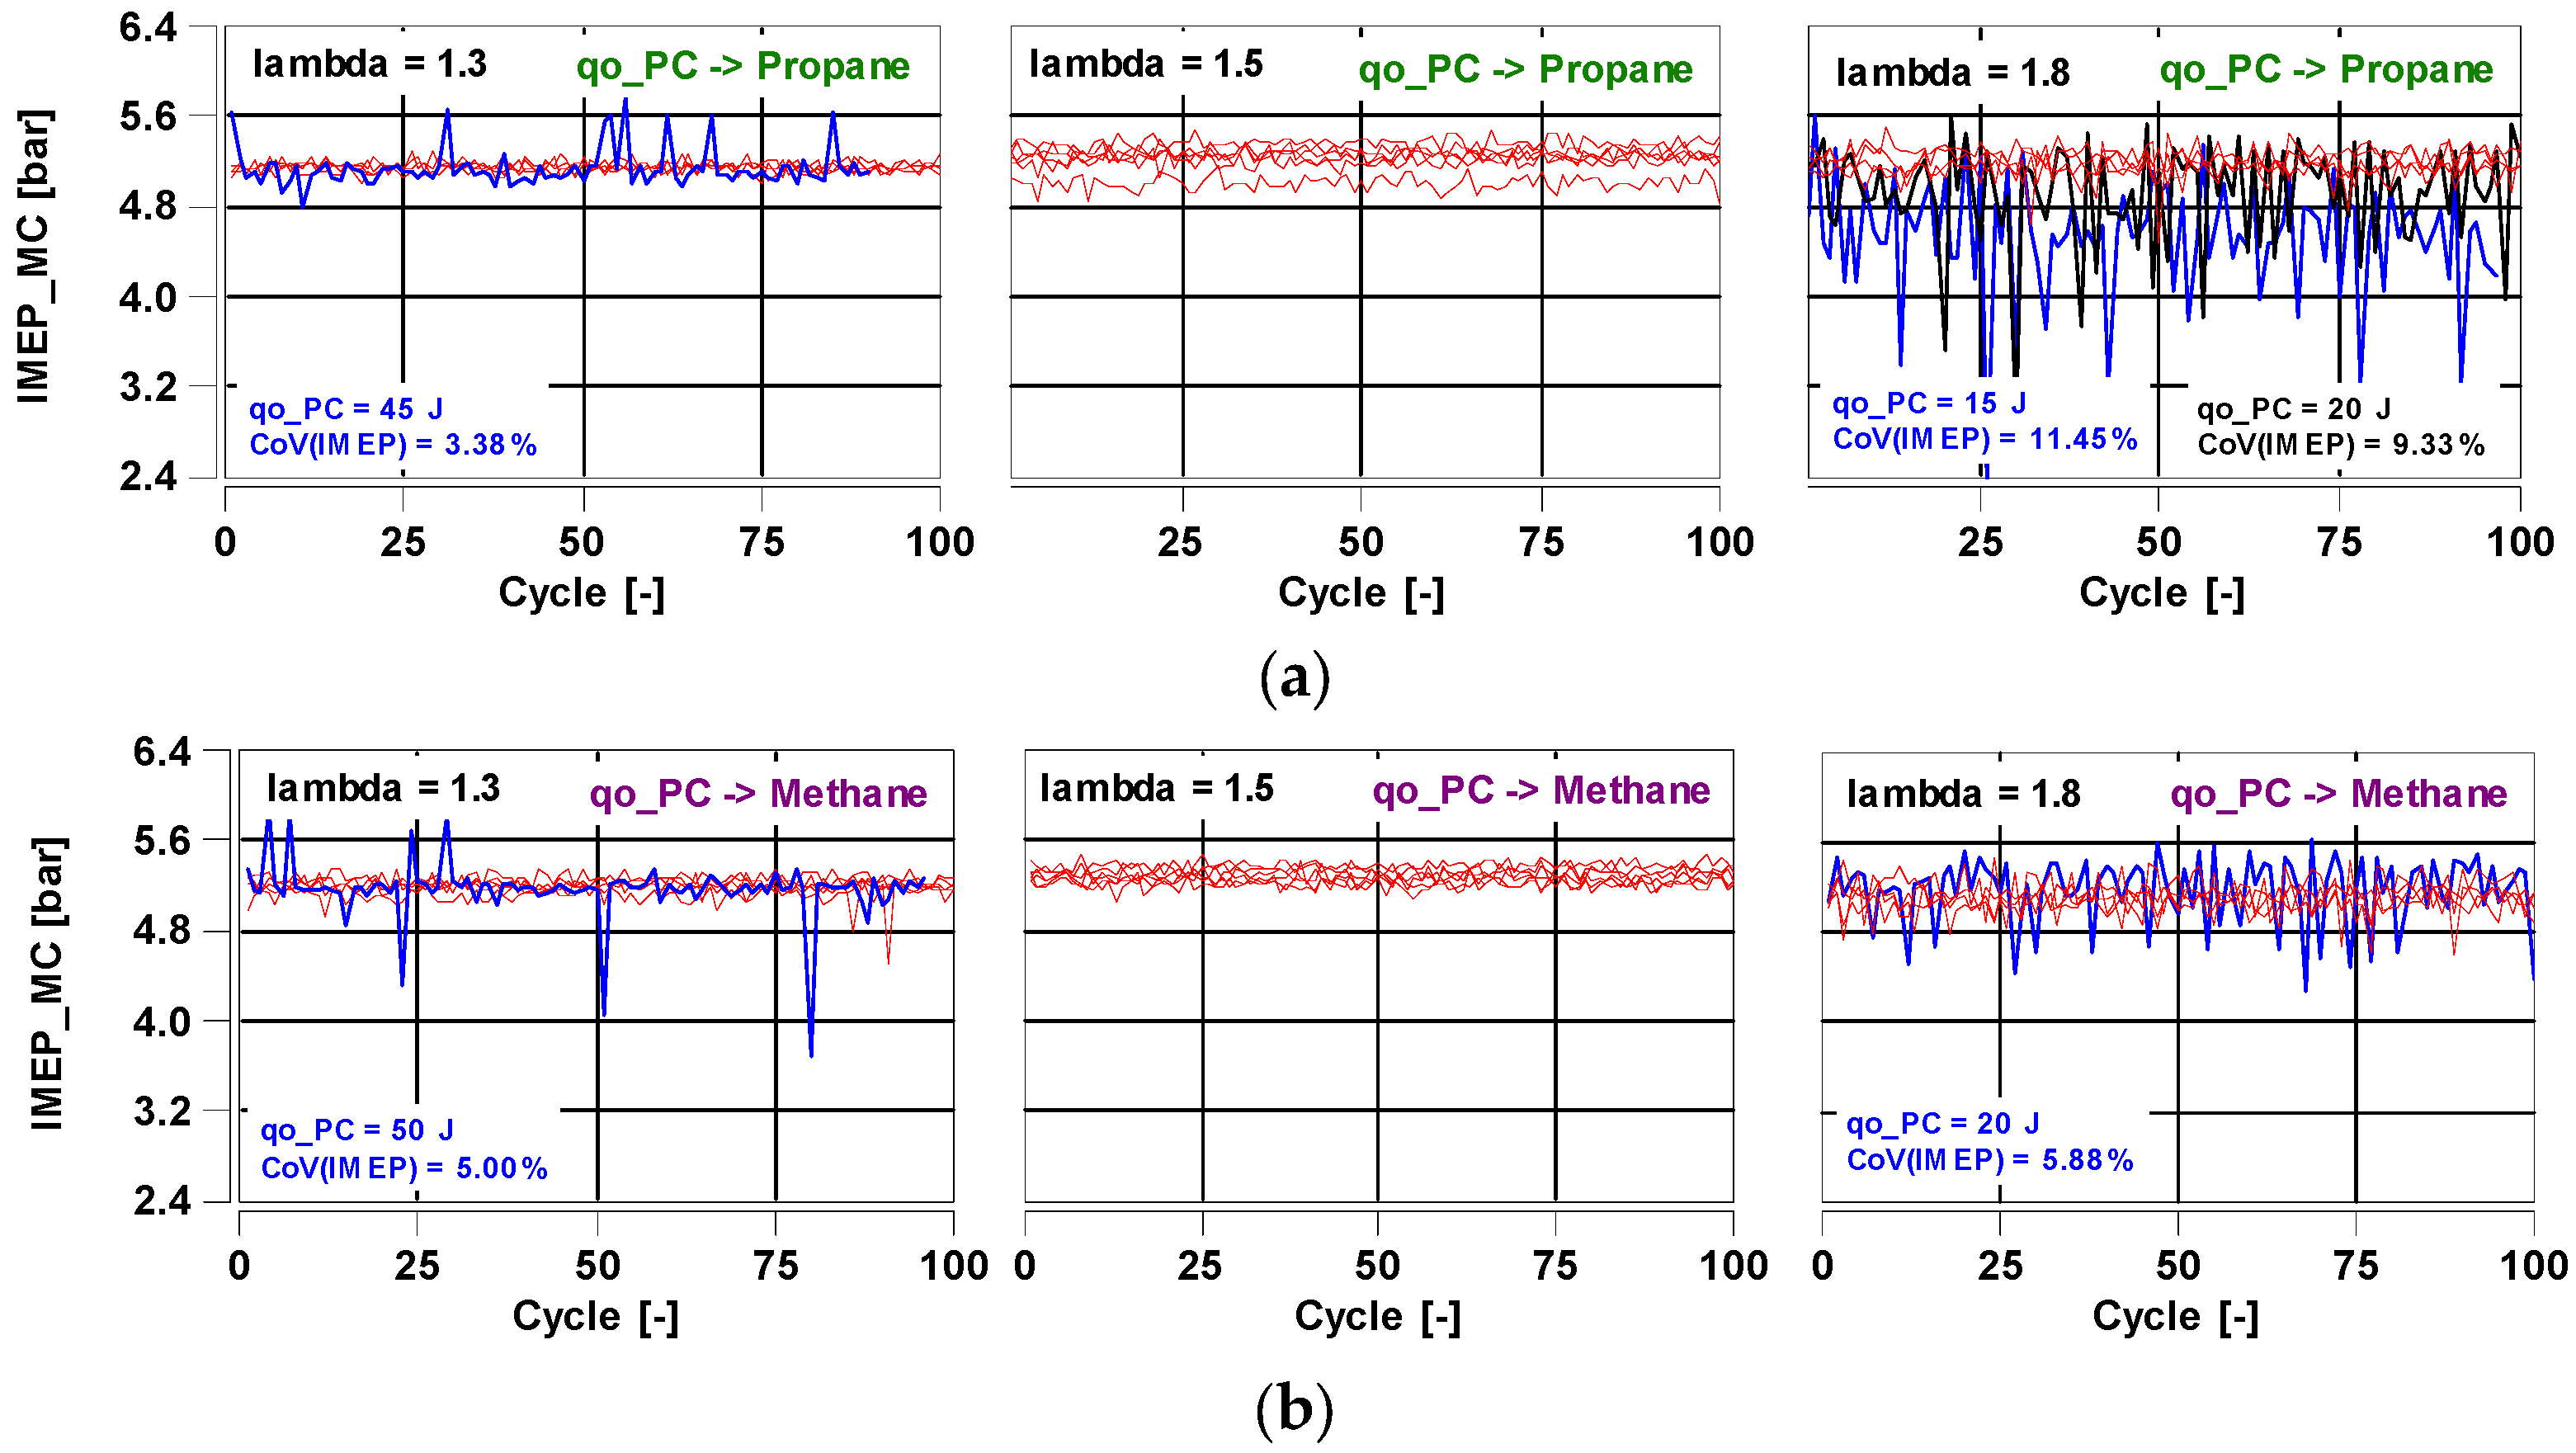
A comparison of IMEP values at each point of engine operation is briefly shown in Figure 7. All curves are drawn in the same color, but those showing significant deviations are marked in blue or black. It can be seen from the data presented that the highest instability of operation occurs at λ = 1.8. Two curves significantly deviating from the stability criterion of CoV(IMEP) < 3.5% were recorded. The maximum values are 9.33% and 11.45%. Comparing the combustion of methane and propane, it was found that the combustion of methane significantly degrades the combustion process more (no combustion at qo = 10 J and λ = 1.8). At other operating points, the combustion conditions are similar (at the same fuel doses qo_PC), i.e., combustion is deteriorated.
The engine’s so-called “work maps” stability is also included in the IMEPn-IMEPn+1 coordinates (Figure 8). They indicate the variability of sequential engine cycles and illustrate in detail the changes in the cyclicality of engine operation. At the smallest value of the excess air ratio λ = 1.3, the greatest irregularity occurs at high fuel doses to the PC during the combustion of methane in the prechamber (Figure 8b—left graph). The variation averages ΔIMEP = 0.8 bar/cycle. The most stable engine operation occurs at λ = 1.5. The cyclic changes from cycle to cycle are less than ΔIMEP = 0.5 bar/cycle. The highest irregularity was observed at λ = 1.8 during propane combustion (Figure 8a). The ΔIMEP changes are almost 3 bar/cycle. During methane combustion, the ΔIMEP value is a maximum of 1.5 bar/cycle.
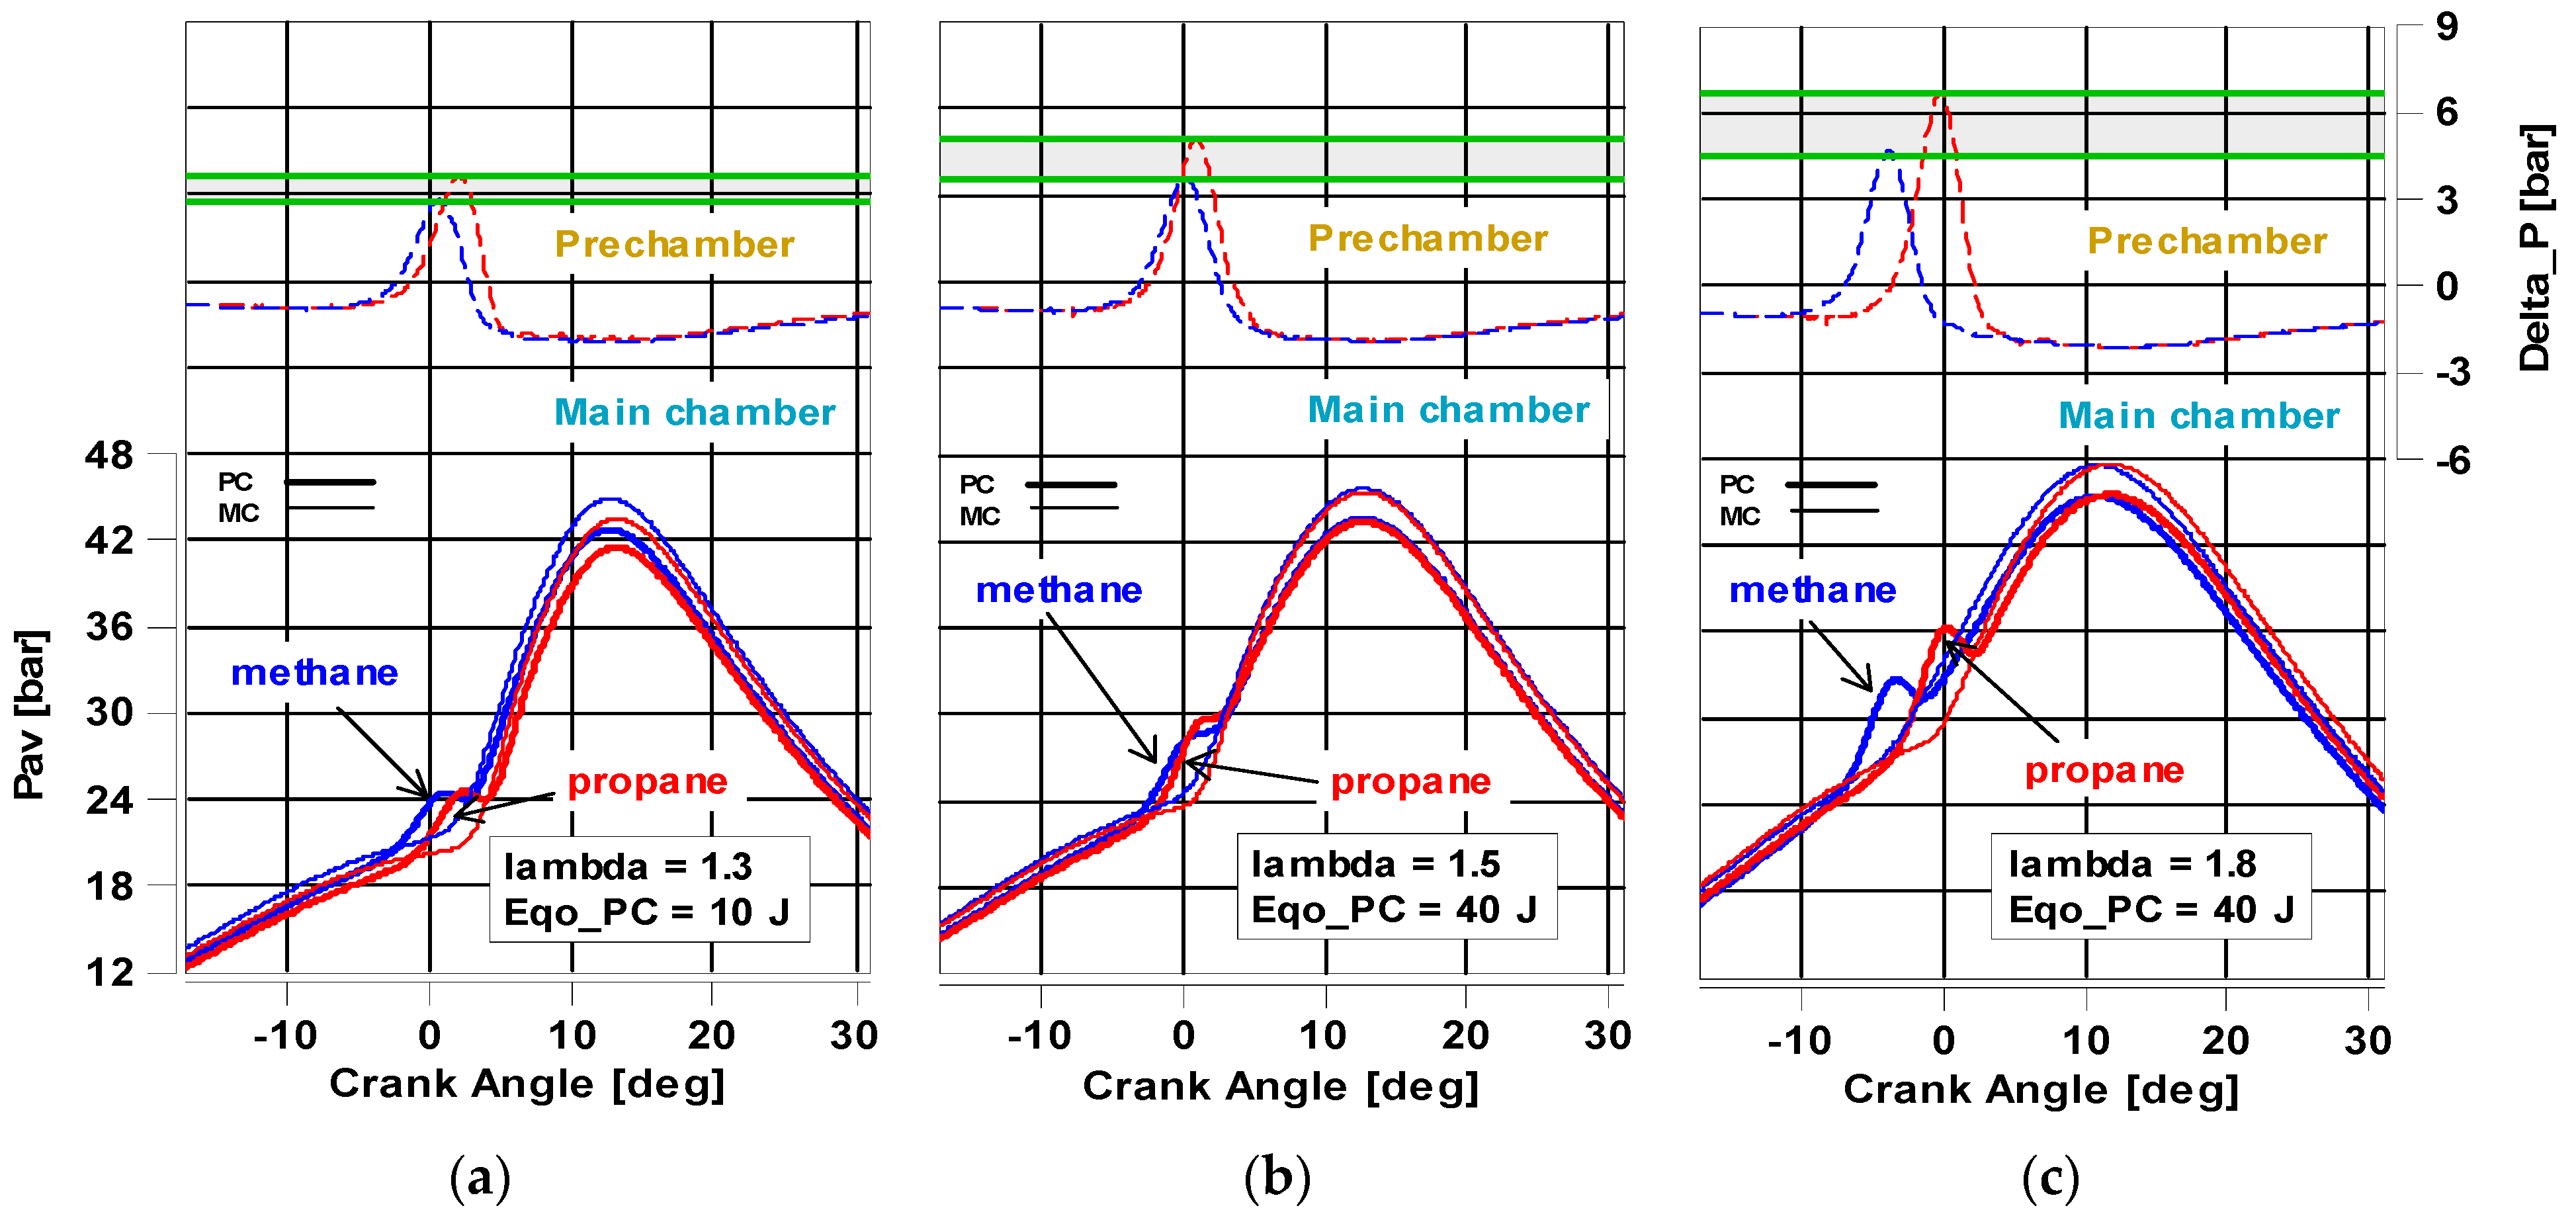
The analysis of inter-chamber tides is shown in Figure 9. The pressure difference between chambers was chosen as the parameter representing mass transfer intensity. The combustion of fuels at λ = 1.3 (Figure 9a) shows the smallest pressure difference between volumes when various fuels are combusted. A higher value was recorded during the combustion of propane in the prechamber, the pressure difference between the main and prechamber being about 0.9 bar. An earlier ignition of methane than propane is observed to achieve CoC = 8 deg aTDC. This means that propane combustion occurs faster, especially in the range of the first phase of combustion. This phase lasts from the beginning of combustion until 50% of the heat is released. When burning fuels at λ = 1.5, the start of combustion in the PC is slightly later for both fuels (Figure 9b). The pressure differences in the prechamber are already greater at about 1.4 bar. The combustion pressure in the PC during propane fueling is higher, and again the maximum falls slightly later than during methane combustion. The largest differences were observed when sparging the fuels at λ = 1.8 (Figure 9c). Differences in the onset of combustion in the PC are large at about 4 deg. Pressure differences in PC are about 2.1 bar.
At all points, the maximum pressure in the MC is several bars higher than in the PC. This is mainly due to the throttling effect of the flow orifices produced in the prechamber.
The specific changes in the pressure values in the two chambers are shown in Figure 10. It shows the high intensity of the processes in the prechamber under the conditions of the mean energy supplied to this chamber. On this basis, it is possible to conclude the optimal amount of fuel delivered to the prechamber. As can be seen from the data presented, the best value is the energy in the range of 20–30 J delivered to the PC. Too small as well as too large a dose of fuel to the PC results in a non-intensive combustion in the prechamber. Regardless of the dose, higher pressure values were always recorded in the MC than in the PC.
Based on the above considerations of engine stability, the average values of IMEP in both combustion chambers were determined (Figure 11). It was found that the IMEP in MC has about 0.2 bar higher values than in PC. As the dose to the PC increases, the value decreases almost linearly. The change in IMEP is about 0.2 bar per 50 J of energy delivered to the PC. This decrease may be due mainly to the lower energy of the fuel contained in the main chamber. This means that the minimum dose delivered to the PC is sufficient to initiate the combustion process and maximize IMEP. The figures also show the effect of the loss of stability of engine operation, which is a very large drop in IMEP at λ = 1.8 and low energy fed to the PC. With such conditions of high excess air, the minimum dose given to the PC is too low to achieve proper combustion.
The combustion of methane and propane at λ = 1.8 is not beneficial. In both cases, an unsatisfactory combustion was obtained at small values of qo_PC. At larger values of qo_PC, the smallest IMEP values were observed, indicating that the excess air ratio limit was exceeded with the combustion system used.
Based on the pressure curve in the cylinder and Equation (3), the rate of heat release was determined. Integrating these values, the total amount of heat released was obtained. The analysis of this quantity in Figure 12 confirms the above information about the minimization of the dose delivered to the PC.
The combustion of propane and methane in the PC results in the maximum heat release values being obtained with the minimum fuel dose. The combustion of very lean mixtures (λ = 1.8—Figure 12c) results in a different process when methane or propane is injected into the PC. When burning propane, the minimum dose is too low to achieve proper combustion, and the amount of heat released is the smallest. In this case, very large spreads in the path of heat release were obtained, depending on the amount of energy delivered to the PC. The combustion of methane (Figure 12c) also results in a maximum of heat released at qo → min, i.e., 10 J of energy delivered to the PC. However, the amount of heat released is at the same time the smallest (compared to other values λ).

4.3. Indicators of Engine Operation

4.3.1. Thermodynamic Indicators

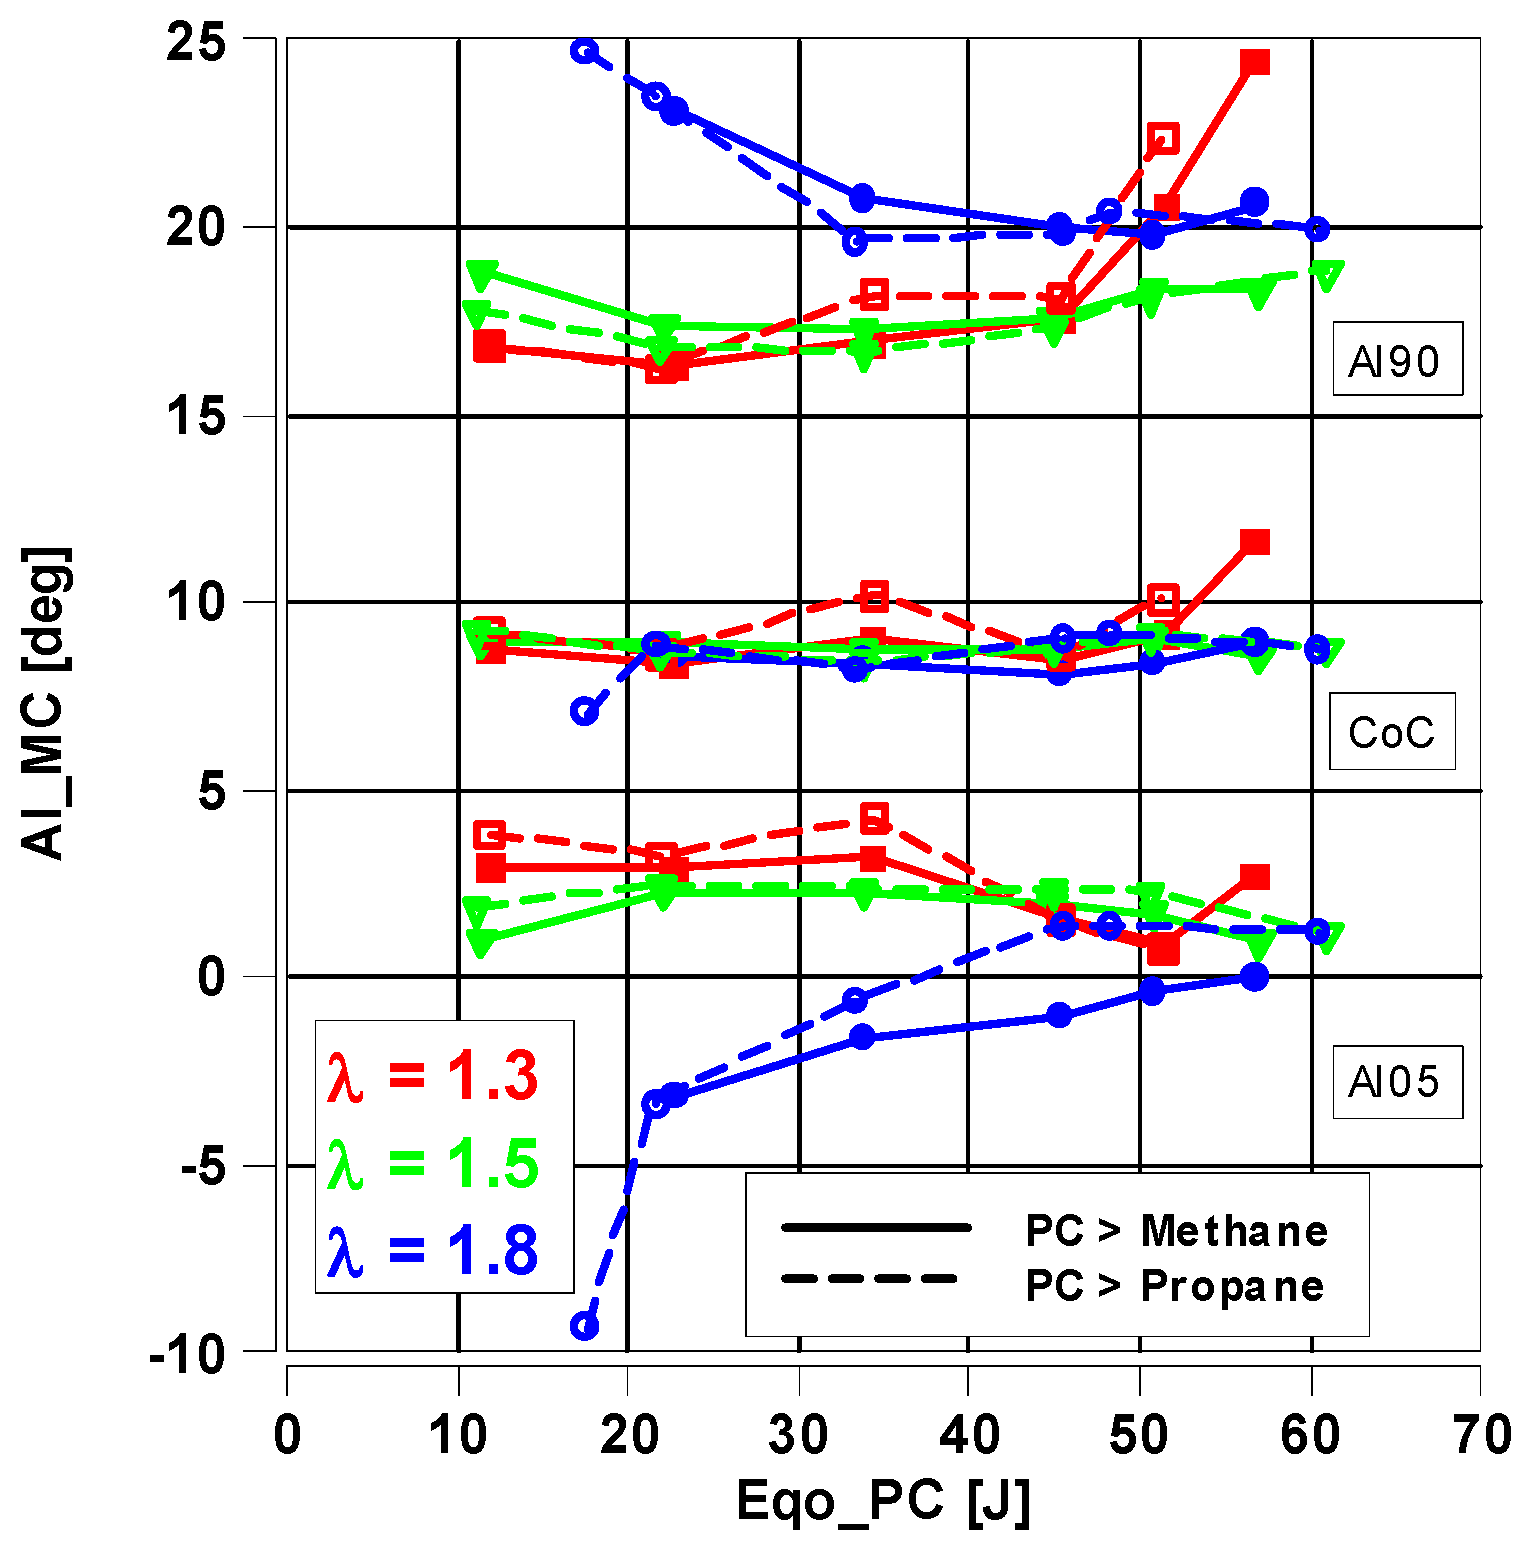
Using the quantities in Figure 12 and taking into account Equation (1), the thermodynamic indices of an engine fueled by methane and propane were determined. The combustion center (CoC) and start (AI05) and end of combustion (AI90) were determined. The results of these measures are included in Figure 13.
According to data from Figure 13, the combustion of methane and propane in PC at λ = 1.3 and 1.5 results in high operation stability. As the energy delivered to the PC increases, the time of combustion I phase also increases. This is due to the control method of keeping the CoC constant (8 deg aTDC). Such control requires an increase in the ignition advance value, which results in an advance at the start of combustion. At the same time, during the combustion of both fuels, a longer combustion phase II (AI90—CoC) is also observed. This means that the fastest process occurs when small doses of fuel are fed into the prechamber. The combustion of fuels at λ = 1.8 results in large variations in thermodynamic indicators. This is due to the combustion conditions (operating instability) presented previously. Although the CoC value was kept constant, both the start and the end of combustion have a different trend from the previous values of the excess air ratio.

4.3.2. System Efficiency for Methane and Propane Combustion

Taking into account Equations (4)–(6), the efficiency of the engine was determined at each operating point when the prechamber was fed with methane and propane (Figure 14). It was found earlier that the operating conditions at λ = 1.8 were not fully acceptable. Due to stable operating conditions, the highest engine efficiency was observed at λ = 1.5 when the prechamber was fueled with methane. The values of ηi reach more than 40% at a low fuel initial dose. Slightly lower values were observed at this operating point when PC was fueled with propane (ηi = 39.3%). The combustion of mixtures with λ = 1.3 results in an efficiency slightly lower than at λ = 1.5, but higher than at λ = 1.8, at low doses of fuel delivered to the prechamber.
Prechamber methane combustion is more beneficial at small fuel doses to PC and at λ = 1.3 and 1.5 in the range up to 30 J of energy in PC. The areas of increased engine efficiency for propane combustion in a two-stage system cannot be clearly identified.
Based on the above relationships, interpolated maps of the indicated engine efficiency fueled by propane and methane to PC were determined (Figure 15). As can be seen from the data presented, there are areas of higher efficiency when burning methane in PC than when burning propane. The combustion of methane in the PC results in higher efficiency for both small and large doses of this fuel fed to the PC. The combustion of small doses of propane in the PC at λ = 1.8 results in combustion efficiency being rapidly reduced. Similar negative engine operating conditions were noted when burning methane (no measuring point).

4.3.3. Analysis of Emission Indexes

During engine operation, the concentrations of carbon monoxide CO, hydrocarbons HC, and nitrogen oxide NO were analyzed, which were then converted into specific emissions relative to the power generated by the engine, and the results are shown in Figure 16, Figure 17 and Figure 18. The main factor affecting emissions is the lambda excess air factor, and the trends obtained are consistent with the results presented in another paper [29].
The specific carbon monoxide CO emissions generated due to incomplete combustion, among other factors, are shown in Figure 16. For charges with an excess air ratio of 1.3, regardless of the amount of fuel delivered to the ignition chamber, lower emissions were generated by injecting propane into the PC. The largest differences of 1 g/kWh were achieved for the minimum energy in the PC. This may be due to more intensive ignition processes of the main charge determined by the flow of charge between chambers when combustion starts in the PC. Subsequently, increasing the charge dilution, i.e., λ = 1.5, reverses the trend of lower CO for propane as the fuel initiating combustion except for the two smallest values of the share of energy delivered to the PC. For ultra-lean charges of λ = 1.8, emissions for the single-fuel mode were more or less constant regardless of the amount of fuel delivered to the PC, which correlates with the stability of engine operation in this area. Using propane for lower fuel doses to the PC where the engine operated unstably resulted in higher emissions, which decreased sequentially as the proportion of the dose to the PC increased.
The next step analyses hydrocarbon emissions from unburned fuel and lubricating oil (Figure 17). Increasing the proportion of air in the mixture promotes increased HC emissions due to the deterioration of the combustion process and the incompletion of the flame in all areas of the combustion chamber. In the case of excess air ratio λ = 1.3 and λ = 1.5, emissions increase as the proportion of fuel to PC increases, i.e., the main charge becomes leaner. In this case, the primary factor determining combustion efficiency throughout the cylinder volume is the lower ignition energy requirements of the main charge rather than the amount of energy supplied to the initial combustion chamber. Increasing the excess air ratio in the leanest area decreases the importance of the fuel dose size to PC, especially for single-fuel operation. Propane supply to PC is better for lean charges, while for ultra-lean charges, single-fuel supply is better.
Nitrogen oxide NO emissions depend mainly on peak temperatures in the cylinder during the combustion process [30]. Dilution of the charge causes a decrease in the mentioned temperature, which leads to a decrease in NO emissions with an increase in the lambda excess air ratio. In the cases analyzed, NO emissions decrease with an increase in the proportion of fuel supplied to the PC. This is due to the dilution of the main charge mostly responsible for the emission of toxic exhaust components. In most cases, better NO emission rates were obtained for the single-fuel mode (Figure 18), corresponding to higher thermal efficiency, i.e., improving the combustion process due to energy indicators.

5. Conclusions

As a result of the experimental work carried out with a single-cylinder engine operating in single-fuel (methane) and dual-fuel methane (MC) + propane (PC) modes, it was found that
  • Feeding the engine in a single-fuel mode methane (MC) + methane (PC) allows better thermodynamic parameters of the combustion process to be obtained in relation to the dual-fuel mode where propane is supplied to the ignition chamber instead of methane.
  • The effect of dividing the fuel dose between the MC and PC chambers has the greatest impact in the case of combustion of mixtures with excess air ratios of 1.3 and 1.5.
The advantages of a single-fuel methane (MC) + methane (PC) system over a dual-fuel methane (MC) + propane (PC) system are as follows:
  • Better stability of engine operation CoV(IMEP) < 3.5% in the range of small doses of fuel fed to the prechamber and at charges with λ = 1.3–1.5.
  • Higher values of indicative mean effective pressure IMEP when burning mixtures with excess air ratio in the range λ = 1.3–1.5; these values are slightly higher when measured in the main chamber than in the prechamber.
  • Higher maximum values of heat released; at the same time, the combustion of minimum doses in the prechamber resulted in maximum values of heat released in relation to the other values of energy supplied to the PC.
  • Better thermodynamic performance of combustion in the prechamber at small doses fed to the PC and at λ = 1.3 and 1.5 in the range up to 30 J. The areas of increased propane combustion efficiency in the two-stage system cannot be clearly identified.
  • Higher value of the engine’s indicated efficiency reaching more than 40% at a small dose of fuel to the prechamber against 39.3% when propane is fed to the ignition chamber.
The positive aspects of burning propane in a prechamber are as follows:
  • Shorter combustion time; the combustion time increases with an increase in λ and with an increase in the dose delivered to the prechamber.
  • Ignitability of the mixture at high λ and low fuel doses (no ignitability when using methane).
  • Reduction in CO and HC emissions when burning leaner loads.

Author Contributions

Conceptualization, I.P. and F.S.; methodology, I.P. and F.S.; software, I.P. and F.S.; validation, I.P. and F.S.; formal analysis, I.P. and F.S.; investigation, I.P. and F.S.; resources, I.P. and F.S.; data curation, I.P. and F.S.; writing—original draft preparation, I.P. and F.S.; writing—review and editing, I.P. and F.S.; visualization, I.P. and F.S.; supervision, I.P. and F.S.; project administration, I.P. and F.S.; funding acquisition, I.P. and F.S. All authors have read and agreed to the published version of the manuscript.

Funding

This research received no external funding.

Data Availability Statement

Not applicable.

Conflicts of Interest

The authors declare no conflict of interest.

References

  1. Gracz, W.; Marcinkowski, D.; Golimowski, W.; Szwajca, F.; Strzelczyk, M.; Wasilewski, J.; Krzaczek, P. Multifaceted comparison efficiency and emission characteristics of multi-fuel power generator fueled by different fuels and biofuels. Energies 2021, 14, 3388. [Google Scholar] [CrossRef]
  2. Davis, G.C.; Krieger, R.B.; Tabaczynski, R.J. Analysis of the Flow and Combustion Processes of a Three-Valve Stratified Charge Engine with a Small Prechamber; SAE Technical Paper; SAE International: Warrendale, PA, USA, 1974. [Google Scholar] [CrossRef]
  3. Adams, T. Torch Ignition for Combustion Control of Lean Mixtures; SAE Technical Paper; SAE International: Warrendale, PA, USA, 1979. [Google Scholar] [CrossRef]
  4. Alvarez, C.E.C.; Couto, G.E.; Roso, V.R.; Thiriet, A.B.; Valle, R.M. A review of prechamber ignition systems as lean combustion technology for SI engines. Appl. Therm. Eng. 2018, 128, 107–120. [Google Scholar] [CrossRef]
  5. Pielecha, I.; Szwajca, F. Lean methane mixtures in turbulent jet ignition combustion system. Energies 2023, 16, 1236. [Google Scholar] [CrossRef]
  6. Zhu, S.; Akehurst, S.; Lewis, A.; Yuan, H. A review of the pre-chamber ignition system applied on future low-carbon spark ignition engines. Renew. Sustain. Energy Rev. 2022, 154, 111872. [Google Scholar] [CrossRef]
  7. Allison, P.M.; de Oliveira, M.; Giusti, A.; Mastorakos, E. Pre-chamber ignition mechanism: Experiments and simulations on turbulent jet flame structure. Fuel 2018, 230, 274–281. [Google Scholar] [CrossRef]
  8. Wu, H.; Wang, L.; Wang, X.; Sun, B.; Zhao, Z.; Lee, C.-F.; Liu, F. The effect of turbulent jet induced by pre-chamber sparkplug on combustion characteristics of hydrogen-air pre-mixture. Int. J. Hydrogen Energy 2018, 43, 8116–8126. [Google Scholar] [CrossRef]
  9. Gholamisheeri, M.; Wichman, I.S.; Toulson, E. A study of the turbulent jet flow field in a methane fueled turbulent jet ignition (TJI) system. Combust. Flame 2017, 183, 194–206. [Google Scholar] [CrossRef]
  10. Liu, Z.; Zhou, L.; Zhong, L.; Wei, H. Enhanced combustion of ammonia engine based on novel air-assisted pre-chamber turbulent jet ignition. Energy Convers. Manag. 2023, 276, 116526. [Google Scholar] [CrossRef]
  11. Onofrio, G.; Napolitano, P.; Tunestål, P.; Beatrice, C. Combustion sensitivity to the nozzle hole size in an active pre-chamber ultra-lean heavy-duty natural gas engine. Energy 2021, 235, 121298. [Google Scholar] [CrossRef]
  12. Zhou, L.; Liu, P.; Zhong, L.; Feng, Z.; Wei, H. Experimental observation of lean flammability limits using turbulent jet ignition with auxiliary hydrogen and methane in pre-chamber. Fuel 2021, 305, 121570. [Google Scholar] [CrossRef]
  13. Bueschke, W.; Szwajca, F.; Wislocki, K. Experimental Study on Ignitability of Lean CNG/Air Mixture in the Multi-Stage Cascade Engine Combustion System; SAE Technical Paper; SAE International: Warrendale, PA, USA, 2020. [Google Scholar] [CrossRef]
  14. Vera-Tudela, W.; Merotto, L.; Balmelli, M.; Soltic, P. Experimental study of the ignition of lean methane/air mixtures using inductive and NRPD ignition systems in the pre-chamber and turbulent jet ignition in the main chamber. Energy Convers. Manag. 2022, 252, 115012. [Google Scholar] [CrossRef]
  15. Arslan, E.; Kahraman, N. Comparison of natural gas and propane addition to combustion air in terms of engine performance in compression ignition engine. Fuel 2022, 312, 122952. [Google Scholar] [CrossRef]
  16. Jeong, S.Y.; Jang, D.; Lee, M.C. Property-based quantitative risk assessment of hydrogen, ammonia, methane, and propane considering explosion, combustion, toxicity, and environmental impacts. J. Energy Storage 2022, 54, 105344. [Google Scholar] [CrossRef]
  17. Li, X.; He, B.-Q.; Zhao, H. Effect of direct injection dimethyl ether on the micro-flame ignited (MFI) hybrid combustion characteristics of an optical gasoline engine at ultra-lean conditions. Fuel Process. Technol. 2020, 203, 106383. [Google Scholar] [CrossRef]
  18. Distaso, E.; Amirante, R.; Cassone, E.; De Palma, P.; Sementa, P.; Tamburrano, P.; Vaglieco, B.M. Analysis of the combustion process in a lean-burning turbulent jet ignition engine fueled with methane. Energy Convers. Manag. 2020, 223, 113257. [Google Scholar] [CrossRef]
  19. Liu, Z.; Zhou, L.; Wei, H. Experimental investigation on the performance of pure ammonia engine based on reactivity controlled turbulent jet ignition. Fuel 2023, 335, 127116. [Google Scholar] [CrossRef]
  20. Vinod, K.N.; Fang, T. Experimental characterization of spark ignited ammonia combustion under elevated oxygen concentrations. Proc. Combust. Inst. 2022. [Google Scholar] [CrossRef]
  21. Zhang, X.; Tian, J.; Cui, Z.; Xiong, S.; Yin, S.; Wang, Q.; Long, W. Visualization study on the effects of pre-chamber jet ignition and methane addition on the combustion characteristics of ammonia/air mixtures. Fuel 2023, 338, 127204. [Google Scholar] [CrossRef]
  22. Liu, Z.; Zhou, L.; Zhong, L.; Wei, H. Reactivity controlled turbulent jet ignition (RCTJI) for ammonia engine. Int. J. Hydrogen Energy 2023, 48, 12519–12522. [Google Scholar] [CrossRef]
  23. Lee, M.C.; Seo, S.B.; Yoon, J.; Kim, M.; Yoon, Y. Experimental study on the effect of N2, CO2, and steam dilution on the combustion performance of H2 and CO synthetic gas in an industrial gas turbine. Fuel 2012, 102, 431–438. [Google Scholar] [CrossRef]
  24. Cheng, Q.; Kaario, O.; Ahmad, Z.; Vuorinen, V.; Larmi, M. Effect of pilot fuel properties on engine performance and combustion stability in a tri-fuel engine powered by premixed methane-hydrogen and diesel pilot. Int. J. Hydrogen Energy 2021, 46, 37469–37486. [Google Scholar] [CrossRef]
  25. Jean, M.; Granier, P.; Leroy, T. Combustion stability control based on cylinder pressure for high efficiency gasoline engines. Energies 2022, 15, 2530. [Google Scholar] [CrossRef]
  26. Heywood, J.B. Internal Combustion Engine Fundamentals; McGraw-Hill: New York, NY, USA, 1988. [Google Scholar]
  27. Batool, S.; Naber, J.D.; Shahbakhti, M. Data-driven modeling and control of cyclic variability of an engine operating in low temperature combustion modes. IFAC-PapersOnLine 2021, 54, 834–839. [Google Scholar] [CrossRef]
  28. Merkisz, J.; Pielecha, J.; Radzimirski, S. New Trends in Emission Control in the European Union; Springer Tracts on Transportation and Traffic; Springer: Cham, Switzerland, 2014; Volume 4. [Google Scholar] [CrossRef]
  29. Lott, P.; Deutschmann, O. Lean-burn natural gas engines: Challenges and concepts for an efficient exhaust gas aftertreatment system. Emiss. Control Sci. Technol. 2020, 7, 1–6. [Google Scholar] [CrossRef]
  30. Li, G.; Long, Y.; Zhang, Z.; Liang, J.; Zhang, X.; Zhang, X.; Wang, Z. Performance and emissions characteristics of a lean-burn marine natural gas engine with the addition of hydrogen-rich reformate. Int. J. Hydrogen Energy 2019, 44, 31544–31556. [Google Scholar] [CrossRef]
Figure 1. Scheme of cylinder head: (a) model of active prechamber; (b) view of main and prechamber; (c) view of intake duct and combustion chamber (main and prechamber).
Energies 16 03608 g001
Figure 2. Test stand layout with a 2-stage combustion system fueled by methane and propane.
Energies 16 03608 g002
Figure 3. An example of the waveform of the recorded signals with the description of the fuels fed to both combustion chambers (start of fuel feeding to both chambers at the angle α = 260 deg bTDC).
Energies 16 03608 g003
Figure 4. In-cylinder (main chamber) pressure curves Pav_MC averaged from 100 cycles of combustion pressure in the cylinder when the prechamber was fueled with methane or propane (methane was always supplied to the main chamber via injector placed in intake duct).
Energies 16 03608 g004
Figure 5. Interpolated maps showing the stability of engine operation represented by the coefficient of variation CoV(IMEP): (a) when burning propane in the prechamber; (b) when burning methane in the prechamber.
Energies 16 03608 g005
Figure 6. Stability of engine operation determined by maximum cylinder pressure Pmx (blue dots): (a) smallest CoV(IMEP) < 1% when burning methane and propane: λ = 1.5 Eqo_PC = 30 J; (b) largest CoV(IMEP) > 10% when burning methane and propane: λ = 1.8 Eqo_PC = 20 J.
Energies 16 03608 g006
Figure 7. Instability of engine operation determined by IMEP for each value of excess air ratio: (a) when burning propane in the prechamber; (b) when burning methane in both chambers (values of the largest IMEP changes are marked in the figure).
Energies 16 03608 g007
Figure 8. Unevenness of engine cycles determined by IMEP maps for each value of excess air ratio and different values of fuel dose energy injected into the prechamber: (a) when burning propane in the prechamber; (b) when burning methane in both chambers.
Energies 16 03608 g008
Figure 9. Inter-chamber flows (Delta_P) and pressure in the prechamber and main chamber during combustion of methane (blue line) and propane (red line): (a) during combustion of fuels with excess air λ = 1.3; (b) during combustion of fuels with excess air λ = 1.5; (c) during combustion of fuels with excess air λ = 1.8.
Energies 16 03608 g009
Figure 10. Conditions of pressure change in the cylinder during the combustion of propane (PC) and methane (MC), as well as combinations of methane (PC) and methane (MC) at different values of energy injected into the prechamber at λ = 1.5 (the most favorable combustion conditions regardless of the fuel initial dose).
Energies 16 03608 g010
Figure 11. Variation in IMEP with respect to energy delivered to the prechamber at different values of excess air ratio λ: (a) variation in IMEP in the main chamber; (b) variation in IMEP in the prechamber.
Energies 16 03608 g011
Figure 12. The heat release path in the cylinder (in the main chamber) with the determination of the minimum dose of fuel injected into the prechamber for both types of fuels: (a) at λ = 1.3; (b) at λ = 1.5; (c) at λ = 1.8.
Energies 16 03608 g012
Figure 13. Thermodynamics of the combustion process: beginning of combustion (AI05), center of combustion (CoC), and end of combustion (AI90) determined for average pressure curves during methane and propane combustion.
Energies 16 03608 g013
Figure 14. Indicated engine efficiency related to the value of energy supplied to the prechamber during the combustion of methane and propane.
Energies 16 03608 g014
Figure 15. Indicated engine efficiency maps related to the energy contained in the fuel dose to the prechamber: (a) propane; (b) methane.
Energies 16 03608 g015
Figure 16. Carbon monoxide emissions at different values of energy supplied to the prechamber: (a) λ = 1.3; (b) λ = 1.5; and (c) λ = 1.8 (the arrows indicate the trend).
Energies 16 03608 g016
Figure 17. Hydrocarbon emissions at different values of energy supplied to the prechamber: (a) λ = 1.3; (b) λ = 1.5; and (c) λ = 1.8 (the arrows indicate the trend).
Energies 16 03608 g017
Figure 18. Nitrogen oxide emissions at different values of energy supplied to the prechamber: (a) λ = 1.3; (b) λ = 1.5; and (c) λ = 1.8 (the arrows indicate the trend).
Energies 16 03608 g018
Table 1. Technical data of the single-cylinder test engine used.
ParameterUnitValue
Engine1-cyl., 4-valve, SI, TJI
Displacement dm30.5107
Bore × strokemm85 × 90
Compression ratio14.5
FuelingPrechamber: EM injector Main chamber EM injector
Prechamber2.35 cm3 (5.93% of Vc)
Air system Naturally aspirated
Table 2. Properties of methane and propane [23,24].
PropertyMethanePropane
Chemical formulaCH4C3H8
Lower flammable limit [%]52.1
Upper flammable limit [%]15.49.5
Flammable range [%]10.47.4
Risk index of explosion [−]2.03.524
Minimum ignition energy [mJ]0.21–0.300.25–0.27
Auto ignition temperature [°C]580480
Stoichiometric air/fuel ratio [−]17.1915.67
Adiabatic flame temperature [°C]19631980
Laminar burning velocity [cm/s]3739–43
Lower heating value [MJ/kg]50.046.35
Disclaimer/Publisher’s Note: The statements, opinions and data contained in all publications are solely those of the individual author(s) and contributor(s) and not of MDPI and/or the editor(s). MDPI and/or the editor(s) disclaim responsibility for any injury to people or property resulting from any ideas, methods, instructions or products referred to in the content.