Review

A Comprehensive Review of Behind-the-Meter Distributed Energy Resources Load Forecasting: Models, Challenges, and Emerging Technologies

by
Aydin Zaboli
,
Swetha Rani Kasimalla
,
Kuchan Park
,
Younggi Hong
and
Junho Hong
*
Department of Electrical and Computer Engineering, University of Michigan-Dearborn, Dearborn, MI 48128, USA
*
Author to whom correspondence should be addressed.
Energies 2024, 17(11), 2534; https://doi.org/10.3390/en17112534
Submission received: 5 April 2024 / Revised: 10 May 2024 / Accepted: 21 May 2024 / Published: 24 May 2024
(This article belongs to the Special Issue Blockchain, IoT and Smart Grids Challenges for Energy II)

Abstract

:
Behind the meter (BTM) distributed energy resources (DERs), such as photovoltaic (PV) systems, battery energy storage systems (BESSs), and electric vehicle (EV) charging infrastructures, have experienced significant growth in residential locations. Accurate load forecasting is crucial for the efficient operation and management of these resources. This paper presents a comprehensive survey of the state-of-the-art technologies and models employed in the load forecasting process of BTM DERs in recent years. The review covers a wide range of models, from traditional approaches to machine learning (ML) algorithms, discussing their applicability. A rigorous validation process is essential to ensure the model’s precision and reliability. Cross-validation techniques can be utilized to reduce overfitting risks, while using multiple evaluation metrics offers a comprehensive assessment of the model’s predictive capabilities. Comparing the model’s predictions with real-world data helps identify areas for improvement and further refinement. Additionally, the U.S. Energy Information Administration (EIA) has recently announced its plan to collect electricity consumption data from identified U.S.-based crypto mining companies, which can exhibit abnormal energy consumption patterns due to rapid fluctuations. Hence, some real-world case studies have been presented that focus on irregular energy consumption patterns in residential buildings equipped with BTM DERs. These abnormal activities underscore the importance of implementing robust anomaly detection techniques to identify and address such deviations from typical energy usage profiles. Thus, our proposed framework, presented in residential buildings equipped with BTM DERs, considering smart meters (SMs). Finally, a thorough exploration of potential challenges and emerging models based on artificial intelligence (AI) and large language models (LLMs) is suggested as a promising approach.

1. Introduction

1.1. Background

The evolution of smart grid technologies has necessitated the comprehensive management of both the generation and the demand aspects for effective monitoring. The appearance of complex methods for energy generation has created interest in the adoption of microgrids (MGs) as localized generation assets within residential buildings. To control and mitigate demand-side requirements, it is critical to initially understand the features of demand-side loads. The classification of an energy system’s relationship with a smart measurement, as either BTM or front of meter (FOM), is pivotal [1,2]. BTM systems supply electricity directly to on-site locations, bypassing traditional metering, whereas FOM systems deliver energy to external locations, necessitating metering before reaching consumers. This process is essential for the utilities in FOM systems to monitor energy consumption accurately, thereby enabling the prediction of consumption pattern shifts and the identification of potential privacy or cybersecurity threats to residential users [3,4].
Power network load models have been a focus of research for decades. The overall loads in the system, ranging from industries to small enterprises, energy consumption of EVs, residential electricity demand, and other types of electricity usage in the grid are all incorporated into these models. Throughout this time, it has been widely assumed that residential load demand does not differ significantly among several houses, regardless of the social and economic conditions of their residents [5,6]. The expanding integration of DERs within electrical distribution frameworks has compelled utility providers to enhance their systemic comprehension for the application of load forecasting strategies in BTM configurations [7]. Envision a residential building equipped with a PV system, a BESS, and an EV charging infrastructure as a model of the BTM system. In such scenarios, these installations exhibit diverse operational modalities wherein the electricity generated remains hidden from the utility providers, bypassing conventional metering protocols [8]. This characteristic is similarly observed in BESS units during discharge operations, as they store energy for domestic appliances and the EV, notwithstanding its grid connectivity. Excess electricity generated by DERs may be conserved within a BESS for localized utilization as necessary. The adoption of a BESS potentially augments the direct consumption of energy derived from PV systems, particularly in cases where the injecting of electricity to the grid is not compensated. Technicians responsible for distribution systems might encounter challenges in managing raised levels of variable generation originating from DERs, notably in locales with a significant prevalence of rooftop PV installations. Thus, the evaluation of residential PV, BESS, and EV charging systems presents a complex challenge for utility entities in monitoring and quantifying electricity consumption and generation [9,10].

1.2. Problem Statement

The inherent intermittency, variability, and unpredictability of DERs poses significant challenges, thereby decreasing the grid’s flexibility. It is imperative to devise innovative methodologies for the integration of intermittent DERs into the electrical system, as such integration substantially enhances the system’s reliability and stability. Accurately forecasting the fluctuating power output from the ever-increasing non-dispatchable sources is essential. Traditional approaches to obtaining typical load profiles often involve averaging the energy consumption of residential, commercial, and industrial consumers. However, some ML models neglect various socioeconomic factors and meteorological conditions, leading to compromised accuracy in the load profiles generated [5,11,12]. Figure 1 demonstrates the general connections between different parts, from SMs and ML methods to the load forecasting process.
Traditional and statistical models are employed to forecast load profiles in different locations along with ML models. However, the growth in BTM DERs in residential/commercial buildings has made the load forecasting process challenging. This is because different steps are required to analyze datasets for various DERs, and these datasets are not publicly available. Also, any anomaly or abnormal activities (e.g., marijuana growing) on the customer side can make the forecasting process more sophisticated [13,14]. The next section provides literature surveys on load forecasting procedures, considering different DERs, even though the main focus has been on PV generation, according to previous research. It is helpful for utilities to consider a combination of various DERs in households, to have a good estimation of energy consumption according to SM data. Also, this combination can make the application of the load forecasting process relatively close to real-world scenarios.

1.3. Contributions

According to our best knowledge, there has been no review published that covers all the possible single and hybrid methods based on different load forecasting techniques for BTM DERs that include PVs, BESSs, and EV charging infrastructures in residential households. Also, there are no extensive literature surveys on applications at the level of the distribution grid for comprehensive analysis, including monitoring and operation, forecasting, predictive maintenance, flexible planning, interaction, and the relationship among them, considering abnormal activities. Hence, the main contributions of this review paper are listed as follows:
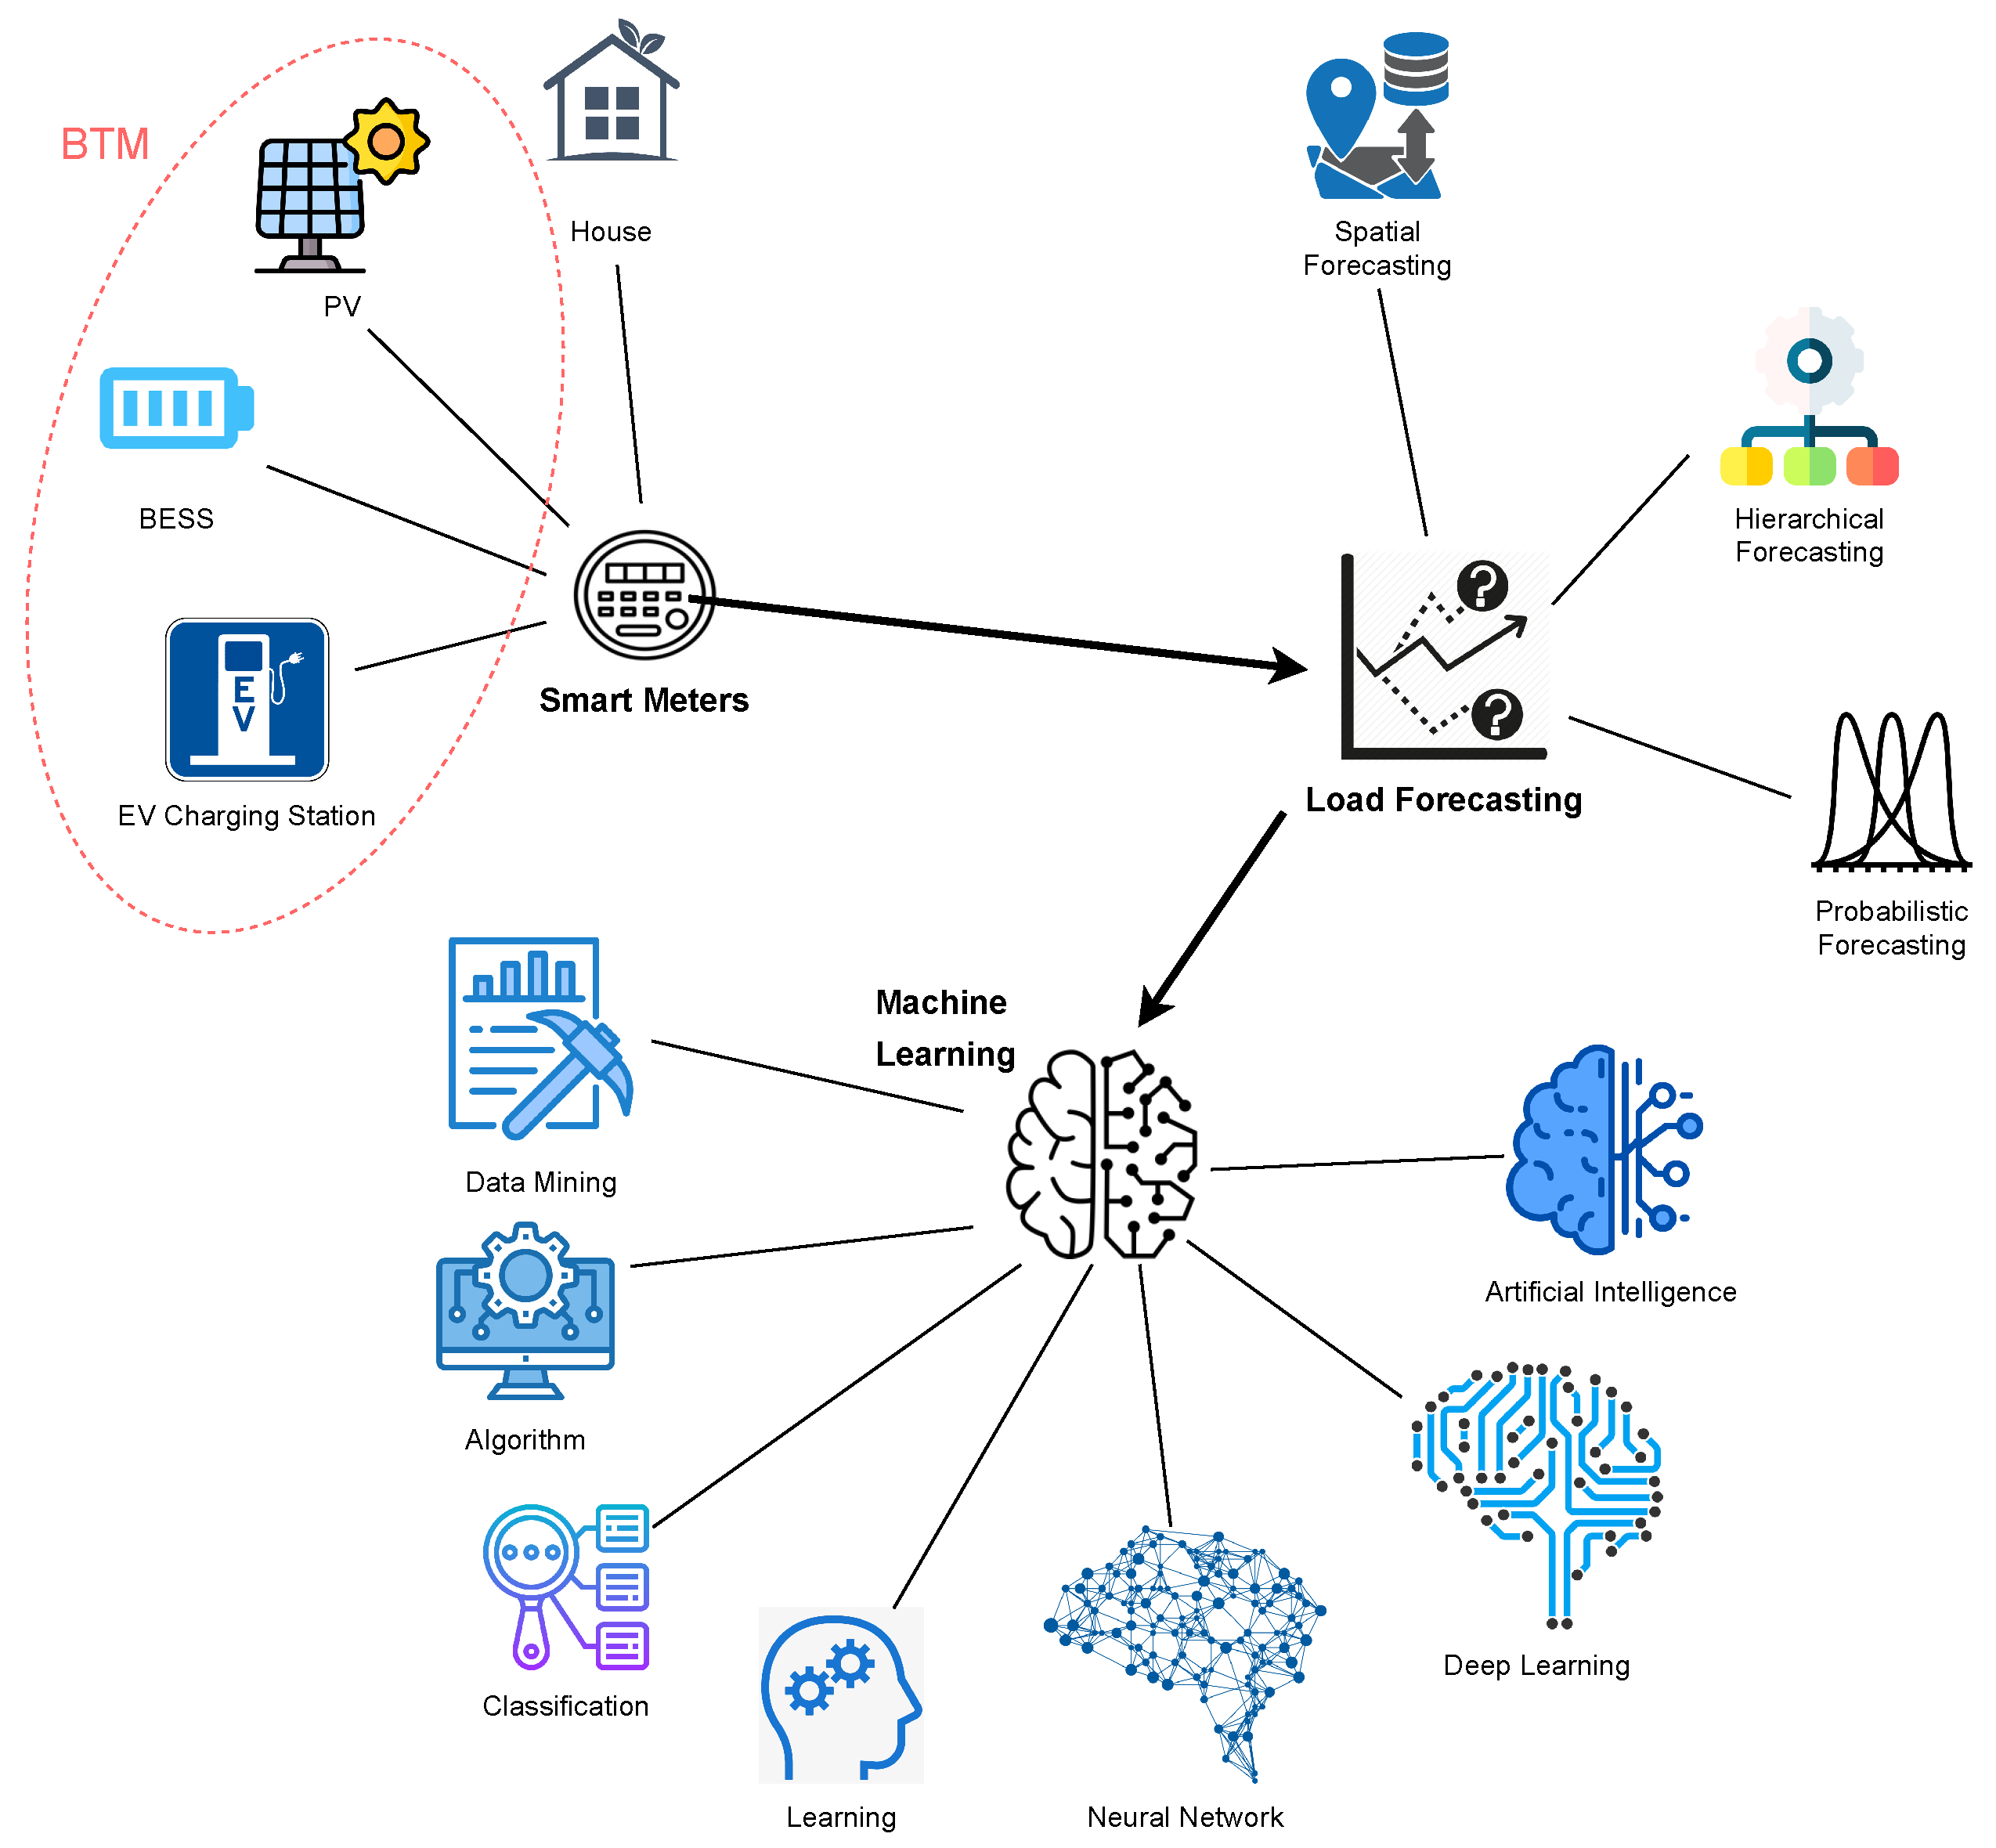
  • A comprehensive survey on how the load forecasting process of BTM DERs in residential locations regarding different combinations of PVs, BESSs, and EV charging infrastructures has been provided with state-of-the-art technologies in recent years.
  • This review encompasses a wide range of models employed in load forecasting processes, showcasing a broad spectrum, from conventional approaches to state-of-the-art ML algorithms. This study delves into the applicability of each model, providing a thorough understanding of their capabilities and limitations. Furthermore, a systematic methodology for model selection and optimization has been introduced, considering the computational effort, and offering a structured approach to identifying the most suitable forecasting techniques for specific use cases.
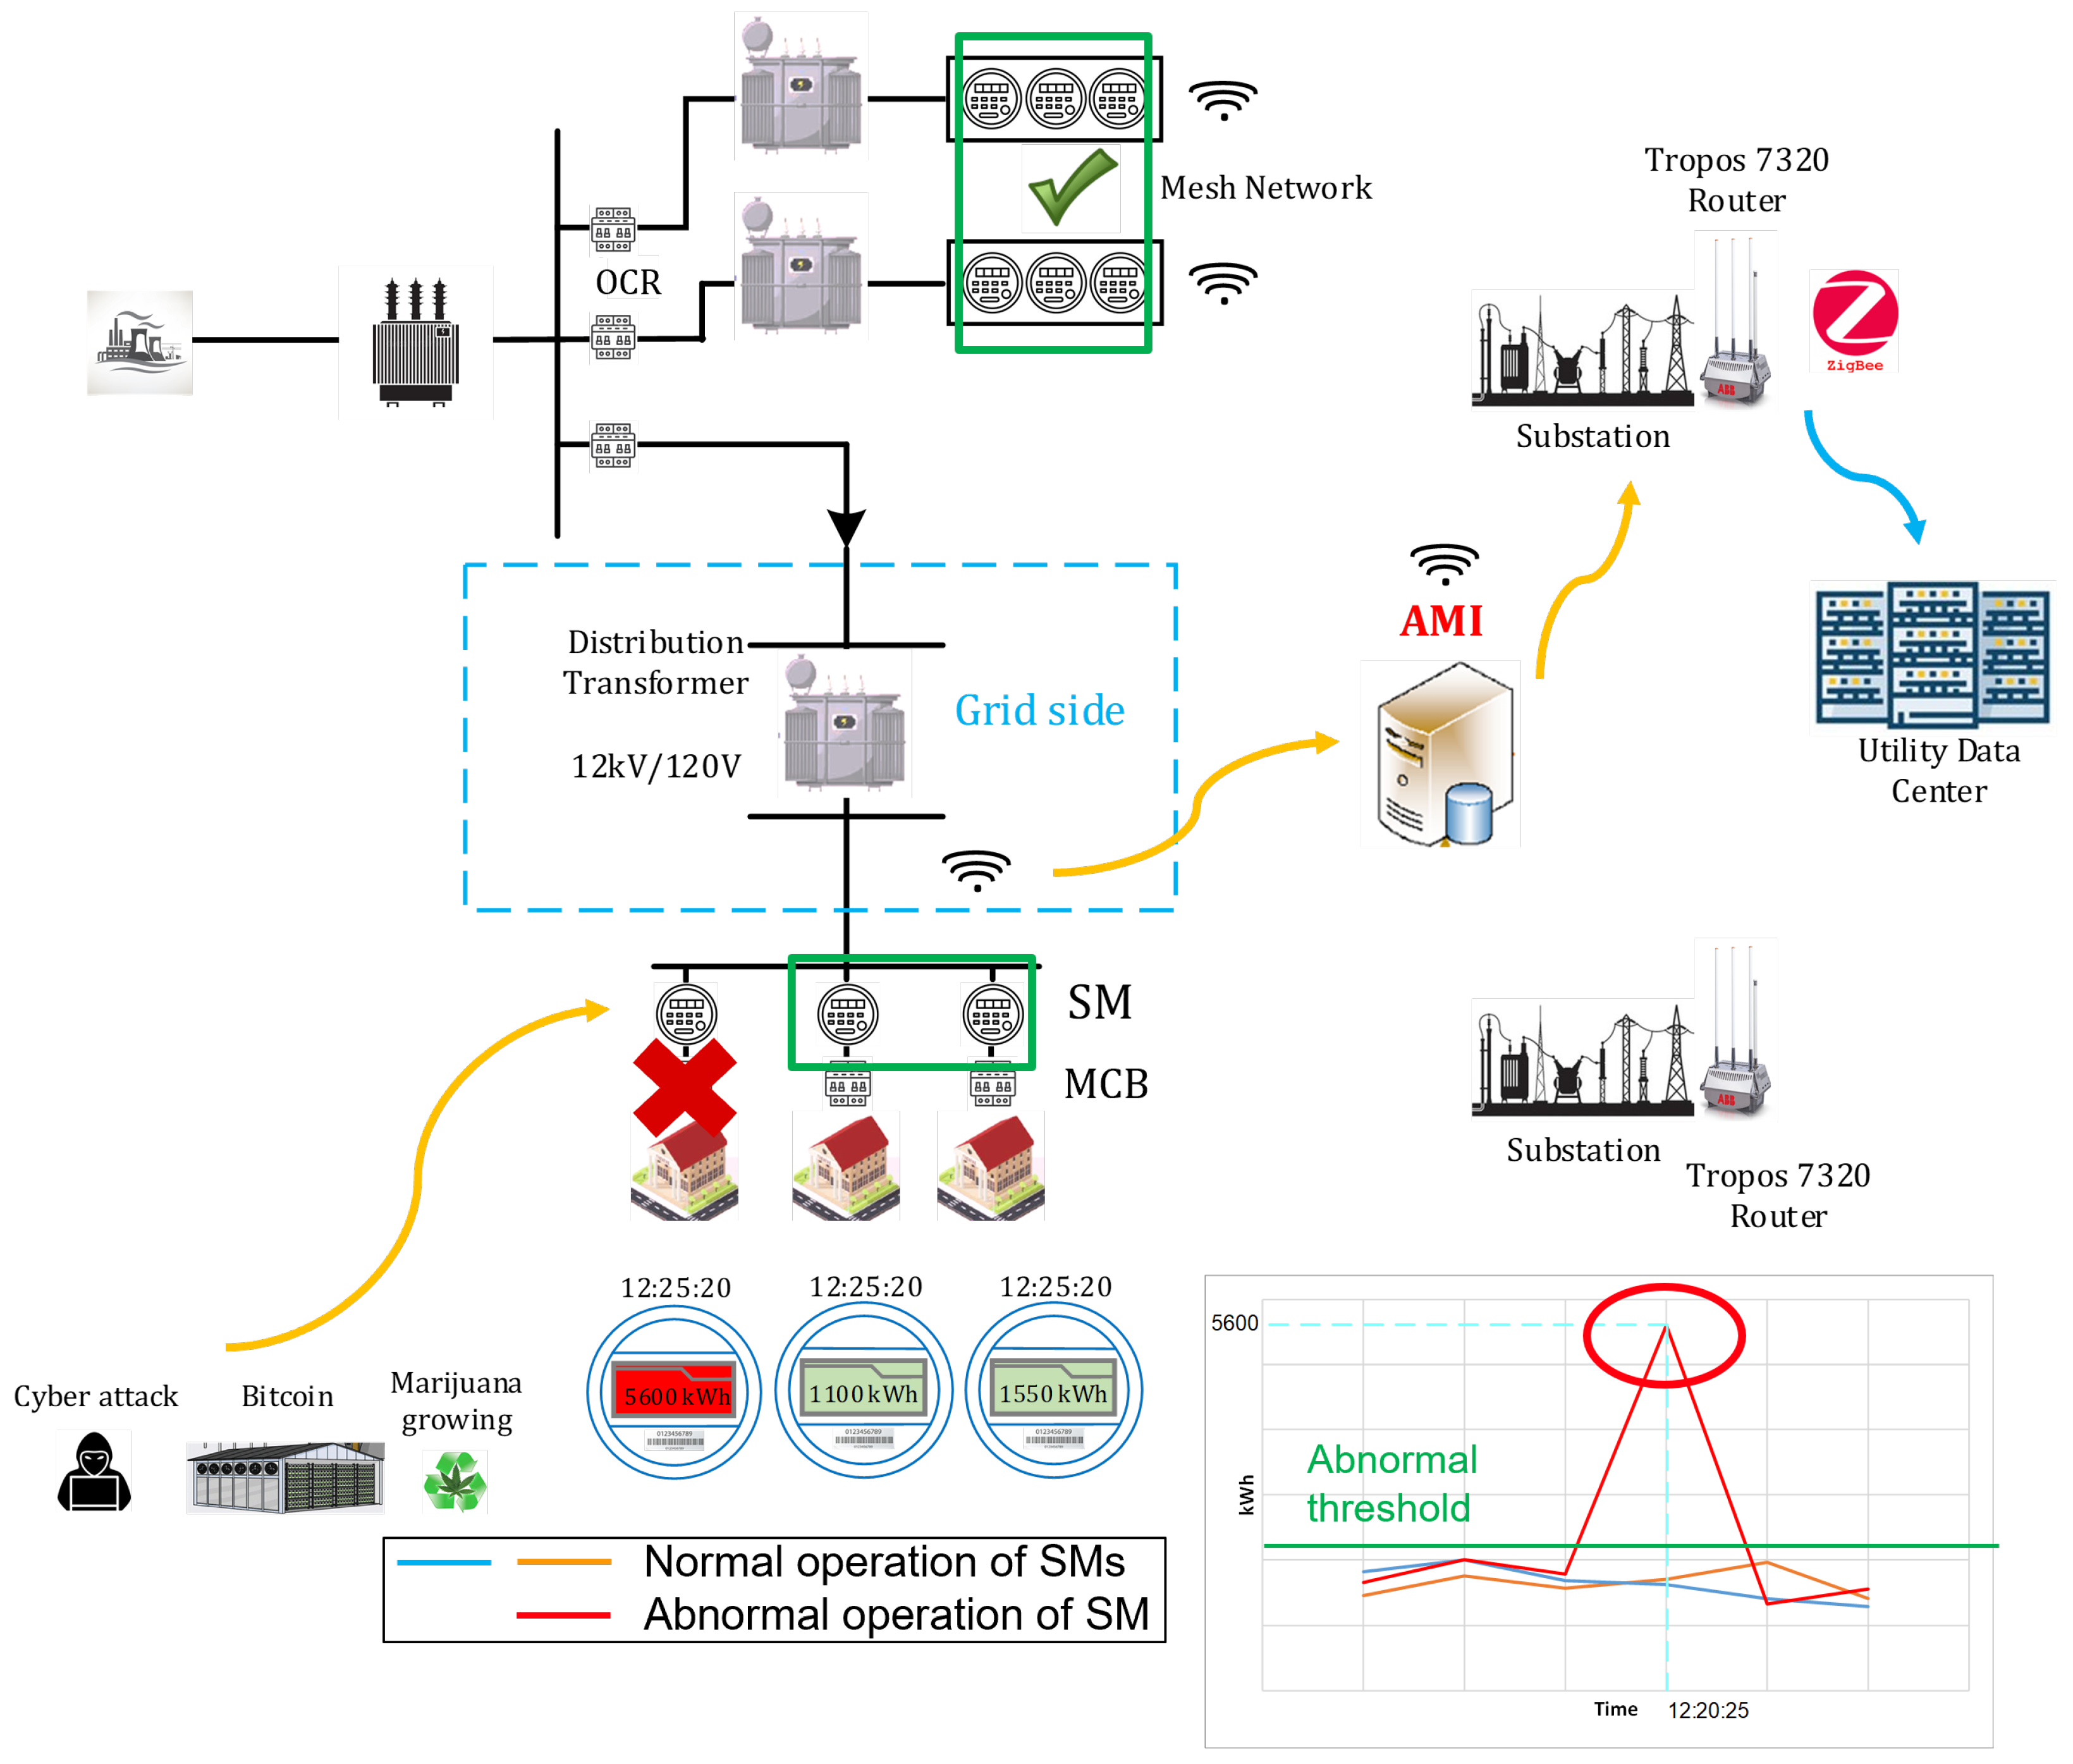
  • Some case studies considering abnormal activities (e.g., Bitcoin mining) in residential households with BTM DERs are considered for the first time as potential proposed scenarios that make the anomaly process challenging. These attacks/anomalies can also occur in digital substations through communication messages [15] that are in a loop with residential/commercial locations. A proposed conceptual framework for anomaly detection has been introduced to elucidate the pivotal nature of this process. An LLM-based anomaly detection can be considered as a new methodology to handle this process with less effort and with acceptable accuracy in terms of performance evaluation metrics. Moreover, an extensive analysis of the potential challenges associated with BTM DERs and load forecasting algorithms has been initially conducted, providing valuable insights for future research and development.

1.4. Paper Structure

The rest of this paper is organized as follows: Section 2 describes the literature surveys on the load forecasting process and BTM challenges. A representation of the BTM operation, considering different DERs, is discussed in Section 3. Different load forecasting models, from traditional methods to ML models, as well as model selection and optimization and computational effort in the load forecasting process are presented in Section 4. Case studies in BTM load forecasting applications along with potential abnormal activities in residential buildings are noted in Section 5. Section 6 explains the potential challenges and future models that can be considered. Finally, the paper is concluded in Section 7.

2. Related Work on Load Forecasting

In the domain of smart grid operations, forecasting energy consumption is vital, facilitating effective management of demand, load planning, and optimization of grid operations [16]. Therefore, to fully leverage the potential of an MG, an accurate load forecasting process becomes imperative. This need stems from both consumer objectives to minimize consumption and from grid operator goals to enhance decision making and manage ESSs efficiently [17]. This section delves into the extensive research and efforts aimed at addressing the diverse applications of ML algorithms, seeking to overcome the associated challenges. Table 1 provides an overview of assorted strategies and their corresponding challenges across different applications, further enriching understanding of this critical aspect of MG management.
Li et al. [18] implemented a two-stream convolutional network to capture spatial representations, and they devised a load identification model aimed at distinguishing between low-power and multi-state appliances. By integrating multiple feature extractions from the current signal across time and frequency domains they sought to enhance load identification accuracy. However, the inherent variability in electric signals presented a significant challenge to achieving precise load differentiation. In a closely related application, Du et al. [19] introduced a finite state machine (FSM) representation method: this technique can extract RMS current and time values associated with each state while also identifying critical states and recurring patterns. However, these repeating patterns may not be identical, and the duration between their occurrences changes. Additionally, it does not provide the overall duration of operation in different modes over specific periods, as this method solely relies on power consumption data. Akarslan et al. [20] made a significant contribution by addressing the challenge of selecting features and classifiers, especially considering the high computational complexity of ML techniques, which deteriorates with an increasing number of inputs. In their approach, they integrated the ReliefF feature selection method with classifiers for load identification. Furthermore, they conducted a comparison between the Elman and radial basis function (RBF) classifiers. However, it is important to note that the effectiveness of these features may vary depending on the dataset used. Wang et al. developed an adaptable automatic feature extraction approach to characterizing consumers’ socio-demographic details. They also conducted a comparison between various ML techniques, including principle component analysis (PCA), sparse coding, and sparse auto-encoder. However, privacy implications arising from SM data influenced the granularity and duration of the data. Furthermore, there is a lack of detailed investigation regarding the integration of convolutional neural networks (CNNs) with additional feature extraction methods [21]. Khodayar et al. [22] put forth a deep learning (DL) model aimed at extracting resilient spatio-temporal features for BTM loads as PV generation. This innovative approach represented a significant step forward in extracting intricate spatial and temporal features from net load datasets. However, it is important to note the inherent variability and uncertainty in solar generation, as well as the presence of comparable values in neighboring regions within the spatial domain.
To extract anomalous consumption pattern data from SMs, Opera et al. [23] devised a spectral residual CNN algorithm. This network is designed to detect anomalies in time-series data sequences. Additionally, they crafted two-class boosted decision tree and Fisher linear discrimination algorithms on pre-processed datasets. However, this algorithm has not been tested on real-time datasets yet. There is a significant risk of the algorithms mistakenly classifying labeled customers as suspicious, and they may also struggle to identify consumers who alter with electricity when SM data are unlabeled. Yuan et al. [24] suggested a graph-based clustering technique to identify load patterns and established a strong correlation between the coincident monthly peak contribution (CMPC) and monthly energy consumption under identical customer load profiles. However, their study did not explore the potential of enhancing real-time distribution system monitoring through SM data analytics. Additionally, it did not address the impact of uncoordinated charging of EVs on distribution grids.
A novel hybrid ML model, known as group support vector regression (GSVR), was introduced to forecast the cooling and heating (C&H) load in residential buildings [25]. This model rigorously analyzed various methodologies, data types, and performance evaluation metrics relevant to C&H load forecasting, based on technical building specifications, without relying on meteorological variables. It achieved the highest R-value and the lowest error metrics, indicating good accuracy. Nevertheless, constructing a precise hybrid model for district heating network (DHN) forecasting is challenging due to sparse data and the need for proper hyperparameter tuning. Incorporating boosting algorithms in DHN forecasting is a crucial strategy for enhancing predictive performance, which was addressed in [26]: in this paper, the FB-Prophet model was refined through the inclusion of positional encoding layers, while the LightGBM model underwent tuning via different hyperparameter optimization methods. However, the algorithm prioritized minimizing the fitting error as the criterion for selecting optimal parameters, which led to frequent overfitting. Furthermore, the optimal parameters exhibited a degree of randomness. Consequently, the predictive results exhibited a significant degree of instability. These challenges were properly tackled in [27] by proposing a novel dynamic fractional-order discrete gray model (DFDGM) for the load forecasting process of renewable energy capacity in China. Generally, the practicality of these hybrid models is controversial in the forecasting of C&H loads. A cutting-edge home energy management system (HEMS) for battery optimization has been introduced, seamlessly integrating deep reinforcement learning (DRL) with load forecasting techniques based on artificial neural networks (ANNs) [28]. This innovative approach encompasses the holistic management of grid-connected sources and BTM DERs, enabling the implementation of intricate energy management strategies. These advanced strategies hold the potential to not only positively impact bill reduction but also to optimize comfort levels and maximize self-sufficiency within the residential energy ecosystem. A groundbreaking rule-based operational approach, called the forecasting and flexibility based (FFB) strategy, has been introduced for the singular residential PV–battery–flexible load (PV–battery–FL) system [29]. This strategy leverages the predictive insights derived from PV generation and inflexible load forecasting, while incorporating the inherent flexibility offered by batteries and residential loads. Furthermore, an extensive evaluation framework has been meticulously crafted to thoroughly assess the performance of this system. This comprehensive assessment takes into account a wide array of crucial aspects, including economic viability, environmental sustainability, PV self-consumption optimization, zero energy potential, and the profound impacts imposed on the utility grid infrastructure.
Moreover, non-intrusive load monitoring (NILM) models have made significant contributions to the load forecasting process, particularly in the context of BTM DERs. These techniques enable the disaggregation of total household energy consumption into individual appliance-level consumption, providing detailed insights into energy usage patterns. A DER management system based on NILM for residential customers was introduced in [30]. The NILM methodology identified individual appliance consumption patterns, which were subsequently incorporated into DER management strategies to optimize energy utilization and enhance load forecasting precision. Shi et al. [31] introduced an adaptive scaling recurrence plot with the Swin Transformer for NILM, improving the accuracy of load forecasting in both household and industrial buildings. A NILM detailed consumption analysis helped in implementing effective demand response (DR) programs by identifying high-demand appliances and their usage patterns. Azad et al. [32] suggested a DL model using transformers for NILM to enhance energy consumption pattern recognition, which showed superior performance on various datasets. Hence, NILM techniques offer detailed appliance-specific consumption data, enabling a refinement of energy management strategies and the accuracy of forecasting models.
Table 1. A literature review of the load forecasting process in smart grids.
Ref.ApplicationContributionsConstrains/Challenges
Li et al. [18]- A fusion of multiple features extracted from current signals across time and frequency domains.- Implementation of a two-stream convolution network to acquire spatial representation.
- A load identification model designed to distinguish between low power and multi-state appliances.
- The inherent variability of electrical signals presents challenges in the precise identification of loads.
Hong et al. [33]- A short-term forecasting process of electricity usage for residential users.- A framework for short-term residential load forecasting.
- A proposed approach utilizing deep neural networks (DNN) and iterative ResBlocks to capture the correlations among various electricity consumption behaviors.
- The dynamic and stochastic nature of consumption behavior, driven by variability in daily activities, presents significant challenges for load forecasting.
Wang et al. [21]- Delineating socio-demographic details regarding the consumers.- A flexible automatic feature extraction method based on DL techniques is utilized to learn features from various datasets.
- A comparison of cutting-edge and advanced ML techniques, encompassing PCA, sparse coding, and sparse auto-encoder.
- The privacy implications of SM data can be influenced by both the granularity and duration of the data.
- Enhanced identification accuracy by integrating CNN with additional feature extraction methods.
Khodayar et al. [22]- A forecasting framework for analyzing BTM load patterns and PV generation.- A unique spatio-temporal graph auto-encoder (ST-GAE) was developed to extract intricate spatial and temporal features from the net load dataset.
- Used a DL model to extract robust spatio-temporal features for various applications in power systems.
- Voltage limit breaches, voltage profile fluctuations, reverse power flow, and malfunctioning protection devices are common issues encountered in distribution networks.
- Due to the complex interplay of spatial and temporal variability, and to the uncertainties inherent in solar generation, meticulous analysis of comparable regional data is essential for reliable prediction.
Du et al. [19]- Extraction of features.
- An identification of loads.
- The proposed FSM representation offers a powerful analytical framework, enabling the extraction of RMS current and time values associated with individual states. The technique also allows for identification of critical states and the detection of patterns that recur within the dataset.- Repeating patterns may not be identical and the duration between their occurrences varies.
- Fails to offer overall duration of operation in different modes over a specific period.
- These methods solely rely on power consumption data.
Akarslan et al. [20]- Selecting features and a classifier.- A new approach is introduced, which integrates a feature selection method (ReliefF) with classifiers for load identification.
- A comparison is made between the performances of two classifiers, Elman and RBF.
- ML techniques exhibit high computational complexity, which is aggravated by the increasing number of inputs.
- The uniqueness of the features utilized may vary depending on the dataset employed.
Oprea et al. [23]- Examine SM data to identify reading inaccuracies, abnormal activity, malfunctions, cyber threats, and tampering with meters.- Changes within time-series data streams are identified through the combined application of a spectral residual CNN (SR-CNN) and a model designed for anomaly detection.
- A two-class boosted decision tree and Fisher linear discriminant analysis are employed on pre-processed datasets.
- The algorithm may erroneously classify consumers as suspicious and is also unable to determine those consumers who engage in electricity theft when the real-time data from SMs are unlabeled.

3. An Illustration of Behind-the-Meter Operations in Distribution Networks

A distribution network operates with various types of interconnected DERs. The impact of BTM DERs includes dependency reduction on centralized generation, alleviating transmission constraints, and enhancing grid reliability. Furthermore, DERs can enhance grid resilience against outages and natural disasters. The strategic implementation and management of DERs can play a fundamental role in alleviating grid congestion by decreasing peak demand and enhancing the optimization of energy distribution within the network. The operation of BTM DERs facilitates local energy production, facilitating the integration of renewable energy sources, leading to reduced transmission losses and improved energy penetration levels [34]. This integration poses challenges related to voltage regulation, power quality, and grid stability, necessitating advanced control and communication systems. Economic viability, tariff structures, and regulatory frameworks significantly influence the adoption of BTM DERs. A cost-benefit analysis and innovative business models are essential to fully harness the potential of BTM operation. Policymakers need to develop supportive regulations and incentives to encourage the deployment of DERs. Regional and sector-specific variations in the effectiveness of load forecasting methods can arise due to several factors. The presence of legal marijuana growing in residential buildings can introduce unique challenges for load forecasting in Michigan, USA. These growth operations often have high energy demands for lighting, ventilation, and temperature control, which can create distinct consumption patterns compared to normal residential usage. As a result, forecasting methods that perform well in other residential settings may require adaptations or specialized models to accurately predict the load in areas with a higher prevalence of marijuana-growing facilities. Also, urban areas may have higher adoption rates of certain DERs compared to rural regions, leading to variations in the effectiveness of load forecasting methods. Additionally, the presence of specific industries or commercial activities in certain areas can influence the load profiles and the applicability of forecasting techniques. To address these regional and sector-specific variations, it is crucial to develop and validate load forecasting models using data that are representative of the specific context. This may involve incorporating additional features or variables that capture the unique characteristics of the region or sector, such as the prevalence of marijuana-growing operations or the penetration rates of specific DERs. Considering regulatory frameworks, infrastructure investments, and consumer behavior patterns, the legal status of marijuana growing in residential buildings is a relevant regulatory factor. The presence of these facilities can introduce additional complexities in load forecasting, as they may not be explicitly reported to utilities. Regulatory requirements for monitoring and reporting energy consumption in these facilities can impact the availability and quality of data. Furthermore, the level of infrastructure investment can vary across different regions or utilities in Michigan, affecting the applicability of certain forecasting methods. Areas with older or less advanced metering systems may have limitations, in terms of data resolution and availability, requiring alternative approaches or the use of aggregated data. Consumer behavior patterns, including the adoption of energy-efficient appliances, participation in DR programs, and the utilization of DERs, can also influence the applicability. In regions with higher levels of consumer engagement and awareness about energy consumption, load forecasting models may need to incorporate additional variables or techniques to capture the impact of these behaviors. Engaging with stakeholders, including regulatory bodies, utilities, and consumer groups, can provide valuable insights into specific contexts and help in tailoring forecasting approaches [35,36]. Simplified connection processes and equitable compensation mechanisms are vital in promoting DERs. Thus, the integration of BTM DERs holds immense potential to transform distribution networks into more robust, efficient, and sustainable systems [37]. By addressing technical challenges, understanding economic opportunities, and implementing policies, the adoption of BTM DERs can significantly contribute to the advancement of modern power-distribution systems. Figure 2 illustrates the components of FOM and BTM systems.
The FOM system typically includes large-scale generators and energy storage facilities. For instance, FOM encompasses utility-scale PV farms, solar power plants, wind farms, hydropower plants, natural gas power plants, large-scale ESSs, grid-management systems, and so on. On the other hand, the electrical energy generated or stored in BTM systems is mainly consumed by the residential loads or building itself. Therefore, economic effects can be expected by lowering electricity bills simply by reducing the power that must be purchased from the utility. Additionally, if there is surplus power excluding consumption power among the energy generated in the BTM system, additional revenue or energy credits can be provided to individual customers by selling it back to the utility. Elements that can make up these BTM systems include PV systems, BESSs, wind turbines, combined heat and power (CHP) systems, EV charging stations, energy-management systems (EMS), fuel cells, MGs, geothermal systems, and DR programs. The selection and specification of the elements that make up a BTM vary depending on the user’s conditions, including economic capabilities, geographical location, and available space. However, regardless of these factors, a BTM system ultimately aims for an efficient system that can contribute to the energy industry of the future by optimizing energy generation and consumption, reducing costs, supporting utilities, and using energy sources that can be sustainable [5,38].
In particular, a representation of the BTM system based on three households with different combinations of DERs for the load forecasting process has been demonstrated in Figure 3.
The power received from the grid system is stepped down through a transformer to 120 V, which can be used by consumers. A utility meter is employed in this location to measure voltage and current at the boundary between the customer and the grid. Three residential loads behind the utility meters are installed for the suggested system. Each load has a combination of different DERs (e.g., Resident #1 has a rooftop PV system and a BESS installed). The data structure used for load forecasting is also specified to show different features in households. These data are in a time-series format with a 1 min period. The voltage V T r and current I T r measured from the utility meters in the smart transformer and the currents I h 1 , I h 2 , and  I h 3 are acquired by SMs installed in each residence as required. Moreover, the operating status of each DER in the residences is utilized using binary values. Each residence has an SM to measure energy consumption from the customer. Traditional meters have been slowly replaced and have more than tripled in 10 years. Currently, SMs have become widespread, accounting for 93 % , and the emergence of DERs allows utility companies and consumers to interact in a changing power-distribution structure [39]. This is a key component of the advanced metering infrastructure (AMI) system and provides accurate energy consumption data. Thus, contrary to typical analog meters that require manual readings, the AMI system can automatically monitor energy usage on the consumer side. Particularly, in the case of SMs, the voltage and current values in the circuit are measured and multiplied to calculate and display power consumption. Measurements are usually communicated to the utility company using one of the communication methods including radio frequency (RF) signals, cellular networks, broadband networks, WiFi, Zigbee, or power line communications (PLCs). The utility companies use the measured data to perform several roles. Firstly, unlike existing meter readings that used estimations, more accurate billing is possible based on actual usage. Secondly, it helps utility companies to better assess and manage demand on the systems. By analyzing consumption patterns, peak-demand times can be more accurately identified and incentives can be provided to customers using DR policies. Third, it enables optimized grid management by utilizing measurement data. By optimizing energy resource distribution, power outages can be predicted and prevented, and energy sources on the consumer side can be monitored and managed effectively. Therefore, when a problem occurs in the power system, it can be quickly resolved without a technician visiting the location, thereby reducing consumer inconvenience. In addition, it provides data that are easily accessible to customers through mobile apps or online portals, encouraging bi-directional communication between utilities and consumers. It provides customer-participation functions, such as allowing customers to check their data in real time. From the consumer’s perspective, this integrates SMs with smart home technologies, allowing them to automate and optimize their residence’s energy usage. For example, by adjusting the settings of the heating and cooling system based on real-time electricity price information, a comfortable indoor temperature and expected economic savings can be maintained simultaneously [5,6,40].
However, despite these advantages, challenges facing BTM systems should be regarded. The first issue could be preserving the privacy of users’ information. Since BTM systems collect detailed energy usage data and transmit it via communication protocols, this can expose sensitive information about consumers’ preferences. It also leads to cybersecurity issues and can harm the integrity of the grid, causing service interruptions or even developing into billing fraud. This is one of the factors that can cause consumers’ repulsion. Hence, many utilities have recently focused on making up security systems. Additionally, a high installation cost is another challenge. The installation of a BTM DER requires high initial costs because it requires replacing existing meters with SMs and upgrading the grid’s communication and infrastructure equipment. However, from a long-term perspective, the advantages and possibilities of the BTM systems are expected to outweigh the initial construction costs. Moreover, interoperability and standardization must be strengthened so that all equipment and systems can interact effectively. An appropriate standardization is needed to achieve unified connection with other MG components [41,42].

4. Load Forecasting Models

4.1. Introduction

Load forecasting within the distribution network entails the prediction of electricity demand across an extensive array of time-series data at various levels and locations within the network. This process is crucial for the operational efficiency and planning of future smart grids, which necessitate the forecasting of electrical demand at thousands of measurement points. The inherent complexity and computational demands of current forecasting methodologies are granted for such large-scale applications. This challenge underscores the need for innovative research in load forecasting models that can efficiently scale with the huge data, adapt to the diverse statistical characteristics of time-series load, and deliver precise forecasts for substantial datasets [43].
To address the limitations of traditional forecasting approaches, this paper examines the development and application of advanced load forecasting models that are designed to perform optimally on a global scale. By focusing on global time-series modeling, several solutions are explored that not only involve the computational inefficiencies of conventional models but also enhance the generalizability and reliability of load predictions across time-series datasets [44,45]. This paper highlights the significance of creating scalable and robust models that can accommodate the evolving demands and complexities of modern smart grid systems, thereby enabling more precise and dependable load forecasting methods. A detailed load forecasting procedure for residential households with BTM DERs regarding historical time-series data for PV generation, BESS charge/discharge, EV charging, and grid consumption is represented in Algorithm 1.
Firstly, this algorithm pre-processes the data, handling missing values, outliers, and normalizing the features. Feature engineering techniques are applied to create informative features (e.g., lagged values and moving averages). The data are then transformed using appropriate methods (e.g., log or Box–Cox transformations) and split into training and testing sets. Secondly, the algorithm initializes the model parameters and selects a suitable forecasting model (e.g., LSTM, CNN, or Transformer). For each household, the model is trained using an optimization algorithm (e.g., Adam) for a specified number of epochs. The best model parameters are selected based on the lowest training error. The trained model is used to generate forecasts for the testing set, and prediction intervals are calculated at a given confidence level α . Evaluation metrics are computed to assess the model’s performance. Finally, the model is updated with the best parameters found across all houses. This algorithm provides a more detailed and mathematically rigorous approach to load forecasting for residential households with BTM DERs, considering data pre-processing, feature engineering, model selection, training, prediction intervals, and model updating [46].
Algorithm 1 A Load Forecasting Process for Residential Households Considering BTM DERs.
Require: 
Historical time-series data for PV generation P V ( t ) , BESS charge/discharge B E S S ( t ) , EV charging data E V ( t ) , and Grid consumption G r i d ( t )
Require: 
Forecast horizon H
Require: 
Number of households N
Require: 
Confidence level α for prediction intervals
Ensure: 
Predicted load values Y ( t ) f o r e c a s t for each household
Ensure: 
Updated model parameters θ u p d a t e d
Ensure: 
Prediction intervals P I ( t )
1:
D ( t ) CollectData ( P V ( t ) , B E S S ( t ) , E V ( t ) , G r i d ( t ) ) for t = 1 to T
2:
D ( t ) c l e a n DataPre - processing ( D ( t ) ) (handling missing values, outliers, normalization)
3:
D ( t ) i n t FeatureEngineering ( D ( t ) c l e a n ) (create lagged features and moving averages)
4:
X ( t ) TransformData ( D ( t ) i n t ) (apply appropriate transformations, e.g., log, Box–Cox)
5:
( X ( t ) t r a i n , X ( t ) t e s t ) SplitData ( X ( t ) ) (split into training and testing sets)
6:
θ InitializeParameters ( ) (initialize model parameters)
7:
M SelectModel ( ) (choose appropriate forecasting model, e.g., LSTM, CNN, Transformer)
8:
for i 1 to N do
9:
    for  e i 1 to E do
10:
         ( θ i , ε i ) TrainModel ( M , X ( t ) t r a i n , θ ) (train model using optimization algorithm, e.g., Adam, SGD)
11:
        if  ε i < ε b e s t then
12:
            θ b e s t θ i
13:
            ε b e s t ε i
14:
        end if
15:
    end for
16:
     Y ( t ) f o r e c a s t Forecast ( M , X ( t ) t e s t , θ b e s t ) (generate forecasts for household i)
17:
     P I ( t ) CalculateIntervals ( Y ( t ) f o r e c a s t , α ) (calculate prediction intervals at confidence level α )
18:
     E ( t ) Evaluate ( Y ( t ) f o r e c a s t , X ( t ) t e s t ) (compute evaluation metrics)
19:
end for
20:
θ u p d a t e d UpdateModel ( M , θ b e s t , ε b e s t )
An accurate load forecasting model in the residential buildings is essential to the operational efficiency of EMSs. It underpins critical decisions in power distribution and infrastructure enhancement, while ensuring that energy provision remains cost-effective and reliable for end users. The integration of advanced AI, including ML and DL methodologies, has significantly refined the accuracy of such demand predictions. The strategic assessment of different forecasting approaches is essential to reveal the most efficacious approach for smart grid applications, with AI-centric methods outperforming traditional models in terms of error metrics [47].

4.2. Historical Development of Load Forecasting Models

Accurate predictions of future energy loads are imperative for facilitating energy supply, storage management, peak load mitigation, and scheduling for EVs. In addition to recognizing the significance of load forecasting, it is crucial to acknowledge that inaccurate predictions can disrupt the scheduling and planning of power systems, potentially leading to energy shortages in the market [48,49]. Figure 4 illustrates the various models utilized in load forecasting, each with its own set of strengths and weaknesses. These methods can be categorized based on their time frames into short-, medium-, and long-term forecasting models.
Short-term forecasting covers a duration ranging from seconds or minutes to hours, with a primary focus on flow control applications. Conversely, medium-term forecasting models extend their predictive horizons from hours to weeks, primarily serving to adjust generation and demand and enable offerings in the electricity market [48]. Short-term forecasting models are crucial for daily operations, including tasks such as evaluating net interchange, committing units, scheduling, and analyzing system security. Medium-term forecasting methods, which typically span months, assist utilities in several tasks (e.g., fuel scheduling, maintenance planning, and managing hydro reservoirs). Finally, long-term forecasting models, which span years, aid utilities in planning the grid’s capacity and scheduling maintenance activities [50].
Linear systems fall into two categories, including time-series and dynamic programming, which encompass state-space models and the auto-regressive moving average (ARMA) model. These models involve extensive mathematical calculations and statistics and are considered traditional methods for the load forecasting process. However, with the emergence of AI and NNs, the complexity of systems has grown, leading to nonlinear systems. These systems are modeled using techniques (e.g., support vector machines (SVMs), Markov chains, ANNs, fuzzy neural networks, and stochastic distributions). Moreover, ANNs can be further classified into supervised, unsupervised, and RL models [51,52].

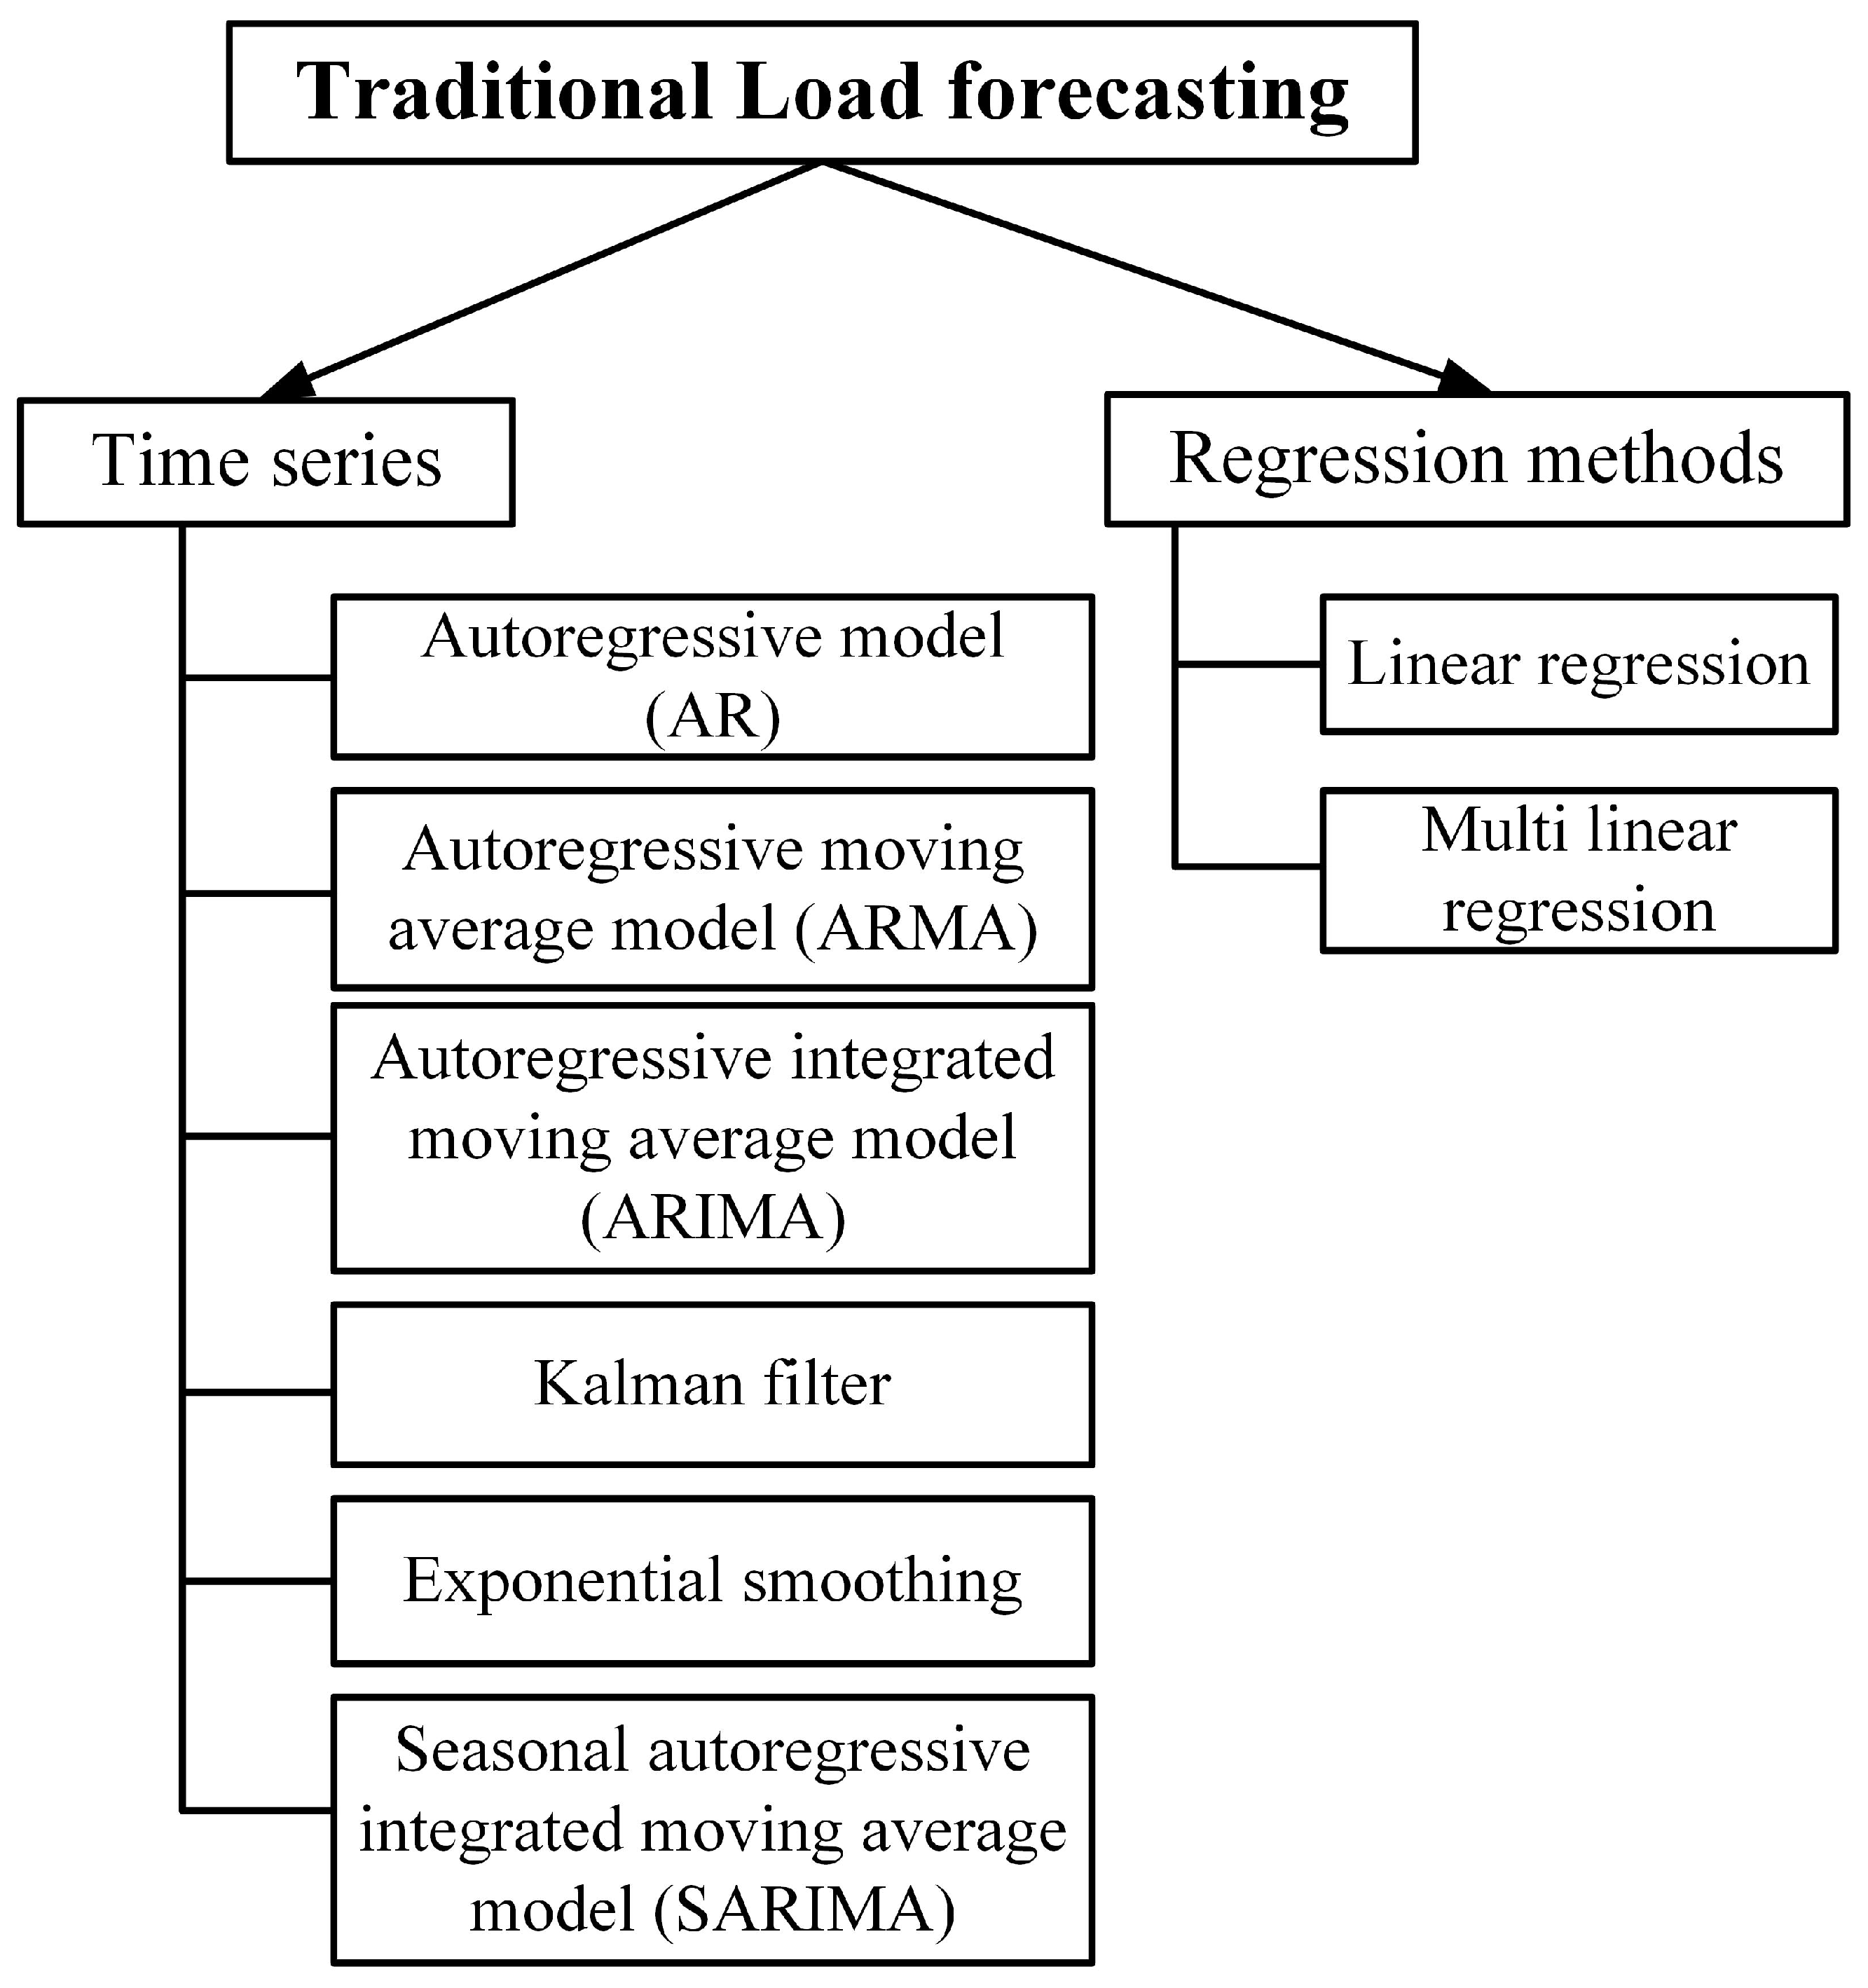
4.3. Traditional Load Forecasting Models

Time-series models analyze historical data to classify load patterns. These methods, rooted in classical approaches, employ statistical modeling techniques. Essentially, they utilize statistical modeling and mathematical functions to predict future load values. Figure 5 illustrates the various types of models within traditional forecasting methods.
The auto-regression integrated models stand out as a widely employed traditional approach, seamlessly blending the moving average and auto-regression models [53]. Evolving from this foundation, the ARMA model introduced a stationary framework [54,55], paving the way for the refined auto-regressive integrated moving average (ARIMA) model, adept at handling both seasonal and non-seasonal differentiating terms. This flexibility is summarized in the ARIMA ( p , d , q ) ( P , D , Q ) notation, showcasing its adaptability to various datasets [56]. Expanding further, the (S)ARIMAX or (S)ARMAX models incorporate exogenous variables, enriching predictive capacity with inputs such as temperature and special events [57].
In parallel, the Kalman filtering algorithm emerges as a basis in forecasting models, offering robust tracking in noisy data environments. Leveraging the principles of linear system dynamics, it optimally estimates system states based on observed inputs and outputs, ensuring accurate prediction even in uncertain data [58]. Beyond these established methods, the Gray model harnesses the complex patterns within power load dynamics, excelling in capturing smooth rises and falls [59]. Furthermore, exponential smoothing models emerge as a fundamental tool in load forecasting, with their accuracy relying on the selection of the coefficient α . Through studies aimed at optimizing this parameter, exponential smoothing models unlock their full potential in delivering reliable forecasts [60].
Table 2 presents a breakdown of these models in traditional load forecasting, detailing their respective statistical formulas and parameter explanations [56,61].
While time-series models can adjust to seasonal parameter variations and maintain tracking amidst noise, they often face a numerical instability. In contrast, regression models demonstrate effectiveness regardless of dataset size. These models establish relationships between historical load forecasts and weather conditions through mathematical functions. However, they may lack accuracy, especially when overfitting occurs. Furthermore, they can handle the nonlinearity of load consumption, and the additional parameters can lead to an instability issue [62].
Table 2. Traditional load forecasting models and their mathematical equations.
Ref.Traditional Forecasting ModelsStatistical FormulaeParameters
[53]Auto-regressive Y t = ϵ t + i = 1 p y t 1 ϕ i ϵ t = random noise
ϕ 1 , ϕ 2 , , ϕ p are auto-regressive
coefficients that are unknown
y t = time-series output
[53]Model based on moving average Y t ϵ t = i = 1 p y t 1 θ i Duality of auto-regressive model
[54,55]ARMA model Y ( n ) = p k = 1 a k y ( n k ) + q k = 0 b k x ( n k ) p = auto-regressive order
q = moving average (MA) order
Y ( n ) = return series of original time series x
[56]ARIMA model ( 1 ( ϕ P ( B s ) + ϕ p ( B ) ) ) Y t = ( 1 ( θ q ( B ) + Θ Q ( B s ) ) ) e t P = order of seasonal auto-regressive
Q = order of seasonal MA term
p = the order of a non-seasonal difference
q is the order of non-seasonal MA term
[57](S)ARIMAX and (S)ARMAX ϕ ( B ) . y t = θ ( B ) . ϵ t + i = 1 k δ 0 i ( B ) v t i i = exogenous factor
v t i and δ i are adequate coefficient polynomials
[58,61]Kalman filtering algorithm x k = A x k 1 + w k 1
z k = H x k + v k
x ¯ k = x ¯ k ¯ + K k ( z k H x ¯ k ¯ )
K k = P k ¯ H T H P k ¯ H T + R
w k 1 , v k are zero mean small white noise signals with covariance matrices
P w , k and P v , k  
x k = system state vector
z k = state observation vector
H = state observation matrix
K k = gain matrix
[59,63]Gray system theory x ¯ ( 0 ) ( k + 1 ) = x ¯ ( 1 ) ( k + 1 ) x ¯ ( 1 ) ( k ) = ( e a ¯ 1 ) ( x ( 0 ) ( 1 ) u ¯ a ¯ ) e a ¯ k where
( k = 0 , 1 , 2 , n )
x ¯ ( 0 ) = original sequence
a = development co-efficient
u = Gray constant
[60]Exponential smoothening S t = α x t + ( 1 α ) S t 1 S t = smooth value at time t 
x t = actual observation value at time t
S ( t 1 ) = smooth value at time ( t 1 )
  α = smoothing constant, ranging from 0 to 1

4.4. Machine Learning in Load Forecasting Models

ML methods have garnered considerable interest in enhancing load forecasting accuracy based on load profile attributes. Employing an ML framework for short-term load forecasting equips a power system with the capacity to learn from and forecast based on existing data. This process employs diverse algorithms, expected to perform effectively, to scrutinize available data, using a set of instructions, thereby generating data-informed forecasts and decisions. Load forecasting algorithms rooted in ML algorithms utilize real-time power system operation data for day-ahead predictions, while historical power system data are utilized for training purposes [64]. They are capable of learning intricate, non-linear connections between the input and output variables and electricity demand. Such relationships might be challenging to be captured using conventional statistical or econometric approaches [47]. These methods stand out for their capacity to operate autonomously, eliminating the need for complex mathematical formulations or quantitative correlations between inputs and outputs.

4.4.1. Supervised ML Model

An SVM regression method summarizes an advanced predictive paradigm grounded in statistical learning theory and the principles of structural risk minimization [65]. As a result, it adeptly navigates the complex trade-off between model intricacy and learning ability within the constraints of limited sample data, yielding optimal generalization capabilities. Diverging from ANN methodologies predicated on principles of experience risk minimization, the SVM model exhibits unparalleled efficacy in addressing challenges associated with insufficient sample sizes, high-dimensional data spaces, and the intricacies of local minima. Consequently, it has emerged as a focal point of interest among researchers within the area of short-term load forecasting [66].
The SVM algorithm efficiently updates its structure based on the input training data. A part of the SVM model’s training involves an understanding of the quadratic optimization, which is reliant on NNs, not reliant on random initialization of weights. Consequently, when operating on identical information with the same parameter settings, any SVM model can yield identical outcomes, ensuring the repeatability of SVM forecasts. This characteristic significantly reduces the training runs needed to discover optimal SVM parameter settings compared to the NN training process. Moreover, the SVM model excels in addressing various challenges (e.g., local minima, high minima, and smaller sample sizes). Figure 6 illustrates the essential structure for the SVM method [67]:
The nonlinear regression function expression is given as Equation (1):
y = f ( x ) = f ( x , ω ) = ω ϕ ( x ) + b = ( ω , ϕ ( x ) ) + b
where ω = weight, ϕ ( ) is the nonlinear function, ( ω , ϕ ( x ) ) shows the inner product, and b is the bias. The support vector regression method offers a solution to the regression estimation problem by implementing an insensitive loss function ϵ [57].
In this context, Ye et al. [66] conducted a case study utilizing historical and meteorological data. They employed the SVM, ANN, and time-series analysis methods to forecast load profiles. Their findings indicated that SVM exhibited a lower maximum relative error in comparison with the ANN model and time-series analysis. Additionally, the mean absolute percent error was smaller for SVM in comparison with the latter two methods. Similarly, Al-Amin et al. compared the ARIMA and SVM models for a short-term load forecasting process. They observed that SVM effectively identified the pattern of actual load, although occasionally missing the magnitude of peaks. In contrast, ARIMA failed to match the samples, resulting in a higher mean square error compared to the SVM model, which consequently led to significant monetary losses [57].

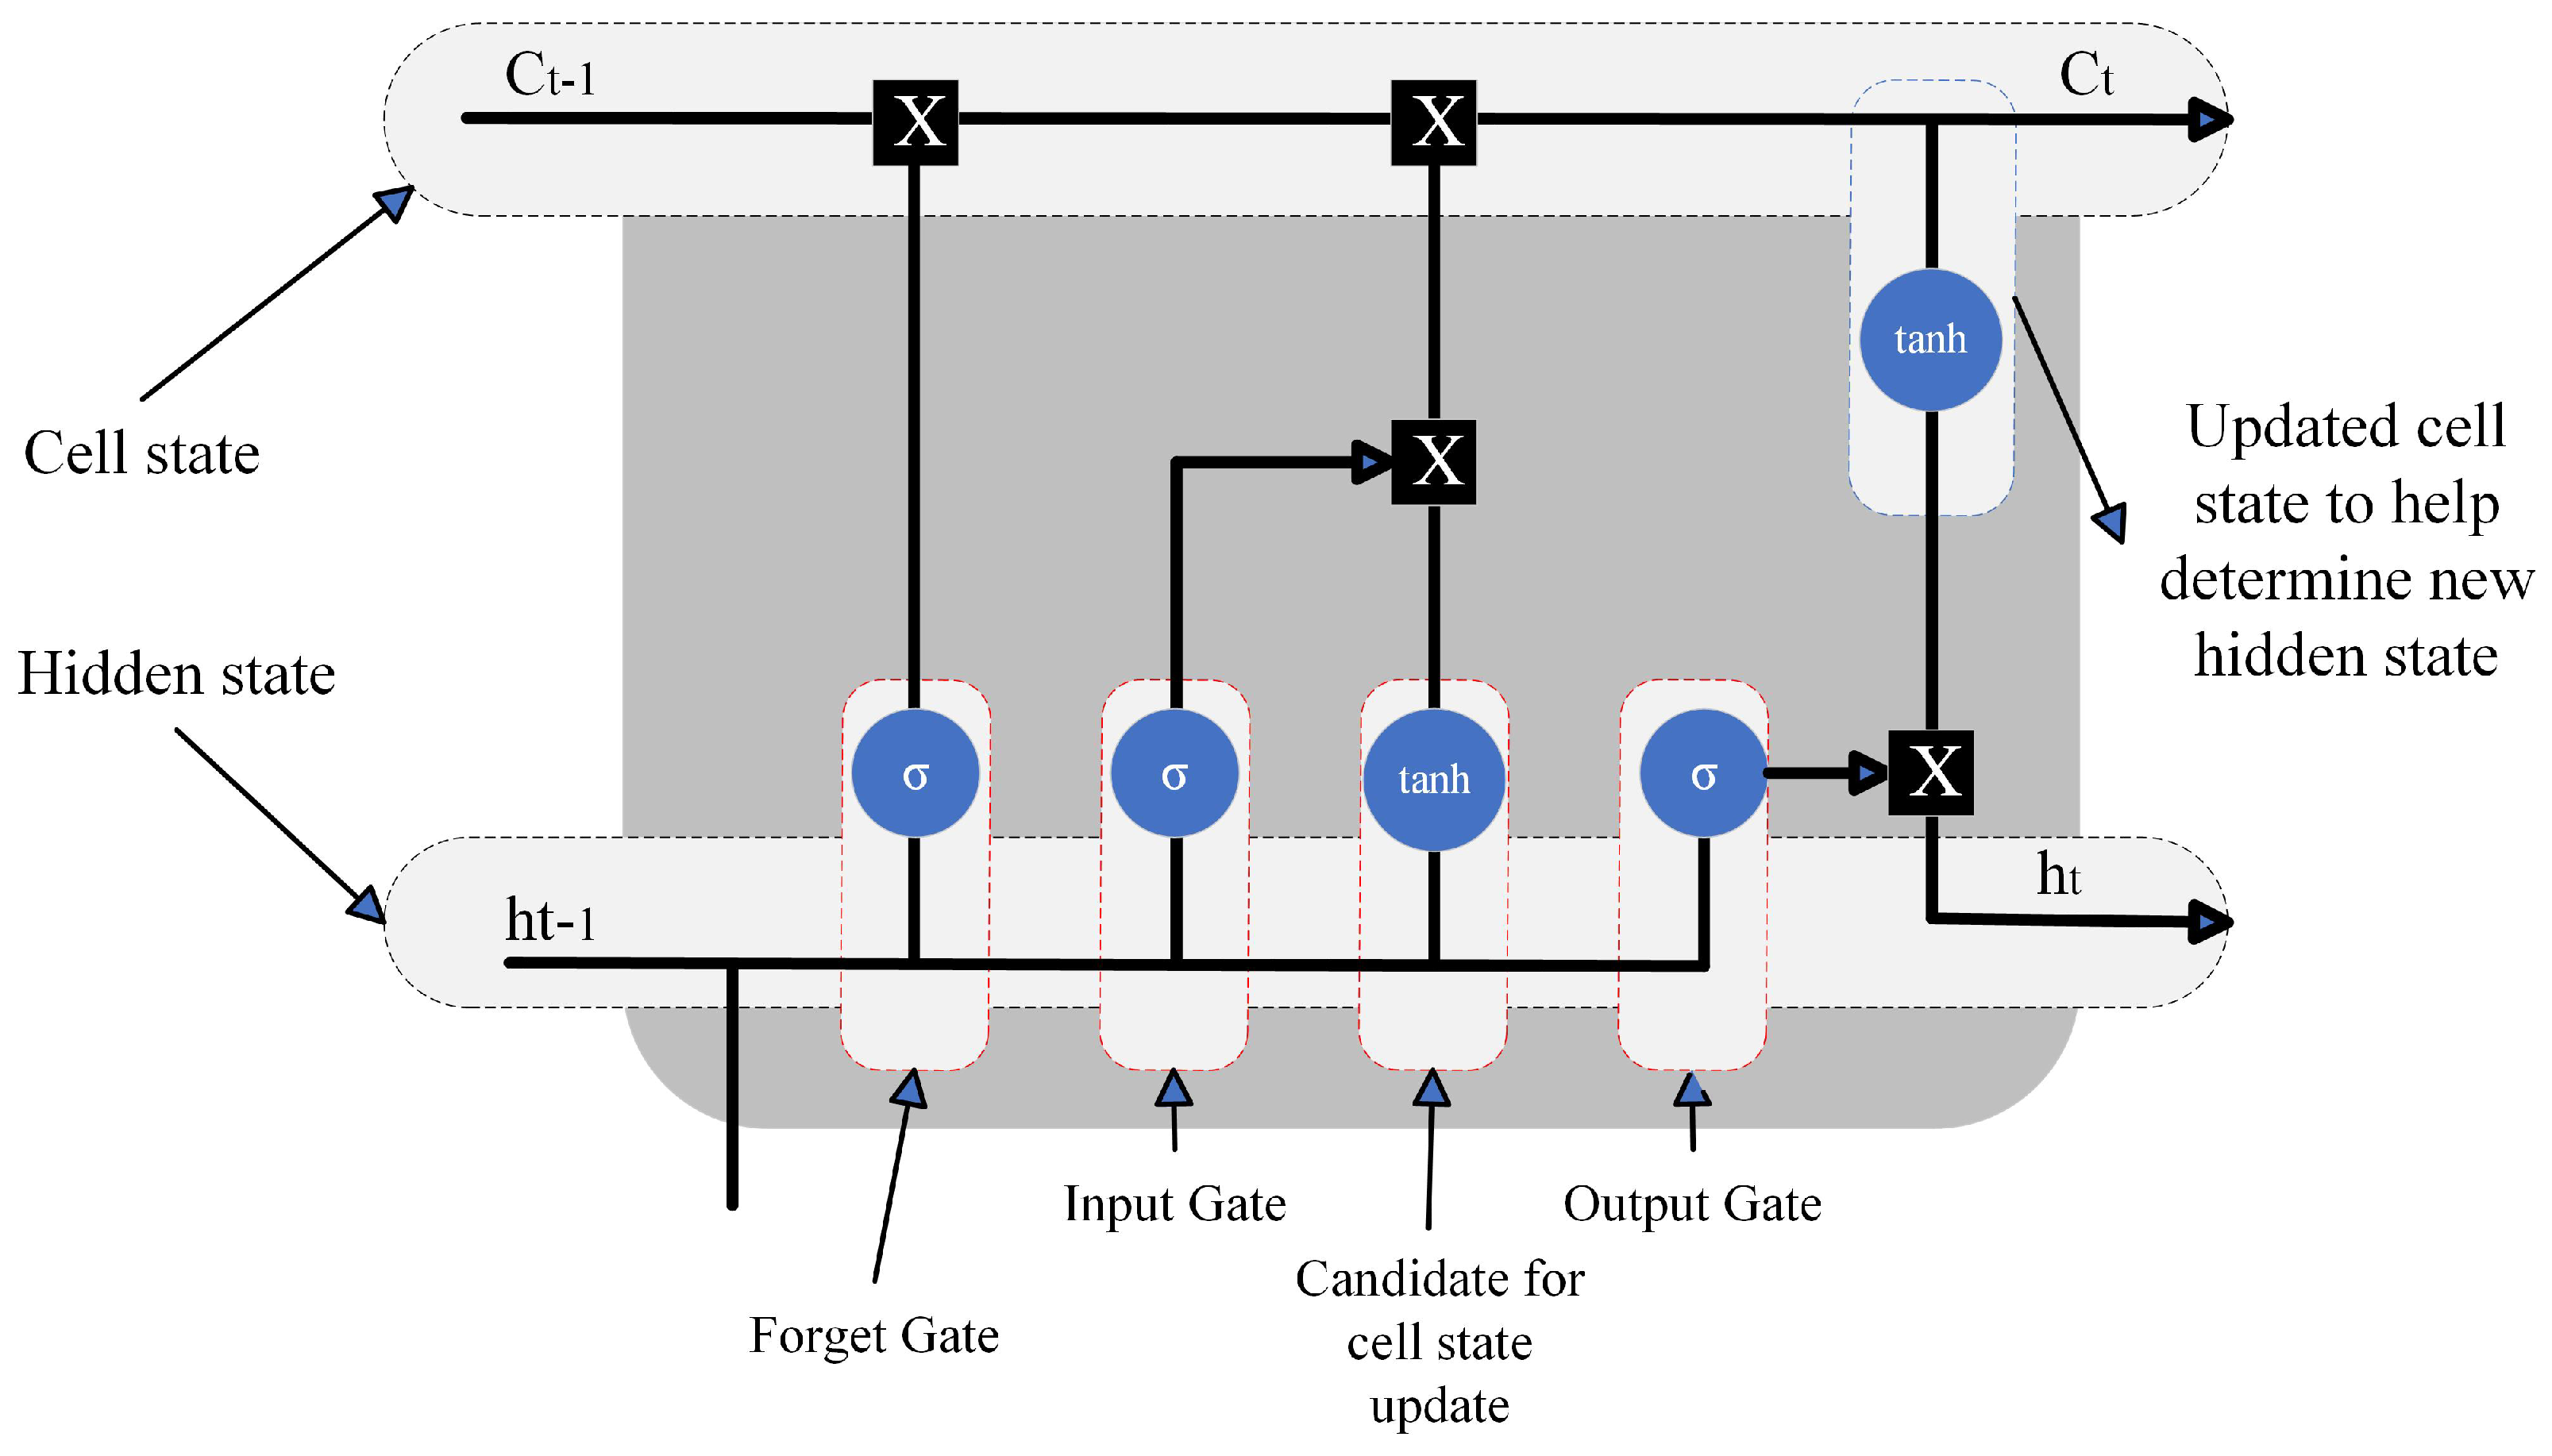
4.4.2. Artificial Neural Networks

In the past decade, ANNs have gained immense popularity in the load forecasting process. Essentially, ANNs emulate the human brain, enabling them to autonomously learn patterns and regularities from past experiences and generate generalized results. Unlike ARIMA-based linear forecasting methods, ANNs represent a set of nonlinear, self-adaptive techniques that rely solely on datasets. Consequently, there is no requirement for prior knowledge regarding the relationship between forecasting models and data. It is widely acknowledged that ANNs are capable of approximating any nonlinear function. Specifically, ANNs typically yield satisfactory results for complex and time-series models. ANNs are further subdivided into various types, including back propagation, ensemble extreme learning machines, k-nearest neighbors, CNNs, long short-term memory (LSTM), and so on. The LSTM method has gained prominence for effectively addressing the challenges posed by the nonlinearity, non-stationary, and non-seasonal characteristics of short-term time-series models [68]. The structure of the LSTM architecture is illustrated in Figure 7. Central to the LSTM architecture are memory cells, capable of retaining information over an extended duration. These memory cells possess a distinctive design enabling them to critically learn and discard information, depending on the context of the input sequence [5].
Enabling the selective memory management has three key components (input, forget, and output gates). The mathematical operations of the LSTM model are described by Equations (2)–(7) [69,70]:
f t = σ g ( M x f x t + N h f h t 1 + b f )
i t = σ g ( M x i x t + N h i h t 1 + b i )
o t = σ g ( M x o x t + N h o h t 1 + b o )
c t = σ c ( M x c x t + N h c h t 1 + b c )
c t = g t c t 1 + i t c t ¯
h t = o t t a n h ( C t )
where f t , i t , o t denote the forget gate, input gates, and output gate respectively; M and N are the weight matrices; b is the biased value of different gates; x t represents the input vector at the current time step; and the hidden state at the previous time step and current time step are h t and h t 1 , correspondingly. The cell states at the current and previous time step and the candidate cell states are represented by c t , c t 1 , and c t ¯ , respectively. Finally, the nonlinear activation functions are σ g and σ c , and the element wise operator is represented by ⊙ [68].

4.4.3. Evaluation Metrics

Utilizing the mean absolute error (MAE), mean squared error (MSE), and root mean square error (RMSE) metrics, as depicted in Equations (8)–(10), the methodologies can be assessed. Here, n represents the forecast horizon, y m , i signifies the actual measured value at time i, and y f , i denotes the predicted value in parallel [71]:
MAE = 1 n . i = 1 n | y m , i y f , i |
MSE = 1 n . i = 1 n ( y m , i y f , i ) 2
RMSE = 1 n . i = 1 n ( y m , i y f , i ) 2
In this regard, Zeng et al. [72] conducted a comparative analysis of the LSTM model against other NN models, such as the seasonal auto-regressive integrated moving average (SARIMA), nonlinear auto-regressive exogenous (NARX), and SVM models. Their evaluation criteria focused on the RMSE and MAE between the actual values and the forecasting results, utilizing electrical load data for these models. The findings revealed LSTM’s superiority, demonstrating its capability in forecasting a complex single-variable time-series load classified by strong non-stationary and non-seasonality features [8].

4.5. Model Selection and Optimization

Various model types are effective for predicting loads in BTM DER systems. The time-series models (e.g., ARIMA or SARIMA) can be considered as a preliminary benchmark. When complex nonlinear patterns must be addressed, tree-based approaches (e.g., Random Forest and XGBoost) are particularly proficient. DNNs, including recurrent NNs (RNNs), LSTMs, and CNNs are advantageous for capturing long-term dependencies and temporal dynamics, offering notable enhancements [73]. After choosing a model type, fine-tuning the hyperparameters is crucial. Methods such as grid search and random search serve as basic strategies for navigating through hyperparameter settings. A Bayesian optimization can deliver faster and more effective outcomes, especially for models that are resource-intensive. For challenges in non-convex optimization scenarios, evolutionary algorithms present a dependable solution. A thorough evaluation procedure is vital to confirm the model’s accuracy. The cross-validation methods (e.g., k-fold or time-series-based) can be employed to mitigate the risk of overfitting. Applying various error metrics, including MAE and RMSE, provides a well-rounded evaluation of the model’s predictive performance. Comparing the model’s forecasts with actual graphs will reveal deficiencies and indicate opportunities for refining the model [74]. According to the descriptions, Figure 8 illustrates a methodical procedure for selecting and optimizing models used in the load forecasting process for BTM DERs:

4.6. Computational Burden of Load Forecasting Process

The computational effort of ML models in the BTM DER load forecasting process is crucial due to the need for real-time processing and decision making. Traditional ML models (e.g., SVM, Random Forests) are widely used due to their predictive accuracy. However, these models often require extensive computational resources, especially when handling large datasets or performing multi-step forecasting. For instance, SVMs can become computationally intensive with large training sets due to their quadratic optimization problem, while ensemble methods such as Random Forests involve training multiple decision trees, which increases computational time linearly with the number of trees and depth [75]. Considering the computational effort estimation in an LSTM network as an example, the time and energy for model training depend on both hardware and software, and the total number of model parameters serves as a useful surrogate. To begin, x t should represent a vector with a dimensionality corresponding to the feature count f, while h t must be a vector of dimensionality u, matching the number of units. Thus, all M x matrices need a shape of [ u × f ], N h matrices require a [ u × u ] shape, and each bias vector b should have dimensions of [ u × 1 ]. Consequently, the simplified formula for the parameter count in the first hidden layer P H L 1 is given by [76]
P H L 1 = 4 u × ( u + f + 1 )
In the subsequent hidden layer, the input vector changes because it takes the hidden state h directly as an input. Therefore, u replaces f and the parameter count in any second hidden LSTM layer P H L 2 becomes
P H L 2 = 4 u × ( 2 u + 1 )
Lastly, the final hidden layer’s state is fully connected to a densely populated output layer that yields a single forecast value. Here, the output layer parameter count P O is the sum of the hidden state length and a single bias value as follows:
P O = u + 1
When comparing ML algorithms with generative AI (GenAI) models, LLMs have shown promise in reducing the computational burden while maintaining or improving forecasting accuracy. LLMs can leverage pre-trained models and fine-tuning strategies to process and predict time-series data efficiently. For example, the use of transformers and attention mechanisms allows LLMs to focus on relevant parts of the input sequence, improving computational efficiency. In the context of BTM DERs, LLMs can quickly adapt to different energy consumption patterns and provide accurate load forecasts without the need for extensive hyperparameter tuning or model re-training. This adaptability and efficiency make LLMs particularly suited for real-time applications, where they outperform traditional ML models in both speed and scalability [32].

5. Abnormal Activities in Residential Households with BTM Systems: A Case Study

This section presents scenarios that can occur in residential/commercial locations based on abnormal activities (e.g., cyberattacks, Bitcoin mining, marijuana growing). These activities can suddenly increase the energy consumption in households according to SM data. It could be challenging for utilities to manage and prevent these anomalous activities and makes the forecasting process difficult as the usual patterns of DERs cannot be detected. A normal operation of SMs, considering different parts of the distribution systems, from transformers to communication protocols, is demonstrated in Figure 9:
According to this figure, a mesh network of SMs that utilize wireless communication protocols (e.g., Zigbee) is depicted, demonstrating real-time energy consumption monitoring at different houses. These meters are connected to a distribution transformer, with a nominal voltage ratio of 12 kV/120 V, illustrating the down-step voltage transformation from the distribution grid level to the residential level. Overcurrent relays (OCRs) are installed for protection and automation purposes at the transformer points, ensuring the safety and reliability of the electrical supply. The AMI is shown to interface with a utility data center, enabling data exchange for billing, monitoring, and management goals. The communication between the SMs and the data center is depicted as a two-way exchange, indicating the potential for both data collection and control of the command distribution. The presence of specified routers at substations suggests the use of robust communication to support the necessary bandwidth and reliability for grid communication needs. The inclusion of Zigbee technology indicates a low-power, wireless network standard for enabling communication between devices in close proximity, such as within the household or local distribution network. All the miniature circuit breakers (MCBs) are closed, and the distribution transformer reads data from the SMs and sends it to the AMI through communication protocols. Then, a data transfer to the utility center is the final step. As can be observed, different houses illustrate normal energy usages simultaneously without any abnormal activity [5]. However, an abnormal case study is presented in Figure 10:
Suppose there is abnormal activity in a house, e.g., a cyberattack, Bitcoin mining, or marijuana growing. These activities can significantly affect SM values (i.e., the red SM with 5600 kWh), being much higher than the normal threshold of energy consumption. Hence, this can cause power outages in houses and create challenges to forecasting the load profiles for a specific customer. Some abnormal activities can be preventive but others (e.g., cyberattacks) can be out of control and lead to problems for residents and utilities to manage and monitor. In this case, the alarm is raised and the relevant MCB trips. However, other feeders could be safe and in their normal operations. Sending data to the AMI, and then to the utility center, for detection of anomalous data with ML methods based on load forecasting for each house, is a significant point.
As mentioned, when residents engage in energy-intensive activities (e.g., Bitcoin mining), it can significantly disrupt the normal energy consumption patterns and pose challenges to the system’s stability and efficiency. Hence, the proposed anomaly detection module plays a crucial role in identifying and mitigating the impact of such abnormal activities, as illustrated in Figure 11:
The process begins with SMs installed in the residential sides, which continuously collect energy consumption data at granular levels. These data are then transmitted to the utility center through a secure communication channel (i.e., Zigbee or WiFi). At the utility center, the received data are stored in a cloud storage module and sent to the cloud for further processing. The training module in the cloud leverages historical data to train ML models, such as SVM, NNs, or ensemble methods, to learn the normal patterns of residential users. These trained models are then used in the load forecasting module to predict future energy demand accurately. The anomaly detection module comes into play when the actual energy consumption data deviate significantly from the predicted values. The module compares the incoming data with the forecasted values and applies statistical techniques (e.g., Z-score) or ML algorithms to identify anomalies. If an anomaly is detected, an alarm is triggered, notifying the system administrators or utility operators to take appropriate actions, such as implementing DR measures to maintain the system’s stability. These abnormal activities can cause sudden spikes in energy consumption that deviate from the normal patterns. By detecting these anomalies promptly, the utility operators can take necessary steps to mitigate their impact on the grid and ensure fair energy distribution among the residents. This may involve implementing dynamic pricing schemes to discourage excessive energy consumption during peak hours, enforcing energy consumption limits, or working with local authorities to address any illegal activities.
The U.S. Energy Information Administration (EIA) has stated realizations regarding the substantial energy consumption attributed to cryptocurrency mining endeavors. Following legal challenges by mining entities contesting their obligation to disclose energy usage data as a part of the EIA survey, the agency has initiated a consultative process to determine the feasibility and legal framework for mandatory reporting requirements. This initiative represents a preliminary phase in the establishment of definitive reporting protocols for the cryptocurrency mining sector. Historically, similar data reporting is routine among other significant energy-consuming industries, facilitating the EIA’s ability to generate analytical reports that assist utility companies and grid operators in strategic energy planning. The EIA acknowledges an urgent requirement for the cryptocurrency sector to quantify its escalating energy requirements, which have demonstrated potential to compromise the dependability of electrical services and to influence energy tariffs adversely. The practice of cryptocurrency mining, noted for its intensive energy usage, poses a challenge to the U.S. objectives of grid stability, energy rate balance, and the reduction of reliance on carbon-intensive energy sources. The EIA’s preliminary assessment in February 2024 suggested that cryptocurrency mining may account for as much as 2.3 % of the total electricity demand in the U.S. The EIA faces a regulatory imperative to collect and analyze cryptocurrency mining energy consumption data. Its recent announcement soliciting public input signals a multi-month process contingent upon agency prioritization. The lack of transparency surrounding miner energy use, particularly during peak demand, has deteriorated the grid vulnerability. This was demonstrated in Texas, where near-failure conditions threatened widespread power outages [77,78].

6. Challenges and Emerging Models

In recent scholarly endeavors, researchers have encountered numerous barriers in enhancing both the accuracy and precision of models related to the forecasting and identification of BTM DERs. To recap, the following concerns can be considered according to the current progress in load forecasting analysis:
  • The variability and uncertainty in BTM PV generation provide a range of issues (e.g., voltage limits violations, voltage profile fluctuation, reverse power flow, and protection device failure) in distribution networks [40,79]. Also, energy consumption is influenced by non-technical loss detection, environment, building features, and users’ behavior [80].
  • An NILM process makes it challenging to achieve high-accuracy load identification using a single waveform characteristic (i.e., low load detection accuracy). Choosing the perfect combination of features is challenging [18].
  • The unpredictability associated with residential activities and energy consumption exhibits dynamic variability, even within the context of a single user’s specific application [33].
  • Due to the enormous number of parameters that must be adjusted in DNNs, there is a considerable risk of overfitting [81,82].
  • Implementing functional encryption at the SM level introduces significant complexity, both in terms of cryptographic operations and the management of decryption keys by the system operator in cases where there are some anomalies in the SMs. Also, the system operator can have constraints in a comprehensive analysis for an effective load forecasting process [83,84].
  • Spatial resolution of the recorded datasets, data gaps, and measurement errors in the datasets could be challenges in the process [85].
  • Uniqueness of the characteristics utilized may differ depending on the data collection [20].
  • Data time resolution and using average consumption of residential customers are questionable. Some SM data quality issues (e.g., duplicating, missing, outliers, or anomalous data samples) are the factors for less accuracy in the load forecasting performance [24].
  • Predicting various configurations of residential BTM loads, taking into account the intricate characteristics of PV systems, BESS, and EV charging stations, and extracting data at one-second intervals over an extended period, presents a considerable challenge [5,6].
  • Repeating patterns of current waveform may not be similar, and the time intervals between their occurrences may not be identical [19].
  • Adaptability of DL algorithms is challenging because of no accessibility to a huge number of datasets [85].
  • Most clustering methods suffer from the dimensionality presented by time-series SM data because of the divergence in a high-dimensional domain. Also, there are certain algorithmic restrictions (e.g., sensitivity) to outliers by hierarchical clustering models [24].
  • A fault management system can be effective in a low-voltage grid because the smart transformer is not able to provide the full short-circuit current to the fault point, due to the limited capacity of semiconductor devices. A lower efficiency regarding the conventional transformers can be debatable [86].
  • Utilities use the customer daily peak demand to approximate flexibility for peak-shaving programs, which can cause errors because it cannot be coincided with the peak [24].
The advancements in this field are predominantly propelled by the incorporation of sophisticated computational frameworks, especially emphasizing the roles of AI and LLMs. It is anticipated that these frameworks will markedly improve the precision, efficiency, and scalability of predictive analyses, tackling the complexities associated with the BTM DERs dynamic. The general emerging models can be considered as the following categories:
  • AI-Driven Models: The application of AI in the forecasting of BTM DERs is set to expand. These models are capable of capturing nonlinear and complex patterns of energy usage and generation, factoring in variables such as weather conditions, user behavior, and electricity prices.
  • LLM-Based Load Forecasting: LLMs are leveraging huge amounts of textual and numerical data to predict energy demand. Unlike traditional ML models that require extensive feature engineering and pre-processing, LLMs can directly analyze and interpret the data, making them highly efficient for processing large datasets from SMs.
  • Hybrid Models: Combining AI-driven approaches with LLM capabilities, hybrid models offer a comprehensive solution that benefits from the predictive power of AI and the contextual understanding of LLMs. These models can dynamically adapt to changing energy patterns and integrate different data sources for improved forecast accuracy. Some advantages of LLMs in this process can be mentioned as follows:
    -
    Adaptability: They can quickly adapt to new data and patterns, making them ideal for the continuously changing area of residential energy systems.
    -
    Time Efficiency: LLM-based models lessen the need for manual feature selection and pre-processing, accelerating the forecasting process.
    -
    Efficiency in Large Datasets: LLMs can handle huge amounts of data more efficiently than traditional ML models, making them particularly appropriate for analyzing extensive SM datasets.
Developing models that not only forecast load but also provide personalized energy management recommendations for houses could be a trend for future research. Establishing frameworks to address privacy, data security, and ethical considerations in the deployment of advanced forecasting models could be studied. Also, integration with IoT devices could be achieved by enhancing data collection and real-time forecasting by combining LLMs and AI models with IoT devices in smart homes.

7. Conclusions

This survey undertook a comprehensive and systematic analysis of the complex load forecasting processes associated with BTM DERs in residential settings. It meticulously examined various configurations of PVs, BESSs, and EV charging infrastructure, while incorporating the latest technological innovations. Also, it explored a wide range of models, presenting a structured approach for model selection and optimization. Notably, the review introduced pioneering case studies that considered abnormal activities in residential households with BTM DERs for the first time, highlighting the challenges associated with anomaly detection. A suggested anomaly detection framework was presented to show the applicability of different procedures for households considering SMs. Furthermore, the potential for utilizing LLMs as a novel approach to anomaly detection was discussed, offering a more efficient and accurate method. Lastly, the review provided valuable insights into the potential challenges related to BTM DERs and load forecasting algorithms, laying the groundwork for future research and development in this rapidly evolving domain.
The future of BTM DER load forecasting presents complex challenges, particularly in detecting anomalous activities. Enhancing anomaly detection algorithms becomes a crucial task to recognize and mitigate irregular patterns, subsequently elevating the precision and robustness of load forecasting efforts. Refining anomaly detection techniques and exploring AI-driven models, such as LLMs, are crucial for advancing the field. However, ensuring the privacy of these models remains a critical consideration.

Author Contributions

Conceptualization, A.Z., S.R.K., K.P., Y.H. and J.H.; formal analysis, A.Z., S.R.K., K.P., Y.H. and J.H.; writing—original draft preparation, A.Z., S.R.K., K.P., Y.H. and J.H.; writing—review and editing, A.Z., S.R.K., K.P., Y.H. and J.H.; supervision, A.Z. and J.H. All authors have read and agreed to the published version of the manuscript.

Funding

This research received no external funding.

Data Availability Statement

Not applicable.

Conflicts of Interest

The authors declare no conflicts of interest.

References

  1. Wen, M.; Yu, Z.; Li, W.; Luo, S.; Zhong, Y.; Changqing, C. Short-term load forecasting based on feature mining and deep learning of big data of user electricity consumption. AIP Adv. 2023, 13, 125315. [Google Scholar] [CrossRef]
  2. Zhao, L.; Zhang, T.; Peng, X.; Zhang, X. A novel long-term power forecasting based smart grid hybrid energy storage system optimal sizing method considering uncertainties. Inf. Sci. 2022, 610, 326–344. [Google Scholar] [CrossRef]
  3. Pan, K.; Chen, Z.; Lai, C.S.; Xie, C.; Wang, D.; Li, X.; Zhao, Z.; Tong, N.; Lai, L.L. An unsupervised data-driven approach for behind-the-meter photovoltaic power generation disaggregation. Appl. Energy 2022, 309, 118450. [Google Scholar] [CrossRef]
  4. Lin, J.; Ma, J.; Zhu, J. A privacy-preserving federated learning method for probabilistic community-level behind-the-meter solar generation disaggregation. IEEE Trans. Smart Grid 2021, 13, 268–279. [Google Scholar] [CrossRef]
  5. Zaboli, A.; Tuyet-Doan, V.N.; Kim, Y.H.; Hong, J.; Su, W. An LSTM-SAE-based Behind-the-Meter Load Forecasting Method. IEEE Access 2023, 11, 49378–49392. [Google Scholar] [CrossRef]
  6. Zaboli, A.; Hong, J.; Tuyet-Doan, V.N.; Kim, Y.H. A Machine Learning-based Short-term Load Forecasting Method for Behind-the-meter DERs. In Proceedings of the 2023 IEEE Power & Energy Society General Meeting (PESGM), Orlando, FL, USA, 16–20 July 2023; pp. 1–5. [Google Scholar]
  7. Rafi, S.H.; Nahid-Al-Masood; Deeba, S.R.; Hossain, E. A short-term load forecasting method using integrated CNN and LSTM network. IEEE Access 2021, 9, 32436–32448. [Google Scholar] [CrossRef]
  8. Saeedi, R.; Sadanandan, S.K.; Srivastava, A.K.; Davies, K.L.; Gebremedhin, A.H. An adaptive machine learning framework for behind-the-meter load/PV disaggregation. IEEE Trans. Ind. Inform. 2021, 17, 7060–7069. [Google Scholar] [CrossRef]
  9. Ahmad, N.; Ghadi, Y.; Adnan, M.; Ali, M. Load forecasting techniques for power system: Research challenges and survey. IEEE Access 2022, 10, 71054–71090. [Google Scholar] [CrossRef]
  10. Liu, Y.; Liang, Z.; Li, X. Enhancing Short-Term Power Load Forecasting for Industrial and Commercial Buildings: A Hybrid Approach Using TimeGAN, CNN, and LSTM. IEEE Open J. Ind. Electron. Soc. 2023, 4, 451–462. [Google Scholar] [CrossRef]
  11. Geng, G.; He, Y.; Zhang, J.; Qin, T.; Yang, B. Short-Term Power Load Forecasting Based on PSO-Optimized VMD-TCN-Attention Mechanism. Energies 2023, 16, 4616. [Google Scholar] [CrossRef]
  12. Wang, K.; Zhang, J.; Li, X.; Zhang, Y. Long-Term Power Load Forecasting Using LSTM-Informer with Ensemble Learning. Electronics 2023, 12, 2175. [Google Scholar] [CrossRef]
  13. Wang, X.; Yao, Z.; Papaefthymiou, M. A real-time electrical load forecasting and unsupervised anomaly detection framework. Appl. Energy 2023, 330, 120279. [Google Scholar] [CrossRef]
  14. Wang, X.; Wang, H.; Bhandari, B.; Cheng, L. AI-Empowered Methods for Smart Energy Consumption: A Review of Load Forecasting, Anomaly Detection and Demand Response. Int. J. Precis. Eng.-Manuf.-Green Technol. 2023, 11, 963–993. [Google Scholar] [CrossRef]
  15. Zaboli, A.; Choi, S.L.; Song, T.J.; Hong, J. ChatGPT and other Large Language Models for Cybersecurity of Smart Grid Applications. arXiv 2023, arXiv:2311.05462. [Google Scholar]
  16. Ghayoor, F.; Zaboli, A.; Ghannadpour, S.F. A Coordinated Power Grid optimization Considering Reliability and Chance-Constrained Approaches. In Proceedings of the 2023 IEEE Kansas Power and Energy Conference (KPEC), Manhattan, Kansas, 27–28 April 2023; pp. 1–6. [Google Scholar]
  17. Deivamani, K.; Norouzi, F.; Shekhar, A.; Bauer, P. A Comparison of Various Deep Learning Methods for Household Load Forecasting. In Proceedings of the 2023 IEEE PES Innovative Smart Grid Technologies Europe (ISGT EUROPE), Grenoble, France, 23–26 October 2023; pp. 1–5. [Google Scholar]
  18. Li, K.; Yin, B.; Du, Z.; Sun, Y. A nonintrusive load identification model based on time-frequency features fusion. IEEE Access 2020, 9, 1376–1387. [Google Scholar] [CrossRef]
  19. Du, L.; Yang, Y.; He, D.; Harley, R.G.; Habetler, T.G. Feature extraction for load identification using long-term operating waveforms. IEEE Trans. Smart Grid 2014, 6, 819–826. [Google Scholar] [CrossRef]
  20. Akarslan, E.; Doğan, R. A novel approach based on a feature selection procedure for residential load identification. Sustain. Energy Grids Netw. 2021, 27, 100488. [Google Scholar] [CrossRef]
  21. Wang, Y.; Chen, Q.; Gan, D.; Yang, J.; Kirschen, D.S.; Kang, C. Deep learning-based socio-demographic information identification from smart meter data. IEEE Trans. Smart Grid 2018, 10, 2593–2602. [Google Scholar] [CrossRef]
  22. Khodayar, M.; Liu, G.; Wang, J.; Kaynak, O.; Khodayar, M.E. Spatiotemporal behind-the-meter load and PV power forecasting via deep graph dictionary learning. IEEE Trans. Neural Netw. Learn. Syst. 2020, 32, 4713–4727. [Google Scholar] [CrossRef]
  23. Oprea, S.V.; Bâra, A.; Puican, F.C.; Radu, I.C. Anomaly detection with machine learning algorithms and big data in electricity consumption. Sustainability 2021, 13, 10963. [Google Scholar] [CrossRef]
  24. Yuan, Y.; Wang, Z. Mining smart meter data to enhance distribution grid observability for behind-the-meter load control: Significantly improving system situational awareness and providing valuable insights. IEEE Electrif. Mag. 2021, 9, 92–103. [Google Scholar] [CrossRef]
  25. Moradzadeh, A.; Mohammadi-Ivatloo, B.; Abapour, M.; Anvari-Moghaddam, A.; Roy, S.S. Heating and cooling loads forecasting for residential buildings based on hybrid machine learning applications: A comprehensive review and comparative analysis. IEEE Access 2021, 10, 2196–2215. [Google Scholar] [CrossRef]
  26. Shakeel, A.; Chong, D.; Wang, J. District heating load forecasting with a hybrid model based on LightGBM and FB-prophet. J. Clean. Prod. 2023, 409, 137130. [Google Scholar] [CrossRef]
  27. Xia, L.; Ren, Y.; Wang, Y. Forecasting China’s total renewable energy capacity using a novel dynamic fractional order discrete grey model. Expert Syst. Appl. 2024, 239, 122019. [Google Scholar] [CrossRef]
  28. Real, A.C.; Luz, G.P.; Sousa, J.; Brito, M.; Vieira, S. Optimization of a photovoltaic-battery system using deep reinforcement learning and load forecasting. Energy AI 2024, 16, 100347. [Google Scholar] [CrossRef]
  29. Luo, Z.; Peng, J.; Tan, Y.; Yin, R.; Zou, B.; Hu, M.; Yan, J. A novel forecast-based operation strategy for residential PV-battery-flexible loads systems considering the flexibility of battery and loads. Energy Convers. Manag. 2023, 278, 116705. [Google Scholar] [CrossRef]
  30. Welikala, S.; Dinesh, C.; Ekanayake, M.P.B.; Godaliyadda, R.I.; Ekanayake, J. Incorporating appliance usage patterns for non-intrusive load monitoring and load forecasting. IEEE Trans. Smart Grid 2017, 10, 448–461. [Google Scholar] [CrossRef]
  31. Shi, Y.; Zhao, X.; Zhang, F.; Kong, Y. Non-intrusive load monitoring based on swin-transformer with adaptive scaling recurrence plot. Energies 2022, 15, 7800. [Google Scholar] [CrossRef]
  32. Irani Azad, M.; Rajabi, R.; Estebsari, A. Nonintrusive Load Monitoring (NILM) Using a Deep Learning Model with a Transformer-Based Attention Mechanism and Temporal Pooling. Electronics 2024, 13, 407. [Google Scholar] [CrossRef]
  33. Hong, Y.; Zhou, Y.; Li, Q.; Xu, W.; Zheng, X. A deep learning method for short-term residential load forecasting in smart grid. IEEE Access 2020, 8, 55785–55797. [Google Scholar] [CrossRef]
  34. He, L.; Zhang, J. Energy trading in local electricity markets with behind-the-meter solar and energy storage. IEEE Trans. Energy Mark. Policy Regul. 2023, 1, 107–117. [Google Scholar] [CrossRef]
  35. Lindberg, K.; Seljom, P.; Madsen, H.; Fischer, D.; Korpås, M. Long-term electricity load forecasting: Current and future trends. Util. Policy 2019, 58, 102–119. [Google Scholar] [CrossRef]
  36. Das, P.; Mathur, J.; Bhakar, R.; Kanudia, A. Implications of short-term renewable energy resource intermittency in long-term power system planning. Energy Strategy Rev. 2018, 22, 1–15. [Google Scholar] [CrossRef]
  37. Forero-Quintero, J.F.; Villafafila-Robles, R.; Barja-Martinez, S.; Codina-Escolar, M.; Montesinos-Miracle, D. A flexibility management system for behind-the-meter flexibility with distributed energy resources: A sensitivity analysis. Sustain. Energy Technol. Assess. 2023, 60, 103404. [Google Scholar] [CrossRef]
  38. Madadi, M.; Beddingfield, R.; Ohodnicki, P.; Bhattacharya, S. Utilizing Smart Inverter Virtual-Sensor Nodes for Enhanced Behind-the-Meter Visibility in High PV Penetration Distribution Feeders. In Proceedings of the 2023 IEEE Energy Conversion Congress and Exposition (ECCE), Nashville, TN, USA, 29 October–2 November 2023; pp. 610–616. [Google Scholar]
  39. Smart Energy International. US Smart Meter Penetration to Reach 93% by 2027—Berg Insight. 2023. Available online: https://www.smart-energy.com/regional-news/north-america/us-smart-meter-penetration-to-reach-93-by-2027-berg-insight/ (accessed on 20 March 2024).
  40. Wang, Y.; Zhang, N.; Chen, Q.; Kirschen, D.S.; Li, P.; Xia, Q. Data-driven probabilistic net load forecasting with high penetration of behind-the-meter PV. IEEE Trans. Power Syst. 2017, 33, 3255–3264. [Google Scholar] [CrossRef]
  41. Stratman, A.; Hong, T.; Yi, M.; Zhao, D. Net load forecasting with disaggregated behind-the-meter PV generation. IEEE Trans. Ind. Appl. 2023, 59, 5341–5351. [Google Scholar] [CrossRef]
  42. Tziolis, G.; Livera, A.; Michail, A.; Makrides, G.; Georghiou, G.E. Direct Against Indirect Short-Term Net Load Forecasting Using Machine Learning Principles for Renewable Microgrids. In Proceedings of the 2023 IEEE International Smart Cities Conference (ISC2), Bucharest, Romania, 24–27 September 2023; pp. 1–5. [Google Scholar]
  43. Grabner, M.; Wang, Y.; Wen, Q.; Blažič, B.; Štruc, V. A Global Modeling Framework for Load Forecasting in Distribution Networks. IEEE Trans. Smart Grid 2023, 14, 4927–4941. [Google Scholar] [CrossRef]
  44. Montero-Manso, P.; Hyndman, R.J. Principles and algorithms for forecasting groups of time series: Locality and globality. Int. J. Forecast. 2021, 37, 1632–1653. [Google Scholar] [CrossRef]
  45. Ghayoor, F.; Ghannadpour, S.F.; Zaboli, A. Power network-planning optimization considering average power not supplied reliability index: Modified by chance-constrained programming. Comput. Ind. Eng. 2022, 164, 107900. [Google Scholar] [CrossRef]
  46. Abumohsen, M.; Owda, A.Y.; Owda, M. Electrical load forecasting using LSTM, GRU, and RNN algorithms. Energies 2023, 16, 2283. [Google Scholar] [CrossRef]
  47. Habbak, H.; Mahmoud, M.; Metwally, K.; Fouda, M.M.; Ibrahem, M.I. Load forecasting techniques and their applications in smart grids. Energies 2023, 16, 1480. [Google Scholar] [CrossRef]
  48. Ahmad, A.; Javaid, N.; Mateen, A.; Awais, M.; Khan, Z.A. Short-Term Load Forecasting in Smart Grids: An Intelligent Modular Approach. Energies 2019, 12, 164. [Google Scholar] [CrossRef]
  49. Som, T. Time Load Forecasting: A Smarter Expertise Through Modern Methods. In Prediction Techniques for Renewable Energy Generation and Load Demand Forecasting; Tomar, A., Gaur, P., Jin, X., Eds.; Springer Nature: Singapore, 2023; pp. 153–176. [Google Scholar] [CrossRef]
  50. Erdener, B.C.; Feng, C.; Doubleday, K.; Florita, A.; Hodge, B.M. A review of behind-the-meter solar forecasting. Renew. Sustain. Energy Rev. 2022, 160, 112224. [Google Scholar] [CrossRef]
  51. Takiyar, S. Grid reliability enhancement by peak load forecasting with a PSO hybridized ANN model. In Proceedings of the 2015 4th International Conference on Reliability, Infocom Technologies and Optimization (ICRITO) (Trends and Future Directions), Noida, India, 2–4 September 2015; pp. 1–6. [Google Scholar]
  52. Selakov, A.; Ilić, S.; Vukmirović, S.; Kulić, F.; Erdeljan, A.; Gorecan, Z.; Gorečan, Z. A comparative analysis of SVM and ANN based hybrid model for short term load forecasting. In Proceedings of the PES T&D 2012, Orlando, FL, USA, 7–10 May 2012; pp. 1–5. [Google Scholar]
  53. Jacob, M.; Neves, C.; Vukadinović Greetham, D. Short Term Load Forecasting. In Forecasting and Assessing Risk of Individual Electricity Peaks; Springer International Publishing: Cham, Switzerland, 2020; pp. 15–37. [Google Scholar] [CrossRef]
  54. Sharma, D.; Lie, T.T.; Nair, N.K.C.; Vallès, B. Wind speed forecasting using ANN, ARMA and AIC hybrid to ensure power grid reliability. In Proceedings of the 2015 IEEE Innovative Smart Grid Technologies-Asia (ISGT ASIA), Bangkok, Thailand, 3–6 November 2015; pp. 1–5. [Google Scholar]
  55. Colak, I.; Yesilbudak, M.; Genc, N.; Bayindir, R. Multi-period prediction of solar radiation using ARMA and ARIMA models. In Proceedings of the 2015 IEEE 14th International Conference on Machine Learning and Applications (ICMLA), Miami, FL, USA, 9–11 December 2015; pp. 1045–1049. [Google Scholar]
  56. Karthika, S.; Margaret, V.; Balaraman, K. Hybrid short term load forecasting using ARIMA-SVM. In Proceedings of the 2017 Innovations in Power and Advanced Computing Technologies (i-PACT), Vellore, India, 21–22 April 2017; pp. 1–7. [Google Scholar]
  57. Al Amin, M.A.; Hoque, M.A. Comparison of ARIMA and SVM for short-term load forecasting. In Proceedings of the 2019 9th Annual Information Technology, Electromechanical Engineering and Microelectronics Conference (IEMECON), Jaipur, India, 13–15 March 2019; pp. 1–6. [Google Scholar]
  58. Zhang, X. Dynamic Forecasting of Power System Load Based on Kalman Filter. In Proceedings of the 2022 2nd International Conference on Electrical Engineering and Mechatronics Technology (ICEEMT), Virtual, 1–3 July 2022; pp. 337–342. [Google Scholar]
  59. Li, X.; Hu, L.; Zhai, L. Power load forecasting based on Improved Grey Model of particle swarm optimization. In Proceedings of the 2021 4th International Conference on Advanced Electronic Materials, Computers and Software Engineering (AEMCSE), Changsha, China, 26–28 March 2021; pp. 237–240. [Google Scholar]
  60. Ji, P.; Xiong, D.; Wang, P.; Chen, J. A study on exponential smoothing model for load forecasting. In Proceedings of the 2012 Asia-Pacific Power and Energy Engineering Conference, Shanghai, China, 27–29 March 2012; pp. 1–4. [Google Scholar]
  61. ElMenshawy, M.S.; Massoud, A.M. Short-Term Load Forecasting in Active Distribution Networks using Forgetting Factor Adaptive Extended Kalman Filter. IEEE Access 2023, 11, 103916–103924. [Google Scholar] [CrossRef]
  62. Cecati, C.; Kolbusz, J.; Różycki, P.; Siano, P.; Wilamowski, B.M. A novel RBF training algorithm for short-term electric load forecasting and comparative studies. IEEE Trans. Ind. Electron. 2015, 62, 6519–6529. [Google Scholar] [CrossRef]
  63. Jin, M.; Zhou, X.; Zhang, Z.M.; Tentzeris, M.M. Short-term power load forecasting using grey correlation contest modeling. Expert Syst. Appl. 2012, 39, 773–779. [Google Scholar] [CrossRef]
  64. Farhoumandi, M.; Bahrami, A.; Shahidehpour, M.; Jones, J.; Madvesh, C.; Kakumanu, K.; Ludlow, T.; Alarian, H.; Mishra, A.; Abdul-Rahman, K.H. Short-term Forecasting of Non-Conforming Net Load Using a Fusion Model with Machine Learning and Deep Learning Methods. In Proceedings of the 2023 9th International Conference on Control, Decision and Information Technologies (CoDIT), Rome, Italy, 3–6 July 2023; pp. 2414–2419. [Google Scholar]
  65. Dai, Y.; Zhao, P. A hybrid load forecasting model based on support vector machine with intelligent methods for feature selection and parameter optimization. Appl. Energy 2020, 279, 115332. [Google Scholar] [CrossRef]
  66. Ye, N.; Liu, Y.; Wang, Y. Short-term power load forecasting based on SVM. In Proceedings of the World Automation Congress 2012, Puerto Vallarta, Mexico, 24–28 June 2012; pp. 47–51. [Google Scholar]
  67. Khan, R.A.; Dewangan, C.; Srivastava, S.; Chakrabarti, S. Short term load forecasting using SVM models. In Proceedings of the 2018 IEEE 8th Power India International Conference (PIICON), Kurukshetra, India, 10–12 December 2018; pp. 1–5. [Google Scholar]
  68. Huy, T.H.B.; Vo, D.N.; Nguyen, K.P.; Huynh, V.Q.; Huynh, M.Q.; Truong, K.H. Short-Term Load Forecasting in Power System Using CNN-LSTM Neural Network. In Proceedings of the 2023 Asia Meeting on Environment and Electrical Engineering (EEE-AM), Hanoi, Vietnam, 13–15 November 2023; pp. 1–6. [Google Scholar]
  69. Kong, W.; Dong, Z.Y.; Jia, Y.; Hill, D.J.; Xu, Y.; Zhang, Y. Short-term residential load forecasting based on LSTM recurrent neural network. IEEE Trans. Smart Grid 2017, 10, 841–851. [Google Scholar] [CrossRef]
  70. Hossain, M.S.; Mahmood, H. Short-term load forecasting using an LSTM neural network. In Proceedings of the 2020 IEEE Power and Energy Conference at Illinois (PECI), Champaign, IL, USA, 27–28 February 2020; pp. 1–6. [Google Scholar]
  71. Mansoor, M.; Grimaccia, F.; Leva, S.; Mussetta, M. Comparison of echo state network and feed-forward neural networks in electrical load forecasting for demand response programs. Math. Comput. Simul. 2021, 184, 282–293. [Google Scholar] [CrossRef]
  72. Zheng, J.; Xu, C.; Zhang, Z.; Li, X. Electric load forecasting in smart grids using long-short-term-memory based recurrent neural network. In Proceedings of the 2017 51st Annual Conference on Information Sciences and Systems (CISS), Baltimore, MD, USA, 22–24 March 2017; pp. 1–6. [Google Scholar]
  73. Rodrigues, F.; Cardeira, C.; Calado, J.M.; Melicio, R. Short-Term Load Forecasting of Electricity Demand for the Residential Sector Based on Modelling Techniques: A Systematic Review. Energies 2023, 16, 4098. [Google Scholar] [CrossRef]
  74. Bacanin, N.; Stoean, C.; Zivkovic, M.; Rakic, M.; Strulak-Wójcikiewicz, R.; Stoean, R. On the benefits of using metaheuristics in the hyperparameter tuning of deep learning models for energy load forecasting. Energies 2023, 16, 1434. [Google Scholar] [CrossRef]
  75. Shabbir, N.; Vassiljeva, K.; Nourollahi Hokmabad, H.; Husev, O.; Petlenkov, E.; Belikov, J. Comparative Analysis of Machine Learning Techniques for Non-Intrusive Load Monitoring. Electronics 2024, 13, 1420. [Google Scholar] [CrossRef]
  76. Wood, M.; Ogliari, E.; Nespoli, A.; Simpkins, T.; Leva, S. Day Ahead Electric Load Forecast: A Comprehensive LSTM-EMD Methodology and Several Diverse Case Studies. Forecasting 2023, 5, 297–314. [Google Scholar] [CrossRef]
  77. U.S. Energy Information Administration Press Release. Available online: https://www.eia.gov/pressroom/releases/press550.php (accessed on 15 March 2024).
  78. DeRoche, M. Cryptocurrency Miners Need to Report Their Energy Use. Available online: https://earthjustice.org/experts/mandy-deroche/cryptocurrency-miners-need-to-report-their-energy-use (accessed on 15 March 2024).
  79. Cha, J.W.; Joo, S.K. Probabilistic Short-Term Load Forecasting Incorporating Behind-the-Meter (BTM) Photovoltaic (PV) Generation and Battery Energy Storage Systems (BESSs). Energies 2021, 14, 7067. [Google Scholar] [CrossRef]
  80. Hasan, A.J.; Rahman, M.S.; Islam, M.S.; Yusuf, J. Data driven energy theft localization in a distribution network. In Proceedings of the 2023 International Conference on Information and Communication Technology for Sustainable Development (ICICT4SD), Dhaka, Bangladesh, 21–23 September 2023; pp. 388–392. [Google Scholar]
  81. Fekri, M.N.; Patel, H.; Grolinger, K.; Sharma, V. Deep learning for load forecasting with smart meter data: Online Adaptive Recurrent Neural Network. Appl. Energy 2021, 282, 116177. [Google Scholar] [CrossRef]
  82. Andriopoulos, N.; Magklaras, A.; Birbas, A.; Papalexopoulos, A.; Valouxis, C.; Daskalaki, S.; Birbas, M.; Housos, E.; Papaioannou, G.P. Short term electric load forecasting based on data transformation and statistical machine learning. Appl. Sci. 2020, 11, 158. [Google Scholar] [CrossRef]
  83. Ibrahem, M.I.; Nabil, M.; Fouda, M.M.; Mahmoud, M.M.; Alasmary, W.; Alsolami, F. Efficient privacy-preserving electricity theft detection with dynamic billing and load monitoring for AMI networks. IEEE Internet Things J. 2020, 8, 1243–1258. [Google Scholar] [CrossRef]
  84. Abdalzaher, M.S.; Fouda, M.M.; Ibrahem, M.I. Data privacy preservation and security in smart metering systems. Energies 2022, 15, 7419. [Google Scholar] [CrossRef]
  85. Proedrou, E. A comprehensive review of residential electricity load profile models. IEEE Access 2021, 9, 12114–12133. [Google Scholar] [CrossRef]
  86. De Carne, G.; Bruno, S.; Liserre, M.; La Scala, M. Distributed online load sensitivity identification by smart transformer and industrial metering. IEEE Trans. Ind. Appl. 2019, 55, 7328–7337. [Google Scholar] [CrossRef]
Figure 1. A general framework for load forecasting in BTM DERs within residential buildings, highlighting methodological integration.
Energies 17 02534 g001
Figure 2. A classification of FOM and BTM systems.
Energies 17 02534 g002
Figure 3. A schematic diagram of a BTM system with a data structure for load forecasting process.
Energies 17 02534 g003
Figure 4. Diverse Models for Load Forecasting.
Energies 17 02534 g004
Figure 5. A representation of diverse traditional load forecasting models.
Energies 17 02534 g005
Figure 6. An illustration of an SVM structure with hidden layers.
Energies 17 02534 g006
Figure 7. A description of an LSTM model architecture, highlighting its gates and hidden states.
Energies 17 02534 g007
Figure 8. A methodical procedure for model selection and optimization in a load forecasting process.
Energies 17 02534 g008
Figure 9. A normal operation of SMs in households without abnormal activity.
Energies 17 02534 g009
Figure 10. Anomaly activity in household customers.
Energies 17 02534 g010
Figure 11. A proposed anomaly detection framework considering BTM DERs in residential buildings.
Energies 17 02534 g011
Disclaimer/Publisher’s Note: The statements, opinions and data contained in all publications are solely those of the individual author(s) and contributor(s) and not of MDPI and/or the editor(s). MDPI and/or the editor(s) disclaim responsibility for any injury to people or property resulting from any ideas, methods, instructions or products referred to in the content.

