Article

Using Urban Building Energy Models for the Development of Sustainable Island Energy Systems

by
Jaime Cevallos-Sierra
1,2,*,
Afonso Pinto Gonçalves
2 and
Carlos Santos Silva
1,2,*
1
IN+, Center for Innovation, Technology and Policy Research/LARSyS, 1049-001 Lisbon, Portugal
2
Department of Mechanical Engineering, Instituto Superior Técnico, Universidade de Lisboa, 1049-001 Lisbon, Portugal
*
Authors to whom correspondence should be addressed.
Energies 2024, 17(13), 3135; https://doi.org/10.3390/en17133135
Submission received: 19 April 2024 / Revised: 9 June 2024 / Accepted: 20 June 2024 / Published: 26 June 2024
(This article belongs to the Collection Feature Paper Collection: Energy and Buildings)

Abstract

:
This study evaluates the use of City Energy Analyst, an urban building energy modelling tool, to design zero-carbon energy communities in low-industry isolated island settings. The research aims to test the effectiveness of the software during the development of sustainable energy systems in isolated microgrids and compares it with the widely used tool EnergyPLAN. The goal of the study focused on making a community self-sustainable, considering the rooftop area available in the populated settlements to install photovoltaic systems and distributed storage capacity. With this purpose in mind, the evaluated tool estimated the energy consumption of each building and the respective total annual consumption of Corvo Island, a location that is naturally isolated and dependent on fossil fuels. The results demonstrated that City Energy Analyst is an innovative tool to estimate energy consumption and potential energy generation of photovoltaic systems in a remote location, providing additional features to a traditional model and motivating further development of the associated plug-in. However, it requires initial time-consuming efforts to build a reliable model. As a complement, EnergyPLAN can be used to enhance the design, with the integration of the local existing and potential generation sources and to confirm the stability of the overall energy system. This tool introduced additional wind capacity and centralized storage into the model, testing the balance of the system. Therefore, the study proposes a framework combining the strengths of both tools to measure island energy systems, as they can complement each other, to build a strong analysis model.

1. Introduction

Climate change, driven by greenhouse gas emissions, is a global concern with significant environmental and health impacts, where the energy sector, dominated by coal, oil, and natural gas, is a major contributor. Despite this, renewable energy sources are gaining ground [1]. As the European Union aims to bring clean energy to its islands, new opportunities have appeared for these locations to become climate-neutral and achieve net-zero greenhouse gas emissions by 2050 [2]. Energy communities are crucial to accelerating the clean energy transition by facilitating collective and citizen-led energy initiatives, as they enhance energy efficiency, reduce electricity costs, create local jobs, and contribute to the flexibility of the electrical system [3]. The study proposed in this document evaluates the urban building energy modelling (UBEM) tool, City Energy Analyst (CEA), and compares it with the widely used tool EnergyPLAN, focusing on the design of sustainable energy systems and their application in low-industry isolated settings.
This research considered the use of two bottom-up energy modelling tools: CEA and EnergyPLAN, which are briefly characterized and described as follows. First, EnergyPLAN has been used commonly to assess the economic, environmental, and technical impact of energy systems, aiding strategic development. This software uses user input parameters and renewable energy source data to calculate outcomes, select strategies, and simulate an entire system, considering hourly and annual data during the evaluations [4]. The use of EnergyPLAN in the design of sustainable energy systems for microgrids on remote islands is well documented; in Portugal alone, various studies have evaluated the scenario of 100% renewable energy sources for its archipelagos, such as those of Reia [5], modelling two scenarios for Corvo Island, Alves et al. [6,7] assessing the interconnection of Pico and Faial islands to increase the penetration of renewable energy sources (RESs), and Monteiro [8] on the island of Madeira, achieving possible significant reductions in emissions and costs by 2050. Additionally, many other studies have executed similar analyses of islands worldwide and proposed novel strategies to increase the penetration of RE, e.g., a carbon-neutral island energy system using intermittent renewable energy sources and the vehicle-to-grid concept proposed by Dorotic et al. [9], the use of local renewable electricity through battery energy storage systems (BEESs), using thermal storage examined by Marczinkowski et al. [10], and the examination of energy requirements and the potential of RE sources on Wang-An Island [11].
The evaluated tool, CEA, is an open-source framework able to simulate the energy demand and potential renewable energy generation of a group of buildings. It analyzes the energy performance of an urban area to achieve sustainability and efficiency goals by providing detailed insights [12]. Although this tool has limited capacity to simulate an entire electric system, especially in the generation and distribution sectors, this software can provide greater insight into the consumption side, helping users manage the energy efficiency of the district at an individual level; e.g., upgrading the architecture and technology of the buildings to reduce energy demand. Some examples showing its use are Jewell et al. [13] presenting a district energy infrastructure design for the project Vale de Santo Antonio in Lisbon, highlighting the impact of building renovations on heat demand; Mendes [14] developing an energy management platform for the IST Alameda Campus, showing significant energy consumption reduction by replacing lighting equipment; Adman [15] evaluating solar radiation on buildings in Lisbon; Mora et al. [16] comparing dynamic urban-scale tools to assess energy demand in the historical district of Venice; and Romero et al. [17] introducing a computational methodology combining the microclimate model ENVI-met with CEA to assess building energy demand at a district scale.
Still, the development of a fair model will require access to other types of relevant information, such as architectural characteristics, technology in use, and occupant behavior, raising an initial limitation while implementing this tool in the proposed environments [18]. One important factor to consider in UBEM models is the U-value factor of the elements in the envelope of the buildings, which may vary considerably across locations. Fortunately, this parameter can be determined accurately through various methods [19]. In addition, the development of archetypes is considered one of the biggest challenges using UBEMs as there is great uncertainty about building stocks [20], especially in island environments. Similarly, Hong et al. identified that a technical limitation of these models includes the simulation of different data exchange mechanisms, and the synchronization methods to control several interconnected systems [21]. The authors believe that the present study can help enhance the limitations highlighted by Hong et al., increasing the strengths of UBEMs by coupling them with other bottom-up tools.
The gaps in the literature, identified by the lack of the use of CEA in these isolated environments, as well as the different benefits highlighted through the discussed articles, support the rationale for this work. While many studies have focused on evaluating sustainable energy systems in islands using different computer software, none have yet used the CEA in such settings, as most of the research conducted using this tool has concentrated on modelling urban districts or regions connected to large-scale networks. Through the proposed study, the authors attempted to identify the best way to design island energy systems, giving the greatest emphasis possible to the consumption sector and including energy efficiency in the analysis. When comparing these two software applications, an attempt has been made to achieve the proposed goal, taking advantage of the strengths of each one. Furthermore, the proposed methodology could be applied in isolated regions worldwide with limited information on their urban electricity consumption.
The study proposed in this document proposes the use of two computational tools and their results when simulating island energy systems (IESs), according to the following structure: First, the introduction chapter presents the background, aims of the study, and a brief description of both tools and their uses throughout the available literature. Next, Section 2 describes the energy system of Corvo Island as the case study selected for the analysis, followed by Section 3 presenting the methodology, processes of data collection, model development, and the configuration of both tools. Section 4 states the results of the models and Section 5 discusses their implications when developing IES models using these tools. Finally, the conclusion summarizes the study findings and recommends future research related to this topic.

2. Case Study

The island of Corvo, part of the western group of the Azores archipelago and a UNESCO Biosphere Reserve, was chosen for this study seeking to evaluate the accuracy and feasibility of CEA in terms of creating sustainable energy systems in remote microgrids. This island has a 17.1 km2 volcanic landscape located at the geographical coordinates 39°42′ N, 31°6′ W. According to the 2021 census [22], it has a population of 384 people with a socio-economic structure leaning towards the tertiary sector. Land use is divided between agriculture (34.05%), urban areas (2.05%), and natural vegetation/hydric resources (67.7%).
Architecture—the urbanized area is located at the south of the island, with about 195 buildings [23]. The dissertation by Salvador [24] categorized them into religious, public equipment, services, commerce, restaurants, storage, housing, and ruins. However, the proposed study has simplified the number of categories into the following five sectors: housing, services/commerce, industry, parking/storage, and ruin/unoccupied, which are compared in the left column of Table 1. It is worth mentioning that the 2021 census does not differentiate between building types, and Salvador only defines each type in the historic urban nucleus of Vila do Corvo (Figure 1). The variation between sources in total occupied buildings is about 25, making precise identification challenging, which is crucial to obtaining reliable results. Furthermore, Salvador et al. [23] measured and differentiated between single-story and two-story buildings on the island, finding that 92% of the constructions are two-story buildings, with an average number of one family occupying each house.
Island Energy System—the energy supply and demand data for Corvo Island was provided by Electricity of Azores (EDA). According to this company, the energy generation system of the island is primarily powered by diesel fuel, counting on an installed power of 1.01 MW from diesel generators and 75 kW from photovoltaic panels [25]. Additionally, an expanded power capacity of 700 kW from wind power and 75 kW from photovoltaic panels is expected to be commissioned in future. Regarding energy consumption, the data show that consumption remains constant in most months of the year, except for May and June, as shown in Figure 2. Although EDA does not provide explanations for these variations.
Corvo Weather—the PVGIS website [26], sourced from the meteorological data for Corvo Island in the year 2020, includes wind speed, global irradiance, and temperature. As seen in Figure 3a, the global solar irradiation of the island shows a parabolic trend throughout the year, which is mirrored by its ambient temperature. Similarly, the Azores archipelago, including Corvo Island, experiences frequent winds due to atmospheric circulation systems. Figure 3b presents the annual wind speed variations of the area. Both sets of data were used to feed the models of the study.

3. Materials and Methods

This chapter details the research approach of applying both tools in the study of the case of Corvo Island. The primary objective of this research was to determine the accuracy and viability of CEA during the development of sustainable energy systems in isolated microgrids. The description of this process covers data collection methods, data analysis techniques, research model design, input data and results validation methodology, and discusses the limitations of the study. Figure 4 shows the flow of data in the proposed framework.

3.1. Data Collection and Preparation

The analysis of the tools CEA and EnergyPLAN focused on comparing some of their common functionalities, such as photovoltaic panel production and storage technology. Here, various websites, scientific articles, and academic theses provided the necessary information for the CEA model. Key information included meteorological files for Corvo Island, building characteristics (including type, use, and location), and energy consumption reports. In addition, the meteorological file from PVGIS was processed using EnergyPlus to meet the requirements of the tool and ensure a broad data range for accurate analysis. As EnergyPLAN does not estimate energy consumption and requires preset values for its configuration, the CEA output results were used to generate the required inputs for the second model, including the hourly annual distribution of total energy consumption and PV production. Even though wind power was not considered initially in the models, due to the absence of functionality in CEA, the wind speed distribution data of Corvo Island were collected to consider this source in an additional scenario using the EnergyPLAN model.

3.2. Data Inputs and Tool Configuration

3.2.1. City Energy Analyst

Since there was limited information available about the energy demand on Corvo Island, the CEA software has the advantage of generating hourly energy demand and potential renewable energy supply profiles for each building simulated, using the native Swiss building database and the weather file created with PVGIS and processed with EnergyPlus. The CEA model was initialized using the tool Create New Scenario, selecting the urbanized area of Vila do Corvo. With the use of this functionality, CEA automatically generated the geometries for each building in the scenario and assigned a use type to each one according to the information available in the OpenStreetMap website. However, this feature required manual adjustment as most buildings were automatically classified as MULTI RESIDENTIAL. The final use of the buildings in the area selected for this model is presented in the righthand column of Table 1.
The characteristics of each building archetype were configured using the tabs in the Input Editor tool: Zone, Topology, Internal Loads, and Supply Systems, based on the following considerations:
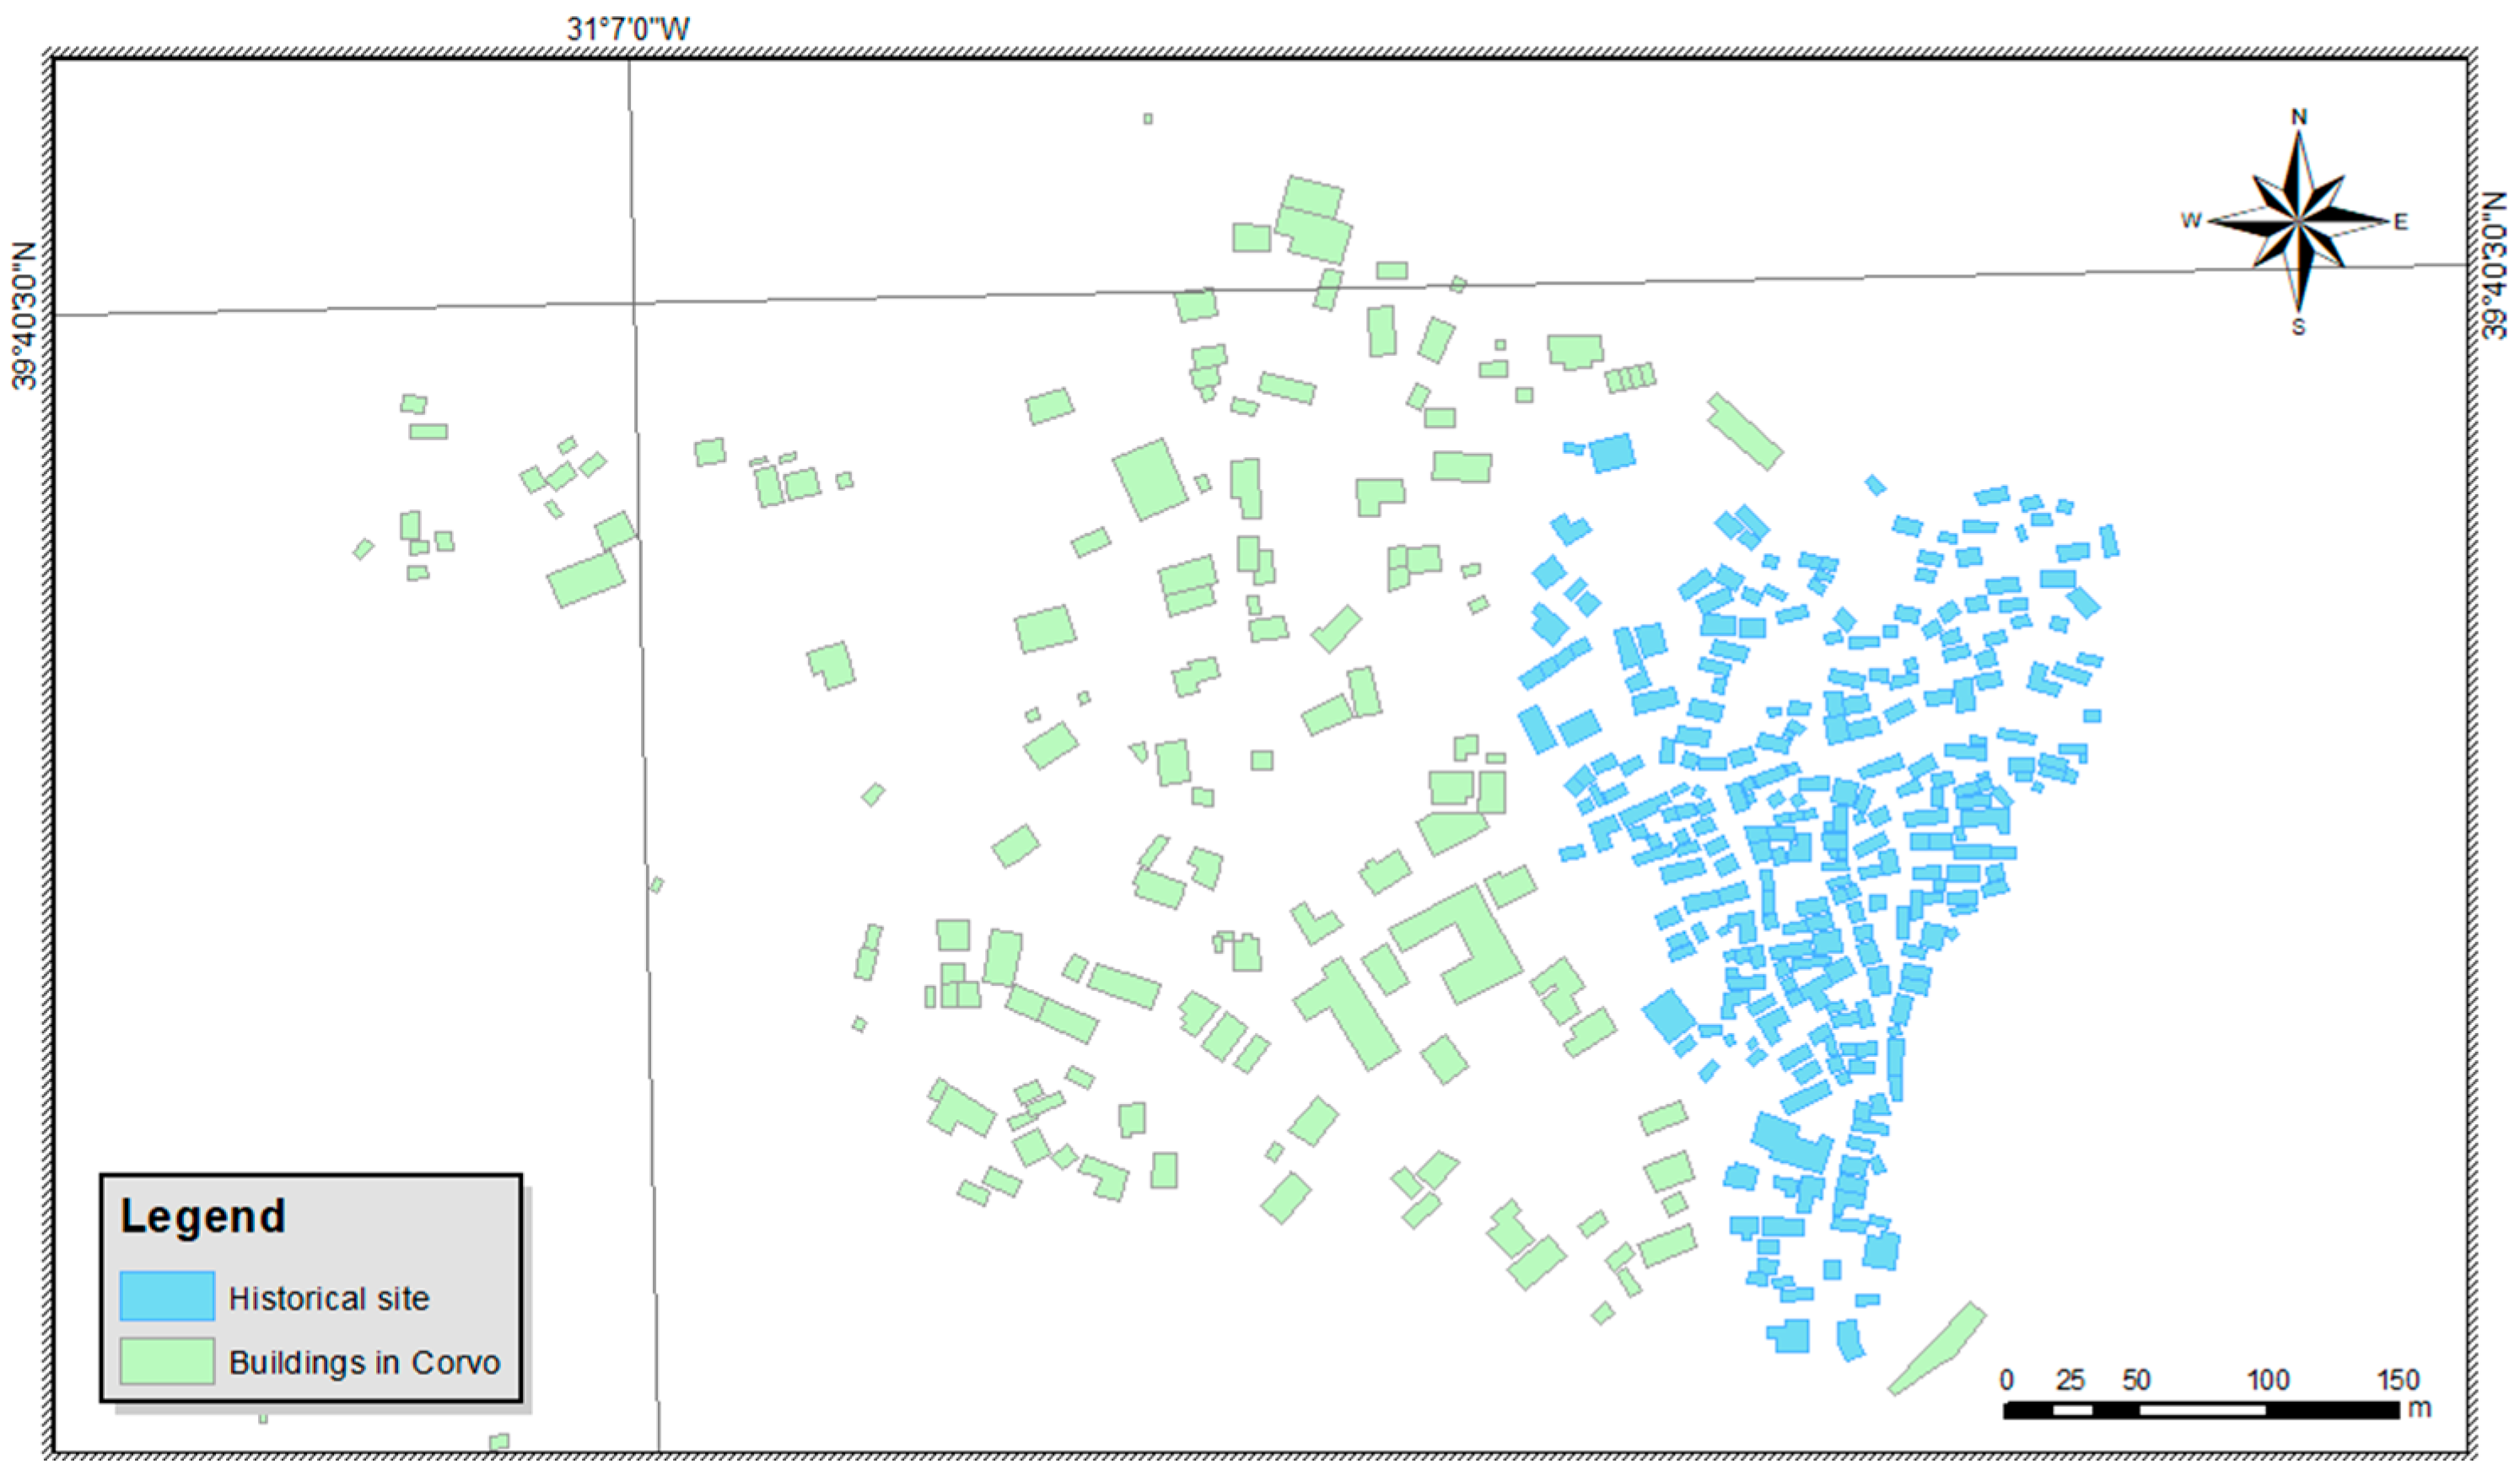
  • Each building use type was manually assigned according to the classification of Salvador [19], including the options described in left column of Table 1. These changes were made only for the buildings within the “Historic urban nucleus of Vila do Corvo”. The use type of the remaining buildings was assigned according to additional information available, and otherwise as SINGLE RESIDENTIAL buildings.
  • Two additional building use types were created based on the classification of Salvador [20]: RUIN—this category included unoccupied and ruined buildings, with all loads set to zero implying no consumption; and CHURCH—derived from the OFFICE use type, characterizing the schedules of religious buildings.
  • Considering that over 90% of the houses have two above-ground floors [19], all buildings were set with two above-ground floors and a height of 6 m. Similarly, the values for below-ground properties were set to zero in every building.
  • For SINGLE RESIDENTIAL buildings, their occupancy, setpoint, and setback temperatures were adjusted given the common house temperatures in Portugal, where heating was set to start below 16 °C and cooling above 26 °C. The occupancy density was changed to 56 occ/m2 to approximately match the population.
  • The supply system technologies for water, heating, and space comfort were configured to electrify every energy service in the buildings using heat pumps. The case of water heating considered a demand for medium-temperature water (up to 45 degrees) using water–water heat pumps, while air–air heat pumps were considered only for space heating.
  • The energy consumption of PARKING properties was set to zero due to the lack of electric mobility on the island, and the buildings in this category are typically used for storage, generally lacking air conditioning and using minimal electricity for lighting.
  • Additional changes to the default building database included: a reduction of 50% in electrical needs of appliances (to 3.5 W/m2), identical temperature settings to all residential buildings, and schedule adjustments during weekends to reflect higher attendance, according to Portuguese culture.
After assigning all the architectural and technological features to each structure in the model, the calculation tools Data Management, Demand Forecasting, and Energy Potentials were executed to generate the desired output data. Here, the parameters of the functionality Demand Forecasting remained almost unaltered during the process, keeping a deterministic schedule model with an hourly resolution output, while in Building Solar Radiation, the parameter Zone Geometry was set to 1 to represent complex geometries (despite increasing computational demand). Since this study focused on electric-powered energy systems, the only functionality executed of the Energy Potentials tools was Photovoltaic Panels. The technology of the panels selected for the system was the commonly used monocrystalline cell type, considering the optimal tilt angle of the modules (tilt calculated automatically by the tool) on only the rooftops of buildings. The roof coverage of the panels was set to 75% of the total area to consider the space occupied by antennas, chimneys, and other objects. This high value was selected to allow for the high participation of solar generation in the system and to confirm whether it is possible to achieve the proposed goals of the research using only the area available on the roofs of the town.
In addition, the storage capacity plug-in can simulate battery banks in any CEA model, which is currently in development by the Center for Innovation, Technology and Policy Research (IN+), and is available for download from the official website. This extension makes it possible to simulate electric batteries in each building of the system to store the excess energy from the panels and supply it during deficits. The installed capacity of the storage for each building is sized according to the estimated number of people inhabiting each building, a value that was previously estimated by CEA. In the model, energy deficit represents the inability of the PV system to satisfy the demand that must be imported from the grid, while excess energy demonstrates the amount of energy that cannot be stored and hence is dumped onto the grid. For this study, all excess energy was considered wasted; for this reason, it is important to size the battery bank properly to minimize generation losses. The Tesla Powerwall+ [27] was the technology chosen to feed the parameters in the plug-in, as presented in Table 2.

3.2.2. EnergyPLAN

This section presents a description of the provided inputs and changes in the configuration of the EnergyPLAN model. This application was configured providing specific values and files from the case study; most of which were generated previously in CEA. This model considered three different supply and storage configurations to achieve the aim of the research. Although the ability to install PV panels on the rooftops of the town is limited, to achieve a 100% RE system on the island, the installed PV and storage capacities must be large enough to eliminate energy imports. For this reason, the first configuration focused on identifying the optimal capacity of the technologies to satisfy local electric demand without considering rooftop area limits, while the second configuration considered the limit of rooftop area using the CEA model (2500 MWp) and calculated the minimum storage required to maintain grid balance. Finally, the third configuration included the use of wind power capacity in the system. Similarly to the previous tool, any energy generated but not used or stored was considered lost. Therefore, it is important to reduce as much as possible this energy excess via the efficient sizing and configuration of the model.
The configuration of the model in each scenario required modifying the options of Demand/Electricity, Supply/Variable Renewable Electricity, and Balancing and Storage/Electricity, as described next:
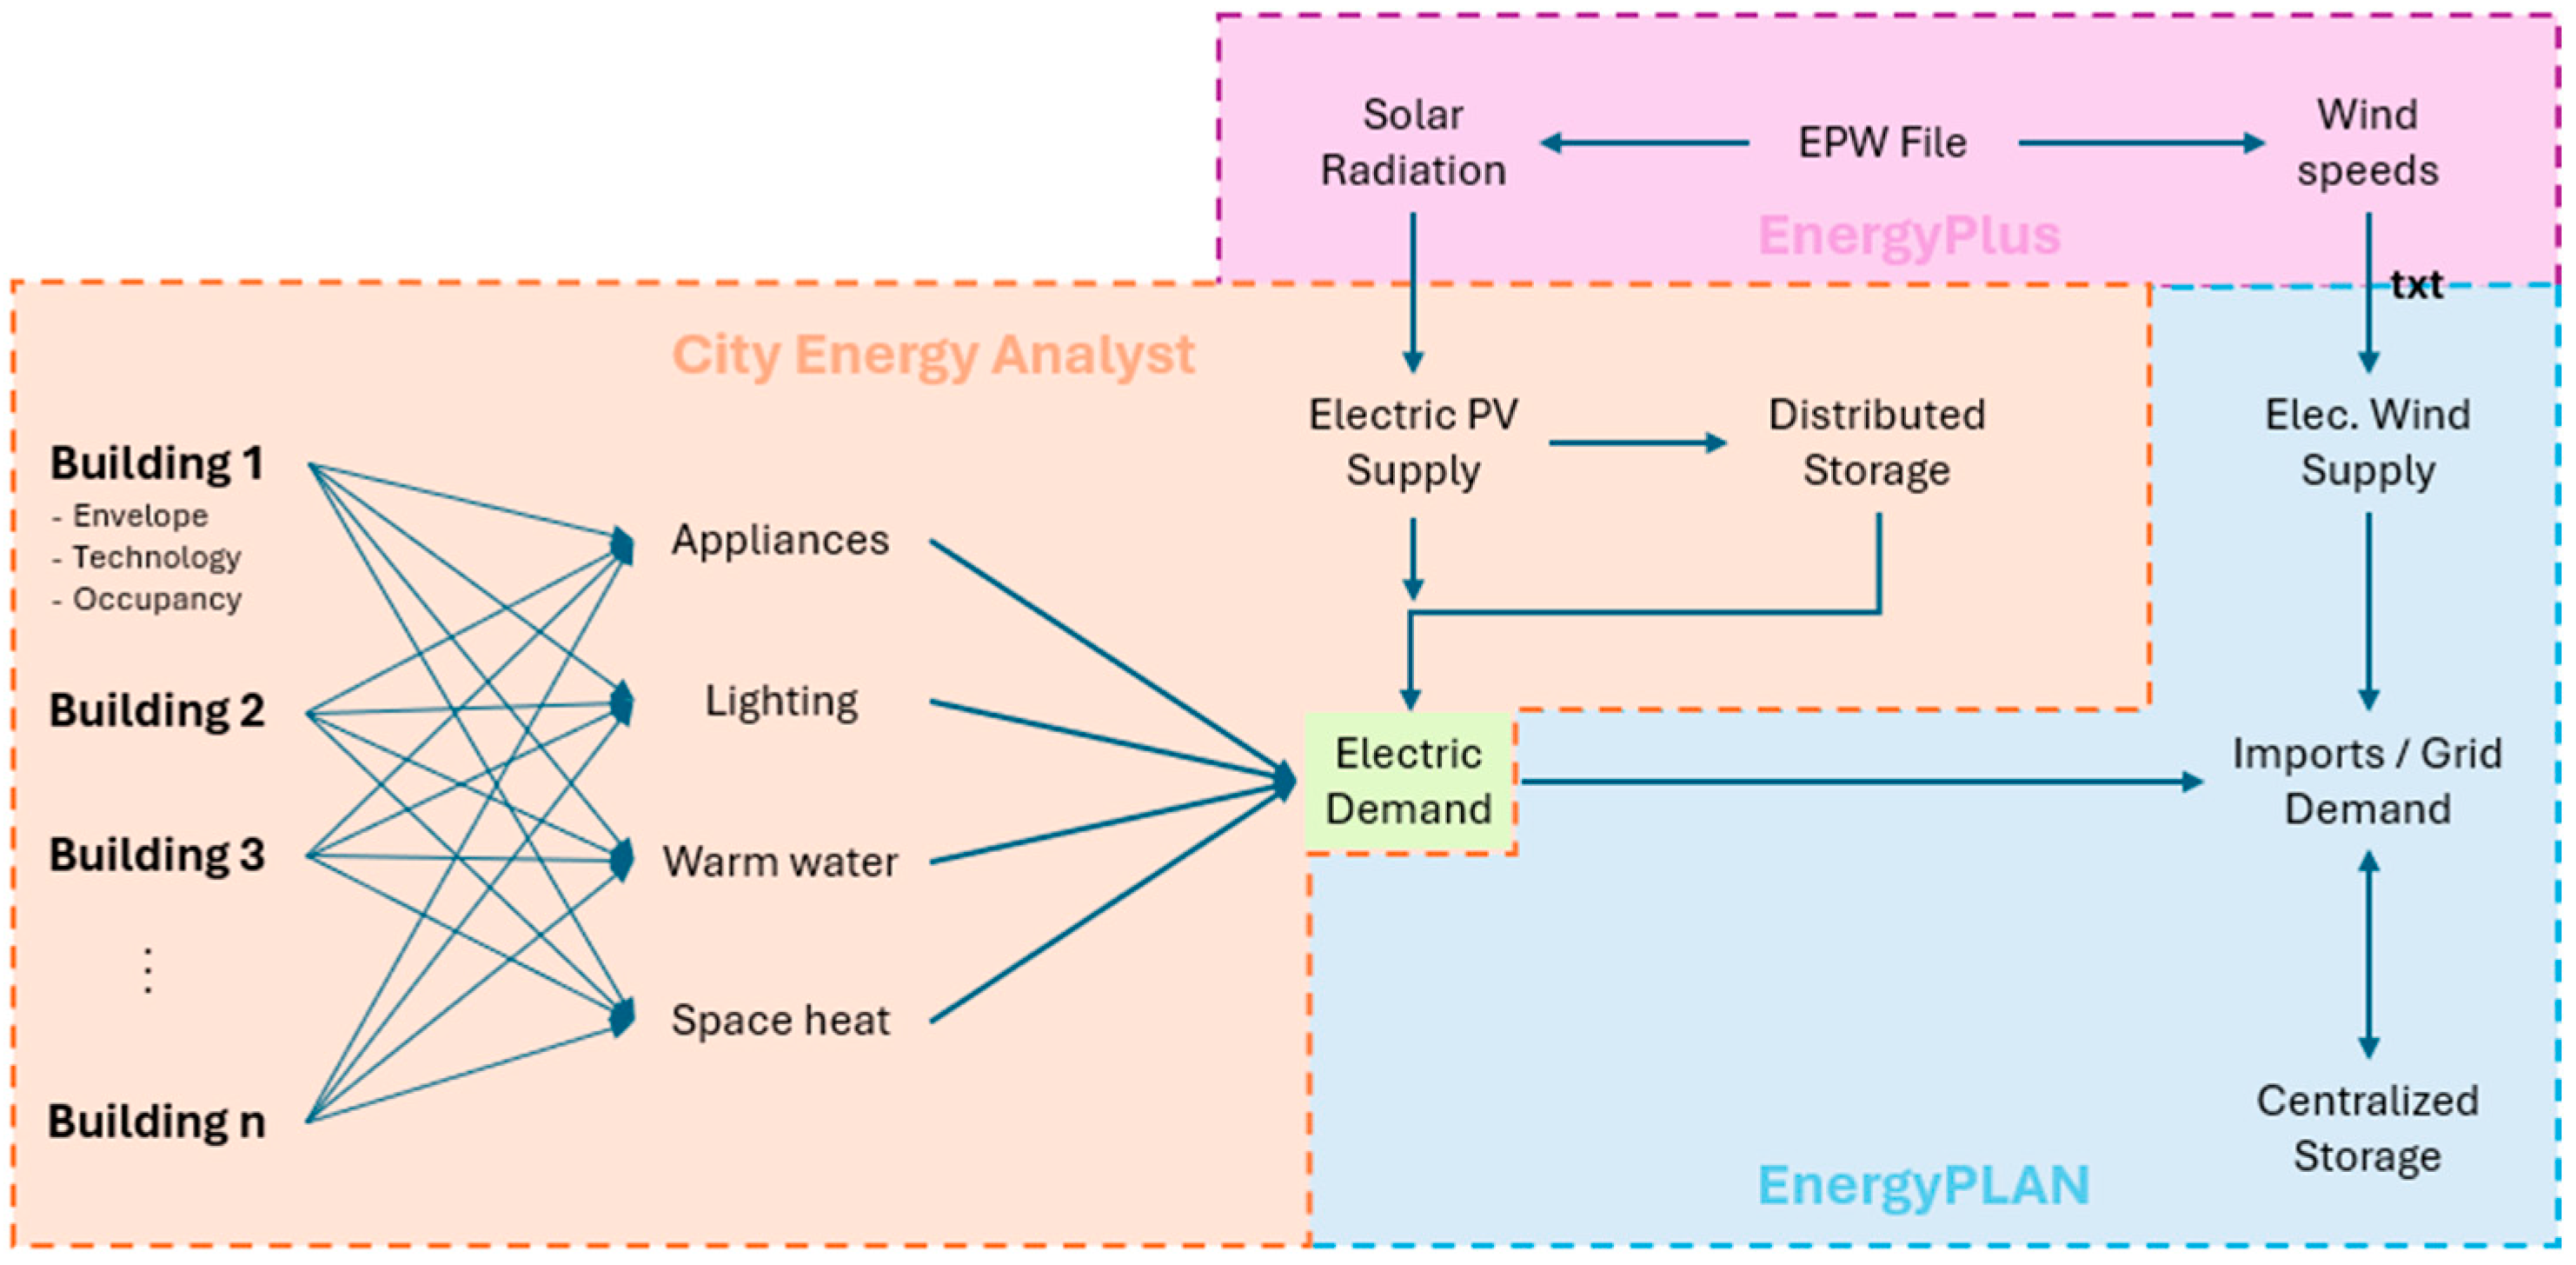
  • Demand—the total electric demand fed to the model was calculated from the CEA results to obtain the district hourly (kWh) and total energy demand (equal to 1.74 GWh/year). The input files for this model were created using the Python programming language to sum the electric demand of all the buildings in each hour of the year and generate the input distribution file, which had to meet the criteria first, i.e., distribution files in “.txt” format containing one column with approximately 8784 rows corresponding to the total hours in a 366-day year. Both hourly and annual values remained equal in the three scenarios proposed during the analysis in this model.
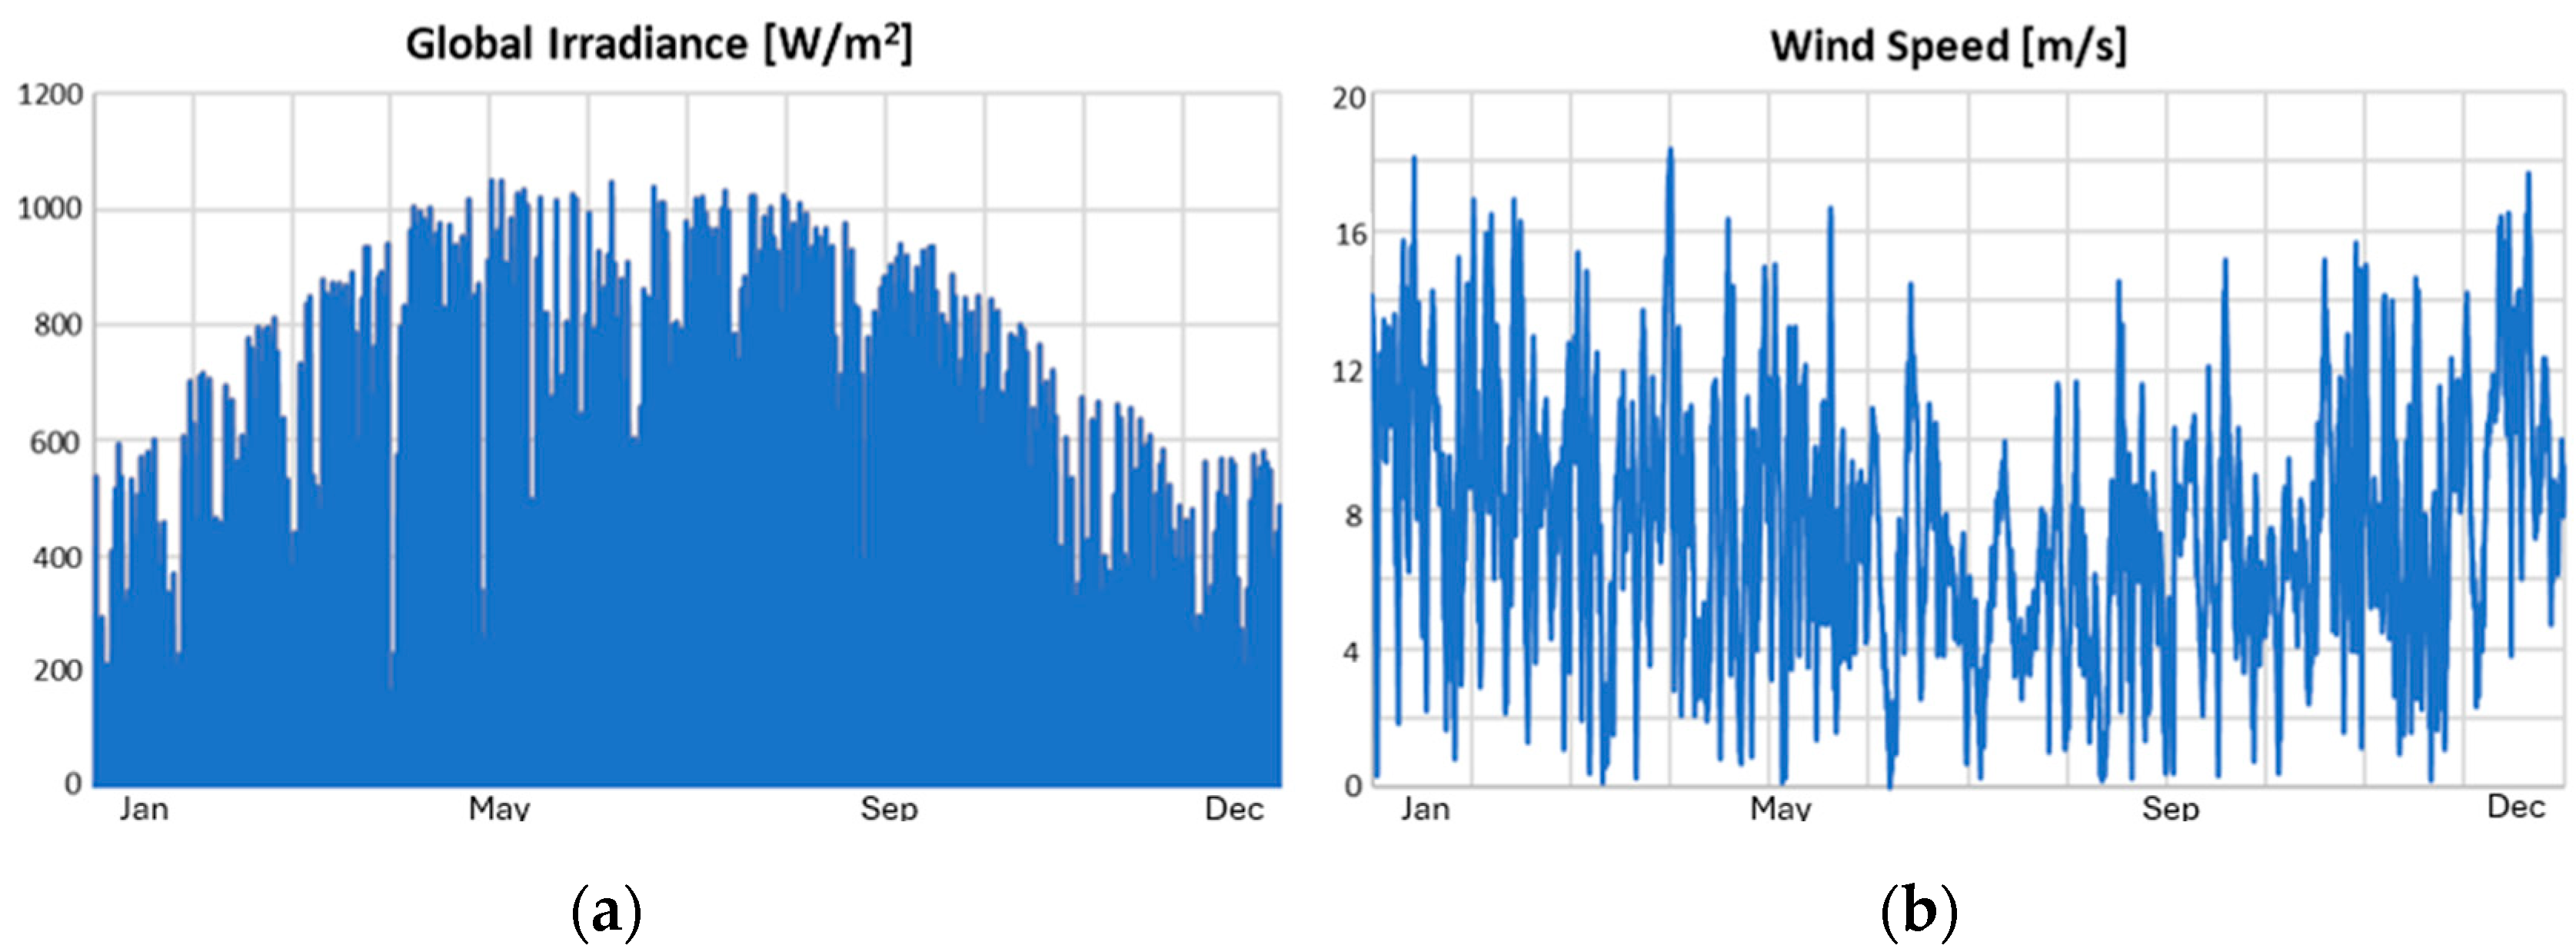
  • Variable Renewable Electricity—this option required specifying the installed capacity, stabilization profile, and distribution generation files of each renewable production technology, which considered three different scenarios: one scenario considering optimal solar and storage capacities according to the tool, one considering the same solar power constraints as in the CEA model, and one included wind power generation. Similarly to the demand files, the PV generation profiles were generated using the output results of CEA, while the wind power generation profiles were calculated using the wind speed recorded in the typical meteorological year (TMY) by EnergyPlus weather files.
  • Balancing and Storage—in this option the only parameter considered was electric storage, which represents a generic storage technology able to charge and discharge a fixed storage capacity, with specific efficiencies. As in previous models, the Tesla Powerwall+ was the selected battery technology to feed the parameters of the model; e.g., according to the specifications of the manufacturer, it has a charge and discharge capacity of 7 kW (with both efficiencies equal to 90%) and a fixed storage capacity of 7.898 kWh per unit [23].
Additional configuration of the tool considered a technical simulation aiming to analyze complex energy systems at regional and national levels, reducing excess energy production and limiting fossil fuel use in line with regulatory measures, and keeping the remaining routines in the method unaltered. Additionally, the basic configuration of energy units was adjusted to kilowatts (kW) to better suit the scale of energy demand and supply in the case study. Similarly to the previous tool, grid stabilization was not considered in this model as it must be met by enough battery backup. Finally, the simulation feature Run Serial Calculation was used to determine the installable capacity of the system based on present conditions.

3.3. Validation of Data and Results

After analyzing the feasibility of a fossil fuel-free system on Corvo Island, relying on photovoltaic energy distributed across the edifications of the settlement, benchmark data were selected to validate the outputs of both models, setting the boundaries and comparing their results where the storage levels could not exceed capacity boundaries, i.e., total energy consumption must match with real historical data and energy production should align with PVGIS and EnergyPlus files. An important assumption in the EnergyPLAN model required that energy imports must remain equal to zero. If met, the results were considered to be reliable. The data files used as a benchmark were the EDA consumption data and the PVGIS and EnergyPLAN estimates.

4. Results

The present work tested two tools, applying them to a remote and low-industry island energy system, intending to evaluate their ability to simulate an entirely sustainable IES. EnergyPLAN, which is a tool that has proven to be effective in such situations, is compared with a novel approach of using UBEMs. This chapter presents the results of the models highlighting their most important findings.

4.1. City Energy Analyst

The final model of CEA generated a total of 450 buildings, which more than doubles the structures reported in the 2021 census. This discrepancy occurred partly due to the tool considering multiple buildings within properties, leading to an inflated count. Despite this, the overall consumption results were close to the reported values, with slight differences for Parking/Storage and Services/Commerce and larger differences for the Ruin/Unoccupied and Single Residential sectors. The Industry sector could not be compared with benchmark data as it only corresponds to the historic urban core of the town.
The total annual consumption of the model diverged from the values reported by EDA by 13%, primarily due to disparities in the residential and commercial sectors (Table 3). The results of consumption by group showed that Single Residential buildings demand almost 60% of the energy, reaching 982.89 MWh/year, which is expected given the large share of residential buildings on the island. In the model, the residential sector spent more energy than reported due to differences between the assumptions and the reality of the island, particularly regarding space comfort and water heating. Hence, this amount did not consider the energy required for space comfort, due to over 85% of the structures on the island lacking a heating system [21]. Moreover, Service/Commercial buildings demonstrated less energy consumption than reported, probably because the model does not account for the demand of the airport, which consumes about 121 MWh annually.
The resulting monthly distribution of energy consumption throughout the year (Figure 5) shows a direct correlation with the average outdoor temperature, as lower temperatures in January and February lead to higher energy consumption, while higher temperatures from July to September result in lower demand. Despite this, there is minimal annual variation in energy consumption, aligning with the average monthly consumption provided by EDA (as seen in Figure 2). Given these findings, the estimates of the tool are deemed reasonable and close to reality, making them reasonably reliable for energy estimation of this and similar scenarios.
The setup of PV panels, considering optimal fixed angles and covering up to 75% of the available roof area, produced enough electricity to satisfy the total demand of the island, requiring an installed power capacity of 2.5 MW (Table 4). The calibration of this parameter demonstrated that lowering PV coverage area might be unfeasible, since reducing this parameter would generate less energy than the 1.736 GWh of electricity required by local demand, e.g., by using a 50% occupied roof area. However, during the analysis of PV generation, the total annual electricity production of the CEA model reached a generation of almost 2.44 GWh per year, while PVGIS and EnergyPLAN estimates demonstrated productions of 2.9 GWh and 3.64 GWh, respectively. These discrepancies emerge due to PVGIS ignoring shadows cast by buildings and panels, and EnergyPLAN accounting only for optimal conditions. Therefore, despite being more conservative, the results of the CEA model are considered more accurate.
The results of the storage simulation demonstrated considerable interaction between the building PV systems and the public network, as it returned both energy deficits and excesses (as seen on Table 4). Although annual electric production from the panels met the total demand of the island, the current storage arrangement, using battery banks distributed along the structures of the town, does not satisfy the individual consumption needs of all the buildings during every hour of the year. This is partly because this plug-in does not consider the interaction between all of the participants of the model; hence, the excess energy is considered lost. Due to the inability of CEA to fully integrate a smart community perspective in an interconnected grid, it is still uncertain whether this tool can model and evaluate the scenario of a 100% sustainable energy system on its own. From these results, it can be concluded that the energy system sized by the CEA tool generally requires energy import and export from the public grid, making it not fully sustainable if the backup energy source remains dependent on fossil fuels.

4.2. EnergyPLAN

The results of this model calculated three sets of outcomes for the same annual electric demand. The first scenario accounted for a minimum of 5.5 MWp of installed PV capacity needed to achieve zero imports, without an energy deficit. However, the excess of energy resulted in considerably high waste, making it necessary to design a strategy to take advantage of this electric surplus. In addition, in this scenario the area required for the installation of PV panels considerably exceeds the available rooftop area on Corvo Island, as reported by the CEA model, which identifies the need to commission an additional PV farm. Yet, due to Corvo Island being a World Biosphere Reserve, this might not be feasible. The second scenario of this tool was used to test the configuration using the CEA framework, whose outcomes are shown in Table 5, validating the configuration of the CEA model, but confirmed minimum imports together with a lower energy excess than in the first scenario. This scenario showed an energy excess of one-third of the energy wasted in the first scenario.
Unlike the CEA model, the results of EnergyPLAN demonstrated a complete, independent, and sustainable renewable energy system. Still, the total solar energy production was considered more accurate in the CEA tool. Therefore, both tools were used complementarily; this synergy arose from the need to install another electricity production technology in addition to PV panels and to adjust the estimates of energy produced by renewable technologies. Here, an additional scenario was proposed to mix the functionalities of both tools and achieve the goal of the study by adding a complementary generation energy source. This scenario considered the available rooftop power capacity, together with the estimated solar production of the CEA model, resulting in a minimum installed capacity of 350 kWp to minimize the required storage in a zero-energy-imports scenario, as shown in the Synergy column of Table 5. Additionally, this approach added a correction value of “−1.22” to match the estimated produced energy with the calculated values generated by CEA. The configuration made it possible to consider the installation of PV panels only on the urbanized area together with small a wind turbine occupying less space and minimizing the impact to the flora and fauna of Corvo Island.

5. Discussion

This chapter will consider the advantages and disadvantages of both tools and explore the possibility of them working together to achieve stronger outcomes. To begin with, unfortunately EnergyPLAN cannot estimate energy consumption and requires users to select specific values of its calculation parameters, yet CEA can be used to automatically produce individual building demand and solar generation profiles. However, it requires careful configuration of the geometry and technologies in the model, leading to large time-consuming efforts during this process, or otherwise, it can potentially inflate estimated energy figures. In addition, given that the CEA model electrified all services in the system, with the goal of removing carbon-based fuels, it becomes inaccurate to compare both values other than an initial benchmark value.
Significant discrepancies occurred between the official reports and the results of CEA demand, especially in industrial structures due to unchanged characteristics of the Industry use type in the CEA database. The discrepancies of the Residential and Commercial sectors may be explained by the electrification goals of the model, a clear example is water heating that in Portugal is powered using natural gas; therefore, it is not accounted for in the electricity consumption of official reports, contributing to higher consumption estimate variations. Furthermore, the default Swiss database used for this study does not accurately represent the behavior of maintenance temperature in Portuguese buildings, leading to variations in the energy consumptions. Despite this, if the elements of the model are well calibrated, CEA can provide reasonable estimates regardless of limited information about structures and their locations. Still, further knowledge of the case study and the future development of the model are required to improve the results of this research.
Through the present study, it has been possible to identify the strengths and weaknesses of each technology, which can work complementarily rather than independently. First, in terms of electricity generation, CEA can only simulate solar photovoltaic technologies as a source of renewable electricity production, while EnergyPLAN supports many other technologies. Additionally, the optimal PV capacity in EnergyPLAN exceeded the maximum permissible roof area for installation and a greater energy surplus, increasing the necessity of proposing a solution for the critical excess of energy in IES. Furthermore, the CEA storage plug-in calculated unrealistic battery capacities for service/commercial buildings because the battery size for each building is calculated considering the number of people using the structure, which might not reflect the optimal battery bank size according to the scheduled demand and potential solar energy. Finally, it has been possible to identify that a limitation of the plug-in is its lack of evaluating the interconnection within the buildings in the case study, while Energy PLAN supports battery interconnection with up to three storage technologies within the overall system.
The results demonstrated that the installed capacities calculated by CEA were insufficient for a 100% sustainable system, while the capacities of EnergyPLAN were able to satisfy local demand. On the other hand, using only EnergyPLAN for this type of model might overlook the impossibility of installing the calculated power capacity of PV panels on the available rooftops of populated areas and the proposed energy efficiency measures. Although CEA provides conservative estimates for PV panel production, these values demonstrated more accuracy than the EnergyPLAN generation results, whose solar electricity production was 1.2 GWh/year higher than the CEA calculations. This leads to the conclusion that the EnergyPLAN model may result in oversized energy systems, which could be problematic for remote systems like the Corvo IES, causing a potentially undersized 100% sustainable energy system.
The results of both models have shown that the strengths of each tool are independent of each other. While CEA shows strong processing capabilities on the consumption side, modeling each building in the study case using its architecture, supply system technology, and occupancy behavior, it lacks the availability to integrate it with the generation and distribution sides. On the other hand, EnergyPLAN can evaluate the stability of an energy system considering specific user parameters, but it considers consumption as a fixed input value. Therefore, by using these tools together, a novel framework can be used to provide greater analysis on the consumption side of an energy system and allow users to model in greater detail the three main sectors of an energy system.

6. Conclusions

The present study has evaluated two bottom-up software applications to assess their effectiveness during the design of 100% sustainable island energy systems. Using both tools together has helped to develop a more reliable renewable energy system model, making it possible to simulate in greater detail the consumption side, including analysis of functionalities such as energy efficiency, distributed PV generation, and storage, adding additional centralized energy sources when needed. The first tool, City Energy Analyst, estimated the energy demand of each building, considering their occupant behavior and architectural and technological features, and generating individual and total demand and supply profiles. On the other hand, the second tool simulated the entire energy system using the results of the first model to evaluate the balance of the system and the stability of the grid, identify the minimum storage needs required to achieve the goals of energy sufficiency and adding additional sources available in the case study. This combined approach yielded initial reliable results, encouraging further adjustments in building features to help during the design of energy policies in the consumption sector.
The CEA tool was used to create the geometry of buildings on Corvo Island, demanding many initially time-consuming tasks for model configuration and correction of errors due to its automatic generation functionalities. After this process, the generated energy consumption estimates were acceptably close to the official reported values. Additionally, CEA accurately estimated PV production but suggested an impractical battery capacity for Service/Commercial buildings and insufficient rooftop space available for panel installation in the desired scenario, suggesting further development of the storage extension. Finally, the total storage capacities calculated by CEA were found inadequate when tested in EnergyPLAN, suggesting that relying on a distributed storage energy system may not be fully sustainable for the present case study.
EnergyPLAN is effective in simulating the performance of RE sources and centralized storage but is not able to estimate consumption in as much detail as CEA. Furthermore, its calculated installed PV capacity of 5.5 MW significantly surpassed the 2.5 MW area limit for installation on the rooftops of Corvo Island. In the optimal configuration of this model, PV panels generated a surplus of three times the demand of the island, indicating that depending solely on solar energy may not be the best approach for a sustainable energy system in the case study. In addition, the projected electricity production significantly exceeded the more accurate value given by CEA, indicating that EnergyPLAN might compute undersized energy systems, posing challenges during the design of sustainable IES.
To enhance the functionalities of CEA for isolated energy systems, future steps will focus on the development of energy community algorithms to evaluate the interaction between excess energy and available battery storage among all the elements of the case study. For this purpose, the storage capacity module must accurately calculate the optimal bank size, differentiating each building archetype. Additionally, future research could evaluate the simulation of centralized PV plants and power banks using geographic information systems to introduce virtual polygons into the model. Finally, it is recommended to continue surveying the actual state of the Corvo energy system to continue improving and closely adapting the model according to the current reality of the town and achieving a more realistic consumption analysis.

Author Contributions

Conceptualization and methodology: C.S.S. and A.P.G.; software: A.P.G. and J.C.-S.; validation, formal analysis, investigation, resources and data curation: A.P.G.; writing—original draft preparation: A.P.G. and J.C.-S.; writing—review and editing and visualization: J.C.-S.; supervision, project administration, funding acquisition: C.S.S. All authors have read and agreed to the published version of the manuscript.

Funding

This research was funded by the Portuguese National Funding through FCT—Fundação para a Ciência e Tecnologia, I. P., through projects UIDP/50009/2020 and LA/P/0083/2020 (LA LARSyS—IN+).

Data Availability Statement

The data presented in this study are available on request from the corresponding author.

Conflicts of Interest

The authors declare no conflicts of interest.

References

  1. Ritchie, H.; Rosado, P.; Roser, M. Energy Production and Consumption. Our World in Data. 2020. Available online: https://ourworldindata.org/energy-production-consumption (accessed on 23 June 2023).
  2. Marczinkowski, H.M.; Alberg Østergaard, P.; Roth Djørup, S. Transitioning Island Energy Systems—Local Conditions, Development Phases, and Renewable Energy Integration. Energies 2019, 12, 3484. [Google Scholar] [CrossRef]
  3. Directorate General for Energy. Energy Communities. European Comission. 2024. Available online: https://energy.ec.europa.eu/topics/markets-and-consumers/energy-communities_en (accessed on 23 June 2023).
  4. Lund, H. Chapter 4—Tool: The EnergyPLAN Energy System Analysis Model. In Renewable Energy Systems, 2nd ed.; Academic Press: Boston, MA, USA, 2014; pp. 53–78. [Google Scholar] [CrossRef]
  5. Reia, C.S.F. Sistema Eletrico da Ilha do Corvo: Estudo de um Sistema Baseado em Renovaveis com Armazenamento. Master’s Thesis, University of Lisbon, Faculty of Science, Department of Geography, Geophysics and Energy Engineering, Lisboa, Portugal, 2021. [Google Scholar]
  6. Alves, M.; Segurado, R.; Costa, M. Increasing the penetration of renewable energy sources in isolated islands through the interconnection of their power systems. The case of Pico and Faial islands, Azores. Energy 2019, 212, 502–510. [Google Scholar] [CrossRef]
  7. Alves, M.; Segurado, R.; Costa, M. On the road to 100% renewable energy systems in isolated islands. Energy 2020, 198, 117321. [Google Scholar] [CrossRef]
  8. Monteiro, D.P.A.P. 100% Renewable Energy System for the Autonomous Region of Madeira in 2050. Master’s Thesis, Instituto Superior Técnico, University of Lisbon, Mechanical Engineering, Lisboa, Portugal, 2021. [Google Scholar]
  9. Dorotic, H.; Doraci, B.; Dobravec, V.; Puk, T.; Krajaci, G.; Dui, N. Integration of transport and energy sectors in island communities with 100% intermittent renewable energy sources. Renew. Sustain. Energy Rev. 2019, 99, 109–124. [Google Scholar] [CrossRef]
  10. Marczinkowski, H.M.; Østergaard, P.A. Evaluation of electricity storage versus thermal storage as part of two different energy planning approaches for the islands samsø and orkney. Energy 2019, 175, 505–514. [Google Scholar] [CrossRef]
  11. Yue, C.D.; Chen, C.S.; Lee, Y.C. Integration of optimal combinations of renewable energy sources into the energy supply of wang-an island. Renew. Energy 2016, 86, 930–942. [Google Scholar] [CrossRef]
  12. Ferrando, M.; Causone, F.; Hong, T.; Chen, Y. Urban building energy modeling (UBEM) tools: A state-of-the-art review of bottom-up physics-based approaches. Sustain. Cities Soc. 2020, 62, 102408. [Google Scholar] [CrossRef]
  13. Jewell, A.; Schuler, N.; Cajot, S.; Gomes, R.; Silva, C.S.; Marechal, F.M.A. Designing a District Energy Infrastructure—A Case-Study in Lisbon. Front. Sustain. Cities 2022, 4, 863787. [Google Scholar] [CrossRef]
  14. Mendes, A.F.G. Plataforma de Gestao de Energia para o Campus do IST, Modelação e Representação dos Consumos de Energia. Master’s Thesis, Instituto Superior Técnico, University of Lisbon, Mechanical Engineering, Lisboa, Portugal, 2019. [Google Scholar]
  15. Adnan, O. Tool for Estimating Solar Radiation Incident on Buildings. Master’s Thesis, Instituto Superior Técnico, University of Lisbon, Mechanical Engineering, Lisboa, Portugal, 2019. [Google Scholar]
  16. Mora, T.D.; Teso, L.; Carnieletto, L.; Zarrella, A.; Romagnoni, P. Comparative analysis between dynamic and quasi-steady-state methods at an urban scale on a social-housing district in Venice. Energies 2021, 14, 5164. [Google Scholar] [CrossRef]
  17. Romero, M.M.; Maiullari, D.; Esch, M.; Schlueter, A. An integrated microclimate-energy demand simulation method for the assessment of urban districts. Front. Built Environ. 2020, 6, 553946. [Google Scholar] [CrossRef]
  18. Ali, U.; Shamsi, M.H.; Hoare, C.; Mangina, E.; O’Donnell, J. Review of urban building energy modeling (UBEM) approaches, methods and tools using qualitative and quantitative analysis. Energy Build. 2021, 246, 111073. [Google Scholar] [CrossRef]
  19. Mobaraki, B.; Pascual, F.J.C.; Lozano-Galant, F.; Lozano-Galant, J.A.; Soriano, R.P. In situ U-value measurement of building envelopes through continuous low-cost monitoring. Case Stud. Therm. Eng. 2023, 43, 102778. [Google Scholar] [CrossRef]
  20. Johari, F.; Peronato, G.; Sadeghian, P.; Zhao, X.; Widén, J. Urban Building Energy Modeling: State of the art and future prospects. Renew. Sustain. Energy Rev. 2020, 128, 109902. [Google Scholar] [CrossRef]
  21. Hong, T.; Chen, Y.; Lou, X.; Lou, N.; Lee, S.H. Ten questions on urban building energy modeling. Build. Environ. 2020, 168, 106508. [Google Scholar] [CrossRef]
  22. Fundação Francisco Manuel dos Santos. Censos de Protugal em 2021. Resultados por Tema e Por Concelho. Pordata. Available online: https://www.pordata.pt/censos/resultados/emdestaque-corvo-703 (accessed on 15 April 2024).
  23. Salvador, A. Passado, Presente e Futuro do Nucleo Urbano Antigo da Ilha do Corvo: A Casa “Corvina”. Master’s Thesis, Universidade de Coimbra, Coimbra, Portugal, 2020. [Google Scholar]
  24. Salvador, A.I.; Mouraz, C.P.; Catarino, L.; Mestre, V.; Silva, J.M. Housing Buildings’ Characterization at Corvo Village (Azores) Historical Center: Towards a Sustainable Rehabilitation Process. Sustainability 2021, 13, 2352. [Google Scholar] [CrossRef]
  25. Eletricidade dos Açores. Relatorio e Contas 2022. Comunicação, Publicações. Available online: https://www.eda.pt/Mediateca/Publicacoes/Paginas/Relatorios.aspx# (accessed on 23 June 2023).
  26. EU Science Hub. Photovoltaic Geographical Information System (PVGIS). Interactive Tools. European Commission. Available online: https://re.jrc.ec.europa.eu/pvg_tools/en/ (accessed on 23 June 2023).
  27. Tesla. How Powerwall Works: Tesla Support. Available online: https://www.tesla.com/support/energy/powerwall/learn/how-powerwall-works (accessed on 16 April 2024).
Figure 1. Building distribution at Vila do Corvo (CEA).
Energies 17 03135 g001
Figure 2. Evolution of electric consumption in Corvo Island (2022) [21].
Energies 17 03135 g002
Figure 3. Historical meteorology: (a) global solar irradiance; (b) daily average wind speed.
Energies 17 03135 g003
Figure 4. Data flow diagram of the model.
Energies 17 03135 g004
Figure 5. Results of energy consumption in the CEA model.
Energies 17 03135 g005
Table 1. Building disaggregation by type and sector in Vila do Corvo.
SectorTypeNo%TypeNo%
HouseholdsHousing12550Housing28062
Service/
Commerce
Restaurant28Office2010
School1
Commerce3Restaurant3
Hospital3
Services5Food store5
Library6
Public
equipment
5Church1
Museum3
Religious5Religious2
Industrial---Industrial31
Parking/StorageStorage house2510Parking4410
Ruin/UnoccupiedUnoccupied8032Ruin7921
TOTAL 25056Total450
Source:Salvador et al. [21]CEA Model
Table 2. Storage Capacity plug-in parameters for battery banks.
ParametersValueUnit
Potential used100%
Power capacity13.5kWh/p
Rated voltage60V
C-rate1C
Maximum discharge100%
Charge/Discharge eff.98%
Table 3. Results of energy consumption in the CEA model.
Building TypeConsumption [MWh/year]%GroupEDA % Diff.
Single residential982.9056.6982.9679.4+30.9
Office215.4012.4652.9826.3−26.6
Hospital137.347.9
Food store102.255.9
School61.223.5
Hotel51.853.0
Restaurant40.412.3
Church22.971.3
Museum14.930.9
Library6.510.4
Industry100.325.8100.321.26+78.8
Parking0.00.0---
Ruin0.00.0
TOTAL1736.1 1736.11532.7+13.27
Table 4. Results of solar PV systems and storage battery banks.
ResultsValueUnit
Photovoltaic panels
Installed area12,529.6m2
Installed power2.506MW
Total production2.44GWh/year
Storage battery banks
Installed capacity15.7MWh
Energy deficit501.95MWh/year
Excess energy1147.61MWh/year
Table 5. Results of EnergyPLAN for different setups.
ParametersEnergyPLANCEA SetupSynergyUnit
Electric demand1.741.741.74GWh/year
PV system capacity550025002100kW
PV production8.013.642.05GWh/year
Wind power capacity--350kW
Wind production--1.27GWh/year
Storage capacity7.9015.707.90MWh
Imports00.160GWh/year
CEEP6.061.891.51GWh/year
Disclaimer/Publisher’s Note: The statements, opinions and data contained in all publications are solely those of the individual author(s) and contributor(s) and not of MDPI and/or the editor(s). MDPI and/or the editor(s) disclaim responsibility for any injury to people or property resulting from any ideas, methods, instructions or products referred to in the content.

