Article

Simulation Study on the Heat Transfer Characteristics of Oil Shale under Different In Situ Pyrolysis Methods Based on CT Digital Rock Cores

Key Laboratory of In Situ Property Improving Mining of Ministry of Education, Taiyuan University of Technology, Taiyuan 030024, China
*
Author to whom correspondence should be addressed.
Energies 2024, 17(16), 4169; https://doi.org/10.3390/en17164169
Submission received: 20 June 2024 / Revised: 11 August 2024 / Accepted: 20 August 2024 / Published: 21 August 2024
(This article belongs to the Special Issue Recent Advances in Oil Shale Conversion Technologies)

Abstract

:
To analyze the heat transfer characteristics of oil shale under different in situ pyrolysis methods from a microscopic perspective, a combination of experimental and simulation approaches was employed. Initially, high-temperature in situ pyrolysis experiments on single-fracture oil shale were conducted using high-temperature steam and electrical methods. Subsequently, micro-CT scanning technology was utilized to obtain digital rock cores under different in situ pyrolysis conditions. Finally, these digital rock cores were seamlessly integrated with COMSOL 6.0 to achieve numerical simulations of high-temperature steam convective heating and electrical conductive heating in the in situ state. The relevant conclusions are as follows: Firstly, during the in situ pyrolysis of oil shale with high-temperature steam convective heating, the overall temperature increase is uniform and orderly. Heat is conducted gradually from the pores and fractures to the matrix. The uneven distribution of pores and fractures causes an uneven temperature field, but no localized overheating occurs, which can effectively enhance the pyrolysis efficiency. Secondly, the heat transfer direction in electrical conductive heating is primarily inward along the normal direction of the heat source end face. The closer the section is to the heat source end face, the higher the rate of temperature increase. Within 1 s, the temperature rise at 100 μm (near the heat source end face) is 2.27 times that at 500 μm (near the farthest cross-section from the heat source end face). The heat transfer effect of high-temperature steam convective heating consistently surpasses that of electrical conductive heating. The Tc value initially increases and then decreases as pyrolysis progresses, reaching a maximum of 1.61331 at 0.4 s, but Tc remains greater than 1 throughout. Finally, in the initial stages of pyrolysis, the high-temperature region formed by conductive heating is superior to that of convective heating. However, once the heat carrier fluid flow stabilizes, the volume of the high-temperature region formed by convective heating grows rapidly compared to that of conductive heating. At 1 s, the volume of the high-temperature region formed by convective heating reaches 5.22 times that of the high-temperature region formed by conductive heating.

1. Introduction

Oil shale, recognized globally as a strategic reserve resource, can undergo high-temperature pyrolysis to convert the solid kerogen within it into shale oil and shale gas [1]. The resulting products can be extracted and utilized under the influence of pressure differentials and other driving mechanisms. The world’s oil shale reserves are abundant, with the proven reserves of oil shale estimated to be capable of producing over 400 billion tons of shale oil, which is three times the amount of the currently known conventional oil reserves [2]. Therefore, the efficient and scientific extraction of oil shale is of great significance for supplementing global oil and gas resources and alleviating the world’s energy shortage [3].
Currently, the extraction methods for oil shale are primarily divided into surface retorting and underground in situ extraction, with surface retorting being the mainstream method of extraction [4,5,6]. In the context of the growing demand for environmental protection worldwide, underground in situ extraction technology has been continually developing due to its advantages of high extractable depth and lower environmental pollution. This has led to the formation of numerous in situ pyrolysis methods based on three main heating techniques: conductive heating, convective heating, and radiative heating [7,8].
In comparison, in situ pyrolysis technologies based on conductive and convective heating have become relatively mature, with many techniques being applied in industrial practice [9,10]. Examples include Shell’s ICP technology [11], ExxonMobil’s Electrofrac™ technology [12], and Chevron’s CRUSH technology [13]. Although in situ pyrolysis technologies based on radiative heating hold great promise, they are still in the exploratory stage. Examples of such technologies include LLNL wireless radio frequency technology [14] and RF/CF technology [15]. Regardless of the heating method used as the basis for in situ pyrolysis technology, the temperature field distribution is a crucial area of study. It directly determines the efficiency of pyrolysis and the changes in physicochemical characteristics [16,17,18]. The variability in the occurrence of kerogen within oil shale, the development of pore and fracture structures, and the modes of heat transfer are decisive factors influencing the evolution of the temperature field. Therefore, studying the evolution of the temperature field distribution of oil shale during in situ pyrolysis using different technologies is of great significance for accurately guiding the in situ thermal recovery of oil shale.
In recent years, numerous experts and scholars have conducted extensive research on the impact of temperature on the physicochemical characteristics of oil shale during in situ pyrolysis. Yang et al. [19] developed an industrial-scale THM (Thermal-Hydraulic-Mechanical) coupled mathematical model for in situ oil shale extraction. They studied the characteristics of fluid flow, heat transfer, and rock deformation during the in situ pyrolysis extraction process with steam injection. They found that the oil shale reservoir has a natural thermal insulation layer during heat injection extraction, which can effectively prevent heat loss. Wang et al. [20] used a self-designed long-distance reaction kettle for in situ pyrolysis with high-temperature steam injection to study the compositional changes of oil shale pyrolysis products at different pyrolysis temperatures. They found that the proportion of heavy oil in the products gradually decreases with increasing pyrolysis temperature, leading to the progressive lightening of shale oil. Hu et al. [21] conducted in situ pyrolysis experiments on oil shale using near-supercritical water to study the pyrolysis behavior and product characteristics. They found that increasing pressure can both promote the pyrolysis of organic matter and inhibit the cracking ability of organic matter due to increased density. This indicates that there is an optimal pressure for the pyrolysis process. Kang et al. [22] conducted large-scale in situ pyrolysis experiments on oil shale with steam injection to study the evolution of the internal heat transfer field during pyrolysis. They found that alternating between injection wells and production wells can effectively enhance pyrolysis efficiency. T. Saif et al. [23] performed real-time CT scanning during the pyrolysis of oil shale to observe changes in the pore and fracture structure. They found that the porosity of oil shale significantly increases between 390 °C and 400 °C. Zhao et al. [24] performed micro-CT scans on oil shale from different regions after in situ pyrolysis and found that the evolution patterns of the pore and fracture structures during pyrolysis were generally similar across different oil shale sources. Zhu et al. [25] used high-temperature nitrogen as the heat carrier fluid for in situ pyrolysis of oil shale and recorded the oil yield. They found that higher injection temperatures and lower sealed areas are more conducive to oil production and recovery. Yang et al. [26] studied the changes in compressive strength during the real-time high-temperature in situ pyrolysis of oil shale. They found that around 350 °C, the compressive strength in the vertical bedding direction significantly decreases to its minimum value across the entire temperature range. Additionally, the compressive strength in different bedding directions shows a trend of initially decreasing and then increasing with rising pyrolysis temperatures. Numerous studies have extensively analyzed the effects of temperature on various physicochemical characteristics during the pyrolysis process, clearly defining the evolutionary patterns of these characteristics with respect to pyrolysis temperature. Therefore, studying the evolution of the temperature field distribution during the in situ pyrolysis of oil shale is crucial for further refining the theoretical framework of the in situ thermal recovery of oil shale. Currently, research on the evolution of temperature field distribution during the in situ pyrolysis of oil shale primarily focuses on regular and intact reservoir models. It utilizes numerical simulations to analyze temperature distribution during pyrolysis [27], without considering the influence of the internal pore and fracture structures of oil shale on the temperature field. However, the influence of pore and fracture structures on the temperature field during the in situ pyrolysis of oil shale is significant and cannot be ignored [28,29]. Studying the temperature field distribution considering these pore and fracture structures can better guide engineering practices in the in situ pyrolysis of oil shale.
This study first utilized single-fracture oil shale samples from the same core to undergo in situ pyrolysis with high-temperature steam (500 °C) and electrical heating (500 °C). Subsequently, micro-CT scanning technology was employed to obtain digital rock cores after pyrolysis using different heating methods. Finally, based on these real oil shale digital rock cores, the study seamlessly integrated COMSOL to simulate the in situ processes of high-temperature steam convective heating and electrical conductive heating. Using the aforementioned methods, this study conducted a microscopic analysis of the temperature field evolution inside oil shale under different heating methods. It compared the heat transfer efficiency of oil shale under these different heating methods with the aim of refining the foundational theoretical framework for the temperature field evolution in the in situ thermal recovery of oil shale.

2. Material and Experiment

2.1. Sample Preparation

The experimental samples were sourced from Jimusaer, Xinjiang. According to GBT 18602-2012, the total organic carbon (TOC) and pyrolysis hydrocarbon generation potential of the oil shale from this location were determined, as shown in Table 1.
Based on the maximum pyrolysis temperature (Tmax) and hydrogen index (HI) from Table 1, it is evident that the solid organic matter (kerogen) type in the Jimusaer oil shale samples is predominantly Type I, approaching Type IIa. This indicates that the oil shale in this region possesses high hydrocarbon generation potential.
Firstly, a cylindrical sample of Φ50 mm × 200 mm was extracted from the bulk oil shale (oriented parallel to the bedding plane), and a splitting knife was used to create fractures within it. Subsequently, this sample was divided into two Φ50 mm × 100 mm split cylindrical samples. These split samples were used separately for in situ pyrolysis experiments: one for high-temperature steam convective heating and the other for electrical conductive heating. The specific procedure is illustrated in Figure 1.

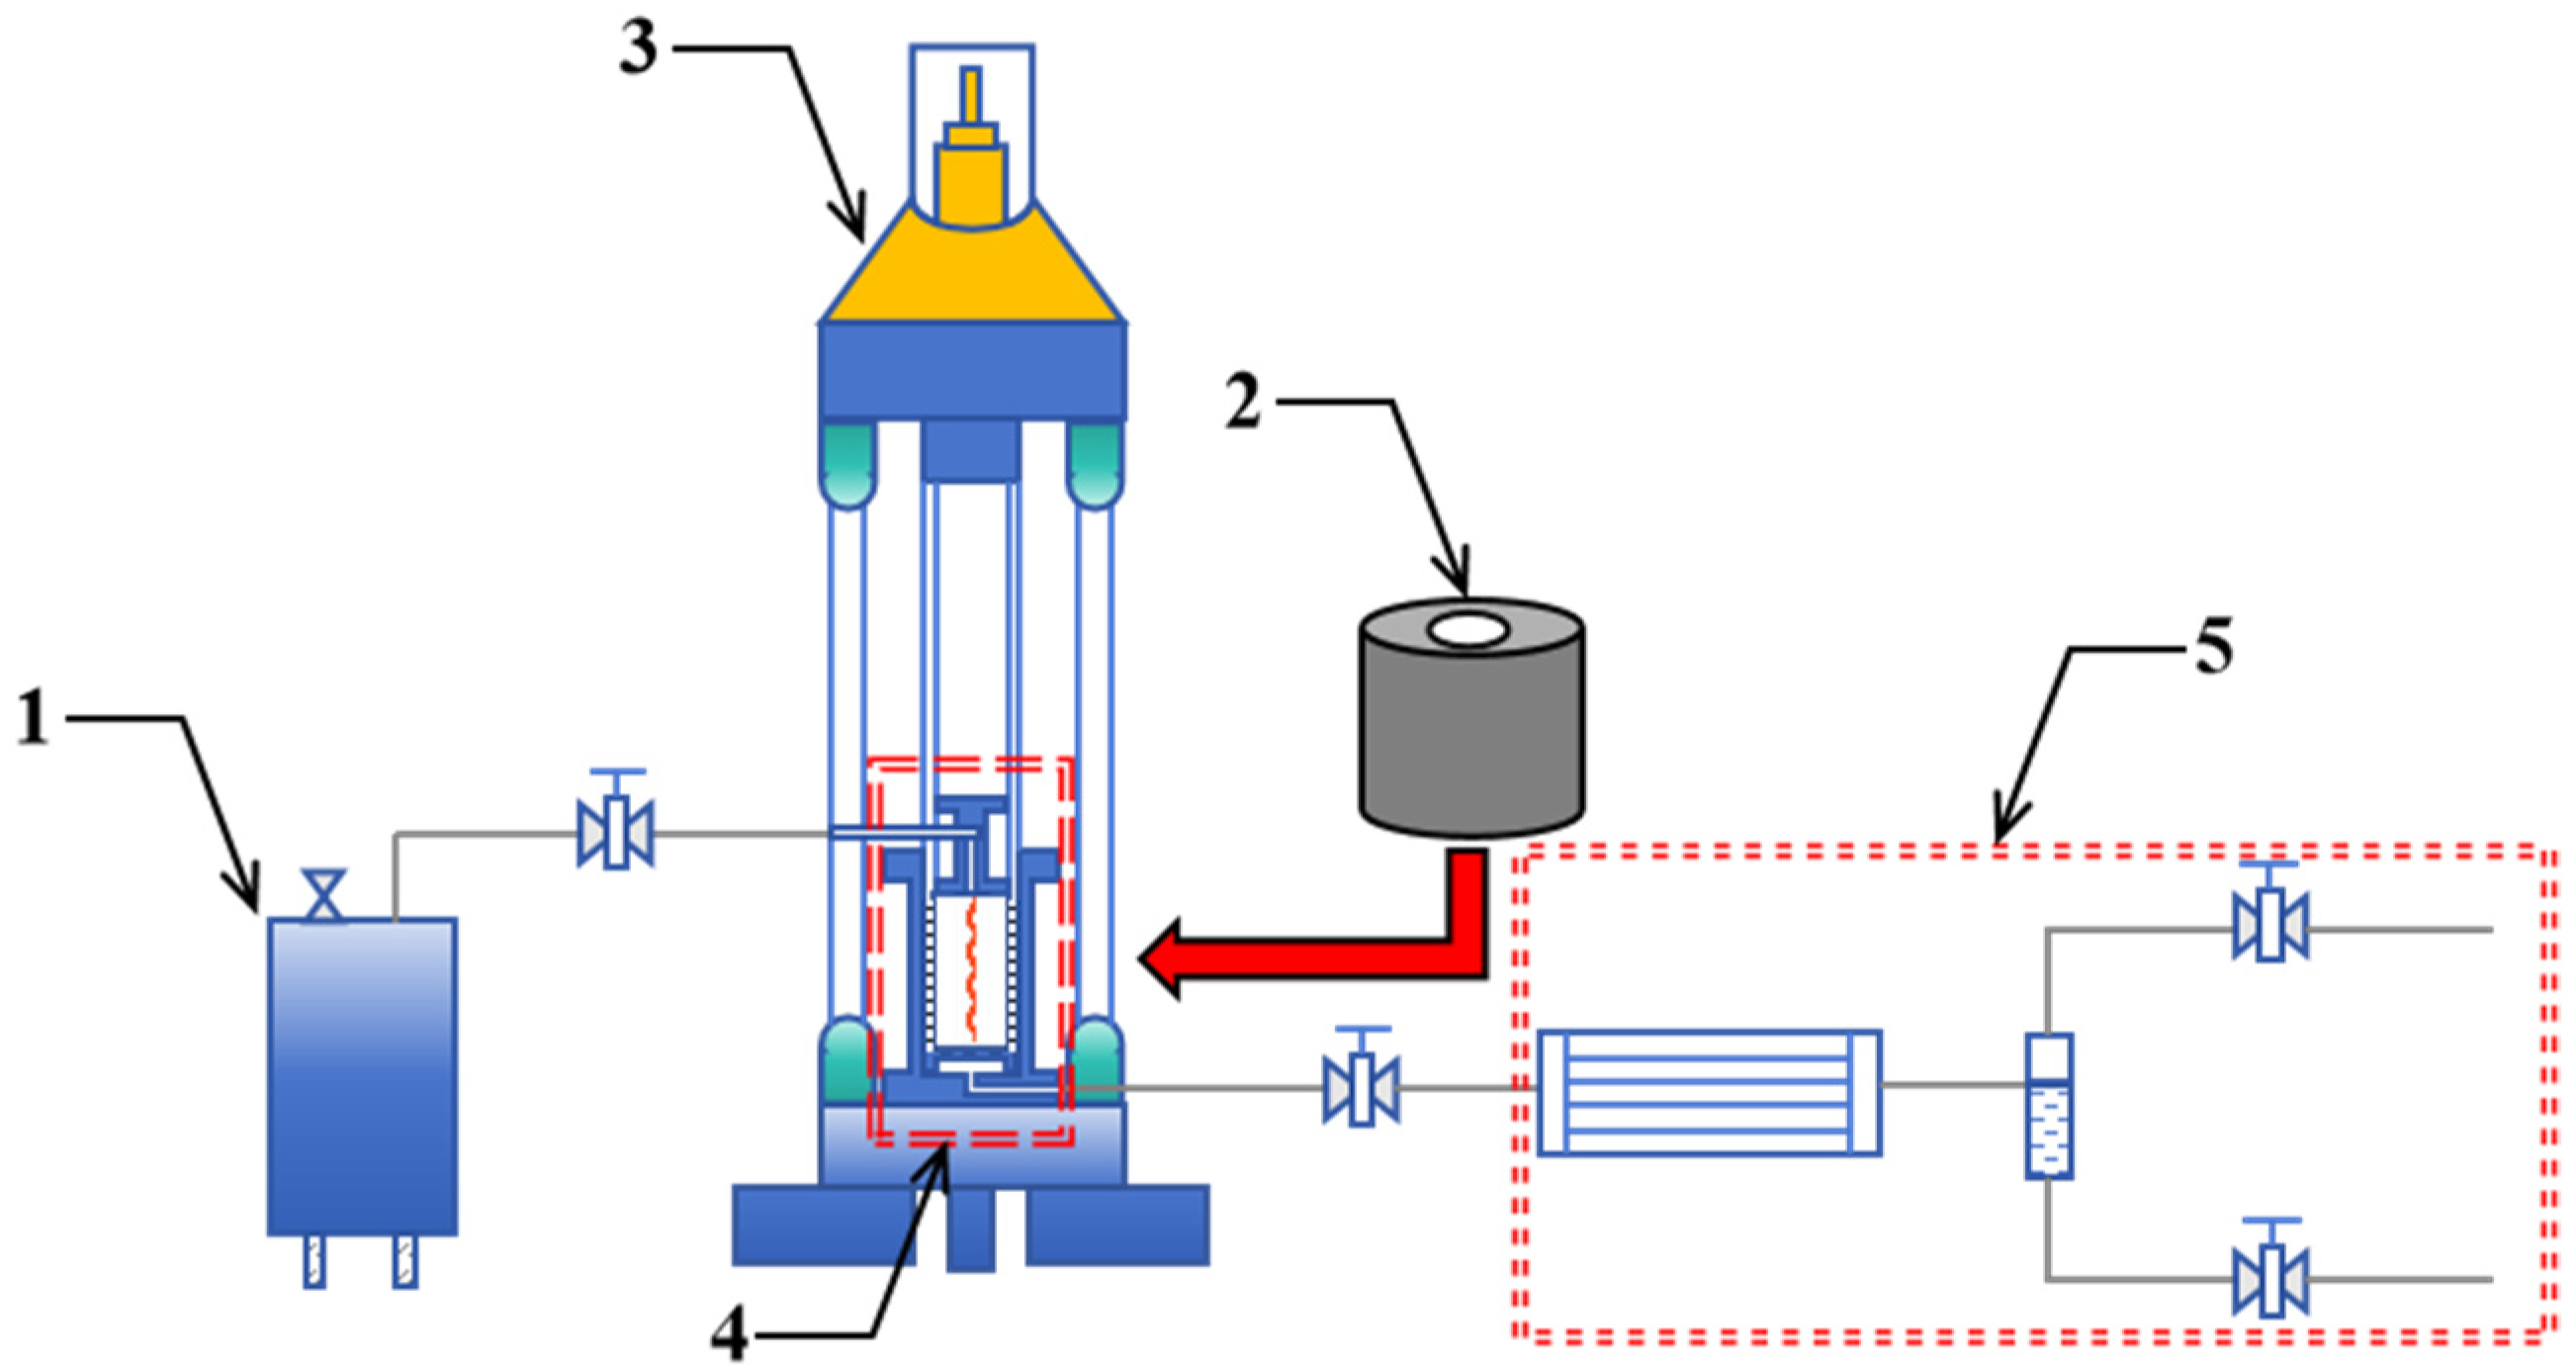
2.2. In Situ Pyrolysis of Oil Shale Using High-Temperature Steam Convective Heating and Electrical Conductive Heating

The experimental setup used was a self-developed in situ pyrolysis apparatus for oil shale (Figure 2), consisting of a high-temperature steam generator, electric heating mantle, servo hydraulic press, high-temperature in situ pyrolysis reaction vessel, and condensation system. The high-temperature steam generator and electric heating mantle serve as heat sources selected according to the desired heating method. The servo hydraulic press applies axial and confining pressure to the samples using solid-state pressure transmission. The high-temperature in situ pyrolysis reaction vessel provides the space for the in situ pyrolysis reactions of the samples. The condensation system is used for condensing and separating pyrolysis oil and gas products.
A substantial body of research [30,31,32] has demonstrated that the solid organic matter in oil shale can achieve near-complete pyrolysis at approximately 500 °C. Therefore, this experiment selected 500 °C as the in situ pyrolysis temperature for both high-temperature steam convective heating and electrical conductive heating.
The specific steps for in situ pyrolysis of oil shale using high-temperature steam are as follows:
  • Place the pre-prepared split standard samples into the high-temperature in situ pyrolysis reaction vessel. Utilize the servo hydraulic press to apply 5 MPa axial pressure and 6 MPa confining pressure to the samples.
  • Close the outlet valve of the high-temperature steam generator. Activate the high-temperature steam generator to prepare 500 °C steam. Once the temperature reaches 500 °C, open the outlet valve to inject the 500 °C high-temperature steam into the high-temperature in situ pyrolysis reaction vessel.
  • After the pyrolysis time reaches 3 h, stop injecting high-temperature steam and allow the high-temperature in situ pyrolysis reaction vessel to cool naturally.
  • After the reaction vessel cools to room temperature, remove the samples after pyrolysis for micro-CT scanning.
The experimental steps for the in situ pyrolysis of oil shale using electrical conductive heating are similar to the above, with slight modifications as follows:
  • Place the pre-prepared split standard samples into the high-temperature in situ pyrolysis reaction vessel. Seal the high-temperature steam injection port with a sealed cap. Use the servo hydraulic press to apply 5 MPa axial pressure and 6 MPa confining pressure to the samples.
  • Set the temperature of the electric heating mantle to 500 °C, and start the pyrolysis timer once the temperature reaches 500 °C.
  • Stop heating after the pyrolysis time reaches 3 h, allowing the high-temperature in situ pyrolysis reaction vessel to cool naturally.
  • After the reaction vessel cools to room temperature, remove the samples after pyrolysis for micro-CT scanning.

3. Numerical Simulation Methods

3.1. Basic Assumptions

Simulating the temperature field in situ is a complex multiphysics numerical simulation. To ensure overall computational convergence while closely approximating real-world conditions [33,34], simplifications are made as follows:
  • Due to the low oil yield of oil shale, the content of oil and gas products is minimal compared to high-temperature steam. Therefore, the flow characteristics of oil and gas products are neglected in the simulation process.
  • Neglecting the effect of surface tension between the water and steam phases.
  • Assuming the permeability of the solid matrix is zero, with fluids flowing only within the pore structure.
  • Fluid flow within the pore structure follows Darcy’s law at a microscale gradient:
q = k μ p
In the equation, q represents the seepage velocity, m/s; k represents the permeability, mD; μ represents the fluid viscosity, Pa·s; ∇p represents the pressure gradient, Pa/m.
5.
The boiling point of water under different pore pressures follows a Gaussian fitting formula [35]:
T b = 359.9 0.03 × e 2 × ( p 112.5 510.37 ) 2
In the equation, Tb represents the boiling point of water, K; p represents the pore pressure, Pa.
If T > Tb, the fluid is in the form of steam; if T < Tb, the fluid is in the form of liquid water. The variations in fluid density (ρ), dynamic viscosity (μ), specific heat (C), and thermal conductivity (λ) with temperature are represented as follows:
ρ = { ( 0.9967 4.615 × 10 5 T 3.063 × 10 6 T 2 ) × 10 3 ( T < T b ) 2272.7 p × 10 6 T + 273 ( T T b )
μ = { ( 1743 1.8 T 47.7 T + 759 ) × 10 3 ( T < T b ) ( 0.36 T + 88.37 ) × 10 7 ( T T b )
C = { 0.0165 T 2 1.4878 T + 4207.4 ( T < T b ) 0.001 T 3 + 0.0948 T 2 27.103 T + 9246.8   ( T T b )
λ = { 1.26 × 10 5 T 2 + 2.56 × 10 3 T + 0.5513 ( T < T b ) 1.0 × 10 8 T 3 4.0 × 10 6 T 2 + 0.0006 T + 0.0078   ( T T b )

3.2. Construction of the Physical Model

The construction process of the physical model, which serves as the foundation for numerical simulation, is outlined as follows:
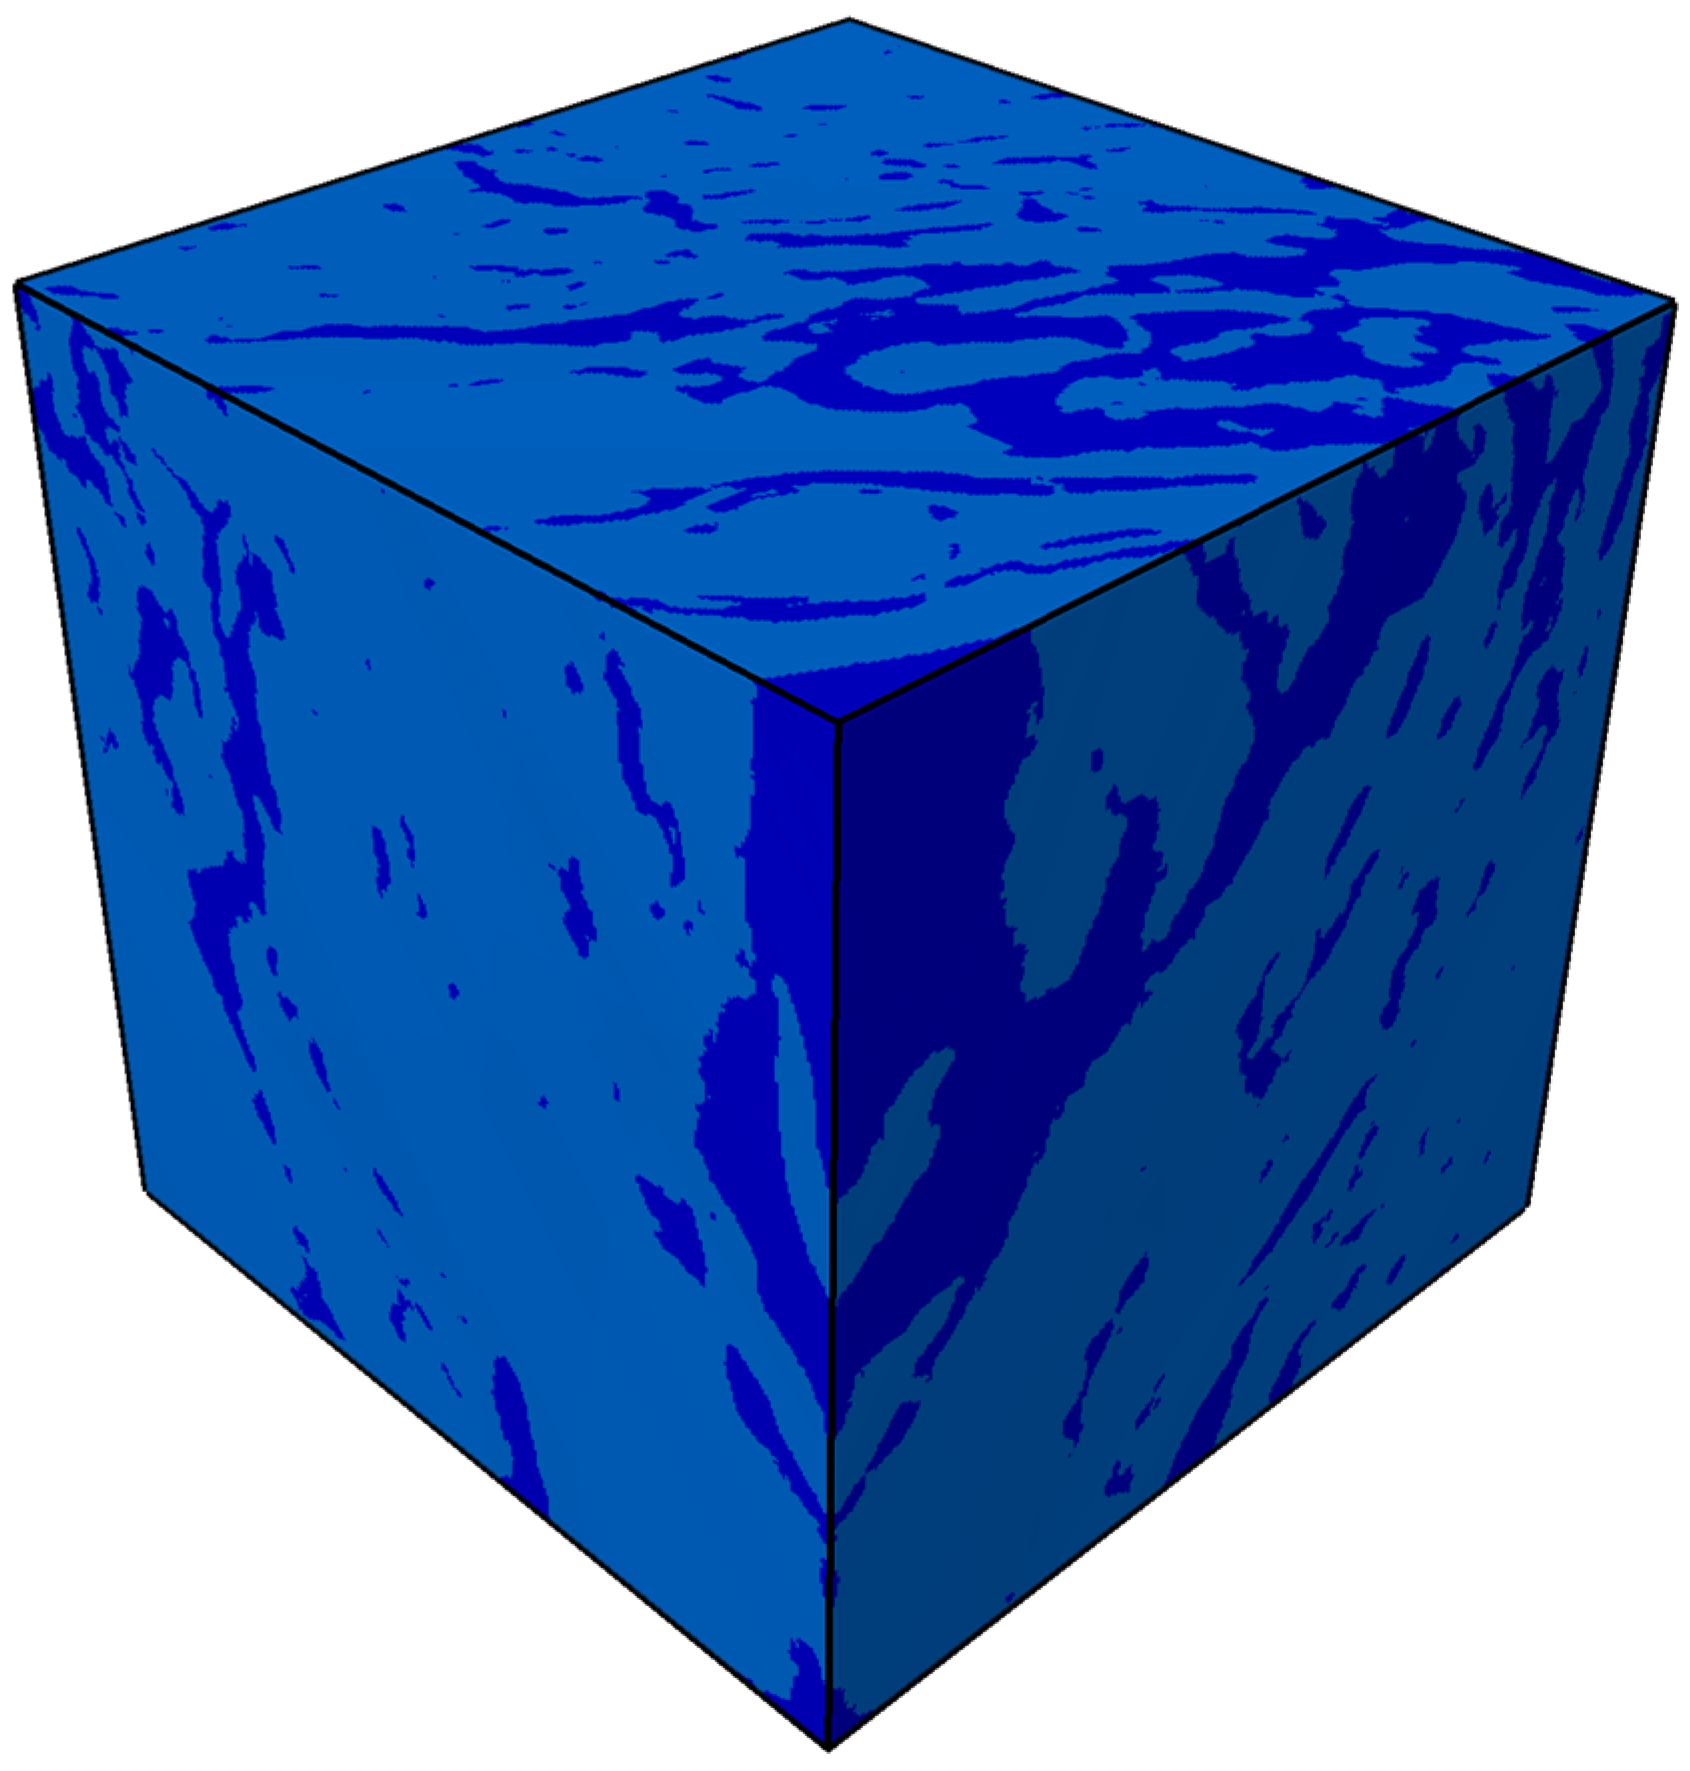
  • Following in situ pyrolysis, micro-CT scan data of oil shale are utilized with porosity as a reference indicator to determine the minimum representative elementary volume (REV). Subsequently, threshold segmentation is applied to the REV to achieve the segmentation of solid matrix and pore structures within the oil shale.
  • After segmenting the solid matrix and pore structures of the digitized oil shale core, tetrahedral meshing is performed, followed by importation into COMSOL to obtain the required physical model for simulation.
The obtained physical model is assigned material properties, with parameters for the solid matrix taken from Wang [36], Yang [19], and Kang [37], as detailed in Table 2.
In Table 2, ρs represents the solid matrix density, kg/m3; λper represents the thermal conductivity in the direction perpendicular to the bedding, W/(m·K); λpar represents the thermal conductivity in the direction parallel to the bedding, W/(m·K); βper represents the coefficient of thermal expansion in the direction perpendicular to the bedding, 1/K; βpar represents the coefficient of thermal expansion in the direction parallel to the bedding, 1/K; Eper represents the elastic modulus in the direction perpendicular to the bedding, Pa; Epar represents the elastic modulus in the direction parallel to the bedding, Pa; vs represents the Poisson’s ratio; T represents the temperature, °C.

3.3. Control Equations

3.3.1. Fluid Dynamics Equations

The mass conservation equation for fluid flow in pore structures is given by [38]:
ρ t + ( ρ u ) = 0
The momentum equation (Navier-Stokes equation) is:
ρ ( u t + u u ) = p + ( μ ( u + ( u ) T ) ) + F
In the equation, ρ represents fluid density, kg/m3; u represents the fluid velocity vector, m/s; p stands for pressure, Pa; µ represents dynamic viscosity, Pa·S; F represents body force, N.

3.3.2. Solid Mechanics Equations

In the process of solid matrix deformation, according to the fundamentals of elasticity theory, the stress equilibrium equation is:
σ i j , j + F i = 0
Taking into account thermal expansion due to thermal effects and the influence of pore pressure on solid matrix deformation, the stress equilibrium equation expressed in terms of displacement is obtained [39]:
( λ + μ ) · U j . j i + μ · U i . j j + F i + ( α · p ) , i = 0
In the equation, σij represents the second-order stress tensor, Fi represents body force, N; U represents displacement, m; λ and μ are Lamé constants; α is the effective stress coefficient; p represents pore pressure, Pa.

3.3.3. Heat Conduction Equation

The heat conduction equation during in situ pyrolysis of oil shale is given by [40]:
ρ C T t + ρ C u T = ( λ T ) + Q
In the equation, ρ represents the density of high-temperature steam or solid matrix, kg/m3; C is the specific heat capacity, J/(kg·K); u is the fluid flow velocity, m/s; λ is the thermal conductivity, W/(m·K); Q represents internal heat sources, J. For heat conduction during fluid flow processes, convection terms ( ρ C u T ) are included, whereas for heat conduction within solids ( u = 0 ), there are no convection terms.

3.3.4. Coupling Conditions

Fluid–solid coupling conditions:
The   fluid   velocity   equals   the   solid   velocity :   u l = u s
At   the   fluid solid   interface ,   stress   continuity   applies :   σ l · n = σ s · n
Non-isothermal flow coupling conditions:
Boundary   temperatures   are   equal :   T l = T s
Boundary   heat   flux   continuity : λ l T l · n = λ s T s · n
In the equation, ul represents the fluid velocity at the fluid–solid boundary, m/s; us represents the solid velocity at the fluid–solid boundary; m/s; σl represents the fluid stress at the fluid–solid boundary, N/m2; σs represents the solid stress at the fluid–solid boundary, N/m2; Tl is the fluid temperature at the fluid–solid boundary, °C; Ts is the solid temperature at the fluid–solid boundary, °C; λl denotes the thermal conductivity of the fluid at the fluid–solid boundary, W/(m·K); λs represents the thermal conductivity of the solid at the fluid–solid boundary, W/(m·K).

3.4. Initial and Boundary Condition

  • Solid Mechanics:
  • Boundary Conditions:
    • Stress boundaries at x = 0 µm and x = 1200 µm: σ = 5 MPa;
    • Stress boundaries at y = 0 µm, z = 0 µm, y = 1200 µm, and z = 1200 µm: σ = 6 MPa.
  • Initial Conditions:
    • Initial displacement U = 0 at arbitrary positions.
2.
Non-isothermal Flow (Simulating in situ pyrolysis with high-temperature steam):
  • Boundary Conditions:
    • Flow inlet boundary at z = 0 µm: Fluid inlet with pin = 2 MPa, Tin = 500 °C
    • Flow outlet boundary at z = 1200 µm: Fluid outlet with pout = 0.1 MPa
  • Initial Conditions:
    • Initial velocity u = 0 at arbitrary positions within the flow domain
    • Initial temperature T = 20 °C
3.
Solid Heat Transfer (Simulating electrical conduction heating for in situ pyrolysis):
  • Boundary Conditions:
    • Thermal source boundaries at z = 0 µm and z = 1200 µm: T = 500 °C
  • Initial Conditions:
    • Initial temperature T = 20 °C at arbitrary positions within the solid domain

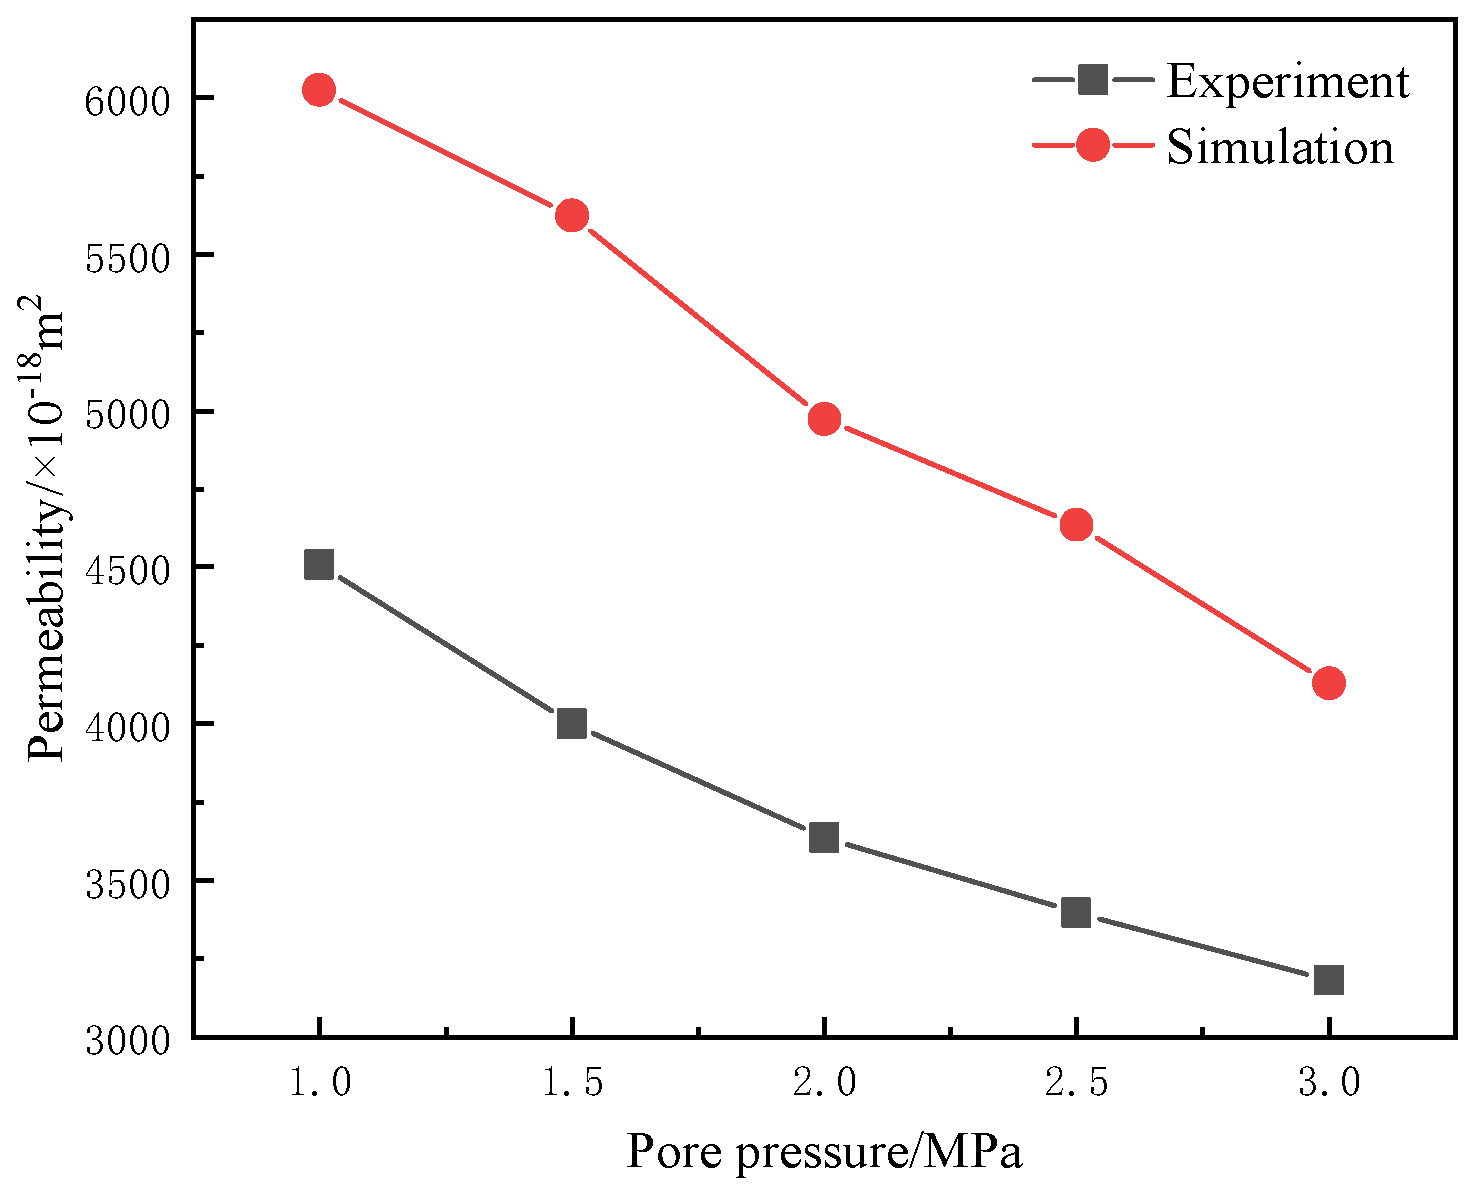
3.5. Simulation Validation

Based on the simulation conditions for in situ convective heat transfer with high-temperature steam in this study, different pore pressures (with pin set at 1 MPa, 1.5 MPa, 2.5 MPa, and 3 MPa) were configured while keeping other conditions constant. The simulation results for in situ convective heat transfer under different pore pressures were obtained.
Using the outlet volumetric flow rate Q from the in situ convective heat transfer simulation results under different pore pressures, the permeability k corresponding to each pore pressure can be calculated using the following equation:
k = 2 Q P d o w n L μ ( P u p 2 P d o w n 2 ) A
In the equation, k represents the permeability, m2; Q is the volumetric flow rate, m/s; L is the length of the specimen, m; μ represents the dynamic viscosity of the fluid, MPa·s; Pup is the inlet pressure, MPa; Pdown is the outlet pressure, MPa; A represents the cross-sectional area of the specimen, m2.
As shown in Figure 3, the simulated permeability results are compared with the experimental permeability results, referring to our previously obtained in situ permeability results under different pore pressures after in situ pyrolysis of fractured oil shale samples from the same origin (Jimusar) with the same dimensions (Φ50 mm × 100 mm) at 500 °C using high-temperature steam under identical experimental conditions [41]. From the figure, it can be observed that the trend of the permeability results obtained from the simulation is consistent with that of the actual permeability test results with respect to pore pressure. Both sets of results show a gradual decrease in permeability as pore pressure increases, and the magnitudes of permeability for both are in the same order of magnitude. The primary reason for the discrepancy between the simulation results and the experimental results is that the simulation yields the permeability under in situ convective heat transfer with high-temperature steam, whereas the experimental permeability was measured using room-temperature nitrogen gas after in situ pyrolysis with high-temperature steam. According to molecular thermal motion theory, high-temperature steam has greater mobility compared to room-temperature nitrogen, which results in the simulated permeability being slightly higher than the experimental permeability.
The above results indicate that the simulated results are reasonable, suggesting that the numerical simulation model used in this study is appropriately set up and can ensure the accuracy of subsequent research findings.

4. Result

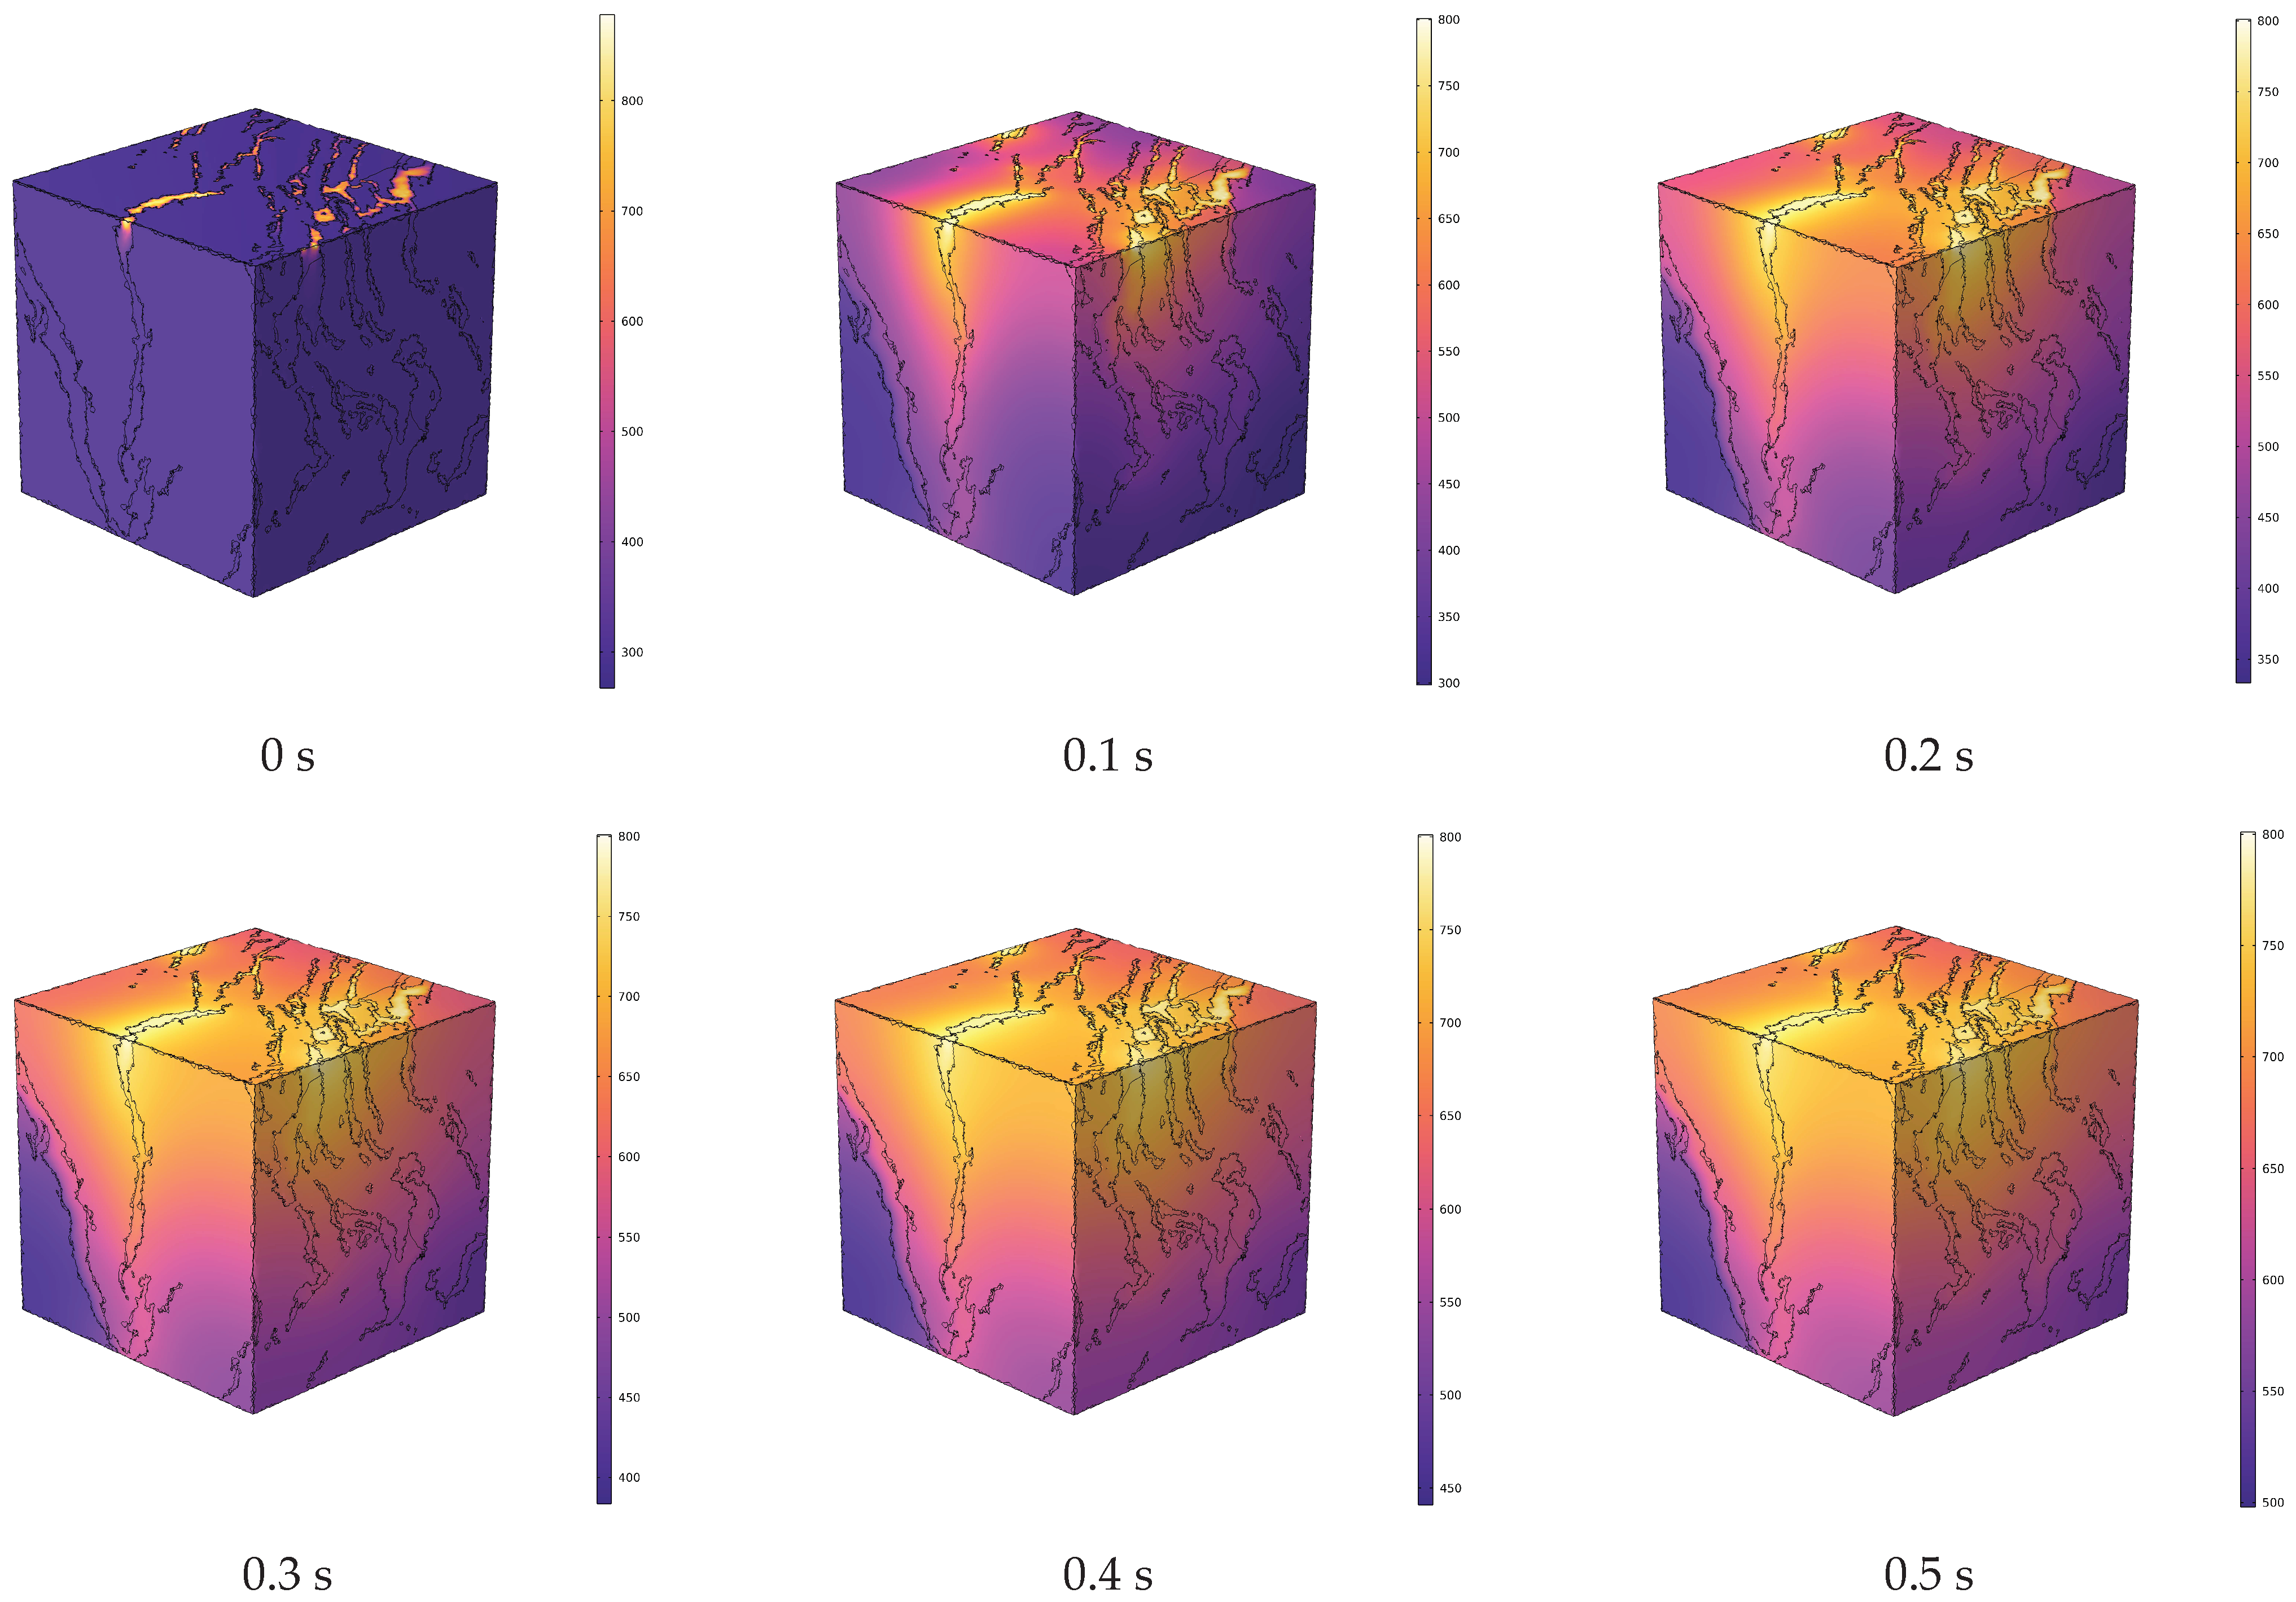
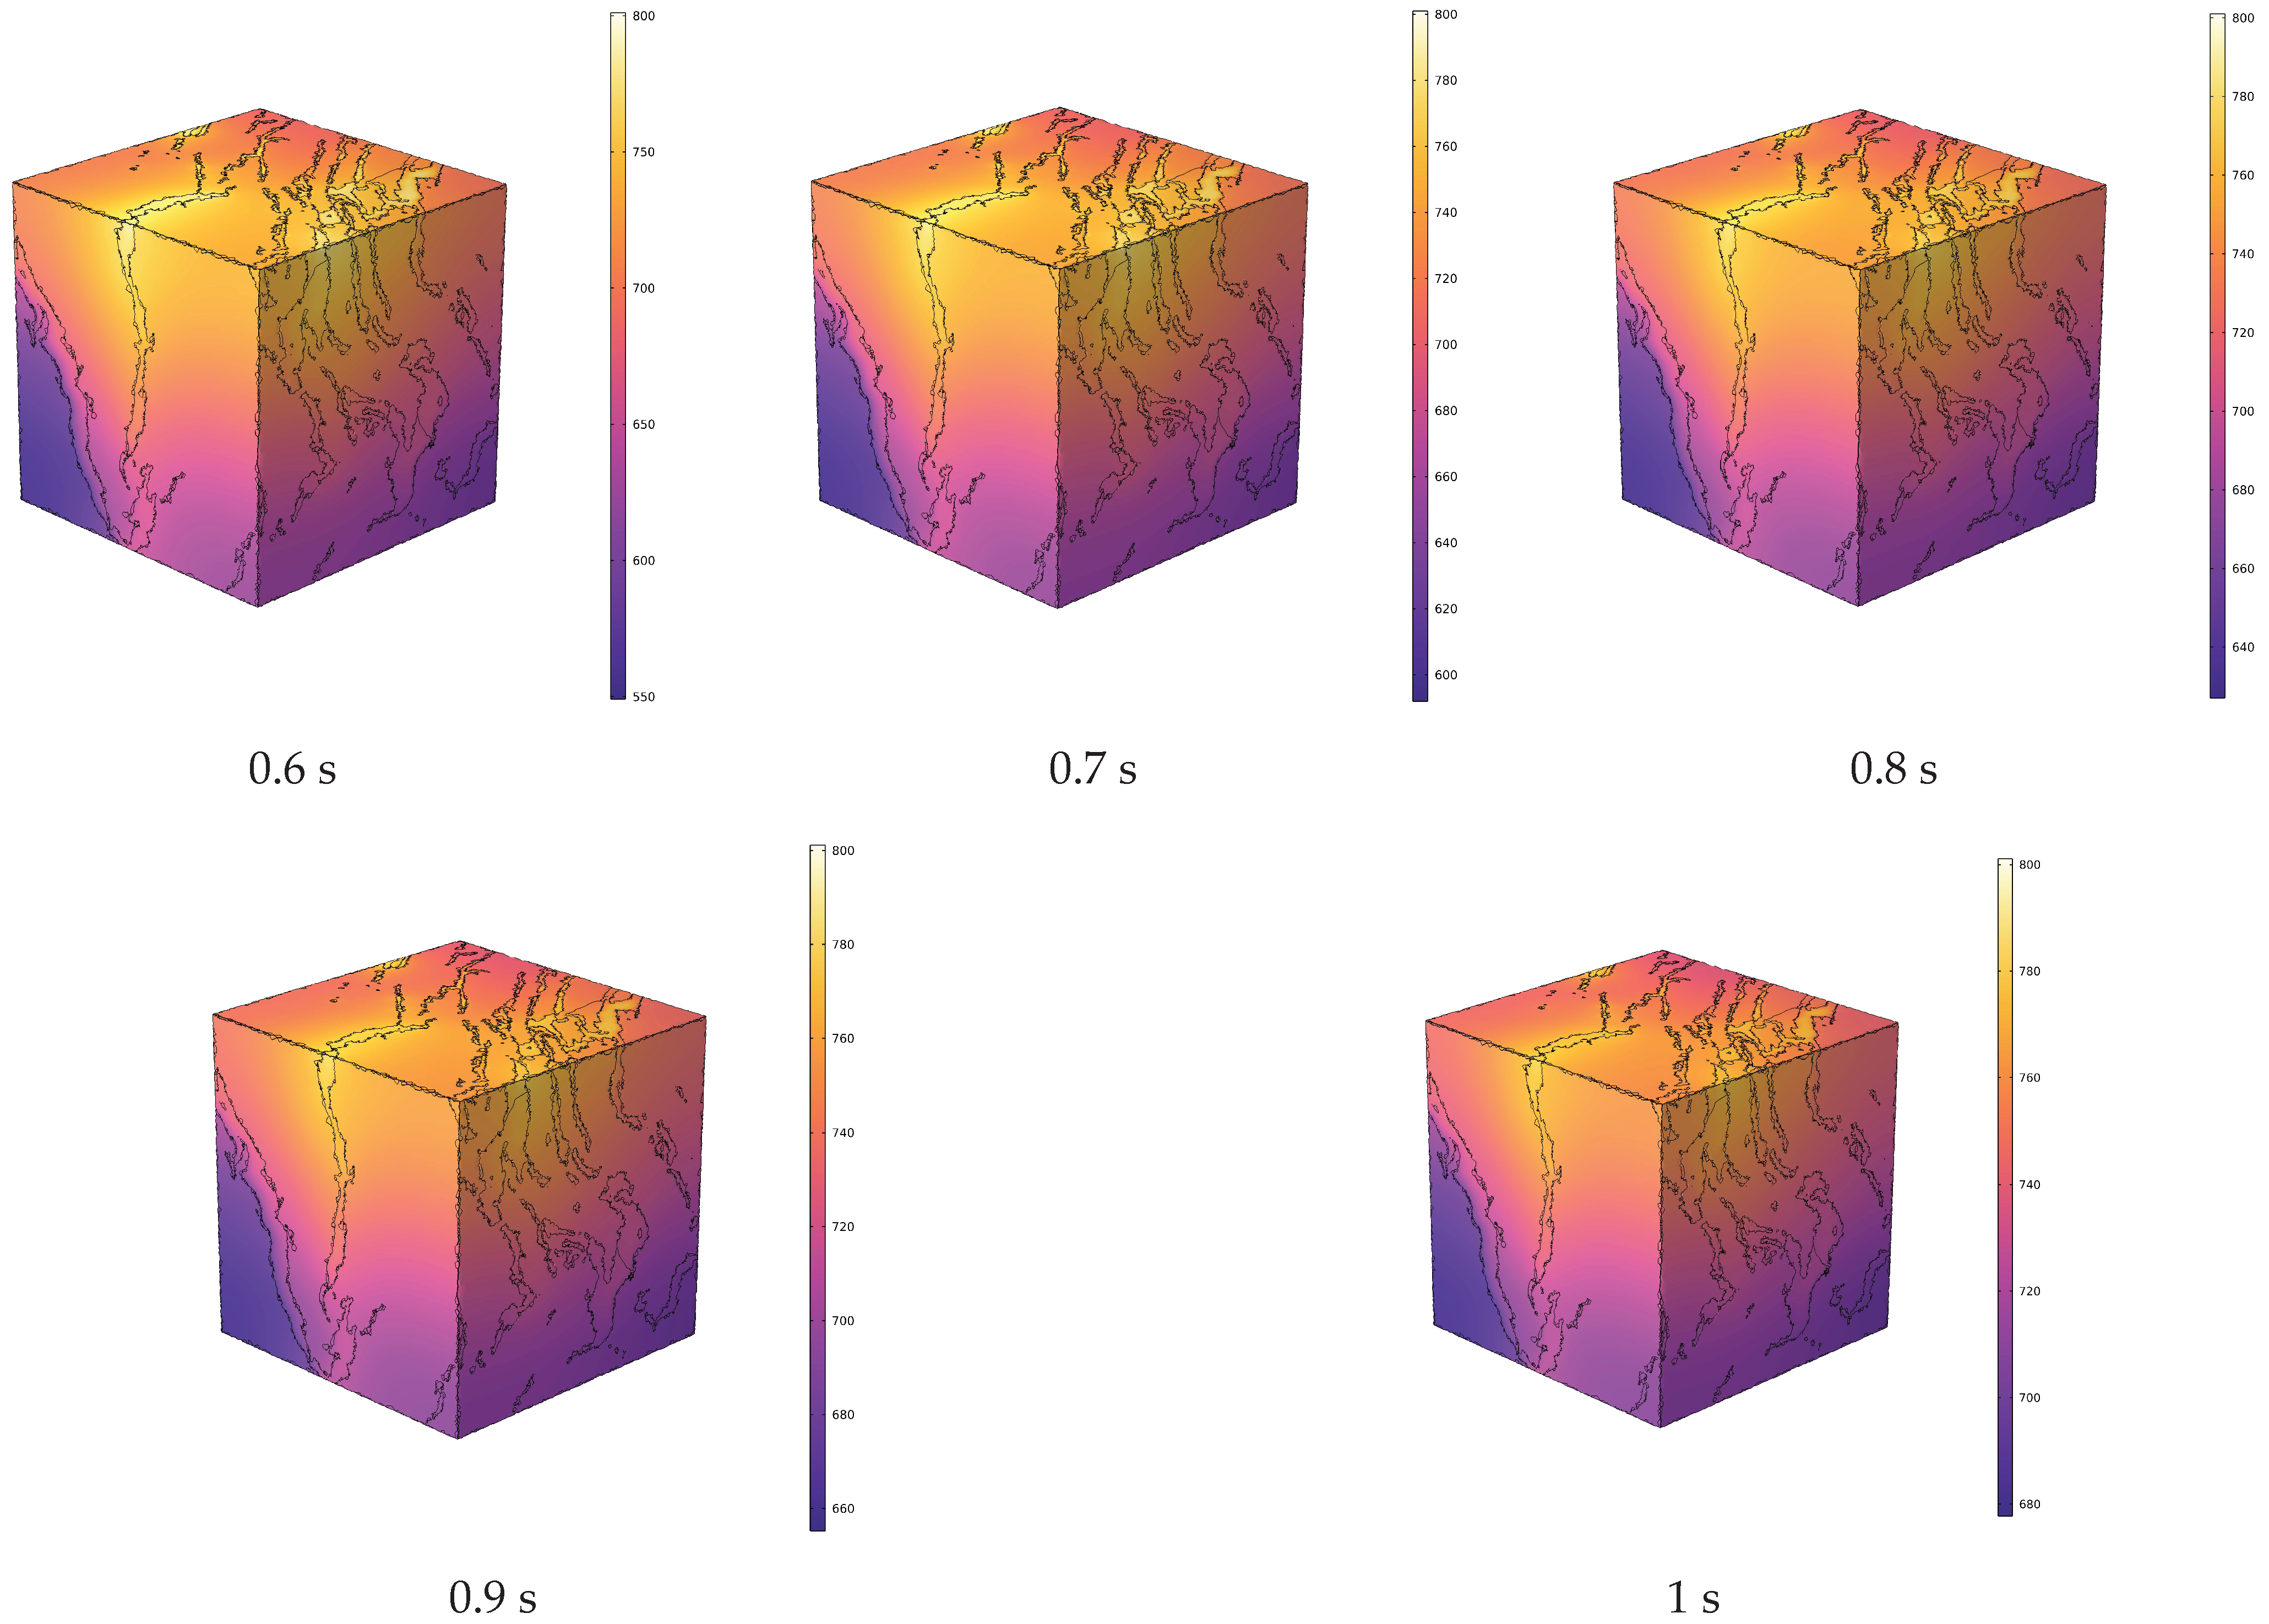
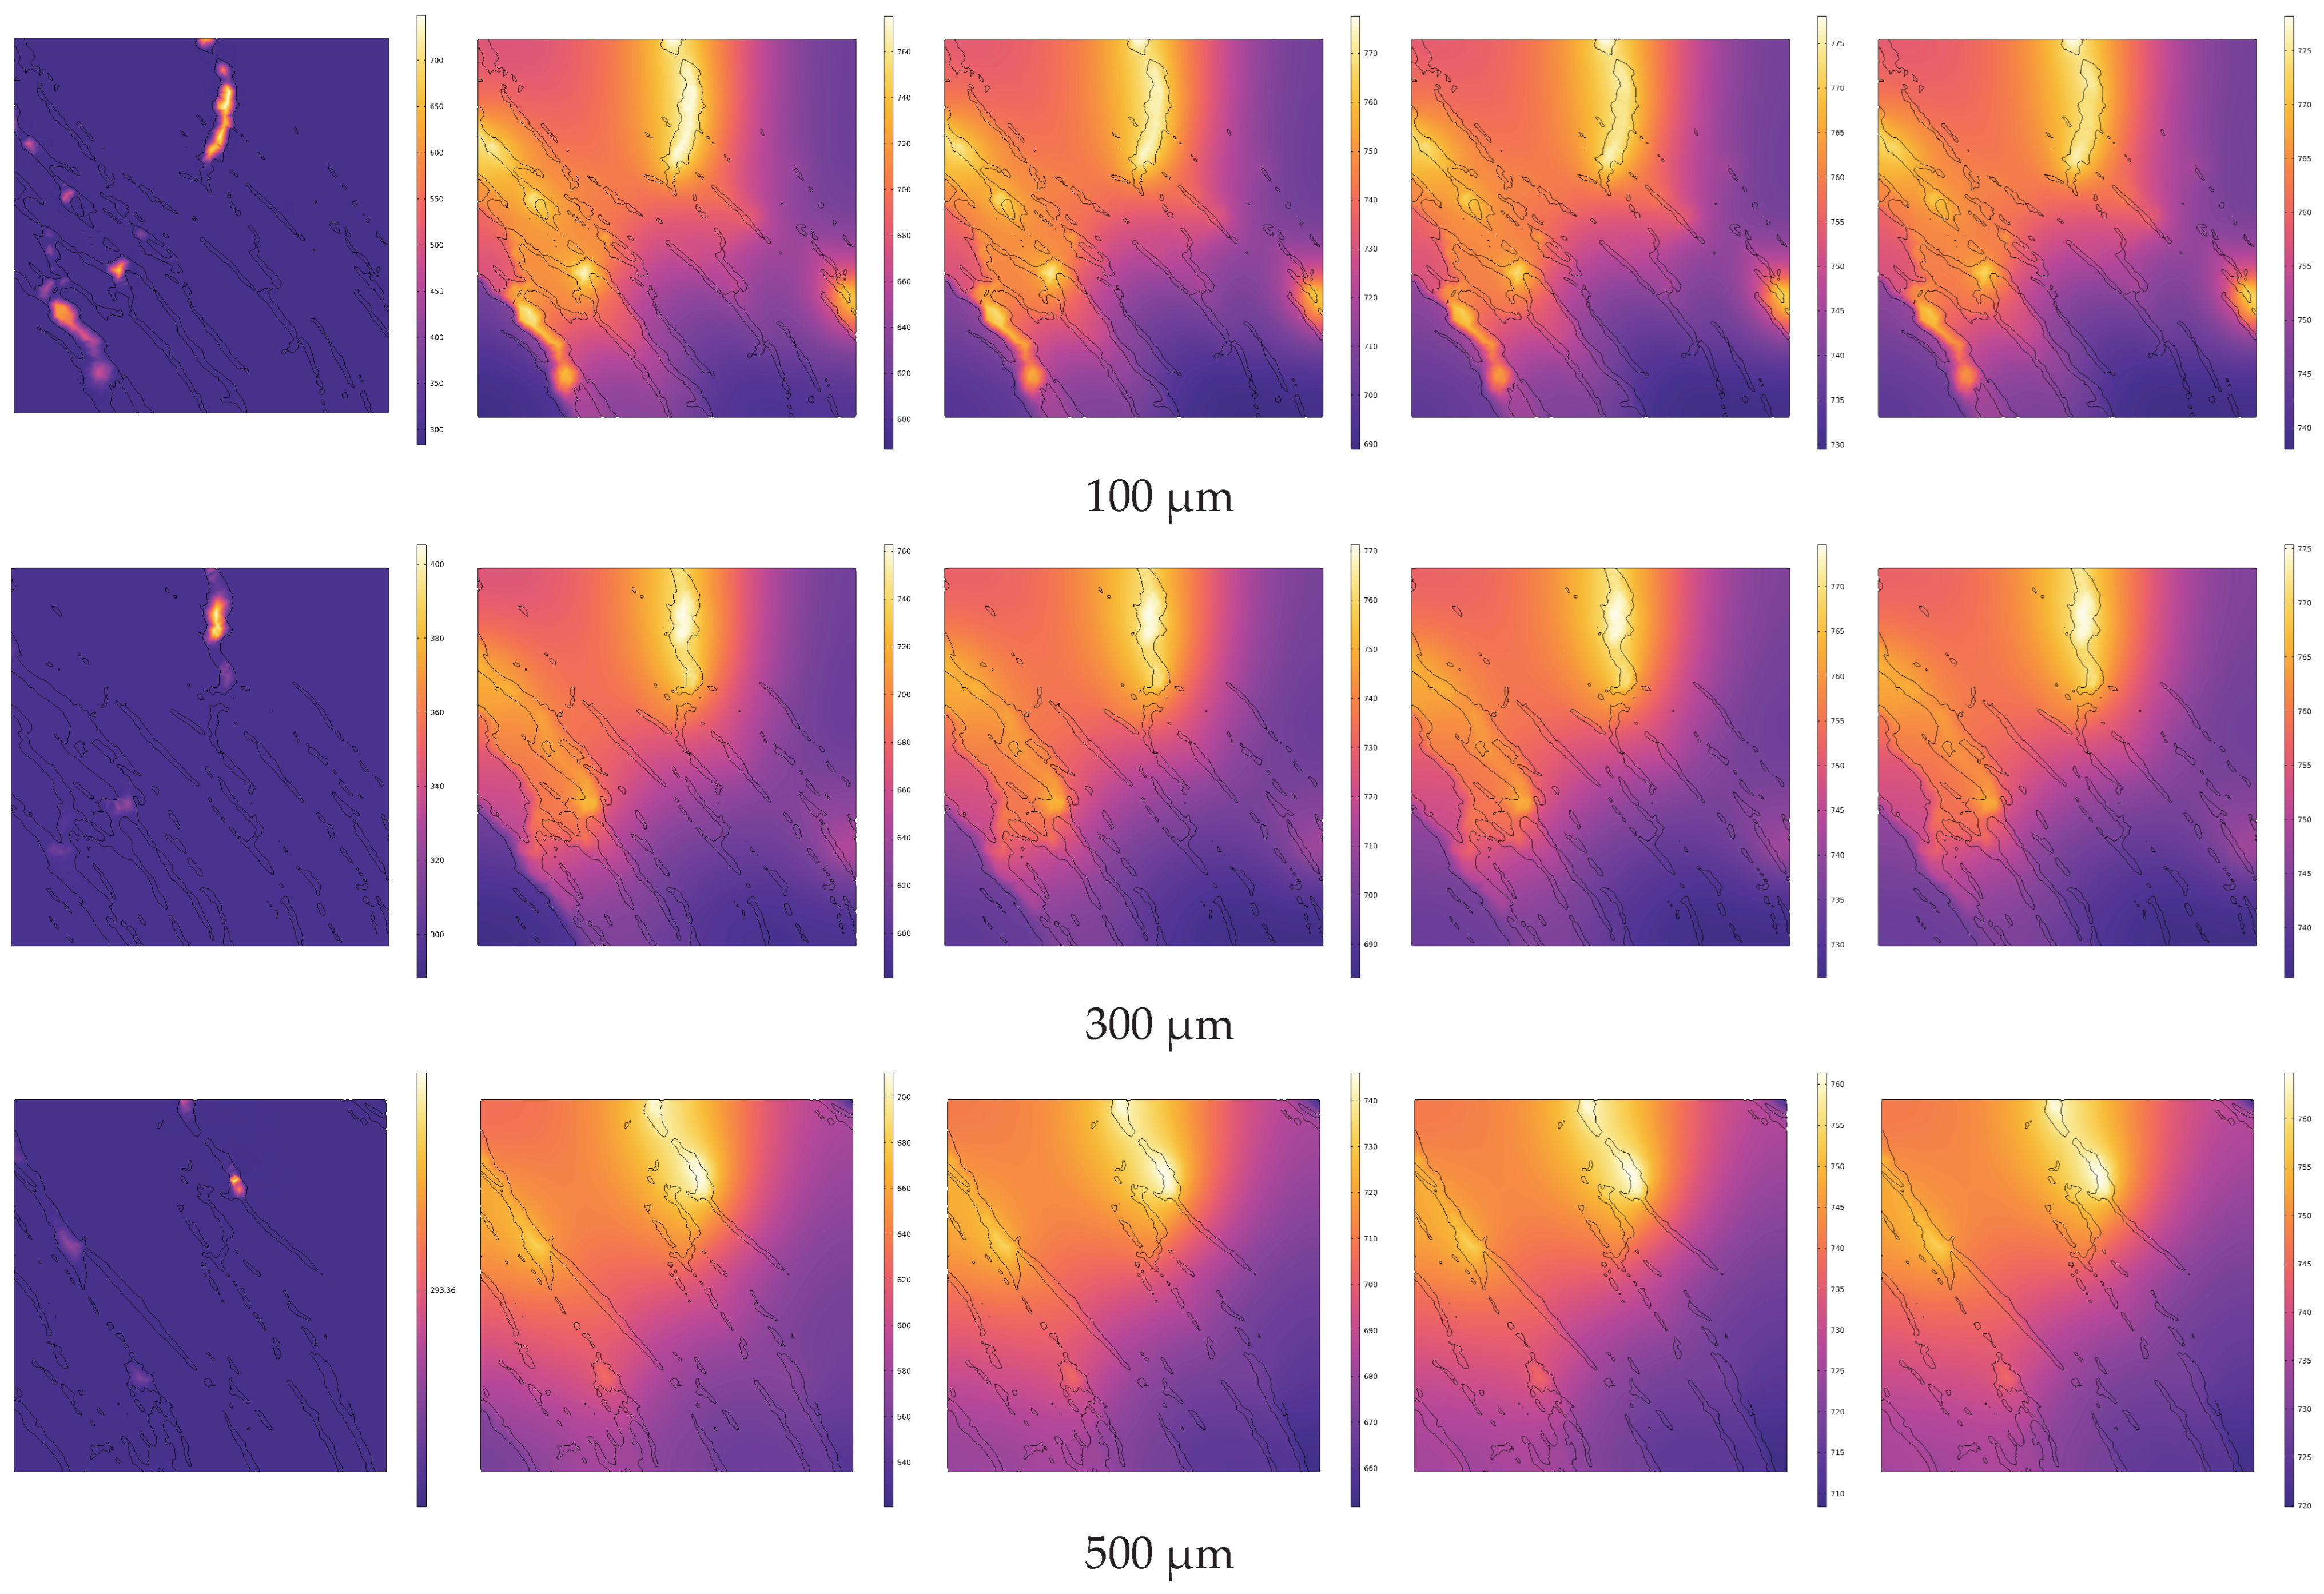
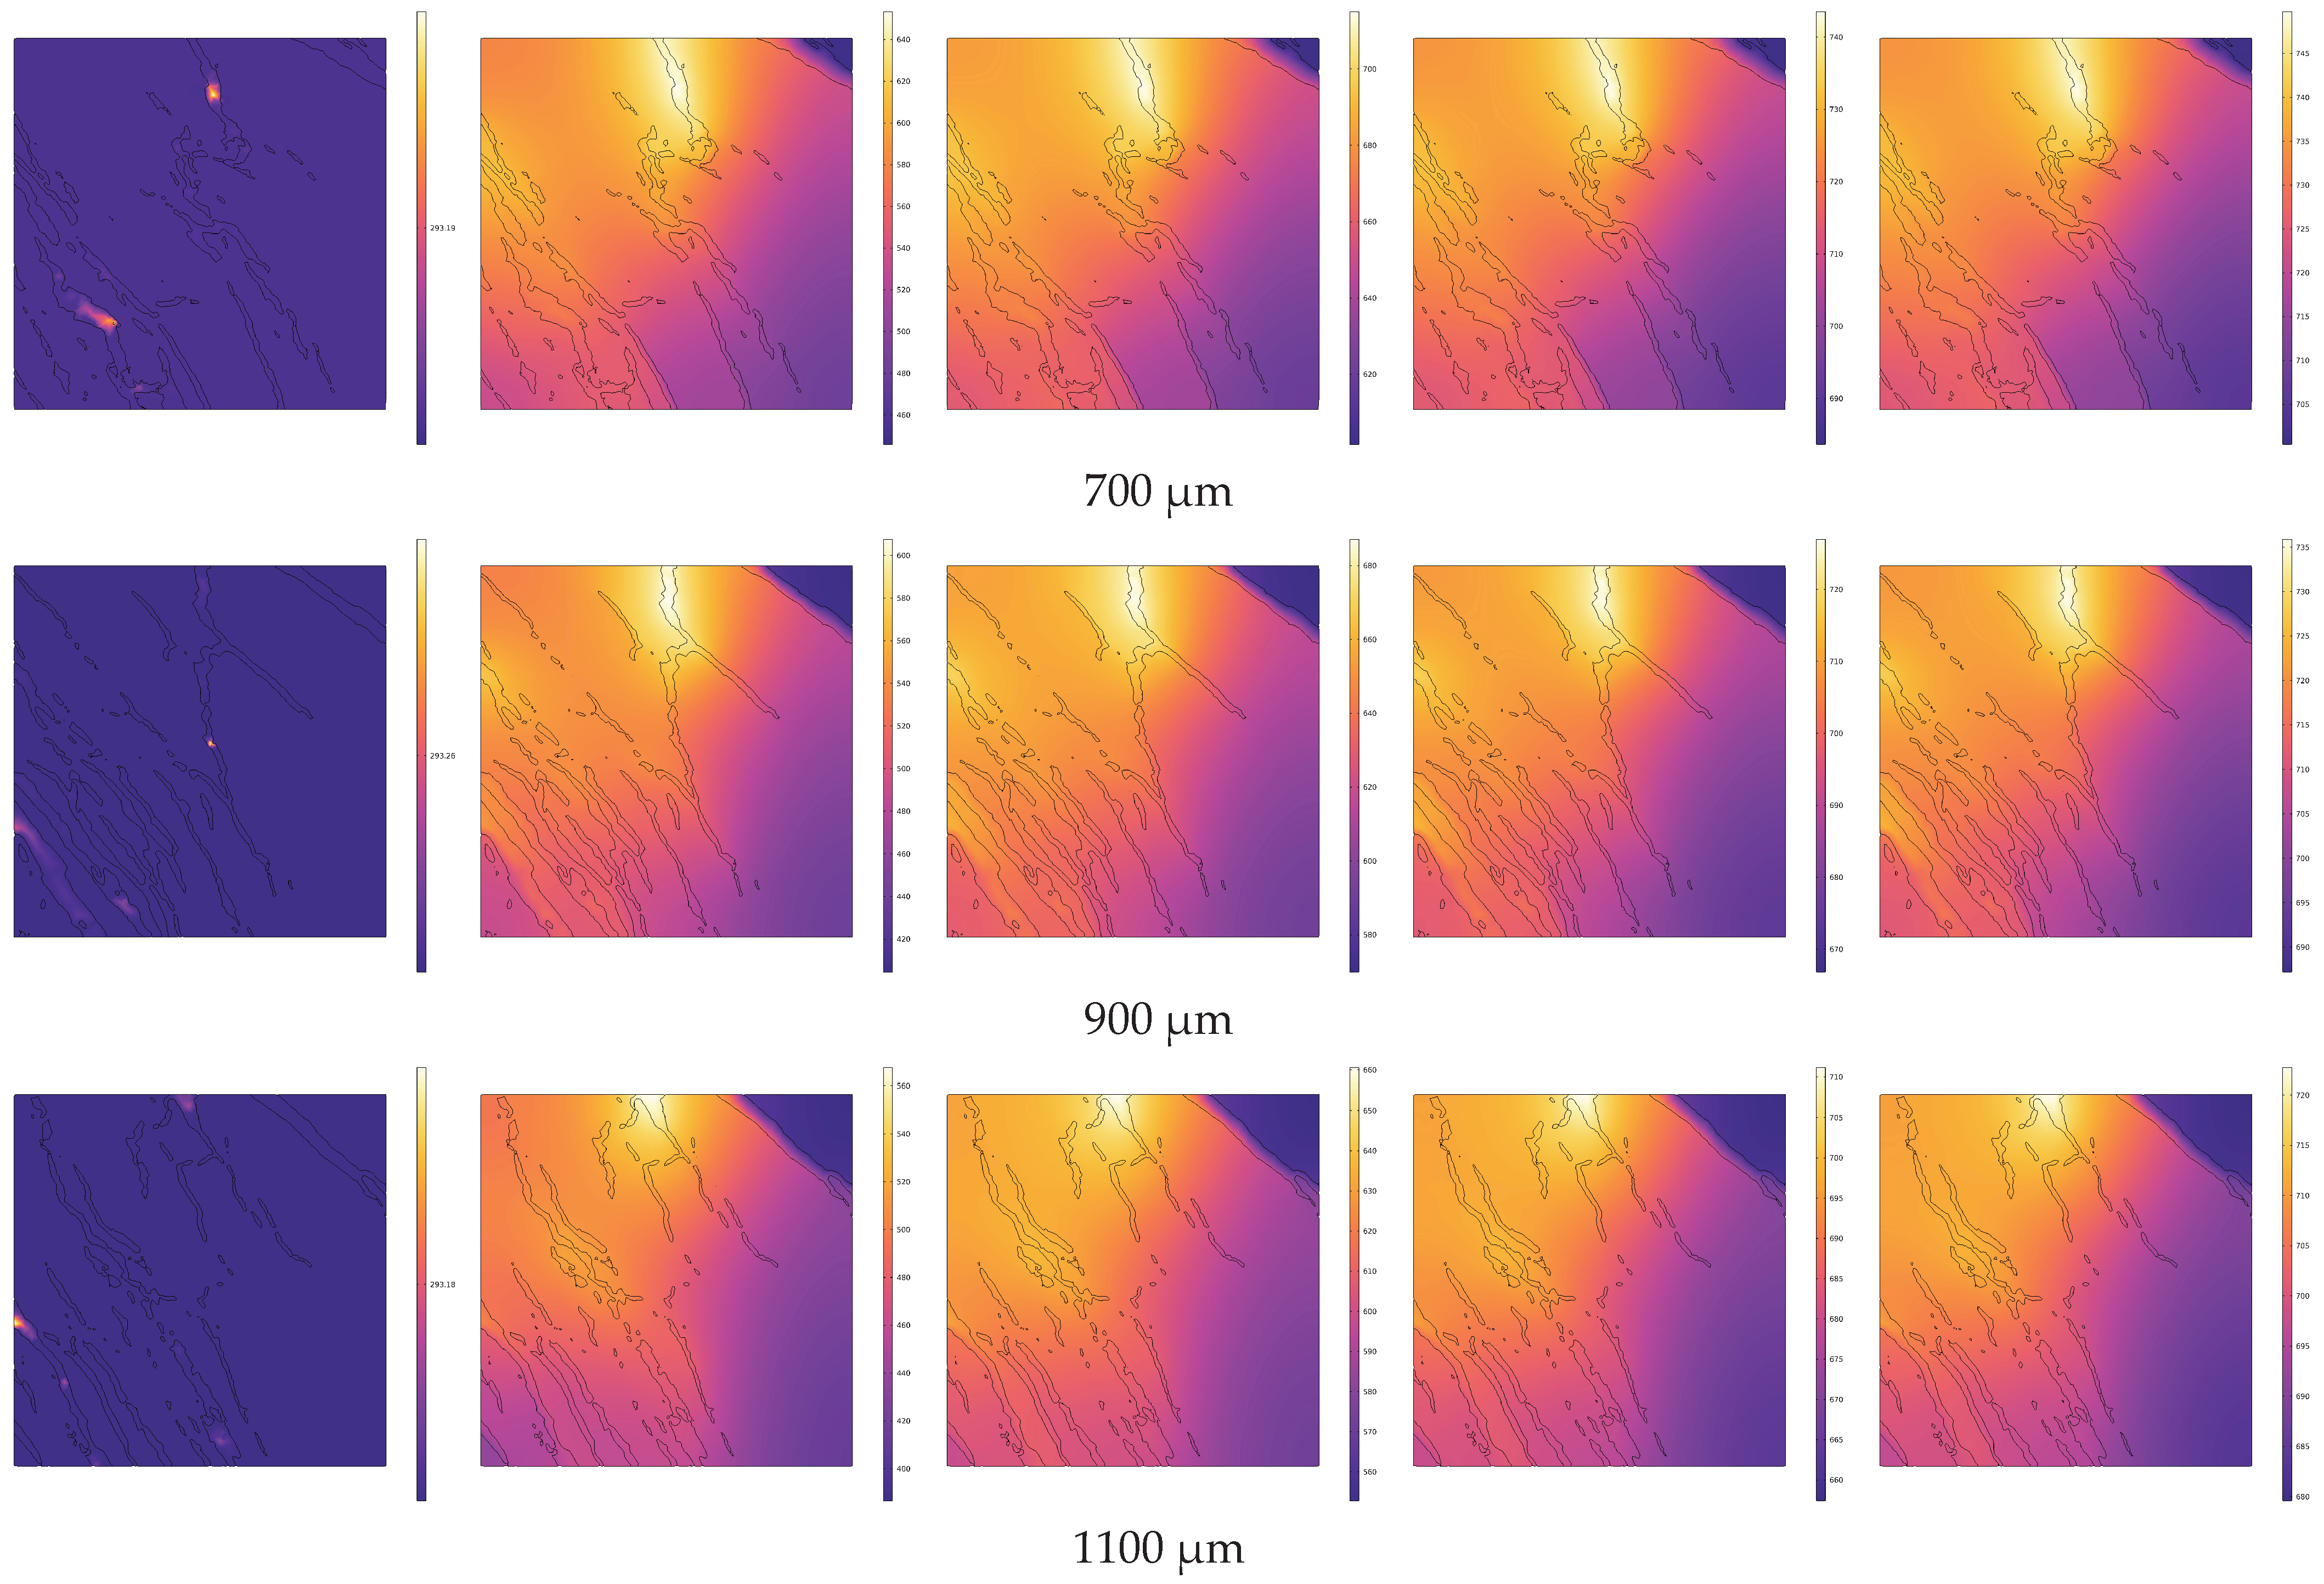
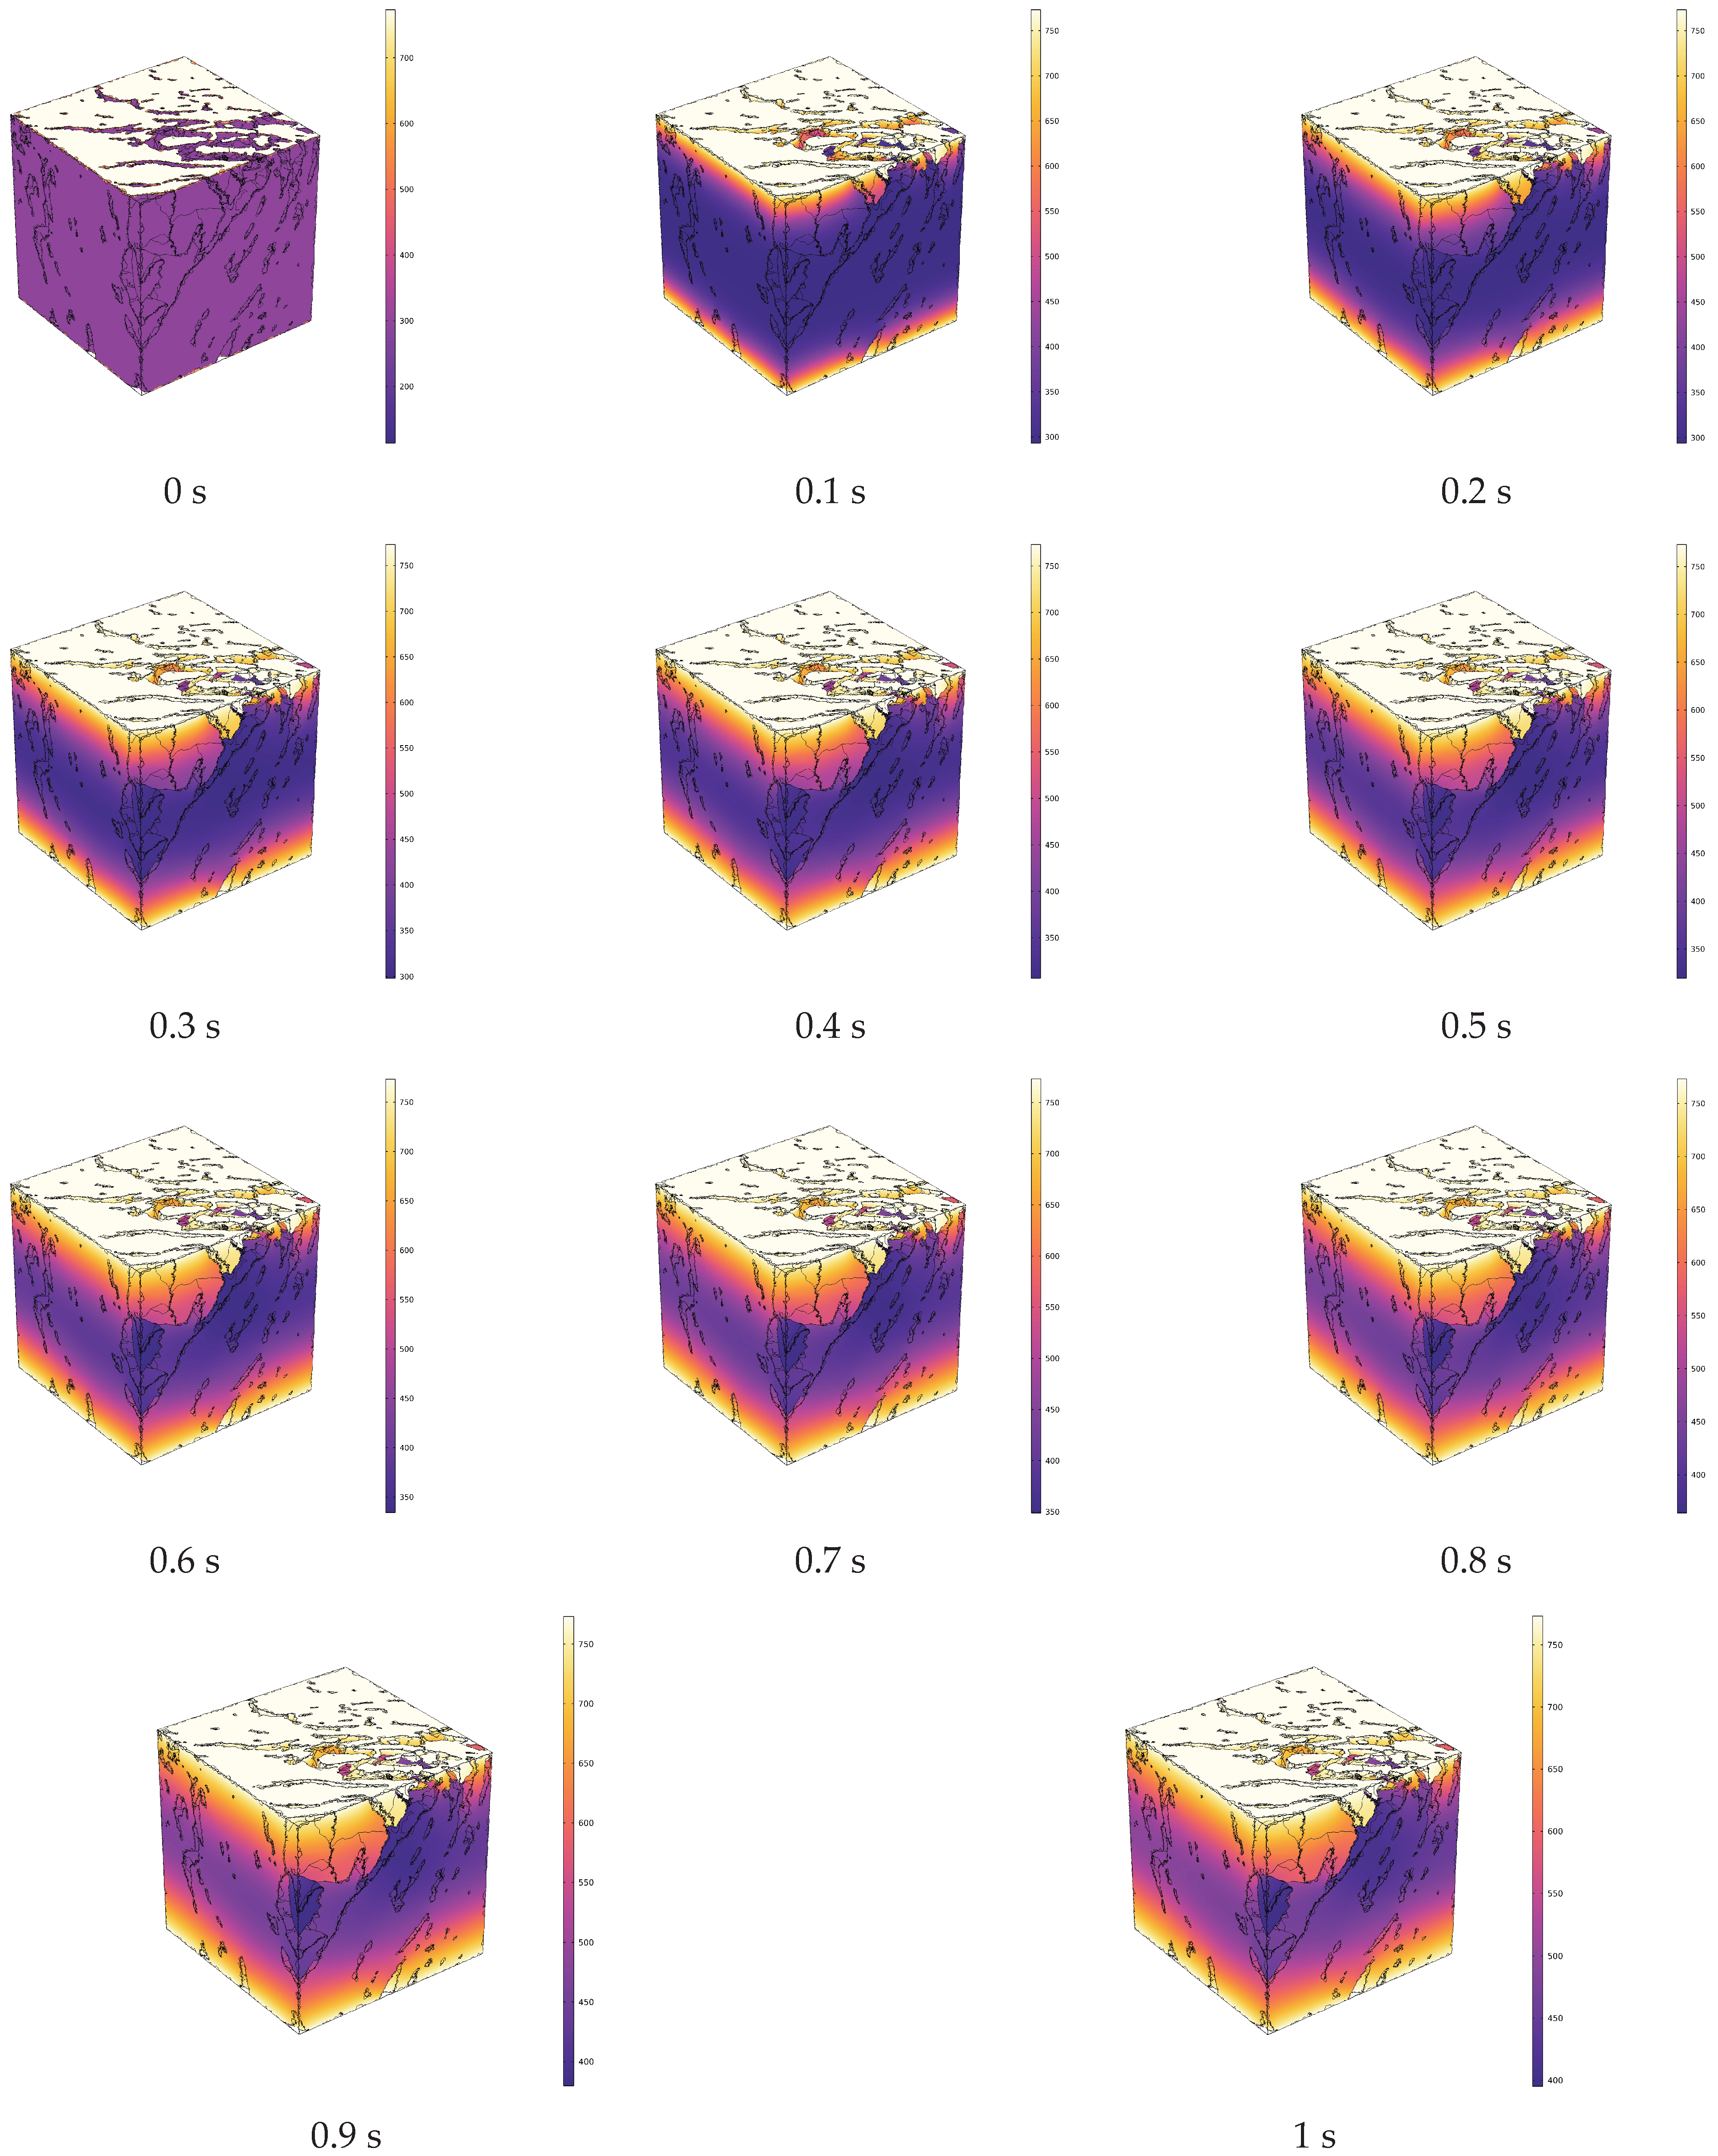
4.1. Analysis of Temperature Field Evolution during In Situ Pyrolysis of Oil Shale with High-Temperature Steam

Figure 4 shows the segmented CT digital core of oil shale after convective heating, with the solid matrix and pore-fracture network distinguished (dark blue represents the pore-fracture network, and light blue represents the solid matrix). Figure 5 illustrates the evolution of the temperature field during the simulated in situ pyrolysis of oil shale using high-temperature steam.
High-temperature steam flows through the inlet along the pore-fracture network, achieving convective heating of the oil shale. Due to the anisotropy of oil shale, the thermal conductivity varies in different bedding directions. The thermal conductivity in the direction parallel to the bedding planes is higher than that in the perpendicular direction. Consequently, while the overall temperature of the oil shale rises, the temperature field in the direction parallel to the bedding planes is superior to that in the perpendicular direction.
The average bulk temperature Tav is used as a reference indicator for in situ convective heating. Its mathematical expression is as follows:
T a v = Ω T d V Ω d V
In the equation, T represents the temperature at any given position, °C; Ω denotes the entire study area of the oil shale.
As shown in Figure 6, the Tav of oil shale during in situ convective heating with high-temperature steam is depicted. The Tav of the oil shale gradually approaches the injected high-temperature steam temperature (500 °C) as convective heating progresses. At 1 s, the Tav reaches 451.45 °C. The temperature increase per unit time gradually decreases as the temperature difference between the high-temperature steam and the oil shale diminishes. Specifically, the temperature increase from 0.9 s to 1 s is only 9.39% of the temperature increase from 0 s to 0.1 s.
In the direction of high-temperature steam injection, cross-sections were taken at intervals of 200 µm within the range of 100 µm to 1100 µm from the steam inlet (including at 100 µm and 1100 µm). The temperature distributions across different cross-sections at various pyrolysis times (e.g., 0 s, 0.3 s, 0.6 s, 0.9 s, 1 s) are shown in Figure 7. In Figure 7, the black contours represent the internal pores and fractures of the oil shale. Heat is gradually conducted from the pores and fractures to the matrix, and due to the uneven distribution of the pores and fractures, the temperature field exhibits non-uniform distribution.
Referring to Equation (17), by defining the entire study area Ω as the corresponding cross-section, the average surface temperature Tas at different cross-sections and pyrolysis times can be obtained. Figure 8 shows the evolution of the Tas of these cross-sections over different pyrolysis times. Initially, during the early stage of pyrolysis at 0.1 s, the closer the cross-section is to the high-temperature steam injection end, the faster the temperature increases. At 0.1 s, the temperature increase at the 100 µm cross-section reaches a maximum of 285.32 °C. As the distance increases, the temperature rise of the cross-sections gradually decreases, with the 1100 µm cross-section only reaching 63.44 °C. The temperature increase at 1100 µm and 0.1 s is merely 16.74% of that at 100 µm and 0.1 s. As high-temperature steam continues to be injected, the temperature difference between different cross-sections gradually decreases. By 1 s, the temperature at 1100 µm reaches 426.88 °C, with only a 55.31 °C difference compared to the temperature at 100 µm. This indicates that during convective heating with high-temperature steam, the overall temperature rise of oil shale is uniform and orderly, without the occurrence of localized overheating zones. This uniform temperature distribution can effectively enhance pyrolysis efficiency.

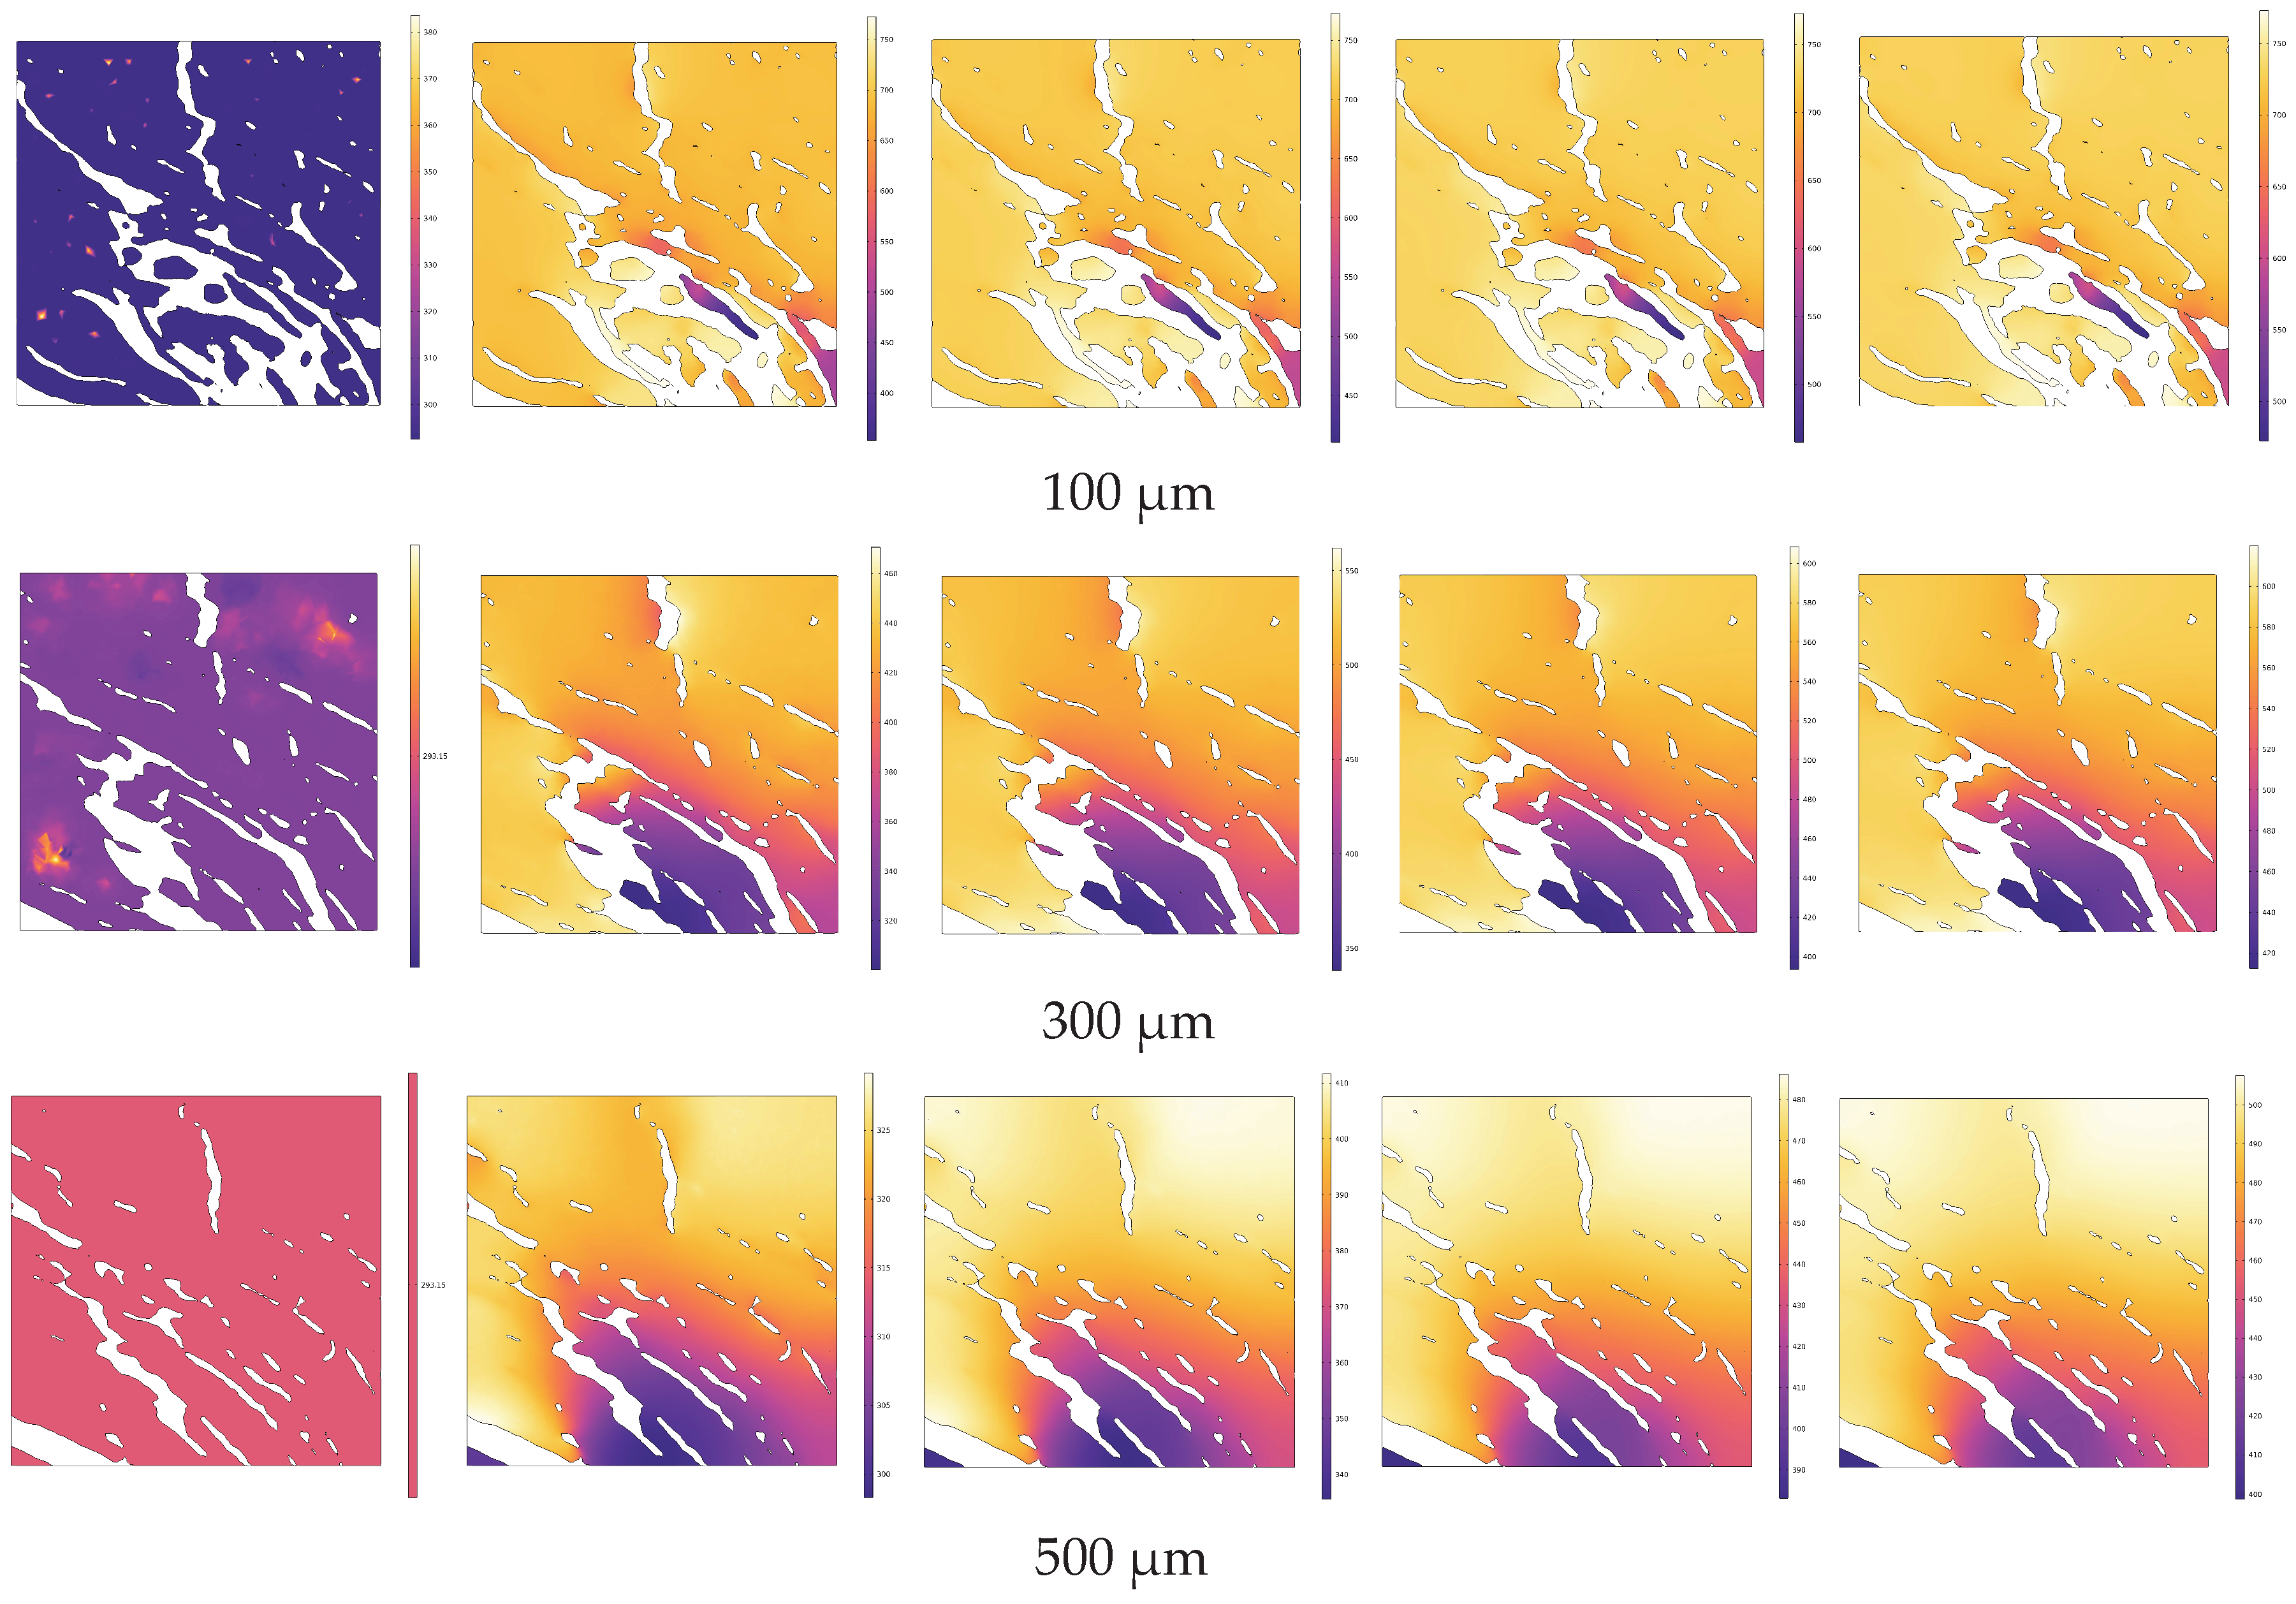
4.2. Analysis of Temperature Field Evolution during Electrical In Situ Pyrolysis of Oil Shale

Figure 9 shows the segmented CT digital core of oil shale after conductive heating, with the solid matrix and pore-fracture network distinguished (dark blue represents the pore-fracture network, and light blue represents the solid matrix). Figure 10 illustrates the evolution of the temperature field during the simulated in situ pyrolysis of oil shale using electrical heating.
During electrical conduction heating, the solid matrix serves as the heat carrier to elevate the overall temperature. Due to the isolation effect of the pore structure on the solid matrix, localized high-temperature zones can occur within the oil shale, affecting efficient heat conduction.
Similarly, using Equation (17), the average bulk temperature (Tav′) of oil shale during electrical conduction heating is calculated, and its variation is depicted in Figure 11. The Tav′ of oil shale gradually approaches the temperature of the heating source (500 °C) as electrical conduction heating progresses. At 1 s, the Tav′ reaches 307.32 °C, which is 61.46% of the heating source temperature. Similarly, the temperature increase per unit time during conduction heating gradually decreases as the temperature difference between the heating source and the oil shale diminishes. Specifically, the temperature increase from 0.9 s to 1 s is only 16.01% of the temperature increase from 0 s to 0.1 s.
Along the normal direction to the heating source surface (similar to the 3.1 direction of high-temperature steam injection), cross-sections were taken at intervals of 200 µm within the range of 100 µm to 1100 µm from the upper end of the heating source (including at 100 µm and 1100 µm). The temperature distributions across different cross-sections at various pyrolysis times (e.g., 0 s, 0.3 s, 0.6 s, 0.9 s, 1 s) are depicted in Figure 12. In Figure 12, the white areas represent the pore structure, while the colored regions represent the solid matrix. Heat is conducted from the heating source end through the solid matrix to the entire region gradually.
Using the corresponding cross-section as the study area, the average surface temperature (Tas′) at different cross-sections and pyrolysis times is obtained. Figure 13 illustrates the distribution patterns of Tas′ at different cross-sections under various pyrolysis times. Initially, at the start of pyrolysis, the Tas′ at different positions in the oil shale remains at room temperature. As heat continues to conduct from both ends of the heating sources into the solid matrix, Tas′ at different positions steadily increases, gradually approaching the temperature of the heating sources (500 °C). Furthermore, at different pyrolysis times, the Tas′ at different positions exhibits a distribution pattern of “higher at both ends, lower in the middle”. This indicates that heat transfer during electrical heating primarily occurs inward along the normal direction to the heating source surface. Moreover, cross-sections closer to the heating source end experience a greater rate of temperature rise. For instance, within 1 s, the temperature increase at 100 μm (near the heating source end) is 2.27 times that at 500 μm (near the cross-section farthest from the heating source end).

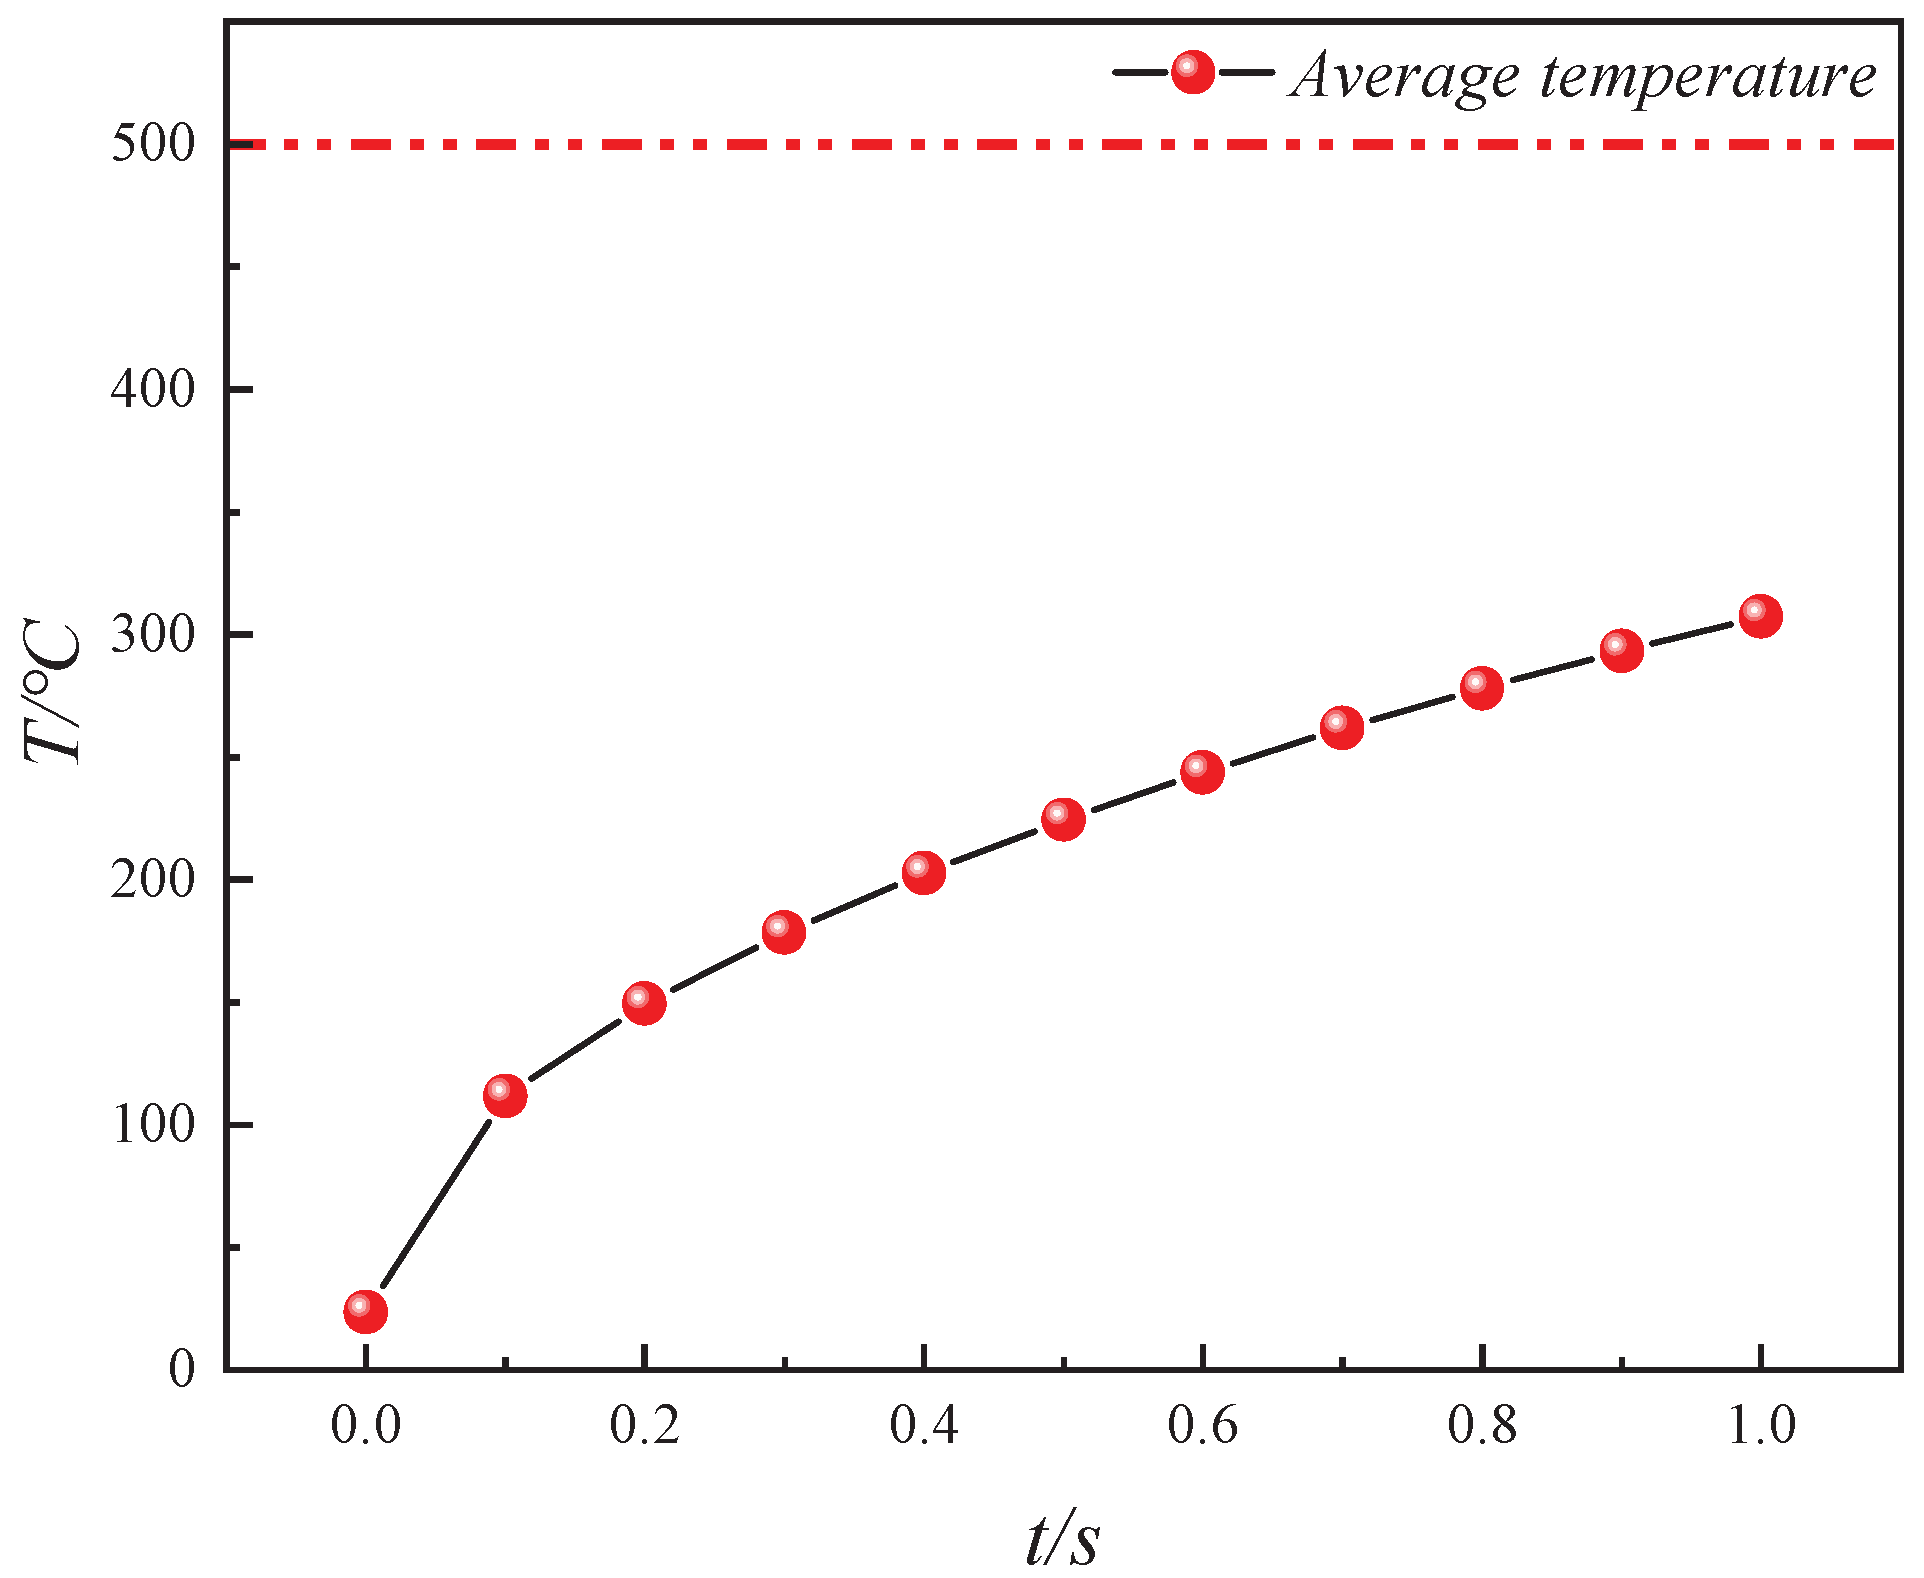
4.3. Comparison of Heat Transfer Efficiency between Convective Heating and Conductive Heating

Based on the simulation results of the in situ pyrolysis of oil shale using convective heating with high-temperature steam (from Section 3.1) and conductive heating with electrical methods (from Section 3.2), Tc is defined as the ratio of the average bulk temperatures at the same pyrolysis time between convective heating with high-temperature steam (Tav) and conductive heating with electrical methods (Tav′).
T c = T a v T a v
Firstly, the variations in Tav, Tav′, and Tc with pyrolysis time are shown in Figure 14. It is clearly observed in Figure 14 that at each moment during the in situ pyrolysis process, Tav for convective heating with high-temperature steam is higher than Tav′ for conductive heating with electrical methods. As pyrolysis progresses, both Tav and Tav′ gradually approach the temperature of the heat source (500 °C). The ratio Tc shows an increasing then decreasing trend over time, reaching its peak at 0.4 s with a value of 1.61331. This trend occurs because the rate of temperature increase decreases as the average temperature approaches the heat source temperature during the heat transfer process. Specifically, after 0.4 s, the rate of temperature increase for convective heating gradually becomes lower than that for conductive heating, resulting in Tc initially increasing and then decreasing during pyrolysis. However, Tc remains greater than 1 throughout, indicating that convective heating consistently exhibits higher heat transfer efficiency compared to conductive heating.
Since the heat source temperature is consistently 500 °C, assuming 400 °C as the lower limit for the high-temperature region, the variation of the volume of the temperature range from 400 °C to 500 °C with pyrolysis time under different pyrolysis methods is depicted in Figure 15 based on temperature field data. From the figure, it is evident that under different pyrolysis methods, the growth of the volume of the high-temperature region (400 °C to 500 °C) exhibits distinct trends. During convective heating with high-temperature steam for in situ pyrolysis, the volume shows exponential growth. In contrast, during conductive heating with electrical methods for in situ pyrolysis, the volume grows more gradually in a logarithmic manner. In the initial stages of pyrolysis (0 s to 0.3 s), convective heating with high-temperature steam requires time for infiltration through the pore structure, gradually diffusing heat outward from the center of the pore structure into the solid matrix. In contrast, conductive heating with electrical methods directly conducts heat through the solid matrix. This results in slower growth of the high-temperature region during the initial phase of convective heating compared to conductive heating. At 0.3 s, the volumes of the high-temperature regions formed by both pyrolysis methods are approximately the same, reaching around 1.2 × 10⁻¹⁰ m3. Subsequently (0.3 s~1 s), the volume of the high-temperature region under convective heating increases rapidly, while under conductive heating, it continues to grow more gradually. By the end of 1 s, the volume of the high-temperature region formed under convective heating is 5.22 times larger than that formed under conductive heating. Although initially during pyrolysis, the high-temperature region formed by conductive heating is superior to that formed by convective heating, once the heat-carrying fluid flow stabilizes, the volume of the high-temperature region formed by convective heating increases rapidly compared to conductive heating.

4.4. Reflection and Outlook

This study utilized a combination of experimental and simulation approaches to compare the heat transfer efficiency of oil shale under different heating methods, based on real CT digital cores. During the experiments, the cooling effect was carefully controlled to minimize its impact on fracture evolution. To reduce the influence of specimen cooling on the research outcomes, the specimens were allowed to cool naturally in a sealed in situ state, thereby minimizing the expansion of cooling effects caused by “unconstrained, forced cooling”. However, achieving real-time micro-CT scanning under high-temperature in situ pyrolysis conditions would yield more accurate research results. Currently, the 4D micro-CT scanning technology for the in situ pyrolysis of oil shale under convective heating has not yet been realized globally and remains in the exploratory stage. Our research team is actively pursuing breakthroughs in real-time CT scanning technology for the in situ pyrolysis of oil shale under convective heating. Any future advancements in this area will further refine our research conclusions and provide more precise guidance for engineering practices.

5. Conclusions

This study combines experimental and numerical simulation methods to analyze the temperature field evolution inside oil shale under different heating methods, based on real digital rock cores seamlessly integrated with COMSOL. From a microscopic perspective, the research contrasts the heat transfer efficiency of oil shale under different heating methods. The conclusions are as follows:
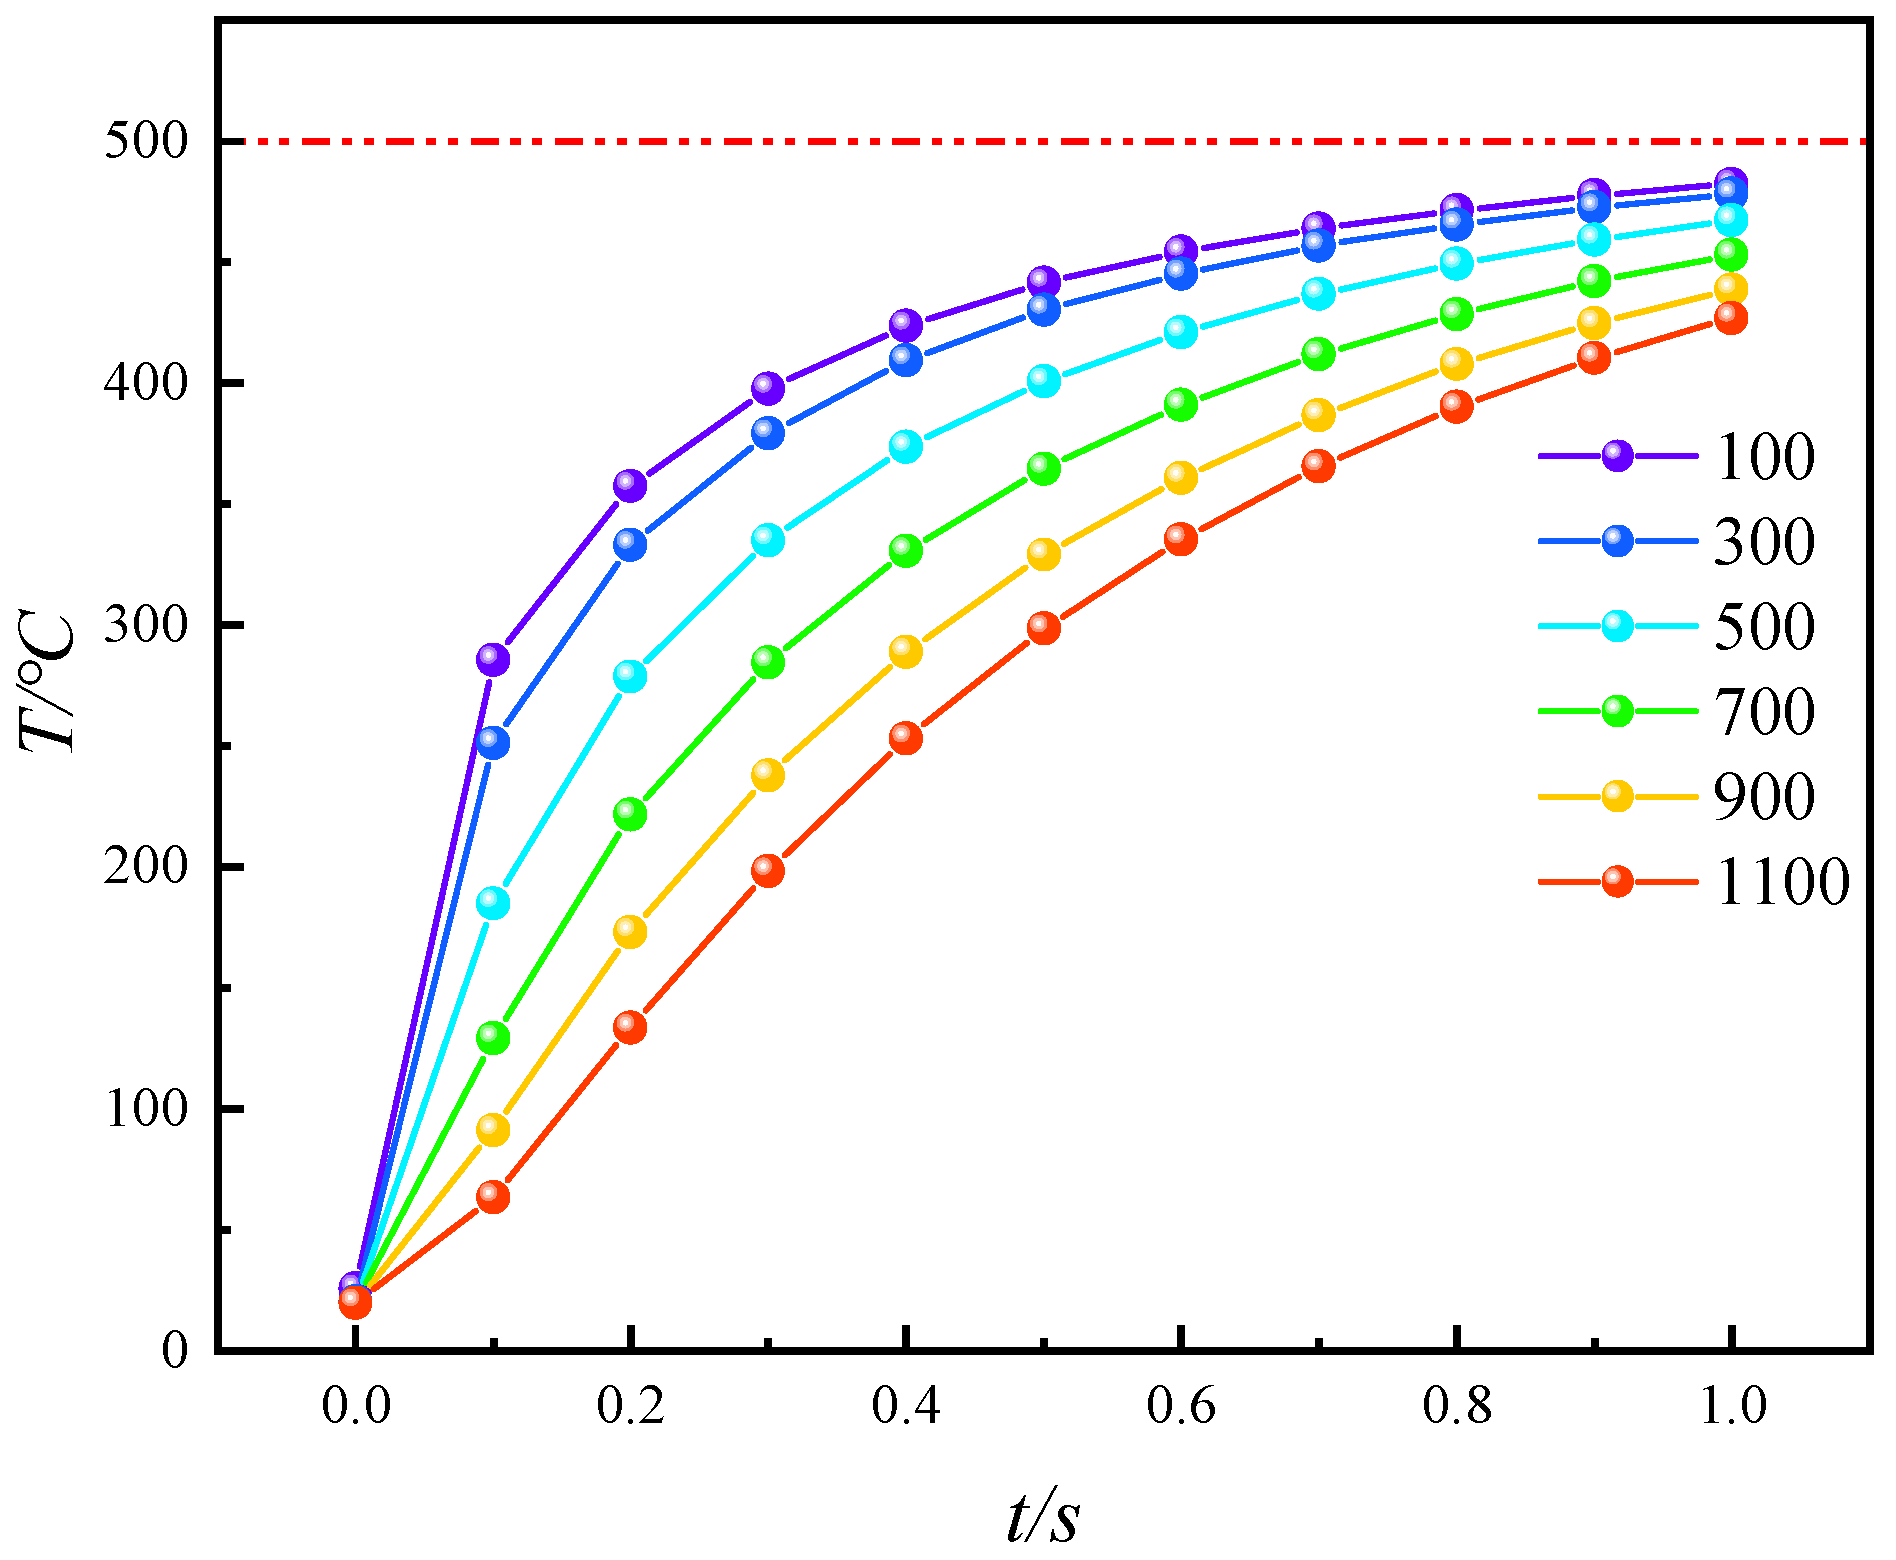
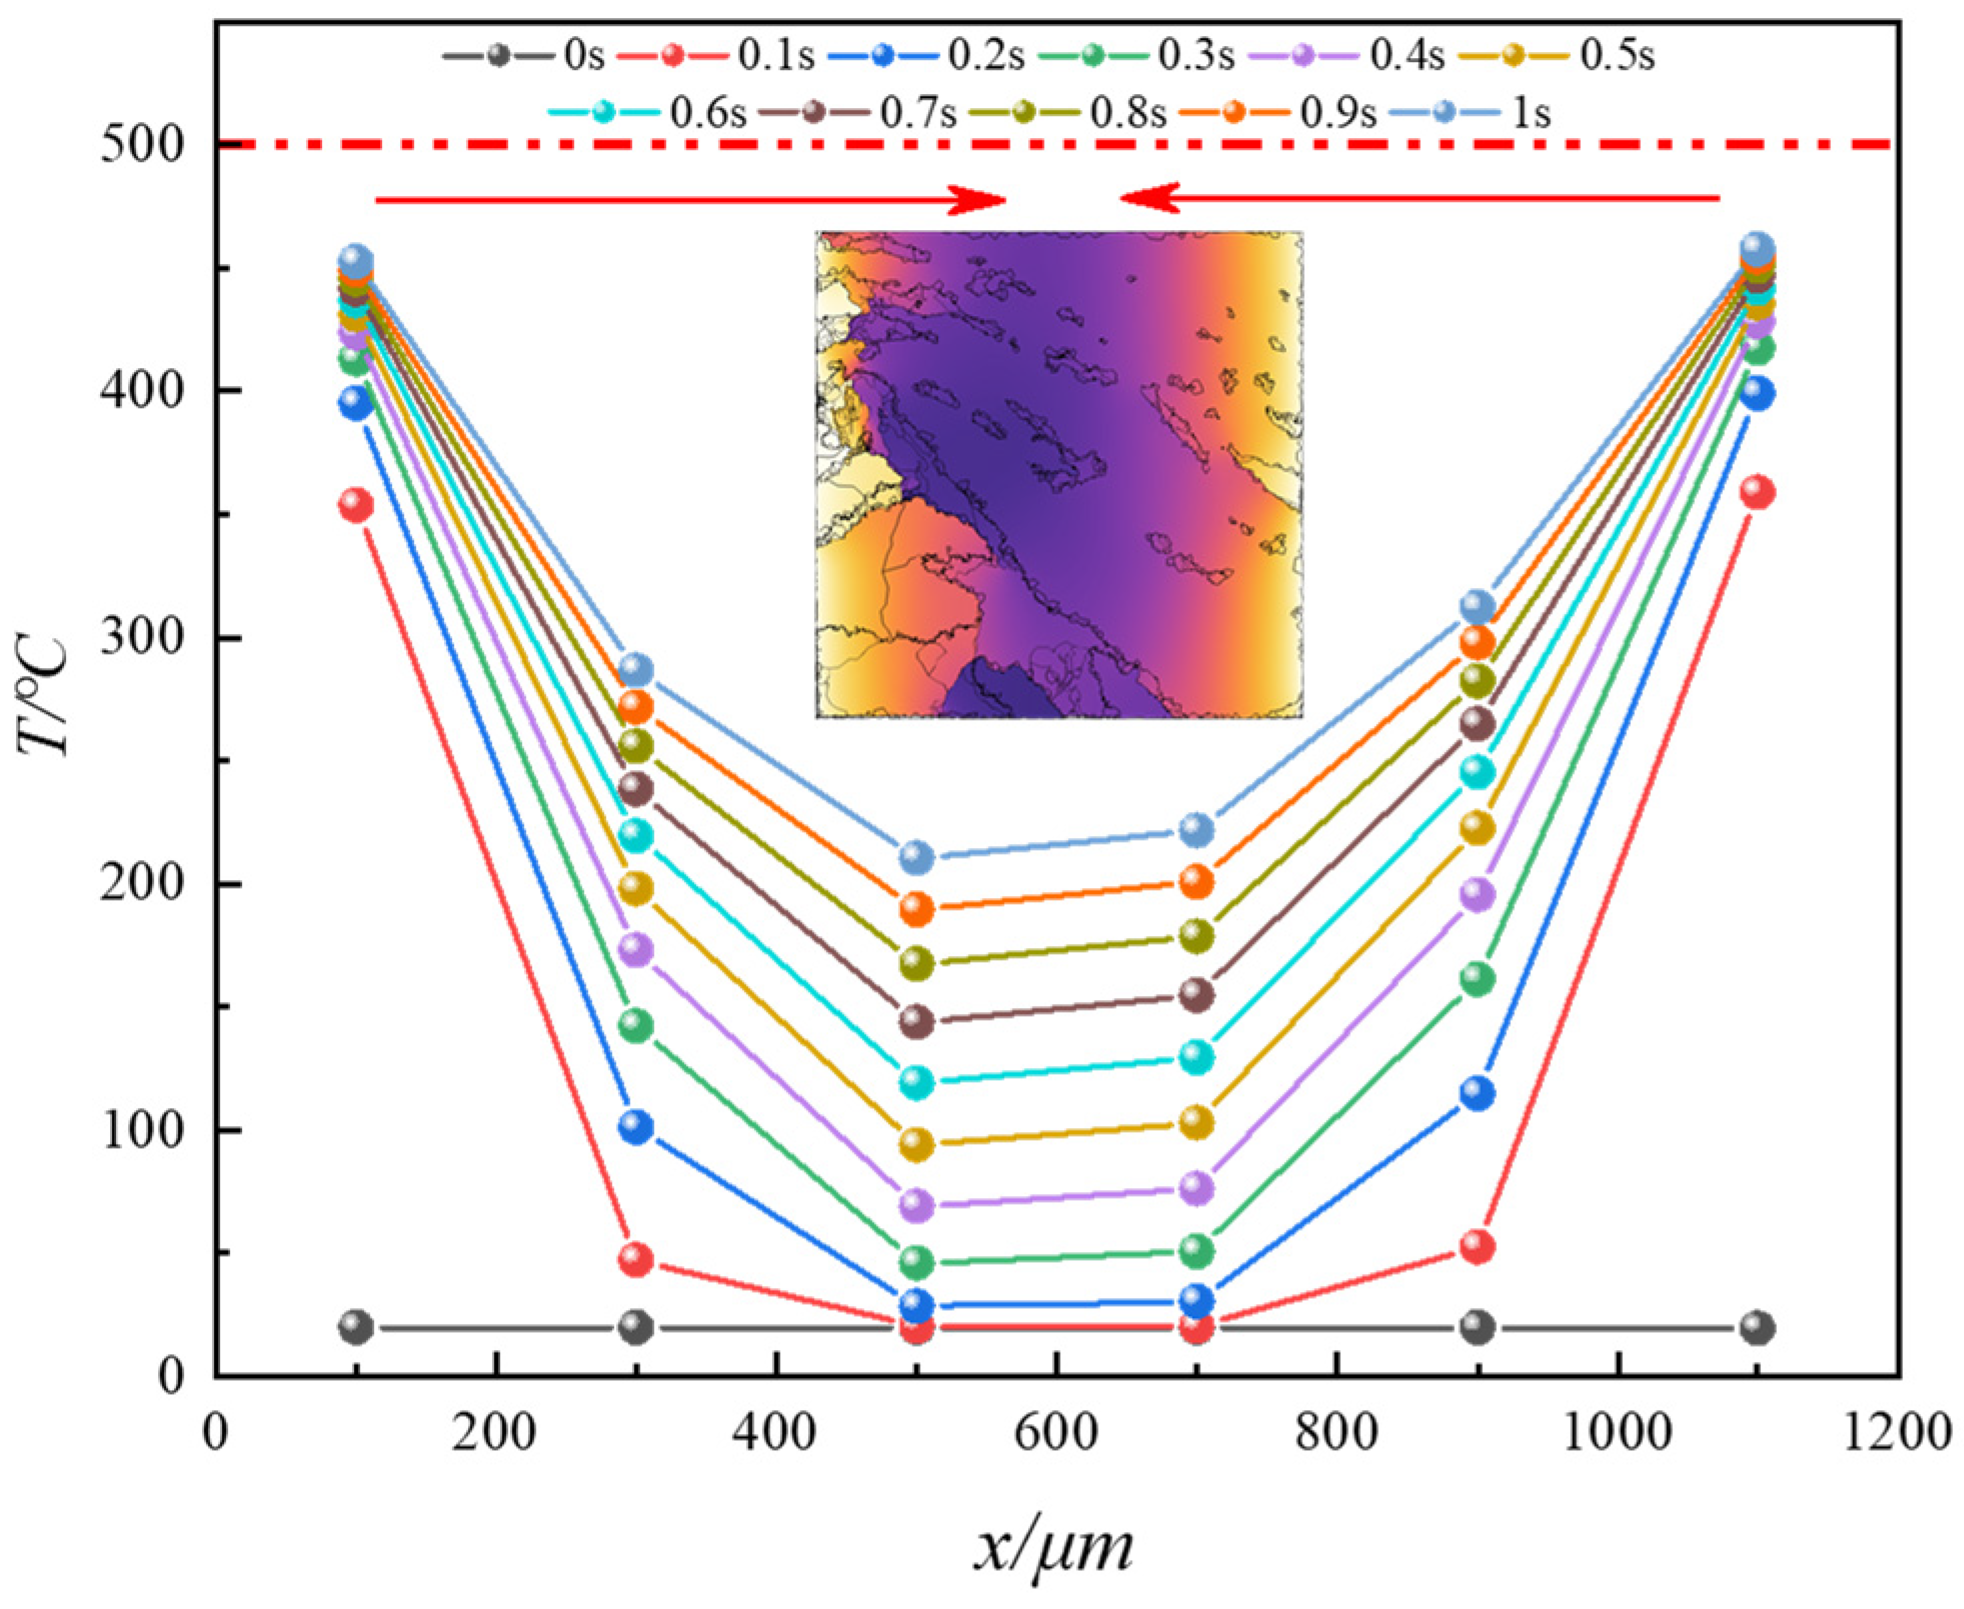
  • During the in situ pyrolysis of oil shale using convective heating with high-temperature steam, the overall temperature rise is uniform and orderly. Heat gradually transfers from pore networks to the matrix, with the uneven distribution of pores causing variations in the temperature field. However, no local overheating areas appear, which effectively enhances pyrolysis efficiency. As high-temperature steam continues to be injected, the temperature difference between different cross-sections decreases gradually. By 1 s, the temperature at 1100 μm has reached 426.88 °C, differing from the temperature at 100 μm by only 55.31 °C.
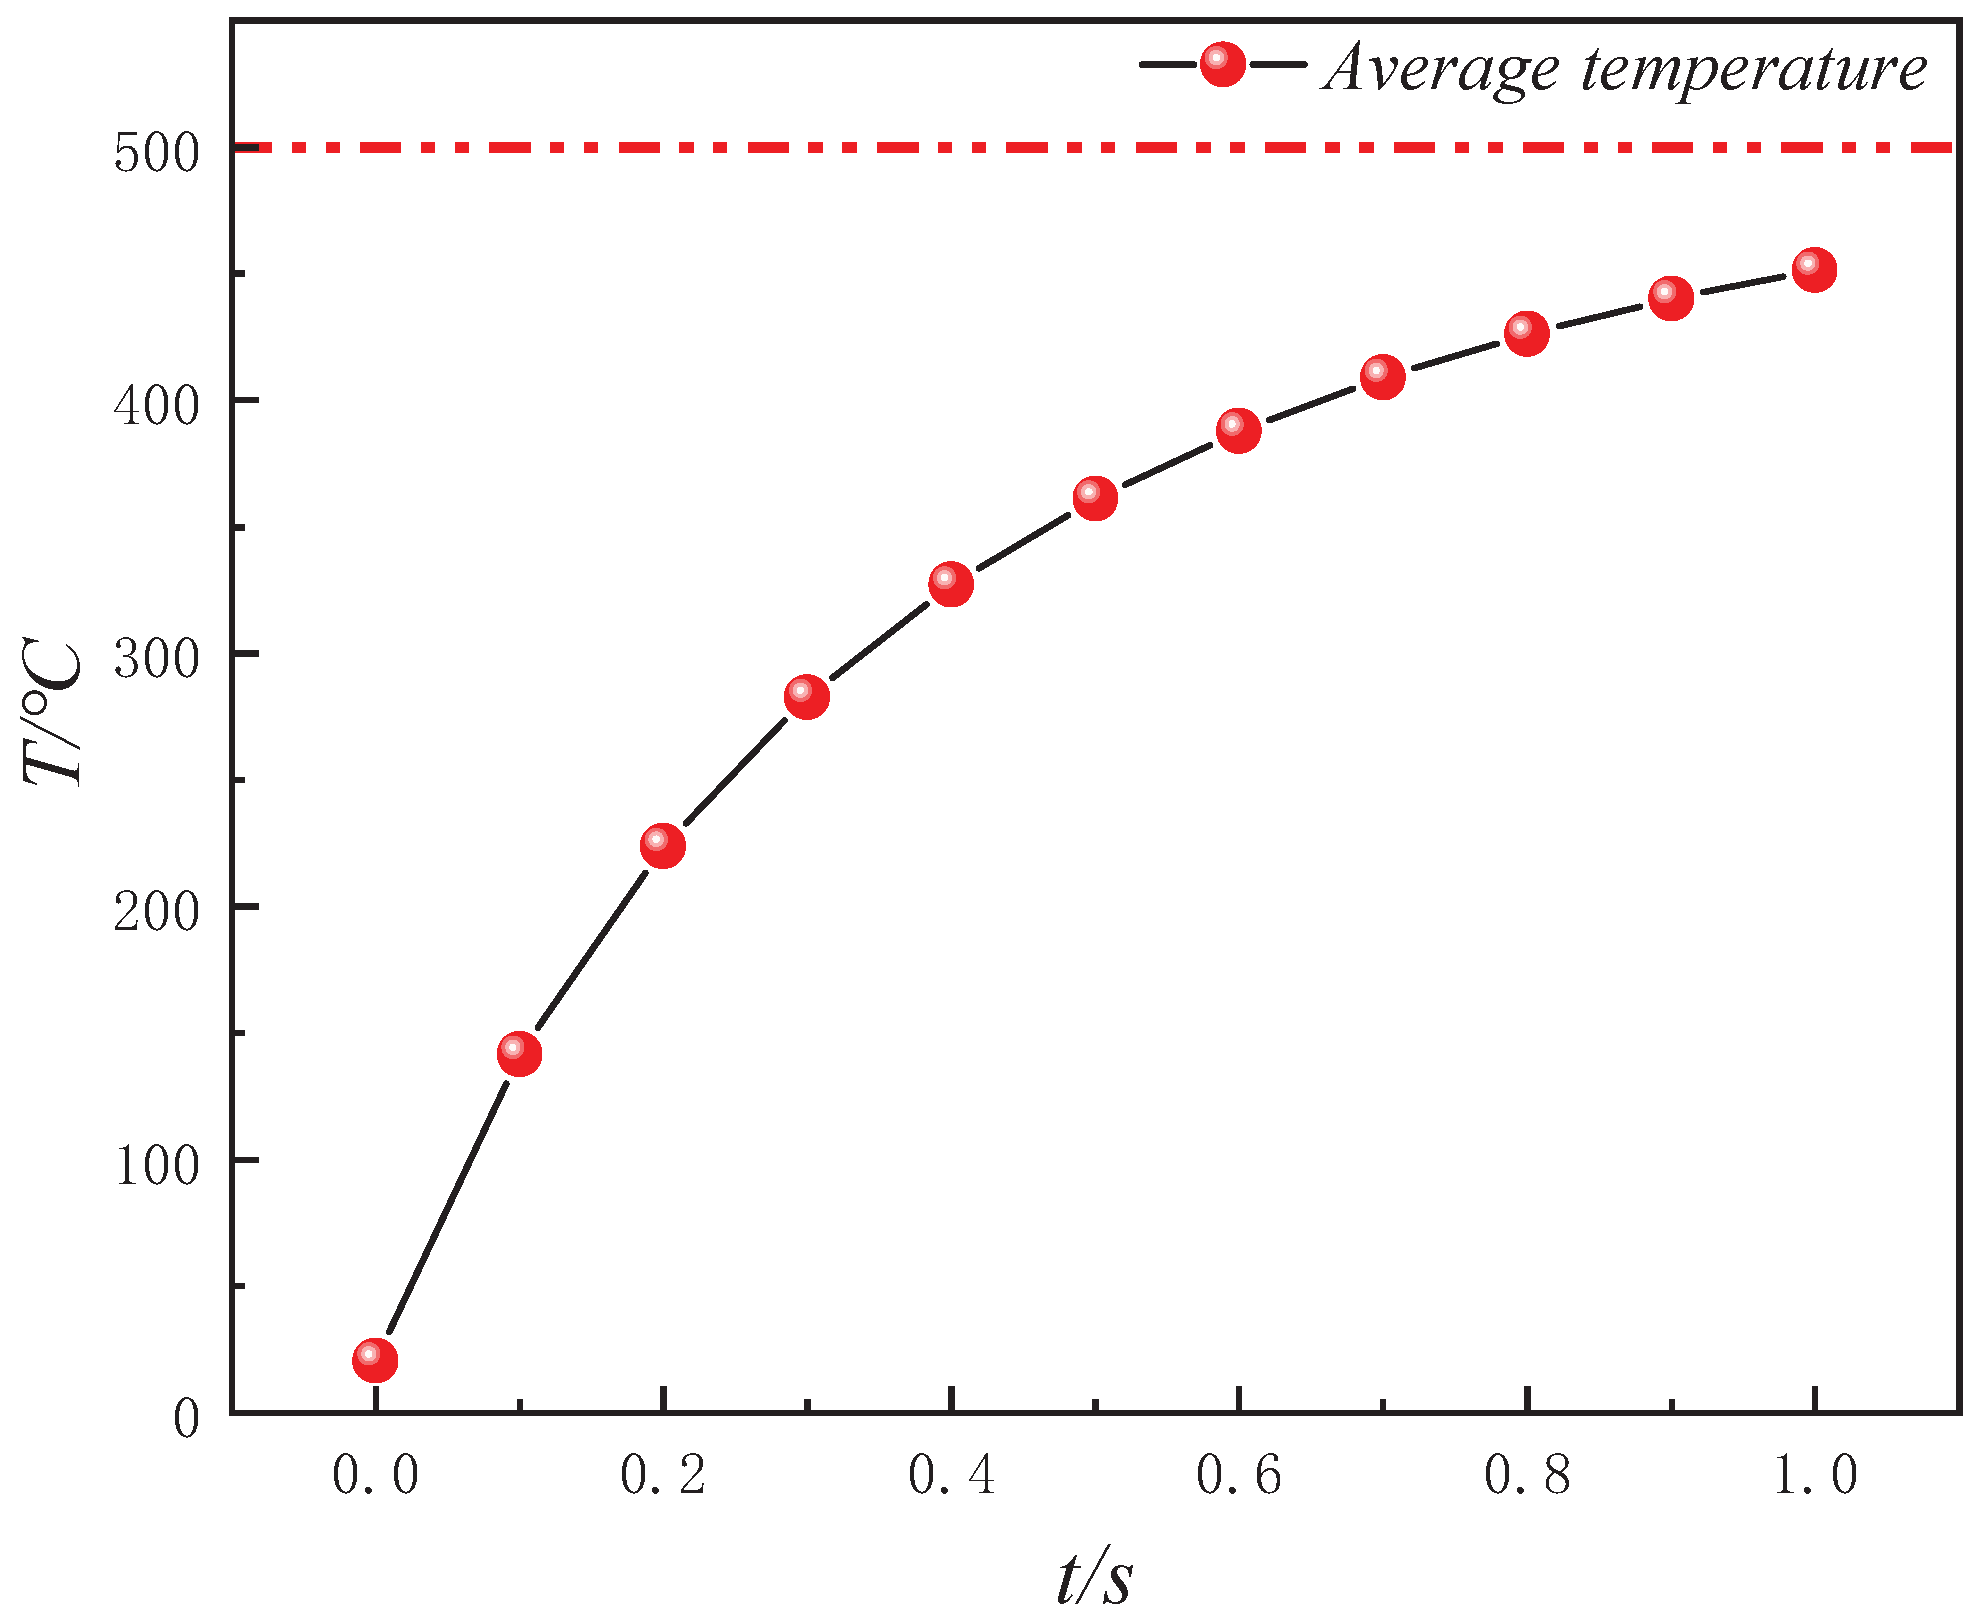
  • During conductive heating with electrical methods, heat transfer primarily occurs inward along the normal direction of the heat source surface. The rate of temperature increase is greater in cross-sections closer to the heat source surface. Within 1 s, the temperature increase at 100 μm (near the heat source surface) is 2.27 times greater than that at 500 μm (the cross-section farthest from the heat source surface).
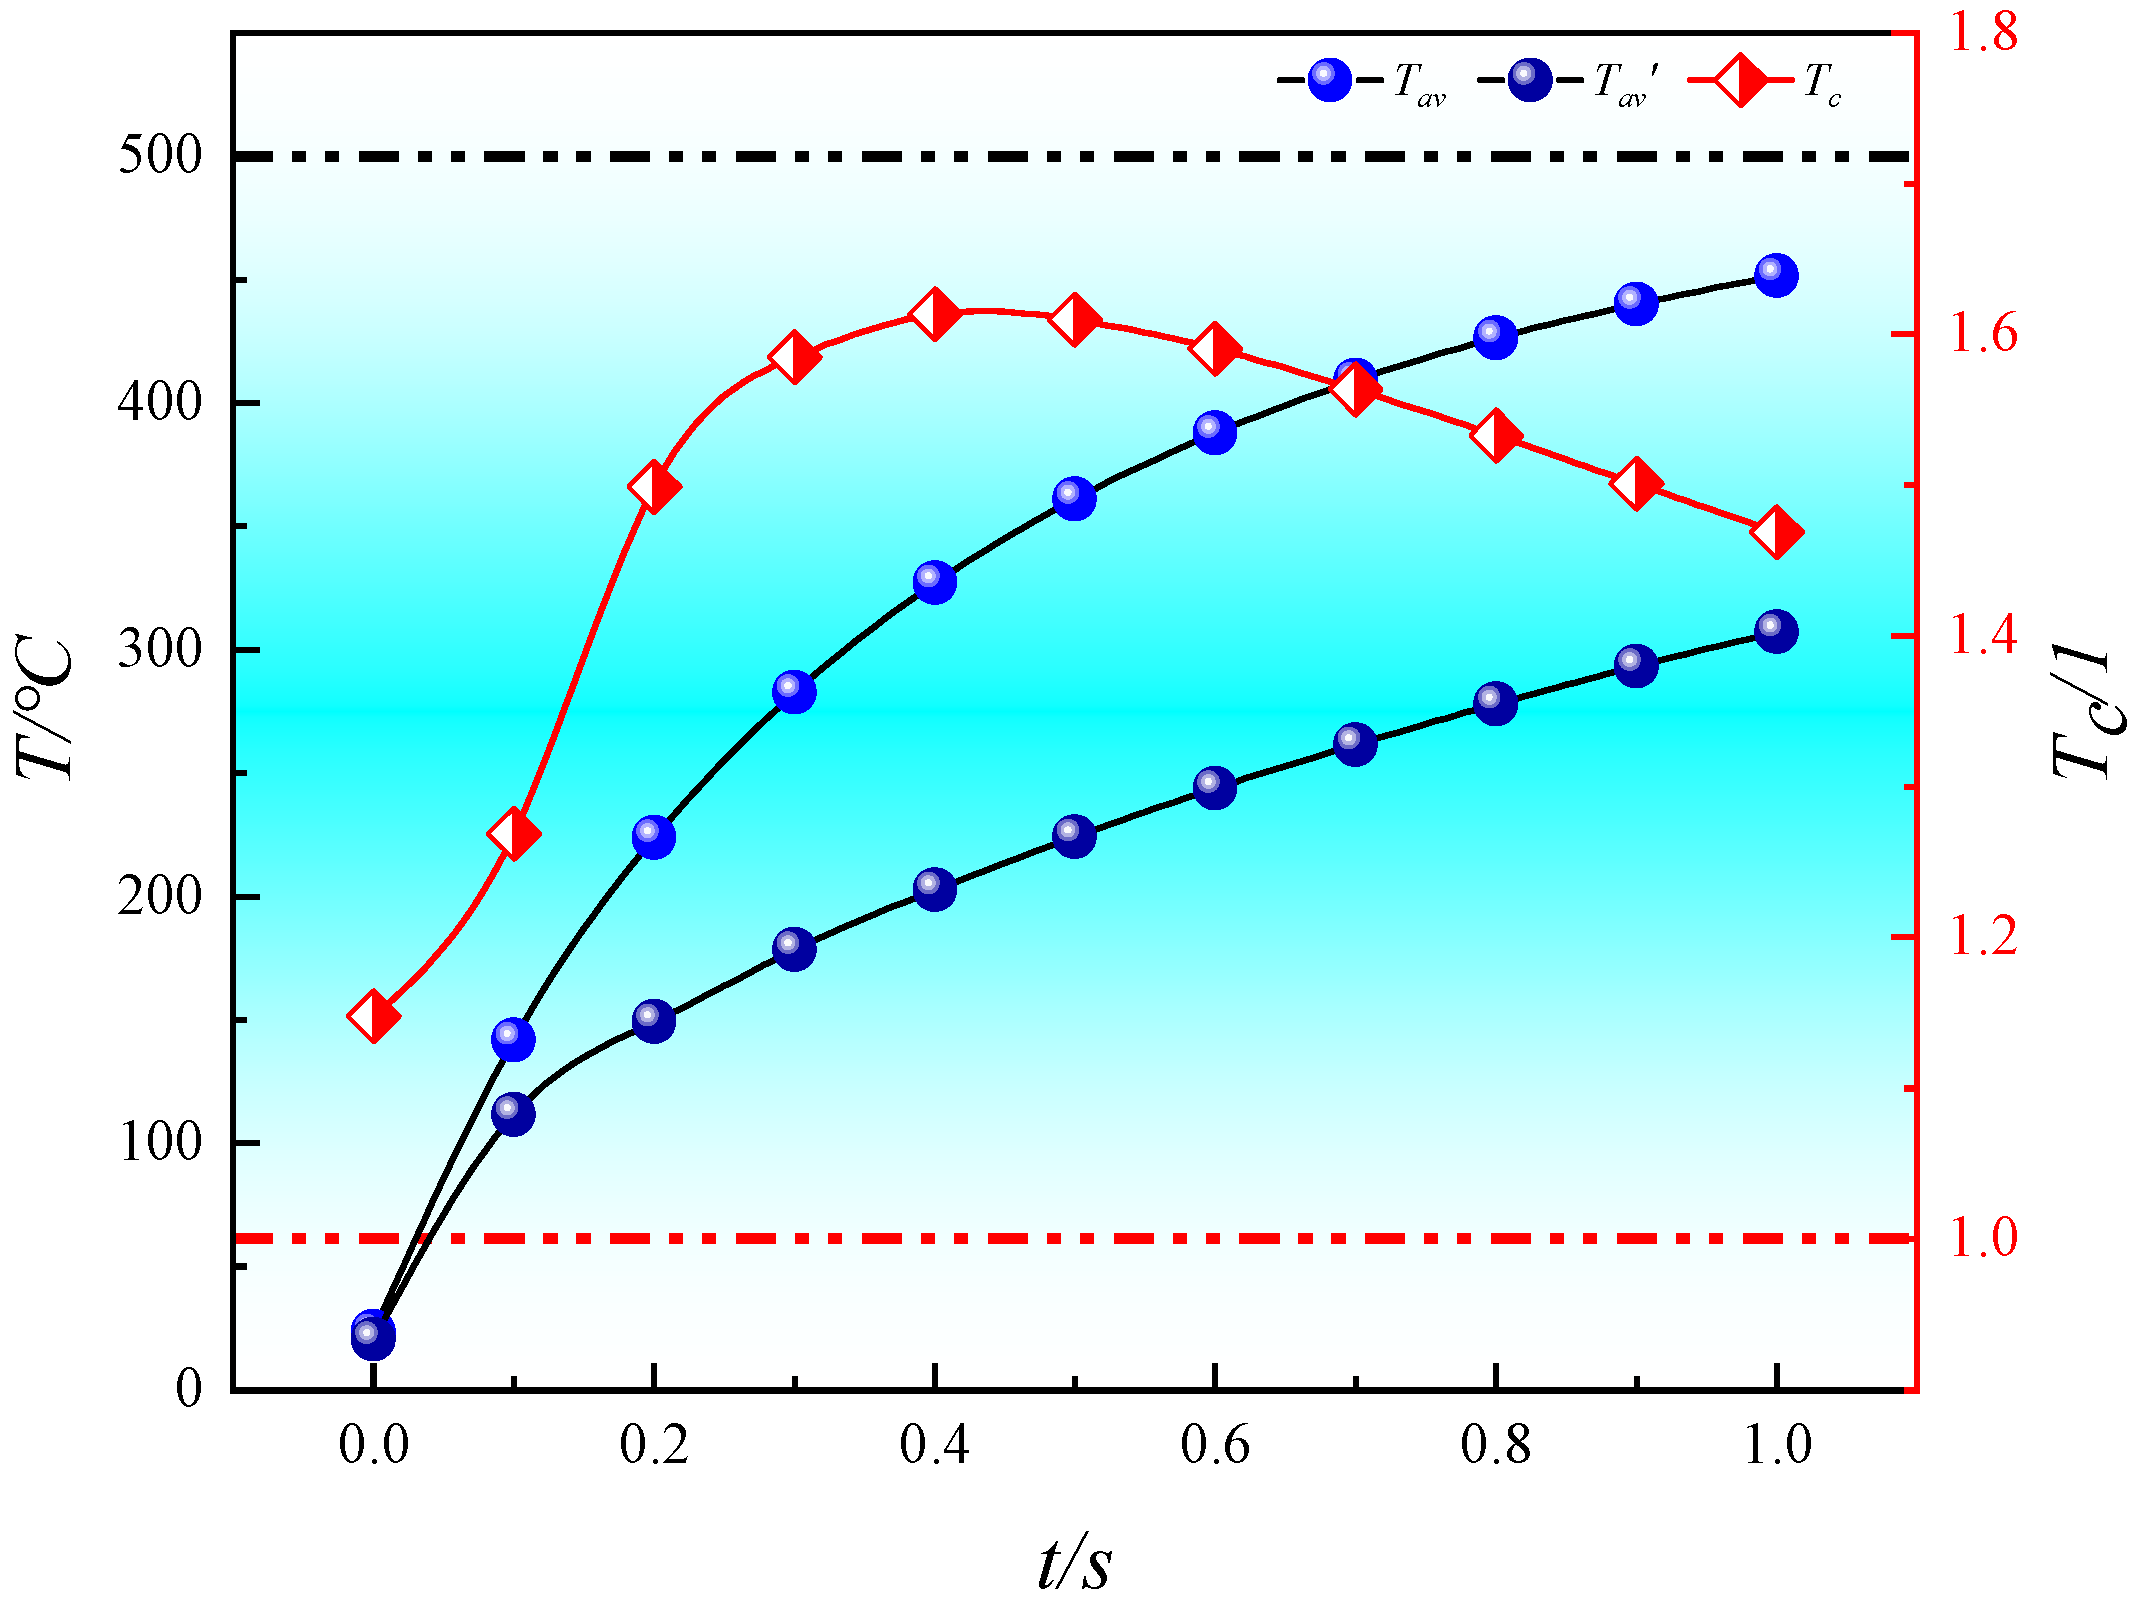
  • The heat transfer efficiency of convective heating with high-temperature steam is consistently higher than that of conductive heating with electrical methods. At every moment during in situ pyrolysis with high-temperature steam, the Tav is higher than that at the corresponding moment during in situ pyrolysis with conductive heating using electrical methods (Tav′). Additionally, Tc, which represents the ratio of the average temperatures between the two methods, initially increases and then decreases as pyrolysis progresses, but Tc remains greater than 1 throughout. At 0.4 s, Tc reaches its peak value of 1.61331.
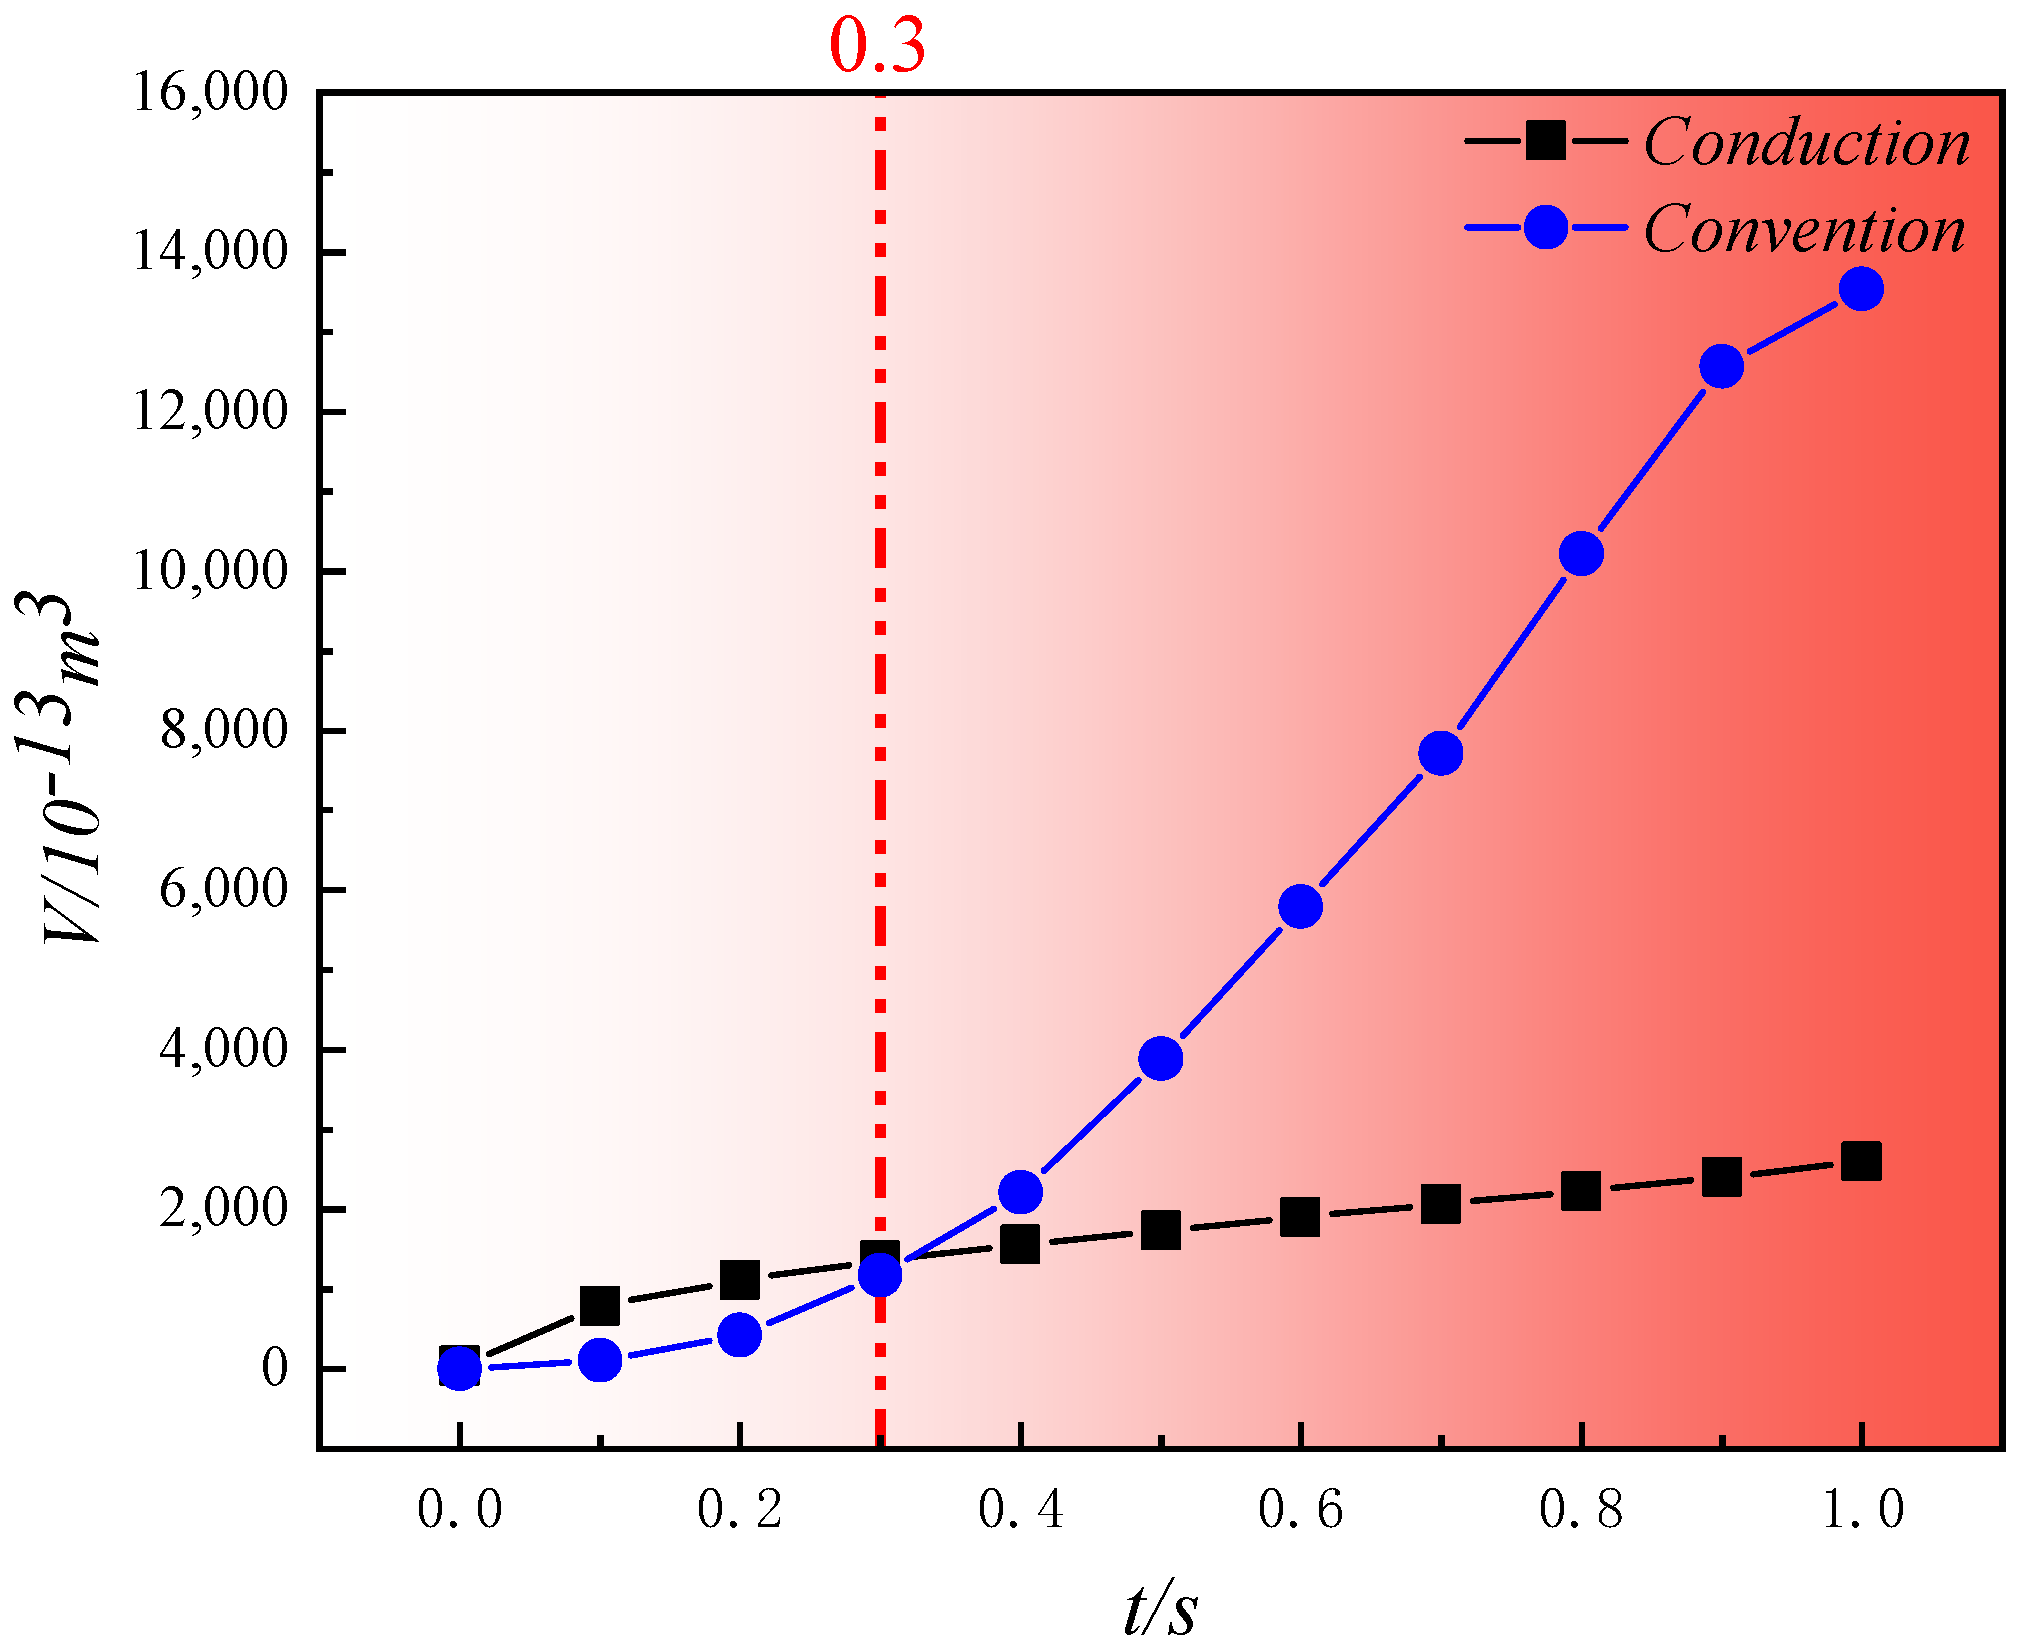
  • In the initial stages of pyrolysis, the high-temperature regions formed by conductive heating outperform those formed by convective heating. However, as the heat-carrying fluid stabilizes, the volume of high-temperature regions generated by convective heating increases rapidly compared to those generated by conductive heating. During the initial phase of pyrolysis (0 s~0.3 s), convective heating initially lags behind conductive heating in terms of the growth of high-temperature regions, because high-temperature steam first needs to permeate and then conduct heat towards the solid matrix through the pore structure. In contrast, conductive heating directly transfers heat through the solid matrix. After 0.3 s, the volume of the high-temperature regions rapidly increases with convective heating, while with conductive heating, it continues to grow at a slower pace. By 1 s, the volume of the high-temperature regions formed by convective heating is 5.22 times that of those formed by conductive heating.
Overall, the efficiency of the in situ pyrolysis of oil shale using convective heating is significantly higher than that of conductive heating. During convective heating, the temperature field is uniform and orderly, whereas in conductive heating, the temperature field is prone to localized high temperatures due to the solid matrix as the heat transfer medium, which can adversely affect heating efficiency. However, the study also shows that the high-temperature zone formed in the early stages of pyrolysis by conductive heating is more favorable than that of convective heating, indicating that conductive heating does have certain advantages compared to convective heating. Therefore, based on the principles of scientific and efficient extraction, industrial in situ recovery of oil shale should not be limited to a single heating method. A combination of various heating techniques might yield better extraction results. For example, utilizing conductive heating to preheat the reservoir during the initial stages of pyrolysis, followed by convective heating for efficient thermal recovery, could enhance overall extraction efficiency.

Author Contributions

Conceptualization, Y.Z. and D.Y.; methodology, Y.Z.; software, Y.Z.; validation, Y.Z. and D.Y.; formal analysis, Y.Z.; investigation, D.Y. and Y.Z.; data curation, Y.Z.; writing—original draft preparation, Y.Z.; writing—review and editing, D.Y.; visualization, Y.Z. and D.Y.; supervision, D.Y. All authors have read and agreed to the published version of the manuscript.

Funding

This research was funded by the National Key R&D Program of China (2019YFA0705501), the National Natural Science Foundation of China (U23B2088).

Data Availability Statement

Data are contained within the article.

Conflicts of Interest

The authors declare no conflicts of interest.

References

  1. Wang, L.; Yang, D.; Zhang, Y.; Li, W.; Kang, Z.; Zhao, Y. Research on the reaction mechanism and modification distance of oil shale during high-temperature water vapor pyrolysis. Energy 2022, 261, 125213. [Google Scholar] [CrossRef]
  2. Guo, W.; Deng, S.; Sun, Y. Recent advances on shale oil and gas exploration and development technologies. Adv. Geo-Energy Res. 2024, 11, 81–87. [Google Scholar] [CrossRef]
  3. Zhang, X.; Guo, W.; Pan, J.; Zhu, C.; Deng, S. In-situ pyrolysis of oil shale in pressured semi-closed system: Insights into products characteristics and pyrolysis mechanism. Energy 2024, 286, 129608. [Google Scholar] [CrossRef]
  4. Kang, Z.; Zhao, Y.; Yang, D. Review of oil shale in-situ conversion technology. Appl. Energy 2020, 269, 115121. [Google Scholar] [CrossRef]
  5. Guo, W.; Zhang, X.; Deng, S.; Sun, Y.; Han, J.; Bai, F.; Kang, S.; He, W. Enhanced pyrolysis of Huadian oil shale at high temperature in the presence of water and air atmosphere. J. Pet. Sci. Eng. 2022, 215, 110623. [Google Scholar] [CrossRef]
  6. Yang, D.; Wang, L.; Zhao, Y.; Kang, Z. Investigating pilot test of oil shale pyrolysis and oil and gas upgrading by water vapor injection. J. Pet. Sci. Eng. 2021, 196, 108101. [Google Scholar] [CrossRef]
  7. Xu, S.; Sun, Y.; Guo, W.; Yang, Q.; Li, Q.; Guo, M.; Bai, F.; Zhu, C.; Deng, S. Regulating the oxidative assisted pyrolysis of Huadian oil shale by preheating temperature and oxygen flow rate. Energy 2023, 262, 125602. [Google Scholar] [CrossRef]
  8. Wang, L.; Yang, D.; Kang, Z.; Zhao, J.; Meng, Q. Experimental study on the effects of steam temperature on the pore-fracture evolution of oil shale exposed to the convection heating. J. Anal. Appl. Pyrolysis 2022, 164, 105533. [Google Scholar] [CrossRef]
  9. Wang, G.; Yang, D.; Zhao, Y.; Kang, Z.; Zhao, J.; Huang, X. Experimental investigation on anisotropic permeability and its relationship with anisotropic thermal cracking of oil shale under high temperature and triaxial stress. Appl. Therm. Eng. 2019, 146, 718–725. [Google Scholar] [CrossRef]
  10. Wang, Z.; Deng, S.; Gu, Q.; Zhang, Y.; Cui, X.; Wang, H. Pyrolysis kinetic study of Huadian oil shale, spent oil shale and their mixtures by thermogravimetric analysis. Fuel Process. Technol. 2013, 110, 103–108. [Google Scholar] [CrossRef]
  11. Burger, J.W.; Crawford, P.M.; Johnson, H.R. Is oil shale America answer to peak-oil challenge. Oil Gas J. 2004, 102, 16. [Google Scholar]
  12. Tanaka, P.L.; Yeakel, J.D.; Symington, W.A.; Spiecker, P.M.; Del Pico, M.; Thomas, M.M.; Sullivan, K.B.; Stone, M.T. Plan to test ExxonMobil’s in situ oil shale technology on a proposed RD&D lease. In Proceedings of the 31st Oil Shale Symposium, Golden, CO, USA, 17–21 October 2011. [Google Scholar]
  13. Jaber, J.O.; Probert, S.D. Non-isothermal thermogravimetry and decomposition kinetics of two Jordanian oil shales under different processing conditions. Fuel Process. Technol. 2000, 63, 57–70. [Google Scholar] [CrossRef]
  14. Deng, S.; Wang, Z.; Gu, Q.; Meng, F.; Li, J.; Wang, H. Extracting hydrocarbons from Huadian oil shale by sub-critical water. Fuel Process. Technol. 2011, 92, 1062–1067. [Google Scholar] [CrossRef]
  15. Teixeira, M.G.; Donzé, F.; Renard, F.; Panahi, H.; Papachristos, E.; Scholtès, L. Microfracturing during primary migration in shales. Tectonophysics 2017, 694, 268–279. [Google Scholar] [CrossRef]
  16. Geng, Y.; Liang, W.; Liu, J.; Cao, M.; Kang, Z. Evolution of pore and fracture structure of oil shale under high temperature and high pressure. Energy Fuels 2017, 31, 10404–10413. [Google Scholar] [CrossRef]
  17. Rabbani, A.; Baychev, T.G.; Ayatollahi, S.; Jivkov, A.P. Evolution of pore-scale morphology of oil shale during pyrolysis: A quantitative analysis. Transp. Porous Media 2017, 119, 143–162. [Google Scholar] [CrossRef]
  18. Huang, X.; Kang, Z.; Zhao, J.; Wang, G.; Zhang, H.; Yang, D. Experimental investigation on micro-fracture evolution and fracture permeability of oil shale heated by water vapor. Energy 2023, 277, 127677. [Google Scholar] [CrossRef]
  19. Yang, D.; Zhao, Y.; Kang, Z. Numerical simulation of in situ exploitation of oil shale by injecting high-temperature steam. Oil Shale 2019, 36, 483–500. [Google Scholar] [CrossRef]
  20. Wang, L.; Yang, D.; Kang, Z. Evolution of permeability and mesostructure of oil shale exposed to high-temperature water vapor. Fuel 2021, 290, 119786. [Google Scholar] [CrossRef]
  21. Hu, X.; Lu, Y.; Li, W.; Huang, X.; Zhang, Y.; Yang, D. Study on the pyrolysis behavior and product characteristics of Balikun oil shale with different water pressures in sub-and supercritical states. Fuel 2024, 369, 131701. [Google Scholar] [CrossRef]
  22. Kang, Z.; Jiang, X.; Wang, L.; Yang, D.; Ma, Y.; Zhao, Y. Comparative investigation of in situ hydraulic fracturing and high-temperature steam fracturing tests for meter-scale oil shale. Energy 2023, 281, 128343. [Google Scholar] [CrossRef]
  23. Saif, T.; Lin, Q.; Gao, Y.; Al-Khulaifi, Y.; Marone, F.; Hollis, D.; Blunt, M.J.; Bijeljic, B. 4D in situ synchrotron X-ray tomographic microscopy and laser-based heating study of oil shale pyrolysis. Appl. Energy 2019, 235, 1468–1475. [Google Scholar] [CrossRef]
  24. Zhao, J.; Yang, D.; Kang, Z.; Feng, Z. A micro-CT study of changes in the internal structure of Daqing and Yan’an oil shales at high temperatures. Oil Shale 2012, 29, 357. [Google Scholar] [CrossRef]
  25. Cai, F.; Xue, S.; Zhang, M.; Zhang, J.; Chen, X.; Bao, Y.; Li, Y. Assessing reliability and validity of the Chinese version of Crown–Crisp experience index and its application in coal miners. Int. J. Coal Sci. Technol. 2023, 10, 90. [Google Scholar] [CrossRef]
  26. Yang, S.; Yang, D.; Kang, Z. Experimental investigation of the anisotropic evolution of tensile strength of oil shale under real-time high-temperature conditions. Nat. Resour. Res. 2021, 30, 2513–2528. [Google Scholar] [CrossRef]
  27. Lu, S.; Zhao, J.; Song, J.; Chang, J.; Shu, C.-M. Apparent activation energy of mineral in open pit mine based upon the evolution of active functional groups. Int. J. Coal Sci. Technol. 2023, 10, 75. [Google Scholar] [CrossRef]
  28. Wang, C.; Shi, X.; Zhang, W.; Elsworth, D.; Cui, G.; Liu, S.; Wang, H.; Song, W.; Hu, S.; Zheng, P. Dynamic analysis of heat extraction rate by supercritical carbon dioxide in fractured rock mass based on a thermal-hydraulic-mechanics coupled model. Int. J. Min. Sci. Technol. 2022, 32, 225–236. [Google Scholar] [CrossRef]
  29. Qin, S.; Lin, H.; Yang, S.; Wei, Z. A mathematical model for parameter setting in discrete element numerical simulation. Int. J. Coal Sci. Technol. 2023, 10, 87. [Google Scholar] [CrossRef]
  30. Yang, S. Study on Microstructure Evolution and Mechanical Response of Oil Shale under Real Time High Temperature. Ph.D. Thesis, Taiyuan University of Technology, Taiyuan, China. (In Chinese). [CrossRef]
  31. Liu, F.; Lin, P.; Xu, Z.; Shao, R.; Han, T. Extraction and imaging of indicator elements for non-destructive, in-situ, fast identification of adverse geology in tunnels. Int. J. Min. Sci. Technol. 2023, 33, 1437–1449. [Google Scholar] [CrossRef]
  32. Zhu, D.; Yu, B.; Wang, D.; Zhang, Y. Fusion of finite element and machine learning methods to predict rock shear strength parameters. J. Geophys. Eng. 2024, 21, gxae064. [Google Scholar] [CrossRef]
  33. Guo, Y.; Pan, B.; Zhang, L.; Lei, J.; Fan, Y.; Ruhan, A.; Yan, D.; Zhao, Y. A study on water saturation predictions in igneous reservoirs based on the relationship between the transverse relaxation time and the resistivity index. J. Pet. Sci. Eng. 2022, 208, 109519. [Google Scholar] [CrossRef]
  34. Chen, J.-H.; Althaus, S.M.; Liu, H.-H.; Zhang, J.; Eppler, G.; Duncan, J.C.; Sun, Q. Electromagnetic-heating enhancement of source rock permeability for high recovery. Fuel 2020, 283, 118976. [Google Scholar] [CrossRef]
  35. Gu, J.; Deng, S.; Sun, Y.; Guo, W.; Chen, H.; Shi, B. Pyrolysis behavior and pyrolysate characteristics of Huadian oil shale kerogen catalyzed by nickel-modified montmorillonite. Adv. Geo-Energy Res. 2024, 11, 168–180. [Google Scholar] [CrossRef]
  36. Wang, G.; Liu, S.; Yang, D.; Fu, M. Numerical study on the in-situ pyrolysis process of steeply dipping oil shale deposits by injecting superheated water steam: A case study on Jimsar oil shale in Xinjiang, China. Energy 2022, 239, 718–725. [Google Scholar] [CrossRef]
  37. Wang, G.; Yang, D.; Kang, Z.; Zhao, J.; Lv, Y. Numerical investigation of the in situ oil shale pyrolysis process by superheated steam considering the anisotropy of the thermal, hydraulic, and mechanical characteristics of oil shale. Energy Fuels 2019, 33, 12236–12250. [Google Scholar] [CrossRef]
  38. Sun, T.; Liu, H.; Zhang, Y.; Li, Y. Numerical simulation and optimization study of In-Situ Heating for three-dimensional oil shale exploitation with different well patterns. Case Stud. Therm. Eng. 2024, 55, 104089. [Google Scholar] [CrossRef]
  39. Zhu, J.; Li, F.; Wang, H.; Yang, Z.; Chen, H.; Zhu, H. Numerical analysis of microwave-enhanced oil shale pyrolysis by rotation turntable based on the Arbitrary Lagrangian-Eulerian method. Fuel 2024, 371, 131925. [Google Scholar] [CrossRef]
  40. Zhao, S.; Xu, C.-Y.; Pu, W.-F.; Chen, Q.-Y.; Yuan, C.-D.; Varfolomeev, M.A.; Sudakov, V. Heat front propagation in shale oil reservoirs during air injection: Experimental and numerical studies. Pet. Sci. 2024. [Google Scholar] [CrossRef]
  41. Zhang, Y.; Wang, L.; Yang, D.; Kang, Z.; Zhao, J.; Zhao, Y. Study on the permeability and meso-structure evolution of organic-rich shale with single fracture during in-situ pyrolysis by high-temperature water vapor injection. J. China Coal Soc. 2024, 1–15. (In Chinese) [Google Scholar] [CrossRef]
Figure 1. Schematic diagram of sample preparation.
Energies 17 04169 g001
Figure 2. High-temperature in situ pyrolysis system. (1—High-temperature steam generator; 2—Electric heating mantle; 3—Servo hydraulic press; 4—High-temperature in situ pyrolysis reaction vessel; 5—Condensation system).
Energies 17 04169 g002
Figure 3. Comparison of simulated permeability results with experimental permeability results.
Energies 17 04169 g003
Figure 4. The segmented CT digital core of oil shale after convective heating.
Energies 17 04169 g004
Figure 5. Evolution of temperature field during in situ pyrolysis of oil shale with high-temperature water vapor.
Energies 17 04169 g005aEnergies 17 04169 g005b
Figure 6. Variation in average temperature (Tav) of oil shale during in situ convective heating with high-temperature water vapor.
Energies 17 04169 g006
Figure 7. Evolution of temperature distribution during the pyrolysis process at different cross-sections.
Energies 17 04169 g007aEnergies 17 04169 g007b
Figure 8. Variation in Average Temperature (Tas) at different cross-sections with pyrolysis time.
Energies 17 04169 g008
Figure 9. The segmented CT digital core of oil shale after conductive heating.
Energies 17 04169 g009
Figure 10. Evolution of temperature field during in situ pyrolysis of oil shale by electrical heating.
Energies 17 04169 g010
Figure 11. Variation in average temperature (Tav′) of oil shale during in situ conductive heating by electrical method.
Energies 17 04169 g011
Figure 12. Evolution of temperature distribution during the pyrolysis process at different cross-sections.
Energies 17 04169 g012aEnergies 17 04169 g012b
Figure 13. Variation of average temperature (Tas′) at different cross-sections with different pyrolysis times.
Energies 17 04169 g013
Figure 14. Variation of Tav, Tav′, and Tc with pyrolysis time.
Energies 17 04169 g014
Figure 15. Variation in volume of the high-temperature zone (400 °C~500 °C) with pyrolysis time under different pyrolysis methods.
Energies 17 04169 g015
Table 1. The total organic carbon and pyrolysis hydrocarbon generation potential of Jimsar oil shale.
TOC
(%)
Rock Pyrolysis Parameters
Tmax
(°C)
S1
(mg/g)
S2
(mg/g)
S3
(mg/g)
HI
(mg/g TOC)
20.554510.36118.210.01575.12
Table 2. Compilation of solid matrix parameter expressions.
Solid Matrix ParametersMathematical Expression
ρs 8.0 × 10 9 T 3 9.0 × 10 6 T 2 + 0.0018 T + 2.0919
λper 1.176 × 10 6 T 2 0.00285 T + 1.9381
λpar 4.563 × 10 6 T 2 0.00119 T + 0.7581
βper 1.01 × 10 5 5.885 × 10 3 ( 106.603 4 ( T 618.202 ) 2 + 11,364.2 )
βpar 1.01 × 10 5 5.657 × 10 3 ( 106.603 4 ( T 603.72 ) 2 + 7880.64 )
Eper { 7.12 × 10 6 T 2 1.08 × 10 4 T + 2.39     ( 20   ° C < T 300   ° C ) 1.84 × 10 7 T 3 + 2.76 × 10 4 T 2 1.33 × 10 1 T + 2.18   ( 300   ° C < T 600   ° C )
Epar { 5.02 × 10 7 T 3 + 3.06 × 10 4 T 2 5.75 × 10 2 T + 5.34 ( 20   ° C < T 300   ° C ) 1.73 × 10 7 T 3 + 2.25 × 10 4 T 2 9.15 × 10 1 T + 1.39   ( 300   ° C < T 600   ° C )
vs 0.00005 T + 0.4653
Disclaimer/Publisher’s Note: The statements, opinions and data contained in all publications are solely those of the individual author(s) and contributor(s) and not of MDPI and/or the editor(s). MDPI and/or the editor(s) disclaim responsibility for any injury to people or property resulting from any ideas, methods, instructions or products referred to in the content.

