Article

Load Prediction of Regional Heat Exchange Station Based on Fuzzy Clustering Based on Fourier Distance and Convolutional Neural Network–Bidirectional Long Short-Term Memory Network

School of Energy and Safety Engineering, Tianjin Chengjian University, Tianjin 300384, China
*
Author to whom correspondence should be addressed.
Energies 2024, 17(16), 4190; https://doi.org/10.3390/en17164190
Submission received: 8 July 2024 / Revised: 29 July 2024 / Accepted: 3 August 2024 / Published: 22 August 2024

Abstract

:
Cogeneration is an important means for heat supply enterprises to obtain heat, and accurate load prediction is particularly crucial. The heat load of a centralized heat supply system is influenced by various factors such as outdoor meteorological parameters, the building envelope structure, and regulation control, which exhibit a strong coupling and nonlinearity. It is essential to identify the key variables affecting the heat load at different heating stages through data mining techniques and to use deep learning algorithms to precisely regulate the heating system based on load predictions. In this study, a heat station in a northern Chinese city is taken as the subject of research. We apply the Fuzzy Clustering based on Fourier distance (FCBD-FCM) algorithm to transform the factors influencing the long and short-term load prediction of heat supply from the time domain to the frequency domain. This transformation is used to analyze the degree of their impact on load changes and to extract factors with significant influence as the multifeatured input variables for the prediction model. Five neural network models for load prediction are established, namely, Backpropagation (BP), convolutional neural network (CNN), Long Short-Term Memory (LSTM), CNN-LSTM, and CNN-BiLSTM. These models are compared and analyzed for their performance in long-term, short-term, and ultrashort-term heating load prediction. The findings indicate that the load prediction accuracy is high when multifeatured input variables are based on fuzzy clustering. Furthermore, the CNN-BiLSTM model notably enhances the prediction accuracy and generalization ability compared to other models, with the Mean Absolute Percentage Error (MAPE) averaging within 3%.

1. Introduction

With the rapid advancement of urbanization and industrialization, China has emerged as one of the largest district heating markets globally. High urban heating energy consumption in northern China accounts for 22% of the total building energy consumption. Due to the accelerated pace of urbanization, the heating area in northern cities and towns has seen a significant increase, from 5 billion square meters in 2001 to 14.7 billion square meters in 2018 [1]. This represents a substantial potential for energy conservation and reduction in carbon emissions. Furthermore, the knowledge derived from data, facilitated by artificial intelligence and IoT technology, enables the realization of on-demand heating. This advancement is aiding in the development of green and energy-saving heating solutions, which is considered the current trend in the industry.
The application and development of intelligent heating monitoring systems have resulted in the accumulation of vast quantities of data. Mining the heating characteristics from these data to realize on-demand heating is of great importance. By extracting knowledge from the data, energy efficiency can be improved, and energy saving and emission reduction can be achieved. The fourth generation of centralized heat supply has introduced the concept of smart heat networks, emphasizing the significance of heat load prediction technology [2,3]. The objective of heat load forecasting is to accurately predict the future energy demands of heat users, thereby enabling the heat supply system to provide and dispatch heat rationally. Through precise load forecasting, it is possible to reduce energy consumption, enhance the performance of the heat supply system, and deliver higher service quality. Consequently, there is an urgent necessity to analyze historical operation data by applying advanced techniques judiciously, in order to enhance the accuracy of load forecasting and ultimately achieve demand-based heat supply. This research can provide guidance for the regulation of centralized heat supply, leading to a reduction in energy waste and savings in heat supply costs.
Data mining techniques have been extensively utilized in the operation of building energy systems to enhance energy efficiency [4,5,6]. The forecasting of building energy system loads is predominantly associated with data mining techniques, which typically encompass four stages: data standardization, feature selection, model parameter optimization, and model construction and training. Feature selection is conducted through data mining to isolate the variables that significantly impact the load, and model training is executed using these extracted features. Zhao and Magoulès et al. [7] examined seven building load forecasting methods employing supervised data mining-based techniques. Ahmad et al. [8] and Chalal et al. [9] reviewed two prevalent supervised artificial neural networks (ANN) and support vector machine (SVM) algorithms for building load forecasting. Amasyail et al. [10] outlined fourteen supervised data mining algorithms. The most commonly utilized unsupervised data mining methods for recognizing building operation patterns include the Association Rule Mining (ARM) method, clustering methods, and motif detection methods. Carmo et al. [11] identified two distinct types of heat load patterns using the K-means clustering method, and based on pattern clustering, analyzed the effects of factors such as building area, building age, and heating form on different load patterns. P. Gianniou et al. [12] applied the K-means method to cluster the daily heat load profiles of 8293 households in Aarhus, Denmark, categorizing the end users of the heating system into five classes based on daily consumption. Tureczek et al. [13] concluded that the K-means method was incapable of addressing the autocorrelation of heating system operation data. Thus, they proposed a data transformation method that combined a wavelet transform and autocorrelation, resulting in improved clustering outcomes. J. Yang et al. [14] introduced a novel K-means clustering algorithm to identify various patterns of building thermal energy consumption over time, suggesting that prediction accuracy could be enhanced through clustering. Chicco et al. [15] conducted a comprehensive comparison of several typical clustering algorithms for identifying typical electrical load patterns and determined that K-means clustering outperformed other algorithms in pattern recognition. Nikolaou et al. [16] found that K-means clustering was more effective and suitable for building thermal load classification when five clustering methods were employed to ascertain the energy and thermal comfort classes of public buildings. Lu et al. [6], aiming to efficiently diagnose and optimize the operation of a district heating station, utilized historical heating operation data. They quantitatively identified and assessed the existing regulation strategies of the district heating station using a Gaussian Mixture Model (GMM)-based unsupervised data mining method for the backward identification of existing operation strategies.
Data mining is utilized to analyze and process vast quantities of historical data. It serves to reduce the dimensionality of input parameters and eliminate interfering variables, thereby preparing for subsequent heat load prediction. This process can enhance the accuracy of heat load forecasting and expedite the calculation speed.
Currently, there are two prevalent methods employed for building heat load prediction: white-box models, which are physical models grounded in physical information like building details and weather conditions, and black-box data-driven models, which are models that leverage machine learning and deep learning and are founded on data information.
For the physics-based model, the initial task is to construct a detailed physical model of the building. This model should encompass information such as the building’s geometry, thermal performance, and internal activities. Subsequently, the model must be validated using pertinent weather data, internal activity data, and heat load data to ensure its precision. Zhao et al. [7] employed a thermophysical model to forecast the energy demand of a building under fluctuating outdoor meteorological conditions. This was achieved by conducting multi-parameter simulations of the actual building-specific parameters, including the building’s structural form, envelope, internal equipment, the number of occupants, and heating facilities.
The U.S. Building Industry Council has developed Energy10 software, while Canada has produced software like FRAME and VISION, which are extensively utilized in simulating the thermal performance of maintenance structures. Energy simulation software developed by Tsinghua University in China, known as Dest, is also widely applied for analyzing building energy consumption. Protić et al. [17] discovered through a case study that predictions of building energy consumption made by artificial neural networks were comparable to those from EnergyPlus software. The findings indicated that despite the EnergyPlus model being constructed with very detailed information about the building, its prediction error was comparable to that of an ANN trained on 17 months of historical data.
Prediction methods based on physical models that simulate the actual energy consumption of a heating system can produce reliable outcomes. However, they necessitate a substantial amount of detailed building information and numerous assumptions to implement heat and mass transfer equations for calculating heat loads. The process from model construction to simulation completion is time-consuming and labor-intensive. Moreover, if there is a discrepancy between the assumed information and the actual thermal mass process, this deviation could result in significant differences in the results [18]. In many instances, acquiring all the necessary information is not feasible. Ultimately, incomplete and inaccurate inputs used in the simulation may lead to substantial discrepancies between the model’s predictions and actual outcomes [19].
To address the limitations inherent in physical models, researchers have turned their focus towards black-box data-driven models. These models are capable of achieving their objectives solely through the analysis of data, facilitated by machine learning or deep learning algorithms. The concept of using linear regression models for the prediction of heat loads in large buildings was initially introduced in 1984 [20]. Since then, a variety of methodologies have been explored by researchers, including the application of support vector machines (SVMs) [21], artificial neural networks (ANNs) [22], Extreme Learning Machines [23], Regression Trees [24], random forests [25], Expert Hierarchical Mixing [26], Multilayer Perceptual Machines (MLPs) [27], Long Short-Term Memory (LSTM) models [28], and XGBoost [29].
A multivariate linear method for predicting heat loads at heat exchange stations was proposed by Idowu et al. [30]. The model was constructed using four key parameters as inputs: outdoor temperature, time series, historical heat load values, and the physical parameters of the heat exchanger station. Wang et al. [29] utilized Long Short-Term Memory networks (LSTM) and Gradient Boosted Decision Tree (XGBoost) algorithms to predict building heat loads. It was found that while LSTM performed well in short-term predictions, its performance in long-term predictions was suboptimal, being significantly influenced by outdoor meteorological parameters. Dalipi et al. [31] employed three load prediction algorithms—Support Vector Regression (SVR), Partial Least Squares (PLS), and random forest (RF)—to forecast heat loads of a heating system, utilizing data from multiple locations. The accuracy of the heat load predictions was assessed using the Mean Absolute Error (MAE), Mean Absolute Percentage Error (MAPE), and the Correlation Coefficient method. The results indicated that SVR exhibited the highest accuracy for heat load prediction in heating systems. Yan et al. [32] introduced Principal Component Analysis (PCA) to enhance the precision of artificial neural networks. It was discovered that building heat loads were predominantly influenced by external environmental parameters. In many cases, the PCA-SVR model was considered the preferred choice for load forecasting. Ahmad et al. [33] presented artificial neural networks and support vector machines, which had distinct advantages in capturing nonlinearities for load forecasting in the built environment. These models were capable of delivering accurate predictions and were well-suited for practical application of the forecasted values.
The accuracy of various algorithms for predicting thermal loads in buildings has been scrutinized by researchers. A comparison was made by Li [34] between support vector machines and artificial neural network models for predicting hourly building cooling loads. The findings indicated that the support vector machine algorithm was more effective in predicting the cooling load. Wang et al. [35] conducted a comparison between seven shallow machine learning, two deep learning, and three heuristic methods. The results demonstrated that the LSTM model was superior for short-term (1 h ahead) building cold load predictions, while the XGBoost model excelled in long-term (24 h or more ahead) building cold load predictions. The comparison revealed that Support Vector Regression (SVR) outperforms the artificial neural network (ANN) in terms of predictive performance. In the realm of machine learning, methods such as combinatorial algorithm prediction [10,36,37,38,39] and ensemble learning [40,41,42,43] have been progressively integrated into the domain of heat load prediction. Hybrid models have notably enhanced short-term load prediction capabilities when compared to single models. Guo et al. [44] developed four hybrid models aimed at improving the accuracy of heating and cooling load predictions. Matthew Motoki et al. [45] employed three algorithms—boosting [46], LightGBM, and Multilayer Perceptron (MLP)—for load forecasting tasks. They then utilized a weighted generalized mean to ensemble the model predictions, which yielded better forecasting accuracy. M. Protić et al. [19] introduced a novel approach based on an SVM and a discrete wavelet transform to devise nine distinct SVM–wavelet forecasting models for loads predicted 1 to 24 h in advance. The SVM–wavelet model predictions were contrasted with Genetic Algorithm (GA) and ANN models. The experimental outcomes suggest that the SVM–wavelet forecasting method offered improved prediction accuracy and generalization compared to GA and ANN models. J. Song et al. [47] proposed an estimation model grounded in the spatiotemporal hybrid convolutional neural network and long short-term memory (CNN-LSTM). This model was designed to accurately predict heat loads, accounting for complex trends, nonlinearities, and significant thermal inertia. The experimental results illustrated that the CNN-LSTM algorithm possessed a distinct advantage in prediction accuracy. The Mean Absolute Percentage Error (MAPE) of the evaluation index for the four heat exchanger stations ranged between 3.1% and 4.1%. The algorithm was adept at accommodating heat load data with varying numerical scales, thereby better fulfilling the demands of practical engineering applications. In contrast to physical models, black-box models necessitate only a sufficient quantity of historical building operation data without extensive building information. This can substantially reduce the time required for inputting the necessary information. Despite the proliferation of load forecasting models, the development of accurate load forecasting models tailored to heating loads of varying durations remains an area for improvement.
This study conducts an analysis of load forecasting and data mining within the context of heating systems. A notable absence in load forecasting is the analysis of factors that influence the load, a deficiency that data mining methodologies are capable of remedying. Data mining techniques are employed to extract valuable insights from the historical operational data of a system. When these data are analyzed in conjunction with specialized knowledge, it can lead to enhancements in the energy efficiency of the system’s operation. Load forecasting leverages collected data and applies machine learning methodologies to uncover patterns in the data’s fluctuations. This process aims to anticipate changes in future periods, thereby informing the operational execution of a project. A research approach that integrates both data mining and load forecasting involves the extraction of data features through various data mining techniques. Subsequently, an appropriate predictive model is applied to refine predictions and augment the model’s accuracy. In the current study, a hybrid research methodology that combines data mining with load forecasting is utilized. Features of the data are extracted using fuzzy clustering based on the Fourier distance, and a predictive model that integrates a convolutional neural network with a bidirectional long and short-term memory neural network is employed for load forecasting. The amalgamation of these two research methodologies, as applied in this study, may offer a viable approach for the investigation of heat supply systems on demand.
Section 2 delineates the research object and examines the diverse array of factors that exert influence on the load. Section 3 elaborates on the research concept and the data mining techniques employed in the study. Section 4 utilizes data mining techniques to extract features from the data, applying specialized knowledge to ascertain the impact of each factor on the heat load. Subsequently, these influencing factors are screened based on the effects they exhibit. In the subsequent phase, load prediction algorithms are deployed to forecast the heat load. A comparative analysis of the performance of several prediction algorithms is conducted to identify a superior model. Section 5, which is the conclusion, encapsulates a summary of all the findings and insights garnered throughout the study.

2. Research Subject

2.1. Heating System

The research subject of this paper was a heat exchange station located in a northern Chinese city, encompassing a heating area of approximately 447,700 square meters. Within this heating station, two gas-fired hot water boilers have been installed. The operation information of these boilers is communicated with the centralized distribution control system (DCS). However, the DCS does not participate in the control of boiler operations. Instead, the secondary heat exchanger station facilitates automatic adjustment control. An intelligent heating management platform was utilized to gather system operation data throughout the entire heating season, which spanned from 15 November to 15 March of the following year. This data collection occurred over approximately 121 days. Temperature sensors, pressure sensors, flow meters, heat meters, and other monitoring devices were employed for this purpose, with a sampling frequency set at once per minute.
The actual operational data from the heat station served as the foundation for employing data mining technology to analyze the underlying characteristics of the system’s operations. Deep learning algorithms were then applied to address the future long-term, short-term, and ultrashort-term energy demands. This approach aimed to enhance the precision of the heating system’s load forecasting, thereby enabling heating enterprises to make informed decisions to optimize energy utilization, minimize energy wastage, and achieve the objectives of energy conservation and carbon reduction. The intelligent heat supply management platform was responsible for the collection of system operation data through the use of monitoring equipment. This paper presents an analysis of the actual operational data from the heating system for a single heating season, spanning from 2021 to 2022.

2.2. Influencing Factors’ Analysis of Heat Load

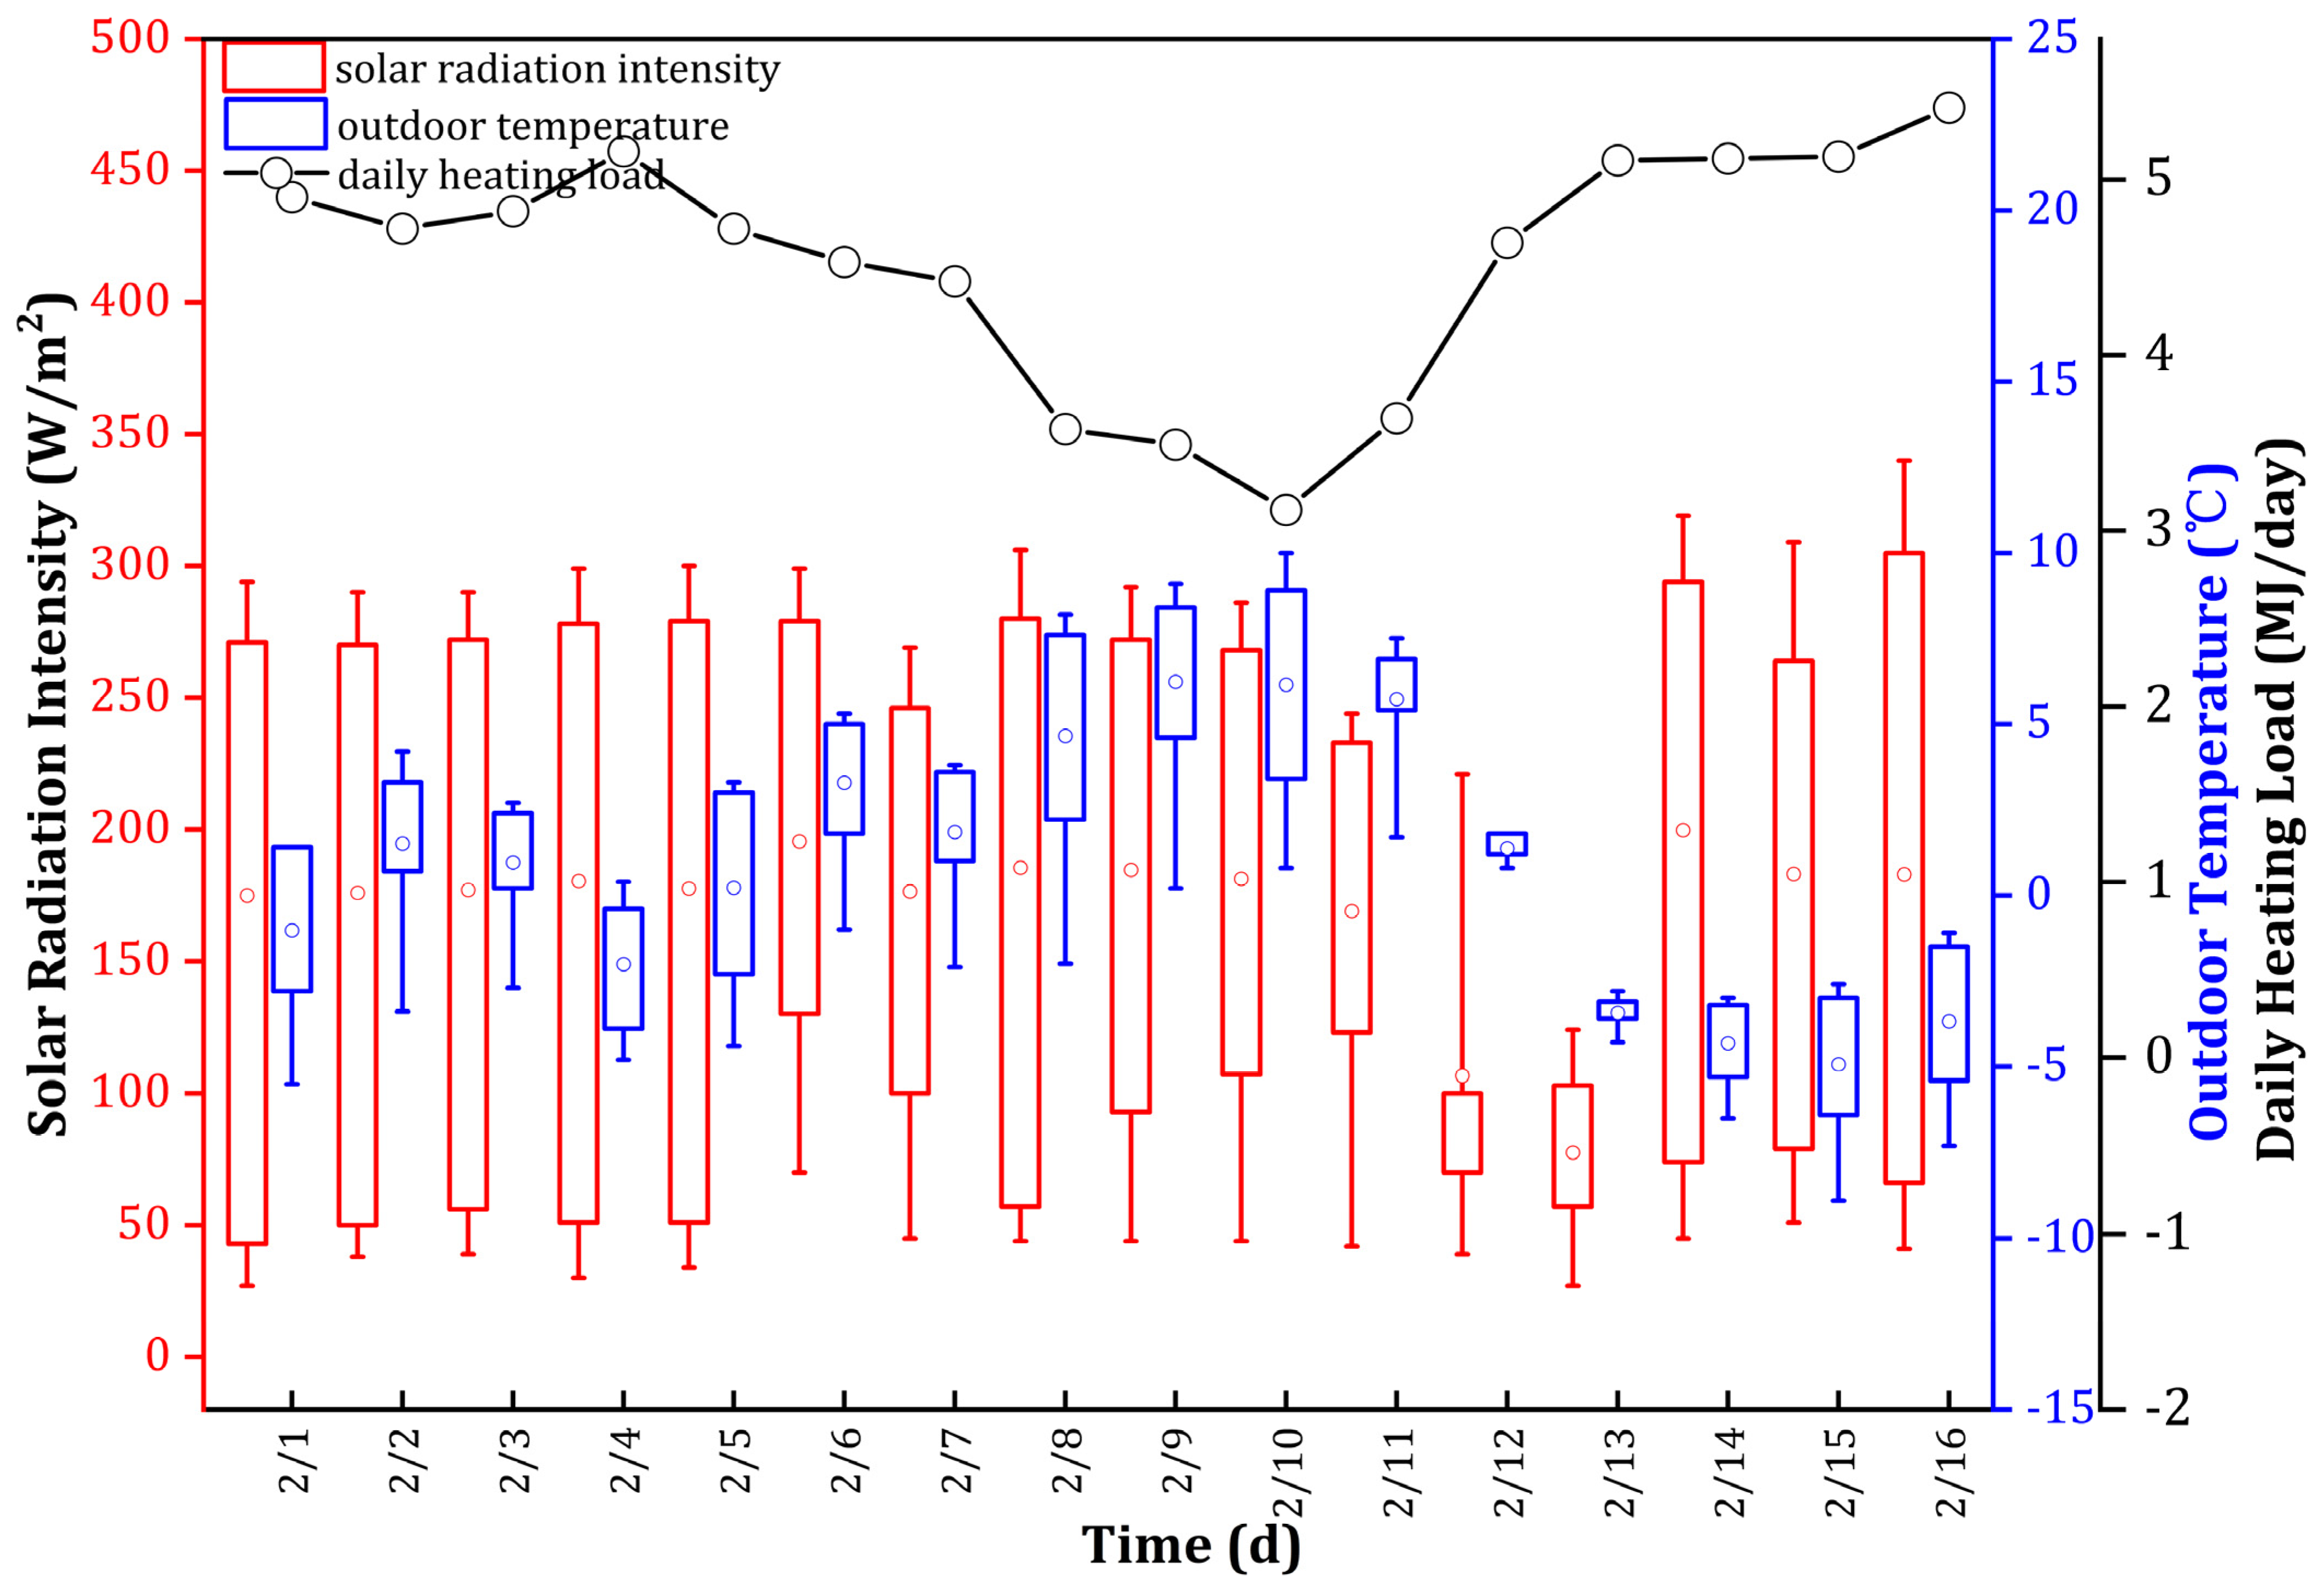
2.2.1. Variation in Heat Load with Meteorological Parameters

Currently, the regulation of the majority of heating systems is predicated on the application of climate compensation technology. Climate compensation operates on the principle of dynamically adjusting the heating system in accordance with pre-established compensation curves. These curves are utilized to calculate the outdoor temperature, taking into account the prevailing outdoor temperature and the primary return water temperature. The outdoor temperature and solar irradiance are identified as the primary factors that exert the most significant influence on heating regulation, and they are also recognized as the principal sources of disturbance. When examining the outdoor temperature and solar irradiance data from February 1 to February 16, it becomes evident that there is an initial negative correlation observed between the heat load and both the outdoor temperature and solar irradiance. The variation in the heat load in relation to the outdoor temperature and the intensity of solar radiation is depicted in Figure 1. Similarly, when considering the outdoor wind speed data from March 5 to March 20, an initial positive correlation is observed between the heat load and the outdoor wind speed. The relationship between the change in heat load and the outdoor wind speed is illustrated in Figure 2.

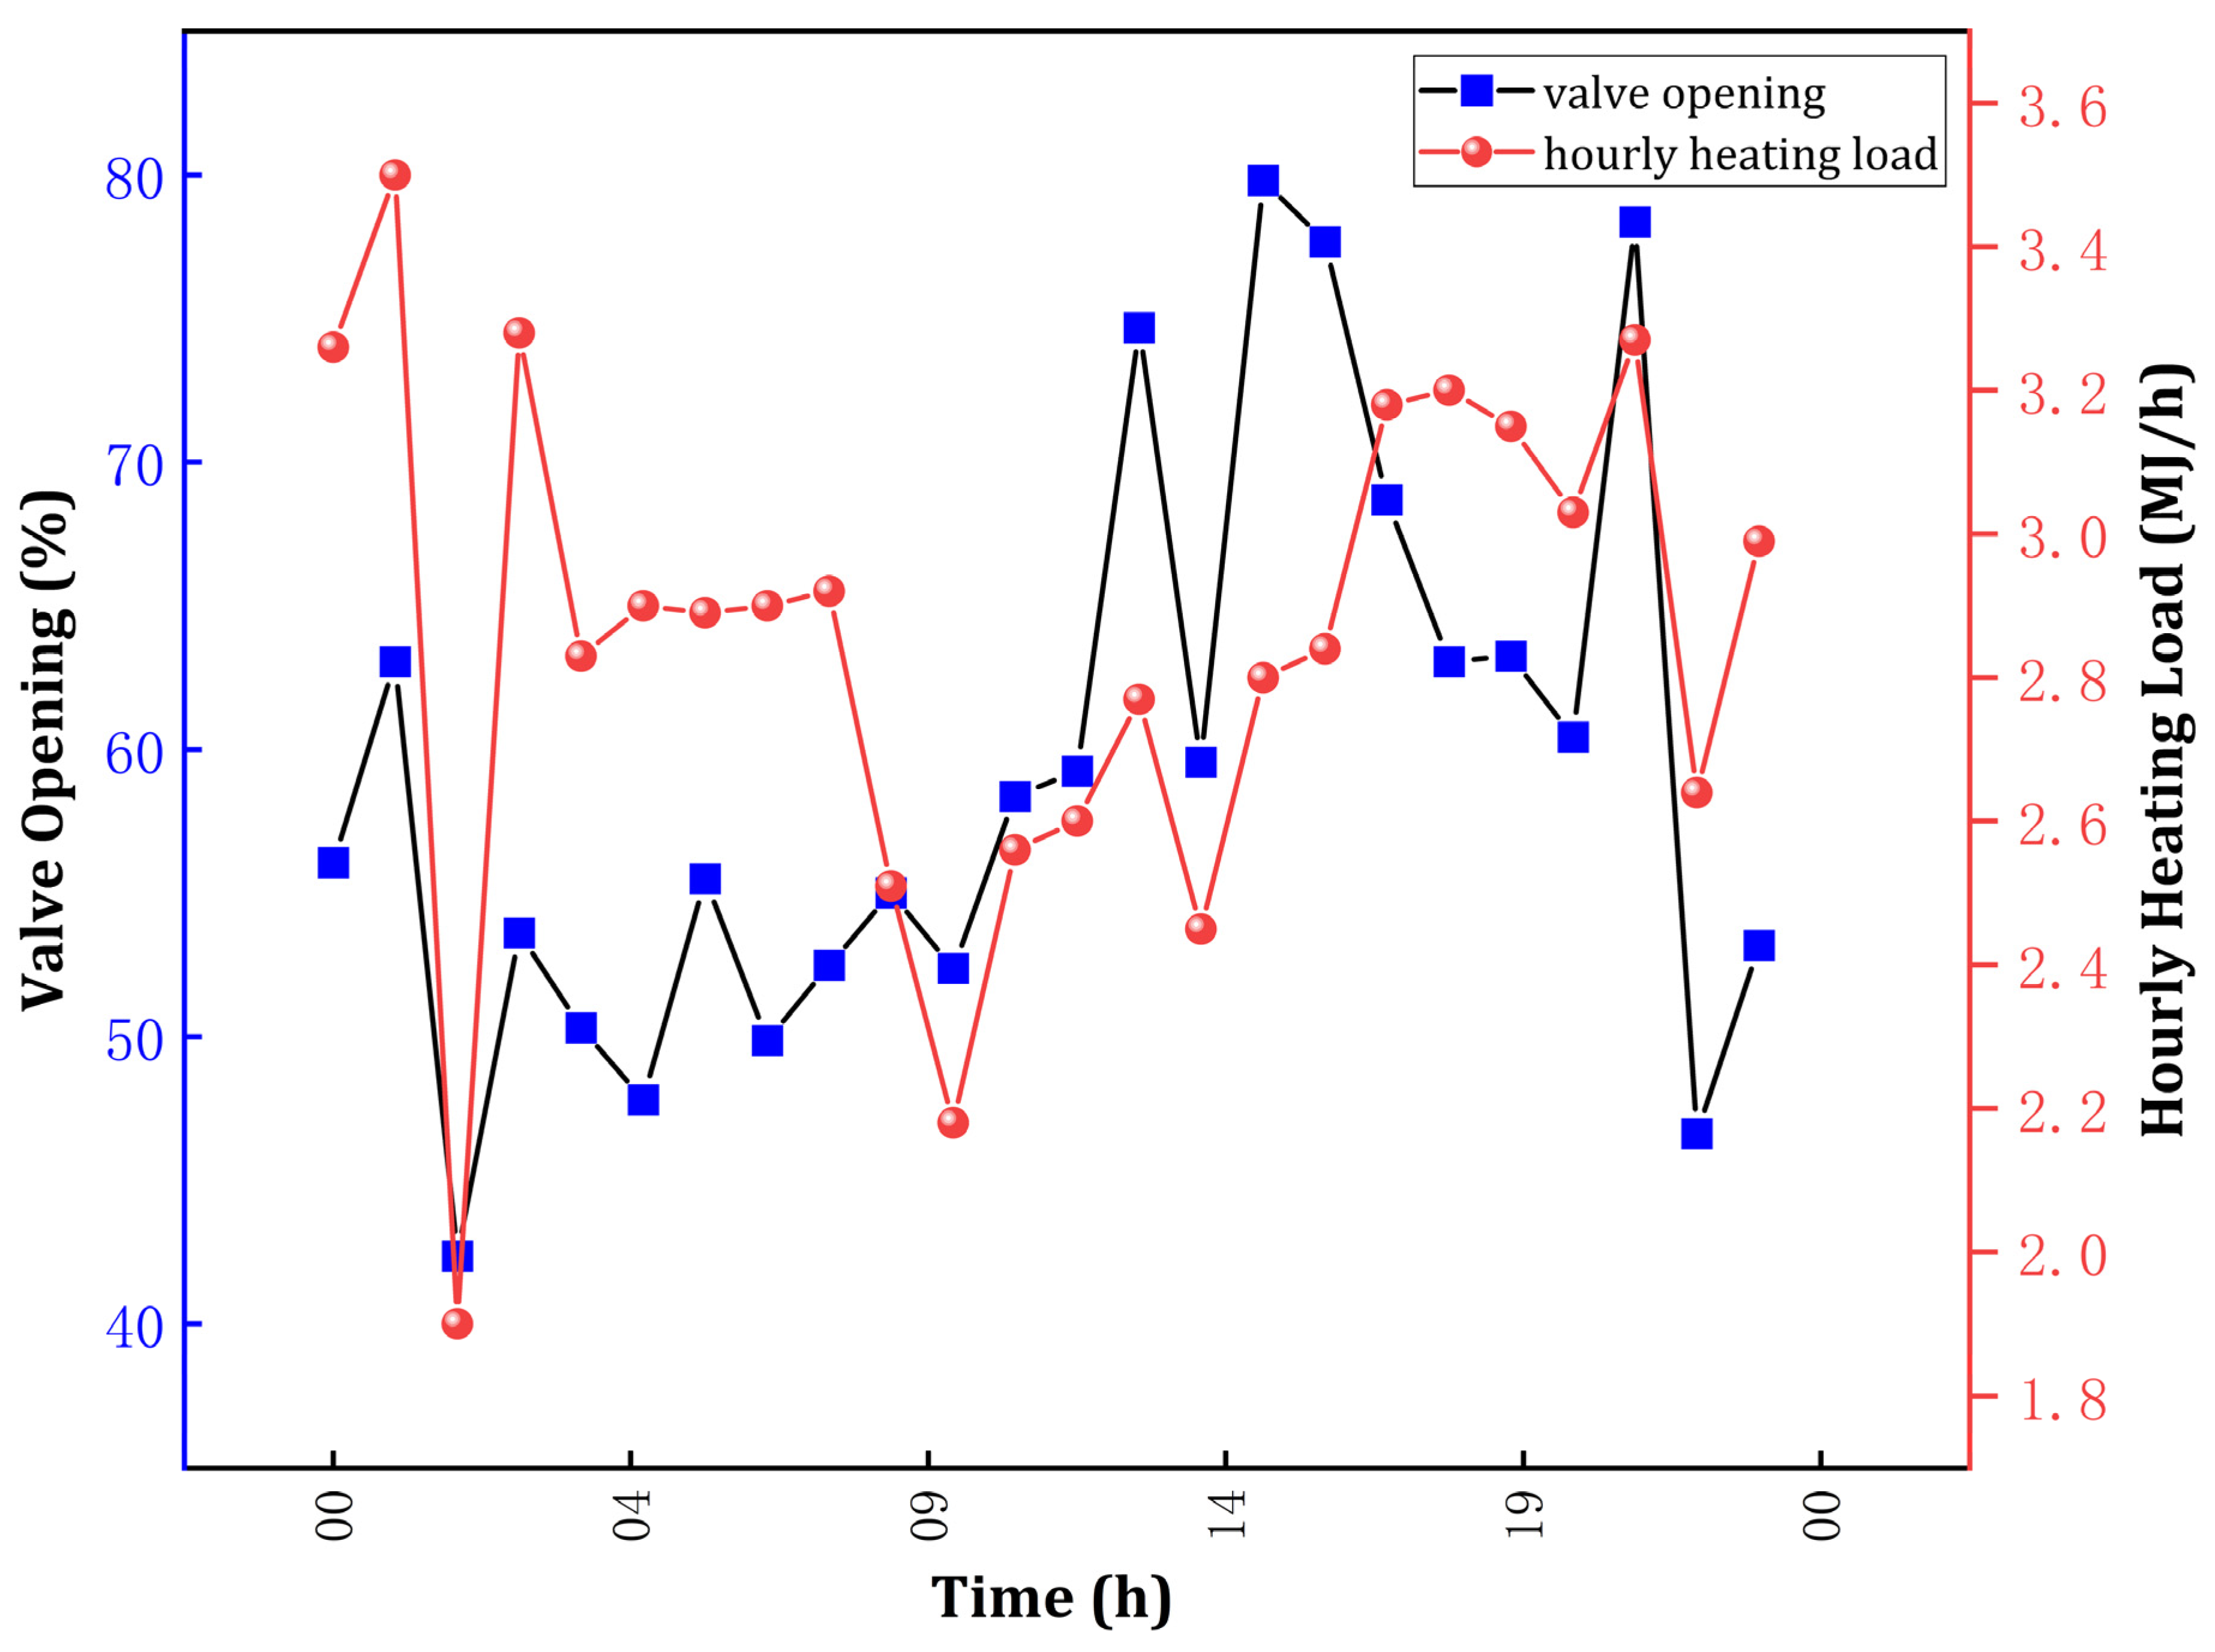
2.2.2. Variation in Heating Load with Dynamic Control Settings
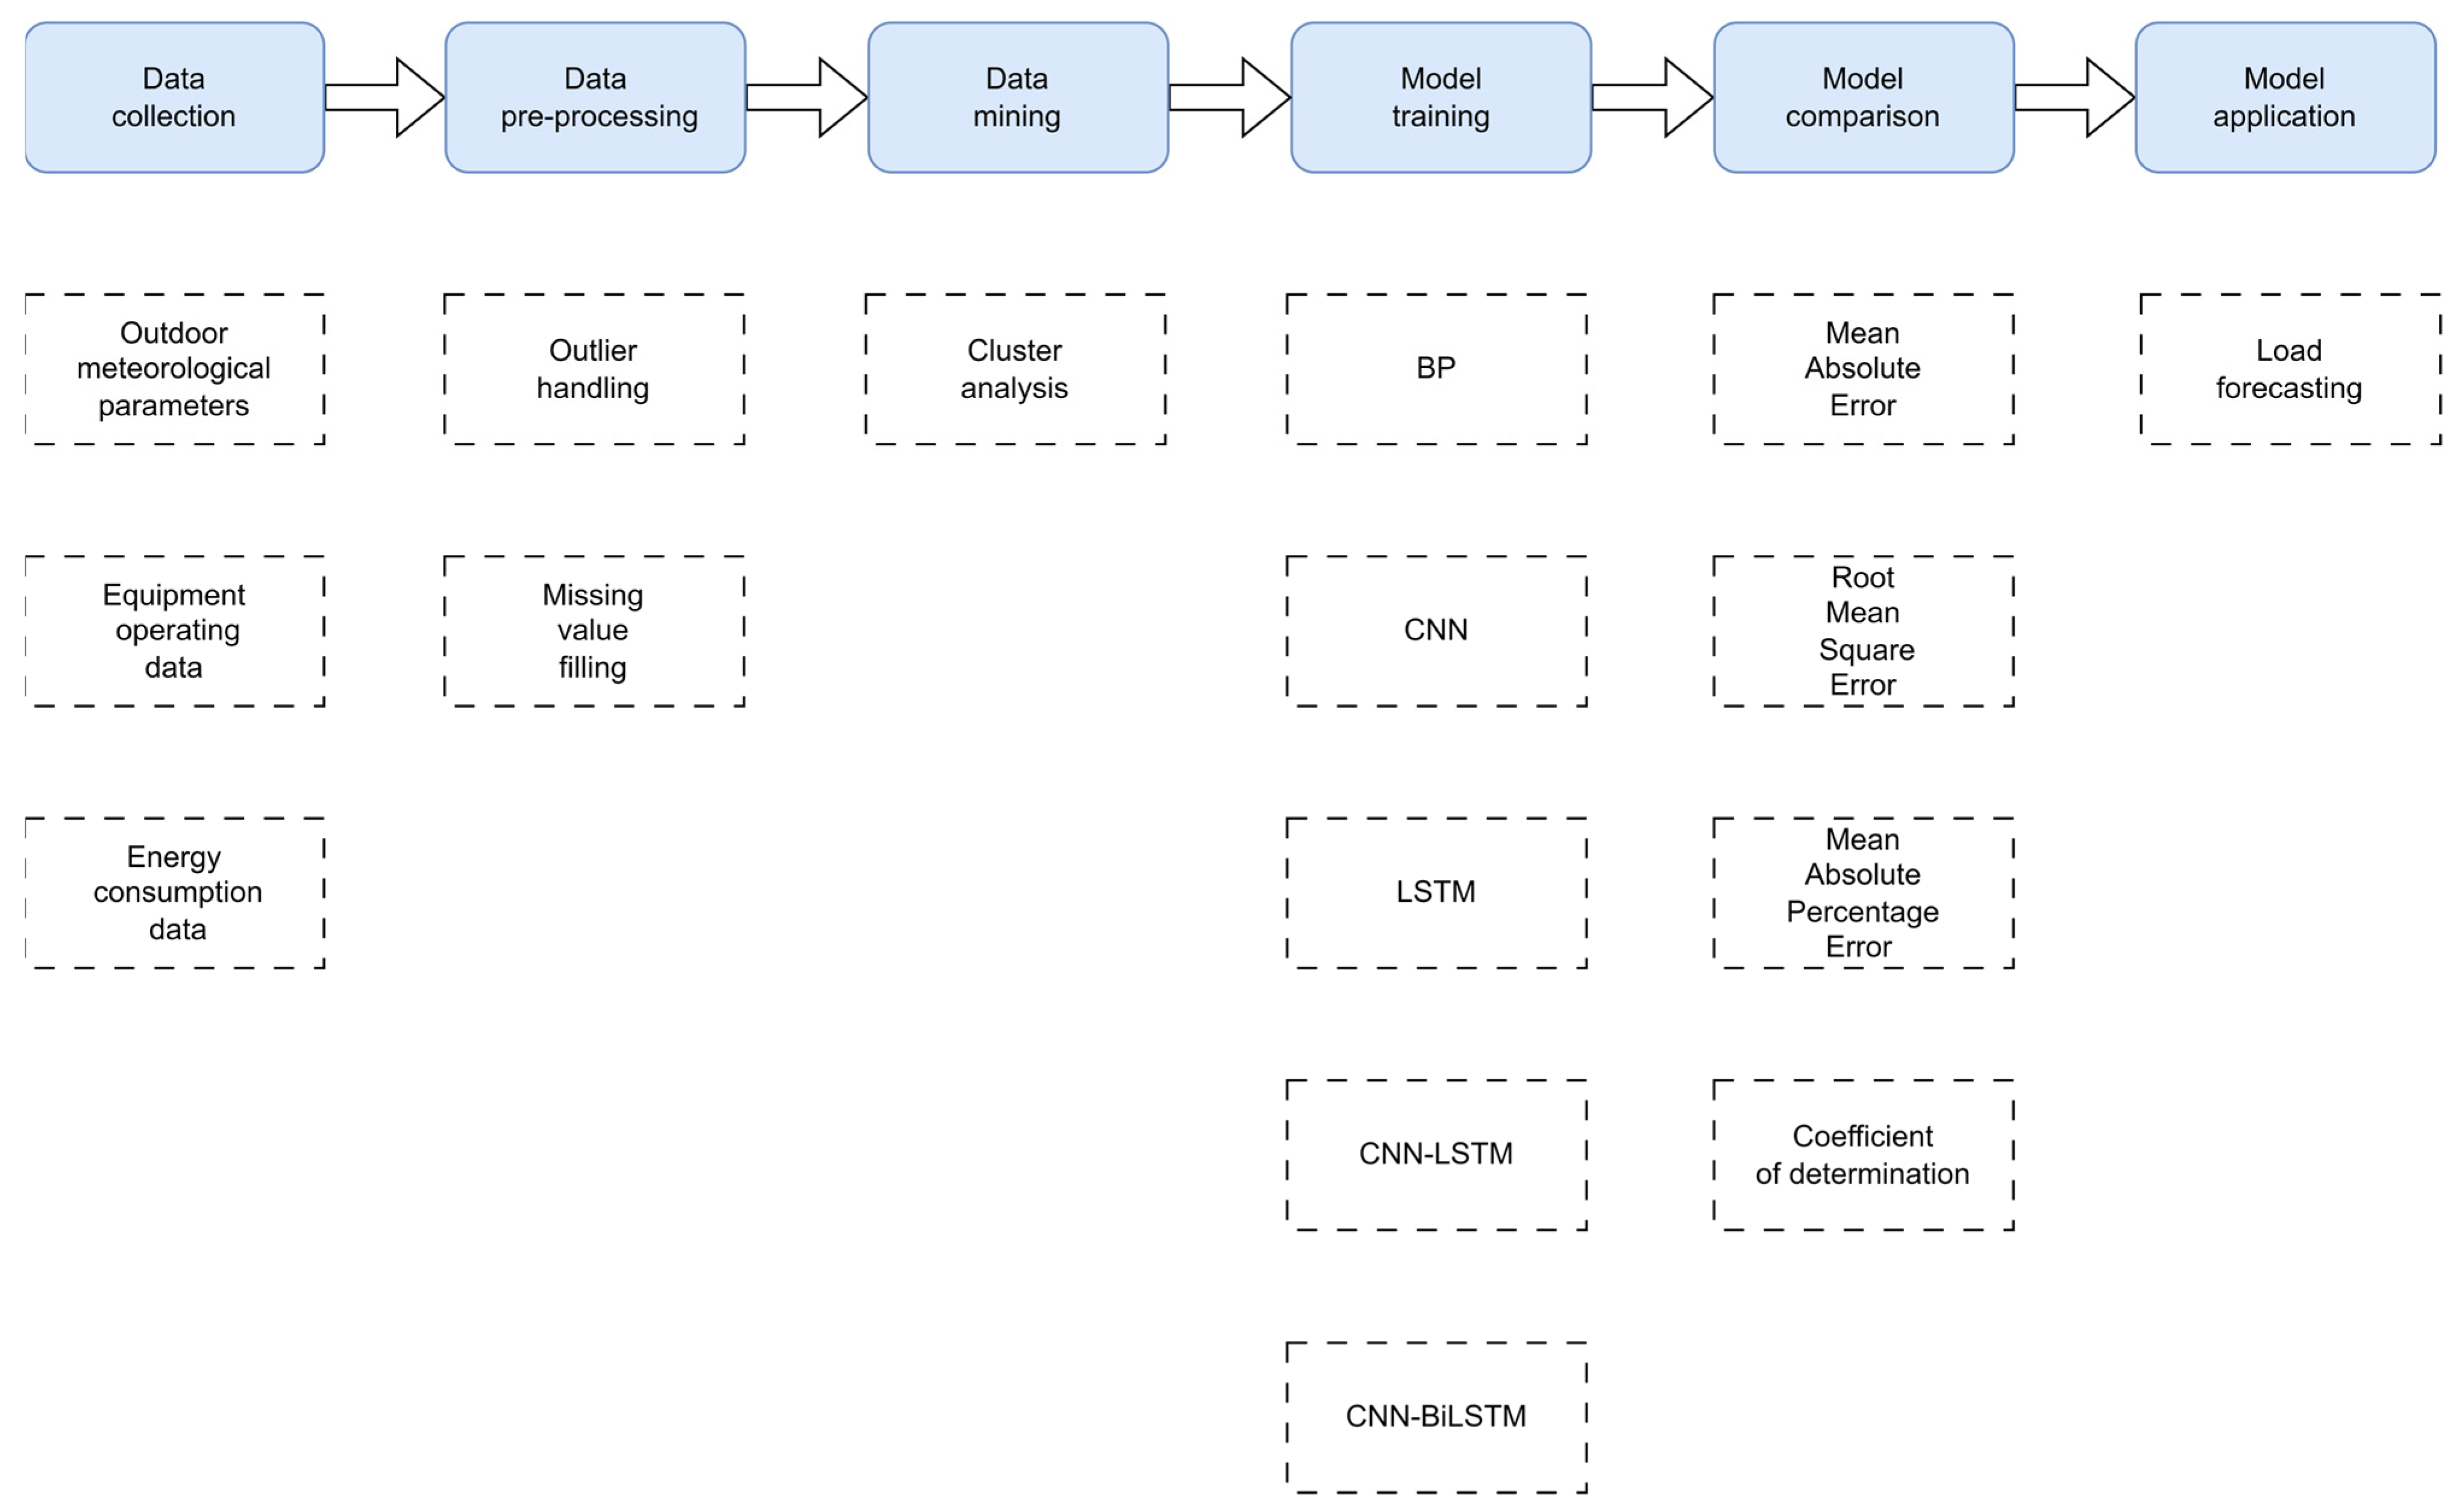
Regulatory factors of both the primary and secondary sides of a heat supply network, such as water supply temperature, return water temperature, water supply pressure, return water pressure, and the degree of primary side valve opening, exert a significant influence on the operation of the heating system. At present, most site technicians at heat stations pre-set the supply and return water temperatures, supply and return water pressures, and primary side valve opening degrees based on anticipated changes in outdoor temperature. The change in setting of the supply and valve opening takes place once every hour. However, despite the fact that this method of regulation can address heating demands, it is not without its issues. On one hand, the inherent inertia of the district heating system necessitates that technicians adjust the system in anticipation of sudden changes in outdoor weather to meet the heat demands of end users. This requires operators to accurately gauge both the timing and magnitude of the adjustments, a task that is exceedingly challenging. On the other hand, manual adjustment of the primary pipe network demands a high level of skilled experience and is often devoid of theoretical backing. Improper adjustments can result in either over-heating or under-heating. An excess of heat supply leads to waste, while an insufficient supply fails to ensure the thermal comfort required by end users. The diurnal variations in valve opening values and heat loads are illustrated in Figure 3.
Typically, the set point of the boiler temperature is reduced during the night. However, as depicted in Figure 3, heat is continuously supplied throughout the day. This strategy is adopted due to the advanced age of the buildings included in this study, which suffer from suboptimal thermal insulation of the building envelope. Continuous heat supply is essential to satisfy the heating requirements of the residents.

3. Methodology

A combination of data mining algorithms was utilized to enhance prediction accuracy, specifically the CNN-BiLSTM prediction algorithm that is based on fuzzy clustering. The methodology encompassed four distinct stages: data pre-processing and clustering analysis, comparative evaluation of multiple prediction models, and load prediction, as depicted in Figure 4.
In this study, data collected via IoT technology were initially subjected to a data cleaning process to eliminate outliers, remove duplicate values, and address missing values within the original dataset. Subsequently, a cluster analysis was conducted to unearth the underlying knowledge within the data and to pinpoint the factors exerting a significant influence on the load. The dataset, once clustered, was partitioned into training, testing, and validation subsets, which were subsequently fed into the neural network models for the purpose of load prediction. Five distinct neural network models were constructed: BP, CNN, LSTM, CNN-LSTM, and CNN-BiLSTM. The predictive accuracy of these models was assessed and compared using four evaluation metrics: Mean Absolute Error (MAE), Root-Mean-Square Error (RMSE), Mean Absolute Percentage Error (MAPE), and coefficient of determination (R2). The models’ prediction accuracy and generalization capabilities were compared across all predictive models. The model exhibiting the lowest Mean Absolute Percentage Error (MAPE) was selected as the optimal choice.

3.1. Data Mining

3.1.1. Data Pre-Processing

Some values within the operational data were significantly deviant from actual operational values and were classified as outliers. These anomalies can exert a substantial impact on the data mining analysis.
In this study, the Jupyter platform of Python was employed for data cleaning and pre-processing to address missing and anomalous values, as detailed below:
1. Pre-processing of missing value data: When a variable contained between 5% to 30% missing values, a random forest multiple imputation model was utilized to fill and complete the data using Python libraries. If a variable contained more than 30% missing values, it was deemed invalid and was consequently discarded.
2. Pre-processing of outlier data: Outliers were identified using box plots (the quartile method), and data substitution was carried out using the mean value of the adjacent data points. For continuously repeated data, if a sequence of data repeated for more than 5 instances consecutively, the data series was judged to be anomalous and was directly rejected.

3.1.2. Fuzzy Clustering

Clustering algorithms represent the most prevalent form of unsupervised learning, classifying objects into distinct groups predicated on the degree of similarity among the data. These algorithms adjust the pertinent clustering parameters to achieve rational clustering outcomes without the need for data labeling. Fuzzy clustering is currently being explored more intensively across various domains, offering a qualitative improvement in clustering results. Among the more widely recognized clustering techniques is the fuzzy K-means clustering (FCM). This method categorizes data into various classes within a Euclidean space. Both from a theoretical and practical standpoint, the fuzzy K-means clustering algorithm demonstrates superior segmentation efficiency when compared to other segmentation methods, particularly when incorporating fuzzy local information in conjunction with K-means clustering. Given that outdoor meteorological parameters and system operation status parameters of heat exchange stations are gathered across different time series, the data for each influencing factor were transformed from the time domain to the frequency domain. This transformation was based on the Fourier coefficient distance (FCBD), necessitating only a select few Fourier coefficients to project high-dimensional data into a lower-dimensional space. When integrated with an unsupervised data analysis, the FCM method was capable of segmenting each variable influencing the heating load into n predefined clusters. The hidden characteristics were then analyzed through a distinctive algorithmic logical framework, namely, the FCBD-FCM method.
The specific steps were as follows:
(1) Establish the whole dataset. Firstly, the FCBD is used to map the disturbance variables such as outdoor temperature, outdoor wind speed, and insolation and the 12 influencing factors of the regulation variables such as supply and return water temperature and pressure and regulating valve opening to build the dataset separately from the heat exchange station.
(2) Define X as the total dataset (including the mapped heating load of the heat exchanger station and other influencing factors). X = [ X 1 , X 2 , X 3 , , X 12 ] T . N is the total data volume, and M is the number of clusters, 2 M N .
(3) Initializing the dataset X i , X i Ø , X i X   and   1 i M . The clustering centers are then calculated as:
c i = j = 1 N μ i j X j j = 1 N μ k i j
(4) Calculate the distance between the cluster data and the cluster center
d X , c i = i = 1 M i = 1 N μ i j X j c i 2
Among them, is the Euclidean norm, μ i j is the value of point j in cluster i, and
i = 1 M μ i j = 1 i , j = 1,2 , 3 , , N
under this condition; the value is between 0 and 1.
(5) Determine the clusters according to the minimum distance;
(6) Recalculate new cluster centers based on the calculated cluster centers and repeat step (4) until the termination condition is satisfied. The maximum number of iterations used in this study was 100, and the termination condition of the algorithm was specified as an absolute change in the cluster centers of less than 1 × 1 0 6 . In this paper, the K value was determined by the elbow method, and the evaluation index of the elbow method was the SSE (sum of the squared errors), whose formula is shown in the following equation:
S S E = i = 1 k p C i p m i 2
where i denotes the ith cluster, p is the sample point, m is the center of mass (the mean of all points in the sample), and SSE is the clustering error of all samples, which represents the clustering effect. The elbow method was used to determine a K value of 3 in this paper.

3.2. Heat Load Forecast

3.2.1. Predictive Models’ Construction

BP, CNN, and LSTM are recognized as commonly utilized and efficacious neural network models within the realm of machine learning. BP neural networks are lauded for their clear algorithm derivation, elevated learning accuracy, and expedited operational velocity. Nonetheless, they are not without their drawbacks, which include a propensity to converge on local minima and a sensitivity to initial weights that significantly influences the training duration. The convolutional neural network (CNN) primarily excels due to its use of convolutional kernels for localized perception, thereby adeptly capturing local features. Moreover, the parameters of these kernels can be shared, leading to a reduction in the network’s overall parameter count. This diminishes the likelihood of overfitting and bolsters the model’s generalization capabilities. The incorporation of pooling layers in CNNs serves to curtail computational demands, thereby enhancing the model’s efficiency and robustness. However, CNNs may exhibit limitations when it comes to the extraction of global features. Long Short-Term Memory (LSTM) networks are designed to learn and retain long-term dependencies through a gating mechanism. This capability allows them to effectively address challenges associated with the processing of long sequences and to mitigate the issue of vanishing gradients. Consequently, LSTM networks are particularly adept at handling complex sequence prediction tasks. However, the architectural design of LSTM networks may not be as proficient in extracting local features from data.
In this study, an attempt was made to construct a hybrid model that leveraged the advantageous aspects of each algorithm, thereby enhancing performance in load forecasting for heating systems. The CNN-BiLSTM network structure comprises several key components, including a convolutional layer, a bidirectional Long Short-Term Memory (LSTM) network, and a fully connected layer. The convolutional neural network (CNN) is primarily utilized for extracting local features from the input sequence. It accomplishes this by performing sliding window operations with convolutional kernels to extract significant features from the input sequence. The Long Short-Term Memory network (LSTM) is a recurrent neural network well-suited for sequence modeling. The bidirectional Long Short-Term Memory network (BiLSTM) processes sequence data while considering contextual information and models long-term dependencies in the sequence using hidden states in both forward and backward directions. The fully connected layer serves to amalgamate the outputs of the CNN and BiLSTM network to produce the final prediction. The LSTM recurrent neural network is capable of retaining and memorizing relatively important historical information. However, it cannot utilize the hidden information from subsequent neurons or future information during network learning. This limitation can result in the omission of information in the final state, which may impact the accuracy of the model’s predictive classification. Consequently, this study combined a bidirectional Long Short-Term Memory neural network with a convolutional neural network for load prediction. The parameters of the constructed neural network model are presented in Table 1.

3.2.2. Evaluation Indexes for Predictive Models

When analyzing the prediction results of heating load forecasting models, obtaining a clear picture of the accuracy of each model is challenging due to the substantial volume of data input across varying time periods. Consequently, the prediction results should be comprehensively assessed using four evaluation metrics: Mean Absolute Error (MAE), Root-Mean-Square Error (RMSE), Mean Absolute Percentage Error (MAPE), and the coefficient of determination (R2). These metrics were employed to ascertain the optimal prediction model. The MAE represents the average value of the absolute error and provides a more realistic reflection of the discrepancy between forecasted and actual values. The RMSE quantifies the sample standard deviation of the residuals, that is, the differences between predicted and observed values. The MAPE, theoretically, indicates that a smaller value corresponds to a better fit of the prediction model and higher accuracy. R2 measures the proportion of the variance in the dependent variable that is predictable from the independent variables. The range of R2 is typically from 0 to 1, with values closer to 1 indicating a stronger explanatory power of the variables and a better model fit.
M A E = 1 n i = 1 n y ^ i y i
R M S E = 1 n i = 1 n y i y ^ i 2
M A P E = 100 % n i = 1 n y ^ i y i y i
R 2 = 1 i = 1 n y i y ^ i 2 i = 1 n y i y ¯ 2

4. Results and Discussion

4.1. Clustering Results

The data analysis was conducted using the FCBD-FCM algorithm, implemented through R language programming, to determine the correlation between the 12 influencing factors of the heating station and the heating load, without consideration of the operator experience. During the Fourier variation process, each influencing factor was transformed into a dimensionless form, which more accurately reflected the physical properties of the system. The clustering results, which include U (representing the 12 influencing factors) and Q (representing the heating load), are presented in Figure 5 to evaluate the strong correlation points of these factors in relation to the heating load. These factors were categorized into three distinct groups, with the details of the results provided in Table 2. The figure indicates that there was a close relationship between the first category and the heating load when the average value of the Fourier distance associated with U and the Fourier distance associated with Q were below 0.2.
The impact of disturbance and regulation factors on both long-term and short-term heat supply was categorized into three distinct groups, as presented in Table 2. Category 1 was primarily associated with disturbance factors, which included outdoor temperature, outdoor wind speed, primary network water supply pressure, primary network water return pressure, secondary network water supply pressure, and secondary network water return pressure. These factors were delineated as having a direct influence on heat supply. Category 2 was characterized by factors on the user side, which were noted for their larger distance from Cluster 1. This distance was indicative of a lag effect associated with the user side, suggesting an indirect influence on heat supply. The factors in this category were recognized for their delayed response to changes in the heat supply system. Category 3 mainly encompassed regulatory factors, such as the opening degree of the primary network regulating valve, which in turn affects the primary network water supply temperature. The weak correlation observed with insolation was attributed to its being subject to a range of comprehensive building factors, including the heat transfer characteristics of the envelope structure, among others. This indicated that while solar radiation was a factor, its impact was moderated by various other elements within the building’s structure.
In this section, the results of an analysis of the influence exerted by disturbing variables such as outdoor temperature, outdoor wind speed, and insolation, along with regulatory variables including supply and return water temperature, pressure, and the opening of regulating valves, on the heating load are presented. This analysis was performed using the fuzzy clustering method based on the Fourier distance. The results obtained from this analysis were expected to be instrumental in the subsequent prediction of heat load.

4.2. Comparison of the Results of Several Prediction Methods

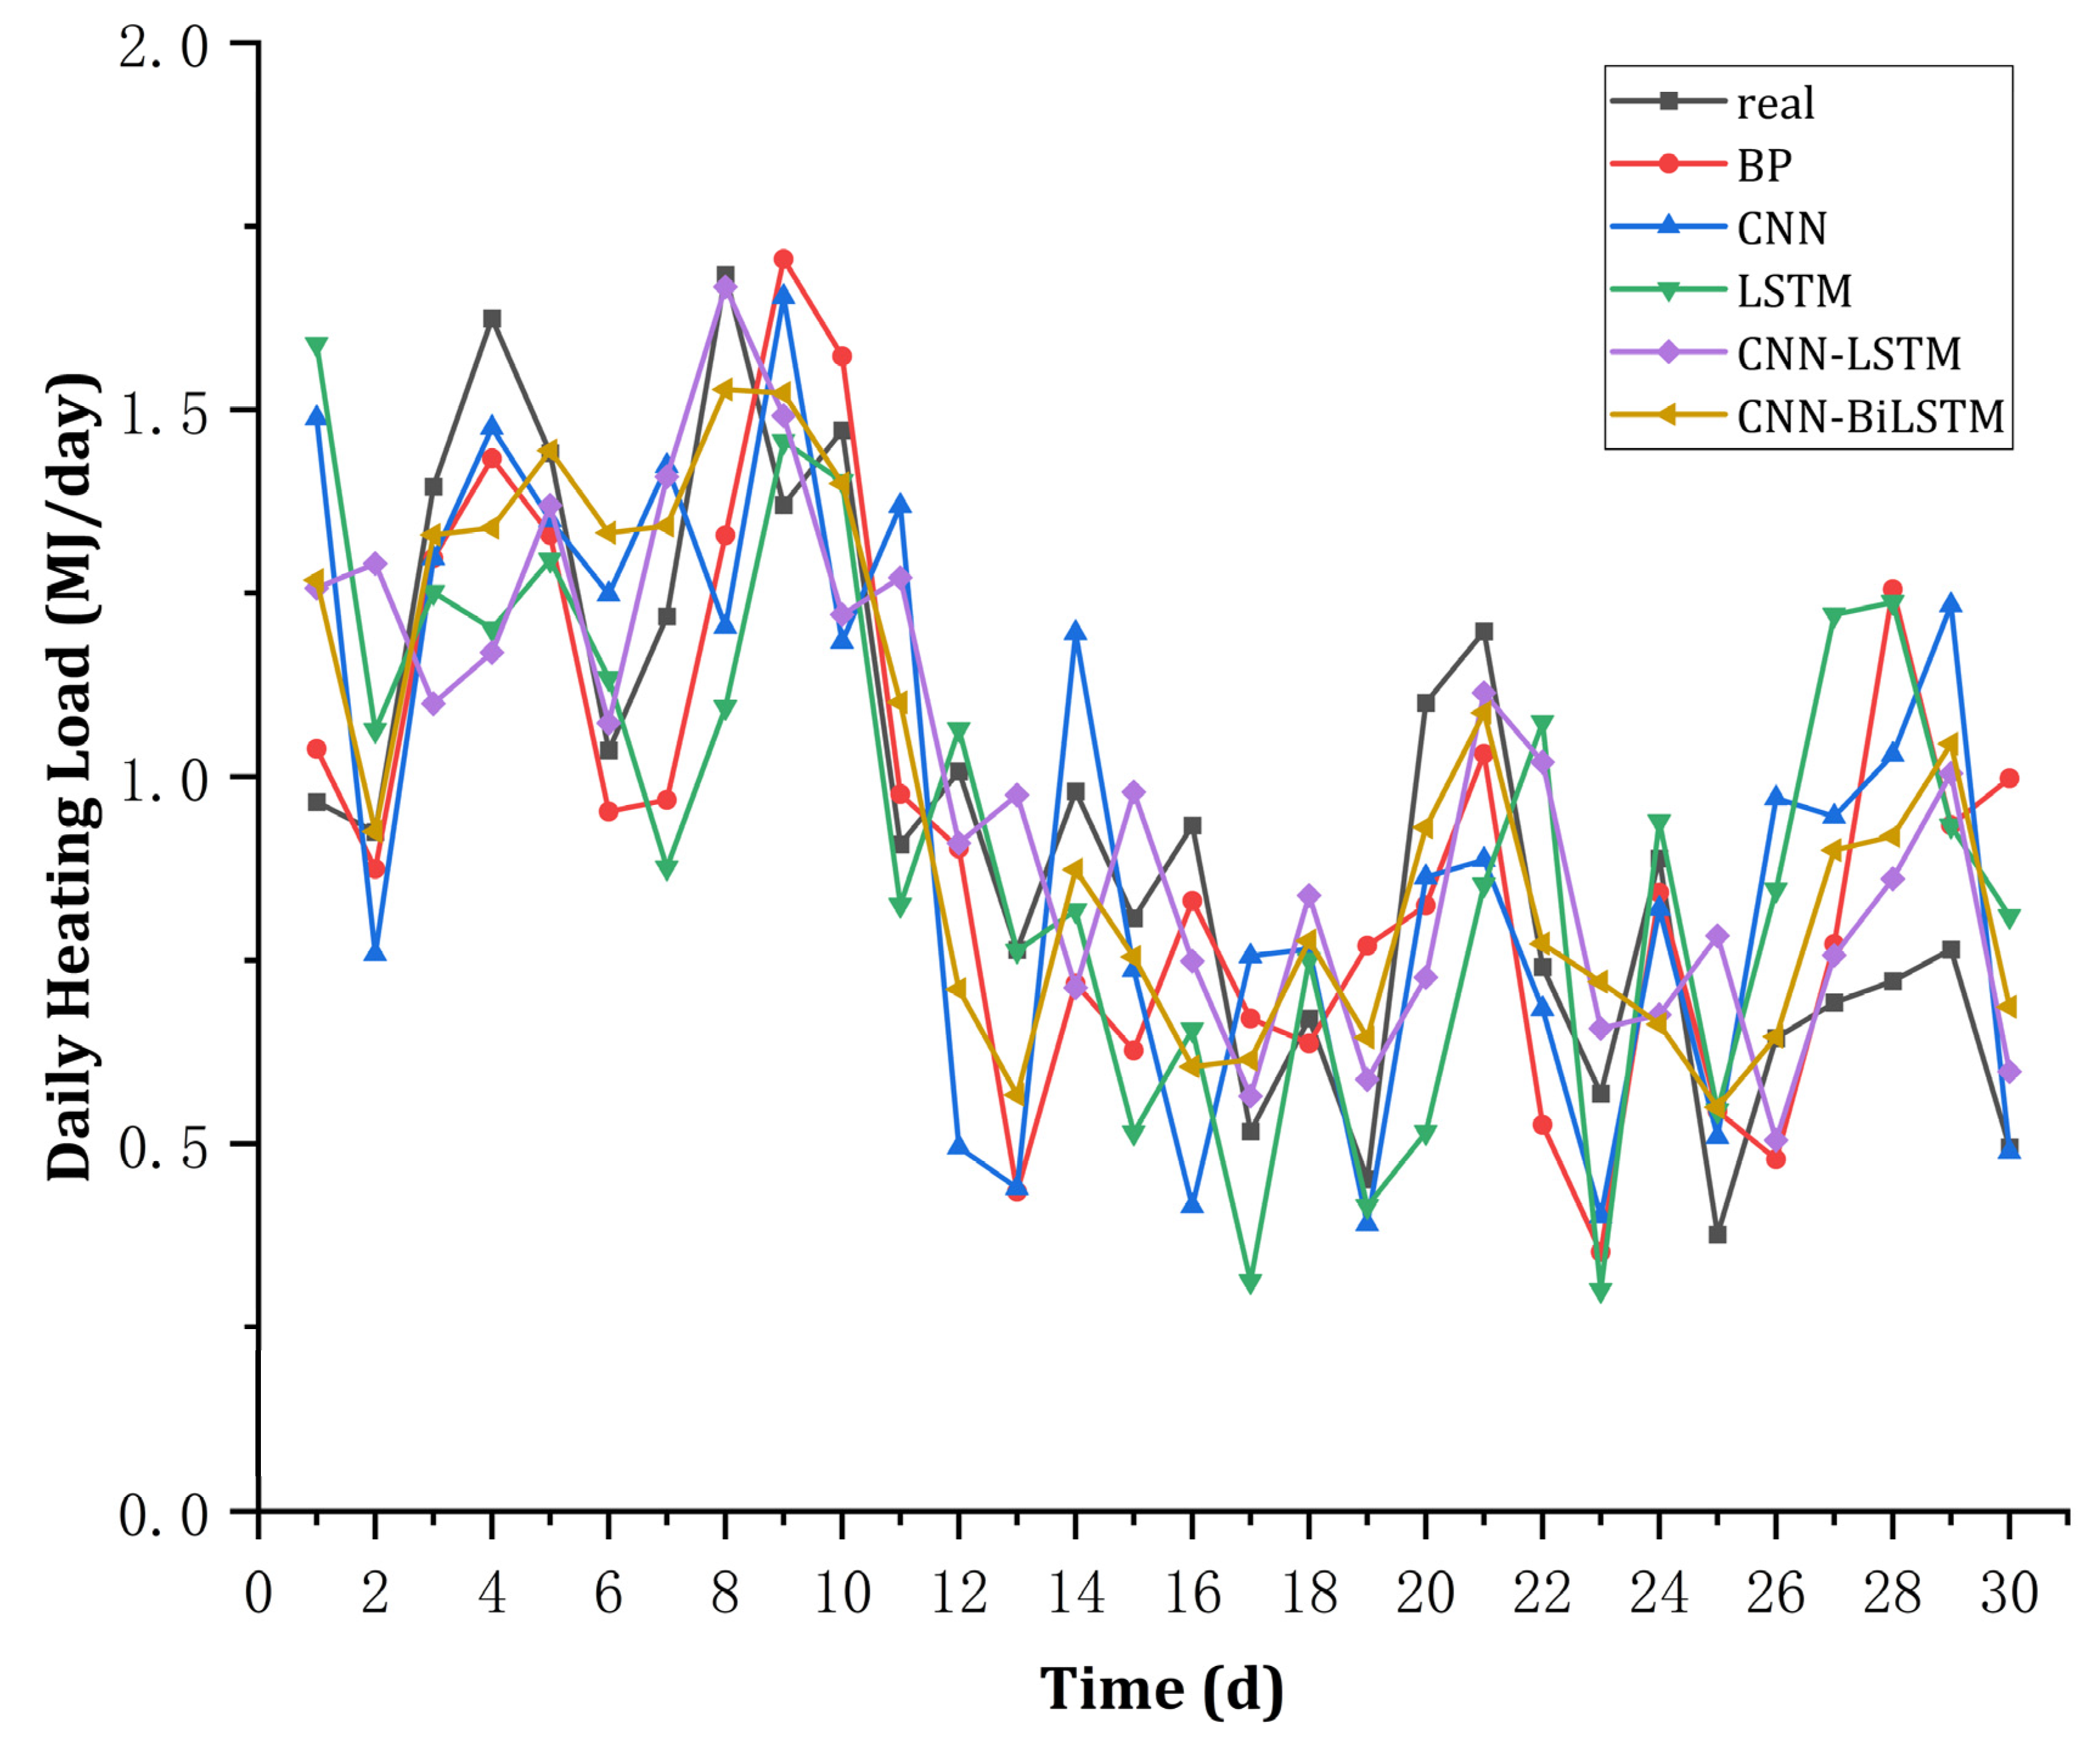
4.2.1. Long-Term Heat Load Forecast

For the purpose of forecasting the quantity of natural gas required in advance for the subsequent heating season, it is deemed essential to predict the long-term heating load. In this study, historical heat load data from a single heating season, spanning from 2021 to 2022, were selected to serve as the sole feature input variables for each model. The data were divided such that 80% constituted the training set, with the remaining 20% allocated to the validation set. The outcomes of the long-term load prediction which pertained to a 30-day period for each predictive model are illustrated in Figure 6.
Five predictive models—BP, LSTM, CNN, CNN-LSTM, and CNN-BiLSTM—were utilized for the long-term forecasting of heat load. The predictive conclusions can be inferred from the data presented in Figure 6 and Table 3. These models were capable of more accurately depicting the trend in load changes for the forthcoming heating season, with the predicted trends generally aligning with the actual values, making them suitable for long-term heat load prediction.
Among the models, the neural network BP model had the highest Mean Absolute Percentage Error (MAPE) at 2.921%, while the CNN-BiLSTM model showed the lowest MAPE at 1.272%. Consequently, the CNN-BiLSTM deep learning algorithm, which integrated convolutional and bidirectional LSTM networks, was found to yield superior results for long-term heat load prediction and was considered to have greater predictive accuracy compared to other neural network algorithms.

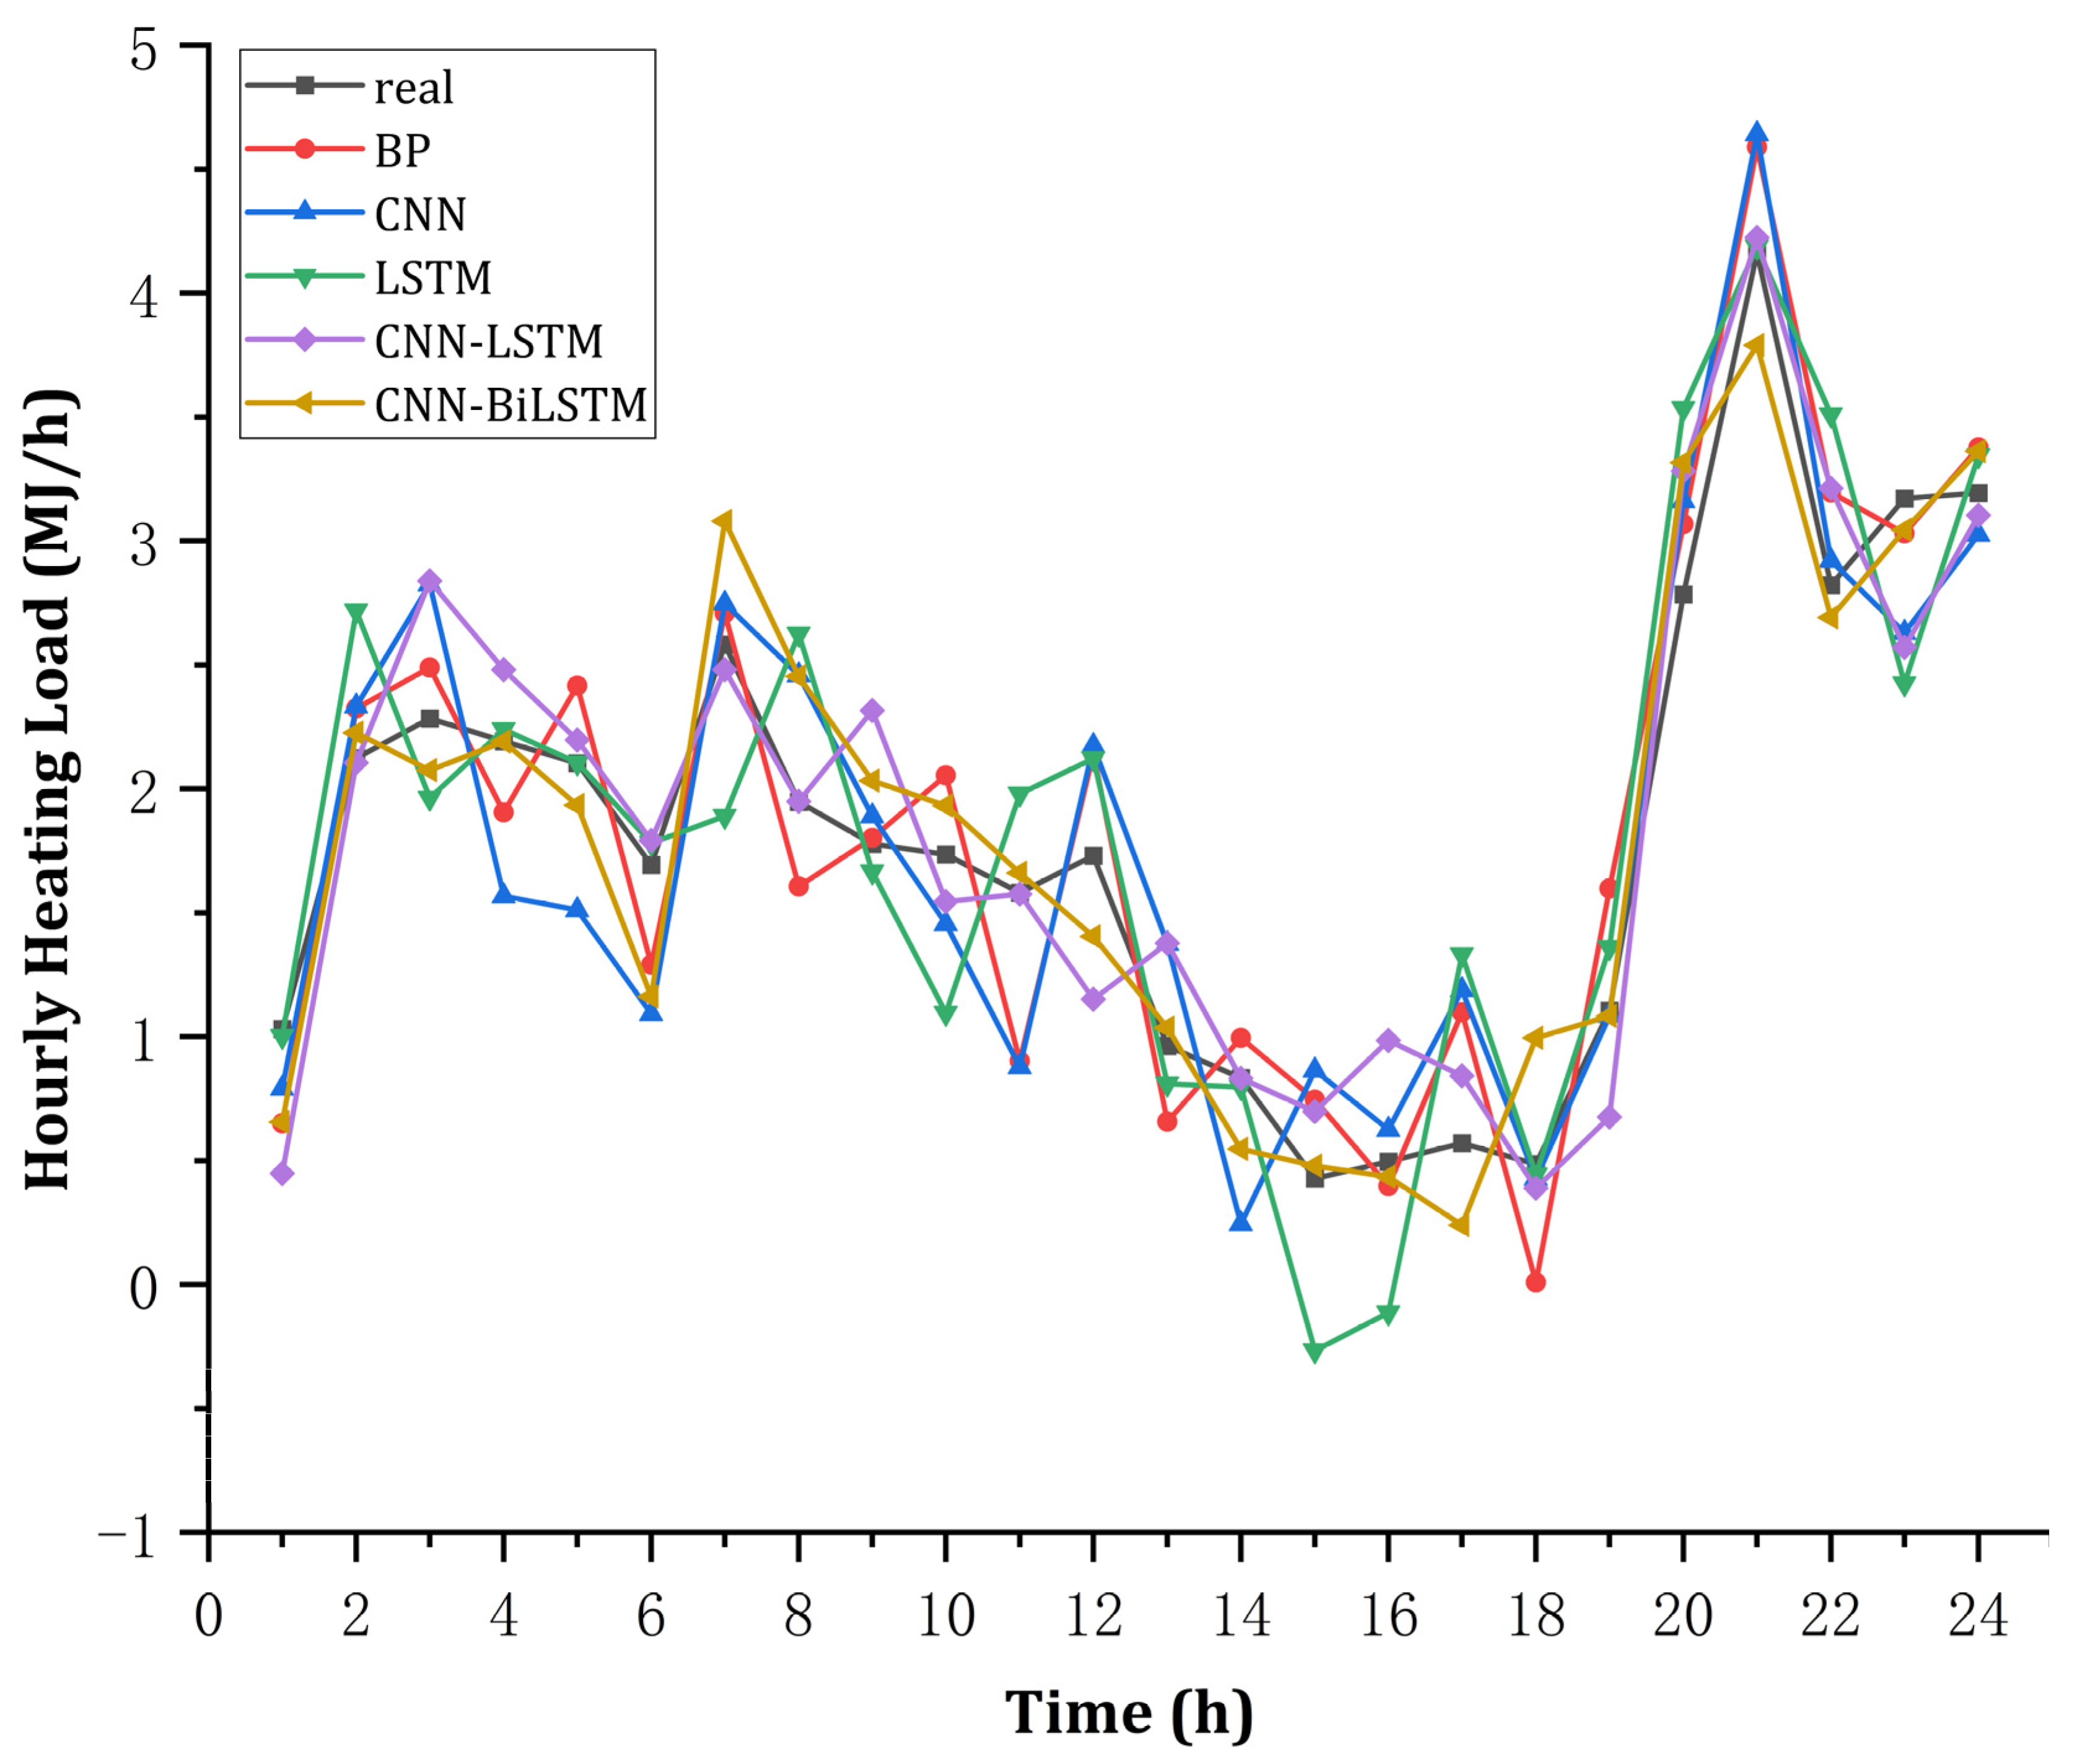
4.2.2. Short-Term Heat Load Forecast

To enhance the control performance of the heating system and achieve energy savings while ensuring user comfort, short-term heat load prediction for the next day is necessary. The accuracy of each prediction model was compared by considering historical heat load data with multivariate input parameters such as outdoor temperature, outdoor wind speed, primary network water supply pressure, primary network return pressure, secondary network water supply pressure, and secondary network return pressure. This comparison aimed to determine a more accurate prediction model with superior generalization capability for practical engineering applications.
In this study, historical heat load data from one heating season, ranging from 2021 to 2022, were selected as both single feature input variables and multifeature input variables for each model. Eighty percent of the data were designated as the training set, while twenty percent were allocated as the validation set. The short-term load (24 h) prediction results for each prediction model are displayed in Figure 7.
From the results presented in Figure 7 and Table 4, it is observed that the CNN-BiLSTM prediction model demonstrated superior comprehensive performance when the evaluation indexes of Mean Absolute Error (MAE), Root Mean Square Error (RMSE), and Mean Ab-solute Percentage Error (MAPE) were compared. The multifeature prediction model, enhanced through data mining, exhibited greater stability, higher prediction accuracy, and a more effective prediction outcome. This model can provide guidance for the actual operation and regulation of the heating system.

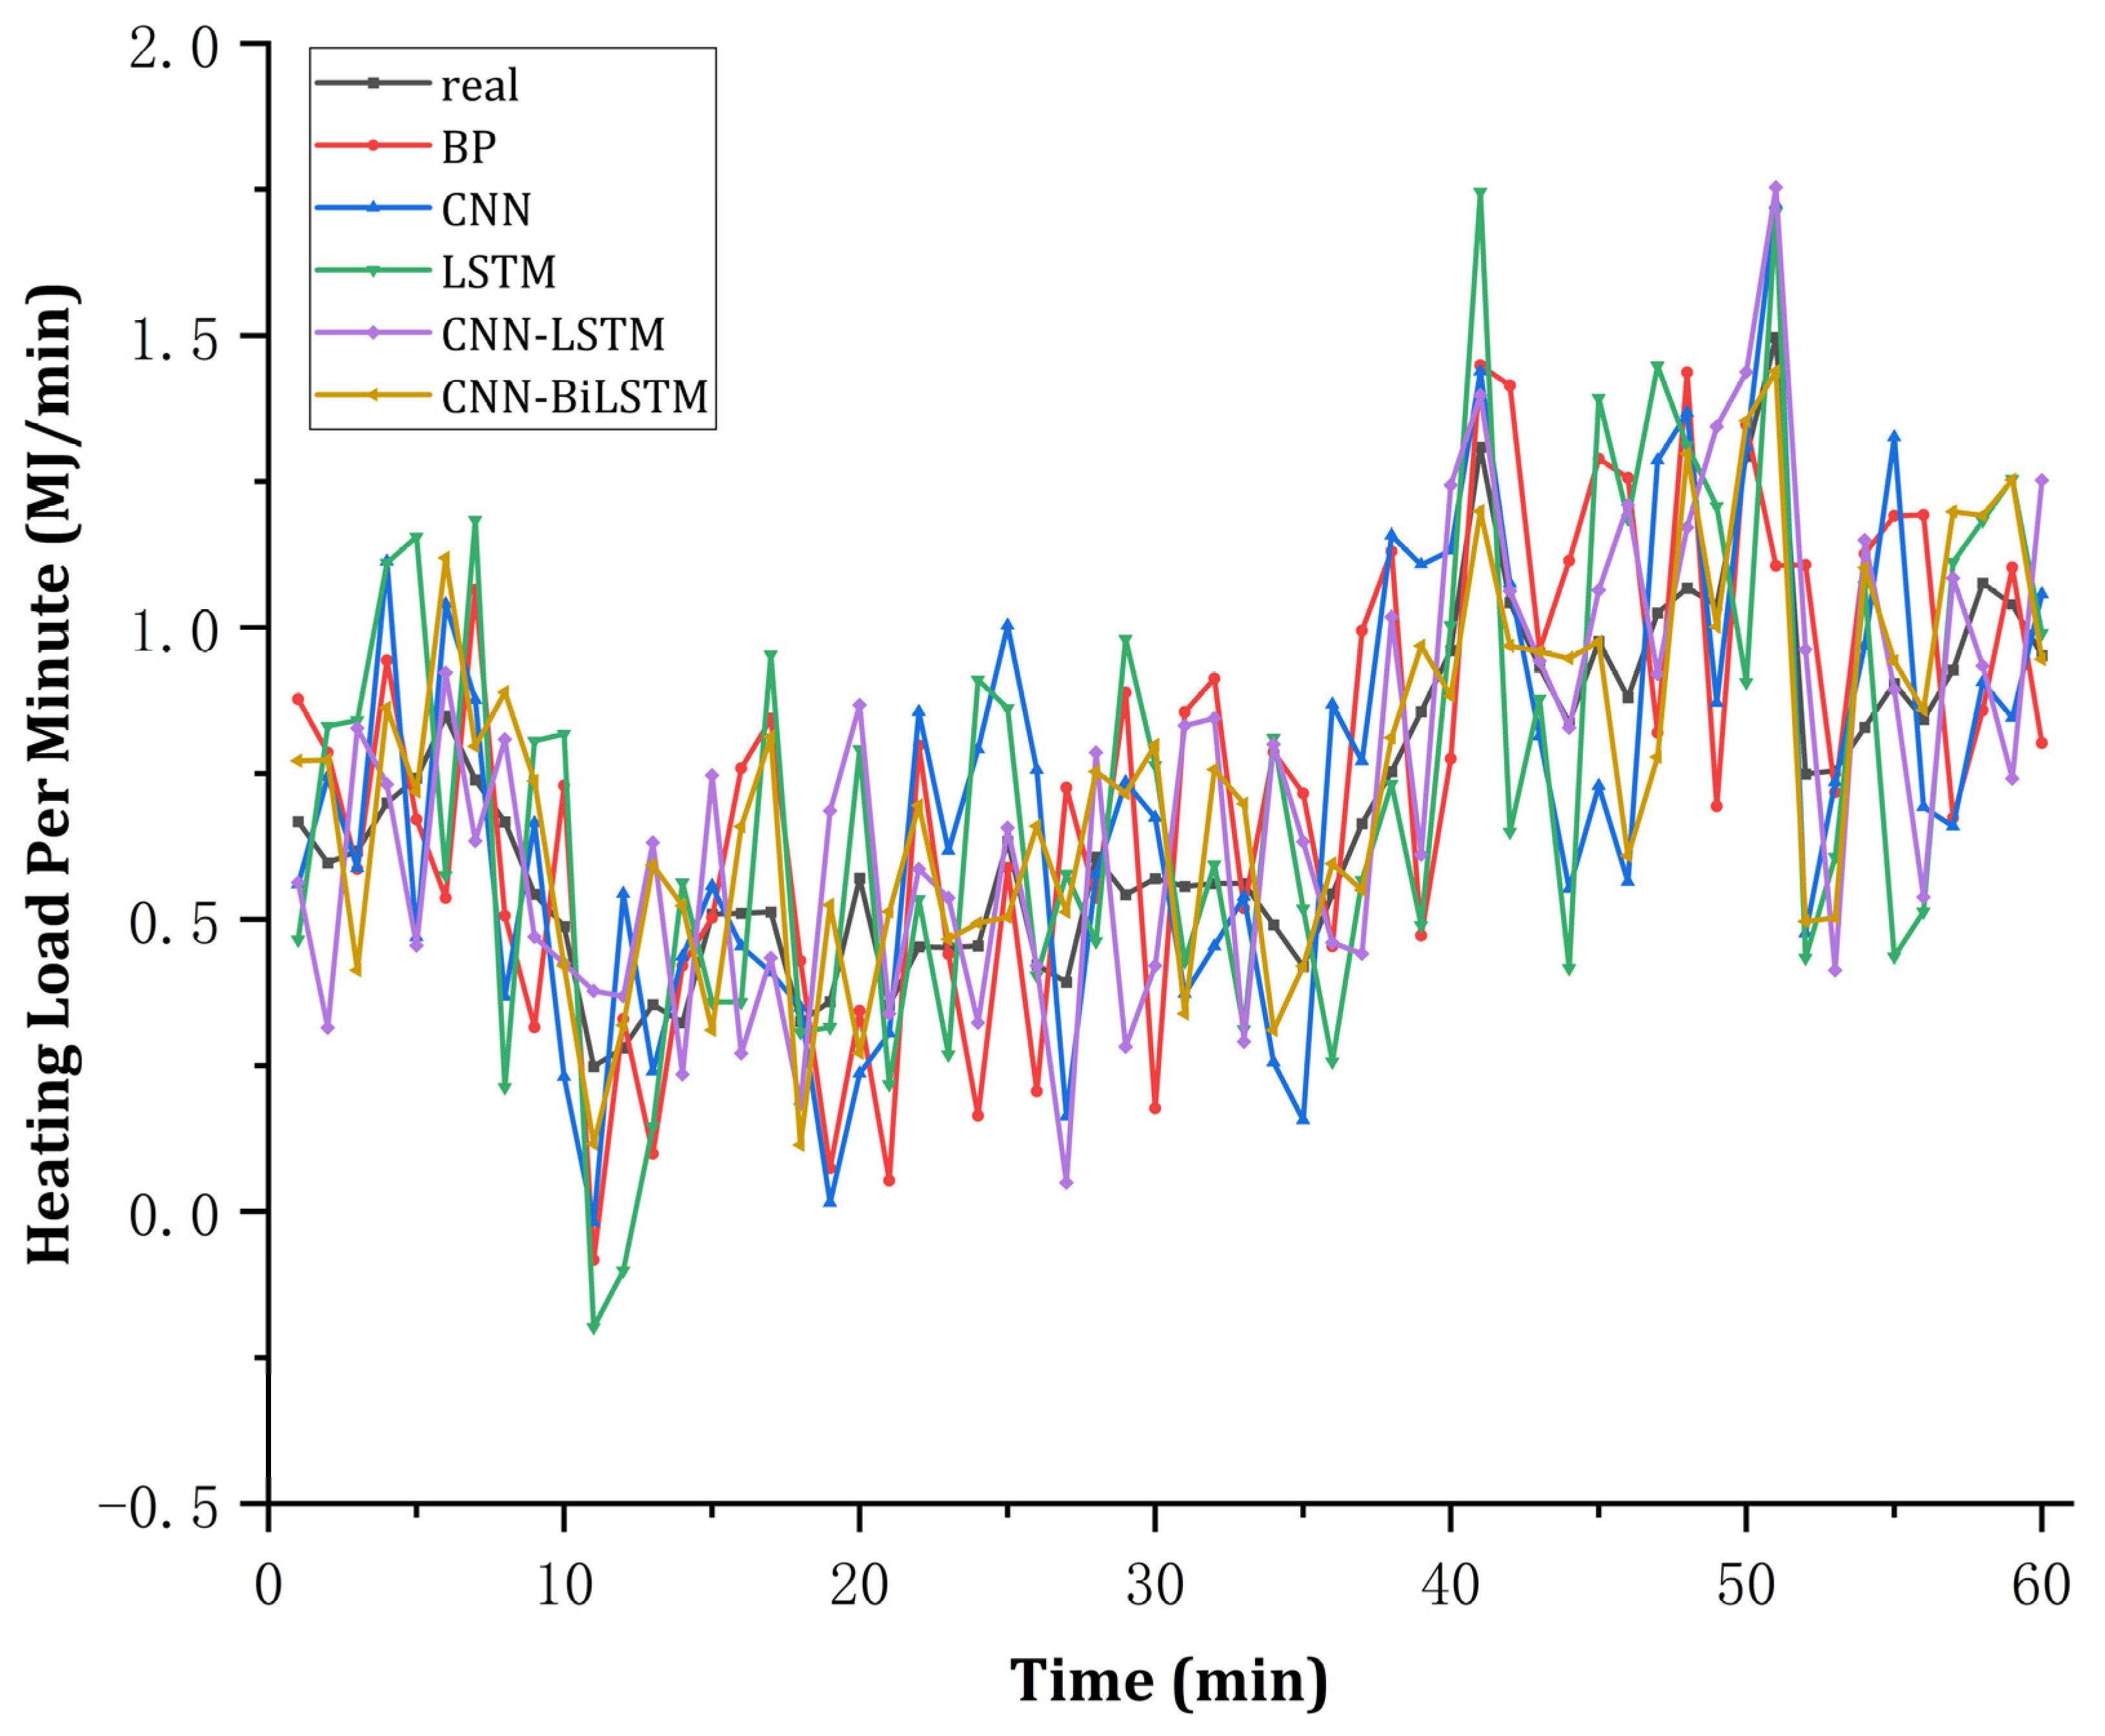
4.2.3. Ultrashort-Term Heat Load Forecast

Due to the significant short-term fluctuations in the operating parameters of the heating system, the accurate selection of variables that exert the greatest influence on the load in the ultrashort term as input feature values is crucial for the precision of load prediction. In this study, historical heat load data from one heating season, spanning from 2021 to 2022, were selected to serve as both single feature input variables and multifeature input variables for each model. Eighty percent of the data were designated for the training set, while twenty percent were allocated for the validation set. The ultrashort-term load (1 h) prediction results for each prediction model are depicted in Figure 8 and detailed in Table 5.
From Figure 8 and Table 5, it can be observed that upon comparing the five evaluation metrics of MAE, RMSE, and MAPE, the combined algorithm was identified as the optimal for ultrashort-term time series load forecasting. The ultrashort-term CNN-BiLSTM forecasting model was found to be more effective, with an MAPE of less than 2%.
The generation of the above results is analyzed as follows: Data mining is a process that discovers features from data, revealing hidden information. Clustering, an unsupervised learning method, categorizes objects within a dataset into groups with similar characteristics, thereby revealing relationships within the data. Clustering does not require data labeling, which allows for an exploratory analysis of the data structure without prior knowledge. Additionally, clustering can reduce the complexity of a dataset, thus decreasing its dimensionality and simplifying the data, which in turn makes subsequent data processing algorithms faster and more accurate. In this study, clustering was utilized in data processing for machine learning predictive analytics to reduce data dimensionality and enhance the accuracy and speed of the predictive model.
CNN-BiLSTM networks offer advantages in load forecasting. Load forecasting tasks typically involve time-series data, and CNN-BiLSTM networks can effectively capture temporal features to better model data dynamics. BiLSTM, by using bidirectional hidden states, can consider inputs at the current moment and subsequent moments simultaneously, providing a more comprehensive understanding and prediction of sequence data dependencies. CNNs employ sliding window operations in the convolutional layer to efficiently extract local features in the input sequence, which is crucial for load forecasting as load fluctuations are often linked to local features. The CNN-BiLSTM network is capable of automatically learning complex feature representations in the input sequence to capture information relevant for load forecasting based on high-dimensional features.
Consequently, the clustering algorithm can reduce the data’s dimensionality and decrease the input parameters and noise for subsequent prediction algorithms, thereby improving the speed and accuracy of these algorithms. The CNN-BiLSTM network combines the strengths of convolutional neural networks and bidirectional Long Short-Term Memory networks, enabling better extraction of temporal features, consideration of contextual information, and extraction of important local features from input sequences, which enhances the prediction performance.

5. Conclusions

The fuzzy clustering method based on the Fourier distance (FCBD-FCM) was utilized to conduct a comprehensive analysis of the multivariate factors that affect the heating load. Five predictive models, namely, BP, LSTM, CNN, CNN-LSTM, and CNN-BiLSTM, were established and applied to different phases of the heating system characterized by time-series data to facilitate on-demand heating.
The conclusions drawn from the study are as follows:
1. The influencing factors were categorized into three distinct groups using the Fourier distance fuzzy clustering (FCBD-FCM) method. Factors that exerted a more significant impact on load variation were identified and subsequently utilized as input variables for subsequent load predictions.
2. The BP, LSTM, CNN, CNN-LSTM, and CNN-BiLSTM predictive models were constructed. These models employed the six most influential variables on the heating load as inputs to forecast the heat load. The findings indicated that the CNN-BiLSTM model outperformed the other four models. The MAE values for CNN-BiLSTM model in long-term, short-term and ultrashort-term load forecasting were 3.786, 2.2546, and 1.691, the RMSE values were 4.664, 2.954, and 1.966, the MAPE values were 1.272%, 2.09%, and 0.737%, and the R2 values were 0.8821, 0.9469, and 0.9764.

Author Contributions

The research presented in this paper was a collaborative effort made by all the authors. All the authors contributed to the literature review, methodology, implementation and experimental analyses, as well as to the writing and reviewing of the paper. All authors have read and agreed to the published version of the manuscript.

Funding

The authors appreciated the funds of the National Natural Science Foundation of China (No. 52278119).

Data Availability Statement

The data that support the findings of this study are available on request.

Conflicts of Interest

The authors declare no conflicts of interest.

References

  1. Gong, M.; Werner, S. An assessment of district heating research in China. Renew. Energy 2015, 84, 97–105. [Google Scholar] [CrossRef]
  2. Lund, H.; Duic, N.; Østergaard, P.A.; Mathiesen, B.V. Smart energy systems and 4th generation district heating. Energy 2016, 110, 1–4. [Google Scholar] [CrossRef]
  3. Lund, H.; Werner, S.; Wiltshire, R.; Svendsen, S.; Thorsen, J.E.; Hvelplund, F.; Mathiesen, B.V. 4th Generation District Heating (4GDH): Integrating smart thermal grids into future sustainable energy systems. Energy 2014, 68, 1–11. [Google Scholar] [CrossRef]
  4. Noussan, M.; Jarre, M.; Poggio, A. Real operation data analysis on district heating load patterns. Energy 2017, 129, 70–78. [Google Scholar] [CrossRef]
  5. Gadd, H.; Werner, S. Heat load patterns in district heating substations. Appl. Energy 2013, 108, 176–183. [Google Scholar] [CrossRef]
  6. Lu, Y.; Tian, Z.; Peng, P.; Niu, J.; Dai, J. Identification and evaluation of operation regulation strategies in district heating substations based on an unsupervised data mining method. Energy Build. 2019, 202, 109324. [Google Scholar] [CrossRef]
  7. Zhao, H.-X.; Magoulès, F. A review on the prediction of building energy consumption. Renew. Sustain. Energy Rev. 2012, 16, 3586–3592. [Google Scholar] [CrossRef]
  8. Ahmad, A.S.; Hassan, M.Y.; Abdullah, M.P.; Rahman, H.A.; Hussin, F.; Abdullah, H.; Saidur, R. A review on applications of ANN and SVM for building electrical energy consumption forecasting. Renew. Sustain. Energy Rev. 2014, 33, 102–109. [Google Scholar] [CrossRef]
  9. Chalal, M.L.; Benachir, M.; White, M.; Shrahily, R. Energy planning and forecasting approaches for supporting physical improvement strategies in the building sector: A review. Renew. Sustain. Energy Rev. 2016, 64, 761–776. [Google Scholar] [CrossRef]
  10. Amasyali, K.; El-Gohary, N.M. A review of data-driven building energy consumption prediction studies. Renew. Sustain. Energy Rev. 2018, 81, 1192–1205. [Google Scholar] [CrossRef]
  11. Do Carmo, C.M.R.; Christensen, T.H. Cluster analysis of residential heat load profiles and the role of technical and household characteristics. Energy Build. 2016, 125, 171–180. [Google Scholar] [CrossRef]
  12. Gianniou, P.; Liu, X.; Heller, A.; Nielsen, P.S.; Rode, C. Clustering-based analysis for residential district heating data. Energy Convers. Manag. 2018, 165, 840–850. [Google Scholar] [CrossRef]
  13. Tureczek, A.M.; Nielsen, P.S.; Madsen, H.; Brun, A. Clustering district heat exchange stations using smart meter consumption data. Energy Build. 2019, 182, 144–158. [Google Scholar] [CrossRef]
  14. Yang, J.; Ning, C.; Deb, C.; Zhang, F.; Cheong, D.; Lee, S.E.; Sekhar, C.; Tham, K.W. k-Shape clustering algorithm for building energy usage patterns analysis and forecasting model accuracy improvement. Energy Build. 2017, 146, 27–37. [Google Scholar] [CrossRef]
  15. Chicco, G. Overview and performance assessment of the clustering methods for electrical load pattern grouping. Energy 2012, 42, 68–80. [Google Scholar] [CrossRef]
  16. Nikolaou, T.G.; Kolokotsa, D.S.; Stavrakakis, G.S.; Skias, I.D. On the Application of Clustering Techniques for Office Buildings’ Energy and Thermal Comfort Classification. IEEE Trans. Smart Grid 2012, 3, 2196–2210. [Google Scholar] [CrossRef]
  17. Protić, M.; Shamshirband, S.; Petković, D.; Abbasi, A.; Kiah, L.M.; Unar, J.A.; Živković, L.; Raos, M. Forecasting of consumers heat load in district heating systems using the support vector machine with a discrete wavelet transform algorithm. Energy 2015, 87, 343–351. [Google Scholar] [CrossRef]
  18. Imam, S.; A Coley, D.; Walker, I. The building performance gap: Are modellers literate? Build. Serv. Eng. Res. Technol. 2017, 38, 351–375. [Google Scholar] [CrossRef]
  19. Li, X.; Wen, J. Review of building energy modeling for control and operation. Renew. Sustain. Energy Rev. 2014, 37, 517–537. [Google Scholar] [CrossRef]
  20. Forrester, J.R.; Wepfer, W.J. Formulation of a load prediction algorithm for a large commercial building. Ashrae Trans. 1984, 90, 536–551. [Google Scholar]
  21. Zhao, H.X.; Magoulès, F. Parallel Support Vector Machines Applied to the Prediction of Multiple Buildings Energy Consumption. J. Algorithms Comput. Technol. 2010, 4, 231–249. [Google Scholar] [CrossRef]
  22. Wei, Y.; Xia, L.; Pan, S.; Wu, J.; Zhang, X.; Han, M.; Zhang, W.; Xie, J.; Li, Q. Prediction of occupancy level and energy consumption in office building using blind system identification and neural networks. Appl. Energy 2019, 240, 276–294. [Google Scholar] [CrossRef]
  23. Guo, Y.; Wang, J.; Chen, H.; Li, G.; Liu, J.; Xu, C.; Huang, R.; Huang, Y. Machine learning-based thermal response time ahead energy demand prediction for building heating systems. Appl. Energy 2018, 221, 16–27. [Google Scholar] [CrossRef]
  24. Chou, J.-S.; Bui, D.-K. Modeling heating and cooling loads by artificial intelligence for energy-efficient building design. Energy Build. 2014, 82, 437–446. [Google Scholar] [CrossRef]
  25. Fan, C.; Xiao, F.; Wang, S. Development of prediction models for next-day building energy consumption and peak power demand using data mining techniques. Appl. Energy 2014, 127, 1–10. [Google Scholar] [CrossRef]
  26. Edwards, R.E.; New, J.; Parker, L.E. Predicting future hourly residential electrical consumption: A machine learning case study. Energy Build. 2012, 49, 591–603. [Google Scholar] [CrossRef]
  27. Massana, J.; Pous, C.; Burgas, L.; Melendez, J.; Colomer, J. Short-term load forecasting in a non-residential building contrasting models and attributes. Energy Build. 2015, 92, 322–330. [Google Scholar] [CrossRef]
  28. Li, Y.; Tong, Z.; Tong, S.; Westerdahl, D. A data-driven interval forecasting model for building energy prediction using attention-based LSTM and fuzzy information granulation. Sustain. Cities Soc. 2022, 76, 103481. [Google Scholar] [CrossRef]
  29. Wang, Z.; Hong, T.; Piette, M.A. Building thermal load prediction through shallow machine learning and deep learning. Appl. Energy 2020, 263, 114683. [Google Scholar] [CrossRef]
  30. Idowu, S.; Saguna, S.; Åhlund, C.; Schelén, O. Applied machine learning: Forecasting heat load in district heating system. Energy Build. 2016, 133, 478–488. [Google Scholar] [CrossRef]
  31. Dalipi, F.; Yayilgan, S.Y.; Gebremedhin, A. Data-Driven Machine-Learning Model in District Heating System for Heat Load Prediction: A Comparison Study. Appl. Comput. Intell. Soft Comput. 2016, 2016, 1–11. [Google Scholar] [CrossRef]
  32. Ding, Y.; Zhang, Q.; Yuan, T.; Yang, F. Effect of input variables on cooling load prediction accuracy of an office building. Appl. Therm. Eng. 2018, 128, 225–234. [Google Scholar] [CrossRef]
  33. Ahmad, T.; Chen, H.; Guo, Y.; Wang, J. A comprehensive overview on the data driven and large scale based approaches for forecasting of building energy demand: A review. Energy Build. 2018, 165, 301–320. [Google Scholar] [CrossRef]
  34. Li, Q.; Meng, Q.; Cai, J.; Yoshino, H.; Mochida, A. Applying support vector machine to predict hourly cooling load in the building. Appl. Energy 2009, 86, 2249–2256. [Google Scholar] [CrossRef]
  35. Wang, Z.; Hong, T.; Piette, M.A. Data fusion in predicting internal heat gains for office buildings through a deep learning approach. Appl. Energy 2019, 240, 386–398. [Google Scholar] [CrossRef]
  36. Lee, W.-Y.; House, J.M.; Kyong, N.-H. Subsystem level fault diagnosis of a building’s air-handling unit using general regression neural networks. Appl. Energy 2004, 77, 153–170. [Google Scholar] [CrossRef]
  37. Du, Z.; Fan, B.; Jin, X.; Chi, J. Fault detection and diagnosis for buildings and HVAC systems using combined neural networks and subtractive clustering analysis. J. Affect. Disord. 2014, 73, 1–11. [Google Scholar] [CrossRef]
  38. Du, Z.; Fan, B.; Chi, J.; Jin, X. Sensor fault detection and its efficiency analysis in air handling unit using the combined neural networks. Energy Build. 2014, 72, 157–166. [Google Scholar] [CrossRef]
  39. Zhao, Y.; Wang, S.; Xiao, F. A system-level incipient fault-detection method for HVAC systems. HVAC&R Res. 2013, 19, 593–601. [Google Scholar] [CrossRef]
  40. Li, G.; Hu, Y.; Chen, H.; Li, H.; Hu, M.; Guo, Y.; Liu, J.; Sun, S.; Sun, M. Data partitioning and association mining for identifying VRF energy consumption patterns under various part loads and refrigerant charge conditions. Appl. Energy 2017, 185, 846–861. [Google Scholar] [CrossRef]
  41. Xue, P.; Zhou, Z.; Fang, X.; Chen, X.; Liu, L.; Liu, Y.; Liu, J. Fault detection and operation optimization in district heating substations based on data mining techniques. Appl. Energy 2017, 205, 926–940. [Google Scholar] [CrossRef]
  42. Gadd, H.; Werner, S. Fault detection in district heating substations. Appl. Energy 2015, 157, 51–59. [Google Scholar] [CrossRef]
  43. Miller, C.; Nagy, Z.; Schlueter, A. A review of unsupervised statistical learning and visual analytics techniques applied to performance analysis of non-residential buildings. Renew. Sustain. Energy Rev. 2018, 81, 1365–1377. [Google Scholar] [CrossRef]
  44. Guo, J.; Yun, S.; Meng, Y.; He, N.; Ye, D.; Zhao, Z.; Jia, L.; Yang, L. Prediction of heating and cooling loads based on light gradient boosting machine algorithms. J. Affect. Disord. 2023, 236, 110252. [Google Scholar] [CrossRef]
  45. Miller, C.; Arjunan, P.; Kathirgamanathan, A.; Fu, C.; Roth, J.; Park, J.Y.; Balbach, C.; Gowri, K.; Nagy, Z.; Fontanini, A.D.; et al. The ASHRAE Great Energy Predictor III competition: Overview and results. Sci. Technol. Built Environ. 2020, 26, 1427–1447. [Google Scholar] [CrossRef]
  46. Prokhorenkova, L.O.; Gusev, G.; Vorobev, A.; Dorogush, A.V.; Gulin, A. CatBoost: Unbiased boosting with categorical features. Neural Inf. Process. Syst. 2018, 31, 6639–6649. [Google Scholar]
  47. Song, J.; Zhang, L.; Xue, G.; Ma, Y.; Gao, S.; Jiang, Q. Predicting hourly heating load in a district heating system based on a hybrid CNN-LSTM model. Energy Build. 2021, 243, 110998. [Google Scholar] [CrossRef]
Figure 1. Variation of heat load with outdoor temperature and solar radiation intensity.
Energies 17 04190 g001
Figure 2. Variation in heat load with outdoor wind speed.
Energies 17 04190 g002
Figure 3. Correlation of heating control valve’s opening values and heating load values over one day.
Energies 17 04190 g003
Figure 4. Flowchart summarizing the research methodology.
Energies 17 04190 g004
Figure 5. Correlation influencing factors of U- and Q-related Fourier distances.
Energies 17 04190 g005
Figure 6. Long-term load forecast results of each forecast model.
Energies 17 04190 g006
Figure 7. The short-term load forecasting of multifeature input variable.
Energies 17 04190 g007
Figure 8. The ultrashort-term load forecasting of multifeature input variable.
Energies 17 04190 g008
Table 1. Neural network model parameters.
CategoryHidden Layer Number Hidden Layer Unit Number(s)Activation
BP4256/128/64/32ReLU
CNN264/32ReLU
LSTM76Sigmoid
CNN-LSTM76ReLU and Sigmoid
CNN-BiLSTM76ReLU and Sigmoid
Table 2. FCBD-FCM clustering results.
CategoryInfluencing Factors
Cluster.1Outdoor temperature, outdoor wind speed, primary network water supply pressure, primary network return pressure, secondary network water supply pressure, secondary network return pressure
Cluster.2Primary network return water temperature, secondary network supply water temperature, secondary network return water temperature
Cluster.3Solar irradiance, valve opening degree, primary secondary network water supply temperature
Table 3. Evaluation of each prediction model.
ModelMAERMSEMAPER2
BP8.1629.4042.921%0.7710
LSTM5.7836.5981.929%0.8041
CNN6.5647.3312.531%0.7088
CNN-LSTM4.9615.6382.258%0.8278
CNN-BiLSTM3.7864.6641.272%0.8821
Table 4. Evaluation of each short-term prediction model with multiple features.
ModelMAERMSEMAPER2
BP2.9643.5727.998%0.89
LSTM3.5653.4463.671%0.898
CNN3.4133.9234.525%0.9023
CNN-LSTM2.8423.3254.509%0.9327
CNN-BiLSTM2.25462.9542.09%0.9469
Table 5. Evaluation of each ultrashort-term prediction model with multiple features.
ModelMAERMSEMAPER2
BP3.3823.8812.37%0.9084
LSTM2.8683.2711.65%0.9349
CNN3.1953.6711.747%0.918
CNN-LSTM2.1612.521.167%0.9613
CNN-BiLSTM1.6911.9660.737%0.9764
Disclaimer/Publisher’s Note: The statements, opinions and data contained in all publications are solely those of the individual author(s) and contributor(s) and not of MDPI and/or the editor(s). MDPI and/or the editor(s) disclaim responsibility for any injury to people or property resulting from any ideas, methods, instructions or products referred to in the content.

