Abstract
Electrical insulation is a critical component in electrical machines. The performance of the insulation system can be adversely affected by operating conditions that induce aging. Assessing the impact of environmental stresses is essential for predicting the failure of electrical insulation. Predicting maintenance to prevent service interruptions caused by insulation breakdown is a key objective. For type I insulating systems used in low-voltage and low-power rotating electrical machines, it has been demonstrated that partial discharges (PDs) are a contributing factor to electrical insulation breakdown. In fact, these insulating systems are not able to withstand the action of PD activity. The inception and evolution of PD activity is an indication of the poor conditions of the electrical insulating system, and this activity can be produced by the electronic power supply. The progressive reduction in partial discharge inception voltage (PDIV) is attributed to the deterioration of insulation properties induced by operational stresses. This study aims to evaluate and compare the effects of thermal stress on various types of enameled wires by collecting the PDIV values over time. In this paper, the authors analyze some particular effects of thermal stress as an aging factor. During the tests, an electrical stress was applied, which acted as a conditioning stress rather than one capable of producing degradation phenomena, as it was not high enough to initiate PD activity. In this research study, twisted pairs prepared from copper wires were evaluated. These wires were coated with various types of enamel and belonged to the thermal class of 200 °C. The samples were subjected to thermal aging tests at different temperatures. An electrical conditioning stress was also applied during all the tests and pertained to the same voltage, amplitude and frequency. The PDIV value pertaining to each sample was regularly measured to monitor its evolution over time.
1. Introduction
Electrical insulation is the protective barrier of winding conductors of the major power system equipment that protects against high temperatures. This protective layer provides electrical insulation and prevents winding conductors from electrical short circuiting. It provides resilience against electrical, thermal, chemical, environmental and mechanical stresses during long-term operation [1,2,3,4,5]. The quality and stability of enamel coating is vital for the efficient functioning and performance of the winding machines. The durability of insulation depends on its ability to prevent severe temperatures and high electric fields [6]. High-temperature enamels are used in areas such as aerospace, hermetic machines and automotive electrical machines [7,8]. The wire enamel is composed of inorganic materials or organic materials with inorganic fillers. These inorganic fillers suffer from the combined effects of thermal, electrical and environmental stresses [9,10]. PD activity depends on the surface and environmental conditions together with the material properties [11]. The failure of an insulating system is due to the partial discharge activity, which causes the breakdown of the insulation [12,13]. The most damage done to the insulation was mainly due to the lowering of the partial discharge inception voltage (PDIV) values. The decrease in PDIV values can also depend on the applied electrical and thermal stresses [14].
Currently, there is an urgent need to find enamels that are able to cope with the abovementioned stresses. The behavior of the enamel when subjected to PDIV activity can be enhanced by the introduction of nano-fillers, as they retard PD erosion [15]. The nano-filler particles bind densely on the sample surface by providing high surge resistance against the erosion [16]. There are some other factors responsible for the decrease in PDIV values that lead to the degradation of insulation. An increase in supply frequency greatly decreases the life of the insulating materials and is another factor to be considered [17]. Moreover, the relative atmospheric humidity produces a great decrease in the PDIV values since the surface conductivity increases. Furthermore, the presence of water vapor in the air boosts the electric field, and the moisture absorption by insulation layer increases the electric field between the air gaps [18]. Electrical insulation may contain miniature internal voids due to imperfections introduced during the manufacturing processes. Partial discharges induced in these voids tend to erode the insulation and start the degradation process [19].
In this paper, thermal aging experiments are performed on different twisted pair samples. Additionally, a conditioning electrical field was applied using a supply voltage with an amplitude lower than the PDIV at a constant frequency of 500 Hz. As we already discussed, the degradation of enamel insulation is related to thermal stress. Aging is a function of time and temperature, as described by Montsinger. According to him, “Every 10 degrees rise in temperature the insulation lifetime decreases by half” [20]. The connection between temperature and the rate of a chemical reaction was introduced by Dakin and Arrhenius. According to them, the “rate of chemical reaction is directly proportional to the applied temperature” [21]. The objective of this study is to evaluate the performance of various insulating enamel materials under high-temperature conditions, with a specific focus on their behavior in relation to the PDIV. The twisted pair samples are composed of copper wire enamel belonging to the thermal class of 200. The polyimide varnish can sustain severe conditions [22]. The behavior of the insulating material can be checked using the trends of the PDIV values obtained over time [23]. Each enamel has its own characteristics and response to the applied thermal stress. Finally, we will select the best insulating material among the tested ones using the trends of the PDIV values.
2. Experimental Setup
2.1. Test Circuit Configuration
The circuit, depicted in Figure 1, was specifically designed to supply voltage to the tested specimens placed inside an oven and to measure the partial discharges:
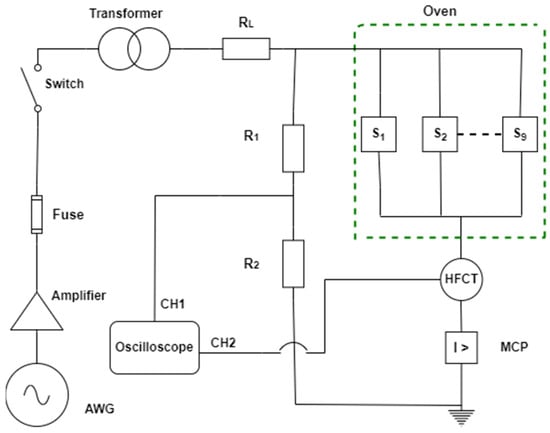
Figure 1.
Test setup.
- AWG—Arbitrary waveform generator. It allows the creation of waveforms of different types, with variable amplitude and frequency. In the case examined here, for electrical aging, a sinusoidal voltage with an amplitude of 395 VRMS, which was lower than the PDIV, and a frequency of 500 Hz was used.
- Amplifier—Variable gain amplifier.
- Fuse—It disconnects the system from the power supply in case of a fault or short circuit currents.
- A step-up high frequency transformer (with transformation ratio and rated frequency 50–1000 Hz).
- HFCT—High-frequency current transformer with a bandwidth of 5 kHz–80 MHz. It is used as a sensor to detect PDIV values.
- Oscilloscope—Digital oscilloscope in which the applied voltage and the PD activity are visualized, and the PDIV values are measured using a voltage divider (VR2/(VR1+R2); ratio, 1/560).
- RL—Limiting resistor (50 kΩ) that limits the short-circuit currents upon possible discharge of the specimen.
- Oven—The chamber where the samples are placed, which is connected in parallel under electrical and thermal stresses, as shown in Figure 2.
 Figure 2. Internal view of the oven.
 - MCP—Maximum current protection.
2.2. Twisted-Pair Specimens
The twisted-pair specimens shown in Figure 3 consist of enameled grade 2 copper wires with a 1.12 mm diameter, and all belong to the thermal class of 200. The enamel composition is as follows:
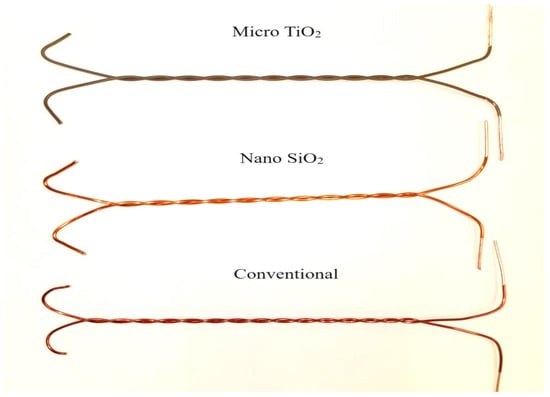
Figure 3.
Twisted-pair specimens.
- Polyester-imide (PEI) basecoat and polyamide imide (PAI) filled with a TiO2 microparticle overcoat [24], hereinafter named “micro TiO2”;
- Polyester-imide (PEI) basecoat and polyamide imide (PAI) filled with a SiO2 nanoparticle overcoat [24], hereinafter named “nano SiO2”;
- A basecoat with THEIC-polyesterimide and an overcoat of polyamide imide (PAI), a conventional enamel (no fillers) [24,25], hereinafter named “Conventional”.
The specimens were prepared in accordance with the IEC 60851-5:2009 par 4.4.1 standard [26].
Before each test, the twisted pairs were conditioned in an oven at 60 °C for 24 h to avoid any trace of moisture and to standardize their initial conditions. The test configuration with respect to the applied temperatures and materials involved in test are listed in Table 1.

Table 1.
Test configurations.
2.3. Test Procedure
Tests were conducted on nine samples in parallel (S1, S2, S3…S9, depicted in Figure 1 and shown in Figure 2) that were placed inside the oven. Five different temperature levels were considered: 200 °C, 220 °C, 230 °C, 240 °C and 250 °C. The twisted pairs placed in the oven were continuously subjected to the selected temperature level and to a sinusoidal voltage with a frequency of 500 Hz and an amplitude of 395 Vrms. As already stated, this voltage amplitude was chosen based on preliminary tests and was lower than the lowest PDIV. To measure the PDIV of each specimen, only one twisted pair was energized at a time, and the power supply was temporarily disconnected from the other specimens. An increasing sinusoidal voltage with a frequency of 500 Hz was applied to the specimen until partial discharges appeared on the oscilloscope screen and were detected by the HFCT. Each PDIV measurement was repeated three times per specimen. After completing the PDIV measurements on all nine specimens, they were all powered on again to continue the aging process. The PDIV was measured regularly over time.
3. Results
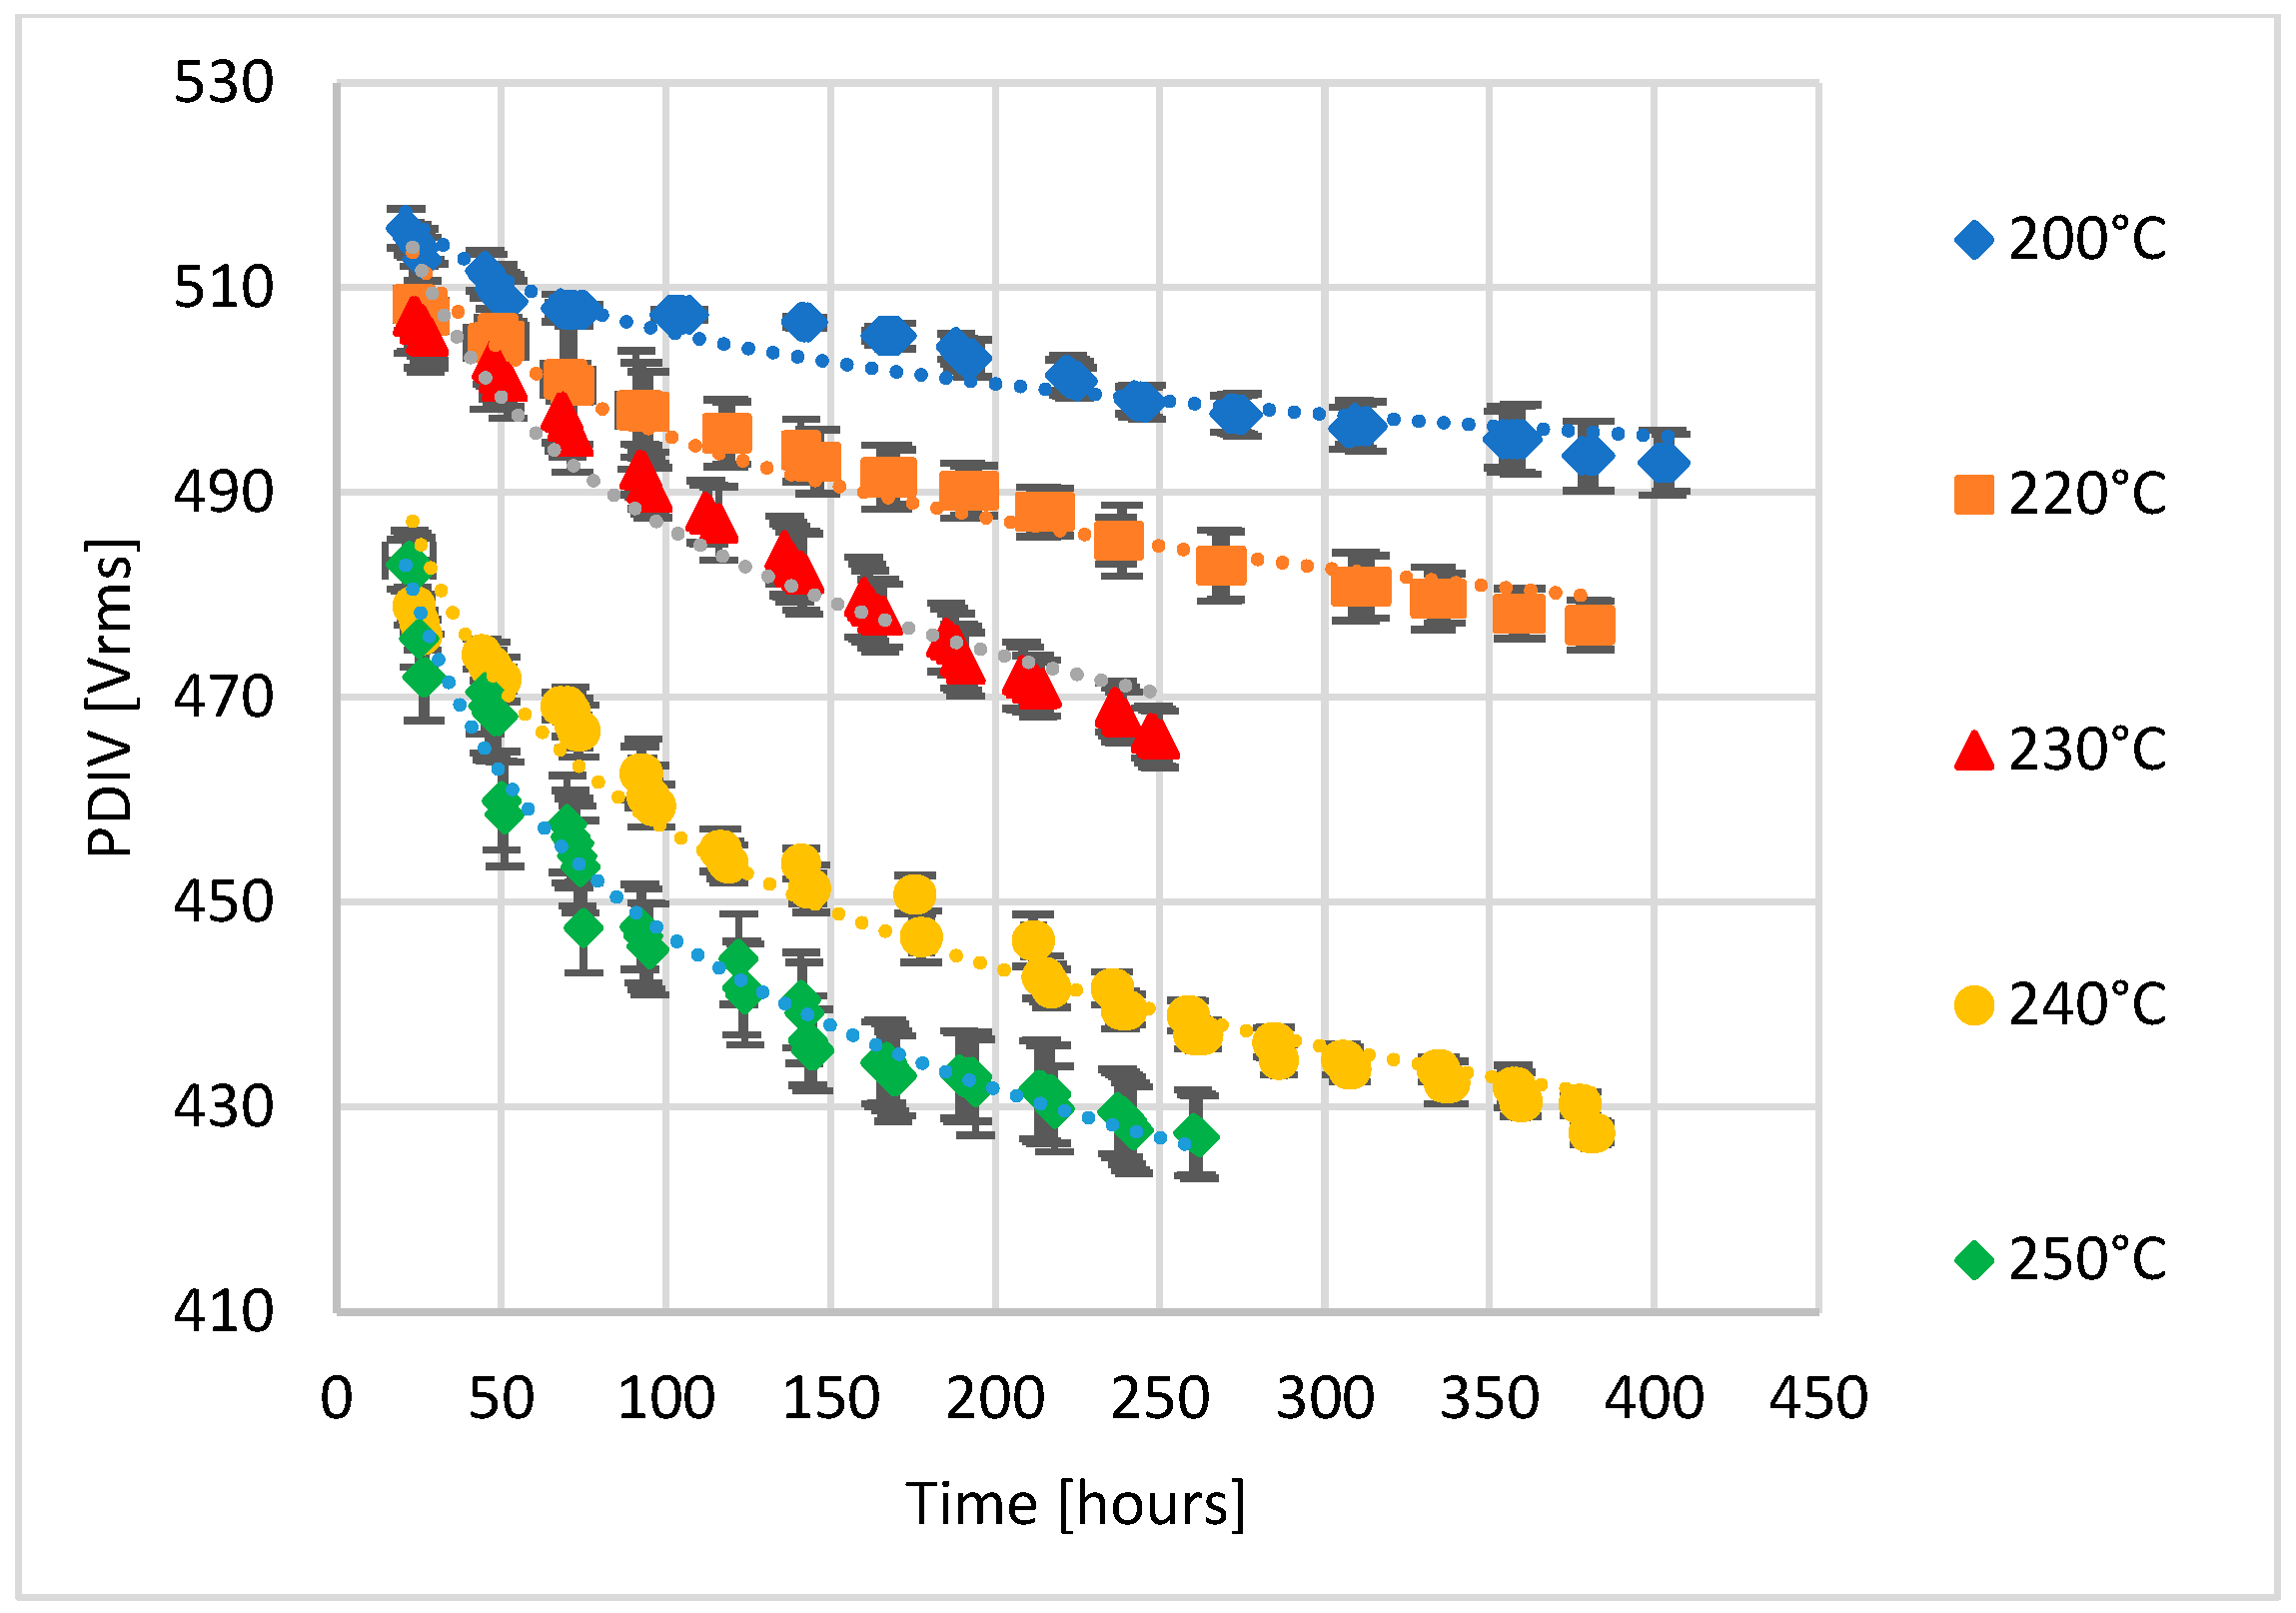
The obtained PDIV values are summarized in the following plots. Each reported point is computed as the average of the results obtained for the three samples of each material and test condition. Figure 4, Figure 5 and Figure 6 illustrate the temporal evolution of the average PDIV for three types of enamel: Conventional enamel, enamel micro-filled with TiO2 particles, and enamel nano-filled with SiO2 particles, respectively.
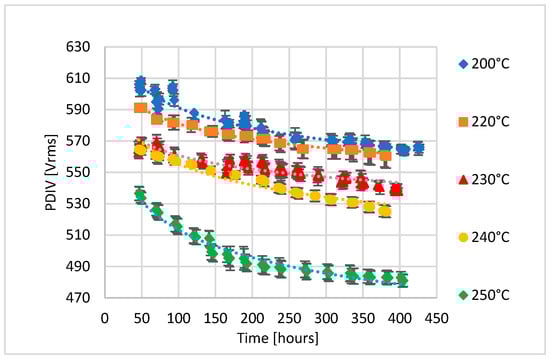
Figure 4.
The average PDIV values vs. time for Conventional enamel.
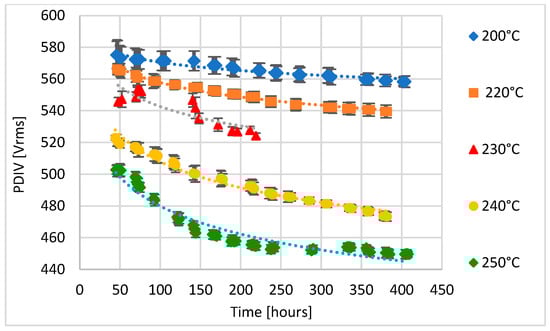
Figure 5.
The average PDIV values vs. time for enamel with TiO2 microparticles.

Figure 6.
The average PDIV values vs. time for enamel with SiO2 nanoparticles.
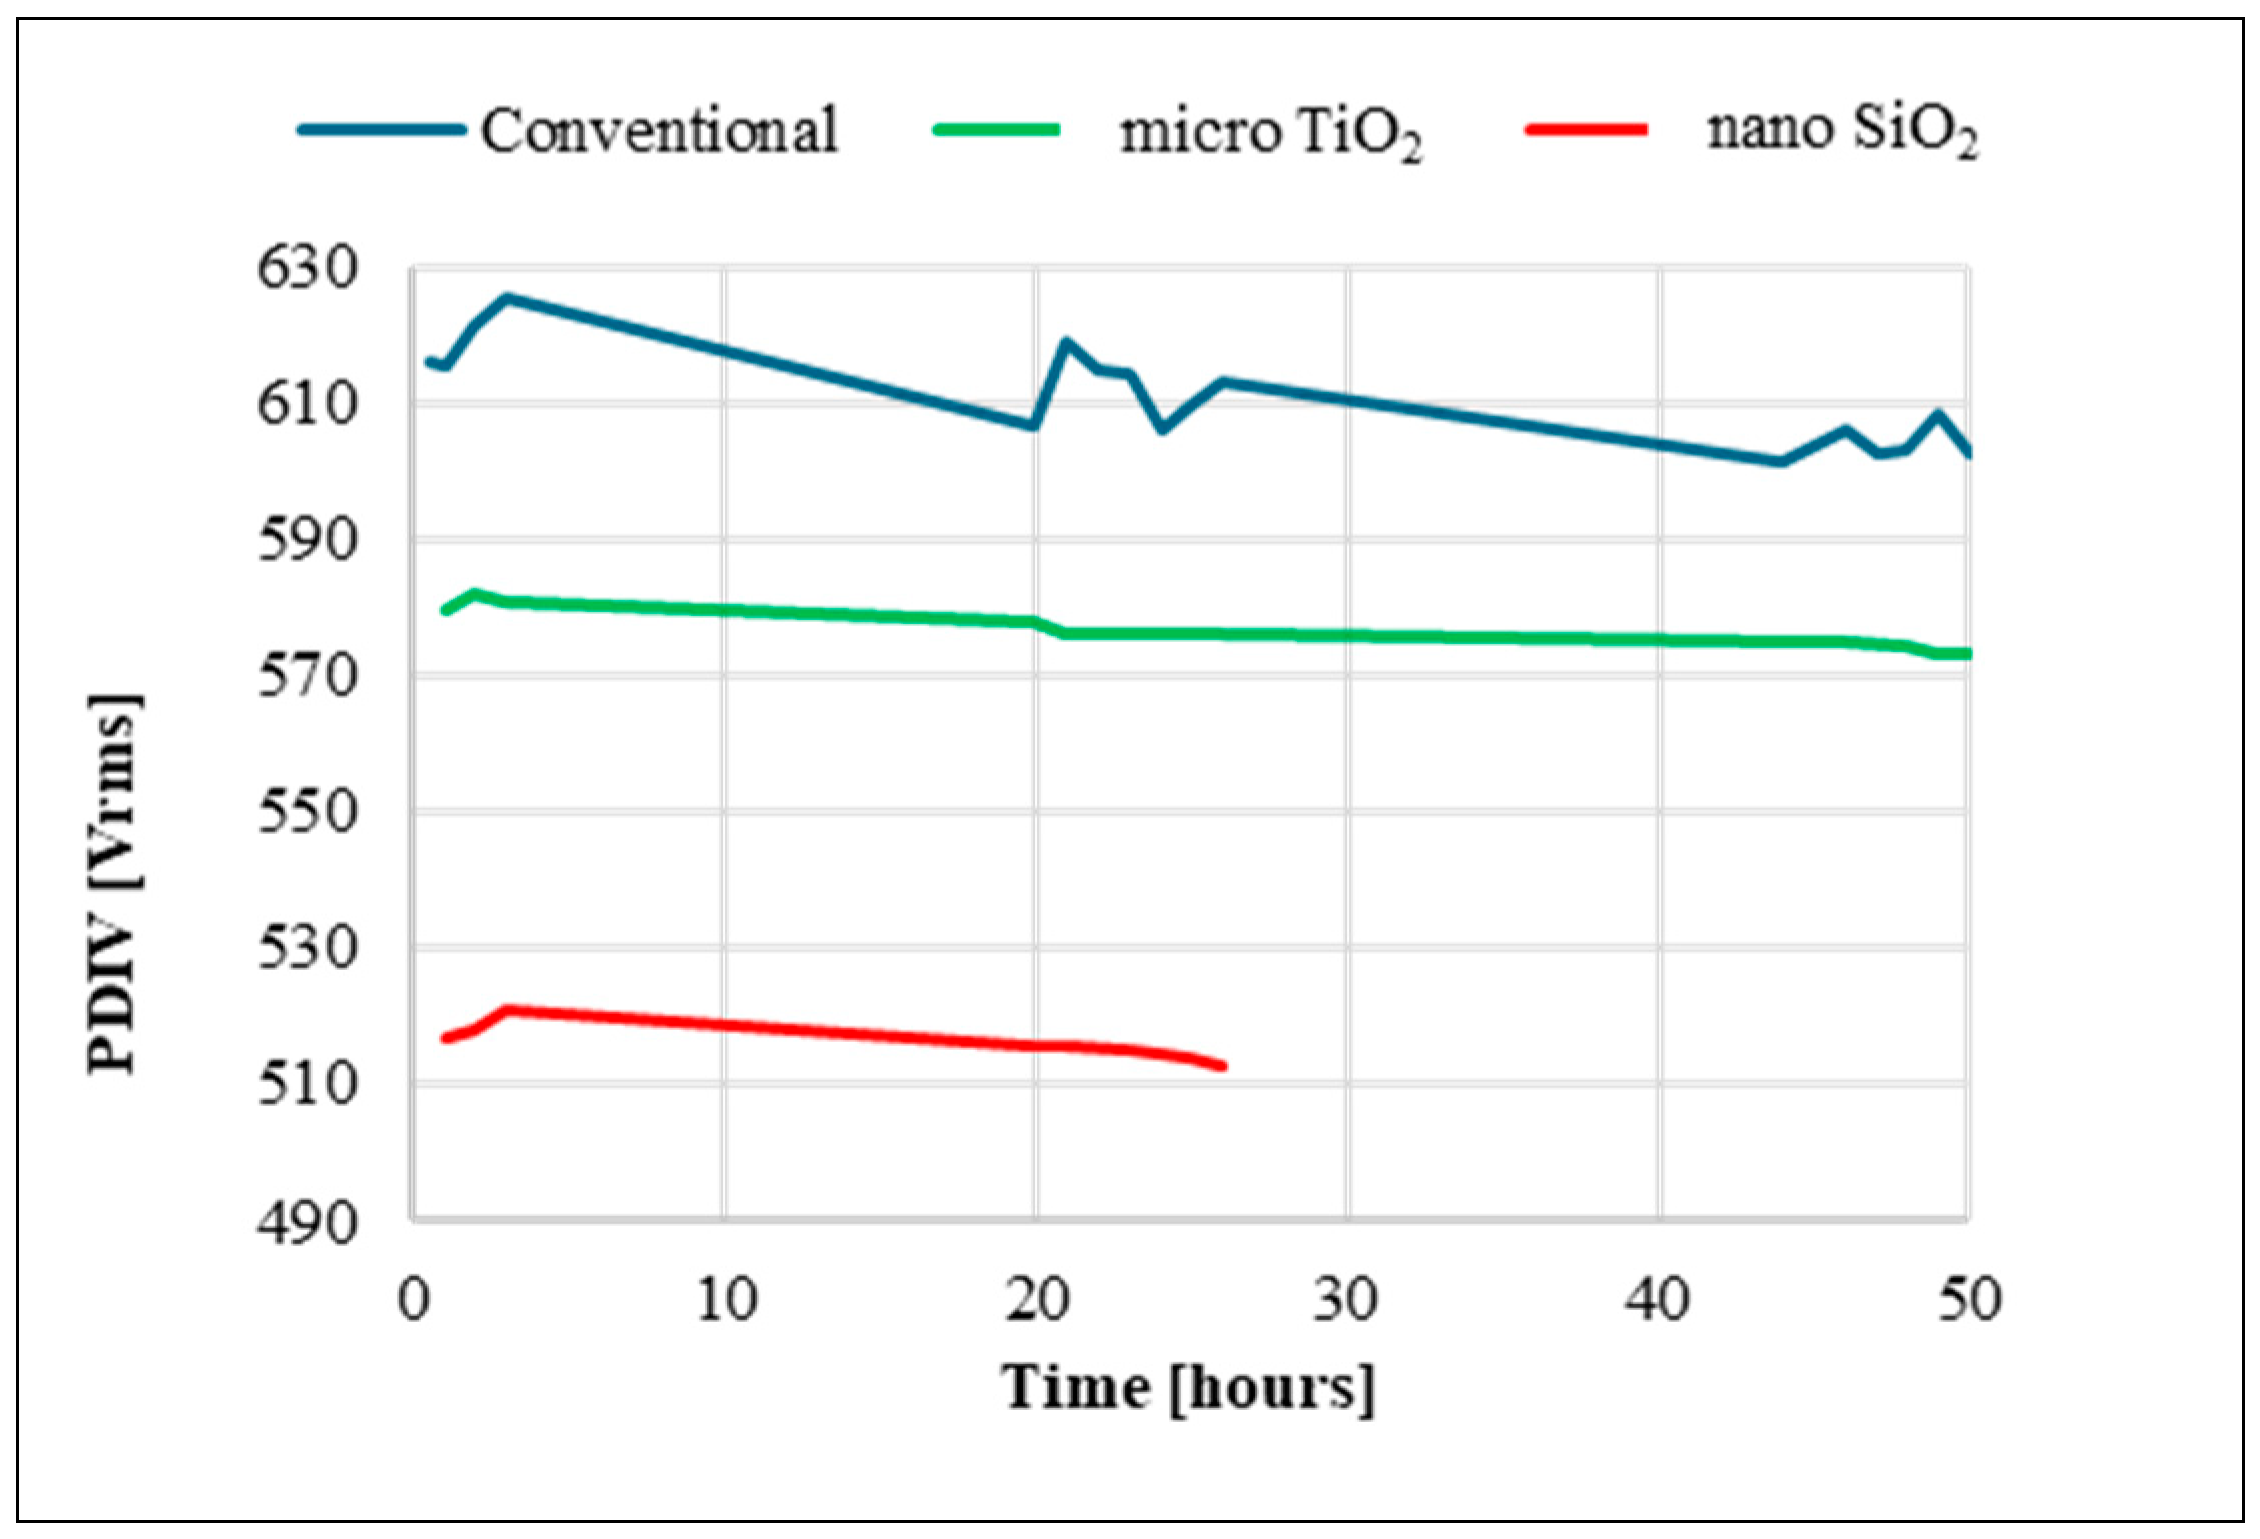
The data indicate that for both Conventional and micro-filled TiO2 enamels, there is a transient period of approximately 40–50 h under all test conditions. By contrast, the nano-filled SiO2 enamel exhibits a transient period of about 20 h. Figure 7, which focuses on the transient stage at 200 °C, shows an initial increase in PDIV values and an unstable trend for the Conventional enamel. However, for the micro-filled TiO2 and nano-filled SiO2 enamels, the PDIV values remain quite constant over time.
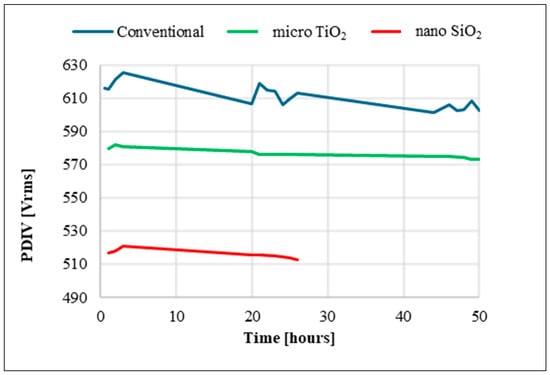
Figure 7.
Transient stage at 200 °C for the three materials.
The trend lines in Figure 4, Figure 5 and Figure 6 were traced for each material and the different temperatures considering the inverse power law shown in Equation (1).
The average PDIV is related to the experimental time tex, and K and n are two coefficients. The inverse power law coefficients, obtained via the best fitting of trend line, were reported for each material and each temperature in Table 2, Table 3 and Table 4 together with the determination factor R2. The results indicate that the Conventional enamel exhibits higher PDIV values compared to the other two materials for all considered temperatures. The nano-filled SiO2 enamel had the lowest PDIV amplitudes. These behaviors were confirmed over time during the degradation process.
Table 2.
Inverse power law coefficients and coefficients of determination for Conventional enamel.
Table 3.
Inverse power law coefficients and coefficients of determination of micro-filled TiO2 enamel.
Table 4.
Inverse power law coefficients and coefficients of determination for nano-filled SiO2 enamel.
The obtained coefficients allow for an extrapolation of the expected partial discharge inception voltage values (PDIVexp) pertaining to 1000 h and 1 year, which are reported in Table 2, Table 3 and Table 4.
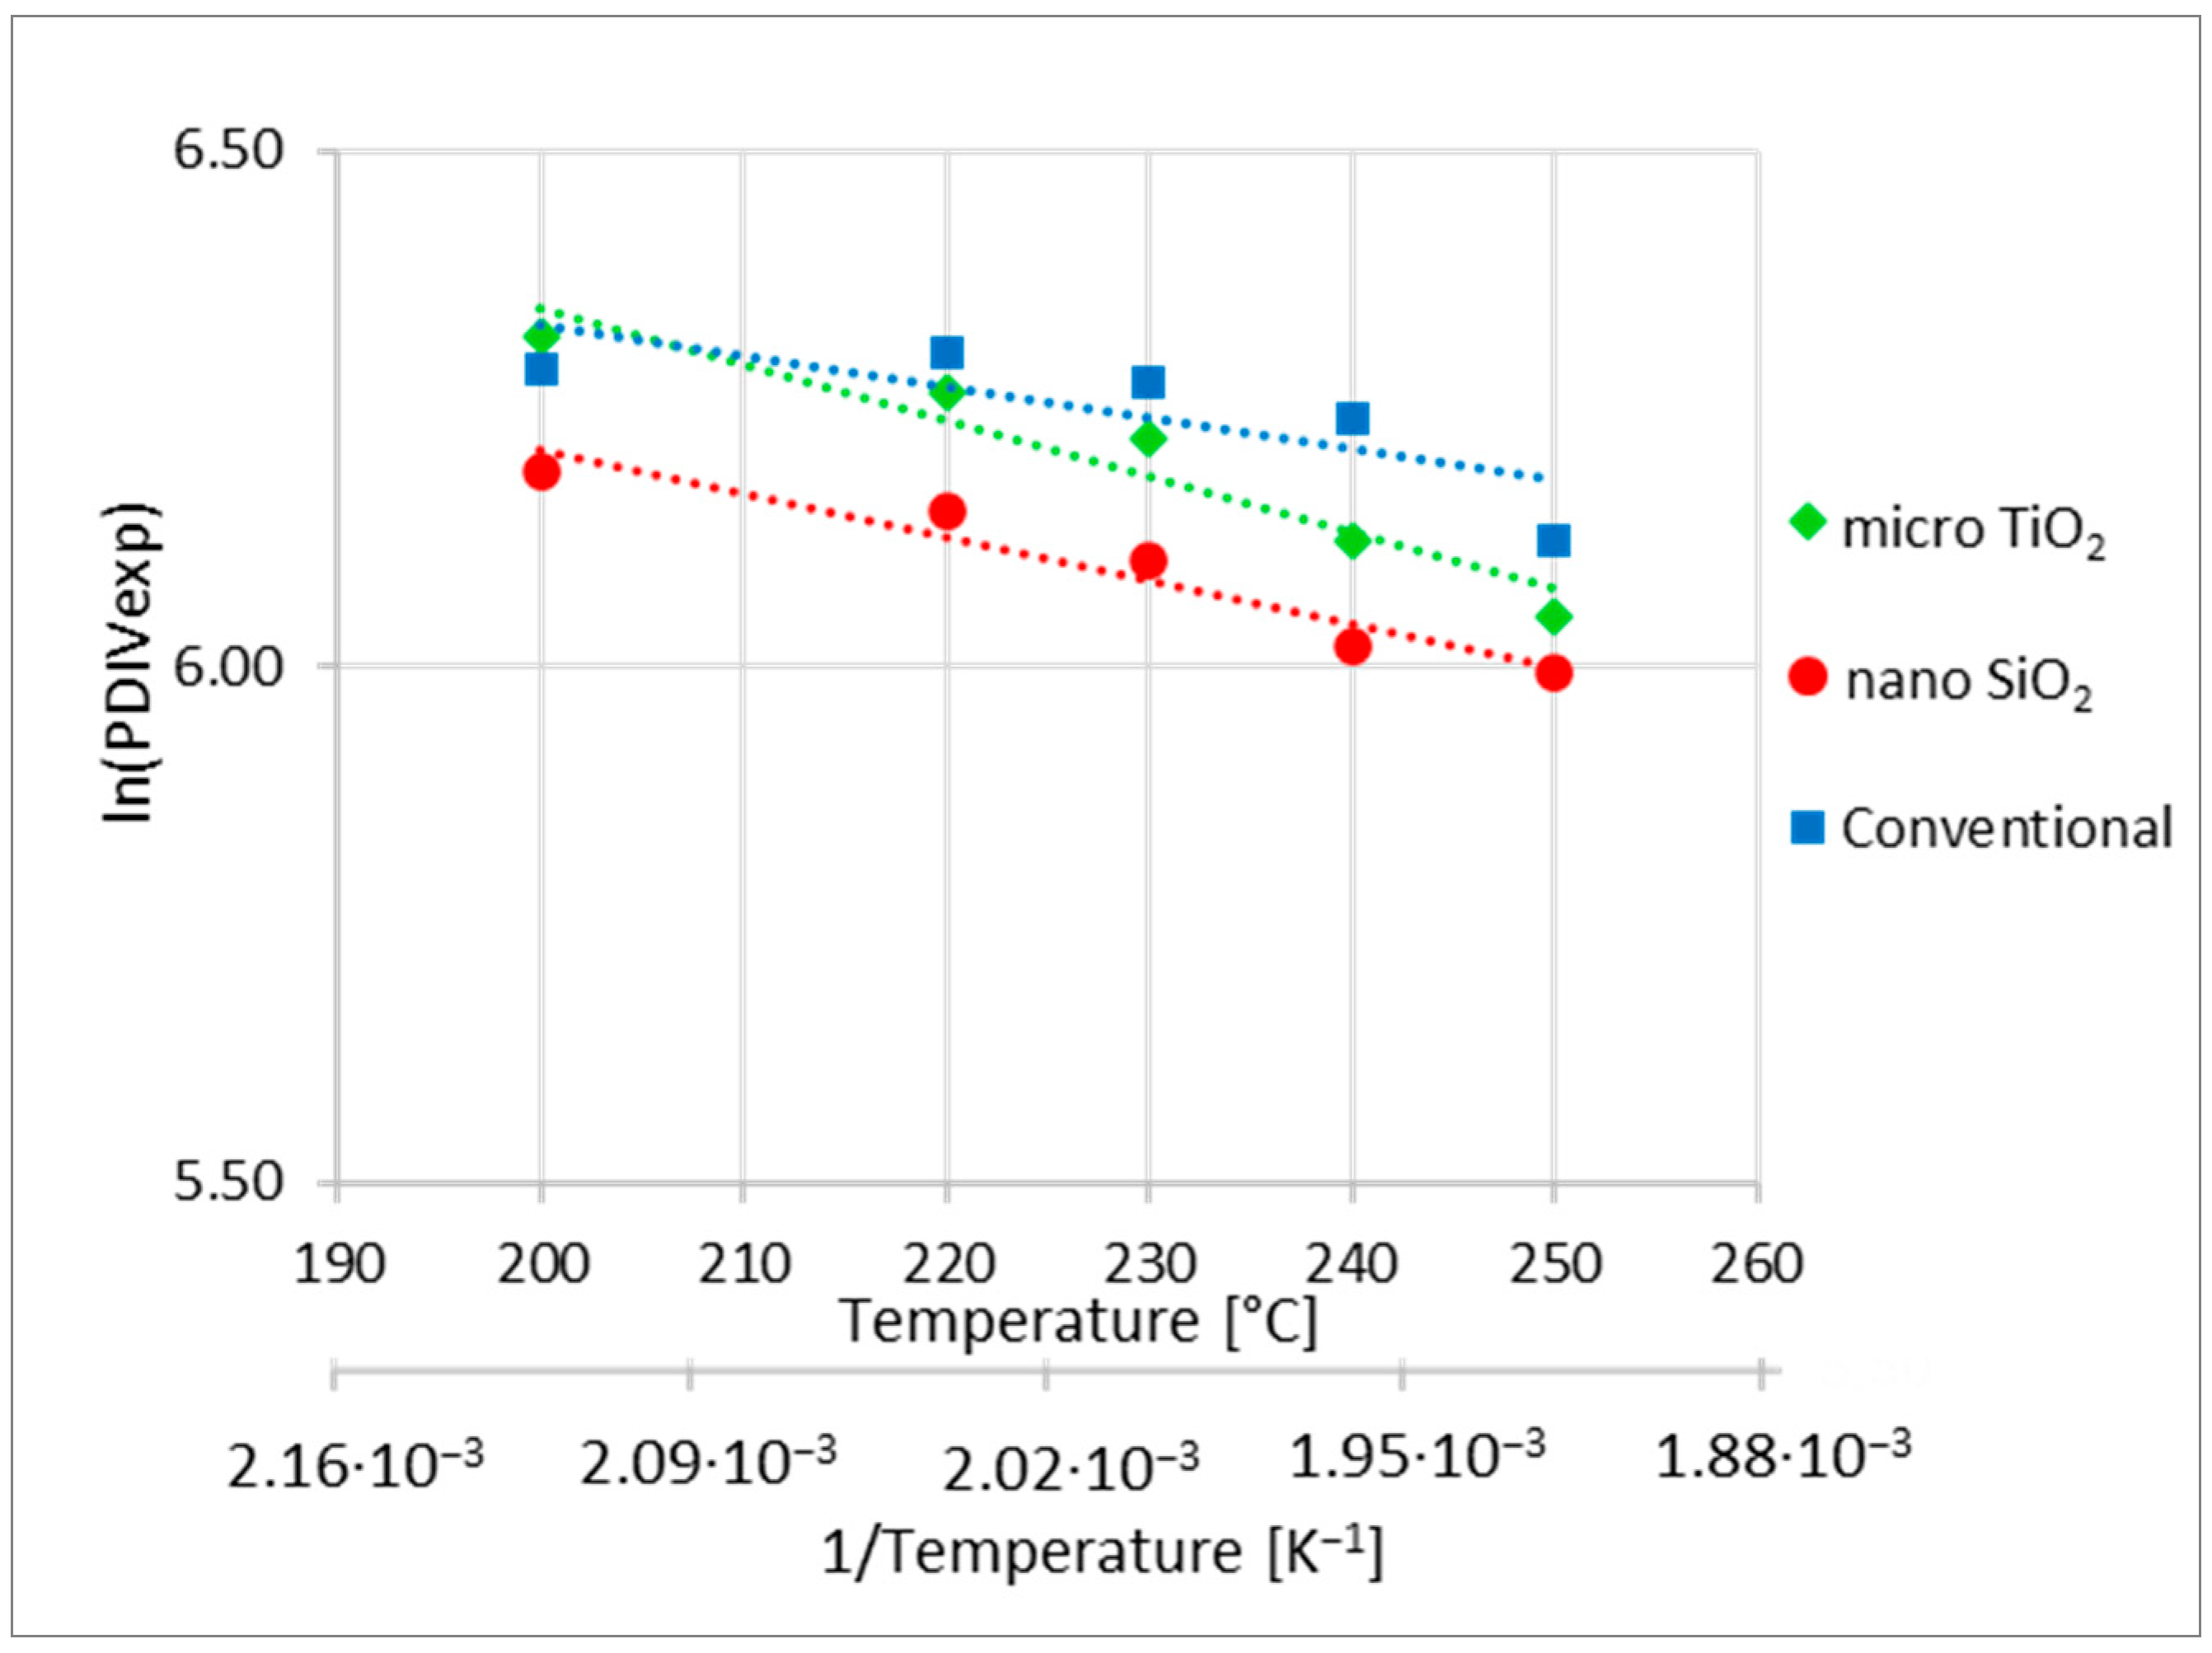
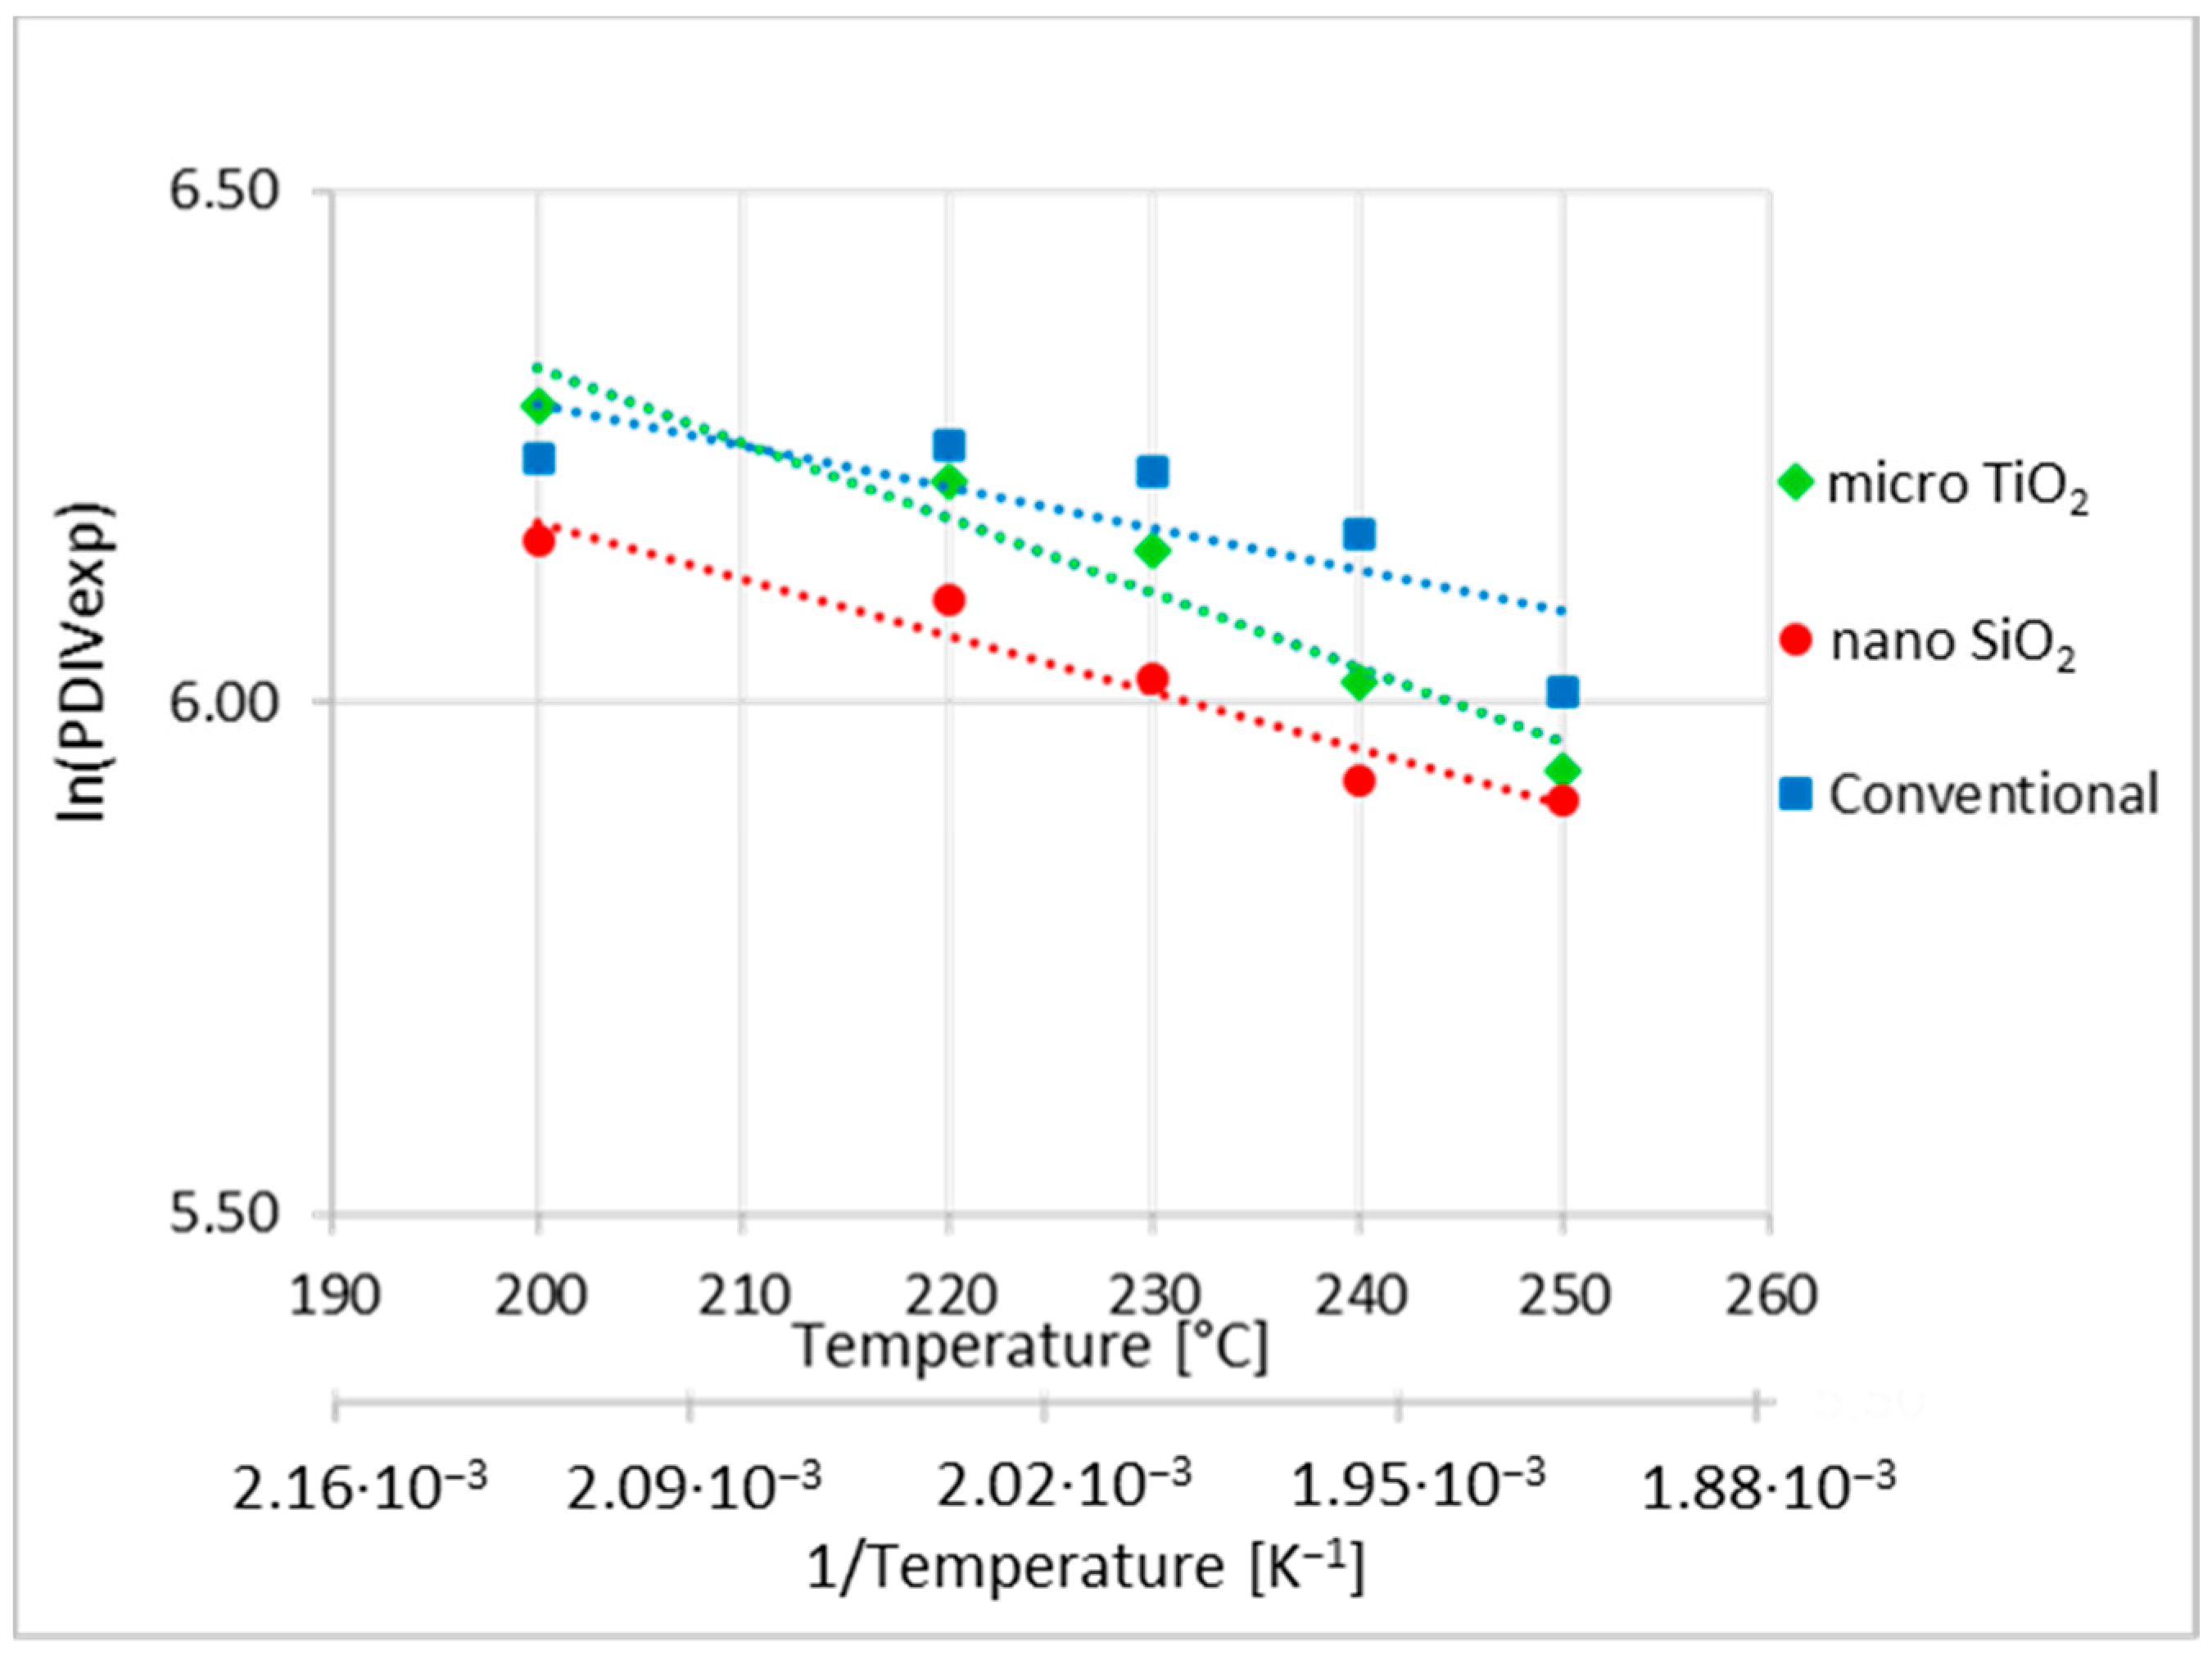
The computed PDIVexp values were calculated in relation to the test temperatures using Equation (2). This equation is written in accordance with the Arrhenius law with a consideration for the PDIVexp values instead of the aging hours. The ln(PDIVexp) values pertaining to 1000 h and 1 year versus each considered temperature were plotted in Figure 8 and Figure 9, respectively. The coefficients A and B can be obtained by means of linear regression techniques. The obtained coefficients, together with the relevant determination factor R2, are reported in Table 5 and Table 6.
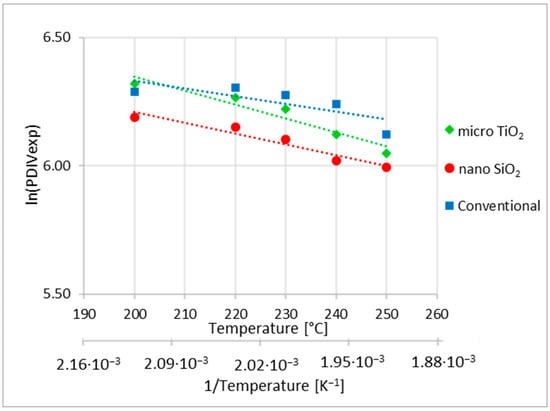
Figure 8.
Expected PDIV values after 1000 h vs. temperature.
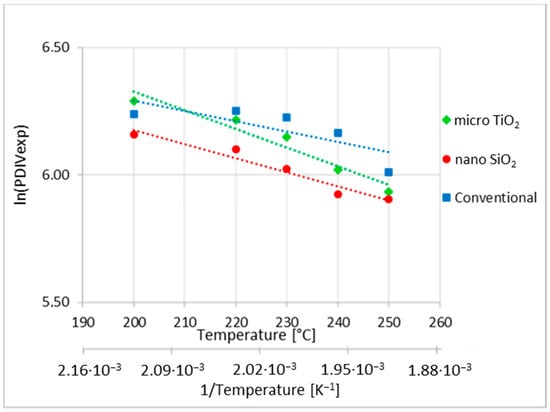
Figure 9.
Expected PDIV values after 1 year vs. temperature.
Table 5.
Coefficients of Equation (2), considering the PDIVexp after 1000 h.
Table 6.
Coefficients of Equation (2), considering the PDIVexp after 1 year.
The PDIVexp values pertaining to the micro-filled TiO2 and nano-filled SiO2 enamels are well-fitted using the relationship in Equation (2). By contrast, the Conventional enamel does not exhibit Arrhenius behavior, as it shows an increase at 220 °C compared to 200 °C, followed by a decrease, deviating from a linear trend. Nevertheless, at the thermal class temperature, the micro-filled TiO2 enamel shows the best behavior, but the Conventional enamel has the highest PDIVexp values when the temperature increases, as shown in the Figure 8 and Figure 9. It is necessary to remember that in the presence of partial discharges, the Conventional enamel has a much shorter lifetime than the micro- and nano-filled enamels [27,28].
4. Discussion
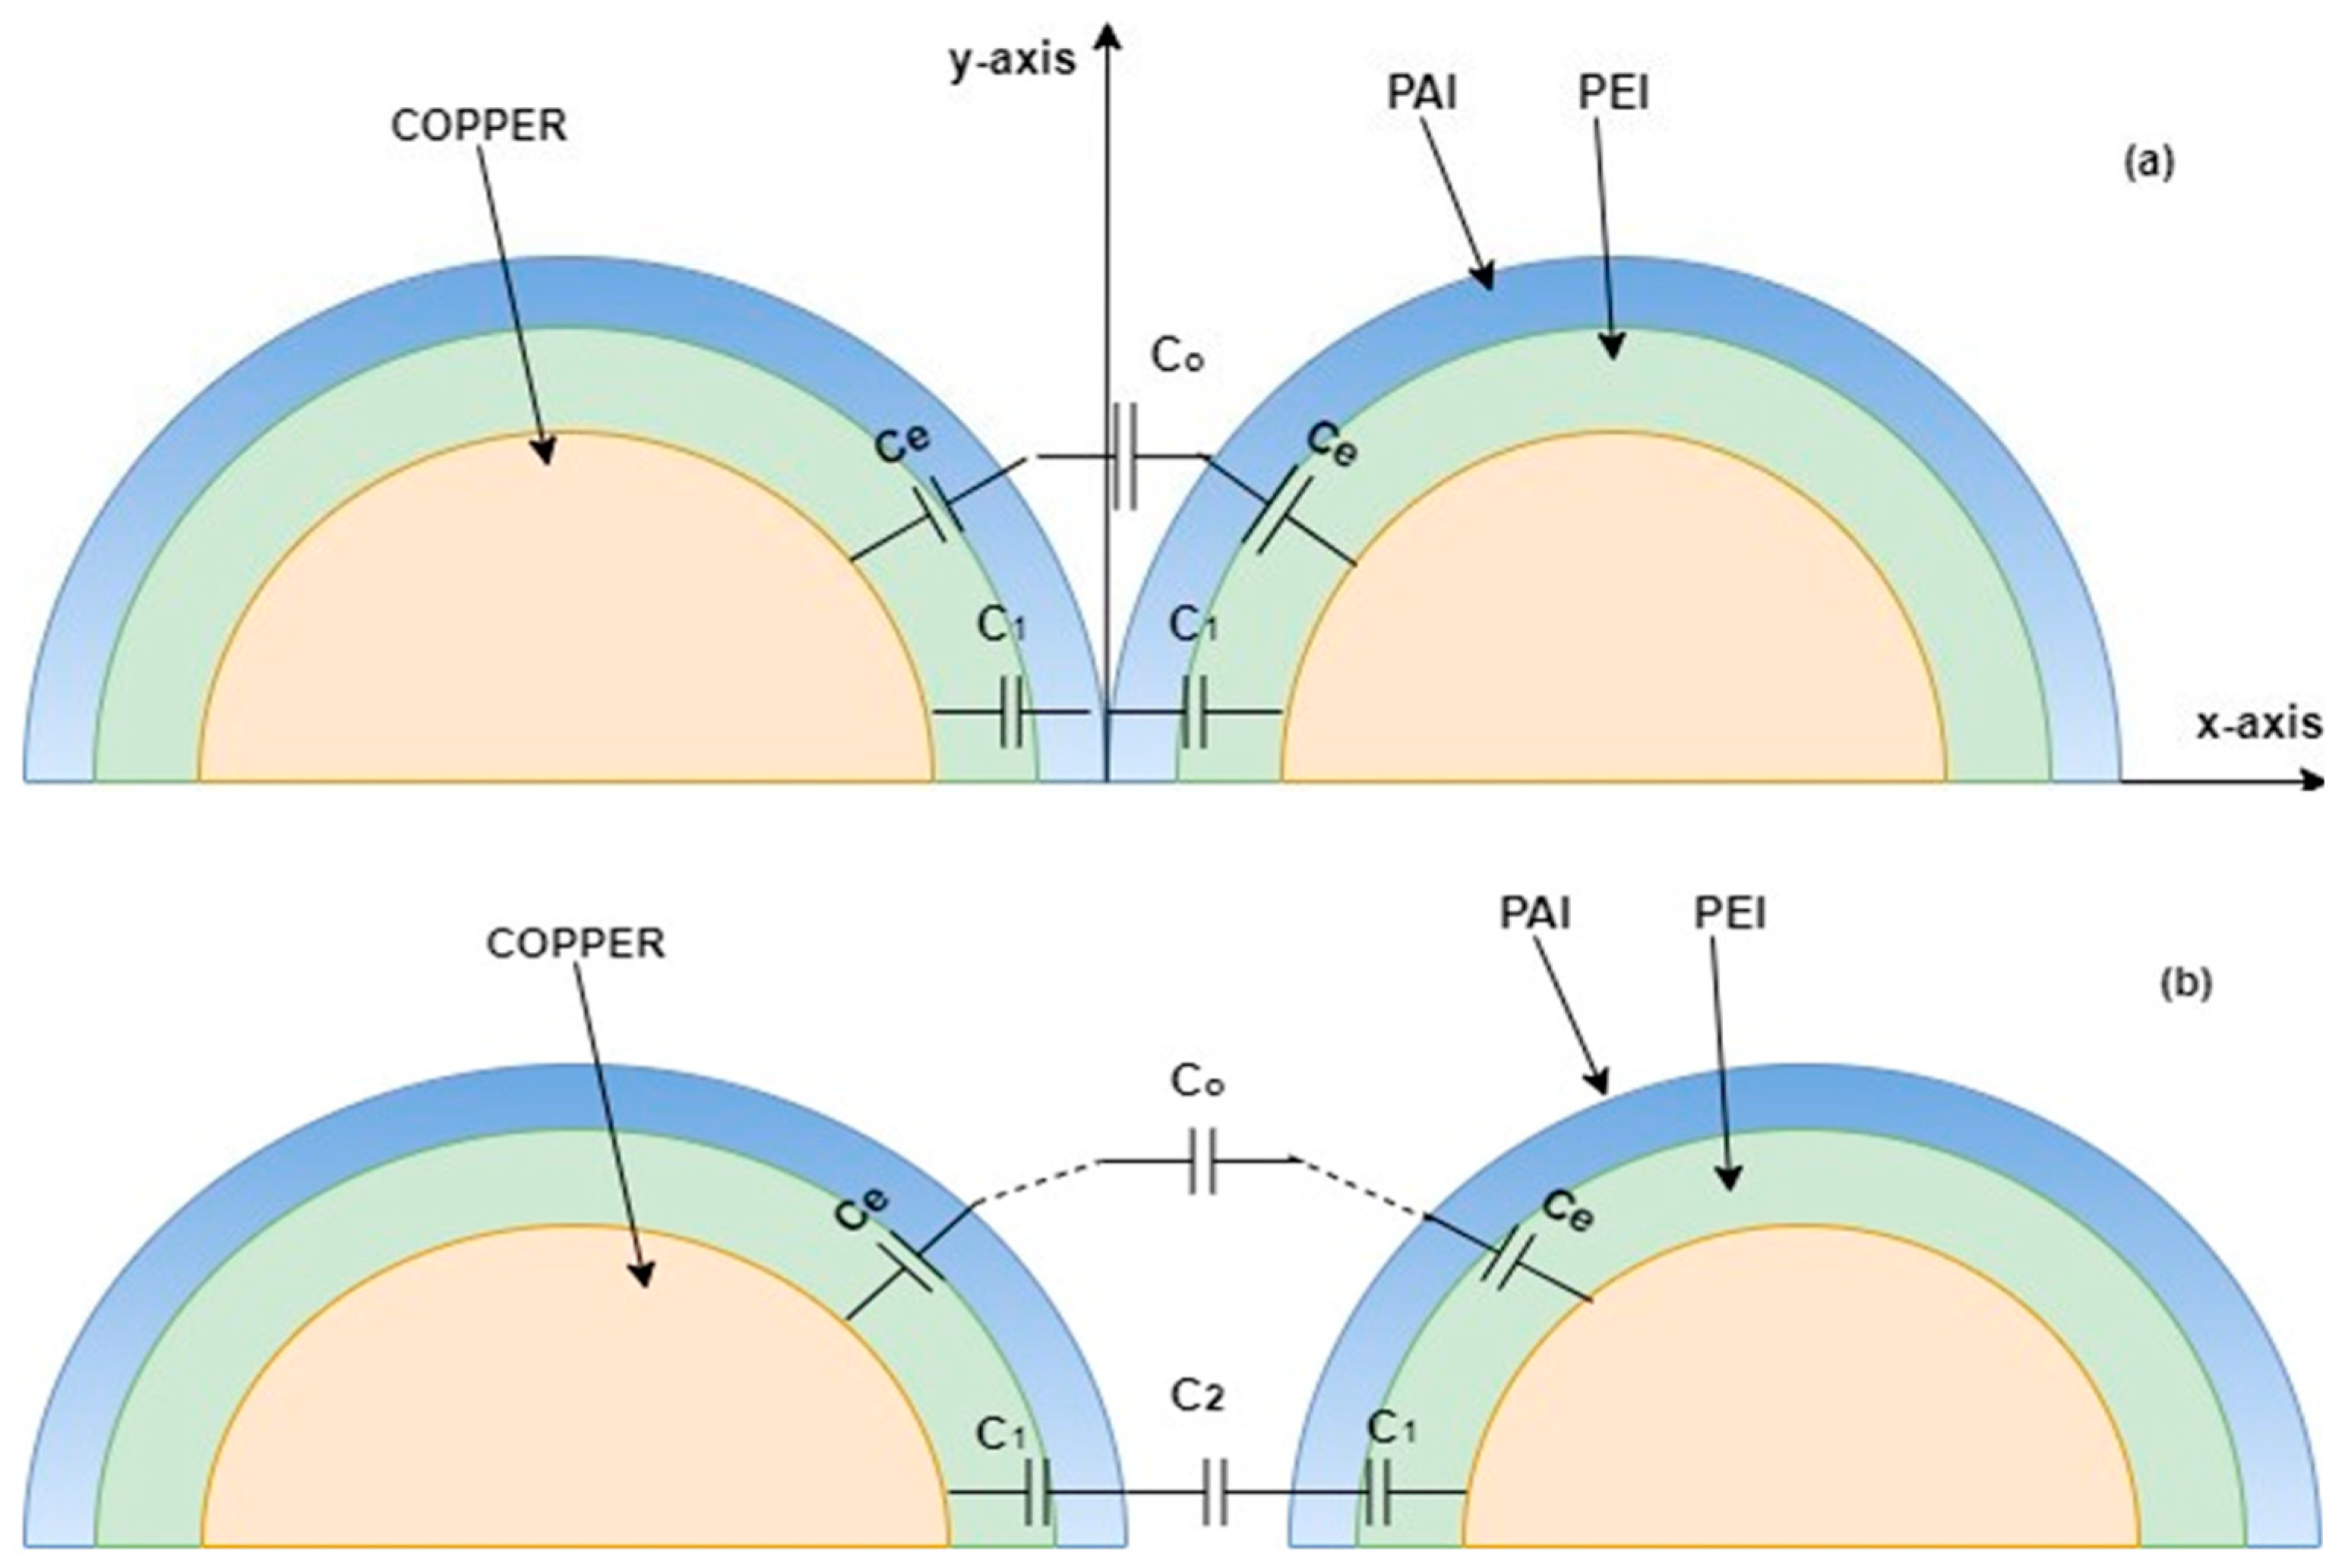
To better interpret the obtained results, DC capacitance measurements were conducted at ambient temperature on three parallel-connected samples for each material and aging temperature, following the aging process. For reference, the capacitance of three unaged twisted pairs connected in parallel were also measured. Table 7 shows the obtained results, which demonstrate that the Conventional enamel has the lowest capacitance and the nano-filled SiO2 enamel has the highest capacitance. This is consistent with the obtained PDIV values, since the highest PDIV values correspond to the highest capacitance and the lowest PDIV values correspond to the lowest capacitance value. In fact, as shown in Figure 10a,b, the electric field in the discharge area depends mainly on the ratio Ce/Co (Figure 10a) or C1/C2 (Figure 10b) as well as on the distance between the two wires. With the increase in the y value, Co decreases, and the corresponding electric field also decreases [29]. Therefore, the higher the Ce or C1 value, the higher the electric field in air and the lower the PDIV value. The higher capacitance values of micro-filled TiO2 enamel and nano-filled SiO2 enamel compared to the Conventional enamel depends on the nature of the two fillers and on the material structure.
Table 7.
DC capacitance values, measured at 25 °C, of three twisted pairs connected in parallel after aging.

Figure 10.
Insulation model of basecoat and overcoat. (a) Wires connected; (b) wires disconnected.
Some research studies [30,31] suggested that the thickness of the enamel layer decreases over time with thermal aging. Other authors showed that the permittivity (εr) increases slightly over time at a constant temperature [32,33]. Also, the conductivity (σ) and the dissipation factor (tanδ) increase over time [34].
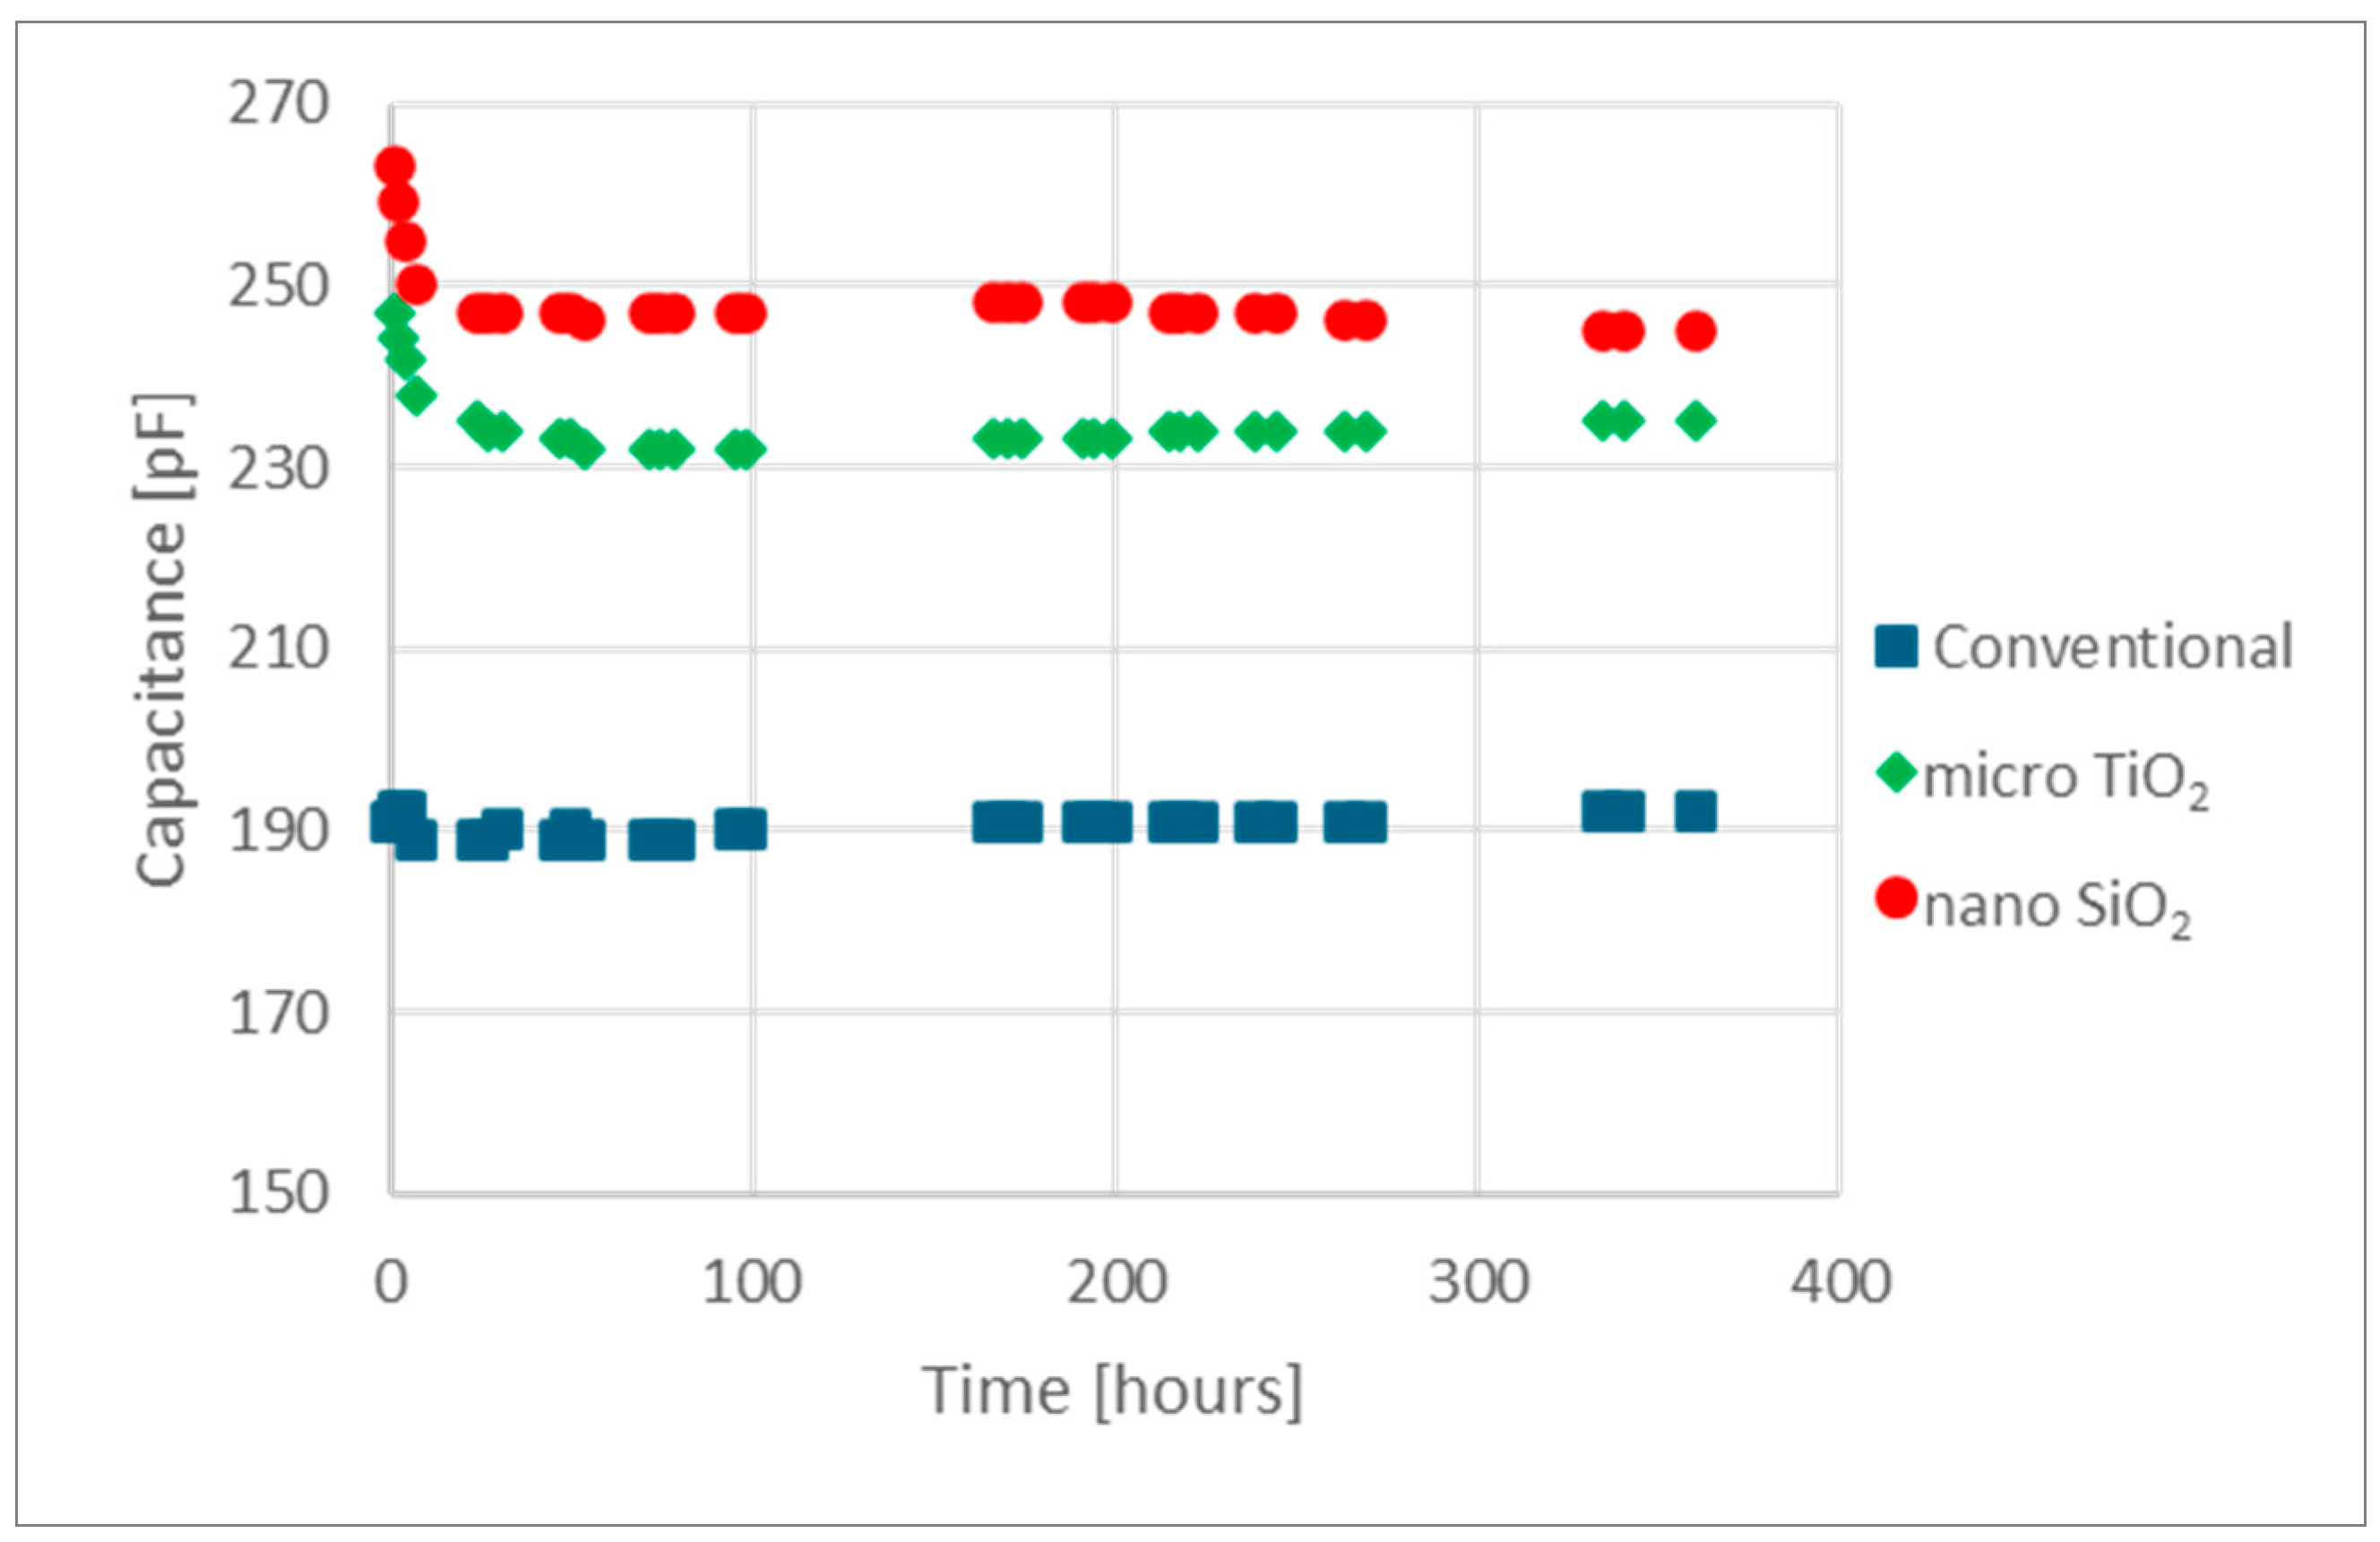
To clarify the behavior of the enamels studied here, the DC capacitance of 15 twisted pairs connected in parallel was measured over time during aging at 230 °C. The obtained DC capacitance values are graphed in Figure 11. For the nano-filled SiO2 enamel and the micro-filled TiO2 enamel, there was an initial rapid decrease in capacitance, probably due to the presence of inorganic fillers, which results in a different surface behavior compared to Conventional enamel. Additionally, the initial decrease in capacitance may be attributed to the release of absorbed moisture.
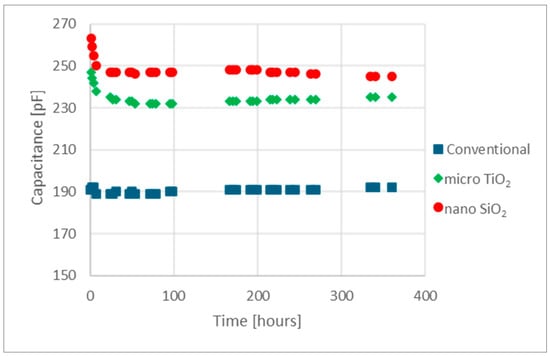
Figure 11.
Thermal aging vs. insulation capacitance at 230 °C.
After the initial decrease in the case of the micro-filled TiO2 enamel, a slight increase in capacitance was observed. Conversely, the nano-filled SiO2 enamel showed a slight decrease over time. The Conventional enamel exhibited a relatively constant behavior. Moreover, the variation in capacitance over time for all the materials considered does not justify the PDIV decrease during aging.
To better understand the PDIV trend over time, DC and AC measurements of electrical resistance and capacitance were performed on unaged and aged samples. The samples consisted of 15 twisted pairs connected in parallel. These samples were preconditioned at 60 °C for 24 h to remove any absorbed moisture. The measurements were performed on the samples placed inside the oven, which was set at 230 °C. The DC resistance values were measured by means of a high-resistance meter that applied 250 VDC to the samples. The AC capacitance and loss factor were measured using a Schering bridge that applied a 50 Hz sinusoidal voltage waveform with a 350 VRMS amplitude. The relevant results are reported in Table 8.
Table 8.
Resistance, capacitance and loss factor measured at 230 °C.
Table 8 shows that both the DC and AC capacitance measurements indicate a decreased value of the aged samples. The DC measurements of resistance show higher values for the aged twisted pairs, while the Tanδ presents lower values for the aged materials. This means that, in general, the capacitance decreases with thermal aging, while the resistance increases.
A decrease in the PDIV value can depend on an increase in the electrical field and/or the increased probability that a first electron initiates the discharge process. In the case considered here, an increase in the electric field could be related to an increase in the enamel capacitance, whereas an initial decrease in capacitance was identified, followed by a quite constant trend over time (Figure 11 and Table 8). The increased probability that first electrons start the discharge activity could be related to an increase in the conductivity of the insulating materials, while the aged samples have higher resistance and lower Tanδ values, as shown in Table 8. Both capacitance and conductance decrease. However, considering the complex permittivity, ε’ decreases more than ε’. Therefore, the obtained experimental results cannot justify the PDIV decrease during thermal aging. A possible explanation could be that the aging of the first layer of the enamel surface in contact with the air leads to an increase in the surface conductivity, resulting in an easier emission of first electrons trapped in the insulating surface. This surface conductivity increase was not measured since its effect is negligible with respect to the measured capacitance and resistance values, but it seems to be the only possible explanation of the PDIV decrease over time. The possibility that the first electron initiating the discharge process can be emitted by the surrounding air was taken into account by the authors. However, they did not find any justification for the PDIV reduction, since the surrounding air characteristics do not change considerably over time.
5. Conclusions
This study monitored the variation in partial discharge inception voltage (PDIV) over time during thermal aging tests on twisted-pair samples. The twisted-pair insulating systems, which belonged to the thermal class of 200, were Conventional enamel, enamel with a PEI basecoat and PAI, enamel with a PEI basecoat and PAI micro-filled with TiO2 particles (“micro TiO2” enamel), enamel with a PEI basecoat and PAI nano-filled with SiO2 particles (“nano SiO2” enamel). Different temperature values were considered for the aging process, and applying a sinusoidal voltage of such amplitude prevented the occurrence of partial discharges. The inverse power law was applied to fit the experimental data, establishing relationships between PDIV and aging time. These relationships allowed for the extrapolation of the expected PDIV values, which corresponded to 1000 h and 1 year. The decrease in PDIV values over time was justified by supposing that it was due to an increase in the conductivity of the enamel surface, which was not measured since its effect is negligible with respect to the measured capacitance and resistance values. Nevertheless, the results of the measurements of the DC and AC capacitances and resistances cannot explain the decrease in PDIV values. The capacitive effects, which increase the electric field, and the resistive effects, which increase the conductivity, were not the primary factors that influenced the PDIV decrease. Further research is necessary to fully understand the underlying mechanisms.
Author Contributions
Validation, L.D.G. and E.T.; Investigation, I.K., F.G., L.D.G. and E.T.; Writing—original draft, I.K. and L.D.G.; Writing—review & editing, F.G. and E.T.; Supervision, F.G. All authors have read and agreed to the published version of the manuscript.
Funding
This research received no external funding.
Data Availability Statement
The original contributions presented in the study are included in the article, further inquiries can be directed to the corresponding author.
Conflicts of Interest
The authors declare no conflict of interest.
References
- Guastavino, F.; Ratto, A. Comparison between conventional and nanofilled enamels under different environmental conditions. IEEE Electr. Insul. Mag. 2012, 28, 35–41. [Google Scholar] [CrossRef]
- Guastavino, F.; Porcile, F.; Ratto, A.; Cordano, D.; Secondo, G. Electrical aging test and repetitive partial discharge inception voltage on random wire wound winding insulation. In Proceedings of the 2014 IEEE Conference on Electrical Insulation and Dielectric Phenomena (CEIDP), Des Moines, IA, USA, 19–22 October 2014; pp. 510–513. [Google Scholar] [CrossRef]
- Guastavino, F.; Dardano, A. Life Tests on Twisted Pairs in Presence of Partial Discharges: Influence of the Voltage Waveform. IEEE Trans. Dielectr. Electr. Insul. 2012, 19, 45–52. [Google Scholar] [CrossRef]
- Guastavino, F.; Briano, L.; Gallesi, F.; Torello, E. Effect of Thermal Stress Over the Partial Discharge Inception Voltage on Twisted Pairs. In Proceedings of the 2020 IEEE Conference on Electrical Insulation and Dielectric Phenomena (CEIDP), Virtual, 18–30 October 2020; pp. 366–368. [Google Scholar] [CrossRef]
- Moghadam, D.E.; Herold, C.; Zbinden, R. Effects of Resins on Partial Discharge Activity and Lifetime of Insulation Systems Used in eDrive Motors and Automotive Industries. In Proceedings of the 2020 Electrical Insulation Conference (EIC), Knoxville, TN, USA, 22 June–3 July 2020. [Google Scholar]
- Montanari, G.C.; Cavallini, A.; Ciani, F.; Contin, A. Accelerated aging, partial discharges and breakdown of Type II turn-to-turn insulation system of rotating machines. In Proceedings of the IEEE Electrical Insulation Conference (EIC), Montreal, QC, Canada, 19–22 June 2016; pp. 190–193. [Google Scholar] [CrossRef]
- Fang, L.; Cotton, I.; Wang, Z.J.; Freer, R. Insulation performance evaluation of high temperature wire candidates for aerospace electrical machine winding application. In Proceedings of the IEEE Electrical Insulation Conference (EIC), Ottawa, ON, Canada, 2–5 June 2013; pp. 253–256. [Google Scholar] [CrossRef]
- Cao, W.; Mecrow, B.C.; Atkinson, G.J.; Bennett, J.W.; Atkinson, D.J. Overview of electric motor technologies used for more electric aircraft (MEA). IEEE Trans. Ind. Electron. 2012, 59, 3523–3531. [Google Scholar]
- Mancinelli, P.; Stagnitta, S.; Cavallini, A. Qualification of hairpin motors insulation for automotive applications. IEEE Trans. Ind. Appl. 2017, 53, 3110–3118. [Google Scholar] [CrossRef]
- Gubanski, S.M. Outdoor polymeric insulators: Role of corona in performance of silicone rubber housings. In Proceedings of the 2015 IEEE Conference on Electrical Insulation and Dielectric Phenomena (CEIDP), Ann Arbor, MI, USA, 18–21 October 2015. [Google Scholar]
- Mavrikakis, C.; Mikropoulos, P.N.; Siderakis, K. Evaluation of field-ageing effects on insulating materials of composite suspension insulators. IEEE Trans. Dielectr. Electr. Insul. 2017, 24, 490–498. [Google Scholar] [CrossRef]
- Mikropoulos, P.N.; Samaras, P.K. Partial Discharge Activity on Polymeric Insulating Surfaces under Positive Trapezoidal High Voltages. In Proceedings of the 2021 IEEE Electrical Insulation Conference (EIC), Virtual, 7–28 June 2021. [Google Scholar]
- Petitgas, B.; Seytre, G.; Gain, O.; Boiteux, G.; Royaud, I.; Serghei, A.; Gimenez, A.; Anton, A. High temperature aging of enameled copper wire—Relationships between chemical structure and electrical behavior. In Proceedings of the 2011 Annual Report Conference on Electrical Insulation and Dielectric Phenomena, Cancun, Mexico, 16–19 October 2011; pp. 84–88. [Google Scholar] [CrossRef]
- Briano, L.; Gallesi, F.; Guastavino, F. Variation Over Time of Partial Discharge Inception Voltage Due to Combined Electrical and Thermal Stress on Twisted Pairs. In Proceedings of the 2021 IEEE Conference on Electrical Insulation and Dielectric Phenomena, Vancouver, BC, Canada, 12–15 December 2021. [Google Scholar]
- Fréchette, M.F.; Vijh, A.; Trudeau, M.L. Nanodielectrics: A “Universal” Panacea for Solving All Electrical Insulation Problems? In Proceedings of the 2010 International Conference on Solid Dielectrics, Potsdam, Germany, 4–9 July 2010. [Google Scholar]
- Takenouchi, S.; Nishigaki, Y. Partial Discharge Properties till Breakdown of Boehmite Added Enameled Twisted Pair under Bipolar Repetitive Impulse Voltage Application. In Proceedings of the 2020 Electrical Insulation Conference (EIC), Virtual Event, 22 June–3 July 2020. [Google Scholar]
- Gallesi, F.; Guastavino, F. Preliminary Investigations of the Electrical Tree Growth at Frequencies of 50 Hz and 2.2 kHz by means of Partial Discharge Analysis. In Proceedings of the Electrical Insulation Conference (EIC), Virtual Event, 7–28 June 2021. [Google Scholar]
- Ji, Y.; Giangrande, P. Investigation on Humidity Effect on Partial Discharge Considering Thermal Aging. In Proceedings of the 2022 International Conference on Electrical Machines (ICEM), Valencia, Spain, 5–8 September 2022. [Google Scholar]
- Prochazka, R.; Sefl, O. Influence of Voltage Distortion Shape on Partial Discharge Activity in Internal Voids. In Proceedings of the 2020 International Conference on Diagnostics in Electrical Engineering (Diagnostika), Pilsen, Czech Republic, 1–4 September 2020. [Google Scholar]
- Montsinger, V.M. Loading Transformers By Temperature. Trans. Am. Inst. Electr. Eng. 1930, 49, 776–790. [Google Scholar] [CrossRef]
- Brancato, E.L. Insulation Aging a Historical and Critical Review. IEEE Trans. Electr. Insul. 1978, 13, 308–317. [Google Scholar] [CrossRef]
- Azimuddin, A.; Refaat, S.S. A Comprehensive Model for Electrical Degradation of Power Cable Insulation. In Proceedings of the 2021 IEEE Conference on Electrical Insulation and Dielectric Phenomena, Vancouver, BC, Canada, 12–15 December 2021. [Google Scholar]
- Guastavino, F.; Torello, E.; Della Giovanna, L.; Khan, I. Study of the Partial Discharge Inception Voltage Variation Over Time on Enameled Wires Subjected to Thermal-Electrical Stress. In Proceedings of the 2023 IEEE Conference on Electrical Insulation and Dielectric Phenomena (CEIDP), East Rutherford, NJ, USA, 15–19 October 2023; pp. 1–3. [Google Scholar] [CrossRef]
- Acebsa. Available online: https://www.acebsa.com/productos.php (accessed on 1 June 2023).
- Gherardi, P.; Goetter, R.; Jordan, C.; Lienert, K.W.; Murray, T.; Winkeler, M. Polymers for Electrical Insulation: Coating and Casting Materials for the Electrical Industry; Die Bibliothek der Technik; Süddeutscher Verlag GmbH: Munich, Germany, 2008; Volume 314, ISBN 978-3-937889-82-52. [Google Scholar]
- IEC 60851-5:2008+AMD1:2011+AMD2:2019; Winding Wires—Test Methods—Part 5: Electrical Properties. IEC Standard: Geneva, Switzerland, 2019.
- Guastavino, F.; Ratto, A.; Torello, E.; Biondi, G. Aging Tests on Nanostructured Enamels for Winding Wire Insulation. IEEE Trans. Ind. Electron. 2014, 61, 5550–5557. [Google Scholar] [CrossRef]
- Guastavino, F.; Briano, L.; Gallesi, F.; Torello, E. A review on the comparison of conventional and corona resistant nanofilled enamels. In Proceedings of the 2021 IEEE Workshop on Electrical Machines Design, Control and Diagnosis (WEMDCD), Modena, Italy, 8–9 April 2021; pp. 213–218. [Google Scholar] [CrossRef]
- Florkowski, M.; Florkowska, B.; Zydron, P. Partial Discharges in Insulating Systems of Low Voltage Electric Motors Fed by Power Electronics—Twisted-Pair Samples Evaluation. Energies 2019, 12, 768. [Google Scholar] [CrossRef]
- Savin, S.; Ait-Amar, S.; Roger, D. Turn-to-Turn Capacitance Variations Correlated to PDIV for AC Motors Monitoring. IEEE Trans. Dielectr. Electr. Insul. 2013, 20, 34–41. [Google Scholar] [CrossRef]
- Szczepanski, M.; Fetouhi, L.; Sabatou, M. How does PDIV change during isothermal aging of magnet wire. In Proceedings of the 2022 IEEE Electrical Insulation Conference (EIC), Knoxville, TN, USA, 19–23 June 2022. [Google Scholar]
- Wan, D.; Qi, F.; Zhou, Q.; Zhou, H.; Zhao, M.; Duan, X. Effect of Thermal Aging on Threshold Field Strength and Relative Permittivity of Cross Linked Polyethylene with Different Cross Linking Agent Contents. J. Electr. Eng. Technol. 2021, 16, 2885–2892. [Google Scholar] [CrossRef]
- Fetouhi, L.; Sabatou, M.; Szczepanski, M.; Pin, S.; Thomas, C.; Belijar, G. Thermal aging of enameled wire: Dielectric markers and structural properties drift correlation. In Proceedings of the 2022 IEEE 4th International Conference on Dielectrics (ICD), Palermo, Italy, 3–7 July 2022. [Google Scholar]
- Uchechukwu, A.M.; Anthony, E.; Godspower, E. Electrical Properties of Enamel Wire Insulation. Int. J. Trend Sci. Res. Dev. (IJTSRD) 2019, 3, 803–806. [Google Scholar]

Disclaimer/Publisher’s Note: The statements, opinions and data contained in all publications are solely those of the individual author(s) and contributor(s) and not of MDPI and/or the editor(s). MDPI and/or the editor(s) disclaim responsibility for any injury to people or property resulting from any ideas, methods, instructions or products referred to in the content. |
© 2024 by the authors. Licensee MDPI, Basel, Switzerland. This article is an open access article distributed under the terms and conditions of the Creative Commons Attribution (CC BY) license (https://creativecommons.org/licenses/by/4.0/).