Abstract
The decarbonization goals of each country necessitate the utilization of renewable resources, with photovoltaic (PV) and wind turbine (WT) generators being the most common forms. However, spatial constraints, especially on islands, can hinder the expansion of PV and WT installations. In this context, wave energy emerges as a viable supplementary renewable source. Islands are candidate regions to accommodate wave power resources due to their abundant wave potential. While previous studies have explored the wave energy potential of the Aegean Sea, they have not focused on the electricity production and techno-economic aspects of wave power facilities in this area. This paper aims to fill this knowledge gap by conducting a comprehensive techno-economic analysis to evaluate the feasibility of deploying an offshore wave power facility in the Aegean Sea, Greece. The analysis includes a detailed sensitivity assessment of CAPEX and OPEX variability, calculating key indicators like LCOE and NPV to determine the economic viability and profitability of wave energy investments in the region. Additionally, the study identifies hydraulic efficiency and CAPEX thresholds that could make wave power more competitive compared with traditional energy sources. The techno-economic analysis is conducted for a 45 MW offshore floating wave power plant situated between eastern Crete and Kasos—one of the most wave-rich areas in Greece. Despite eastern Crete’s promising wave conditions, the study reveals that with current techno-economic parameters—CAPEX of 7 million EUR/MW, OPEX of 6%, a 20-year lifetime, and 25% efficiency—the wave energy in this area yields a levelized cost of energy (LCOE) of 1417 EUR/MWh. This rate is significantly higher than the prevailing LCOE in Crete, which is between 237 and 300 EUR/MWh. Nonetheless, this study suggests that the LCOE of wave energy in Crete could potentially decrease to as low as 69 EUR/MWh in the future under improved conditions, including a CAPEX of 1 million EUR/MW, an OPEX of 1%, a 30-year lifetime, and 35% hydraulic efficiency for wave converters. It is recommended that manufacturing companies target these specific thresholds to ensure the economic viability of wave power in the waters of the Aegean Sea.
1. Introduction
The European Union has established rigorous targets to substantially reduce carbon dioxide emissions, with a key objective of a minimum 55% decrease in greenhouse gas emissions by 2030 relative to 1990 levels, as stipulated in the Green Deal and Climate Law initiatives [1,2]. Following the 2022 Russian incursion into Ukraine, the EU has adapted its strategy, launching the RePowerEU initiative [3]. This initiative prioritizes energy independence, particularly through reducing reliance on Russian natural gas and enhancing the adoption of renewable energy sources (RESs). Solar and wind power are expected to be the primary RESs in many European countries, including Greece. However, challenges such as land constraints and public opposition to large-scale installations on agricultural land are impeding decarbonization efforts [4].
Wave energy has recently gained attention as a viable alternative, especially for islands and coastal regions with significant wave potential. It offers numerous benefits, including a more consistent power output and higher energy density compared to other RESs [5]. Wave converters produce energy near coastal areas where the population is mainly concentrated. Moreover, waves are usually produced far away from consumption sites, thus smoothing the variability in local renewable energy production [6,7] and reducing the dependence on energy storage systems. Additionally, wave generators tend to receive greater public approval than their solar and wind counterparts due to their minimal impact on land-use patterns [8]. Furthermore, integrating wave generators with offshore wind turbines can maximize the use of marine renewable energy, supporting the development of a sustainable blue economy [9].
The Aegean Sea is renowned for its robust wind potential throughout both winter and summer, driven by the “meltemia”—predominant local winds that blow from the northwest during the day. This phenomenon results from the interplay between the hot air masses over the Sahara and cooler air currents above the Balkan Peninsula. Characterized by a steady northwest direction and minimal turbulence, the meltemia offer a high-quality energy source for both wind and wave power. Notably, regions like eastern Crete, positioned between Crete and Kasos, demonstrate significant wave and wind potential. These consistent and reliable renewable energy sources can be leveraged to advance the blue economy in Greece [1,10].
Wave energy research can be broadly divided into two main categories [11]: (a) the design and testing of wave energy converters (WECs) and (b) the assessment of wave energy resources to identify optimal locations for WEC installation from a techno-economic perspective.
The first research category focuses on the development of WECs, which are categorized based on their operational principles [12]. For instance, point absorbers are designed to harness energy from all wave directions through the relative motion between a buoyant component that responds to wave movements and stationary structures. Notable examples include the CorPower device [13] and Ocean Power Technologies’ Powerbuoy [14]. Attenuators, also known as linear absorbers, consist of long, flexible structures made up of linked floating sections. These sections pivot relative to each other, aligning parallel to wave directions to capture energy; an example is the Pelamis WEC, formerly developed by Pelamis Wave Power [15,16]. Oscillating water columns capture wave motion to create air pressure variations within a chamber, driving an air turbine to generate power [17]. Overtopping devices, similar to traditional hydropower, use elevated water in a reservoir to create differential pressure, driving a low-head turbine like the Kaplan to produce electricity. These devices can be either shoreline-based or float offshore. The Wave Dragon generator, analyzed in this paper, is an example of an offshore overtopping device [18].
The second research category encompasses studies focused on the assessment of wave energy resources at various scales, including global analyses [4] and more region-specific evaluations [8,19,20,21,22,23,24,25,26]. Satymov et al. [4] used potential hourly wave data from worldwide locations alongside a wave energy converter manufacturer’s power matrix to estimate global wave electricity potential. The study revealed that, in 2020, the levelized cost of energy (LCOE) was prohibitively high globally, primarily due to the substantial CAPEX associated with this emerging industry. By 2030, however, wave power is projected to become cost-competitive in high-potential areas, with predicted LCOEs below 60 EUR/MWh in regions like the Cape Town coast in South Africa and the northern British Isles. By 2050, wave energy could achieve LCOEs under 50 EUR/MWh, potentially positioning it as one of the cheapest renewable sources, especially in areas with significant spatial constraints, such as the Pacific Islands, Faroe Islands, and Hawaii. In regions with less restrictive spatial constraints, wave power could complement other renewable energy sources, including solar PV and onshore wind power, enhancing the energy mix in places like Scotland, South Africa, Ireland, Portugal, New Zealand, Chile, and southern Australia.
Another significant contribution to the field of global wave energy resource assessment was made by Reguero et al. [27]. Their research began by examining the temporal variations in global wave resources over different periods, from months to decades. This preliminary analysis aimed to quantify the potential wave energy available along coastlines. It is crucial to note that this estimate was theoretical and did not account for the practicalities of energy conversion technologies or economic factors.
Regionally focused wave energy assessments have been conducted in various constrained and expansive environments, including the Maldives [19], an island off the coast of Alaska [20], Europe [21], Scotland [22], the North Sea [23], South Africa [24], North Spain [11], and the Mediterranean [8,25].
Dialyna and Tsoutsos [25] evaluated the performance of wave energy converters (WECs) in the Mediterranean, concluding that while their performance is promising, significant cost barriers remain, necessitating further research and development. Friedrich et al. [8] explored the impact of integrating wave power with other renewables in the Scottish Islands and the Mediterranean. Their findings indicate that integrating wave power can support demand-side management strategies, leading to a 21% reduction in CO2 emissions, an 8% decrease in costs, and a 40–45% reduction in the need for energy storage. These benefits are largely due to wave power’s differing temporal generation profiles, which provide a balancing effect against the high fluctuations of other renewables. Acar et al. [28] performed an extensive evaluation of long-term mean wave power trends in the Mediterranean Sea, calculating seasonal and annual averages over 60 years using significant wave height and peak period data from the ERA5 reanalysis. Lavidas et al. [29] undertook a detailed examination of wave dynamics in the Libyan Sea in the southwest Mediterranean, pinpointing the highest wave energy potentials in open coastal areas, with peaks up to 10 kW/m during the most active months. While these levels are lower than those in open ocean regions, the consistent wave activity could render wave energy a feasible addition to renewable energy strategies. Simonetti et al. [30] explored the impact of long-term changes in wave climate on the sizing and efficiency of oscillating water column WECs along the Mediterranean coast. Their forecasts up to 2100 indicate that shifts in wave energy resources might require moderate design adjustments, with potential size changes in future scenarios of up to 10%. Additionally, they anticipate a significant increase in annual energy output from these devices under future conditions, possibly lowering the levelized cost of energy and boosting the economic appeal of this technology. Miquel et al. [31] introduced the MoonWEC, a novel wave energy converter designed for the Mediterranean Sea’s wave climate, suggesting that its deployment in arrays could provide electricity to isolated islands that are currently reliant on carbon sources.
To the best of our knowledge, despite extensive research on wave potential in the broader Mediterranean region [8,25], no studies have yet assessed the techno-economic feasibility of wave power facilities in the most advantageous locations of the Aegean Sea. While several studies [10,26,32,33] have explored the wave potential in this area, they have not addressed the electricity productivity and techno-economic aspects of wave power facilities, including efficiency, shading effects, energy losses, and costs. Consequently, critical techno-economic indices, such as total annual electric energy generation per installed power, levelized cost of energy (LCOE), net present value (NPV), and economic sensitivity analysis for wave power facilities, remain unexplored in the Aegean Sea context.
The primary objective of this paper is to address the existing knowledge gap by conducting a comprehensive techno-economic analysis to assess the feasibility of deploying an offshore wave power facility in the Aegean Sea, Greece. This analysis is critical given the region’s significant, yet underexploited, wave energy potential. The study includes a detailed sensitivity analysis that accounts for the variability and unpredictability inherent in the CAPEX and OPEX associated with wave energy facilities. Key techno-economic indicators, such as LCOE and NPV, are meticulously calculated to determine the economic viability and profitability of investing in wave energy facilities in the Aegean region. Furthermore, the study highlights critical efficiency levels and CAPEX thresholds that could improve the competitiveness of wave power in relation to traditional energy sources. Finally, this paper examines the economic effects of various scenarios in which technological improvements or policy modifications might reduce costs and enhance operational efficiency.
2. Installation Description
2.1. Wave Dragon Converter
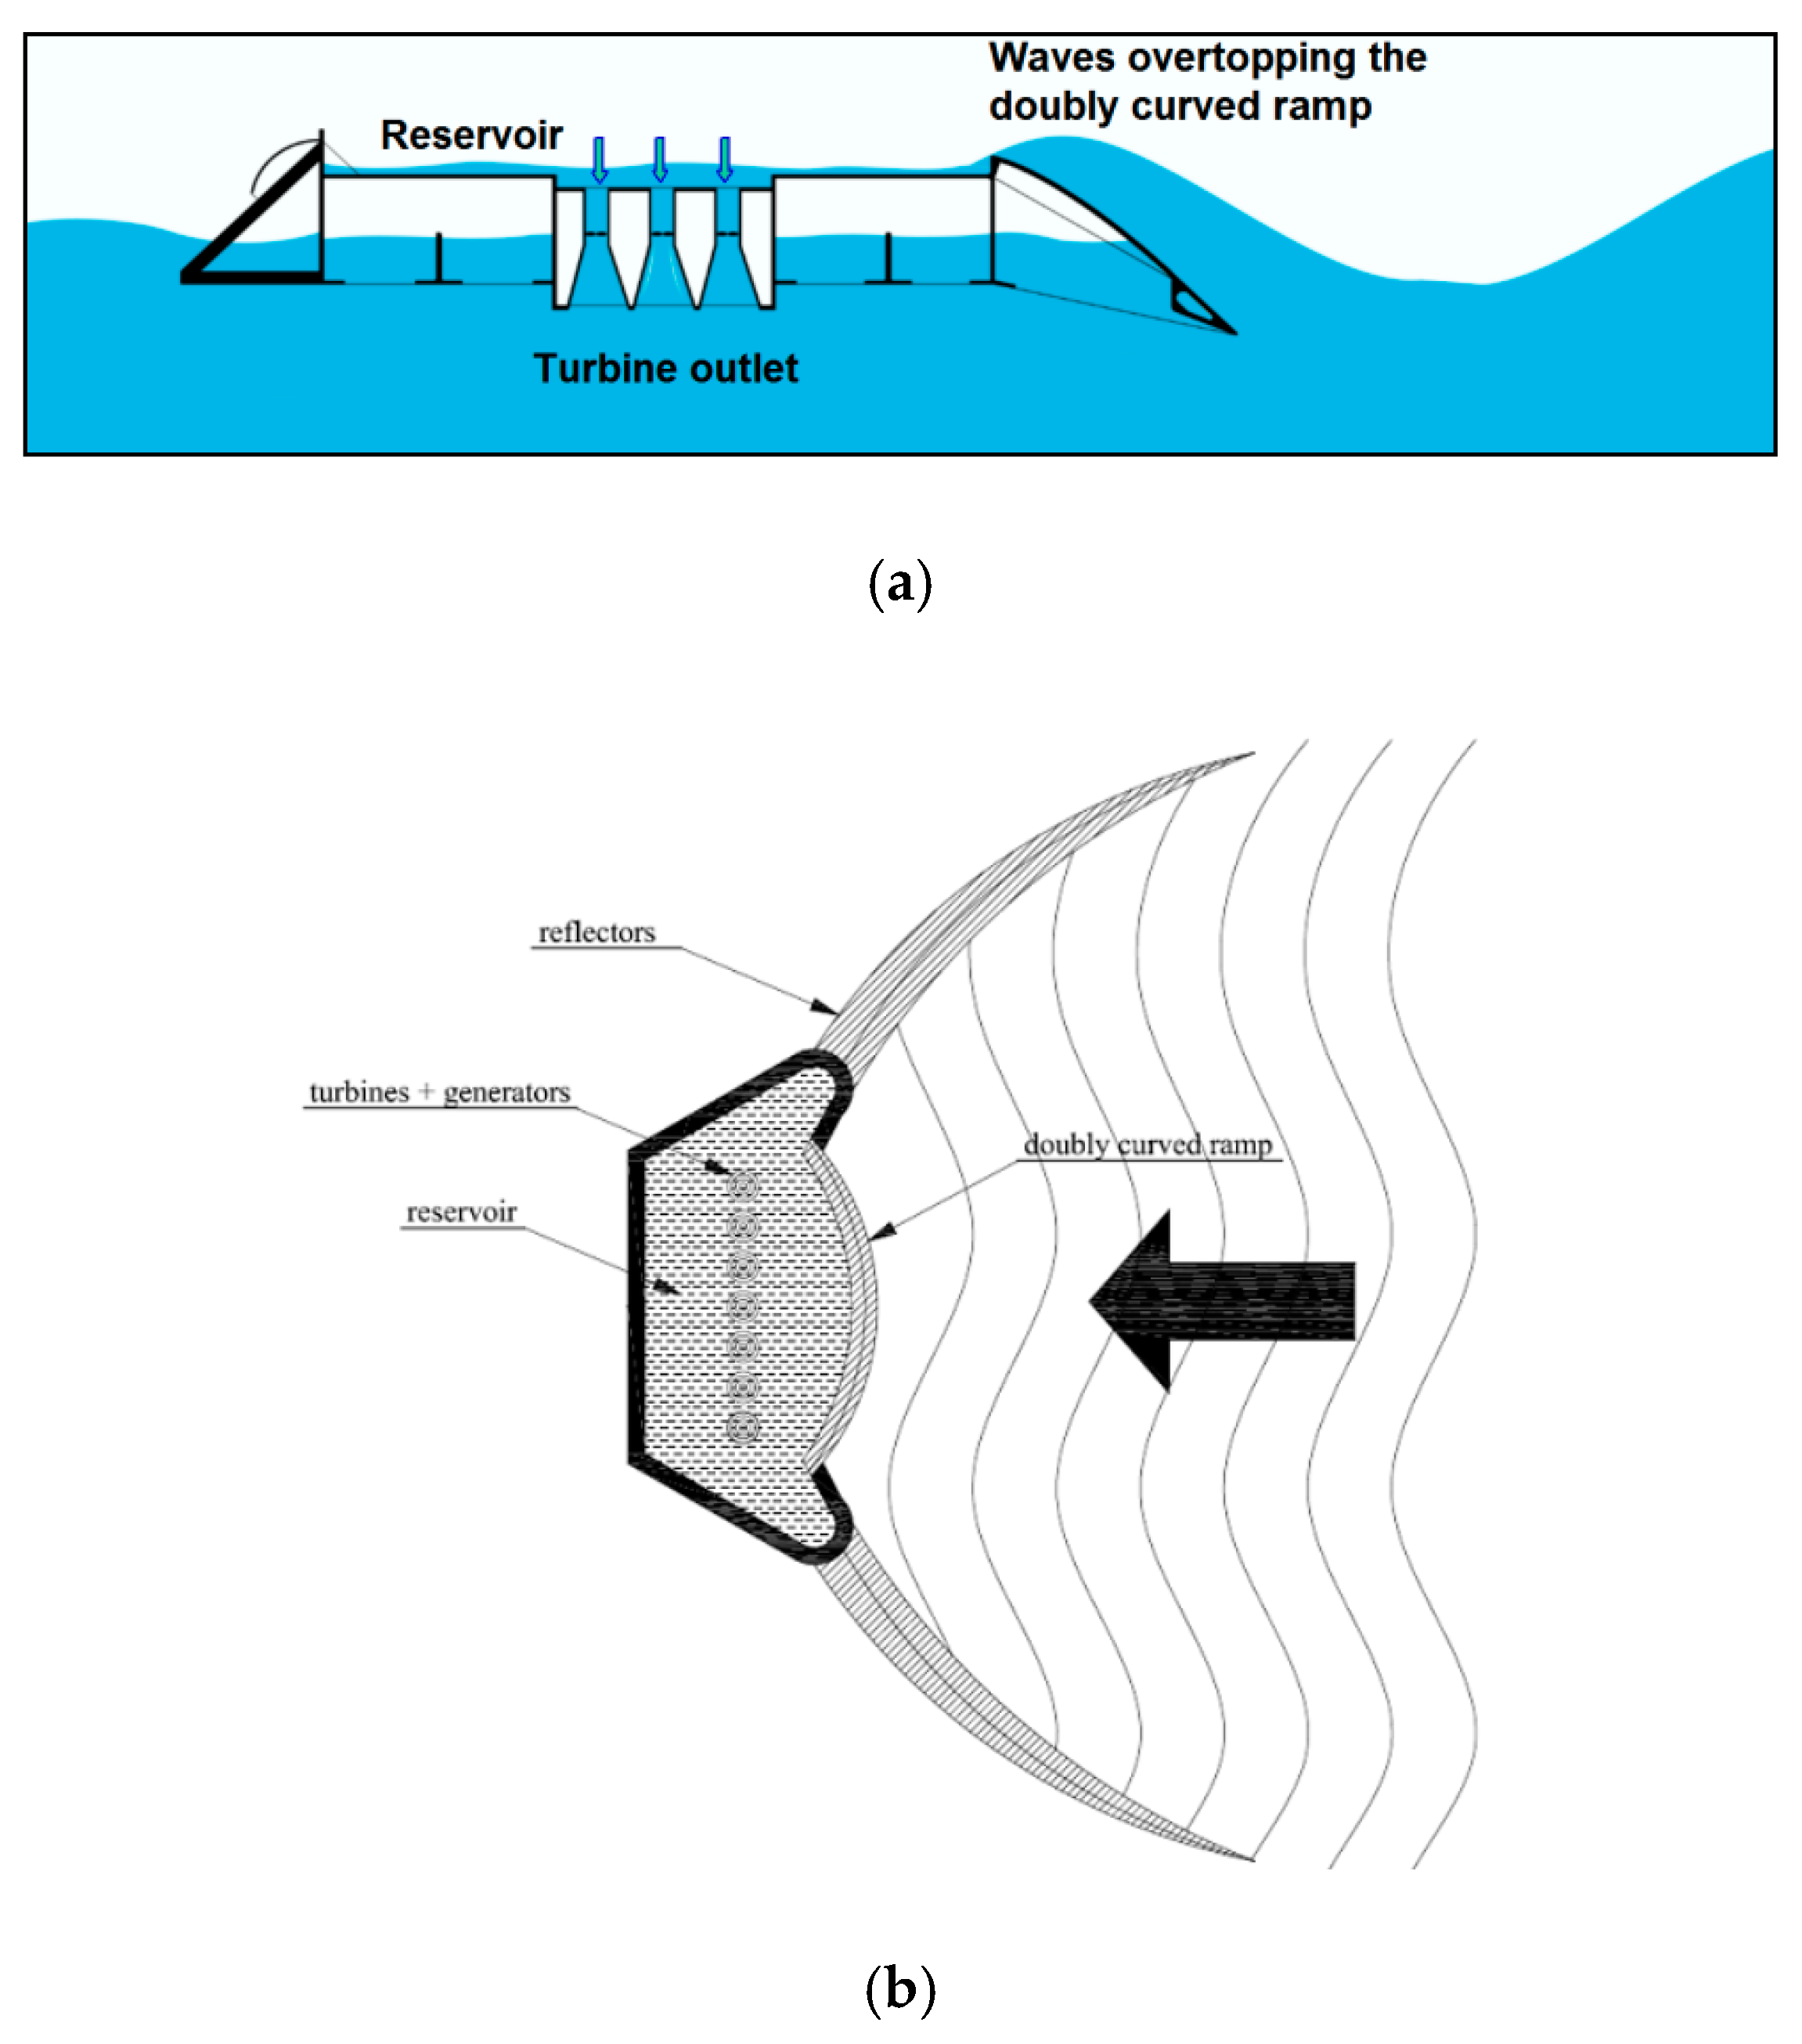
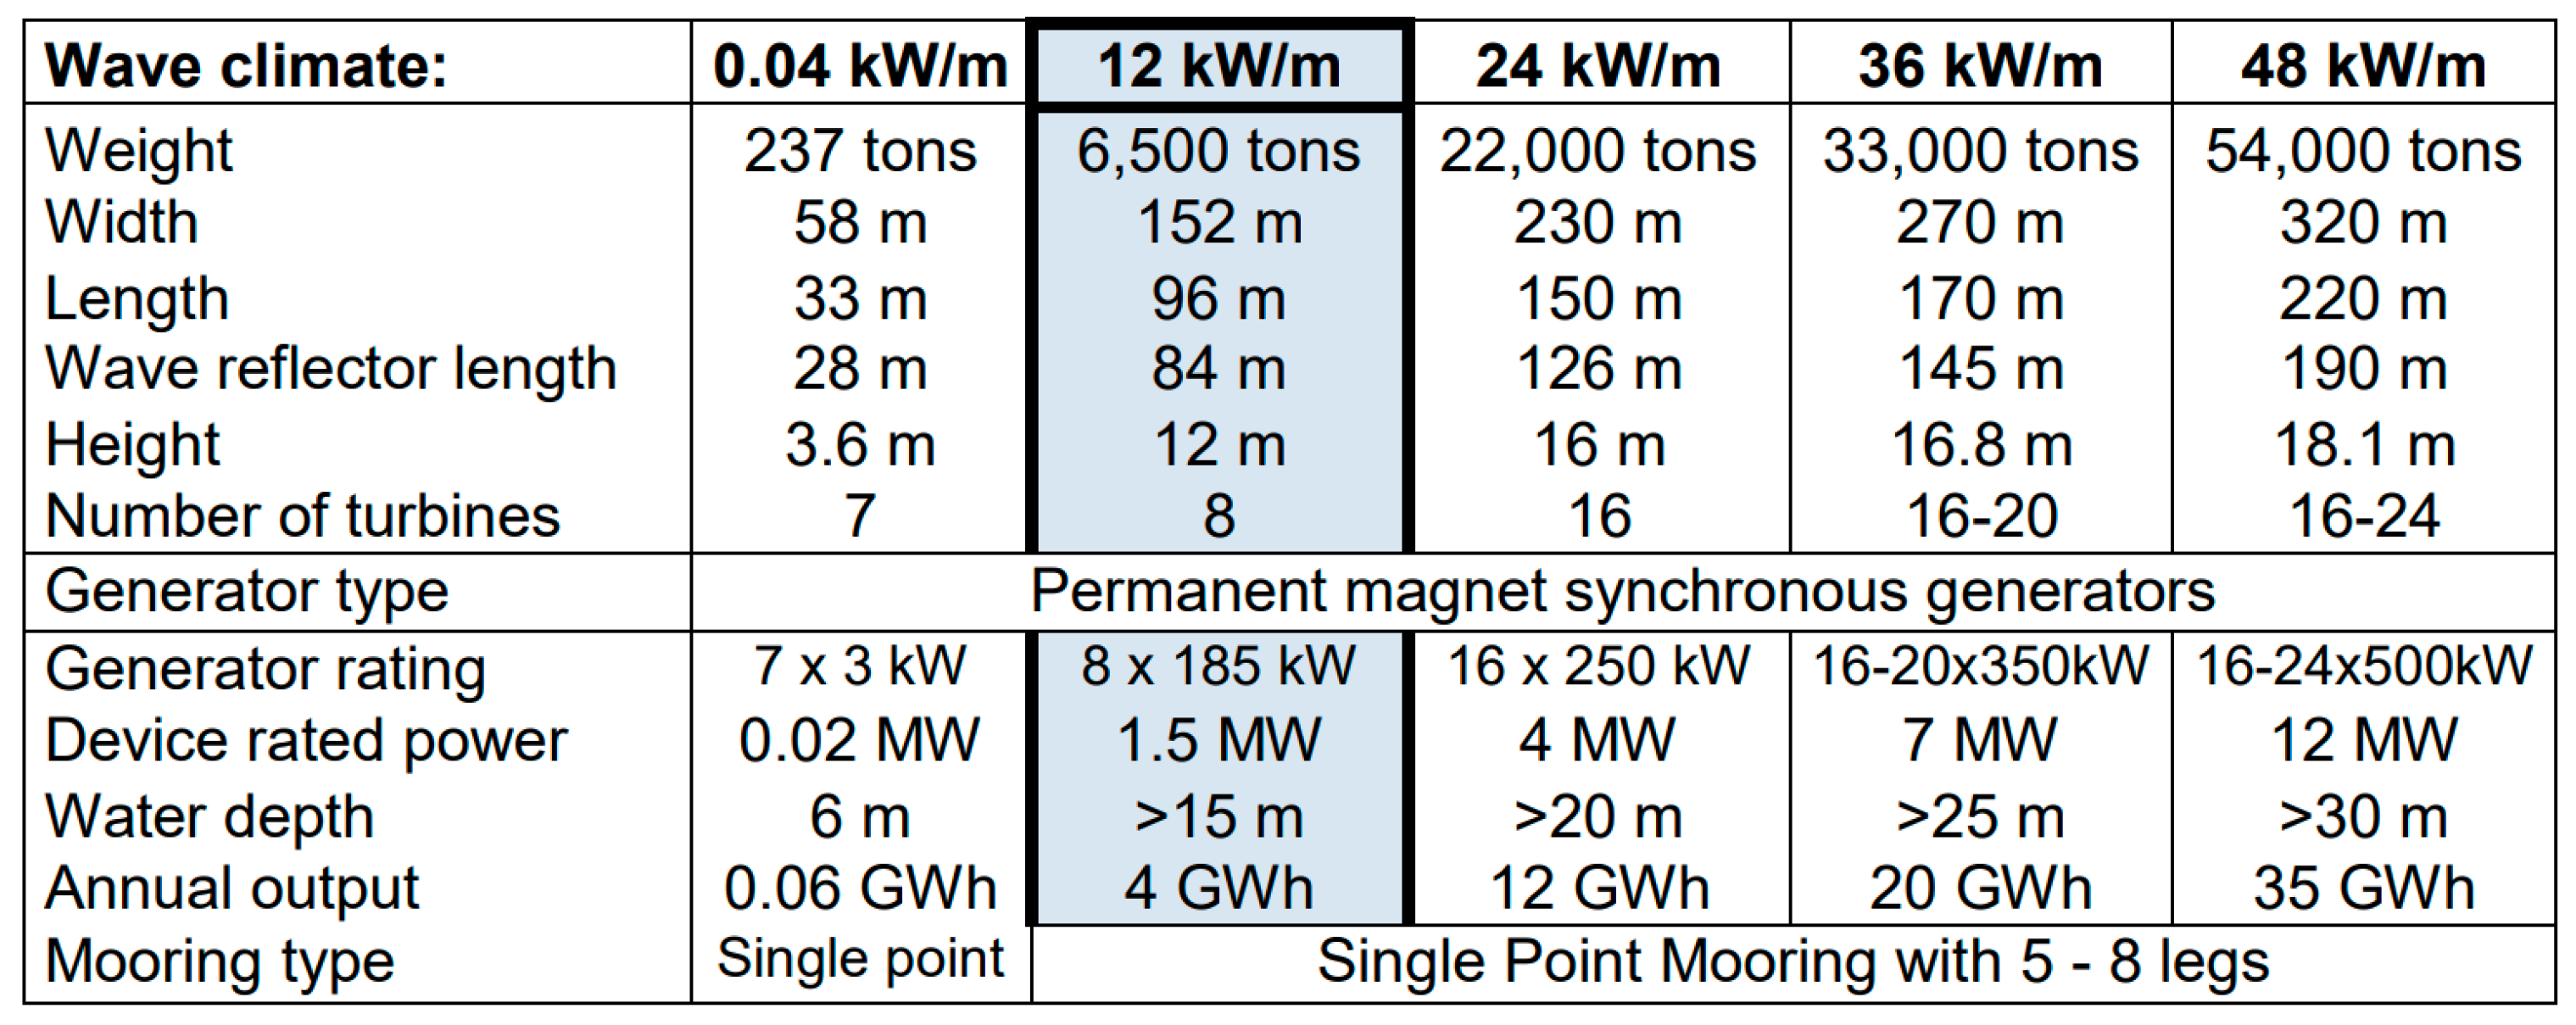
The Wave Dragon is a slack-moored floating WEC that operates on the overtopping principle. The Wave Dragon, developed by a Danish company of the same name (Copenhagen, Denmark), has been under continuous development for over 20 years. This device channels incoming waves toward a doubly curved ramp using two wing reflectors. The waves surge smoothly up the ramp without breaking and overtop into a reservoir that is positioned above the mean water level, as illustrated in Figure 1. The device’s power take-off (PTO) system comprises several variable-speed, low-head hydro turbines connected to Permanent Magnet Synchronous Generators (PMSGs). Electricity is generated as water from the reservoir flows back to the sea through these turbines. The turbines used are of the axial type, featuring fixed propeller blades and guide vanes. The rotational speed of the turbines is regulated according to the available pressure head by a back-to-back frequency converter system. The control system activates the turbines in a cascading sequence based on the reservoir’s water level. This PTO system has demonstrated high efficiency, maintaining over 25% across all operational conditions [34]. Details and specifications of the available Wave Dragon models are documented in Figure 2, based on information from [35]. In this paper, the 1.5 MW Wave Dragon model is used.

Figure 1.
Illustration of Wave Dragon converter. From top to bottom: (a) side view and (b) top view.
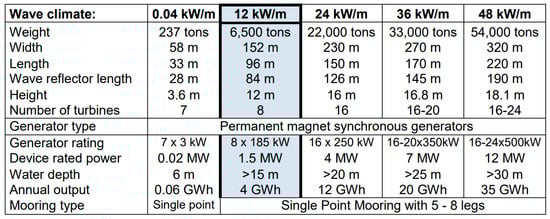
Figure 2.
Wave Dragon converter models for different sea conditions [35].
2.2. Installation Location
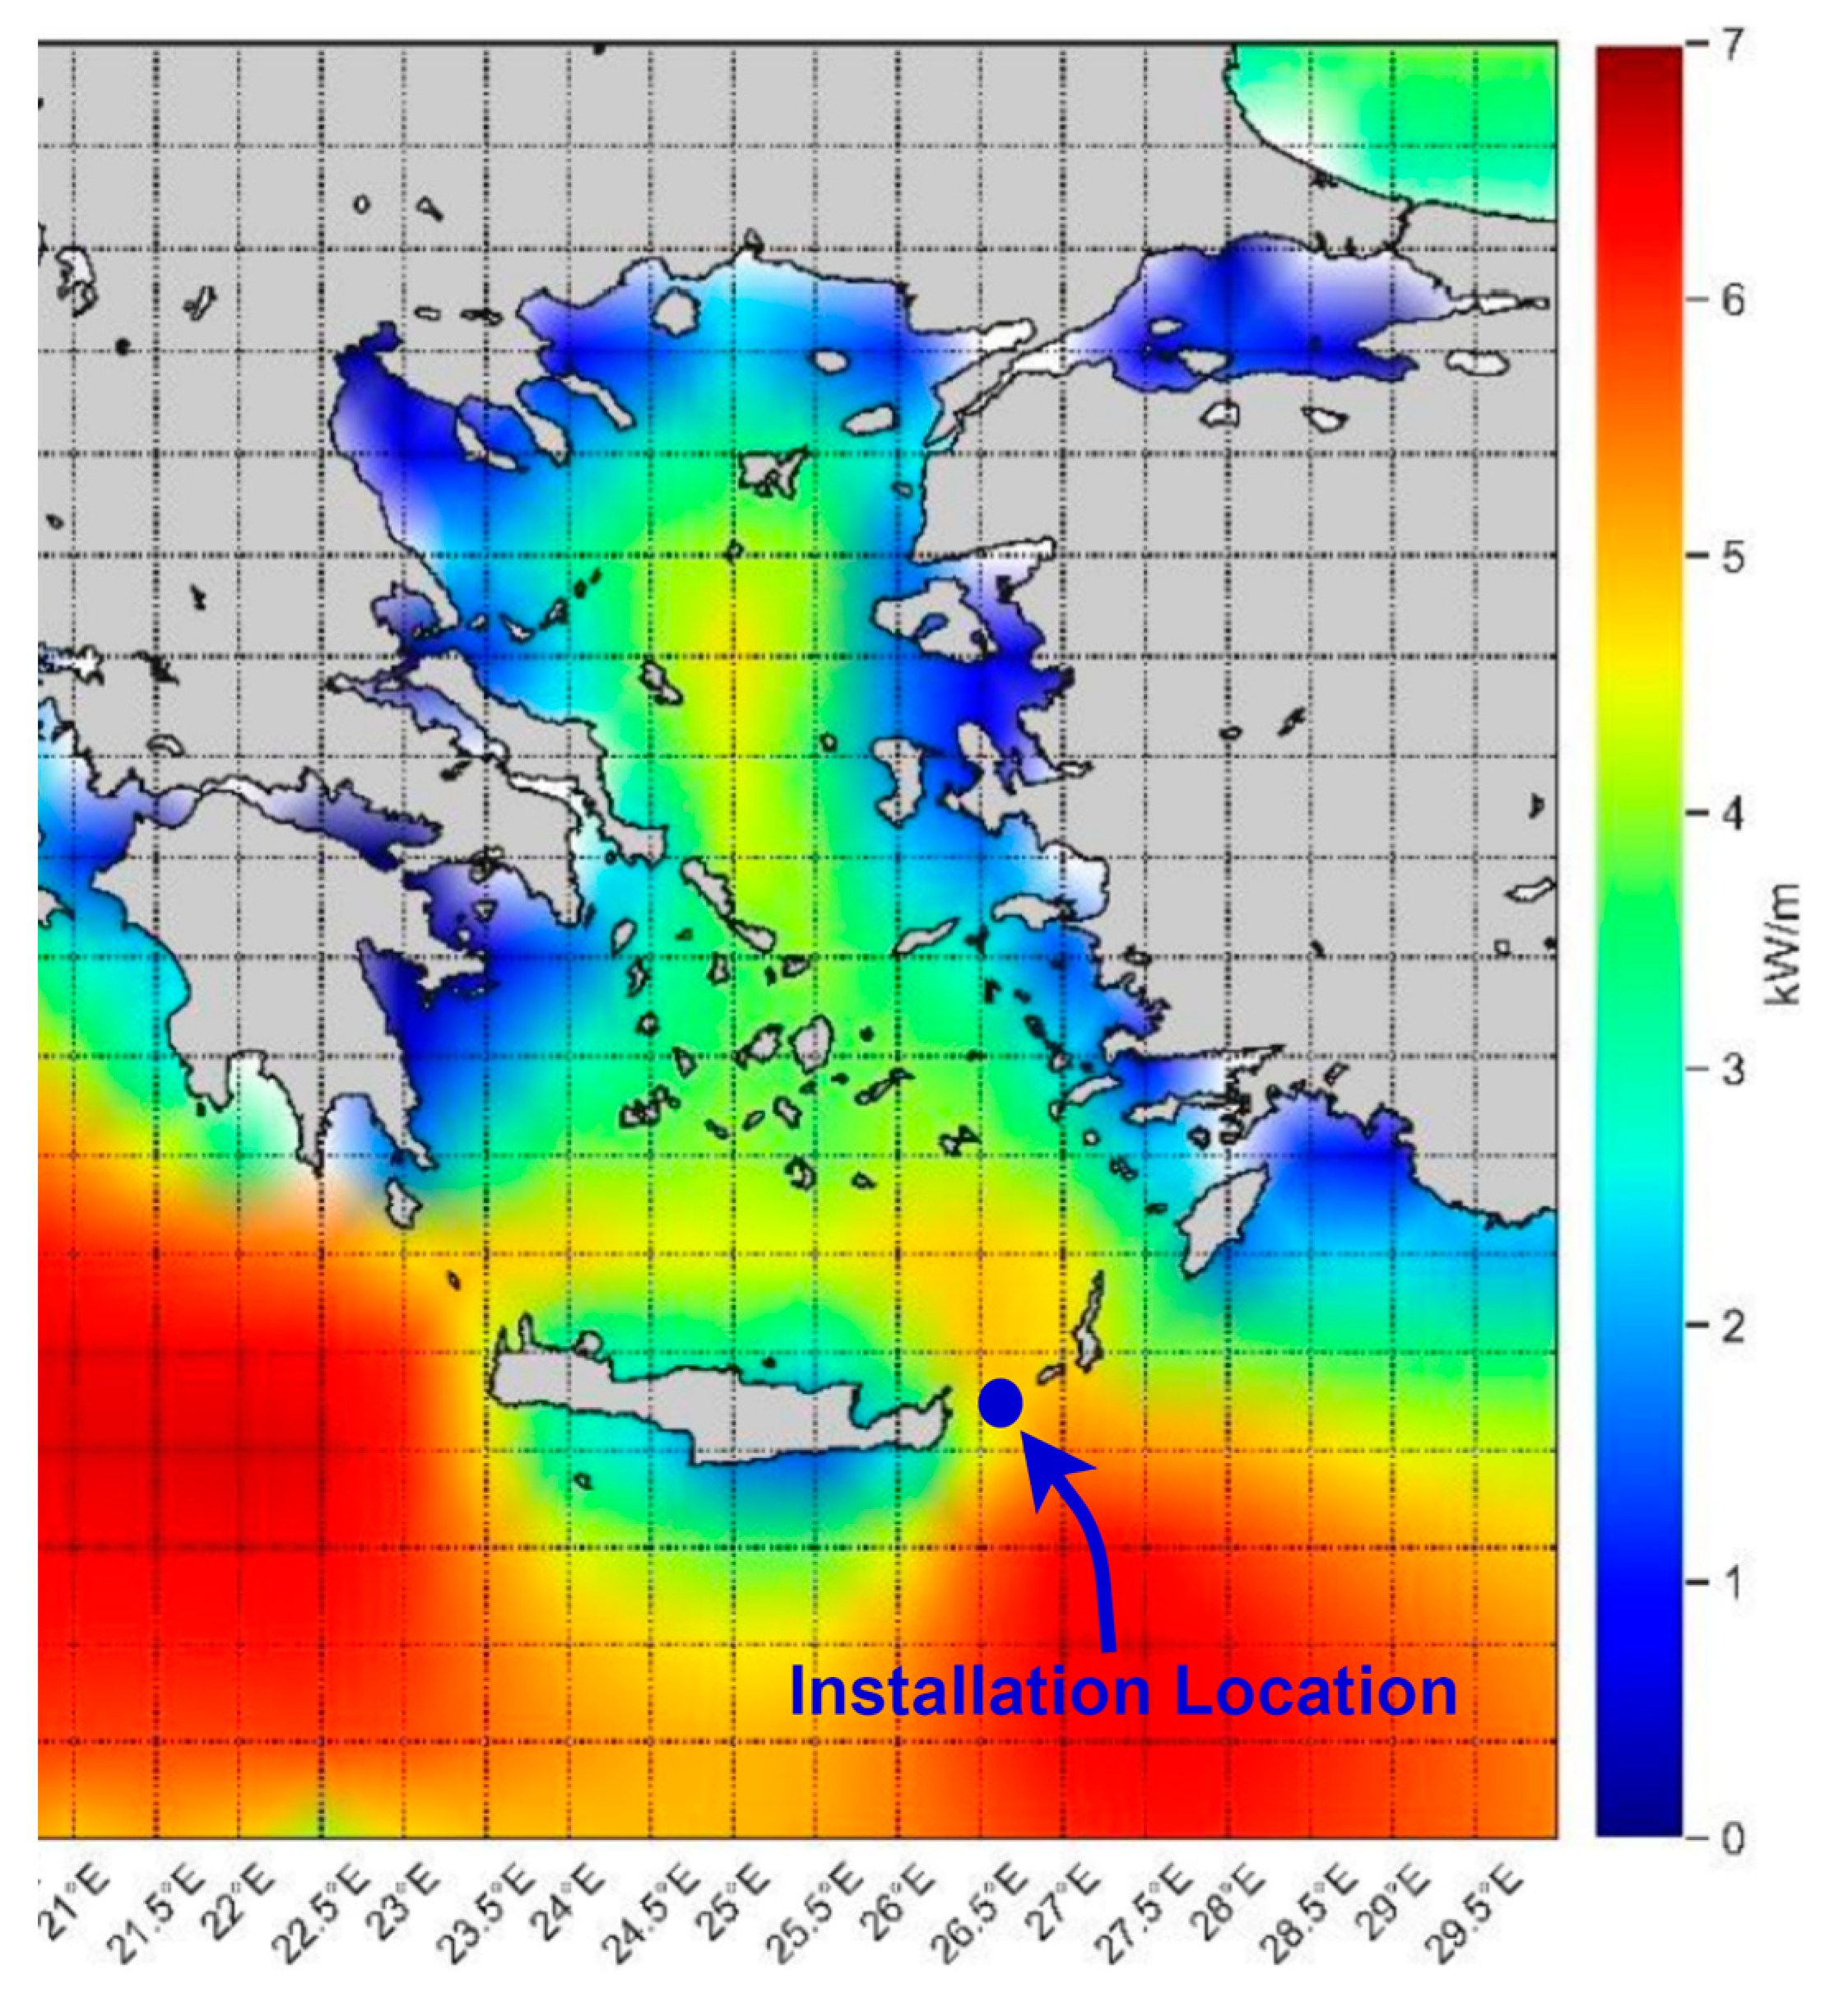
Figure 3 illustrates the fifteen-year mean wave power of the Aegean Sea, highlighting the area between the islands of Crete and Kasos as the selected location for this study due to its robust wave potential, as evidenced by the data in [32]. This region also boasts strong wind potential, making it suitable for hybrid offshore wave and wind energy facilities. A key advantage of this site is its proximity to Crete, which is expected to be linked to the Greek mainland via an HVDC submarine cable by 2025 and to Cyprus and Israel by 2030 [36,37]. This strategic positioning enables the efficient transmission of blue energy to major load centers through multiple submarine interconnections.
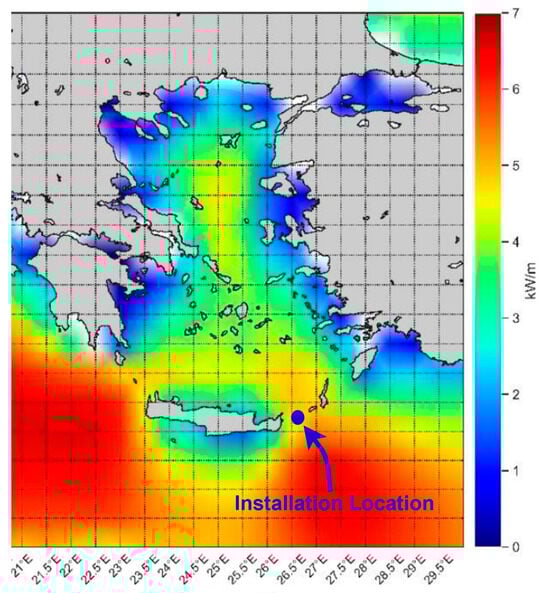
Figure 3.
Fifteen-year mean wave power (kW/m) of Aegean Sea [38].
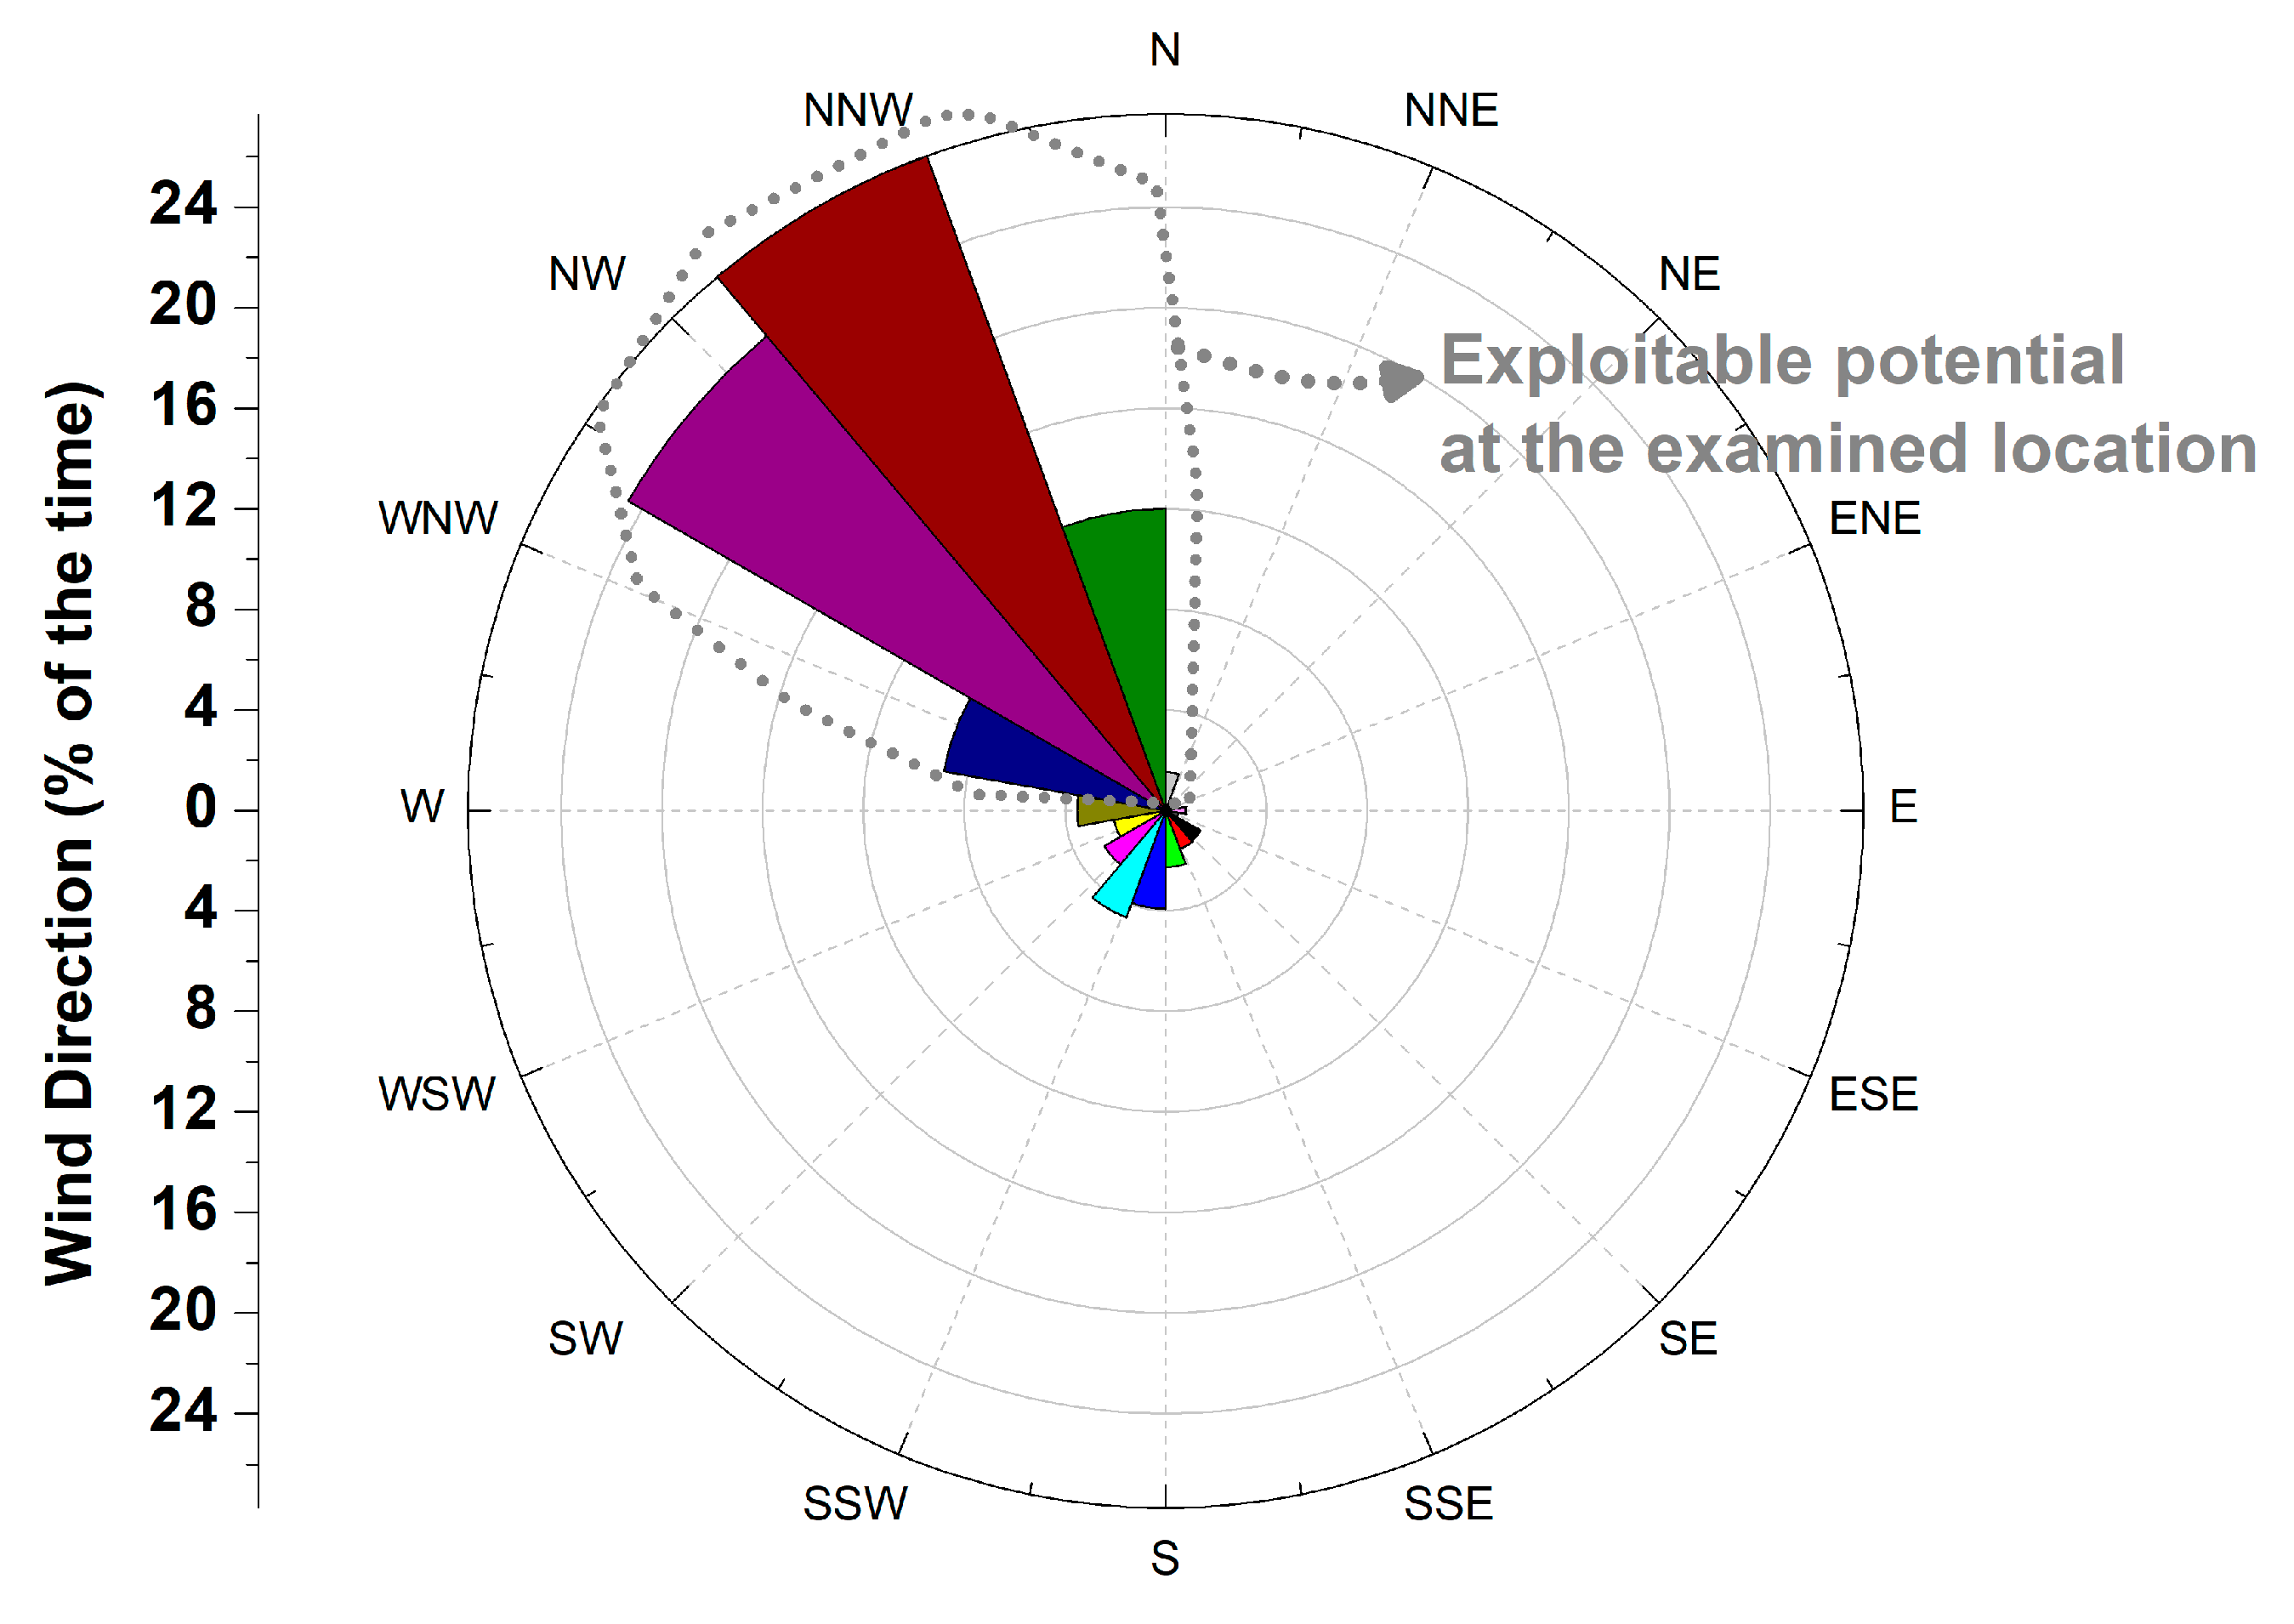
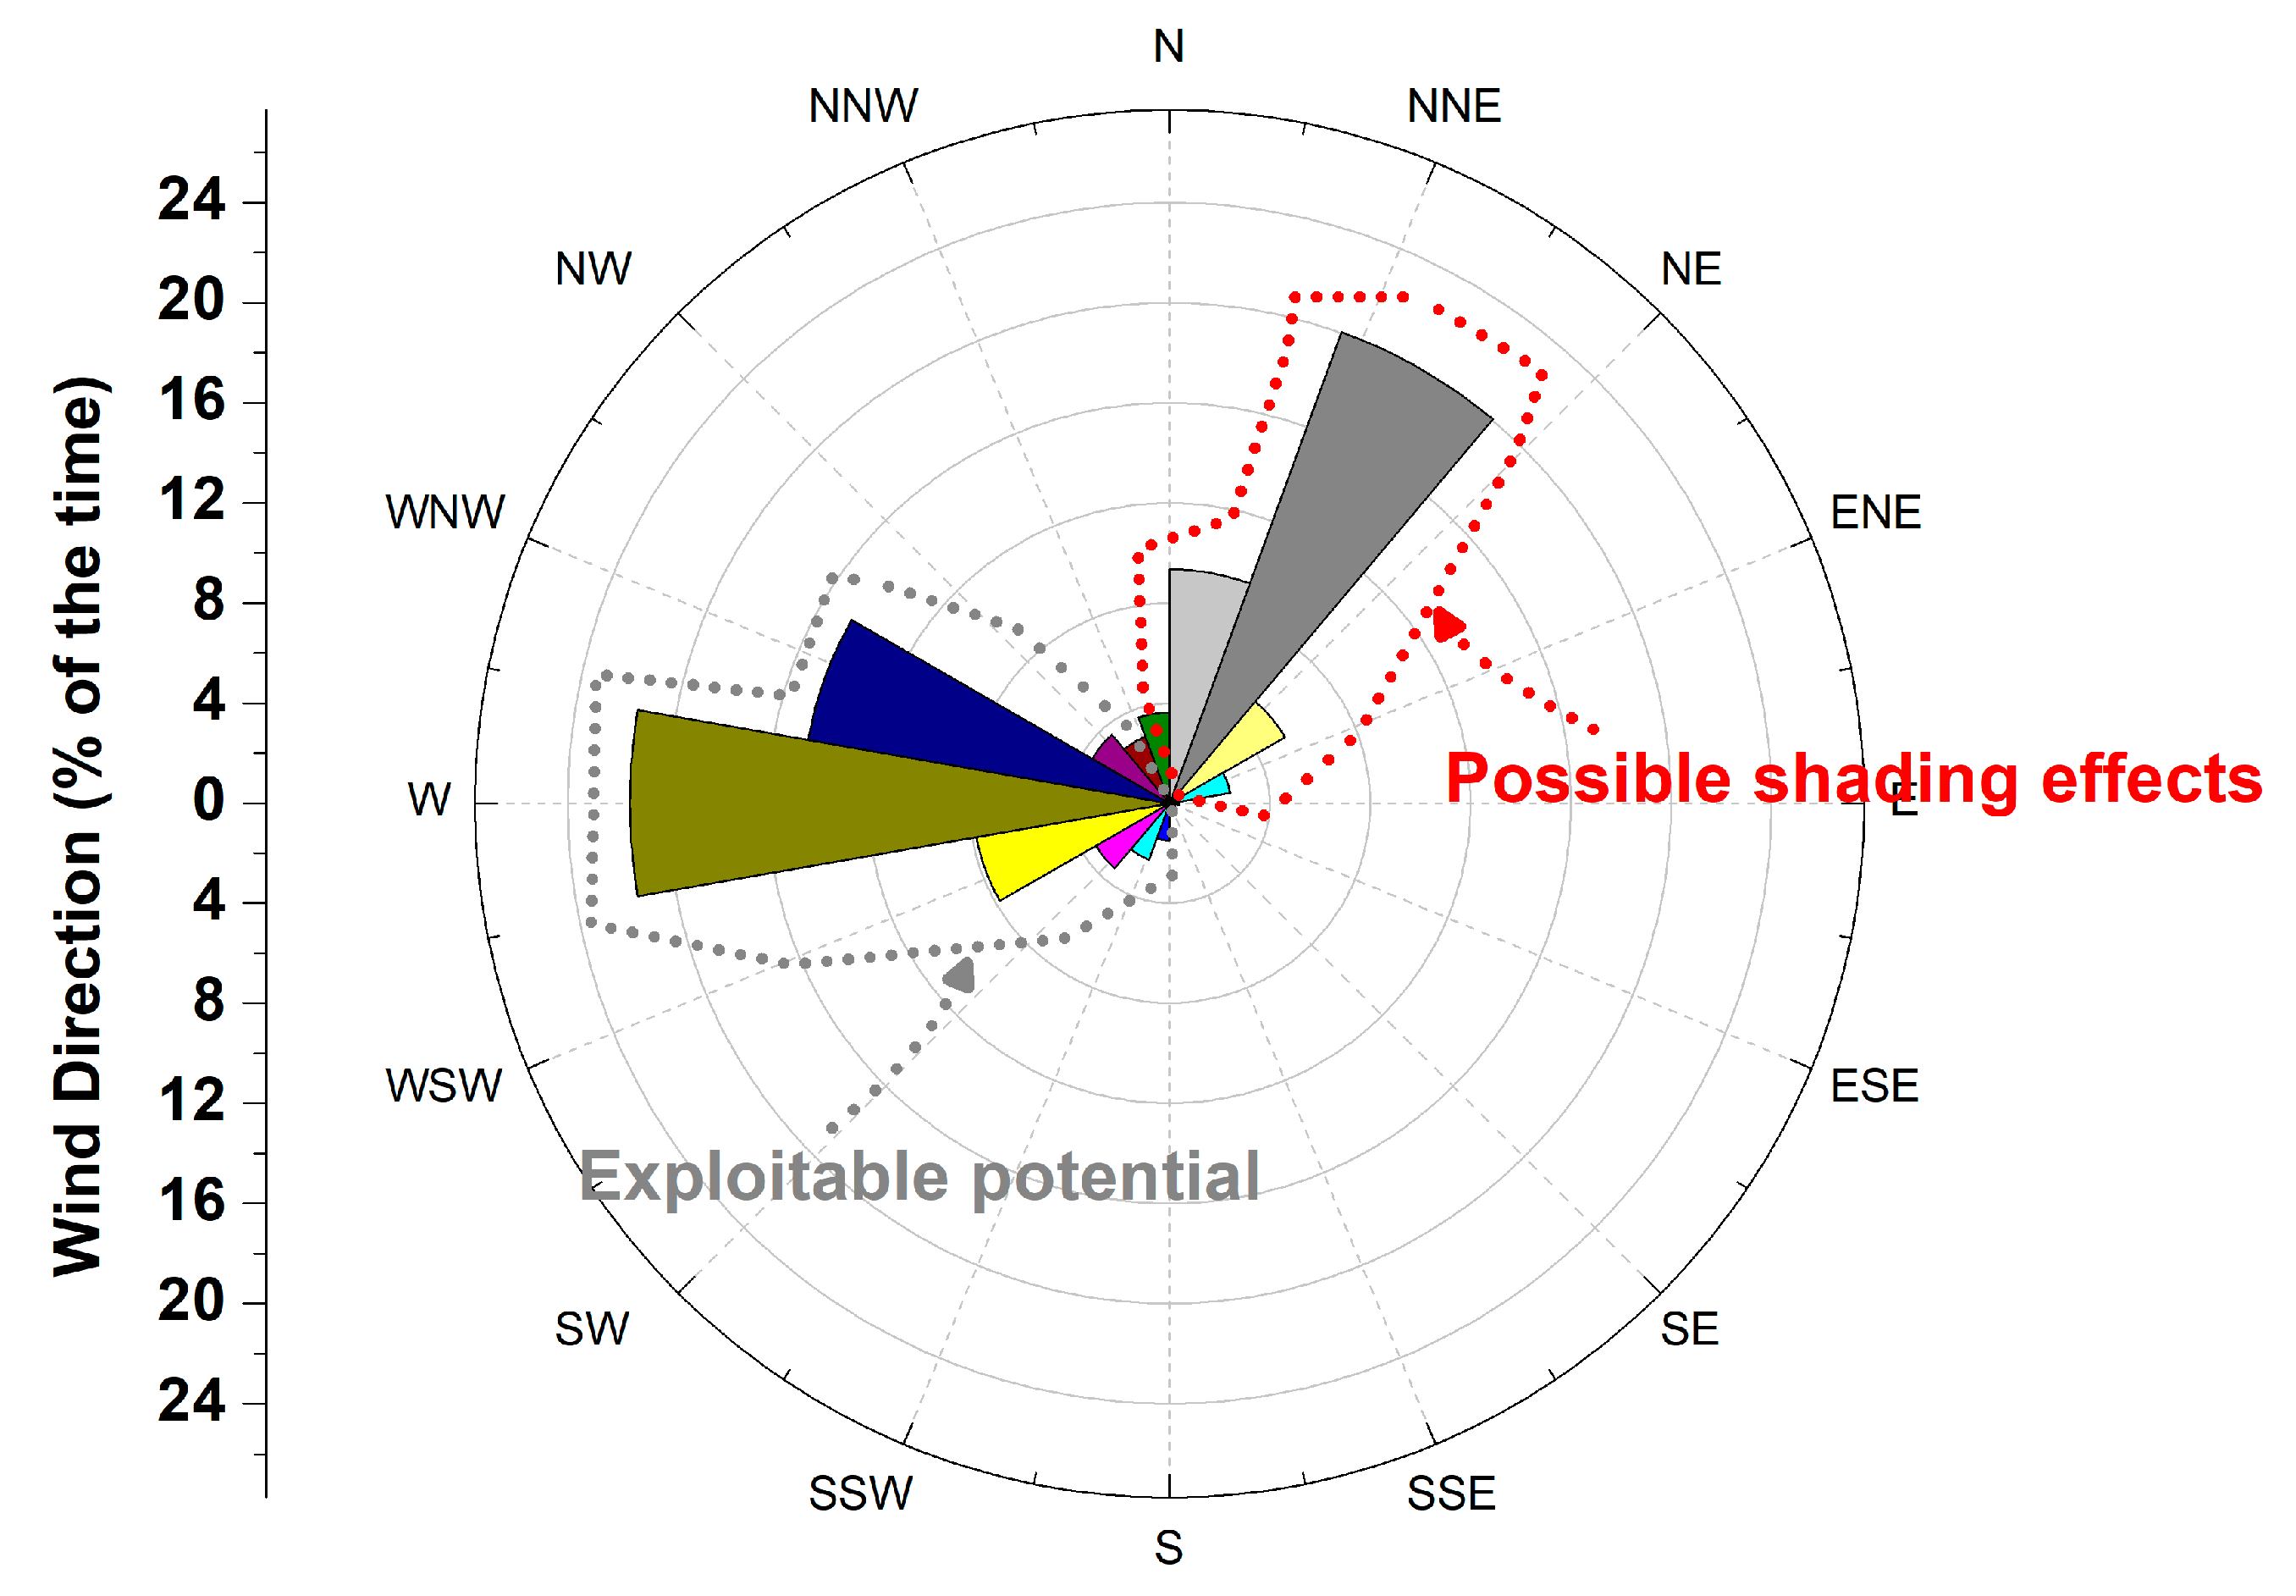
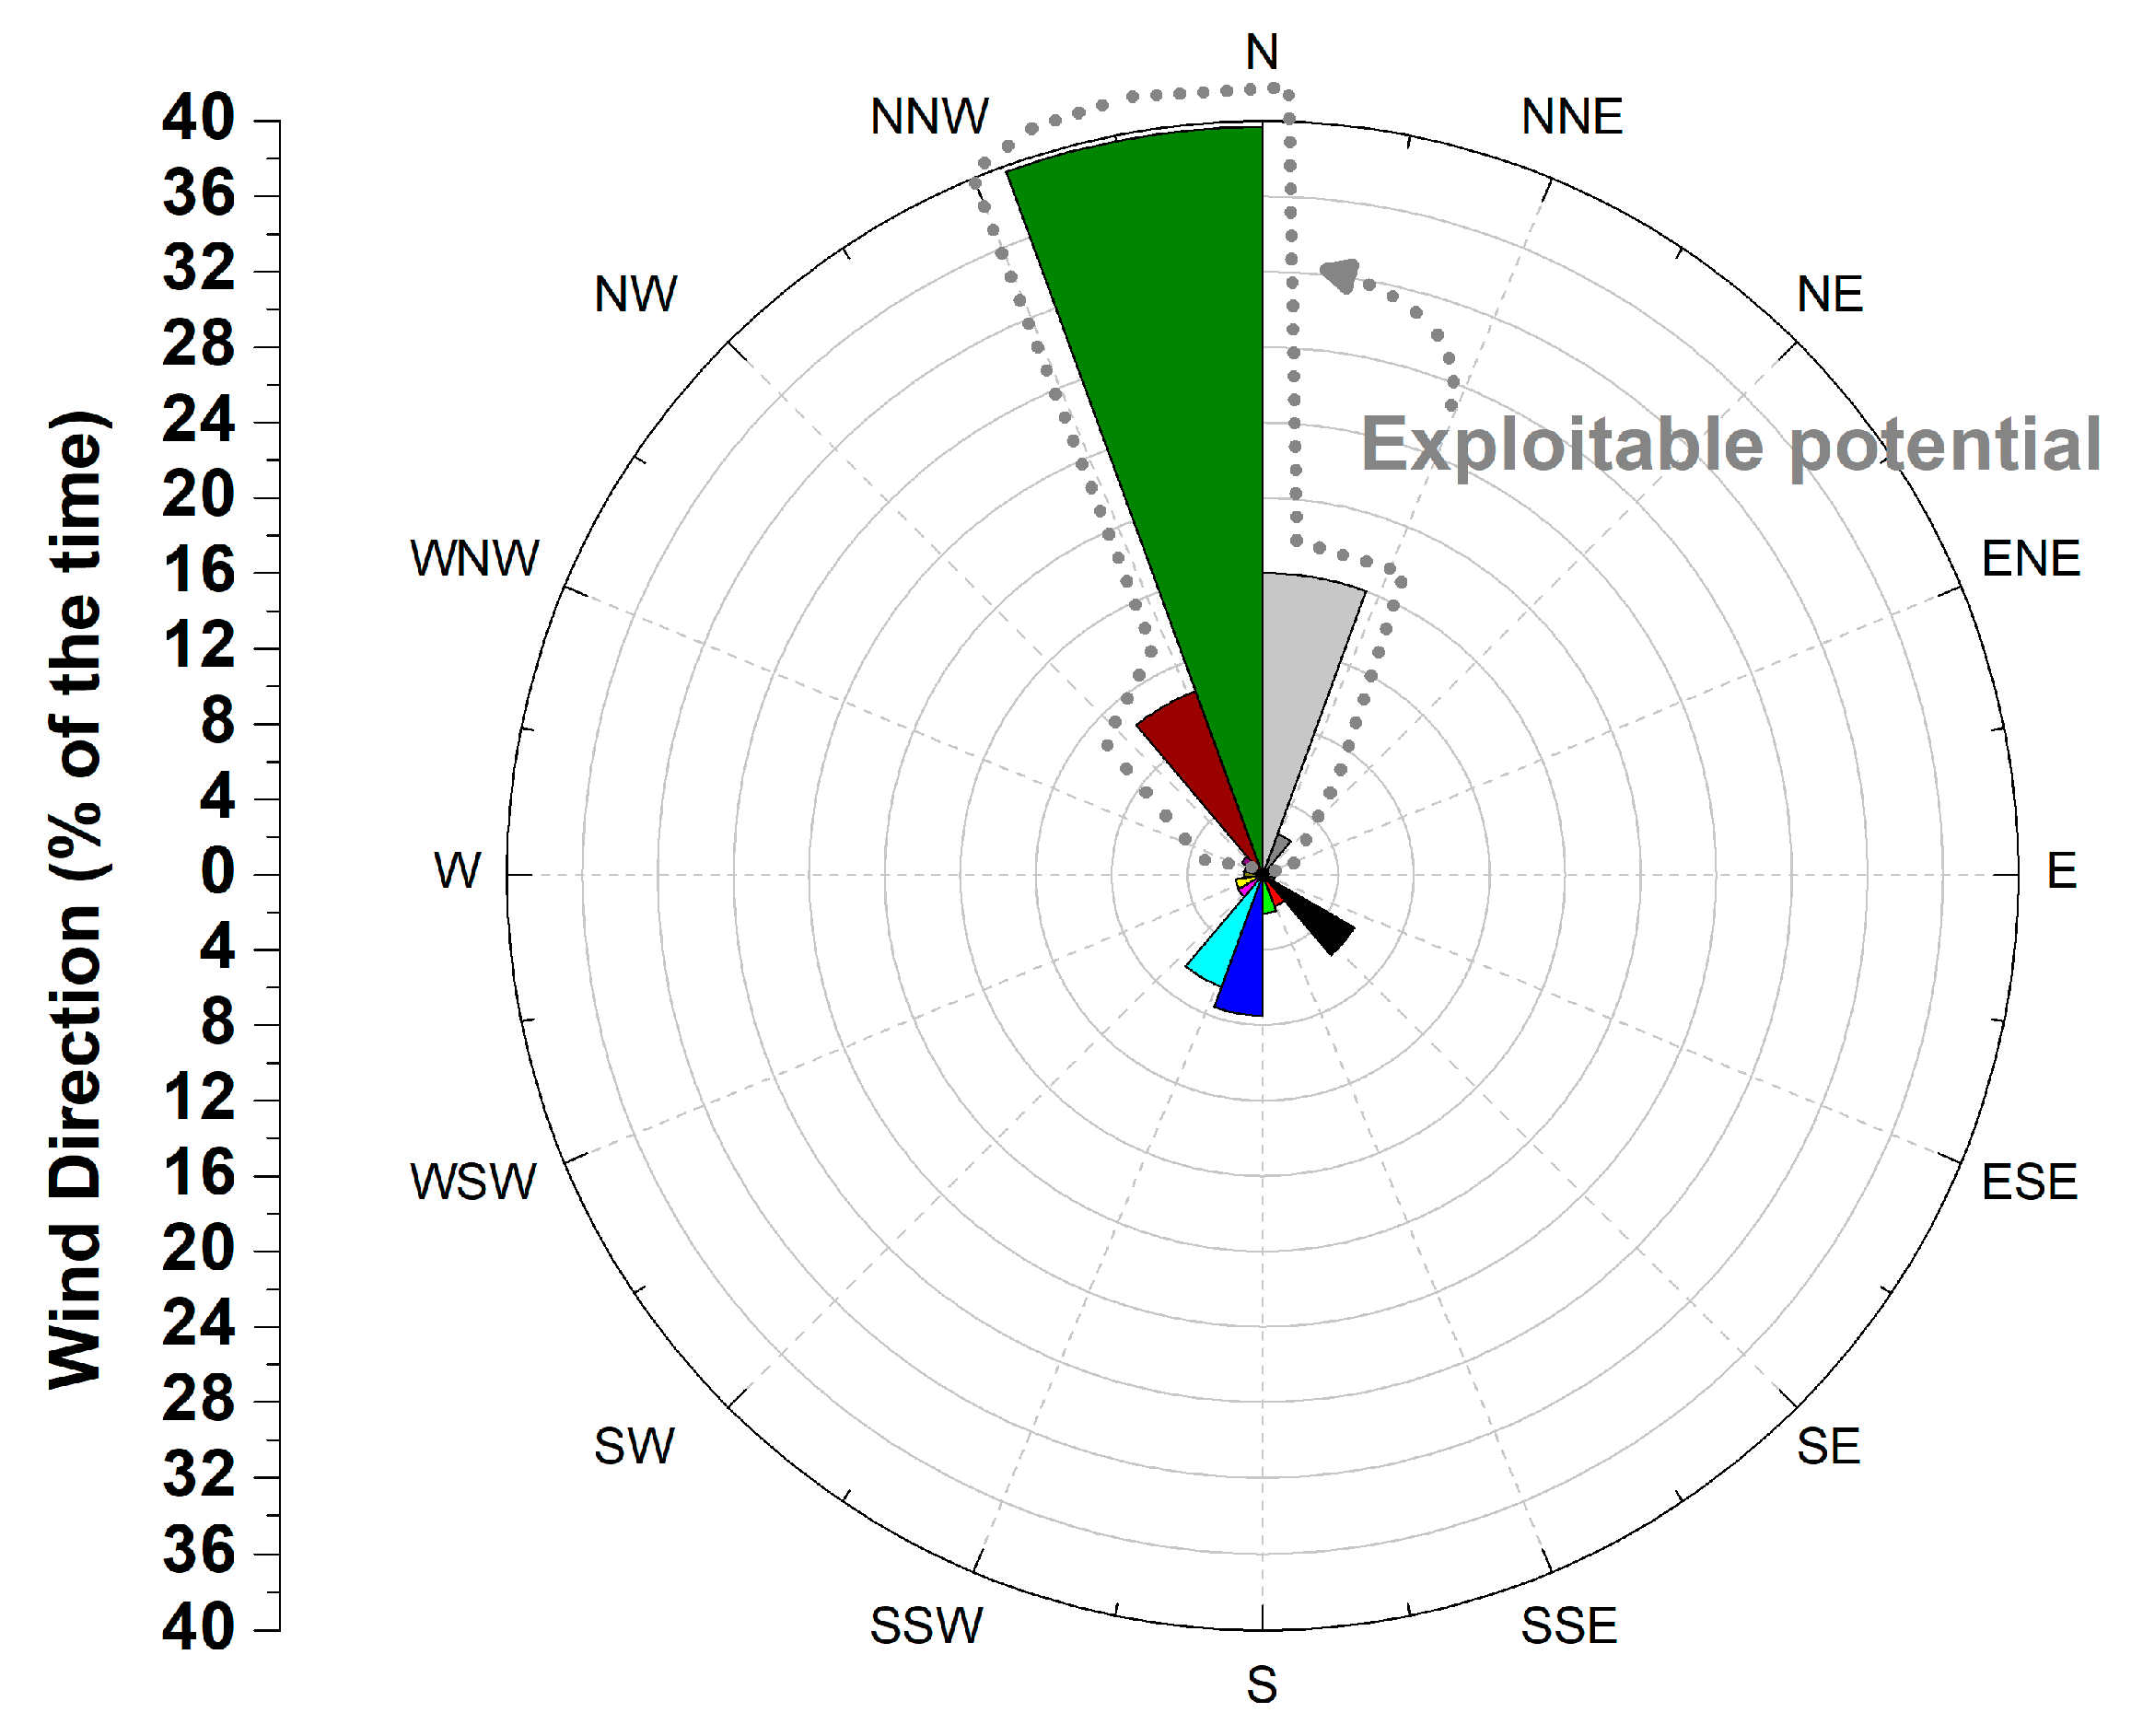
Eastern Crete is characterized by consistent northwest wave potential, an optimal condition for the Wave Dragon converters, which cannot be easily reoriented to accommodate varying wave directions. The wind rose diagram in Figure 4 confirms that the wave potential predominantly aligns northwest for approximately 80% of the year, making it suitable for fixed Wave Dragon converters.
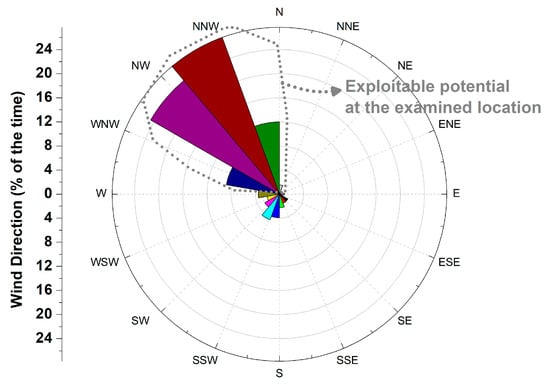
Figure 4.
Wind rose diagram for facility location (eastern Crete).
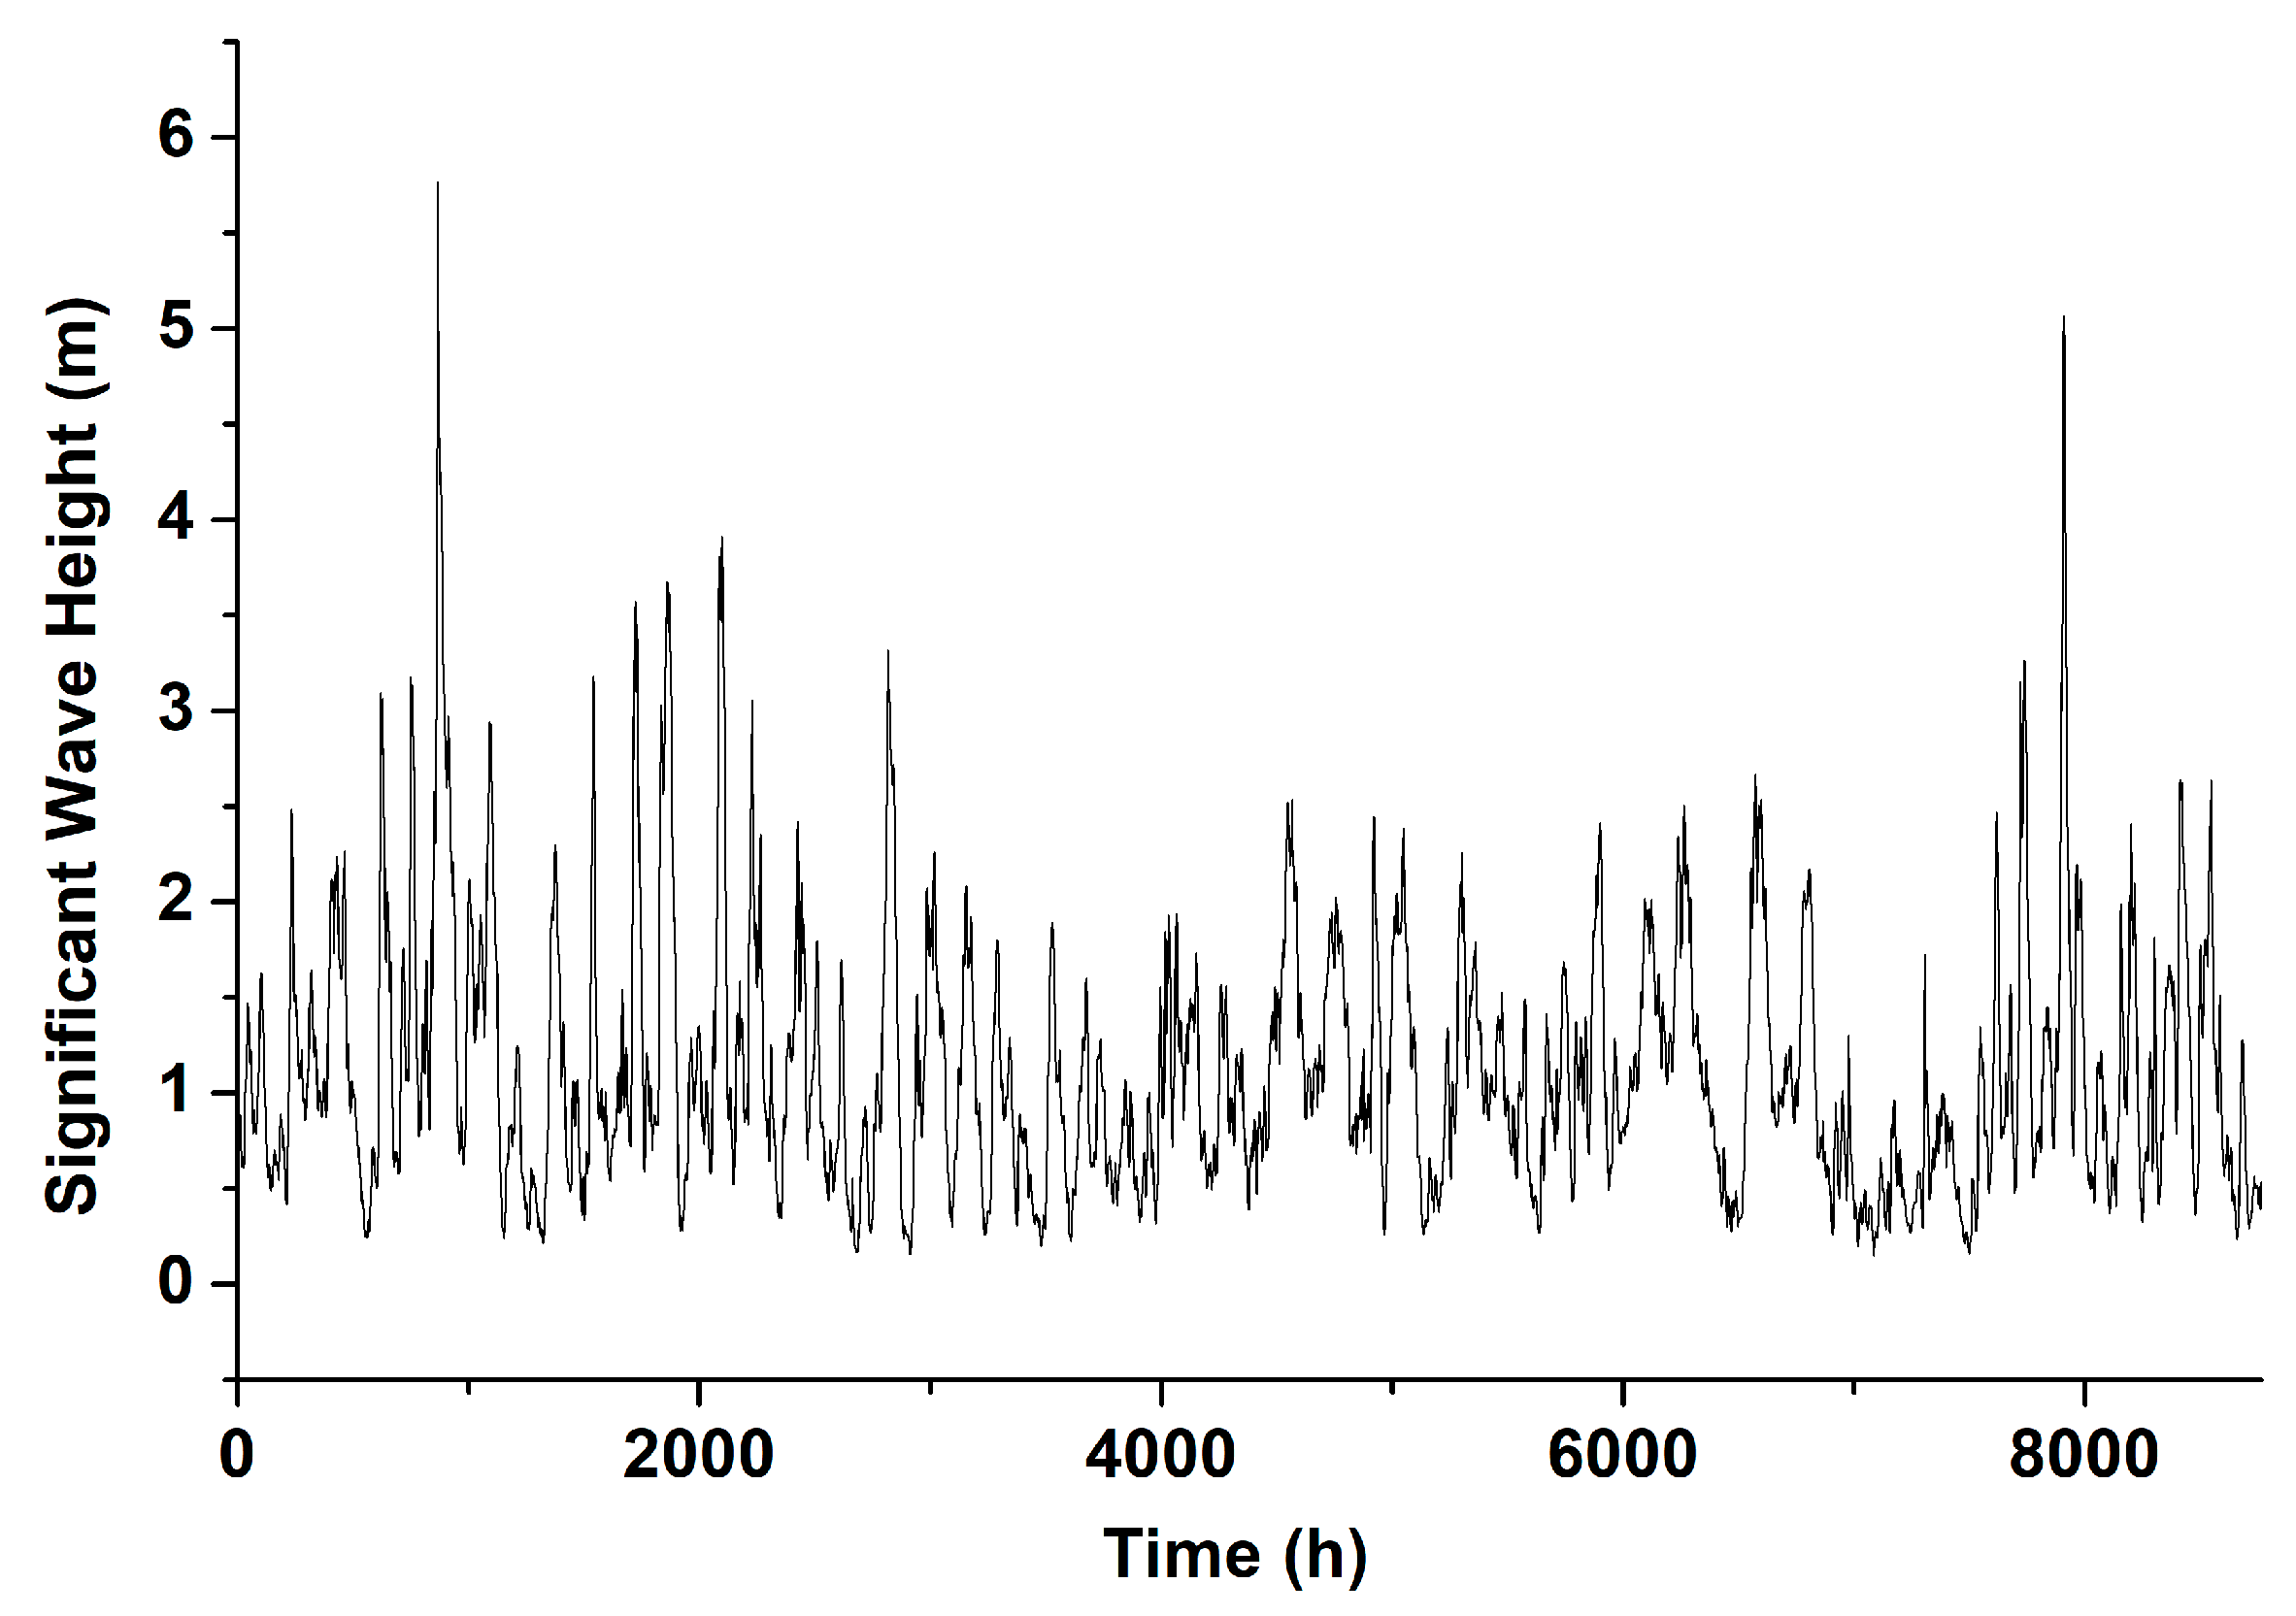
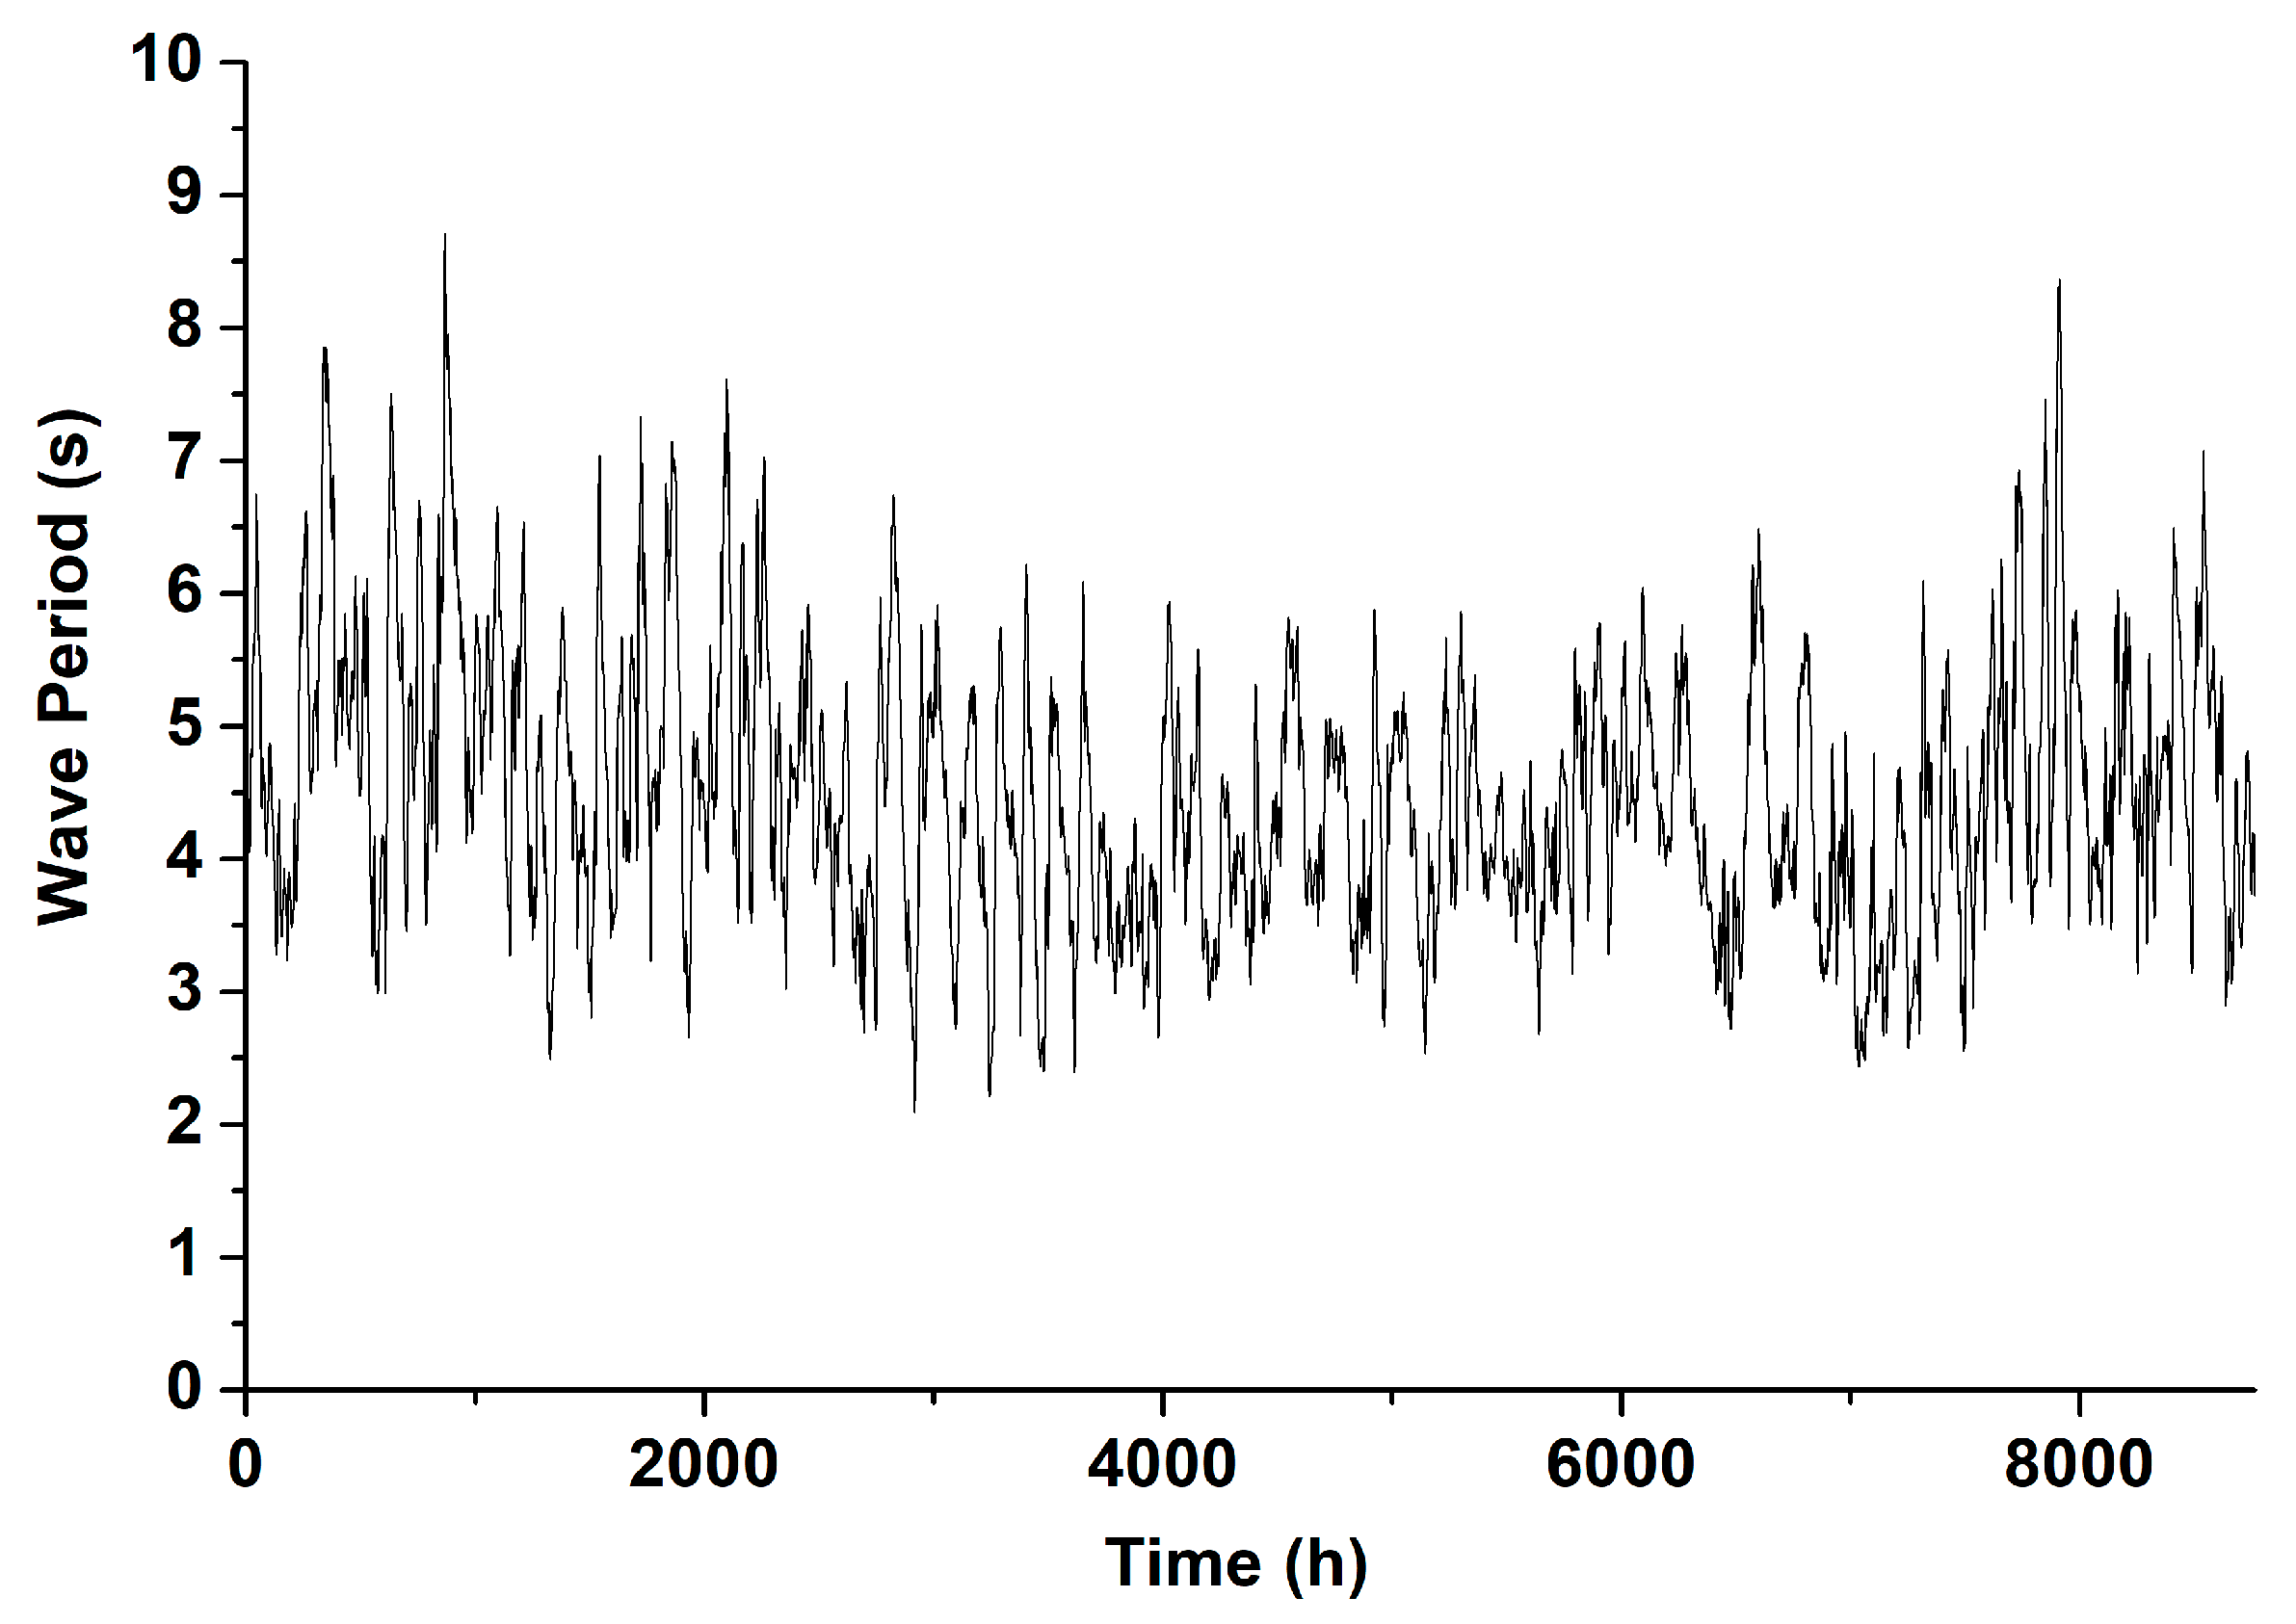
Figure 5 and Figure 6 detail the significant wave height and wave energy period at the chosen location for 2023. Here, ranges from 0.5 m to 4 m, while varies from 2.5 s to 8 s. Given these conditions, the 1.5 MW Wave Dragon converter model is deemed most appropriate for harnessing the power profile of this region, as discussed in Section 3.
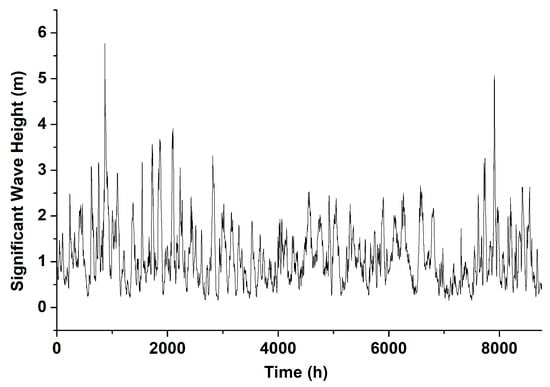
Figure 5.
Significant wave height for the year 2023 between Crete and Kasos [39].
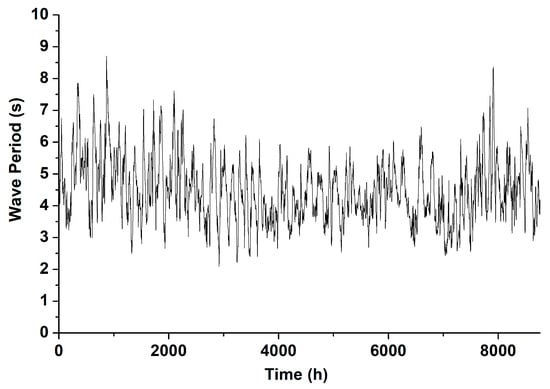
Figure 6.
Wave energy period for the year 2023 between Crete and Kasos [39].
The proposed layout and spacing of the wave power farm are depicted in Figure 7. The farm is planned to have a nominal power capacity of 45 MW, consisting of 30 × 1.5 MW Wave Dragon converters, arranged to capitalize on the prevailing northwest wave direction. Owing to the short distance to Crete (approximately 15 km), the wave farm could be connected to Crete’s power grid via an AC submarine cable, with nominal voltages ranging from 33 kV to 66 kV [35].
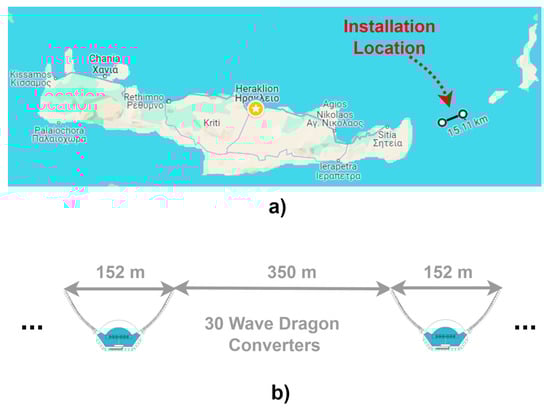
Figure 7.
(a) Installation location of wave power facility on the eastern coast of Crete (image from Google Maps), and (b) layout and spacing details for Wave Dragon converters.
3. Methodology and Data
The methodology adopted in this study is structured into three distinct phases:
- Electricity Generation Calculation: Initially, the annual electricity output of the wave power facility is determined utilizing wave data from the Copernicus Marine System database [39]. These data include significant wave height , wave period , and wave direction specific to the area between eastern Crete and Kasos.
- Cost Estimation: The second phase involves a detailed review of the existing technical literature on wave generators to estimate the cost of the facility. This comprehensive assessment helps ensure that all potential expenses are considered.
- Techno-Economic Analysis: The final phase involves deriving techno-economic indicators such as LCOE and NPV through sensitivity analysis. This analysis aims to assess the economic viability of the wave power facility, providing crucial insights into its potential profitability and sustainability.
3.1. Phase 1: Annual Electricity Production
There are two approaches to calculating the power output of a wave energy converter. The first employs power matrix data, directly correlating the WEC’s power output with the significant wave height and the peak wave period. The second method involves calculating the WEC’s power by multiplying the raw wave power, as described in Equation (2), by constant hydrodynamic efficiency (). For the 1.5 MW Wave Dragon model discussed in this paper, we utilized the second approach due to the lack of specific power matrix data. Although the literature, such as reference [11], does mention power matrices for the Wave Dragon model, these are applicable to higher-power versions intended for regions with high wave potential, not the Mediterranean. Applying these matrices to the Mediterranean context would lead to significantly lower capacity factors and inefficient utilization of the equipment.
Wave data for the location between Crete and Kasos, specifically significant wave height, period, and direction, were sourced from the Copernicus Marine System [39] and analyzed on an hourly basis over a full year. Figure 5 and Figure 6 illustrate the respective and data for this site for each hour t ∈ {1, …, 8760}.
Following the methodology proposed by Besio et al. [40], the wave power flux per unit width of the wave crest at time t, denoted as P (t) and measured in kilowatts per meter (kW/m), is calculated. This calculation utilizes the spectral output from the wave model [10,40]:
where represents the directional wave energy spectrum, is the frequency, and is the direction of propagation of the spectral component. Additionally, denotes the water density, represents the gravitational acceleration, is the group velocity and is the water depth. For situations typical of deep water (h/L > 0.5, with L being the wavelength) an approximation of Equation (2) can be utilized. This is commonly applied in such contexts [41,42,43,44,45]:
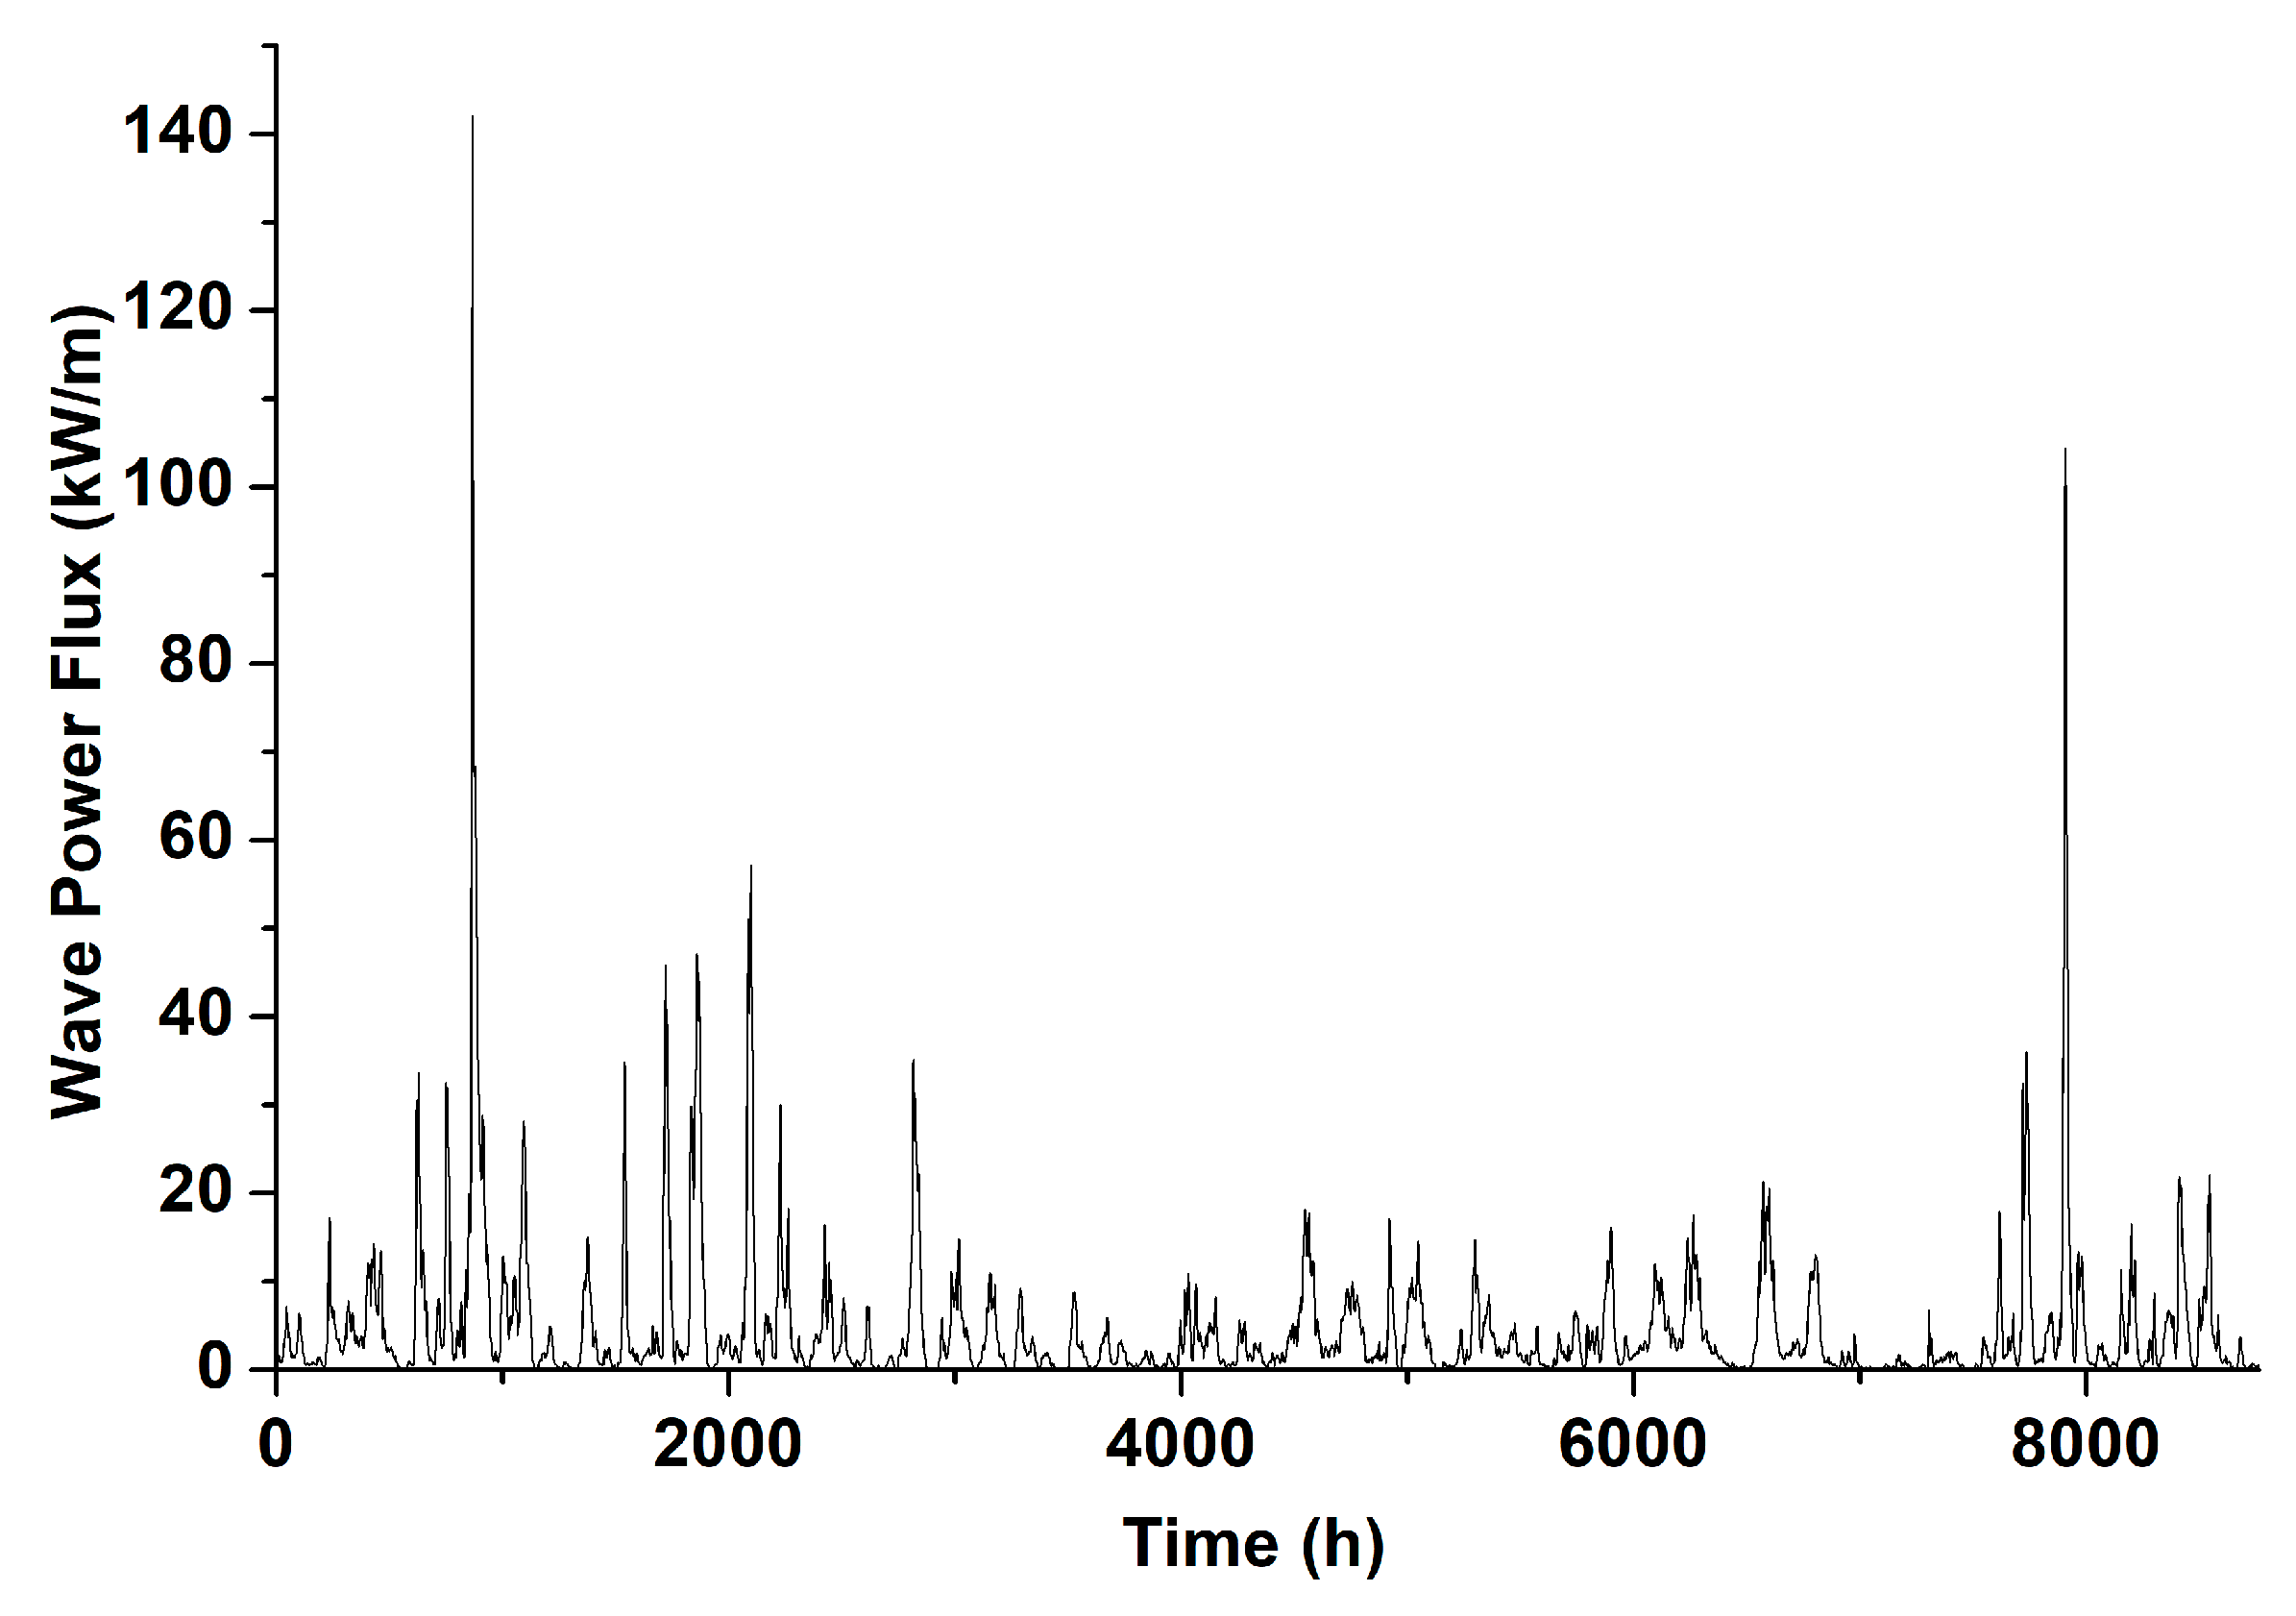
Utilizing Equation (2) along with the and data obtained by the Copernicus Marine System [39]—which underwent specific adaptations, as detailed in Appendix A—the wave power flux can be calculated, as shown in Figure 8, for each hour t ∈ {1, …, 8760}. The total annual wave energy flux per unit width is given in (3).
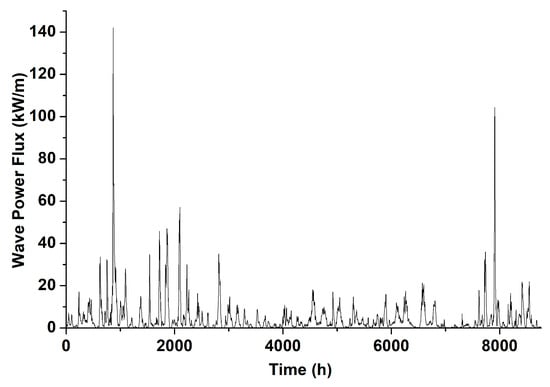
Figure 8.
Wave power flux for the year 2023 between Crete and Kasos.
The total annual electric energy generated by the entire wave power facility, consisting of 30 wave energy converters (WECs), is detailed in Equation (4). The parameters used in this equation are further explained below:
- The distance between the edges of the reflectors for the 1.5 MW wave energy converter (WEC) under examination is 152 m, as shown in Figure 7.
- : This denotes the hydrodynamic efficiency of the Wave Dragon converters, calculated as the ratio of the wave energy harvested and stored in the reservoir to the wave energy passing through the area, defined by the width between the reflector edges. This efficiency metric reflects the converter’s capability to harness available wave energy and varies from 0.25 to 0.35, as reported in sources [18,34,46,47].
- , , : These values represent the efficiencies of the Kaplan turbine, PMSGs, and power electronic converters, which are assessed at 0.91, 0.94, and 0.98, respectively [34].
- : This parameter reflects the availability of wave energy converters (WECs), accounting for the time they are out of service due to maintenance or failures. In this study, it is quantified as 0.98.
- : This factor accounts for the shading effect between wave energy converters (WECs) [48]. The Wave Dragon converters are positioned adjacent to each other and oriented toward the dominant northwest wave direction, as depicted in Figure 7. According to Figure 4, the waves exhibit exploitable northwest potential 80% of the time. While the Wave Dragon devices are constructed as floating and semi-moored, allowing for some modifiability of their reflectors to follow the wave direction [49], they still experience shading when wave directions deviate from the northwest. Reflecting the findings in the rose diagram of Figure 4, the shading factor is set at 80% to quantify the impact of this shading effect on the WECs.
The analysis outlined here offers wide-ranging global applicability by adjusting key parameters that are location-dependent: wave energy period , significant wave height , and the shading coefficient . In this context, the methodology described in Section 3 is sufficiently general and can be broadly applied across various geographical settings.
3.2. Phase 2: Facility Cost
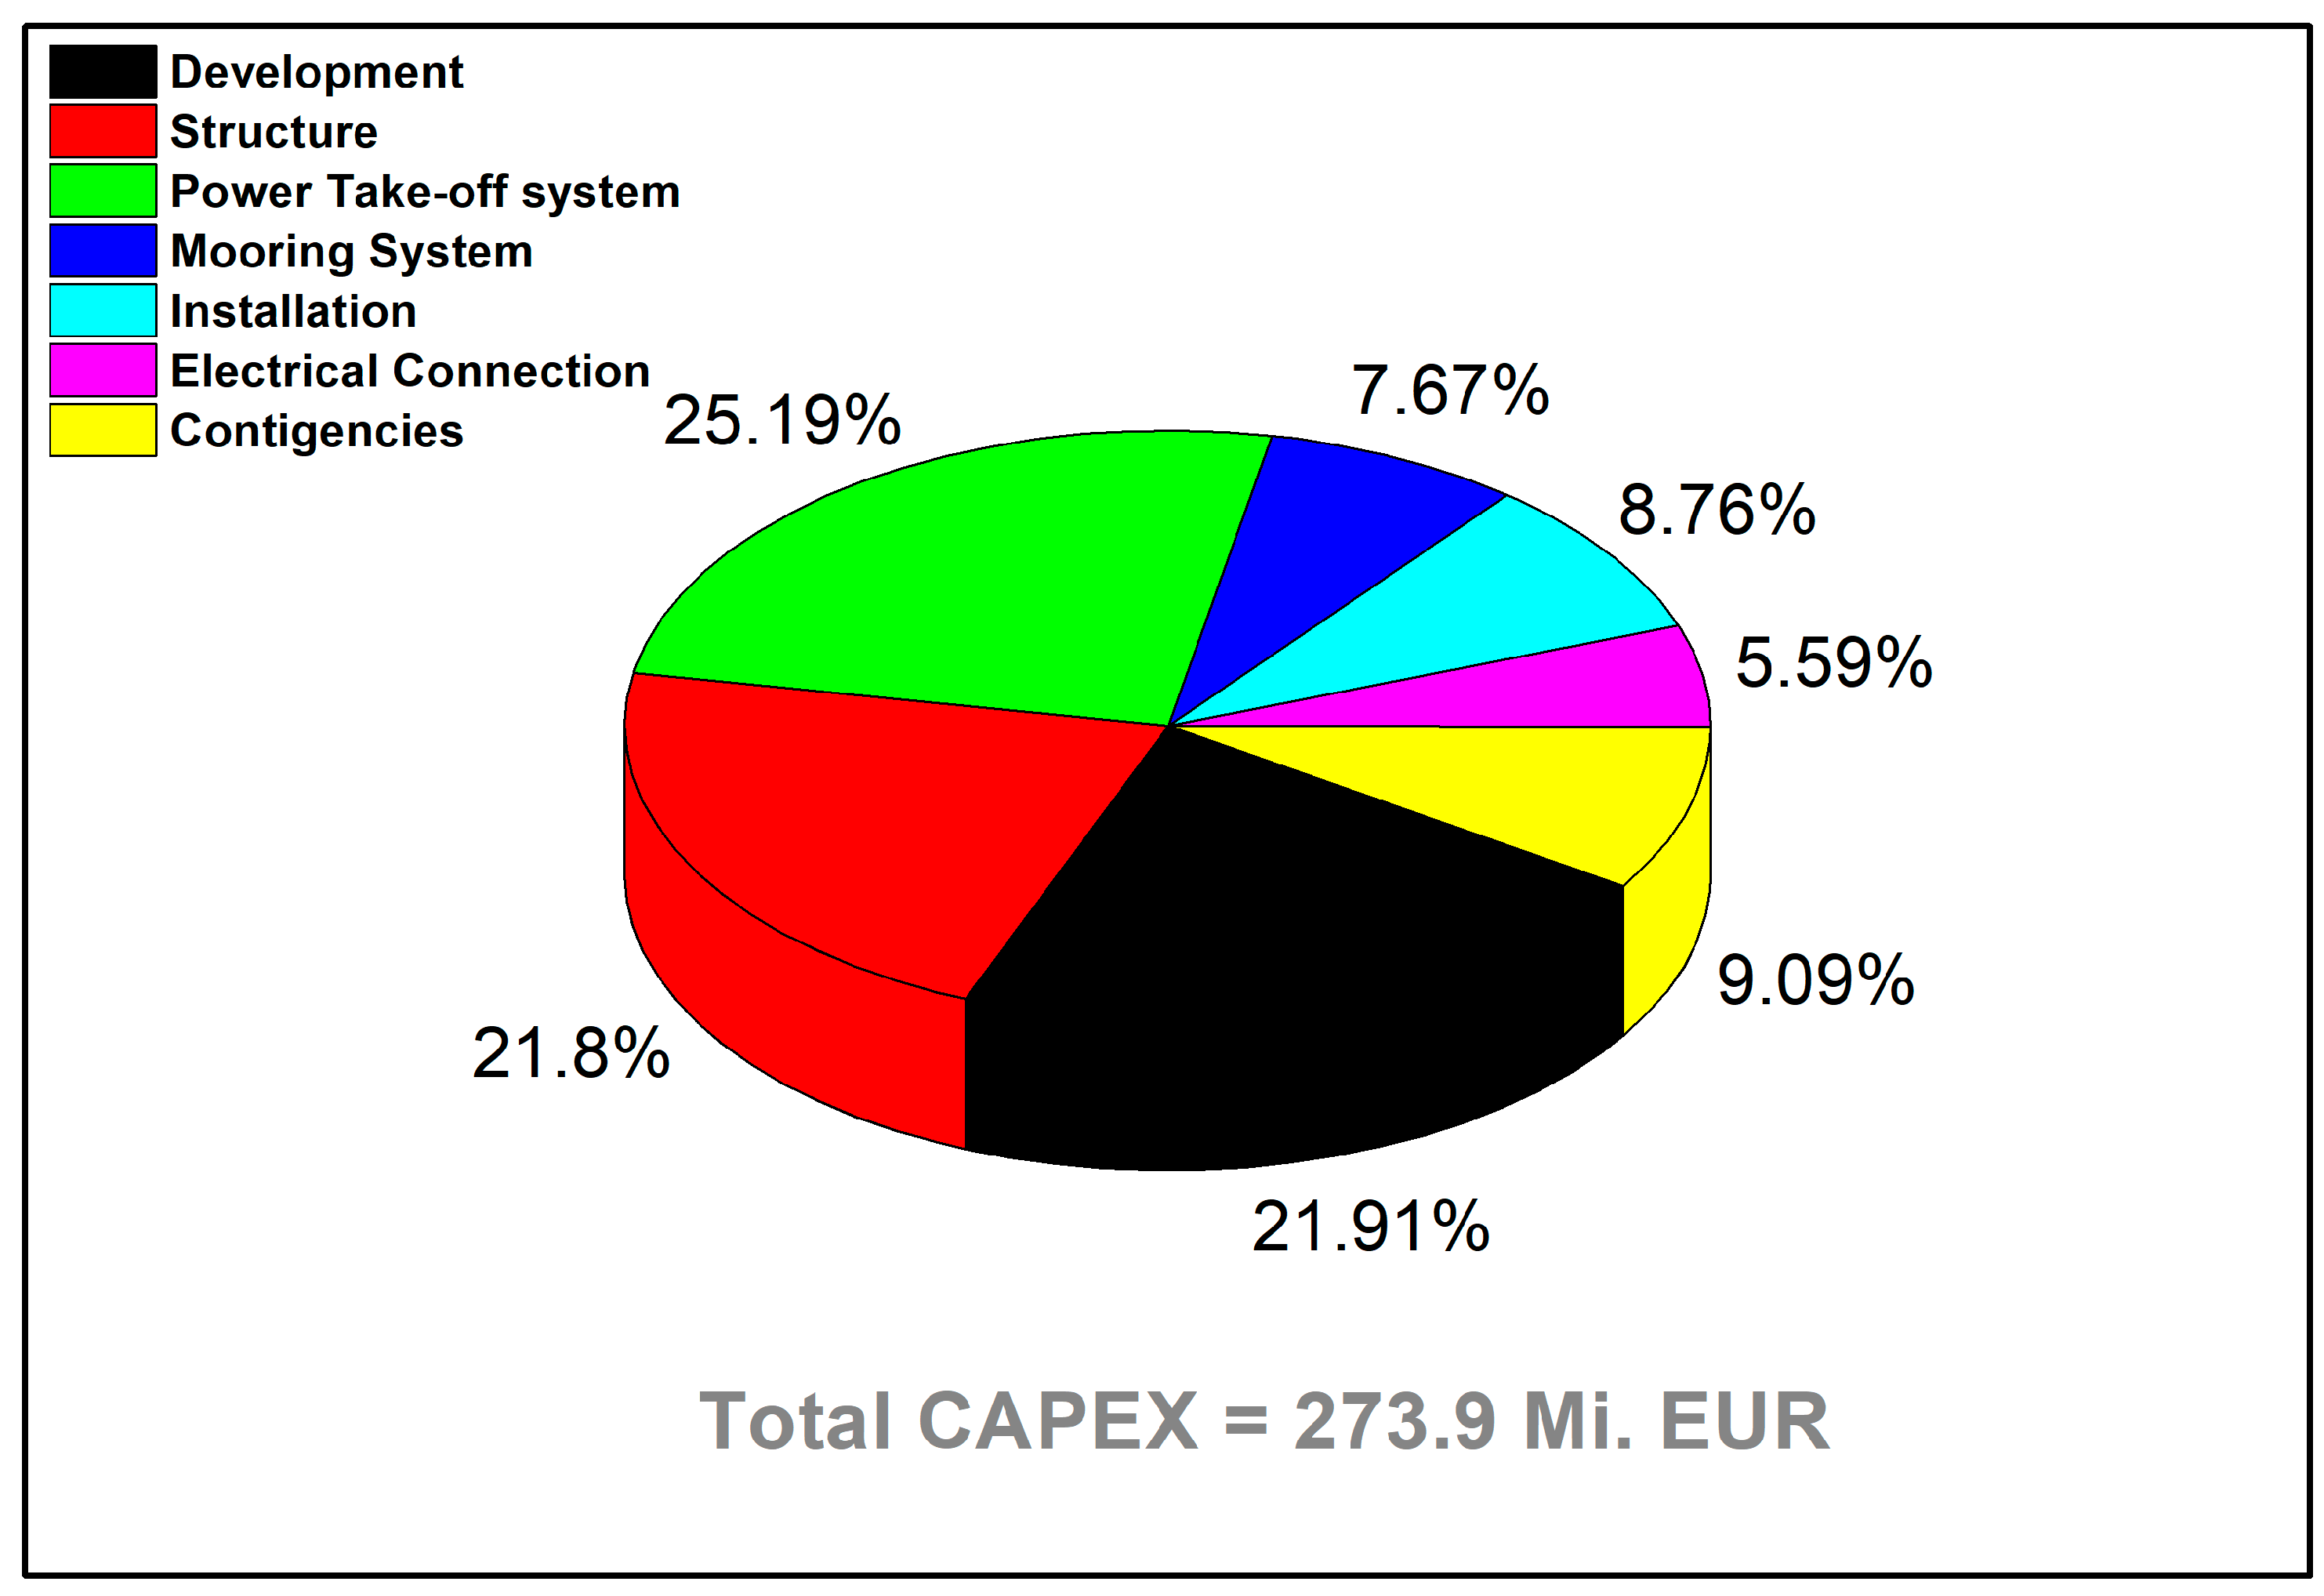
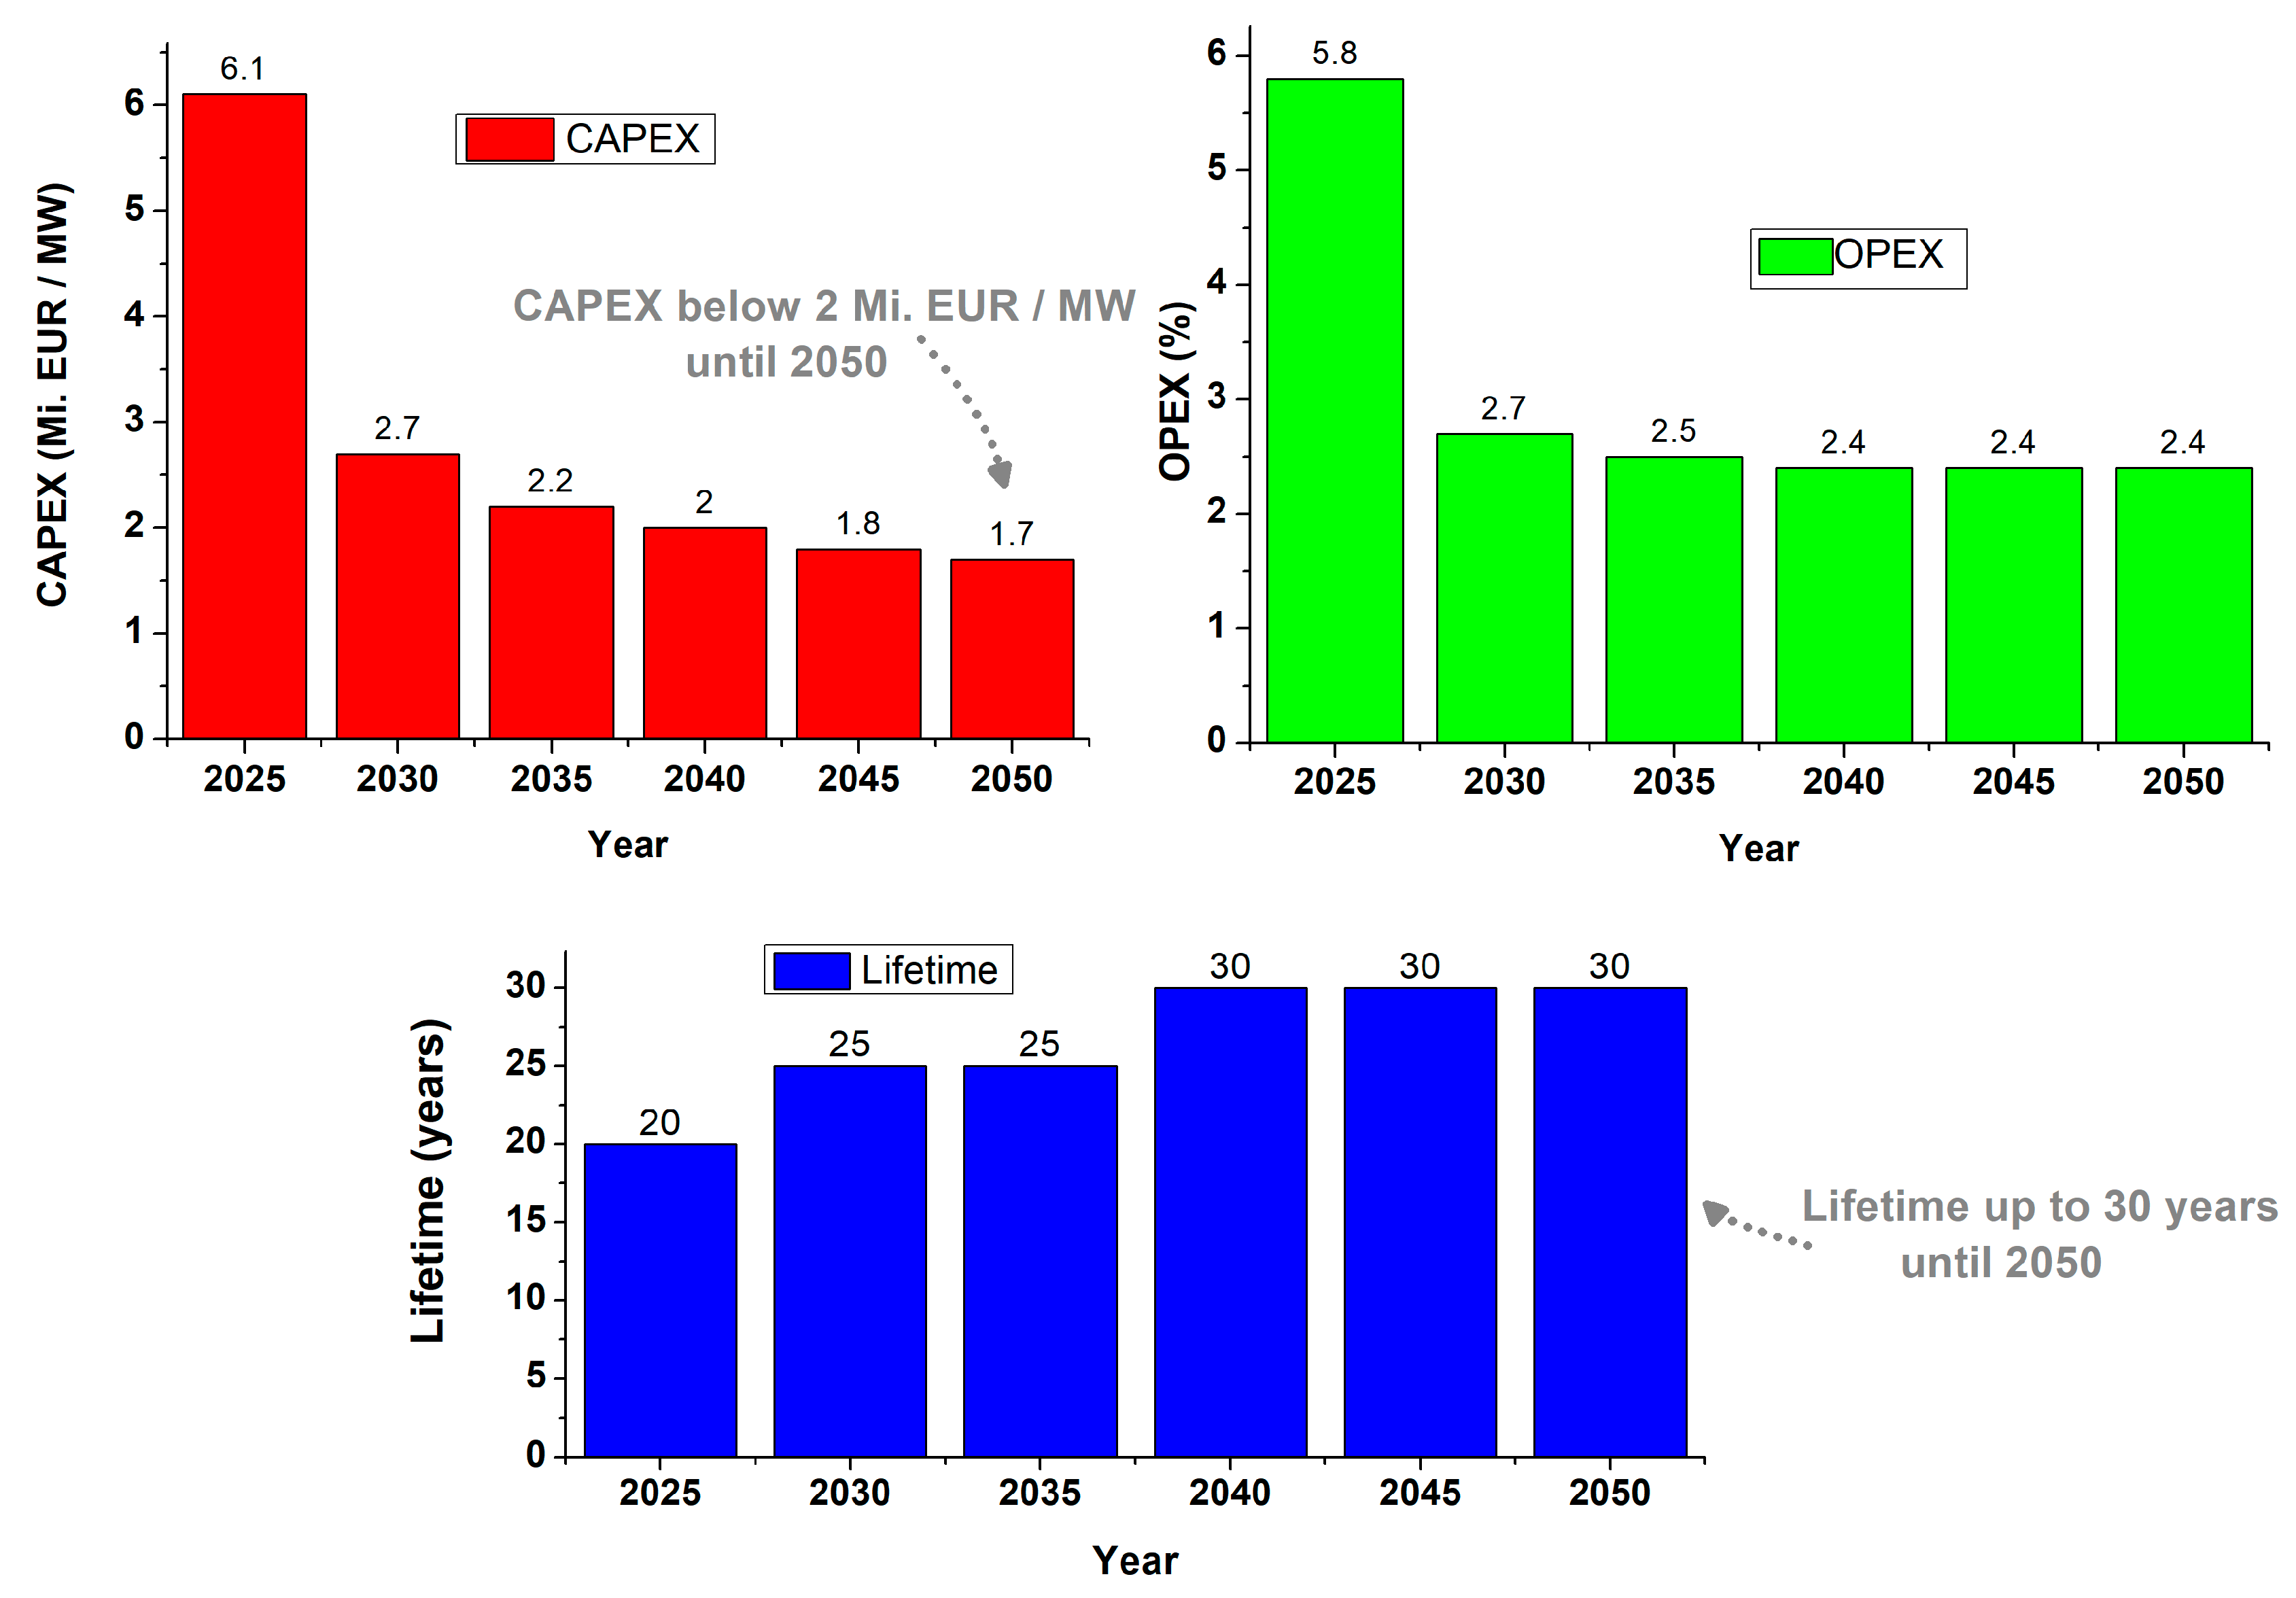
The cost breakdown of the investigated wave power facility is quoted in Table 1 and Figure 9. The initial installation cost, or capital expenditure (CAPEX), amounts to EUR 273.9 million (Mi. EUR). This figure is derived from the CAPEX estimates found in [35], aligning with the cost projections in [4,50,51]. However, due to anticipated commercialization advances, CAPEX is expected to significantly decrease to below 2 Mi. EUR per MW by 2050, as illustrated in Figure 10 [4]. Operational expenditure (OPEX) encompasses all costs related to the operation of a wave power farm from the issuance of a takeover certificate. This includes expenses for operation and maintenance (O&M) activities, site leasing, and insurance. OPEX is projected to decline from 5.8% to 2.4% by 2050, particularly for facilities situated near the coast, as depicted in Figure 10 [4]. Moreover, the operational lifetime of WECs is expected to extend from 20 to 30 years, especially in milder marine environments like the Aegean Sea, which are less prone to extreme events [4].

Table 1.
Breakdown cost of the wave power facility [35].

Figure 9.
Pie chart of the breakdown cost of the examined wave power facility.

Figure 10.
Estimated evolution of CAPEX (top left), OPEX (top right), and lifetime (bottom) of wave converters until 2050 [4].
3.3. Phase 3: Levelized Cost of Energy—Net Present Value
The economic feasibility of the wave power facility is assessed by evaluating the LCOE and the NPV of the investment. The LCOE is calculated using Equation (5), as follows:
In Equation (5), represents the total electric energy produced by the wave power facility, as determined in Equation (4). The capital recovery factor () is calculated as described below:
In (6), the weighted average cost of capital (WACC) depends on inflation, which is considered at 3% in this study.
The net present value (NPV) of the investment is calculated using Equation (7).
In this context, represents the selling price of the electricity produced by the facility, and ‘lifetime’ refers to the duration of the investment.
4. Results
4.1. Levelized Cost of Energy
Due to difficulties in accurately determining the specific characteristics of the facility, such as its lifetime, CAPEX, and OPEX, the economic analysis is segmented into five scenarios:
- ▪
- Scenario 1: Assumes a hydrodynamic efficiency () of 25% for the Wave Dragon converter, with a facility lifespan of 20 years.
- ▪
- Scenario 2: Assumes equal to 30%, with a facility lifetime of 20 years.
- ▪
- Scenario 3: The is kept at 30%, while the lifetime is increased to 25 years.
- ▪
- Scenario 4: Efficiency rises to 35%, with a lifetime of 25 years.
- ▪
- Scenario 5: Efficiency remains at 35%, with the facility lifespan extended to 30 years.
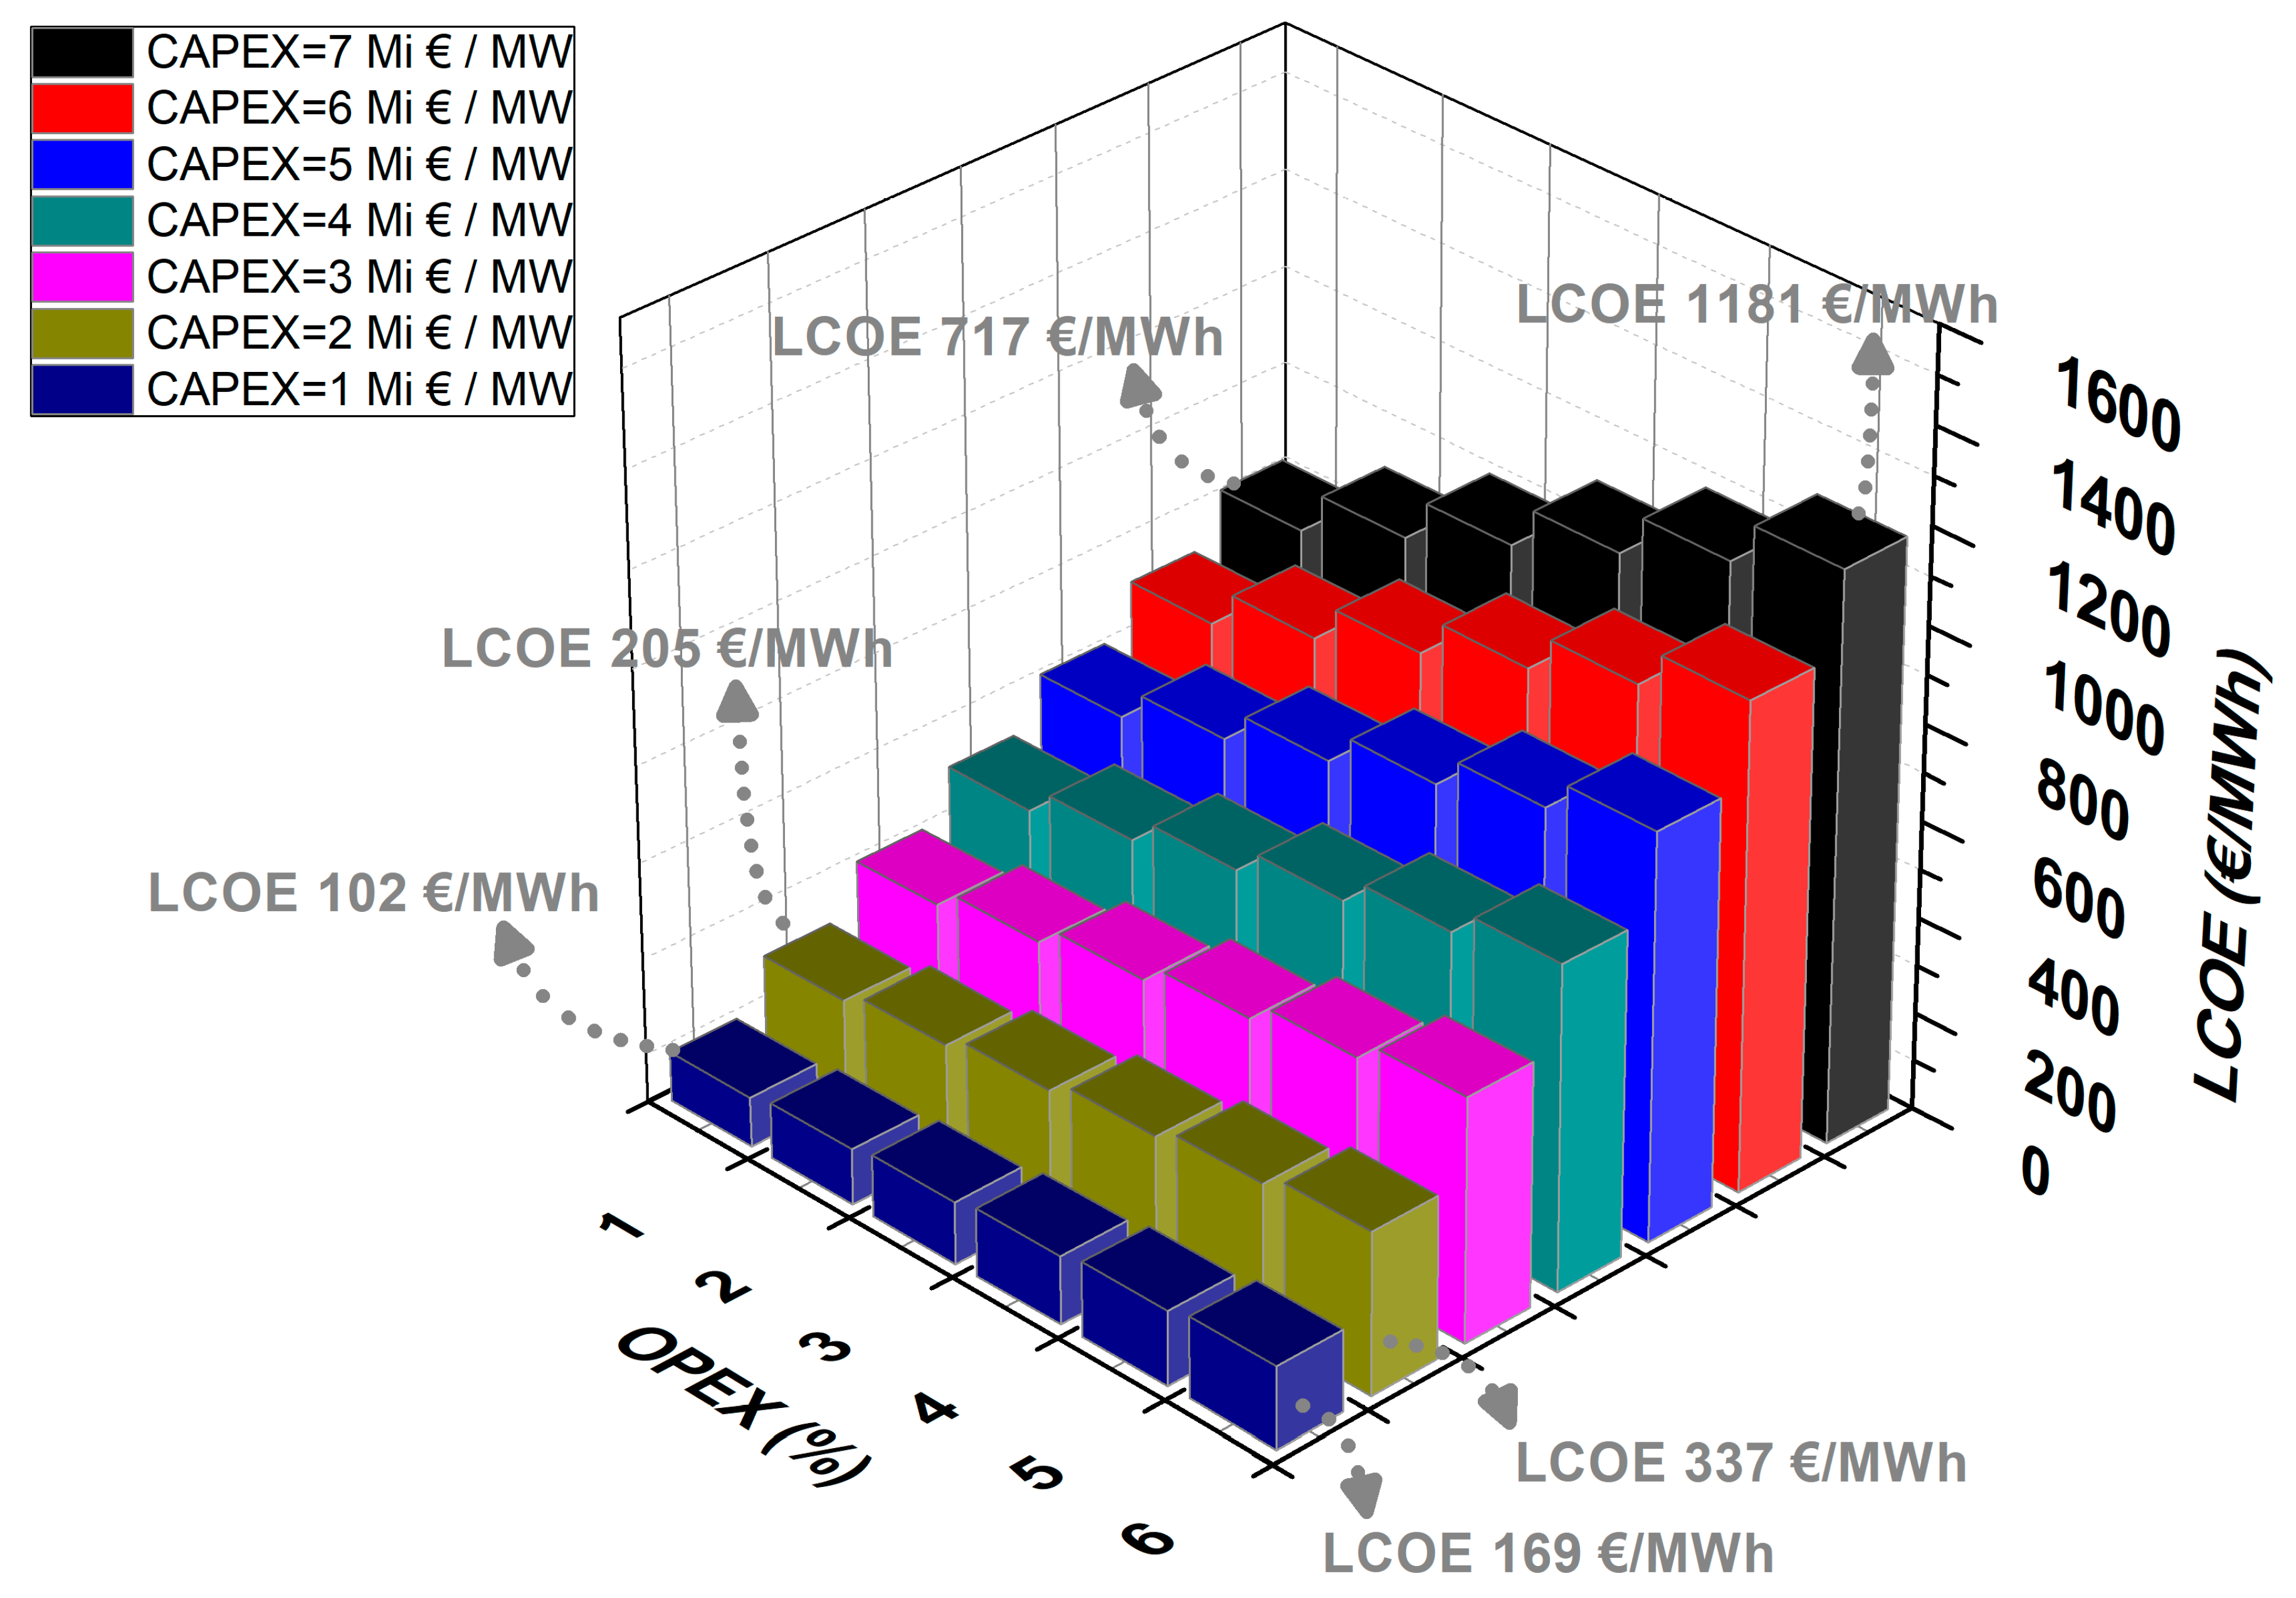
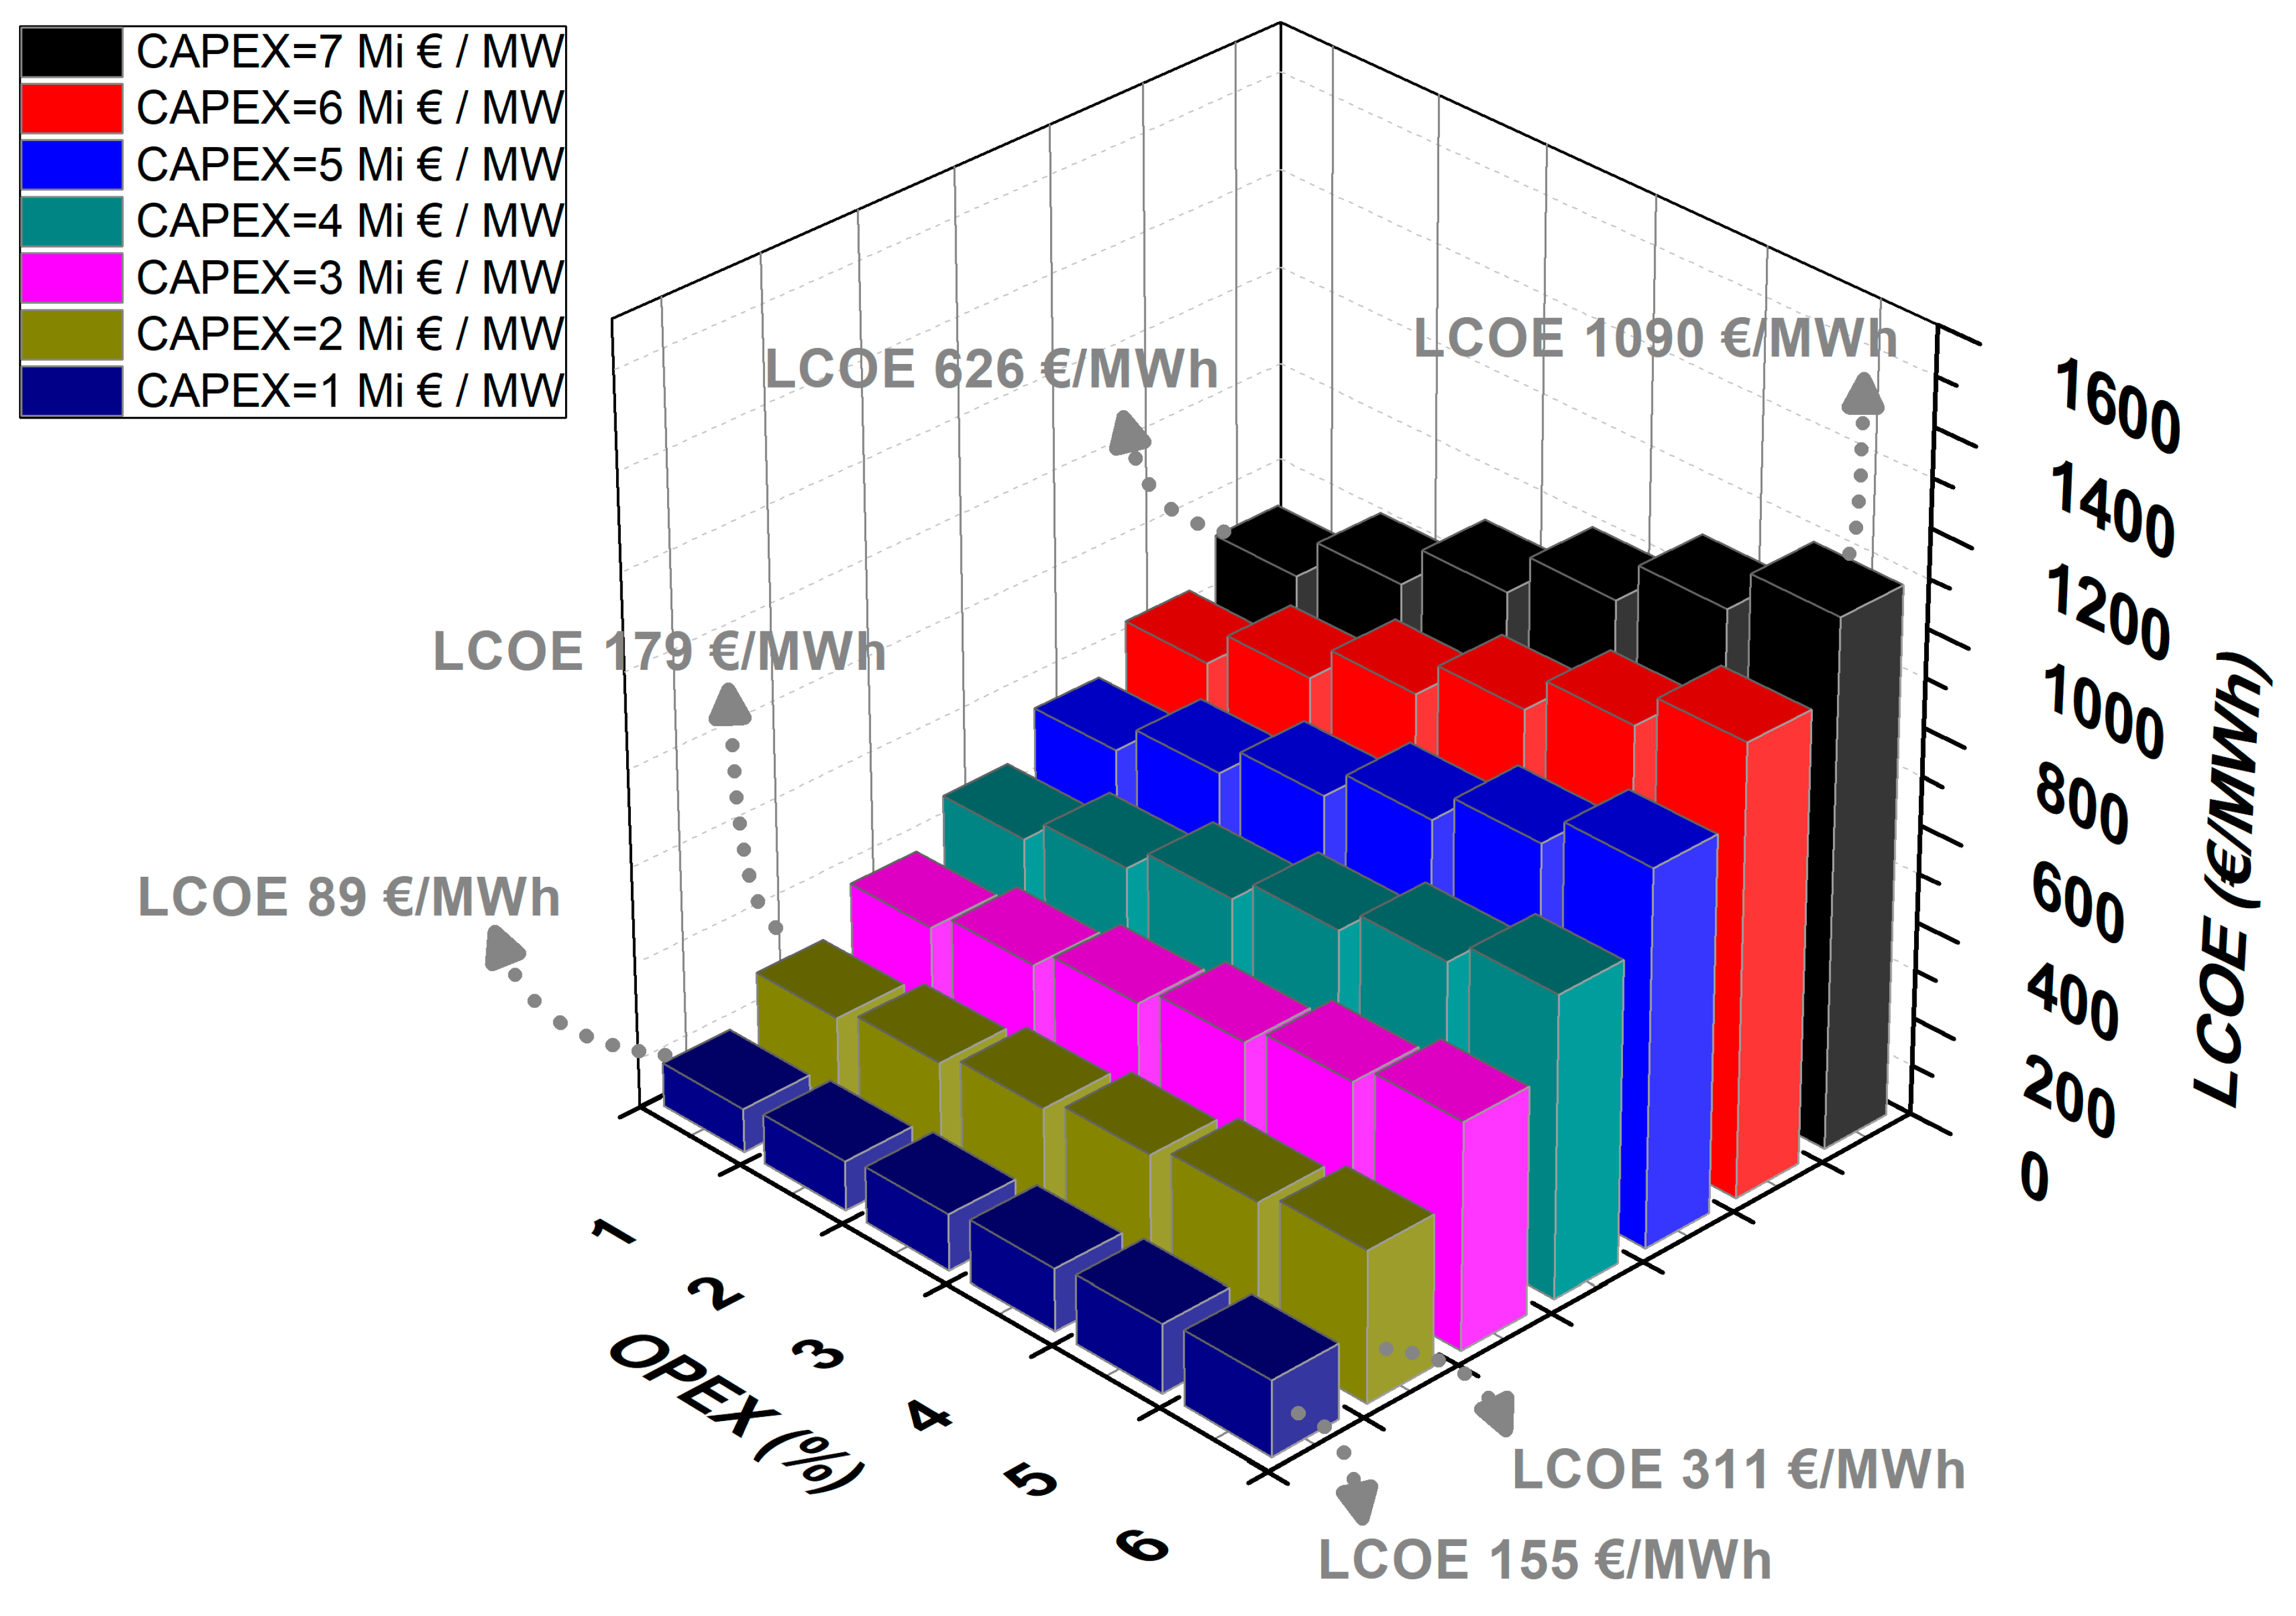
The LCOE for Scenario 1 is illustrated in a three-axis graph in Figure 11. The CAPEX values are plotted on the x-axis, ranging from EUR 1 million to EUR 7 million. This range covers all expected CAPEX costs and projected reductions through to the year 2050, as illustrated in Figure 10. The y-axis displays the annual OPEX as a percentage of CAPEX, varying from 1% to 6%. The z-axis shows the LCOE in EUR/MWh. With the current CAPEX of EUR 7 million and OPEX at 6%, the LCOE peaks at 1417 EUR/MWh; this is significantly higher than the current LCOE in Crete, which ranges from 237 to 300 EUR/MWh [1]. This figure is also uncompetitive when compared to the LCOE of offshore wind power, currently estimated between 72 EUR/MWh and 140 EUR/MWh [52]. Nevertheless, with the anticipated reduction in CAPEX and OPEX for wave power, the LCOE could potentially decrease to as low as 123 EUR/MWh, assuming CAPEX and OPEX are reduced to EUR 1 million and 1%, respectively.
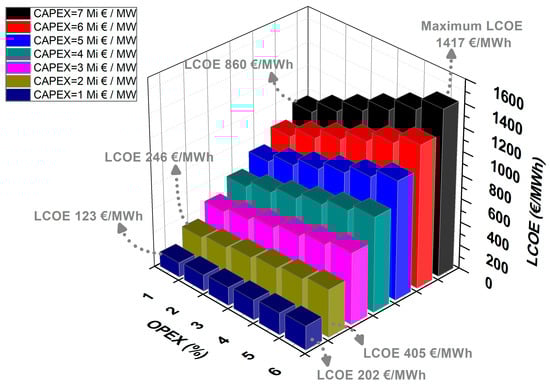
Figure 11.
Scenario 1: = 25%, lifetime = 20.
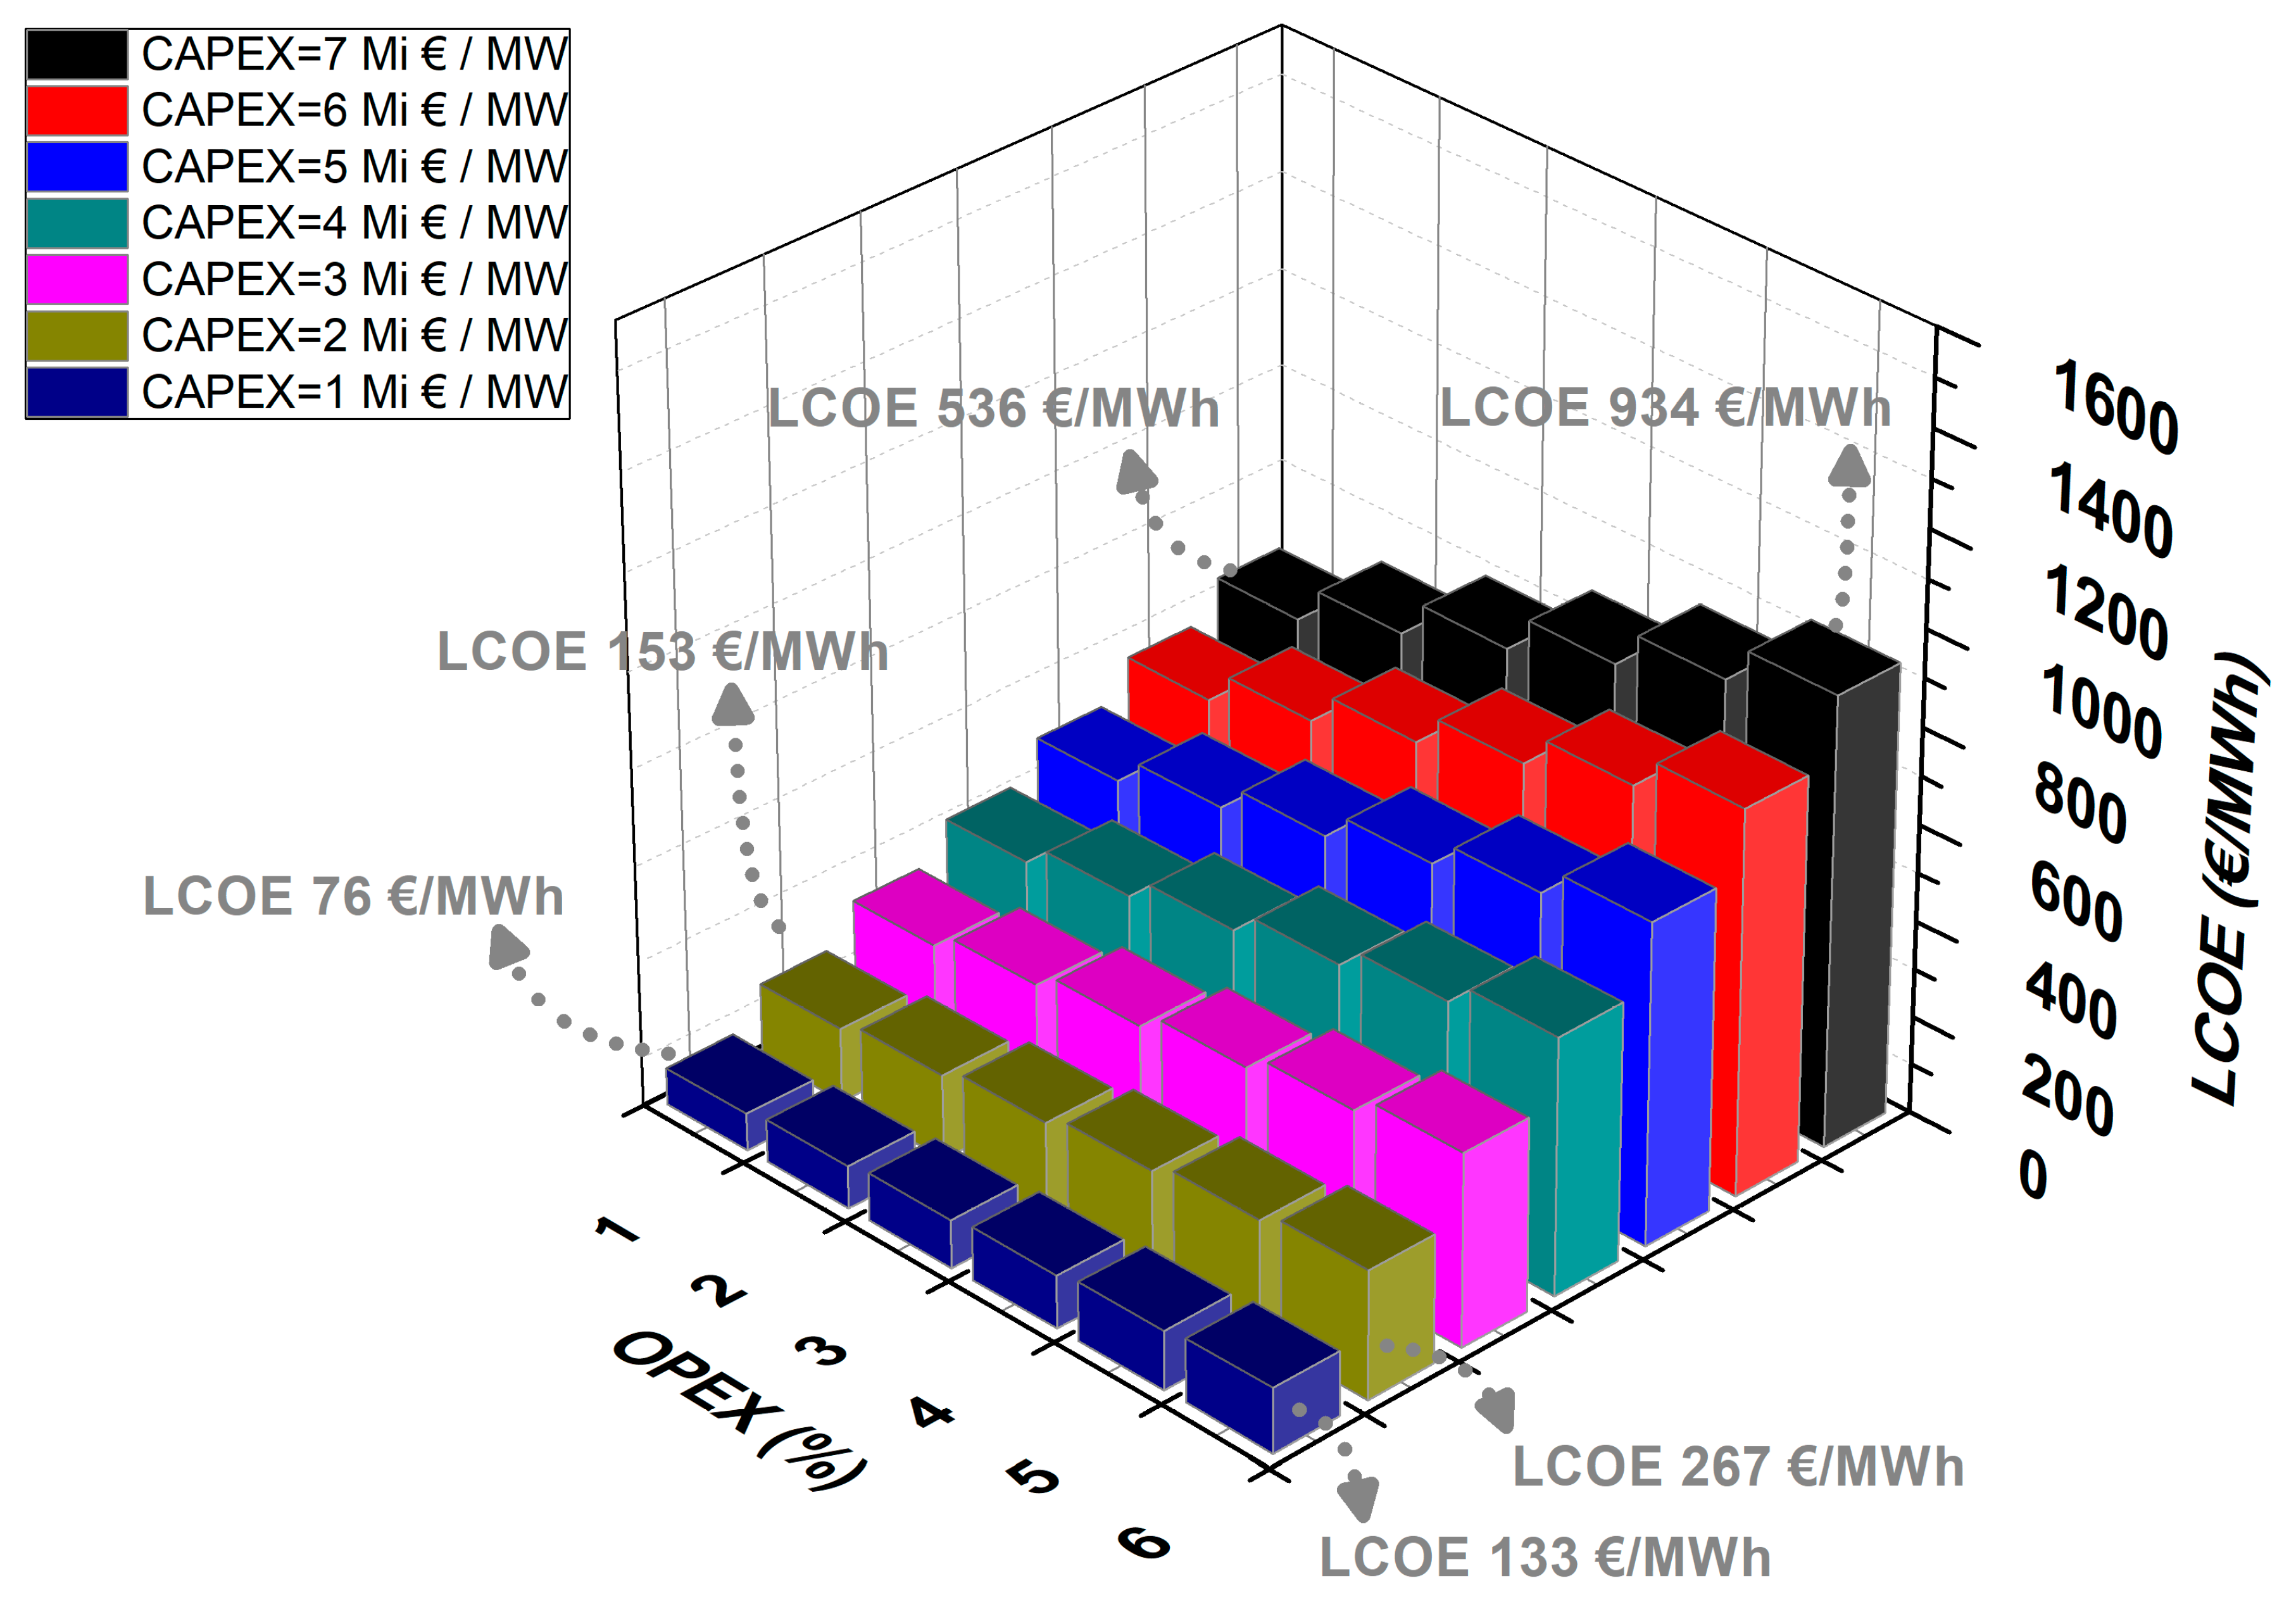
The LCOE for Scenario 2 is depicted in Figure 12. Here, the LCOE is reduced in comparison to Scenario 1, attributed to the higher efficiency of the WECs used. The LCOE spans from 102 EUR/MWh to 1181 EUR/MWh. Figure 13 displays the LCOE for Scenario 3. By increasing the facility’s lifespan to 25 years while sustaining a 30% efficiency, the LCOE decreases to as low as 89 EUR/MWh under the most optimistic CAPEX and OPEX estimates. The LCOE values for Scenarios 4 and 5 are illustrated in Figure 14 and Figure 15, respectively. These scenarios demonstrate that a 35% efficiency can yield an LCOE for wave energy that competes favorably with offshore wind power in the Aegean Sea. Specifically, with CAPEX and OPEX values below EUR 2 million and 3%, respectively, the cost of wave power can be reduced to as low as 69 EUR/MWh, as illustrated in Figure 15. This significant reduction in the LCOE of wave power could make it an attractive option, either as a standalone source or in combination with offshore wind energy. This is due to wave energy’s consistent power profile, which can complement the variability of wind energy.
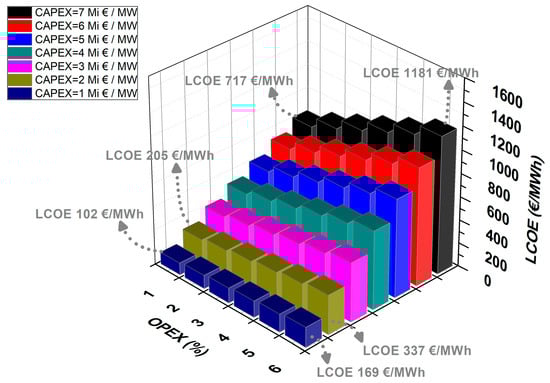
Figure 12.
Scenario 2: = 30%, lifetime = 20.

Figure 13.
Scenario 3: = 30%, lifetime = 25.
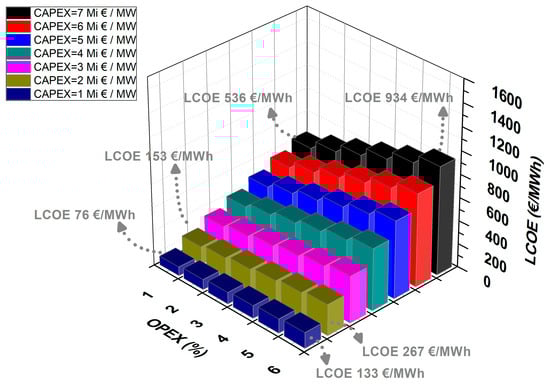
Figure 14.
Scenario 4: = 35%, lifetime = 25.
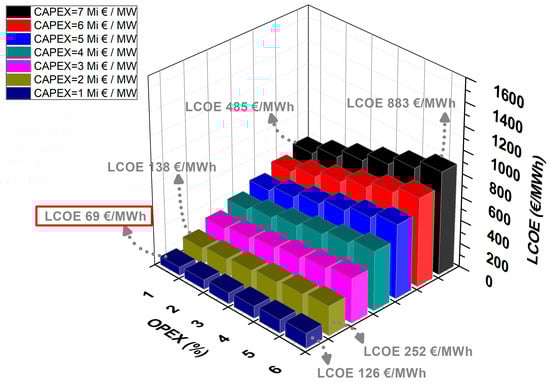
Figure 15.
Scenario 5: = 35%, lifetime = 30.
Finally, it is important to clarify that a separate sensitivity analysis for raw wave energy to account for the uncertainty of raw wave energy is not deemed necessary here. This is because Equation (5) clearly demonstrates that LCOE is inversely proportional to , and thereby to . Therefore, any value other than the one obtained from the Copernicus Marine System database [39] would result in a straightforward variation according to (5). For instance, a 10% decrease in (namely ), would straightforwardly result in an increase in LCOE by the reciprocal factor .
4.2. Net Present Value of the Wave Power Facility
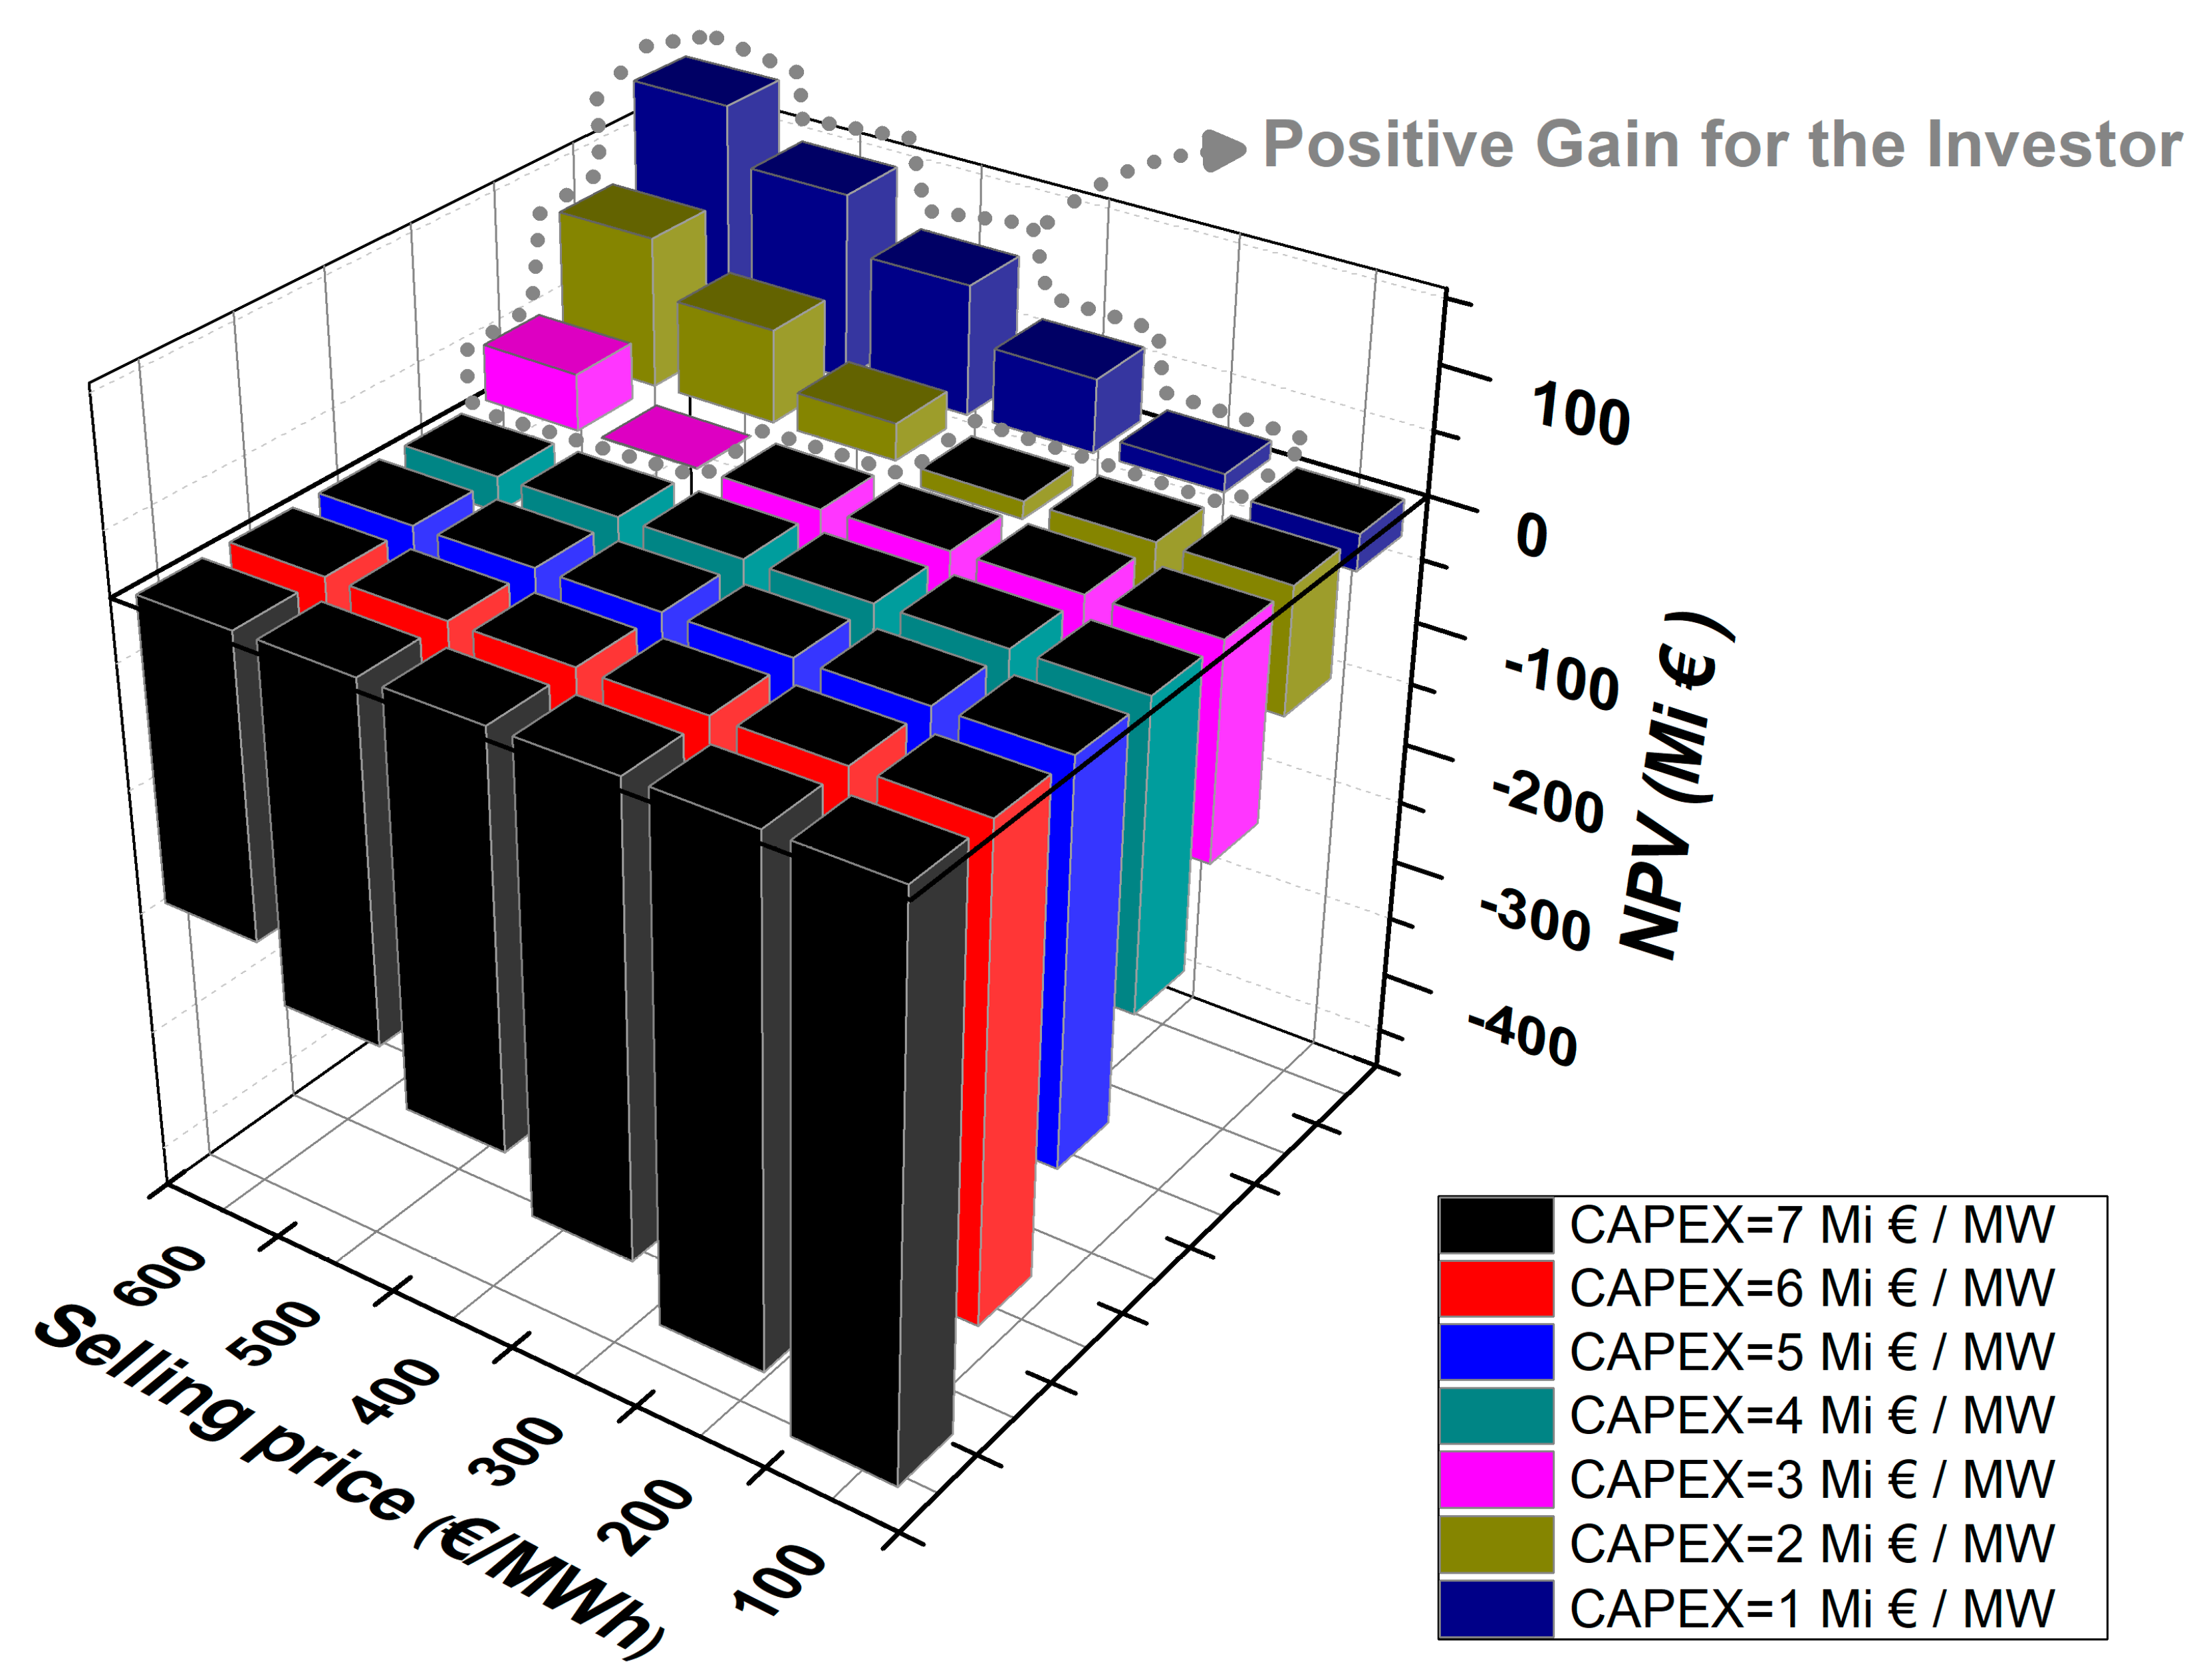
This section investigates the NPV of the wave power facility investment from an investor’s perspective. Figure 16 presents the NPV for various CAPEX and electricity selling prices, assuming a 20-year lifetime, 25% hydrodynamic efficiency, and 3% OPEX. Under these conditions, the investment is not profitable (i.e., negative NPV [53]) for high CAPEX values exceeding 3 million EUR/MW. For a CAPEX of 2 million EUR/MW, the investment becomes profitable only when electricity selling prices exceed 400 EUR/MWh. However, setting prices at this level would inevitably lead to higher electricity costs for consumers. At a CAPEX of 1 million EUR/MW, the investment is profitable for electricity selling prices above 100 EUR/MWh. Figure 17 illustrates the NPV assuming a 3% OPEX, an extended 30-year lifetime, and 35% hydrodynamic efficiency. In this scenario, the profitability of the investment significantly improves. For instance, with a CAPEX of 1 million EUR/MW and an electricity selling price of 200 EUR/MWh, the NPV reaches EUR 74.3 million, demonstrating the economic viability of offshore wave power projects in the Aegean Sea.

Figure 16.
NPV value of the investment for different CAPEX and electricity selling prices, assuming lifetime = 20 years, = 25%, and OPEX = 3%.
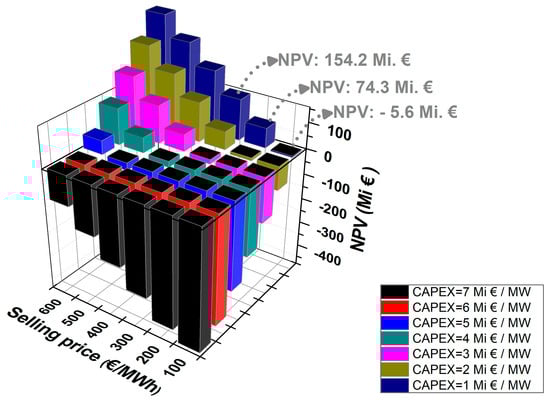
Figure 17.
NPV value of the investment for different CAPEX and electricity selling prices, assuming lifetime = 30 years, = 35%, and OPEX = 3%.
5. Wave Potential in Other Locations across the Aegean Sea
This section explores the wave energy potential of various locations across the Aegean Sea beyond the Crete–Kasos region. The analysis includes four additional sites: western Crete, and the Karpathos, Tinos, and Skyros islands, as depicted in Figure 18. Using a methodology similar to that described in Section 3, wave data from the Copernicus Marine System database [39] are utilized. Table 2 illustrates the annual raw wave energy flux per unit length () at these Aegean sites. Western Crete emerges as the most wave-rich location, with a potential annual energy yield of 49.2 MWh/m, attributed to strong westerly winds and its proximity to the open Mediterranean Sea. However, wave direction variability is higher in western Crete compared to the eastern region. Specifically, Figure 19 indicates two dominant wave directions, complicating the placement of WECs. For example, if WECs are oriented to maximize capture from westerly waves, they may worsen the shading during northeast wave conditions, which also contribute significantly to the region’s energy profile. Consequently, despite its lower absolute energy potential, eastern Crete offers a more effectively exploitable wave resource. Meanwhile, the island of Tinos also shows promising potential, with an annual available energy of 41.2 MWh/m and a predominant favorable northern wave direction, as shown in Figure 20. Such conditions are advantageous for the placement of WECs, effectively minimizing shading effects and optimizing energy capture.

Figure 18.
Other examined locations in the Aegean Sea (western Crete, Karpathos, Tinos, Skyros).
Table 2.
Annual raw wave energy across various locations in the Aegean Sea.
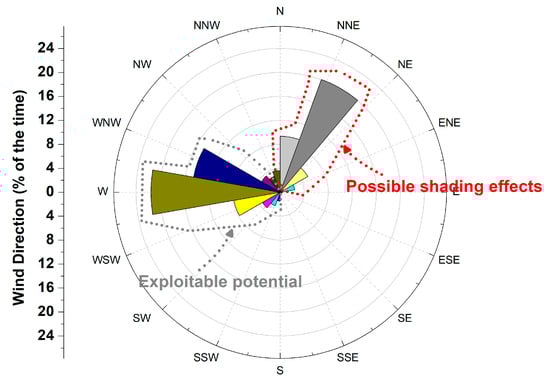
Figure 19.
Wind rose diagram for western Crete.
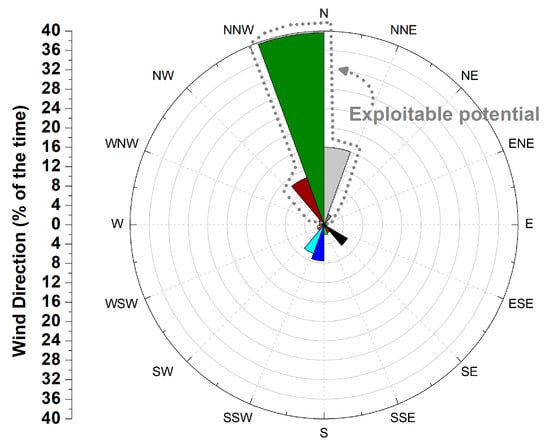
Figure 20.
Wind rose diagram for Tinos.
6. Discussion
Greece has over 100 inhabited islands in the Aegean Sea, each facing unique energy challenges characterized by high dependency and increased generation costs [54]. The elevated costs of energy supply in these insular systems stem from the high prices of fossil fuels, transportation expenses, and the generally low efficiencies (30–35%) of thermal power plants, coupled with the need to maintain spinning reserves for system dynamic security and stability [55]. As of summer 2021, the electricity production costs in these non-interconnected Greek islands ranged from 200 EUR/MWh to over 1000 EUR/MWh, while costs on the mainland were below 70 EUR/MWh [1]. The islands, many of which are popular tourist destinations, also face significant challenges in utilizing solar and wind energy due to high land demand and the intermittent nature of these sources. This intermittency poses substantial risks to the islands’ energy security. The installation of WECs with low LCOE, as projected for the future, around islands with high or moderate wave energy potential could revolutionize green energy production. This shift could enhance renewables’ share in the energy mix, furthering decarbonization and reducing the islands’ LCOE. This study indicates that wave energy could achieve an LCOE as low as 69 EUR/MWh on some Aegean islands, contingent upon future reductions in CAPEX costs to about 1000 EUR/MW (see Figure 15). It is noteworthy that the economic analyses in this paper do not account for the job creation benefits potentially offered by the nascent wave power industry. The development of wave energy can provide direct employment opportunities and stimulate local economic growth. Additionally, this study highlights the financial appeal of wave energy developments to investors. Specifically, wave energy projects present a lucrative investment opportunity, potentially yielding NPV in the range of several million euros, as detailed in Figure 17. This demonstrates the economic viability of investing in wave energy, making it an attractive option for both local development and broader economic advancements.
Additionally, the moderate wave climate of the Aegean Sea presents fewer risks of extreme weather events compared to open seas, enhancing the survivability of WECs and potentially reducing insurance and maintenance costs. Extensive research, including studies by Besio et al. [40] and Liberti et al. [42], highlights the promising wave energy resources in the Mediterranean and suggests that managing survivability issues could be more feasible in these enclosed seas with lower wave energy potential, compared to the high-energy-potential areas of open seas, e.g., Atlantic coasts. This advantage stems from the less frequent occurrence of and less severe extreme wave conditions in these areas, posing fewer design challenges for WECs deployed in these locations.
Finally, it is critical to recognize that existing WECs are primarily engineered for optimal performance in regions with high wave potential, such as Scottish seas [26]. These devices may not perform as effectively in areas with milder wave conditions, like the Mediterranean Sea, resulting in reduced efficiencies. Consequently, there is a substantial need for research dedicated to modifying existing WECs to align with the gentler wave patterns typical of milder wave regions, including the Mediterranean [56,57] and the Black Sea [26], to enhance hydraulic efficiency. Improving hydraulic efficiency is crucial, as evidenced by Figure 11, Figure 12, Figure 13, Figure 14, Figure 15, Figure 16 and Figure 17, which demonstrate its significant impact on the LCOE and the economic viability of wave power investments. Therefore, advancing hydraulic efficiency, e.g., via downscaling WECs, is essential for the successful expansion of wave power technologies in low-energy seas. The techno-economic analysis presented in this paper underscores the necessity for hydraulic efficiencies to exceed 35%, alongside a reduction in CAPEX below 2 million EUR/MW. The downscaling of WECs offers a dual advantage: simultaneously increasing efficiency and decreasing CAPEX [58]. Achieving these targets is essential for making wave power a competitive alternative in the Aegean Sea.
7. Conclusions and Future Research
The decarbonization targets of various countries underscore the need to harness renewable resources, primarily through photovoltaic and wind turbine approaches. However, the physical limitations of islands can restrict the expansion of PV and WT setups. Against this backdrop, wave energy stands out as a promising alternative renewable source. Given their abundant wave potential, islands are prime candidates for hosting wave power resources. This paper presented a techno-economic analysis of a proposed 45 MW offshore floating wave power plant located in Greece between eastern Crete and Kasos—one of the richest wave energy areas in the country. Despite the advantageous wave conditions in eastern Crete, this study reveals that wave power remains considerably less competitive than PV and WT methods due to higher costs. With the current techno-economic parameters—a capital expenditure (CAPEX) of 7 million EUR/MW, operational expenses (OPEX) of 6%, a lifespan of 20 years, and an efficiency of 25%—the levelized cost of energy (LCOE) for wave energy stands at 1417 EUR/MWh. This cost substantially exceeds the current LCOE in Crete, which ranges from 237 to 300 EUR/MWh [1]. However, a sensitivity analysis within this study indicates that the LCOE for wave energy in Crete could potentially decrease to as low as 69 EUR/MWh in the future, given improved conditions such as a CAPEX of 1 million EUR/MW, an OPEX of 1%, a 30-year lifespan, and 35% efficiency.
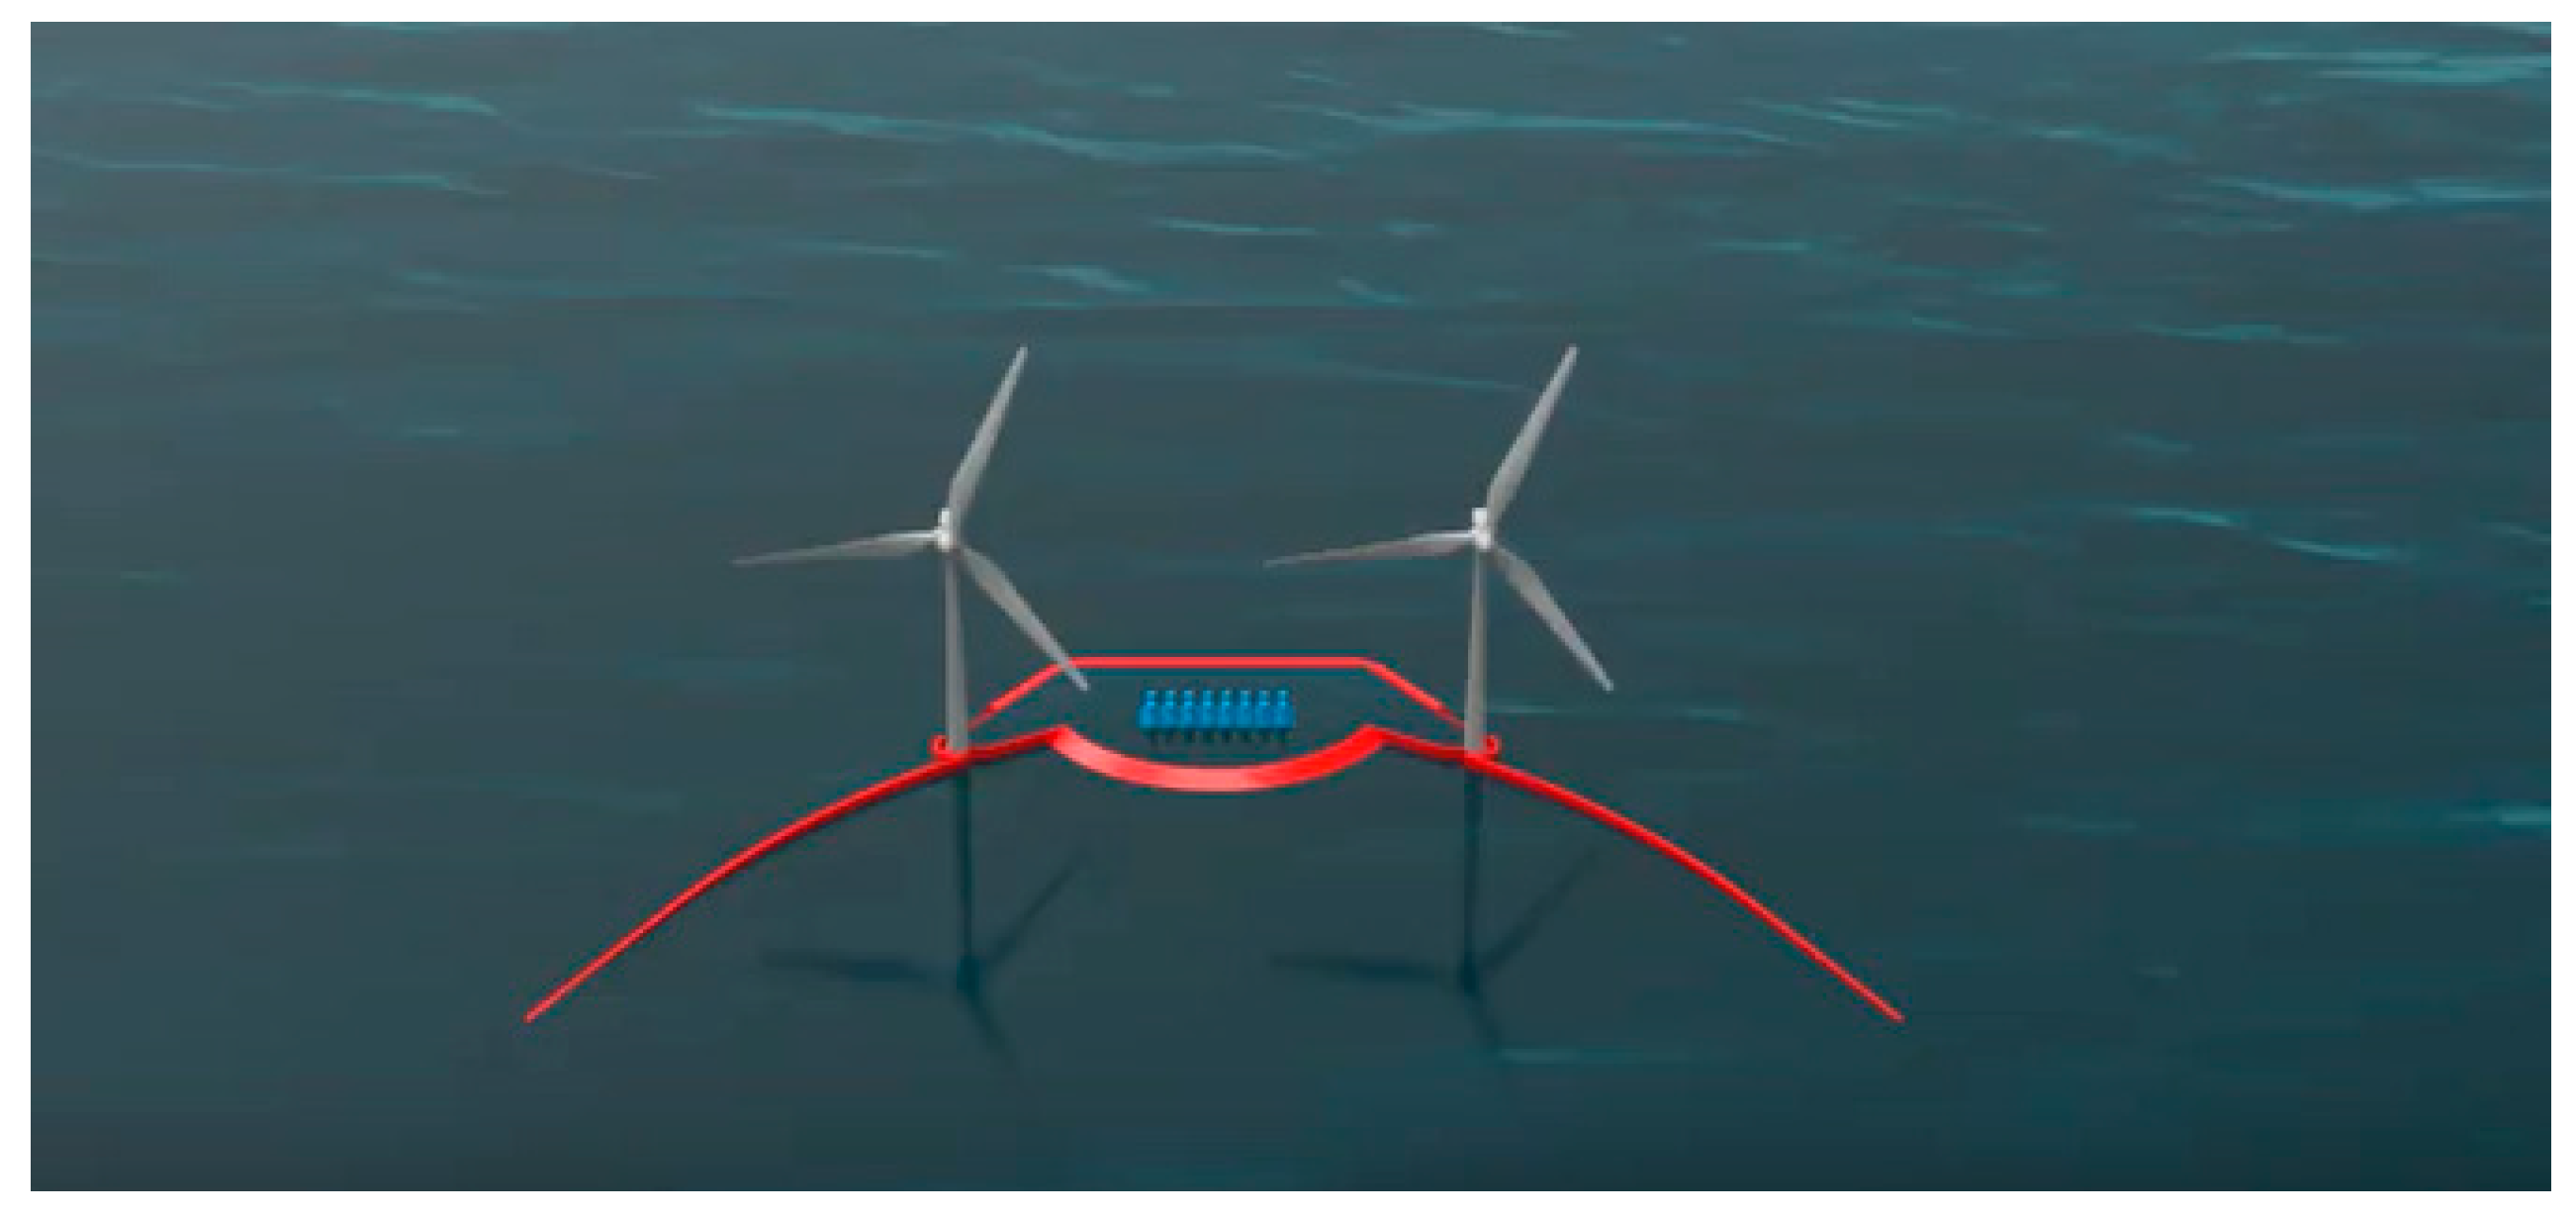
This paper focuses exclusively on wave power, without exploring the potential synergies with other offshore renewable energy sources, such as wind and floating photovoltaics. Integrating various types of offshore renewables could yield significant benefits. For instance, Figure 21 illustrates a Wave Dragon unit equipped with offshore wind turbines. Co-developing wave and wind energy systems could lower CAPEX and OPEX, enhance spatial energy density, reduce energy variability, and ultimately decrease the levelized cost of offshore energy. This subject warrants further exploration. Additionally, hybrid offshore renewable energy systems could be employed to refuel electric or hydrogen-powered ships navigating the Mediterranean Sea. This approach could foster a blue renewable and hydrogen economy within the Mediterranean, aimed at supporting the decarbonization of the maritime sector. This is another topic that merits future consideration.

Figure 21.
Floating offshore power plant combining Wave Dragon and wind turbines (source from [59]).
Author Contributions
Conceptualization, E.E.P.; Methodology, E.E.P.; Software, E.E.P.; Validation, E.E.P.; Formal analysis, E.E.P.; Investigation, E.E.P.; Resources, E.E.P.; Data curation, E.E.P.; Writing—original draft, E.E.P.; Writing—review & editing, G.I.O. and E.K.; Visualization, E.E.P.; Supervision, G.I.O. and Y.K.; Project administration, Y.K. and E.K.; Funding acquisition, Y.K. and E.K. All authors have read and agreed to the published version of the manuscript.
Funding
This research received no external funding.
Data Availability Statement
The original contributions presented in the study are included in the article, further inquiries can be directed to the corresponding author.
Conflicts of Interest
The authors declare no conflict of interest.
Nomenclature
| Variable | Description | Unit |
| lifetime | Project lifetime | years |
| Wave energy period | s | |
| (t) | Significant wave height | m |
| Distance between the edges of the reflectors | m | |
| Hydrodynamic efficiency | % | |
| Turbine efficiency | % | |
| Generator efficiency | % | |
| Power electronic converter efficiency | % | |
| Parameter for the out-of-service period | % | |
| Shading efficiency | % | |
| Total electric energy produced by the wave power facility | MWh | |
| Total annual wave energy flux per unit width | MWh/m | |
| Levelized cost of energy | EUR/MWh | |
| Capital expenditure | EUR | |
| Operating expenditure | % CAPEX | |
| Capital recovery factor | - | |
| WACC | Weighted average cost of capital | % |
| Selling price of electric energy | EUR/MWh |
Appendix A
While hindcast platforms, such as the Copernicus Marine System, typically provide wave parameters like and peak wave period , they often lack the energy wave period . Consequently, is approximated using available data for , multiplied by a calibration factor α, such that . Despite the factor α exhibiting temporal fluctuations [60], it is assumed to be a constant 0.9 in this case, which is a plausible assumption reflecting the short fetch lengths of the Aegean Sea [26,54].
References
- Katsaprakakis, D.A.; Michopoulos, A.; Skoulou, V.; Dakanali, E.; Maragkaki, A.; Pappa, S.; Antonakakis, I.; Christakis, D.; Condaxakis, C. A Multidisciplinary Approach for an Effective and Rational Energy Transition in Crete Island, Greece. Energies 2022, 15, 3010. [Google Scholar] [CrossRef]
- Vivanco-Martín, B.; Iranzo, A. Analysis of the European Strategy for Hydrogen: A Comprehensive Review. Energies 2023, 16, 3866. [Google Scholar] [CrossRef]
- European Commission. REPowerEU: Joint European Action for More Affordable, Secure and Sustainable Energy. Available online: https://ec.europa.eu/commission/presscorner/detail/en/IP_22_1511 (accessed on 2 September 2023).
- Satymov, R.; Bogdanov, D.; Dadashi, M.; Lavidas, G.; Breyer, C. Techno-economic assessment of global and regional wave energy resource potentials and profiles in hourly resolution. Appl. Energy 2024, 364, 123119. [Google Scholar] [CrossRef]
- Veerabhadrappa, K.; Suhas, B.G.; Mangrulkar, C.K.; Suresh Kumar, R.; Mudakappanavar, V.S.; Seetharamu, K.N. Power Generation Using Ocean Waves: A Review. Glob. Transit. Proc. 2022, 3, 359–370. [Google Scholar] [CrossRef]
- Pinhão, M.; Fonseca, M.; Covas, R. Electricity Spot Price Forecast by Modelling Supply and Demand Curve. Mathematics 2022, 10, 2012. [Google Scholar] [CrossRef]
- Amin, A.; Ebeed, M.; Nasrat, L.; Aly, M.; Ahmed, E.M.; Mohamed, E.A.; Alnuman, H.H.; El Hamed, A.M.A. Techno-Economic Evaluation of Optimal Integration of PV Based DG with DSTATCOM Functionality with Solar Irradiance and Loading Variations. Mathematics 2022, 10, 2543. [Google Scholar] [CrossRef]
- Friedrich, D.; Lavidas, G. Evaluation of the effect of flexible demand and wave energy converters on the design of hybrid energy systems. IET Renew. Power Gener. 2017, 11, 1113–1119. [Google Scholar] [CrossRef]
- European Commission. The EU Blue Economy Report 2023; Publications Office of the European Union: Luxembourg, 2023. [Google Scholar]
- Kozyrakis, G.V.; Spanoudaki, K.; Varouchakis, E.A. Long-term wave energy potential estimation in the Aegean and Ionian seas using dynamic downscaling and wave modelling techniques. Appl. Ocean Res. 2023, 131, 103446. [Google Scholar] [CrossRef]
- Castro-Santos, L.; Bento, A.R.; Soares, C.G. The Economic Feasibility of Floating Offshore Wave Energy Farms in the North of Spain. Energies 2020, 13, 806. [Google Scholar] [CrossRef]
- Nguyen, H.P.; Wang, C.M.; Tay, Z.Y.; Luong, V.H. Wave energy converter and large floating platform integration: A review. Ocean Eng. 2020, 213, 107768. [Google Scholar] [CrossRef]
- Pennock, S.; Vanegas-Cantarero, M.M.; Bloise-Thomaz, T.; Jeffrey, H.; Dickson, M.J. Life cycle assessment of a point-absorber wave energy array. Renew. Energy 2022, 190, 1078–1088. [Google Scholar] [CrossRef]
- Rezaei, S.; Rahimi, A.; Parvizian, J.; Mansourzadeh, S.; Düster, A. Dimensional optimization of a two-body Wave energy converter using response surface methodology. Ocean Eng. 2022, 261, 112186. [Google Scholar] [CrossRef]
- Dalton, G.; Alcorn, R.; Lewis, T. Case study feasibility analysis of the Pelamis wave energy convertor in Ireland, Portugal and North America. Renew. Energy 2009, 35, 443–455. [Google Scholar] [CrossRef]
- He, H.; Qu, Q.; Li, J. Numerical Simulation of Section Systems in the Pelamis Wave Energy Converter. Adv. Mech. Eng. 2013, 5, 186056. [Google Scholar] [CrossRef]
- Ibarra-Berastegi, G.; Sáenz, J.; Ulazia, A.; Serras, P.; Esnaola, G.; Garcia-Soto, C. Electricity production, capacity factor, and plant efficiency index at the Mutriku wave farm (2014–2016). Ocean Eng. 2018, 147, 20–29. [Google Scholar] [CrossRef]
- Frigaard, P.; Tedd, J.; Kofoed, J.P.; Friis-Madsen, E. 3 years’ experience with energy production on the Nissum Bredning Wave Dragon Prototype. In Proceedings of the CA-OE Workshop, Lisbon, Protugal, 16–17 November 2006. [Google Scholar]
- Contestabile, P.; Di Lauro, E.; Galli, P.; Corselli, C.; Vicinanza, D. Offshore Wind and Wave Energy Assessment around Malè and Magoodhoo Island (Maldives). Sustainability 2017, 9, 613. [Google Scholar] [CrossRef]
- Beatty, S.J.; Wild, P.; Buckham, B.J. Integration of a wave energy converter into the electricity supply of a remote Alaskan island. Renew. Energy 2010, 35, 1203–1213. [Google Scholar] [CrossRef]
- Lavidas, G.; Venugopal, V. Application of numerical wave models at European coastlines: A review. Renew. Sustain. Energy Rev. 2018, 92, 489–500. [Google Scholar] [CrossRef]
- Lavidas, G.; Venugopal, V. Characterising the wave power potential of the Scottish coastal environment. Int. J. Sustain. Energy 2018, 37, 684–703. [Google Scholar] [CrossRef]
- Lavidas, G.; Blok, K. Shifting wave energy perceptions: The case for wave energy converter (WEC) feasibility at milder resources. Renew. Energy 2021, 170, 1143–1155. [Google Scholar] [CrossRef]
- Lavidas, G.; Venugopal, V. Prospects and applicability of wave energy for South Africa. Int. J. Sustain. Energy 2018, 37, 230–248. [Google Scholar] [CrossRef]
- Dialyna, E.; Tsoutsos, T. Wave Energy in the Mediterranean Sea: Resource Assessment, Deployed WECs and Prospects. Energies 2021, 14, 4764. [Google Scholar] [CrossRef]
- Foteinis, S.; Synolakis, C.E. Field based estimates of wave power at a nearshore Mediterranean locale for sustainable wave energy harnessing. Sustain. Energy Technol. Assess. 2023, 59, 103410. [Google Scholar] [CrossRef]
- Reguero, B.G.; Losada, I.J.; Méndez, F.J. A global wave power resource and its seasonal, interannual and long-term variability. Appl. Energy 2015, 148, 366–380. [Google Scholar] [CrossRef]
- Emine, A.; Akpınar, A.; Kankal, M.; Amarouche, K. Wave Power Trends over the Mediterranean Sea Based on Innovative Methods and 60-Year ERA5 Reanalysis. Sustainability 2023, 15, 8590. [Google Scholar] [CrossRef]
- Lavidas, G.; Venugopal, V. Wave energy resource evaluation and characterisation for the Libyan Sea. Int. J. Mar. Energy 2017, 18, 1–14. [Google Scholar] [CrossRef]
- Simonetti, I.; Cappietti, L. Mediterranean coastal wave-climate long-term trend in climate change scenarios and effects on the optimal sizing of OWC wave energy converters. Coast. Eng. 2023, 179, 104247. [Google Scholar] [CrossRef]
- Miquel, A.; Lamberti, A.; Antonini, A.; Archetti, R. The MoonWEC, a new technology for wave energy conversion in the Mediterranean Sea. Ocean Eng. 2020, 217, 107958. [Google Scholar] [CrossRef]
- Jadidoleslam, N.; Özger, M.; Ağıralioğlu, N. Wave power potential assessment of Aegean Sea with an integrated 15-year data. Renew. Energy 2016, 86, 1045–1059. [Google Scholar] [CrossRef]
- Soukissian, T.; Gizari, N.; Chatzinaki, M. Wave Potential of the Greek Seas. WIT Trans. Ecol. Environ. 2011, 143, 203–213. [Google Scholar]
- Parmeggiani, S.; Chozas, J.F.; Pecher, A.; Friis-Madsen, E.; Sørensen, H.C.; Kofoed, J.P. Performance Assessment of the Wave Dragon Wave Energy Converter Based on the EquiMar Methodology. In Proceedings of the 9th European Wave and Tidal Conference, Southampton, UK, 5–9 September 2011. [Google Scholar]
- Sørensen, H.C.; Friis-Madsen, E. Wave Dragon 1.5 MW North Sea Demonstrator Phase 1; EUDP J.nr. 64010-0405; Wave Dragon: Copenhagen, Denmark, 2015; Available online: https://energiforskning.dk/files/slutrapporter/wd15mwv4_efm-17.pdf (accessed on 9 July 2024).
- Ahmed, A.; Pompodakis, E.E.; Katsigiannis, Y.; Karapidakis, E.S. Optimizing the Installation of a Centralized Green Hydrogen Production Facility in the Island of Crete, Greece. Energies 2024, 17, 1924. [Google Scholar] [CrossRef]
- Emmanuel, K.; Kalogerakis, C.; Pompodakis, E. Sustainable Power Generation Expansion in Island Systems with Extensive RES and Energy Storage. Inventions 2023, 8, 127. [Google Scholar] [CrossRef]
- Kardakaris, K.; Boufidi, I.; Soukissian, T. Offshore Wind and Wave Energy Complementarity in the Greek Seas Based on ERA5 Data. Atmosphere 2021, 12, 1360. [Google Scholar] [CrossRef]
- Copernicus Marine System. Available online: https://data.marine.copernicus.eu/product/MEDSEA_ANALYSISFORECAST_WAV_006_017/description (accessed on 15 June 2024).
- Besio, G.; Mentaschi, L.; Mazzino, A. Wave energy resource assessment in the Mediterranean Sea on the basis of a 35-year hindcast. Energy 2016, 94, 50–63. [Google Scholar] [CrossRef]
- Iglesias, G.; Carballo, R. Wave energy resource in the Estaca de Bares area (Spain). Renew. Energy 2010, 35, 1574–1584. [Google Scholar] [CrossRef]
- Liberti, L.; Carillo, A.; Sannino, G. Wave energy resource assessment in the Mediterranean, the Italian perspective. Renew. Energy 2013, 50, 938–949. [Google Scholar] [CrossRef]
- Rusu, L.; Guedes Soares, C. Wave energy assessments in the Azores islands. Renew. Energy 2012, 45, 183–196. [Google Scholar] [CrossRef]
- Vicinanza, D.; Contestabile, P.; Ferrante, V. Wave energy potential in the north-west of Sardinia (Italy). Renew. Energy 2013, 50, 506–521. [Google Scholar] [CrossRef]
- Sheng, W.; Li, H. A Method for Energy and Resource Assessment of Waves in Finite Water Depths. Energies 2017, 10, 460. [Google Scholar] [CrossRef]
- Babarit, A. A database of capture width ratio of wave energy converters. Renew. Energy 2015, 80, 610–628. [Google Scholar] [CrossRef]
- Aderinto, T.; Li, H. Review on Power Performance and Efficiency of Wave Energy Converters. Energies 2019, 12, 4329. [Google Scholar] [CrossRef]
- Beels, C.; Troch, P.; Kofoed, J.P.; Frigaard, P.; Kringelum, J.V.; Kromann, P.C.; Donovan, M.H.; De Rouck, J.; De Backer, G. A methodology for production and cost assessment of a farm of wave energy converters. Renew. Energy 2011, 36, 3402–3416. [Google Scholar] [CrossRef]
- Vidura, A.; Nurjaya, I.W.; Iqbal, M.; Jaya, I. Ocean wave measurement and wave energy calculation using overtopping power plant scheme. IOP Conf. Ser. Earth Environ. Sci. 2020, 429, 012047. [Google Scholar] [CrossRef]
- Lavidas, G. Energy and socio-economic benefits from the development of wave energy in Greece. Renew. Energy 2019, 132, 1290–1300. [Google Scholar] [CrossRef]
- Astariz, S.; Iglesias, G. The economics of wave energy: A review. Renew. Sustain. Energy Rev. 2015, 45, 397–408. [Google Scholar] [CrossRef]
- 2023 Levelized Cost of Energy+. Lazard. 12 April 2023, p. 9. Available online: https://www.lazard.com/research-insights/2023-levelized-cost-of-energyplus/ (accessed on 27 August 2023).
- Paspatis, A.; Fiorentzis, K.; Katsigiannis, Y.; Karapidakis, E. Smart Campus Microgrids towards a Sustainable Energy Transition—The Case Study of the Hellenic Mediterranean University in Crete. Mathematics 2022, 10, 1065. [Google Scholar] [CrossRef]
- Pompodakis, E.E.; Kryonidis, G.C.; Karapidakis, E.S. Volt/Var control and energy management in non-interconnected insular networks with multiple hybrid power plants. Appl. Energy 2023, 331, 120427. [Google Scholar] [CrossRef]
- Pompodakis, E.E.; Kryonidis, G.C.; Karapidakis, E.S. Optimizing the installation of hybrid power plants in non-interconnected islands. J. Energy Storage 2023, 74, 109511. [Google Scholar] [CrossRef]
- Barbarelli, S.; Amelio, M.; Castiglione, T.; Florio, G.; Scornaienchi, N.M. Design and analysis of a new wave energy converter based on a point absorber and a hydraulic system harvesting energy from waves near the shore in calm seas. Int. J. Energy Res. 2020, 45, 661–690. [Google Scholar] [CrossRef]
- Oikonomou, C.L.; Gomes, R.P.; Gato, L.M. Unveiling the potential of using a spar-buoy oscillating-water-column wave energy converter for low-power stand-alone applications. Appl. Energy 2021, 292, 116835. [Google Scholar] [CrossRef]
- Foteinis, S. Wave energy converters in low energy seas: Current state and opportunities. Renew. Sustain. Energy Rev. 2022, 162, 112448. [Google Scholar] [CrossRef]
- Wave Dragon Website. Available online: https://www.wavedragon.com/ (accessed on 27 August 2024).
- Guillou, N.; Lavidas, G.; Chapalain, G. Wave Energy Resource Assessment for Exploitation—A Review. J. Mar. Sci. Eng. 2020, 8, 705. [Google Scholar] [CrossRef]


Disclaimer/Publisher’s Note: The statements, opinions and data contained in all publications are solely those of the individual author(s) and contributor(s) and not of MDPI and/or the editor(s). MDPI and/or the editor(s) disclaim responsibility for any injury to people or property resulting from any ideas, methods, instructions or products referred to in the content. |
© 2024 by the authors. Licensee MDPI, Basel, Switzerland. This article is an open access article distributed under the terms and conditions of the Creative Commons Attribution (CC BY) license (https://creativecommons.org/licenses/by/4.0/).