Abstract
In-depth understanding of the gas–water seepage law caused by different degrees of gas layer perforation and varying gas production rates is key to determining a reasonable development technology policy for vertical heterogeneous edge-water gas reservoirs. Based on core physical data from the entire section of the X2 well, a large-scale high-pressure positive-rhythm profile model that takes into account the influence of “discontinuous interlayer” was innovatively established. The water intrusion process of the gas layer profile under different gas production rates and degrees of gas layer perforation was simulated using an electrical resistivity scanning device. The experimental model has an area of 3000 cm2, with a maximum pressure of 70 MPa and a maximum temperature resistance of 150 °C. It includes 456 evenly distributed fluid saturation test points to accurately monitor the gas–water distribution, addressing the issues of small bearing pressure and insufficient saturation monitoring points found in other large-scale models. The experimental results show that, in heterogeneous reservoirs, the high-permeability zone controls the invasion path of edge water, which is the main reason for the uneven invasion of edge water. For the positive-rhythm profile of the F layer, a higher gas production rate (1000 mL/min) shortens the water-free gas recovery period of the gas well and reduces the recovery rate. Perforating the upper two-thirds of the layer can inhibit edge-water breakthrough, prolong the water-free gas recovery period of the gas well, enable the gas–water interface to advance more uniformly, and enhance the recovery degree. The results of this study greatly enhance our understanding of the water invasion characteristics of positive-rhythm reservoirs under the influence of different gas production rates and varying degrees of gas layer perforation.
1. Introduction
The worldwide development of typical gas reservoirs indicates that the recovery rate of water-invaded gas reservoirs is generally <50% [1,2,3]. Uneven water invasion poses a key problem that significantly reduces the recovery rate of water-bearing gas reservoirs [4,5]. With natural gas recovery, the gas reservoir’s pressure gradually decreases, and the edge and bottom water invade the gas-bearing layer unevenly under the pressure difference [6,7]. A gas reservoir is driven by edge and bottom water to produce gas–water two-phase flow. This reduces gas phase permeability and increases seepage resistance, which are not conducive to the exploitation of natural gas in the reservoir [8,9]. In addition, when the water invades the wellbore, the gas flow rate is too low to carry the water out of the wellbore, which will cause the gas well to accumulate continuously until it becomes completely watered-out, thereby reducing the recovery rate of the gas reservoir [10,11]. Therefore, it is important to clarify the law of water invasion and seepage in gas reservoirs for the rational formulation of development technology policies [12].
The X gas reservoir selected in this study is a typical thick, heterogeneous edge-water gas reservoir with poor reservoir physical properties and large differences in single-well production [13]. Because of the strong vertical heterogeneity and the development of edge water [14], the edge water quickly flows along the bottom high-permeability zone to the local gas well during the X gas reservoir development process. Consequently, this shortens the gas production period and production decreases rapidly, which seriously affects the normal production of gas reservoirs [15,16,17]. For an X gas reservoir with sufficient edge-water energy and strong heterogeneity, if the gas well is perforated only in the low-permeability area in the upper part of the gas-bearing layer, although the water-free gas production period is prolonged, the gas well productivity is low and the X gas reservoir cannot be effectively utilized. After the high-permeability zone in the lower part of the gas-bearing layer is perforated, the gas well will quickly have water breakthrough, seriously affecting the mining effect. At the same time, the gas recovery rate will also affect the gas recovery degree [18,19]. Song et al. [20] used combined core experiments to show that the higher the initial constant production rate, the shorter the stable production time, and allocating the appropriate production rate can maximize economic and social benefits. Wu et al. [21] explored the water invasion law of vertical heterogeneous gas reservoirs with active edge water based on a dynamic analysis of production data from single-well-controlled reserves. Their results revealed that an unreasonable production ratio will lead to a premature water breakthrough. By effectively controlling the water production of gas wells, continuous and stable production of gas reservoirs can last for >1.3 years. Hu et al. [22] studied the edge-water invasion of multilayer mixed production in vertical heterogeneous gas reservoirs. They showed that the edge-water invasion is mainly affected by reservoir permeability and gas production in commingled production. Under the condition of mixed production with a large permeability gradient and high production, uneven invasion of edge water easily occurs, and the water is more inclined to invade the gas well along the high-permeability zone. Therefore, a reasonable production pressure difference can be achieved by controlling the gas production rate and selecting the appropriate gas layer perforation degree to control the invasion rate of edge water and effectively improve the production cycle of an X gas reservoir [23,24,25,26,27].
The physical properties of X gas reservoir profiles exhibit a positive-rhythm distribution in the longitudinal direction, and there are discontinuous mudstone interlayers in the middle. In such complex reservoirs, the mechanism of water invasion and seepage caused by the gas production rate and gas reservoir perforation degree is unclear and poses a difficult problem. In the past, when scholars studied the mechanism of water invasion and seepage in edge-water gas reservoirs, parallel cores were often used to simulate the heterogeneity of vertical heterogeneous gas reservoirs [28,29]. Although this method can better simulate the influence of inter-reservoir heterogeneity [30], the core size is too small to fully simulate the intra-layer rhythmic differences in the vertical direction of the reservoir, and it is impossible to visually display the distribution of gas and water saturation during water invasion [31,32]. A large-scale physical model can better reflect the heterogeneity of vertical heterogeneous gas reservoirs, and combined with the resistivity measurement device, the water intrusion experiments in line with the geological characteristics can effectively guide the development of vertical heterogeneous gas reservoirs [33,34,35,36,37]. When domestic and foreign scholars conduct visual large-scale physical simulation experiments, most of the materials used are limited to etched glass, and the established visual large-scale models cannot withstand high pressure or high temperature [38,39,40,41]. Moreover, because there are too few saturation test points in the model [33], refined real-time saturation monitoring cannot be achieved, so it cannot meet the requirements of X gas reservoir water invasion experiments.
This study presents a novel high-temperature and high-pressure heterogeneous water intrusion profile model [42], measuring 100 cm × 30 cm × 1 cm (3000 cm2), making it the largest known two-dimensional model to date, effectively simulating the profile heterogeneity of the X gas reservoir. The movement of reservoir fluids under reservoir temperature and pressure conditions is more representative of actual seepage states. Additionally, if the pressure is too low, crude oil will degas at low pressure, which means that only simulated oil can be used when modeling reservoirs, rather than formation crude oil. This model has a maximum pressure capacity of 70 MPa and can withstand temperatures up to 150 °C, meeting the temperature and pressure simulation requirements of most oil and gas reservoirs, which is difficult for other models to achieve. Currently, the model is equipped with 456 uniformly distributed fluid saturation testing points arranged in a 38 × 12 configuration, essentially achieving full coverage of the profile model. Furthermore, since the saturation testing probes are densely arrayed on the surface of the profile model rather than embedded within it, they do not interfere with fluid seepage, allowing for more accurate monitoring of gas–water saturation conditions across the entire profile model. Compared to other models, this model overcomes the limitations of low accuracy caused by small pressure capacity and insufficient saturation monitoring points. To mitigate the impact of gas–water gravity differentiation during water invasion and prevent the edge water from only contacting the lower part of the profile model or the liquid flowing downward at the production end, a long strip of metal mesh and a right-angle metal sheet were specifically designed for the model’s inlet and outlet, respectively. Moreover, an innovative equivalent profile model incorporating a “discontinuous interlayer” was developed based on the core physical property analysis data of the F layer in well X2 of the X gas reservoir. Subsequently, water invasion experiments were conducted under different gas production rates and degrees of gas layer perforation at the formation pressure of 37 MPa. The findings offer valuable theoretical and technical support for the efficient development of X gas reservoirs.
2. Materials and Methods
2.1. Experimental Fluid
Considering that the focus of this research is on water invasion in gas reservoirs, and that N2 has good stability, is not prone to react with other substances, and is not easily decomposed by water, we selected commercial nitrogen with a purity greater than 99.9% to replace natural gas for the experimental formation gas samples. The experimental water samples were prepared in the laboratory based on the analysis data of the formation water from the X gas reservoir. The water type was NaHCO3, and the total salinity was 6739.05 mg/L. The mass concentrations of cations Na++K+, Ca2+, and Mg2+ in water samples were 2679.53, 16.98, and 12.41 mg/L, respectively. The mass concentrations of anions Cl−, SO42−, CO32−, and HCO3− in water samples were 2909.46, 42.44, 223.51, and 1709.47 mg/L, respectively.
2.2. Experimental Devices
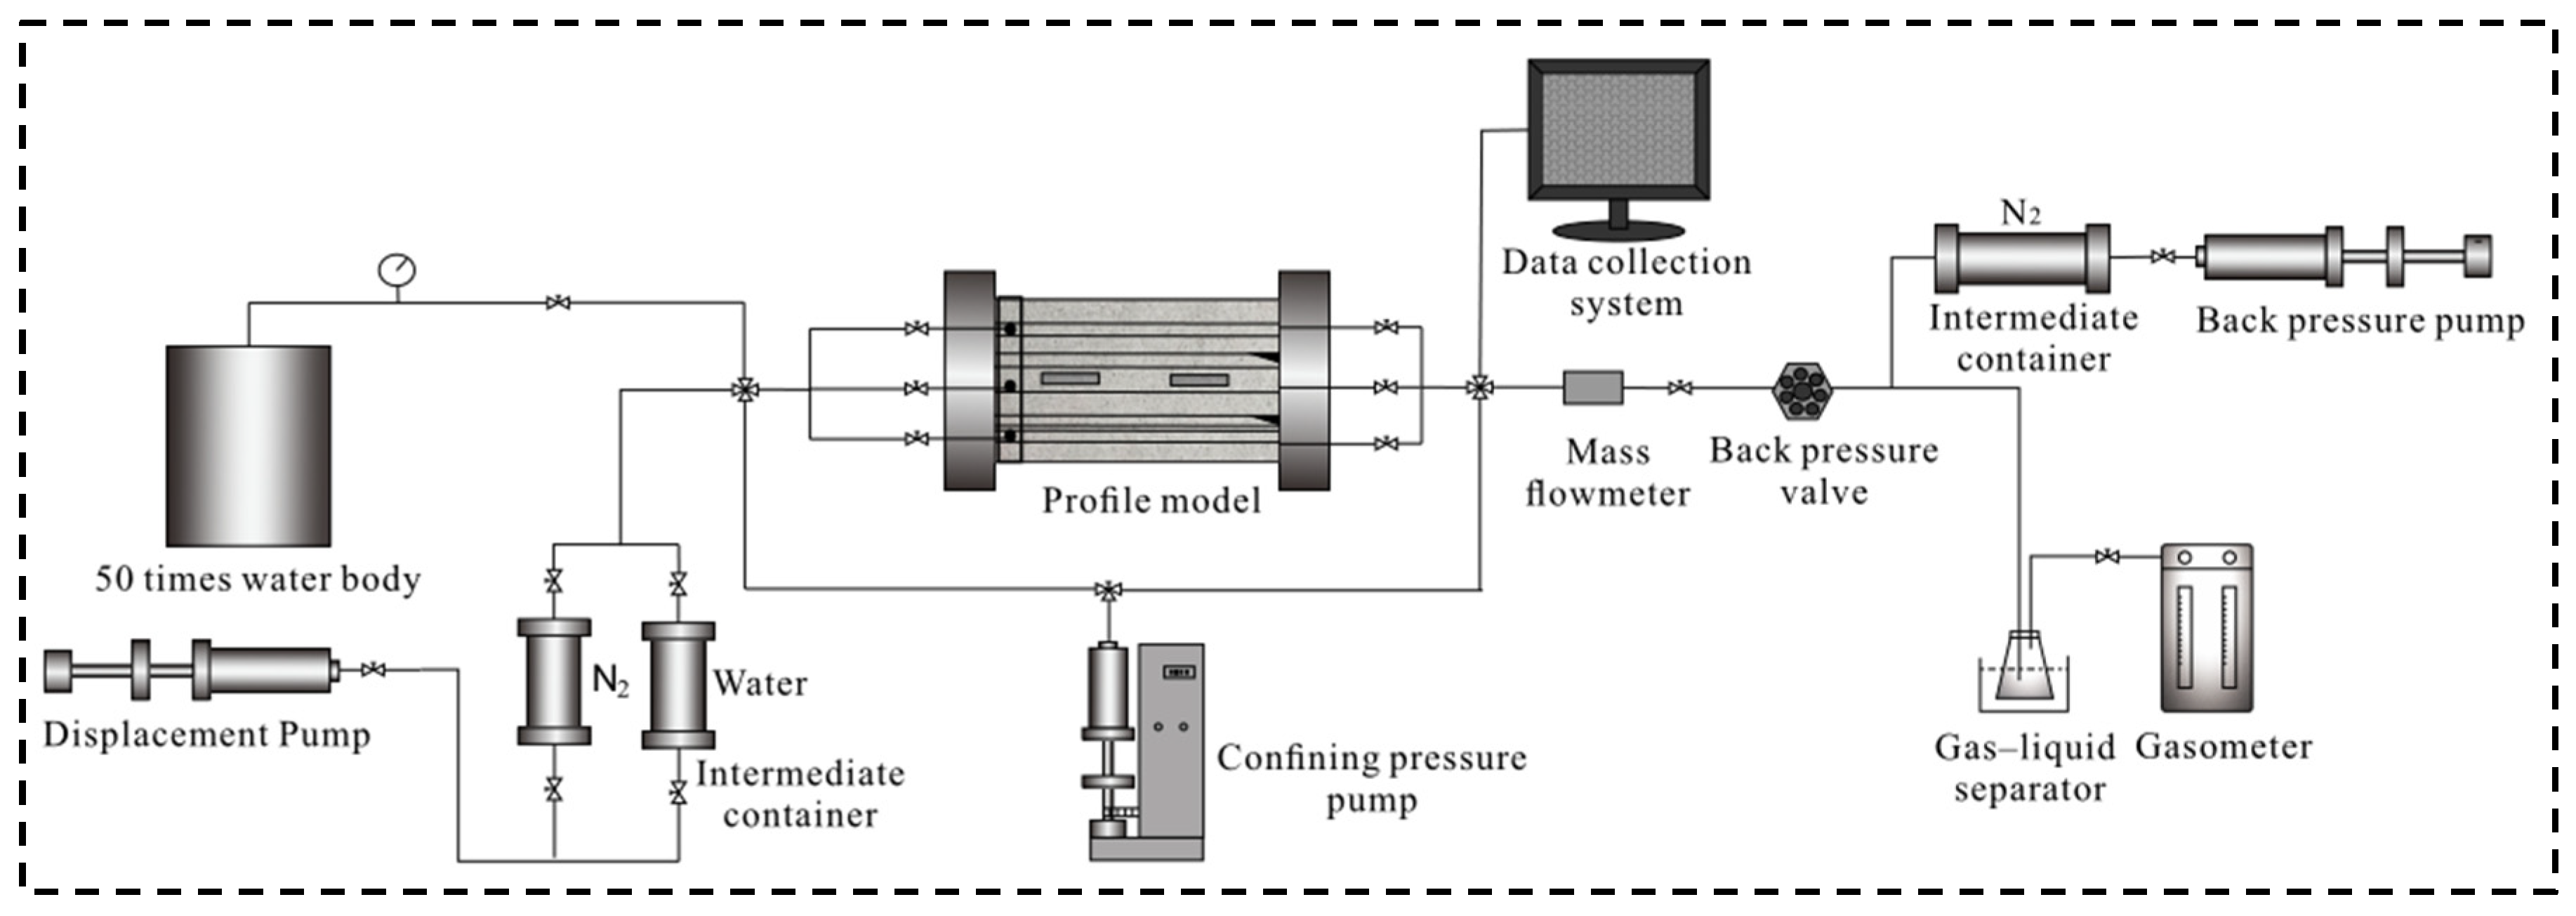
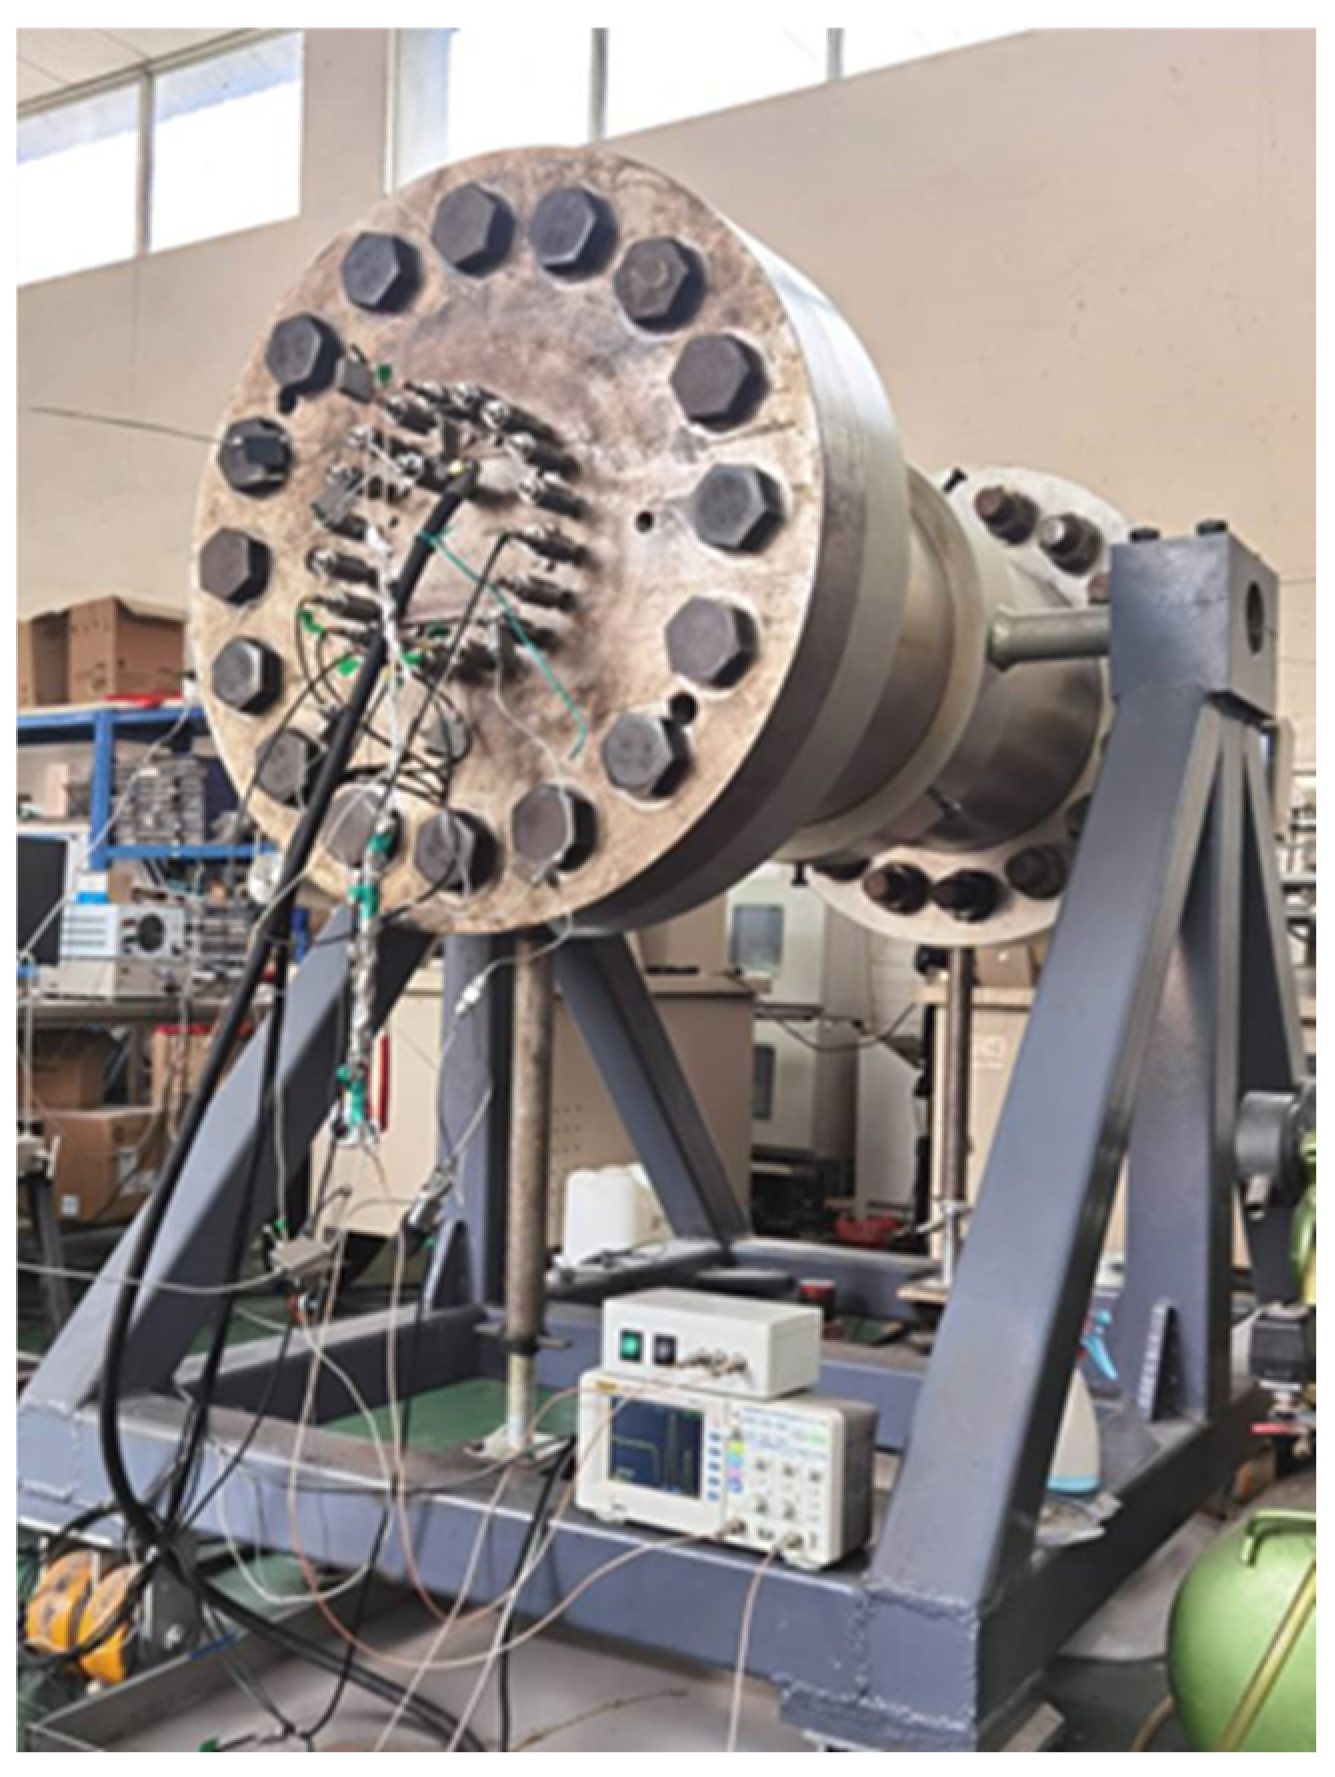
The experimental devices were independently designed and developed at our laboratory [42,43]. They primarily consist of a power high-pressure displacement pump; an intermediate container; a high-temperature, high-pressure plate model system (plate model, model frame, vertical lifting structure, temperature control system, fastening bolt, and resistance measurement component); a data acquisition system; a back pressure regulator; a gas–liquid separator; and a gas meter. The plate model is the pressure-bearing cavity used in the experiment. The experimental schematic and device are shown in Figure 1 and Figure 2.
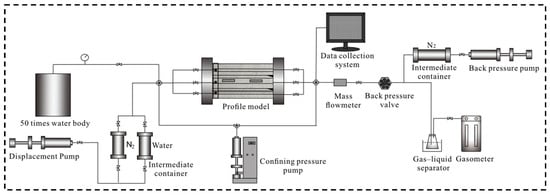
Figure 1.
Schematic of high-pressure 2D scaled physical model experiment.
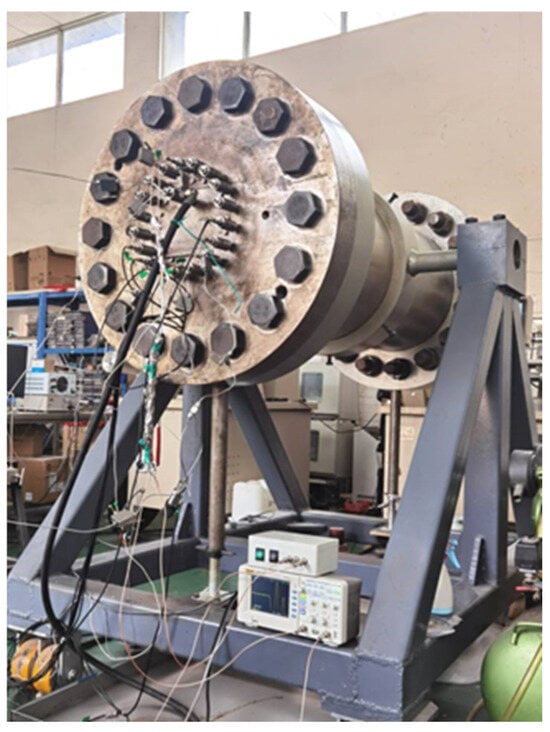
Figure 2.
High-pressure 2D scaled physical model experimental device.
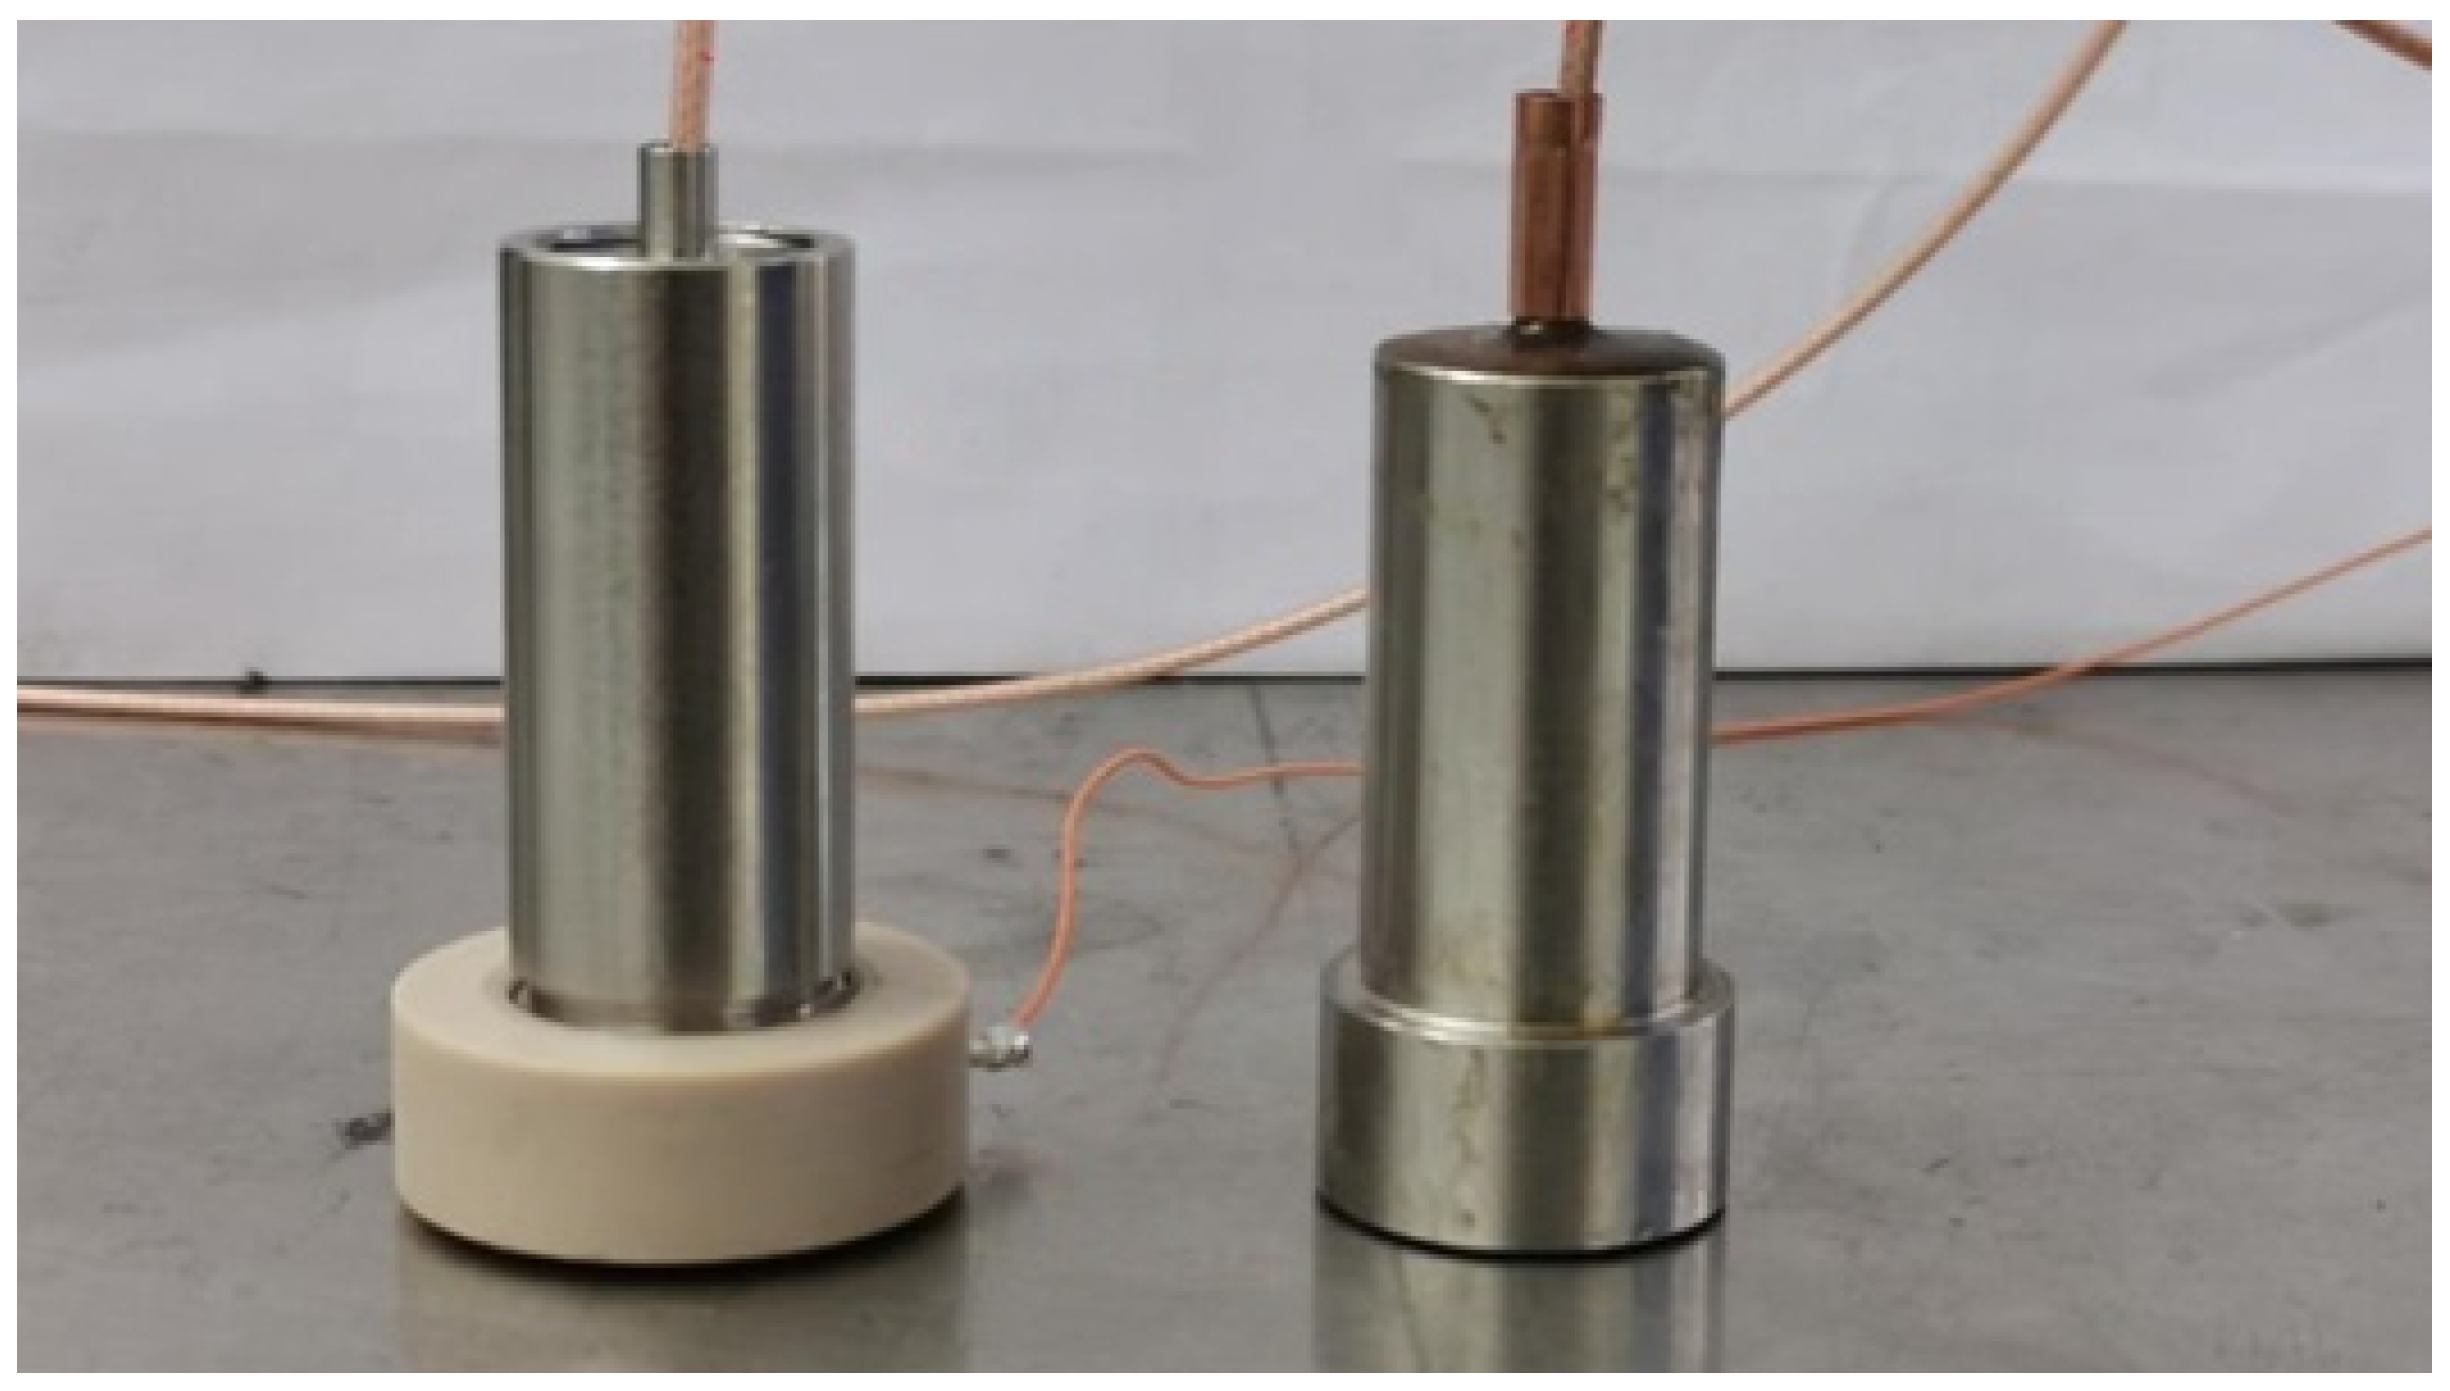
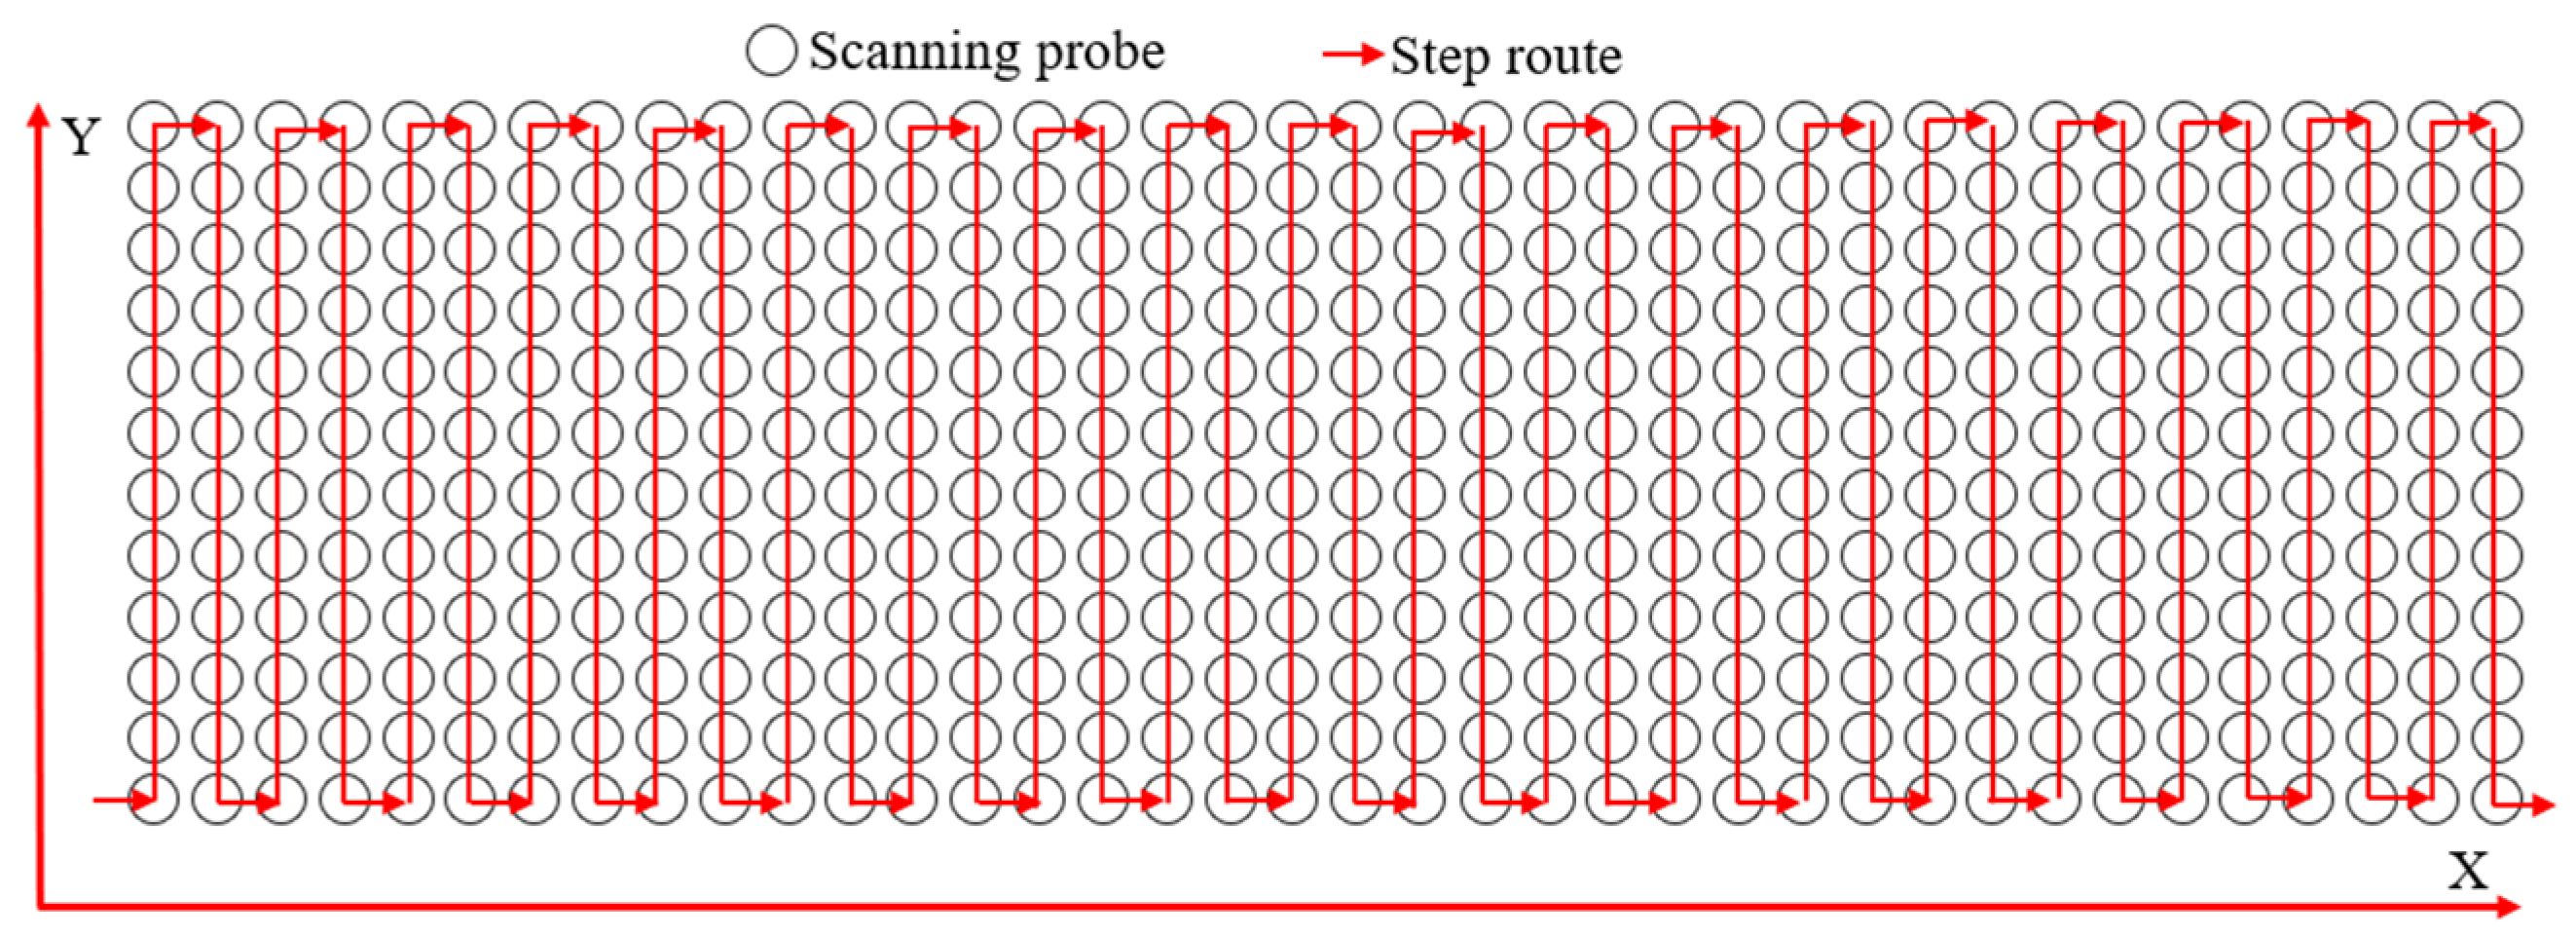
The temperature-controlled system consists of four heating tubes (providing the heat source), a temperature indicator (for real-time monitoring of the model temperature), and an insulation sleeve (wrapped around the exterior of the model to maintain a constant external temperature). The data acquisition system uses a temperature indicator and pressure sensor to collect temperature and pressure data during the experiment, and it also monitors changes in resistivity throughout the entire displacement process using the acoustic–electric emission probe and the acoustic–electric receiving probe (Figure 3). According to the principle of induction logging, when the induction coil in the acoustic–electric emission probe carries an alternating current, an alternating magnetic field is formed around the coil, and an induced current (eddy current) is generated in the rock plate. The secondary magnetic field caused by the eddy current causes a secondary induced current in the induction receiving coil. The acoustic–electric receiving probe can measure the resistivity at each test point’s position, from which the gas–water two-phase saturation data can be calculated using Equations (1)–(3) below, and these data are recorded on the computer. At the same time, the saturation diagram is generated to observe the movement of the gas–water interface in the profile [42]. The fluid saturation testing probe uses a serpentine walking pattern, as shown in Figure 4, which means it traverses each scanning point in the scanning area with the minimum number of movement steps.
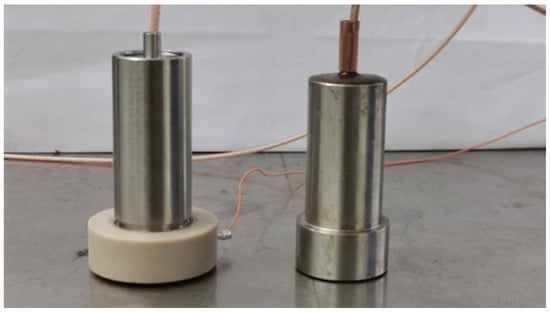
Figure 3.
Scanning probes.
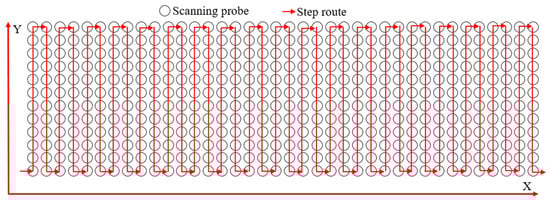
Figure 4.
Snake step diagram for the scanning probe (showing the trajectory of the scanning device when scanning the resistivity of each region of the profile model).
2.2.1. Device Principle
The various salts contained in the rock were ionized in water to produce positive and negative ions. Under the action of the electric field, the positive and negative ions will move and form a stable current [44]. The higher the water salinity, the stronger the conductivity, and the lower the measured resistance [45]. Therefore, the position of the gas–water interface during the water invasion process can be determined by monitoring the change in the resistance value in the model. According to rock electricity theory, the relationship between resistivity and water saturation can be expressed by Archie’s formula [46,47]:
where R0 and Rt are the rock resistance values of 100% saturated formation water and the resistance values of oil and gas-bearing rocks, respectively, in units of Ω·m, reflecting the conductivity of rocks under different water saturation values in the reservoir; b is a constant related to lithology, which is a parameter used to correct resistivity and reflects the sensitivity of rock to resistivity; Sw is water saturation; and n is the saturation index, which reflects the nonlinear relationship between resistivity and porosity.
Because the water invasion experiment only involves gas–water two-phase flow, the gas–water two-phase saturation in the model can be quantitatively expressed as:
where Sg is gas saturation, reflecting the proportion of gas volume in the reservoir to the pore volume of the rock.
2.2.2. Device Improvement
In the profile experimental schematic, including a long strip of metal filter at the entrance of the left side of the profile is a crucial aspect of this design. Initially, there were three edge-water inlets on the left side, which posed the risk of preferential invasion by edge water into the three small layers where the inlets were located. Furthermore, the edge-water intrusion experiment was also susceptible to gravity differentiation. To ensure that the edge water simultaneously invades each small layer of the profile from the left side, we incorporated a two-layer long strip of metal filter, measuring 30 cm in length and 4 cm in width. This filter was positioned above the three entrances on the left side, enabling the formation water to immediately fill the entire metal filter as soon as it enters the sand-filling section on the left side. This ensures even contact with each small layer and minimizes the influence of gravity differentiation.
Furthermore, two right-angle metal sheets were designed for the exit of the frame of the plate model, as shown in the experimental schematic on the right side of the profile model at the one-third and two-thirds positions. The purpose of these metal strips is to prevent the edge water from flowing down along the edge of the sand filling and frame body when it reaches the right metal frame body. This measure ensures accurate experimental results when studying the gas well’s perforation degree.
2.3. Two-Dimensional Profile Model Equivalent Design and Production
2.3.1. Model Design Principles
The X gas reservoir’s long axis formation dip angle is small, and there are a series of complex reverse faults. The sand body in the main layer is very thick, and it is widely distributed on the plane. Many low-permeability, ultra-low-permeability, and high-permeability sand bodies are interspersed in the longitudinal direction. Vertically, there are many low-permeability, extra-low-permeability, and high-permeability sand bodies interspersed with each other. There is no continuous compartment for sealing, and the local gas layer has a “sweet spot” development. Such complex reservoir characteristics make it difficult to design a representative profile model.
Because the conventional logging data are based on a 10 m thick sand body as the unit to measure its physical properties, the permeability data obtained are very rough, making it difficult to accurately reflect the physical properties and heterogeneity of the F layer. By analyzing the logging permeability and core permeability profile of well X2, it was found that the heterogeneity of the core permeability description is more obvious. Therefore, we adopted more fine core permeability test data from well X2 in the whole well section, considered the permeability of the secondary sand body in the F layer, and took a 10 cm thick sand body as a unit for continuous coring, which provides a basis for the representative design of the experimental model.
Given the influence of the vertical heterogeneity of the reservoir, the edge-water invasion exhibits selectivity, and the formation water will first invade the sand body with the highest permeability. Consequently, the water invasion rate and water breakthrough time were not based on the average permeability of the reservoir but on the local maximum permeability. Therefore, similar segmentation was done by taking the highest value of regional permeability to form a simplified permeability profile.
2.3.2. Equivalent Transformation of the Profile Model
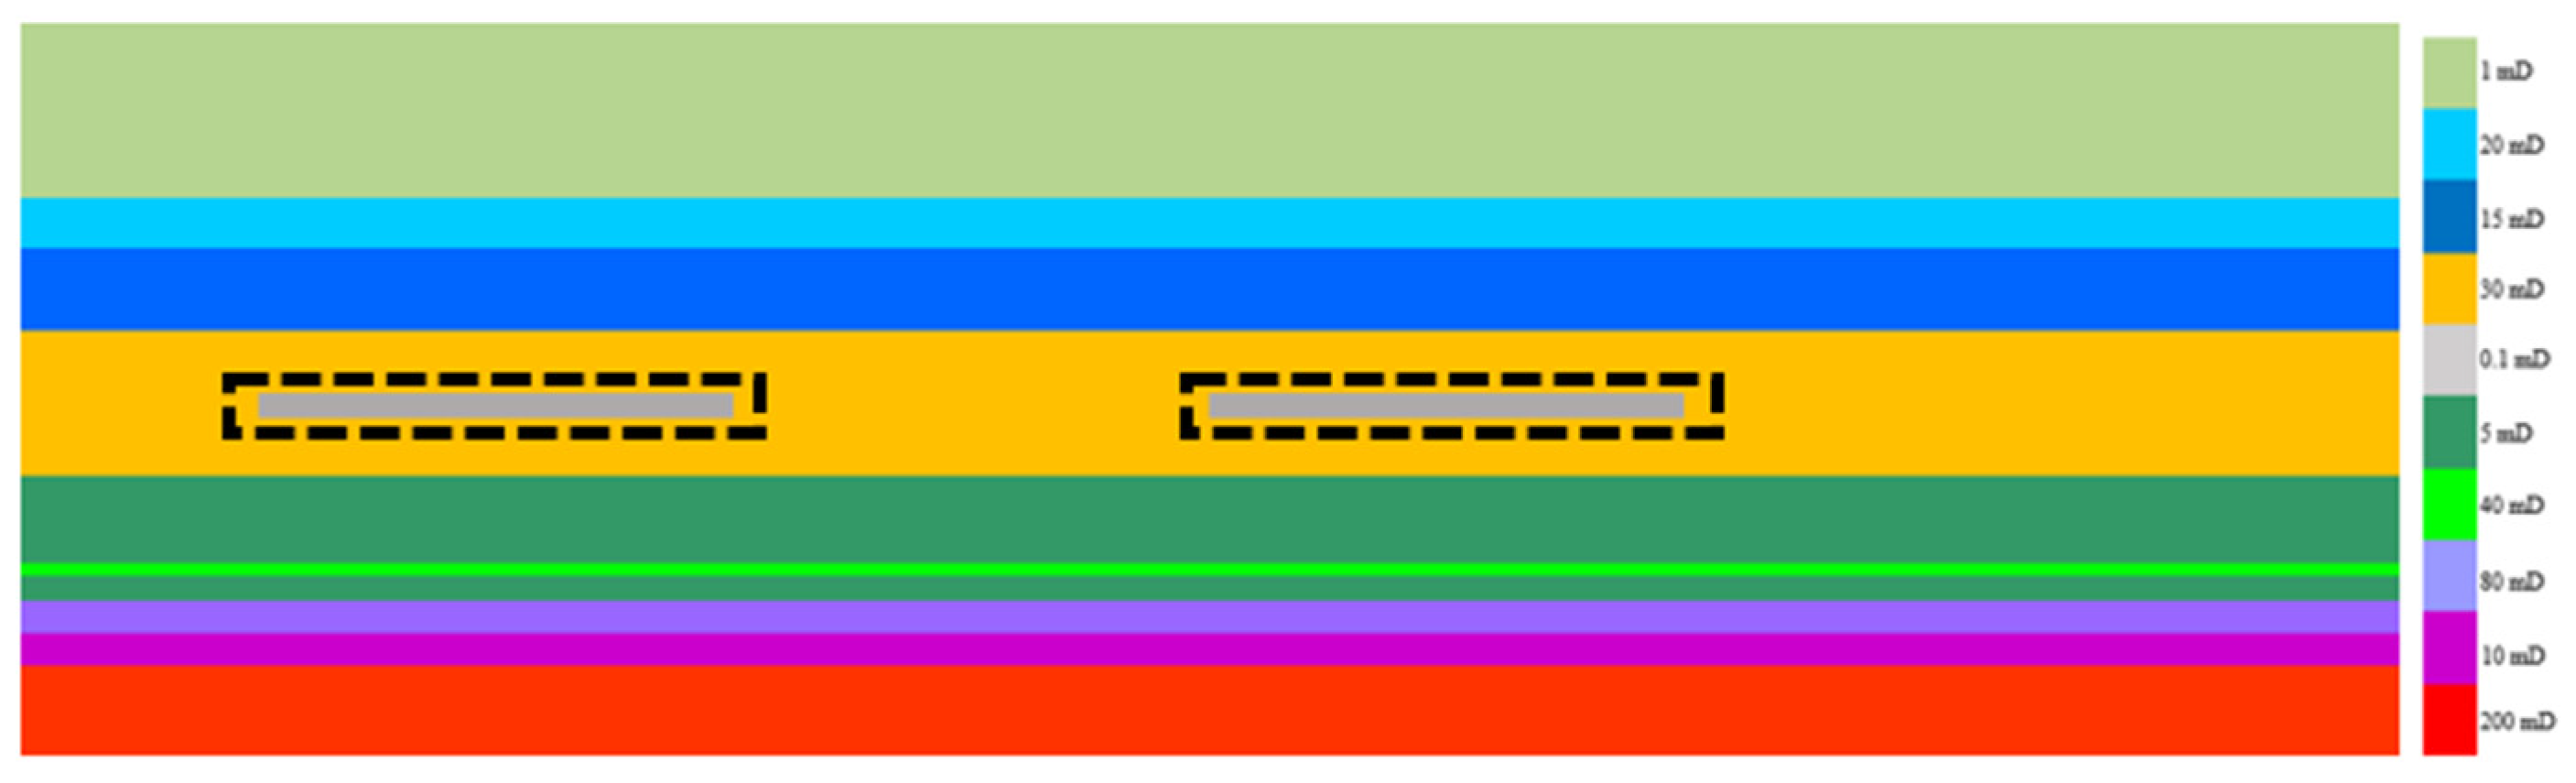
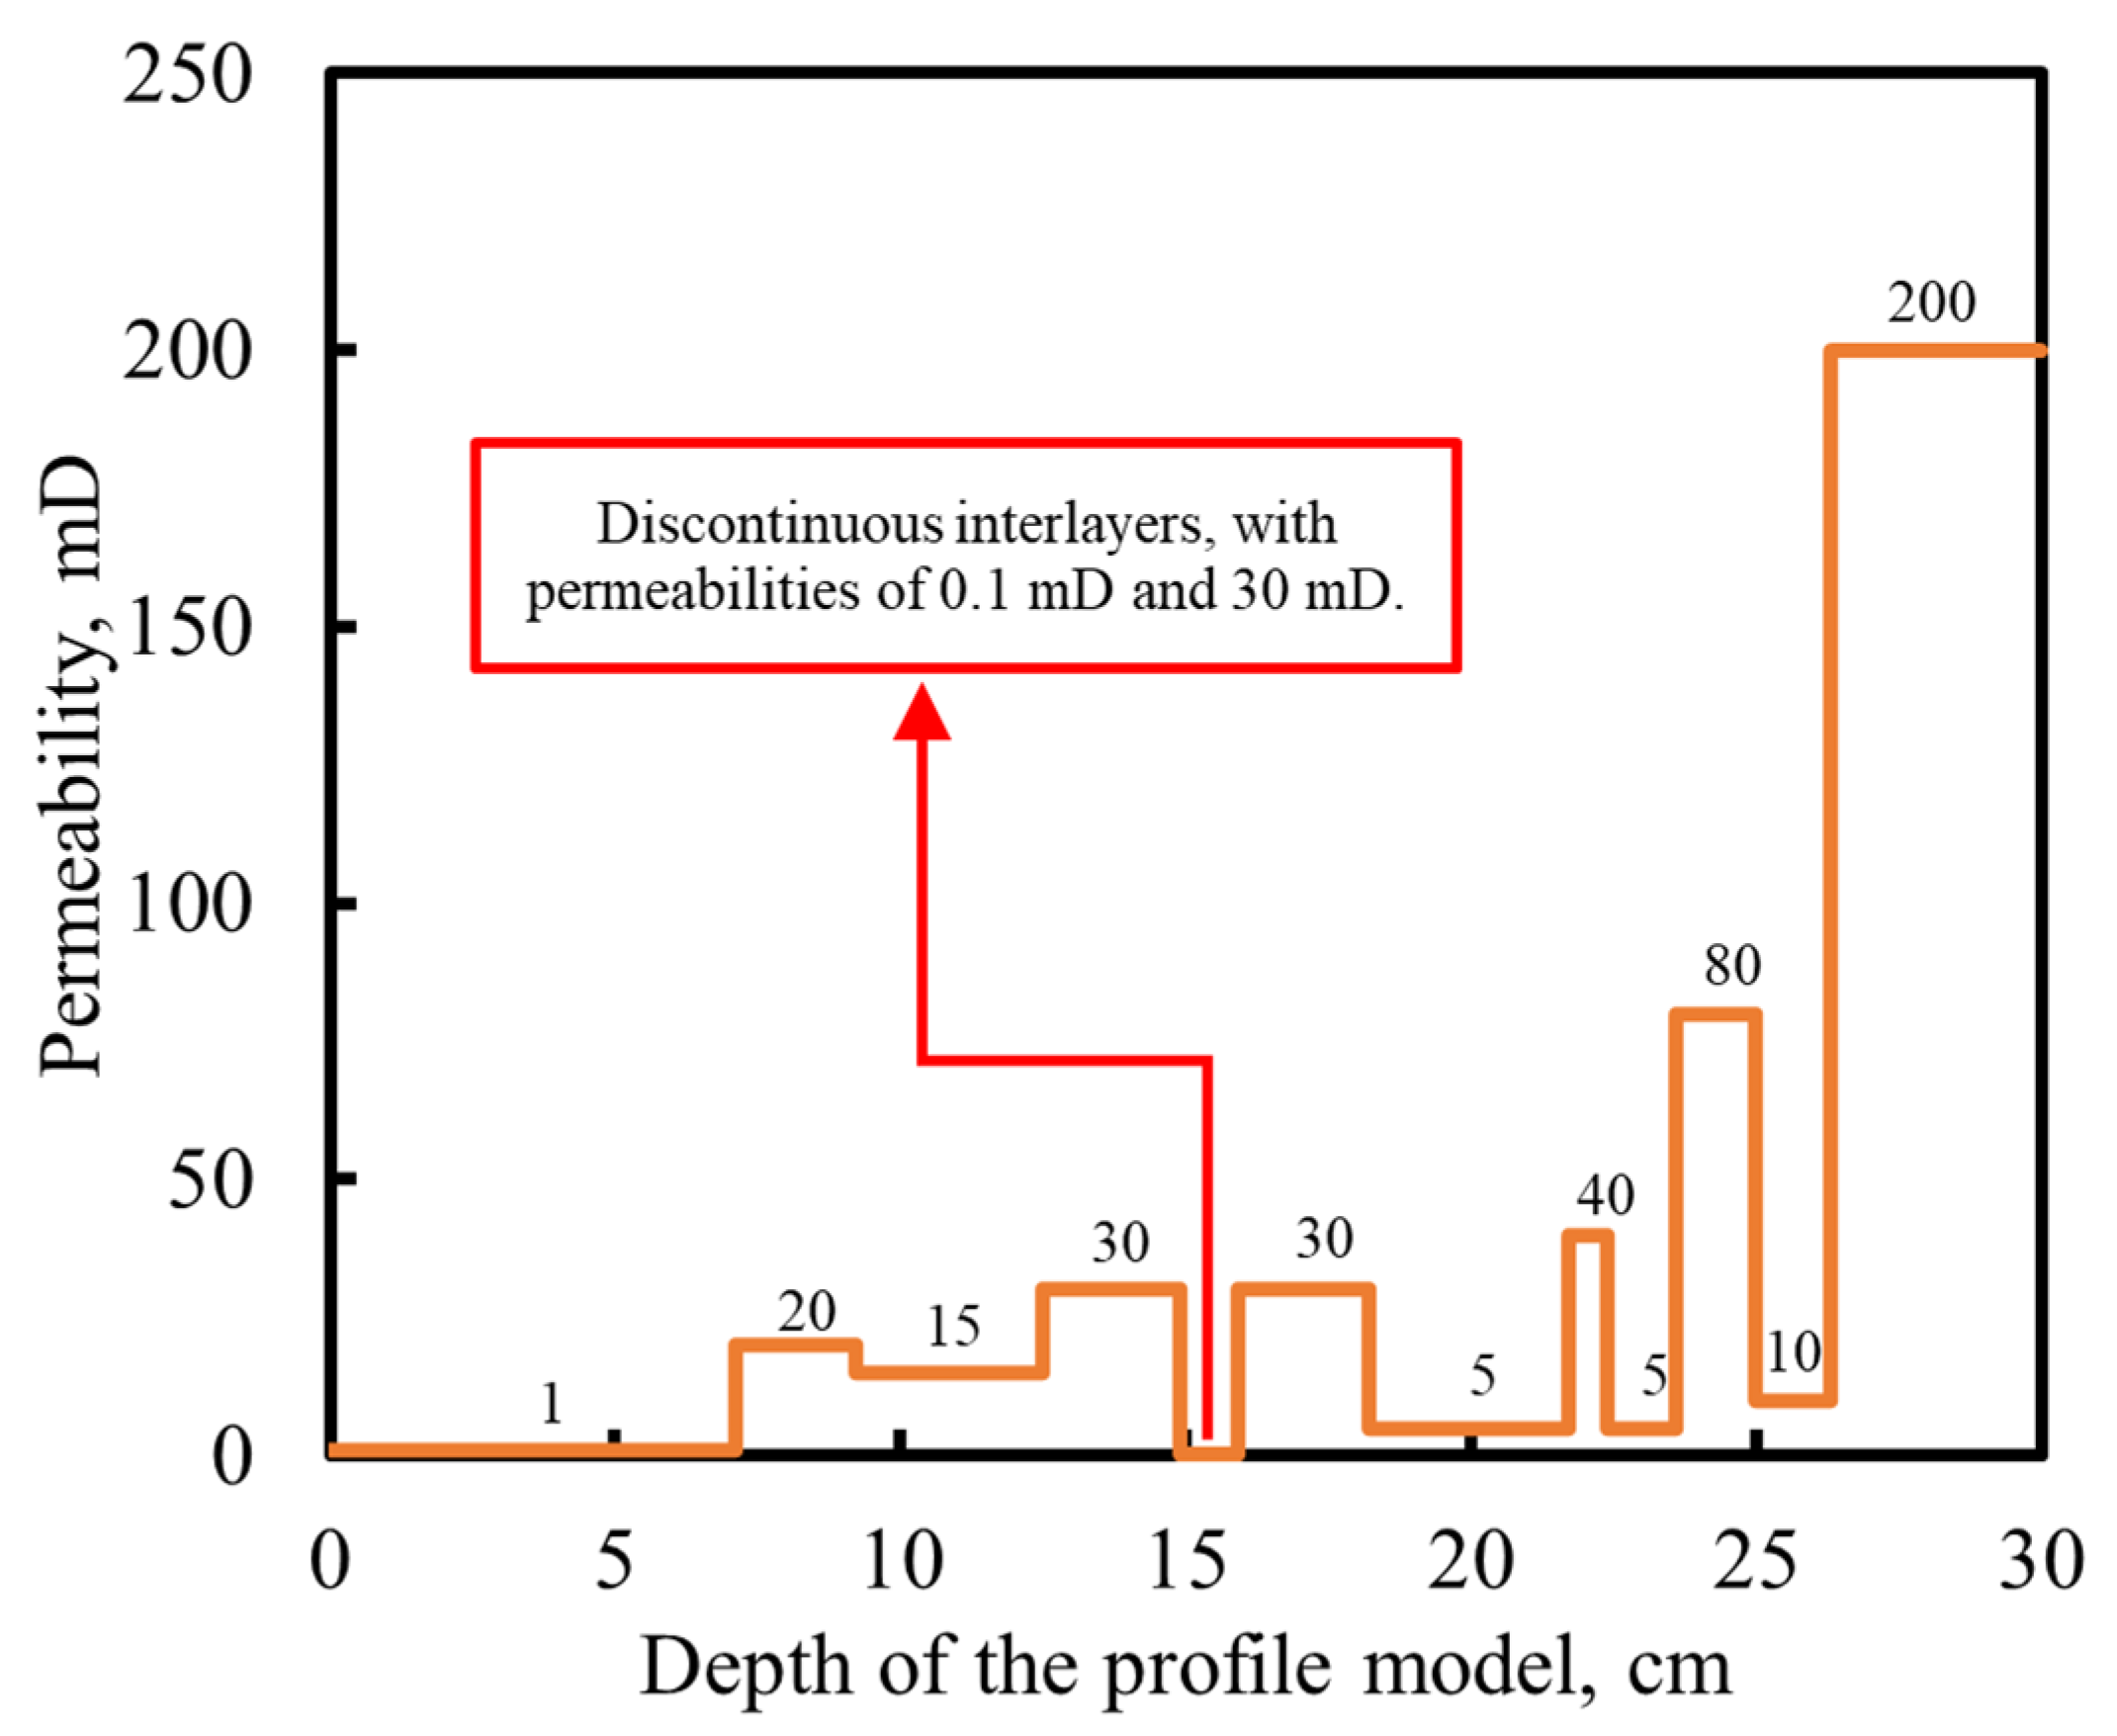
The focus of the innovative design of the two-dimensional profile model was also to design a low-permeability interlayer that is stretched but not completely isolated at 10–30 and 50–70 cm in the middle of the model (see the black dotted box in Figure 5, where the permeability is 0.1 mD). The interlayer will hinder the flow of gas–water fluid, but it is not completely sealed. The design of this “discontinuous interlayer” is a novel approach to understanding the effect of such actual interlayers on fluid transport distribution in thick gas layers in physical simulations. Based on the layer thickness of each small layer in the F layer, a profile model was proportionally scaled down to laboratory dimensions of 30 cm (height) × 100 cm (length) × 1 cm (width), with its permeability distribution shown in Figure 5 and detailed parameters listed in Table 1. By analyzing the permeability at various depths of the profile model, as shown in Figure 6, it can be observed that although the permeability distribution of the profile model is complex and variable, it generally exhibits a characteristic of positive rhythm.
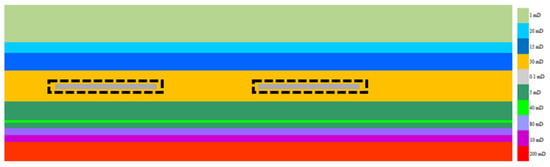
Figure 5.
Permeability distribution of the profile model. (The permeability values range from 0.1 to 200 mD, exhibiting a significant level of heterogeneity. The area indicated by the dashed black line represents a 0.1 mD interlayer).

Table 1.
Profile Model Design Parameters.

Figure 6.
Permeability values at different depths of the profile model.
2.3.3. Profile Model Making
The sand-filling design in this study is very complicated, and each small layer of the profile model needs to fill out ten different target permeabilities. To ensure the accuracy of the permeability of the sand-filling model and simulate the reservoir more realistically, according to the particle size of the real reservoir core, 40–80 mesh quartz sand and UJ-100 binder were mixed in a variety of proportions. These mixtures were compacted in templates with the same strength. After drying, the cores were drilled, and the SCMS-C3 automatic core porosity and permeability tester measured the permeability of each core. Based on this idea, multiple sand-filling formulations were trial-produced, and sand-filling models were tested to determine the permeability formulations of each layer of the high-pressure profile sand-filling model. Then, according to the developed sand-filling formula, sand filling, grinding, and drying were performed on the template. Finally, the physical model of the high-pressure profile was completed.
Because of the influence of different operation intensities on the permeability of profile sand filling, the permeability varied. To ensure accuracy of the permeability of each layer of the sand-filling model, a pressure display was used to assist the operation during the compaction process. The circular contact surface of the pressure display pressed on the sand-filling surface to display the pressure reading, which helps to maintain the consistency of sand filling, ensures a uniform degree of compaction, and reduces the influence of human operation.
2.4. Experimental Scheme
To elucidate the gas–water seepage behavior in the X gas reservoir, we focused on analyzing the F layer profile of well X2. Our objective was to investigate the impact of varying gas production rates and different degrees of gas layer perforation on water intrusion within thick vertical heterogeneous profiles. The experiments were conducted at room temperature and with a formation pressure of 37 MPa. The specific experimental scheme is presented in Table 2.
Table 2.
Experimental Scheme.
2.5. Experimental Steps
The experimental steps of the water intrusion seepage experiment are as follows:
- (1)
- The original state of the gas reservoir is established. The flat plate model is placed vertically, with the injection end at the bottom and the production end at the top. The vacuum pump is used to vacuum the flat plate model, and then the sand-filling model is saturated with formation water from bottom to top, and the pore volume is determined. Then, the injection end is situated at the top and the production end is situated at the bottom. The sand-filling model is gas-driven from top to bottom to restore the original irreducible water state. The sand-filling model’s gas and bound water saturation are determined. Finally, the plate model is continuously pressurized until the pressure rises to 37 MPa.
- (2)
- The edge water system is established. The pressure vessel of the formation water sample is filled with formation water, pressurized by a high-pressure displacement pump, and nitrogen is driven into the formation water through a nitrogen intermediate container until the pressure in the pressure vessel of the formation water sample is restored to the original reservoir pressure.
- (3)
- The gas reservoir mining process is simulated. The vertical lifting mechanism adjusts the flat plate model to a formation dip angle of 5°, and the mass flowmeter sets a constant flow rate to achieve constant production mining. The valve at the production end of the flat plate model controls the degree of reservoir perforation, and the bottom hole pressure is recorded in real time through the pressure sensor.
- (4)
- The data are processed. As the internal pressure of the flat plate model decreases, the water expands into the sand-filling model. The data acquisition system collects the water and gas saturation at the corresponding position in the real-time sand-filling model, as measured by the fluid physical property test point. It enters the supporting software to generate the intuitive saturation distribution map of the water invasion profile. The gas meter reads the total gas production in real time, and the gas reservoir recovery rate is calculated. The sliding probe scanning process is shown in Figure 7.
 Figure 7. Sliding probe scanning process.
3. Results and Discussion
3.1. Permeability Formula for the Profile Model
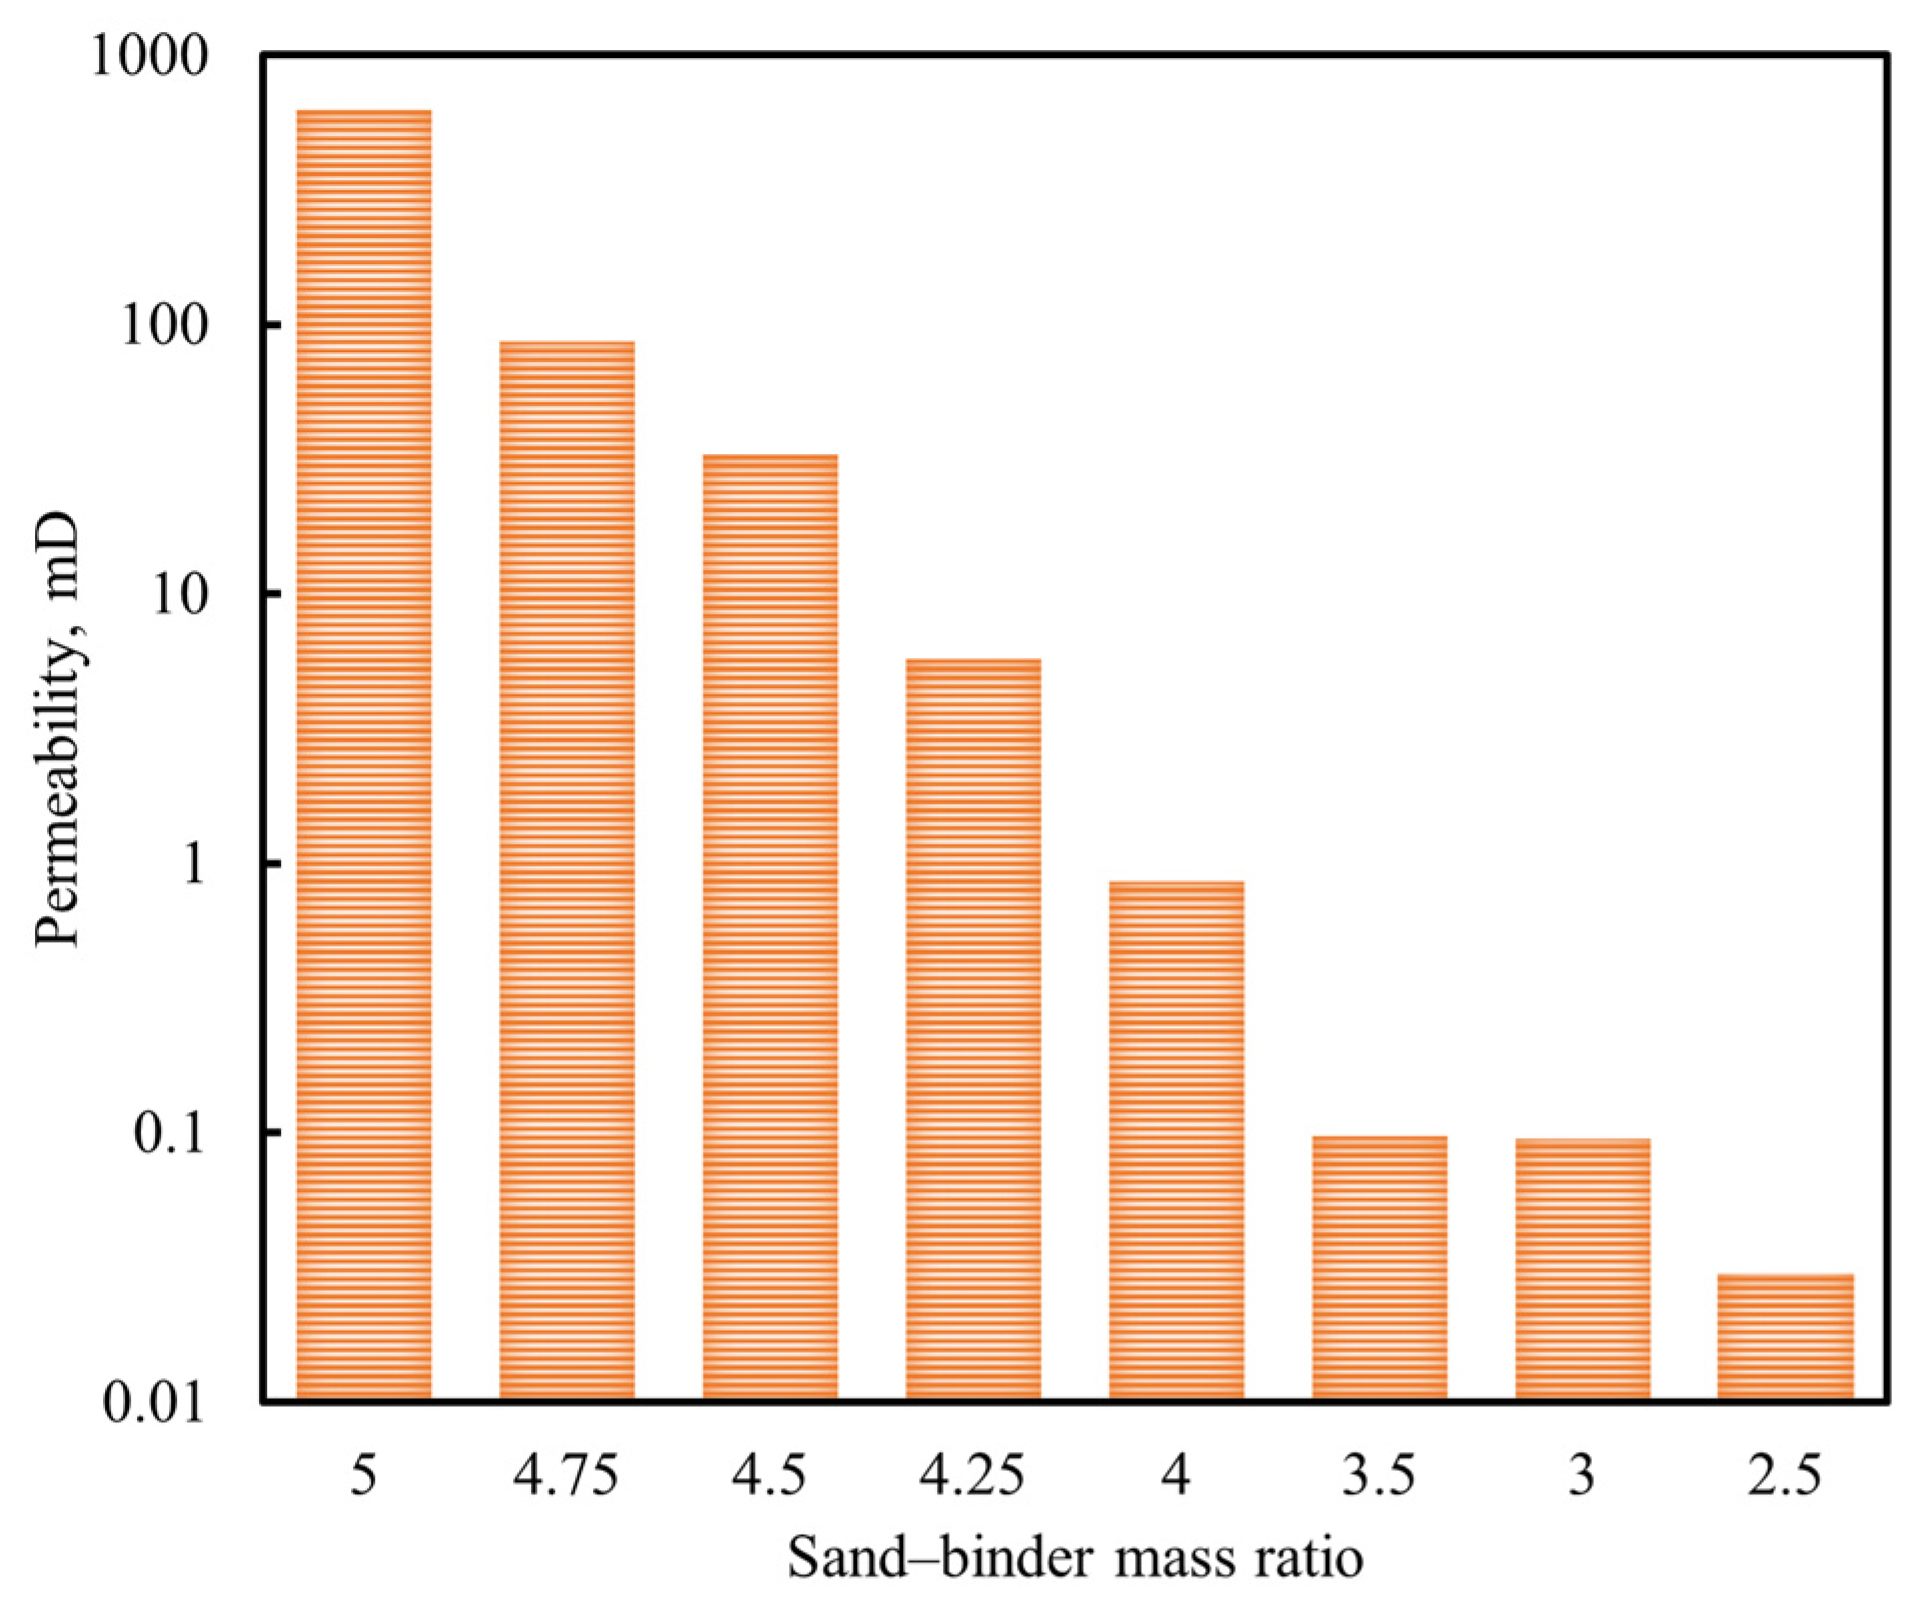
By continuously filling sand-filling models with different sand–binder mass ratios and drilling cores to measure their porosity and permeability, the porosity and permeability of cores with the same sand–binder mass ratio were measured, and the average value was taken. After many tests, the relationship between the sand–binder mass ratio and the permeability was obtained, as shown in Figure 8. It can be seen that the larger the proportion of quartz sand in the sand-filling model, the higher the permeability. The sand–binder mass ratio and permeability correlate well on a semi-logarithmic plot, thus yielding a sand-filling formula that meets the target permeability.

Figure 8.
Relationship between the sand–binder ratio and core permeability. (The X axis is the mass ratio of quartz sand to binder, and the Y axis is the permeability value of the core drilled after the sand–binder mixture is dried).
3.2. Improvement Effect of the Profile Model
After improvement of the device, to verify the effect’s consistency and the idea, a homogeneous permeability sand-filling model was constructed, and the edge-water invasion experiment was conducted under the same experimental conditions as those for the experimental design. Because the seepage resistance of the edge water is the same when it invades the homogeneous model, the edge-water invasion speed of the homogeneous model should be the same in the longitudinal direction without considering the influence of gravity. The experimental results obtained by the resistivity test are shown in Figure 9. From the water saturation diagram, it can be seen that, in the homogeneous sand-filling model, the edge water is neatly and parallelly pushed from the left side to the right side, and the gas–water interface is uniformly pushed in the longitudinal direction. No obvious gravity differentiation of the edge water during the intrusion process is observed, and there is no downward flow of the edge of the edge-water extension frame at the outlet end, which confirms that the design of the long strip of metal filter and the right-angle metal sheet is effective.

Figure 9.
Water saturation distribution for the homogeneous permeability model. (The edge water is uniformly advanced, reflecting the good improvement effect of the device).
3.3. Dynamic Characteristics of Production
3.3.1. Analysis of the Dynamic Characteristics of Water Production
Water breakthrough is a common occurrence in the production of gas wells in edge-water gas reservoirs. The output of formation water not only increases the complexity and cost of treatment during the mining process but also significantly reduces the productivity of gas reservoirs. Analyzing the dynamic characteristics of water production in gas reservoirs is essential for preparing proactive response plans to address the complex situation of water production in gas wells during development.
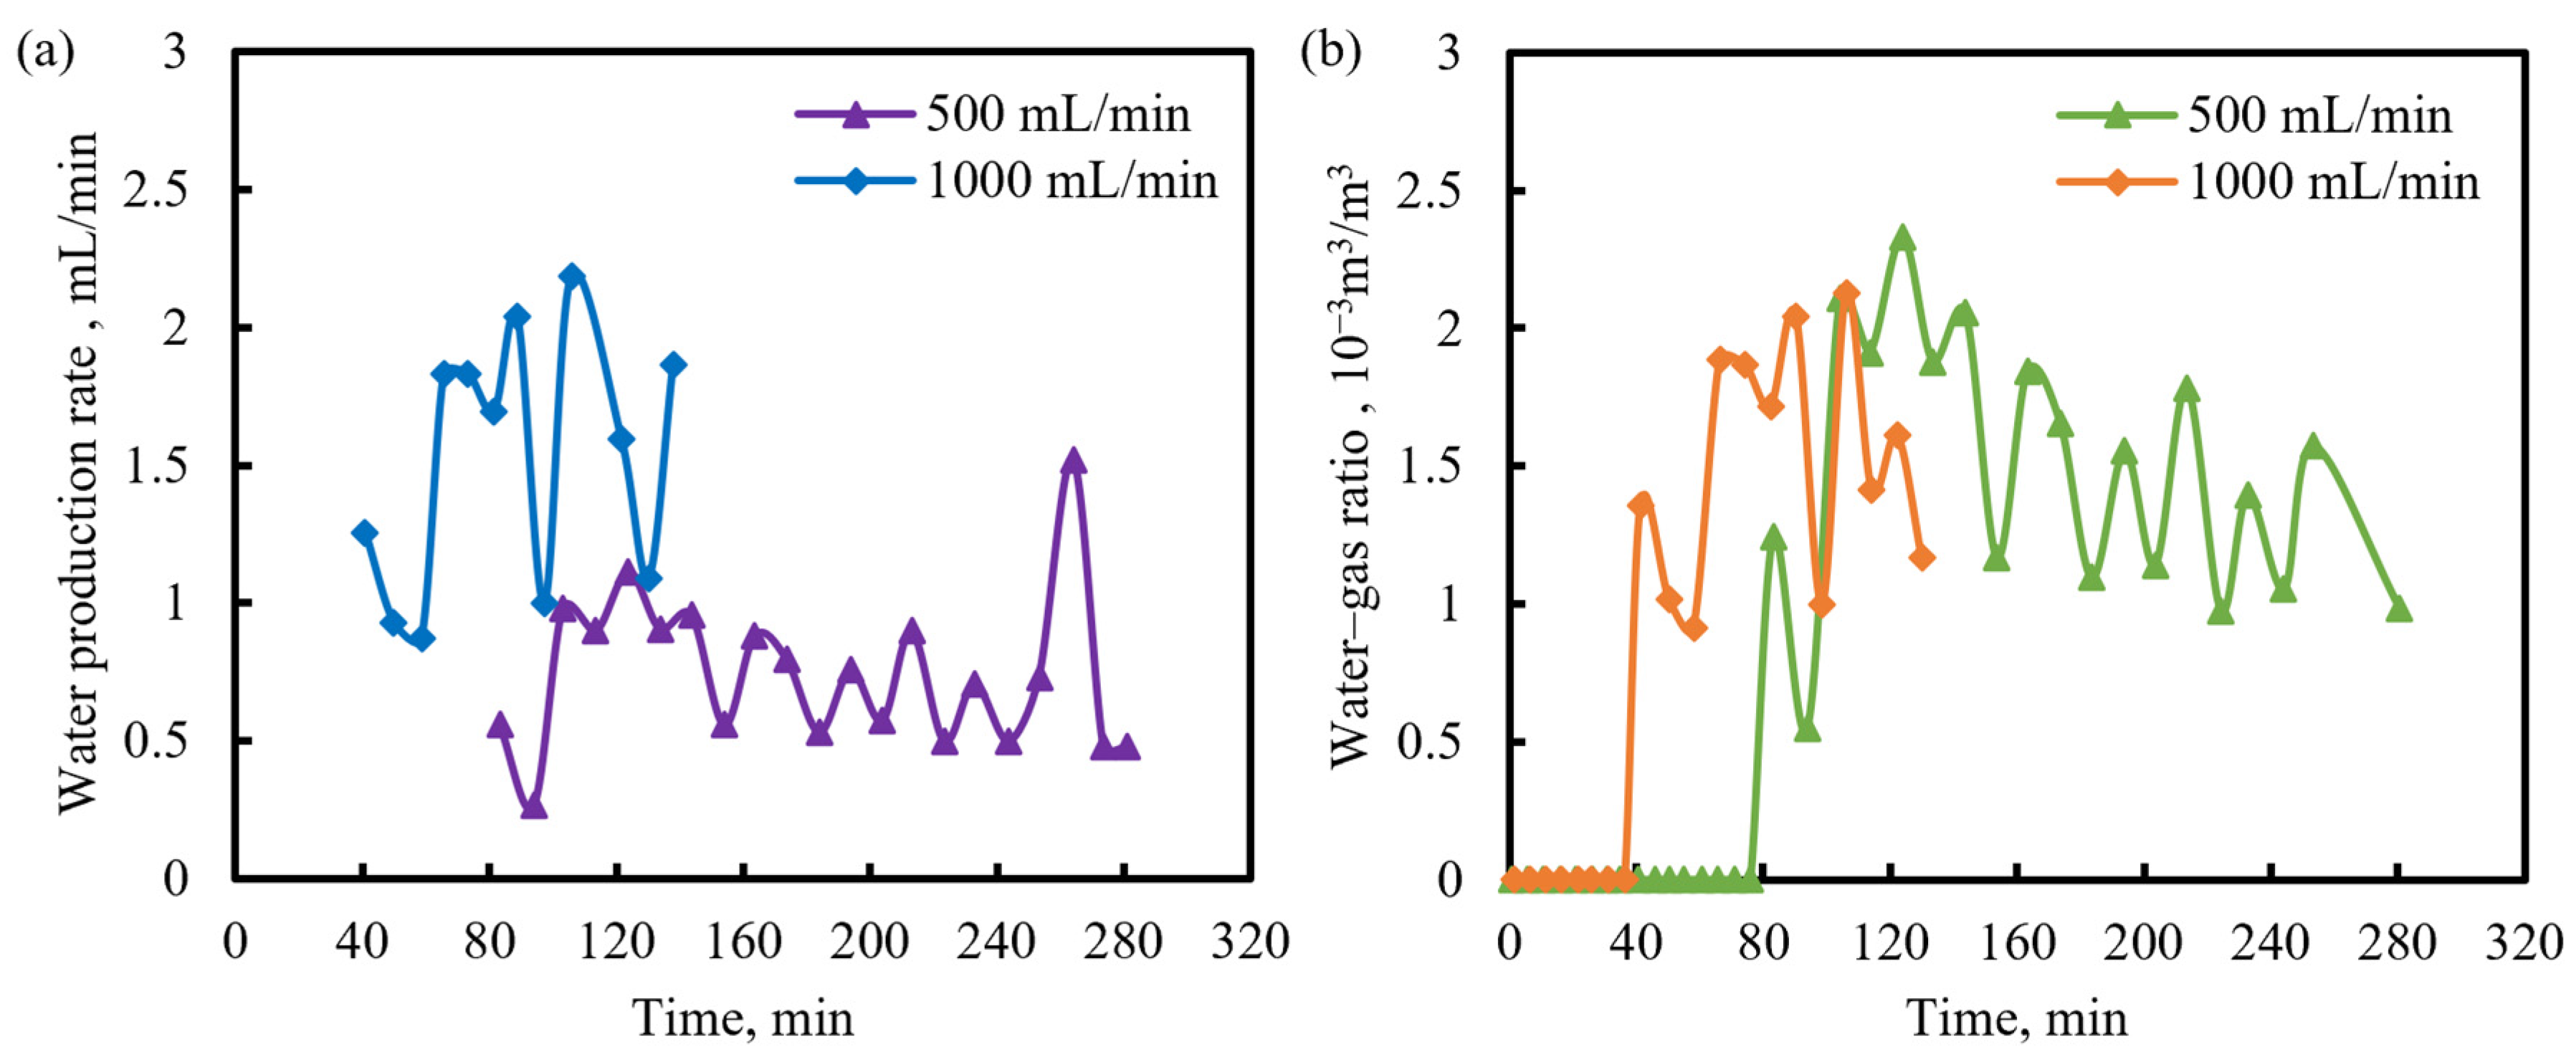
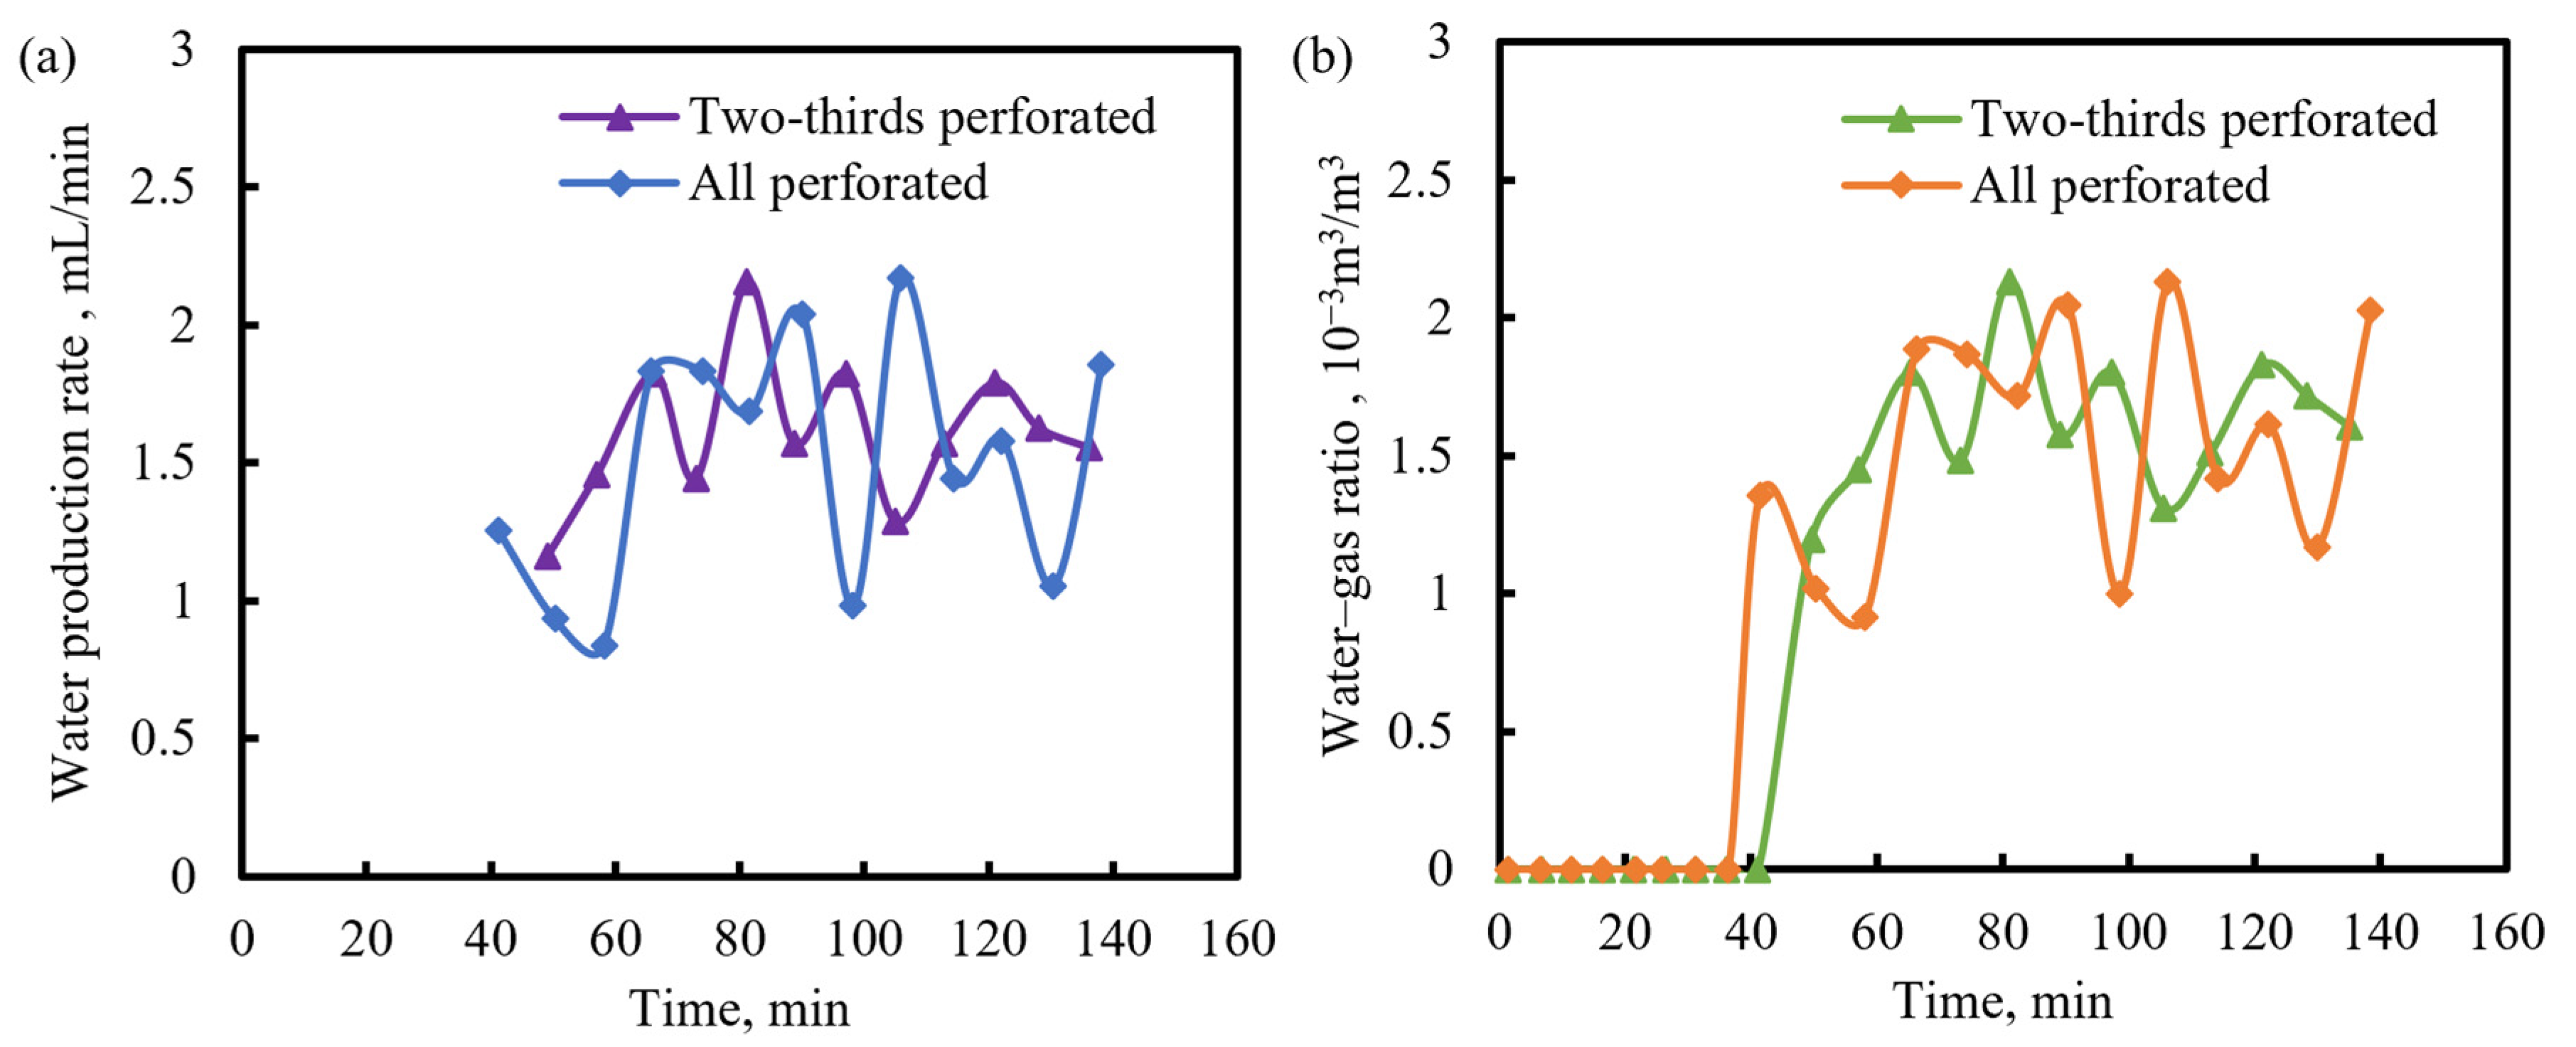
The water–gas ratio is the volume ratio of water to gas produced from the gas reservoir, which can assess the liquid production capacity of the reservoir and analyze the presence of formation water during gas production. When the water–gas ratio of the gas well exceeds 10−3 m3/m3, it is defined as the watered-out stage of the gas reservoir. Figure 10 and Figure 11 show the variations in water yield and water–gas ratio during the experiment. Because of the strong heterogeneity of the F layer in the X gas reservoir, there is a great variation in permeability in the reservoir, which leads to fluctuation in the water production rate of the gas well, and the variation in the water–gas ratio generally oscillates. Figure 10 shows that, when the gas layer is all perforated, the model operating at a gas production rate of 500 mL/min experiences a water breakthrough time of 76 min and a watered-out time of 83 min. In contrast, for the model with a gas production rate of 1000 mL/min, the water breakthrough time is reduced to 36 min, while the watered-out time is 41 min. Under the same degree of gas layer perforation, the greater the gas production rate, the faster the corresponding water production rate, and the greater the total water production. This occurs because the larger production rate will lead to a higher production pressure difference, advancing the gas well water breakthrough time. After the formation water breakthrough, the water–gas ratio rises abruptly, and the gas well quickly enters the watered-out state, which seriously affects the normal production of the gas reservoir. Therefore, when formulating a reasonable gas production rate, it is also necessary to consider the drainage difficulty after the on-site water is produced to avoid construction difficulties.
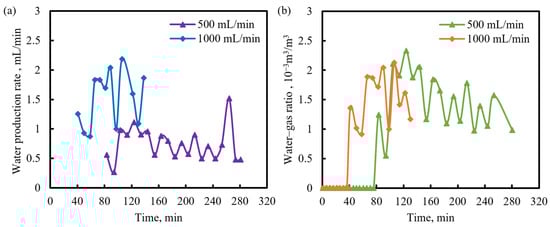
Figure 10.
Variation in water production rate and water–gas ratio of gas wells when the gas layer is all perforated. (a) Water production rate. (b) Water–gas ratio.
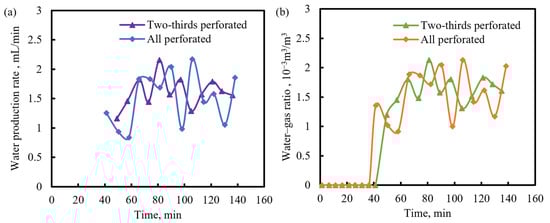
Figure 11.
Variation in water production rate and water–gas ratio of gas wells when the gas production rate is 1000 mL/min. (a) Water production rate. (b) Water–gas ratio.
When the gas production rate is 1000 mL/min, the model with the gas layer all perforated has a water breakthrough time of 36 min and a watered-out time of 41 min. In contrast, for the model with only two-thirds of the gas layer perforated, the water breakthrough time increases to 41 min, and the watered-out time extends to 50 min. Because the F layer of an X gas reservoir is a typical positive-rhythm permeability gas layer, at the same gas production rate, compared with a perforation of two-thirds of the layer, after all layers are perforated, owing to the low seepage resistance of the high-permeability zone at the bottom, the edge water can invade from the bottom faster and more easily to the production end. This results in greater total water production of the gas reservoir, earlier water breakthrough time and watered-out time of the gas well, and faster increase in the water–gas ratio. For a perforation of two-thirds of the layer, because the high-permeability zone at the bottom of the gas formation is not perforated, the permeability contrast in the upper two-thirds part of the gas formation is minor. Therefore, the side water does not exhibit an obvious finger-in phenomenon when intruding, and the water breakthrough time of the gas well is relatively late.
3.3.2. Advancing Speed of the Edge-Water Leading Edge
According to the model size and the water breakthrough time of the gas well, the advancing speed v (in cm/min) of the edge-water front can be expressed as
where l is the length of the model in the X direction with a value of 100 cm and t is the experimental time in minutes.
The results of the calculation for the advancing speed of the leading edge of the edge water are presented in Table 3. It is evident that, when the gas production rate remains constant, perforating two-thirds of the layer can delay the advance speed of the leading edge of the edge water compared to the model where the gas layer is all perforated. Although the maximum pressure difference is greater when the layer is perforated two-thirds, as opposed to when the layer is all perforated, and a larger pressure difference will accelerate the intrusion speed of the edge water, the absence of perforation of the bottom high-permeability zone in the layer under two-thirds perforation results in significant seepage resistance in the low-permeability zone. The propulsive effect of the greater pressure difference on the edge water is less than the delay effect caused by the seepage resistance in the low-permeability zone. This leads to a lower advance speed of the edge-water leading edge when the layer is perforated two-thirds, compared to when the layer is all perforated, despite the same gas production rate. When the perforation degree of the layer is the same, the advance speed of the edge-water leading edge is primarily controlled by the pressure difference, with a greater pressure difference resulting in a higher advance speed of the edge-water leading edge.
Table 3.
Calculation Results of the Advance Speed of the Edge-Water Leading Edge.
3.3.3. Dynamic Analysis of the Average Formation Pressure
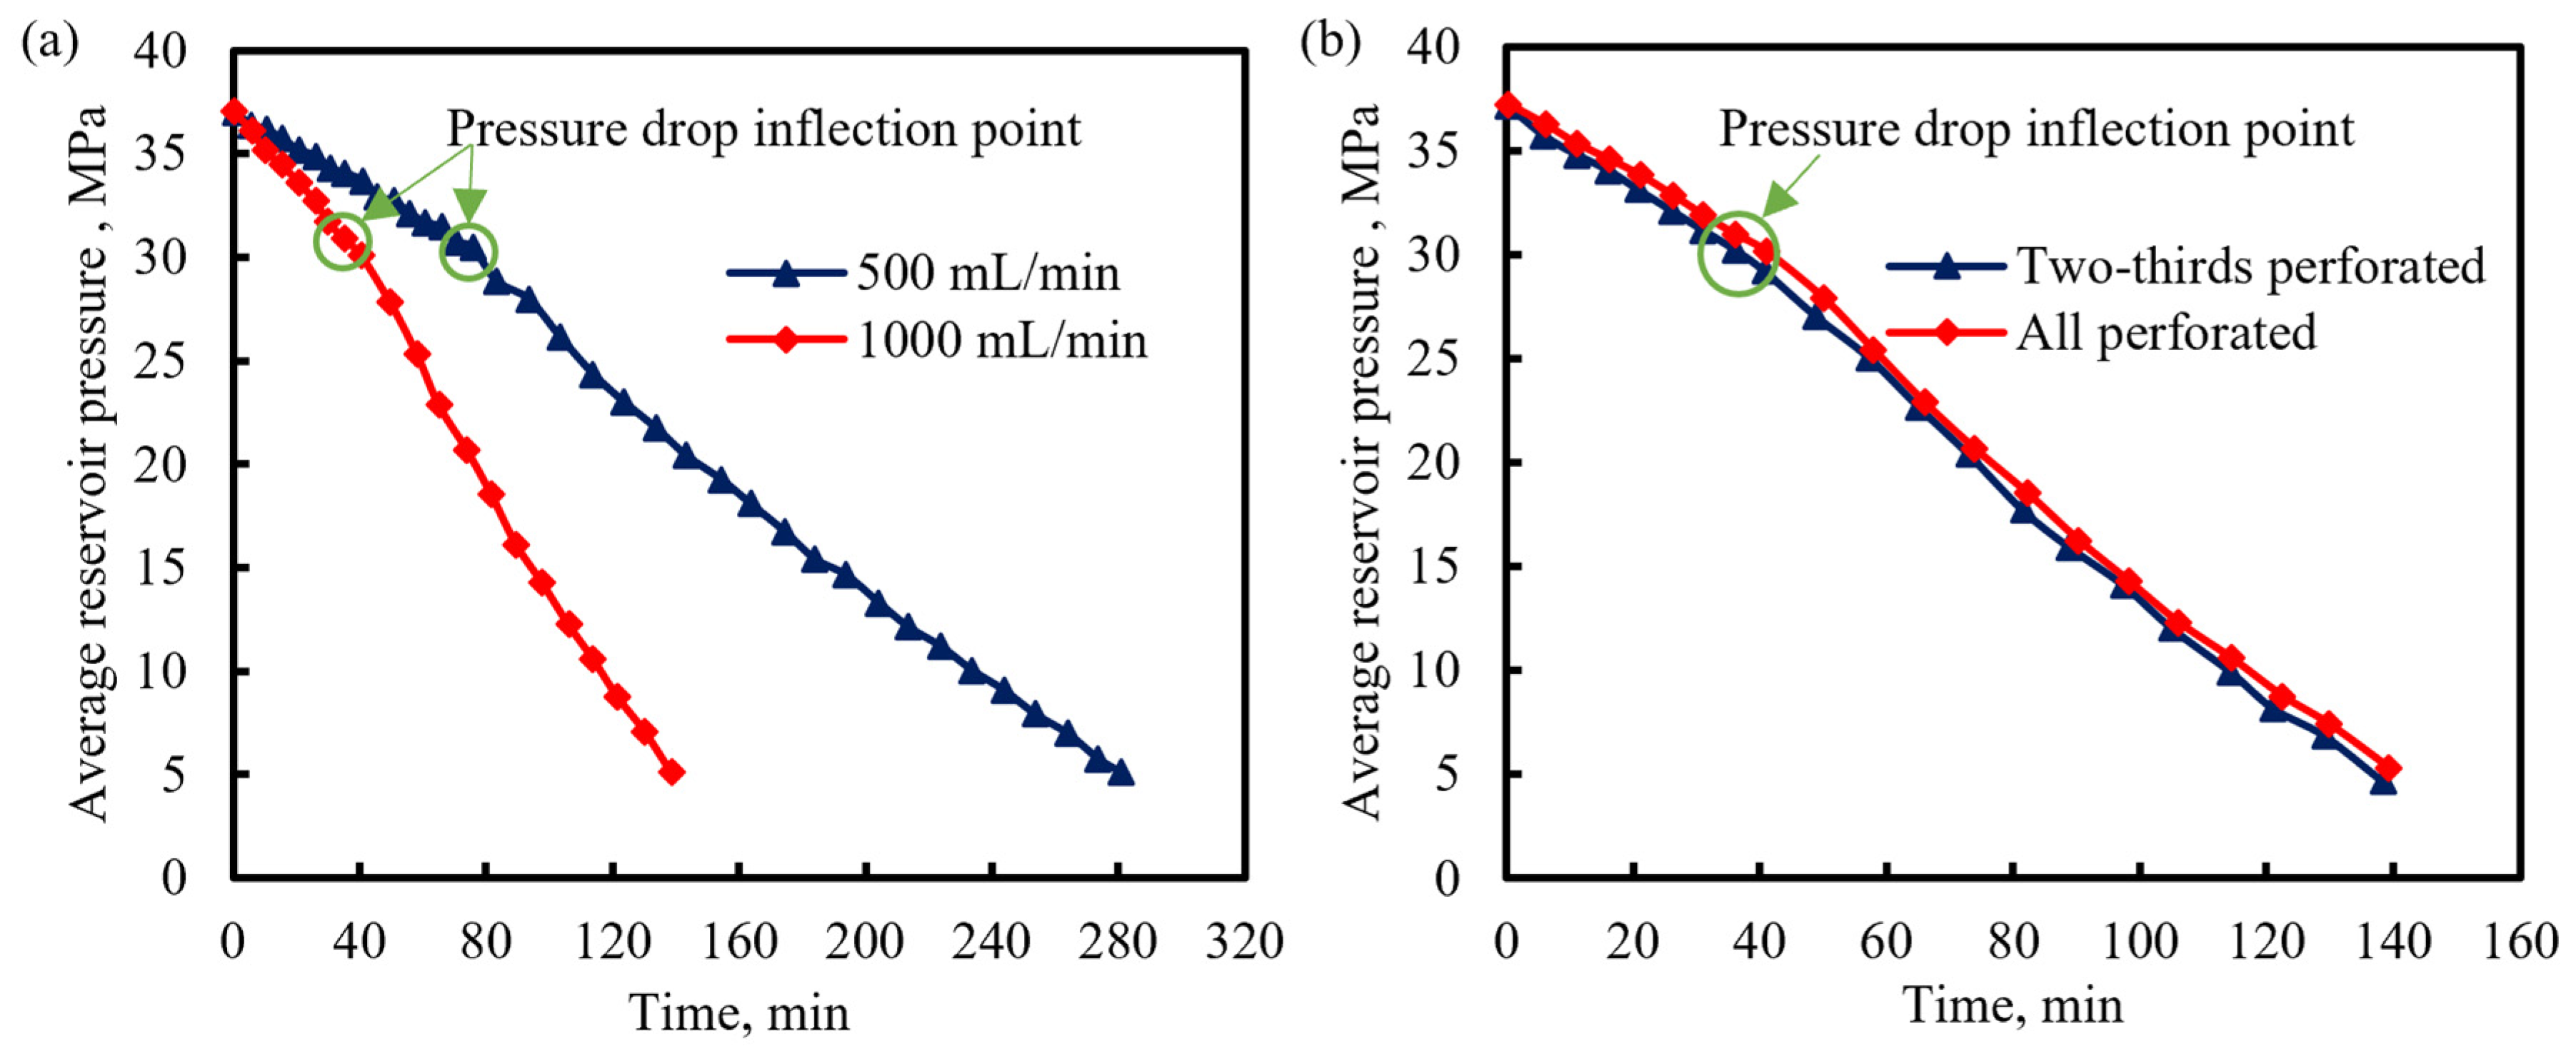
In the production process, the gradual decrease in the internal pressure of the gas reservoir is attributed to the production of natural gas and the formation of water. However, it is important to avoid excessive pressure drops as they can impact the economic development of gas reservoirs. Therefore, a key factor in maintaining the productivity and economic benefits of gas reservoirs is analysis of the law of formation pressure drop in the production process of edge-water gas reservoirs. As depicted in Figure 12, the average formation pressure of the side-water gas reservoir continuously decreases during the development process, and the rate of average formation pressure decline varies depending on the extraction methods used. Higher gas production rates lead to faster formation pressure drop rates because of increased gas extraction, resulting in a rapid decrease in formation pressure. However, the formation pressure trends for different gas layer perforation degree models remains almost the same at the same gas production rate. In essence, the gas production rate is the primary factor influencing the rate of average formation pressure decline.
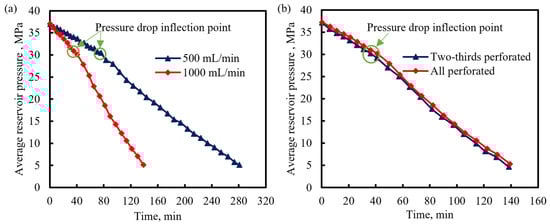
Figure 12.
Variation in the average formation pressure. (a) Variation in the average formation pressure of gas wells at gas production rates of 500 and 1000 mL/min, with the gas layer being all perforated. (b) Average formation pressure under two scenarios: when the gas layer is all perforated and when it is perforated two-thirds, both at a gas production rate of 1000 mL/min.
Careful observation of the trend in the formation pressure curve reveals an evident inflection point. Prior to this inflection point, the formation pressure decreases gradually but, after the inflection point, the formation pressure decreases more rapidly. Comparative analysis reveals that the time corresponding to this pressure drop inflection point coincides with the water breakthrough time of the gas well in the initial stage of edge-water intrusion, at which point water and gas flow as a single phase, resulting in low seepage resistance. The intrusion of edge water supplies energy to the gas reservoirs and delays the reduction in formation pressure. However, as water invasion intensifies, the edge water reaches the production end, leading to a significant increase in water production in the gas well and a rapid decrease in formation pressure. Consequently, in the actual development process, the decline in formation pressure can be used to judge the development stage of the gas reservoir.
3.4. Effect of the Recovery Rate
Because of the small pressure difference produced by physical experiments, the model can be reduced to very low pressure, and there is no influence of wellbore water column pressure. After water breakthrough, gas and water can continue to be produced simultaneously, so the final recovery rate of conventional physical experiments is relatively high. However, for real gas reservoirs, without special process measures, a large amount of water will be produced after the gas well water breaks through, resulting in difficulty in on-site drainage and formation of effusion in the well and ultimately causing the gas well to be watered-out and unable to produce. The recovery rate increased by the gas–water co-production period is extremely limited [48]. Therefore, the recovery degree of water breakthrough and watering-out during the experiment has more important reference significance for X gas reservoirs.
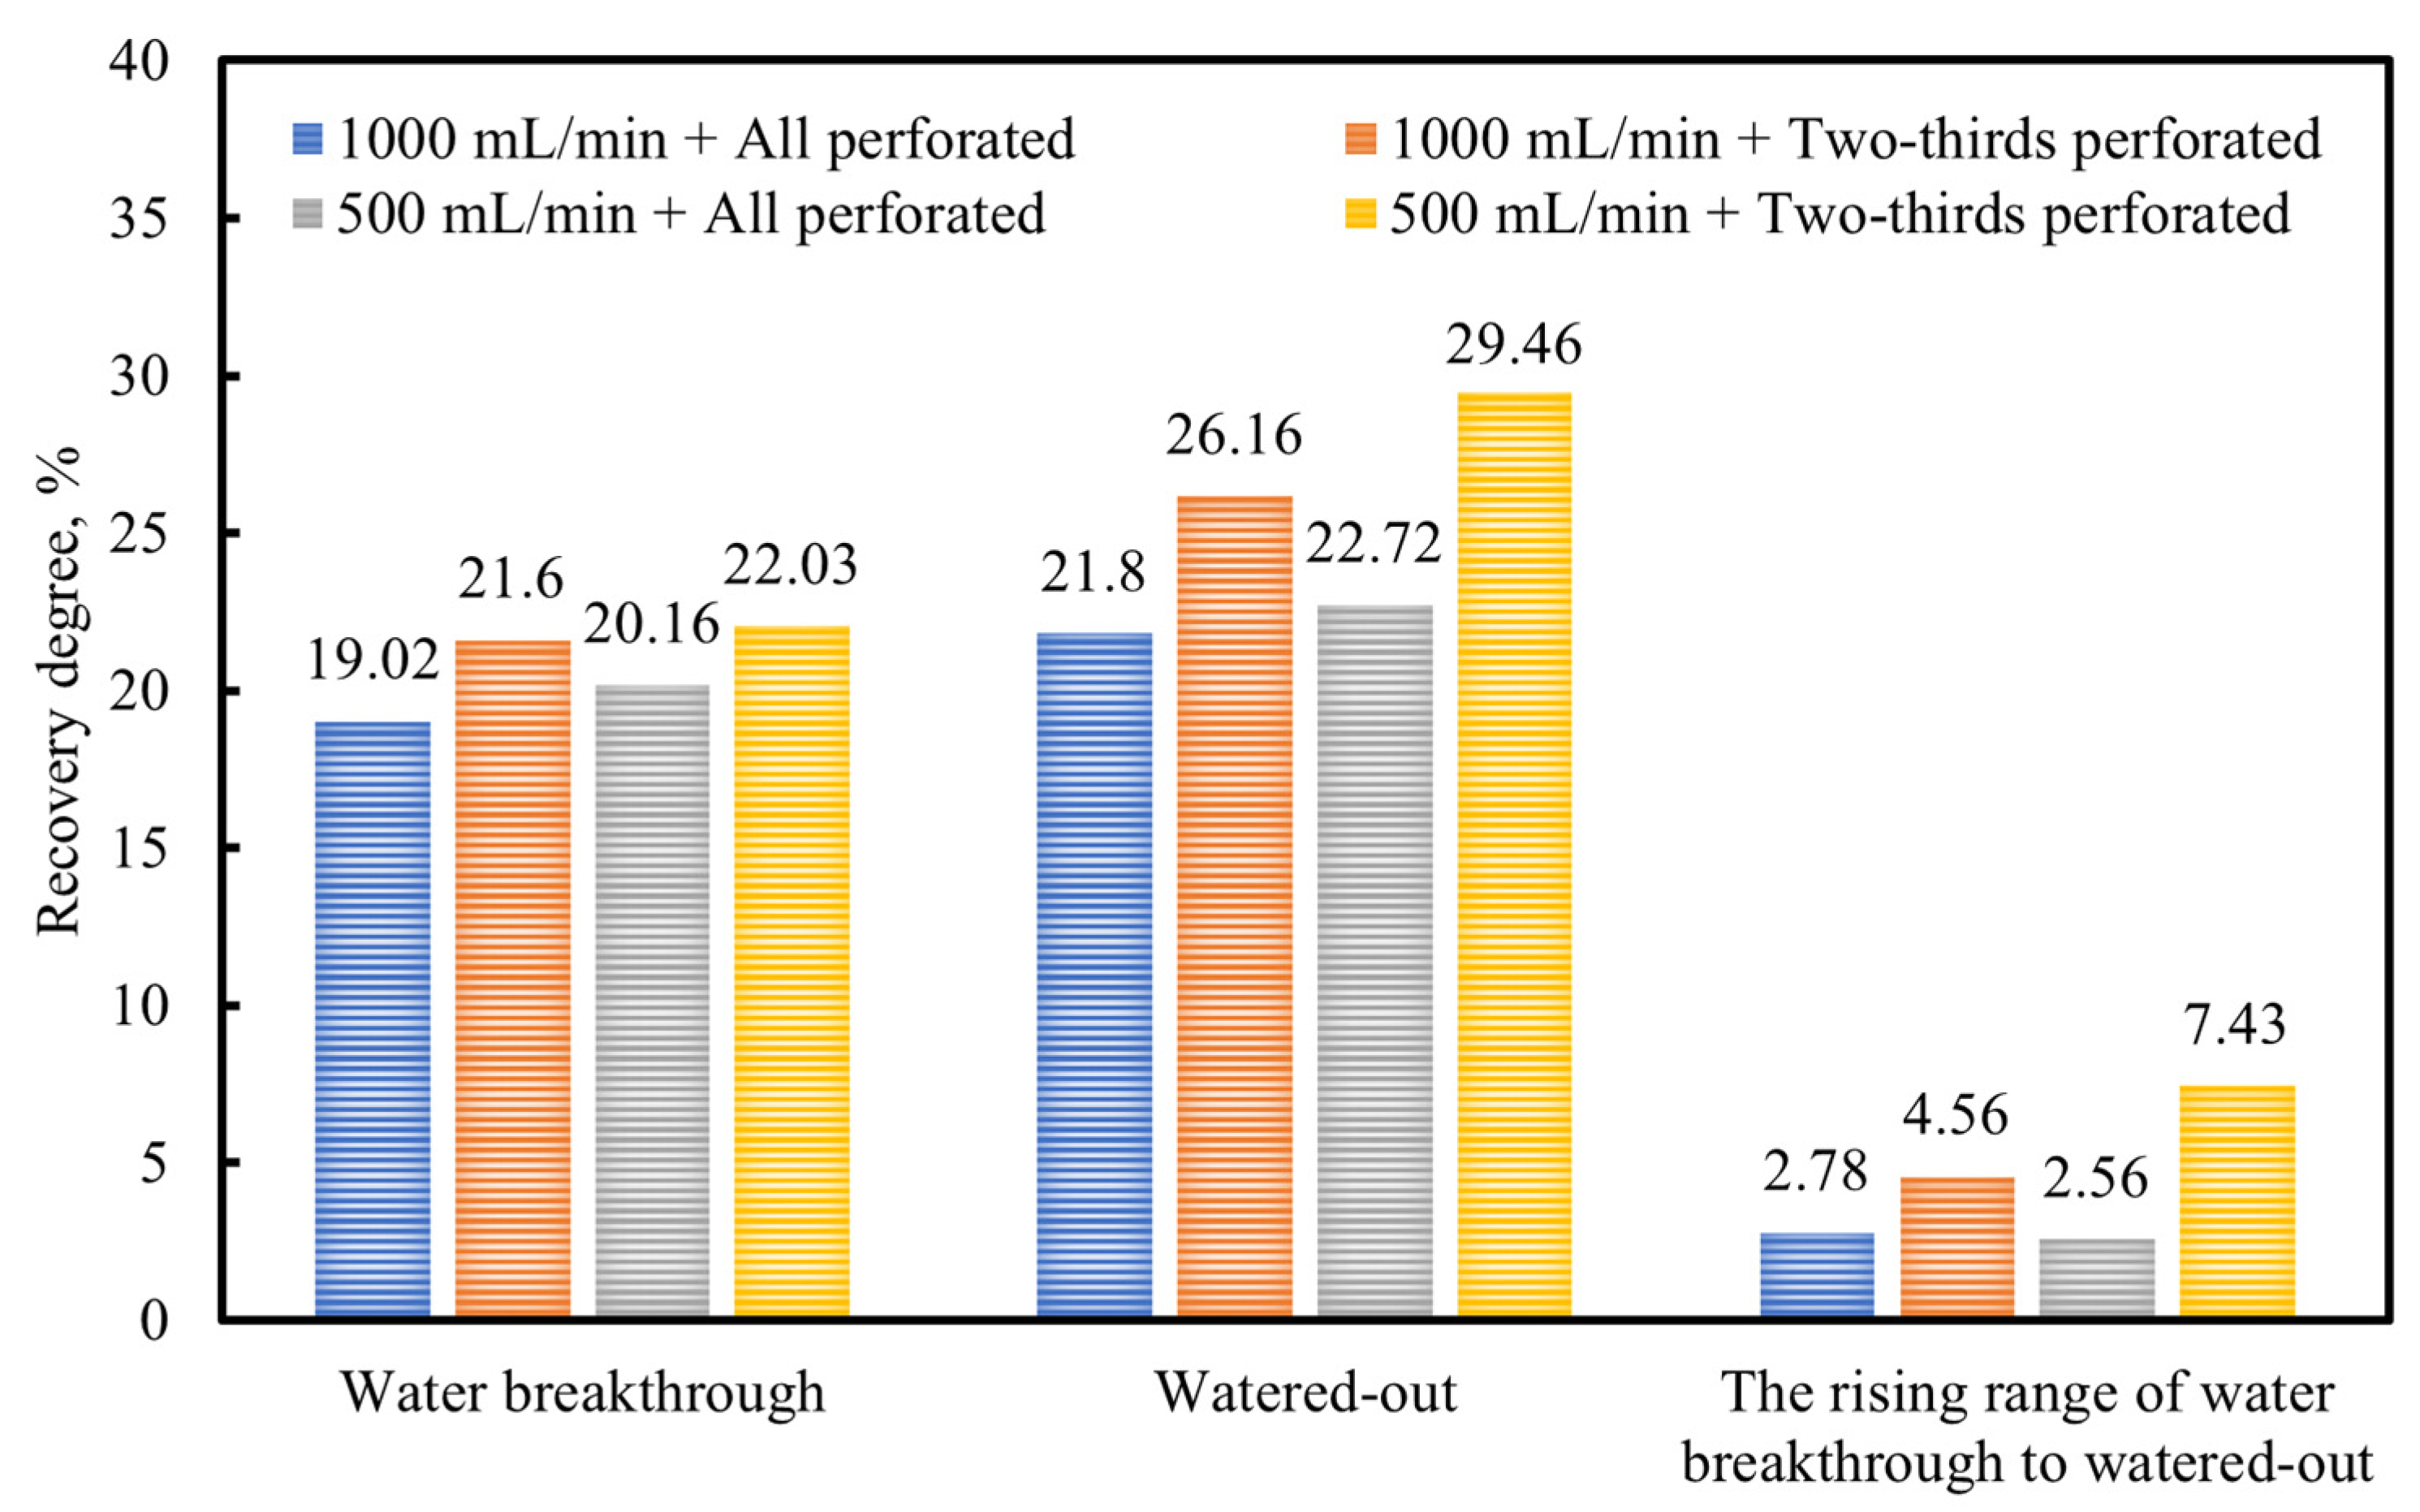
It can be seen from Figure 13 that selecting a gas production rate of 1000 mL/min when the layer is all perforated is not conducive to gas recovery in the profile model, and the recovery degree of water breakthrough and watering-out is relatively low. This is because the sandstone has hydrophilic properties. After the edge water invades, the reservoir rock adsorbs water and shrinks the gas seepage channel. A gas production rate of 1000 mL/min and a perforated layer will accelerate the migration speed of the gas–water interface so that edge water can quickly invade the production end, which is more likely to cause water seal and water lock. In addition, the premature invasion of edge water will increase water saturation in the gas reservoir, thus reducing the relative permeability of natural gas. The water and gas also gradually change from single-phase to two-phase flow, increasing gas phase seepage resistance and reducing the gas reservoir’s stable production capacity and recovery rate. Therefore, when the layer is all perforated, and the gas production rate is set to 1000 mL/min, the recovery degree of the gas reservoir is only 19.02% when water breakthrough occurs. In addition, with a gas production rate of 1000 mL/min and the layer perforated, the water production rate rises faster after the water breakthrough, and the gas reservoir will quickly reach the state of being watered-out. Under the premise that the gas production rate is 500 mL/min, the recovery rate of the model with the layer all perforated from water breakthrough to watering-out is only 2.56%. In contrast, the recovery degree of the model with the layer perforated two-thirds can be increased to 7.43%, a difference of a factor of 2.9. Therefore, for the F layer of an X gas reservoir, the recommended layer is only perforated to the upper two-thirds part.
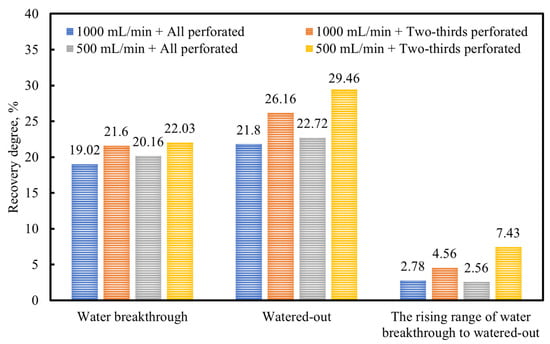
Figure 13.
Variation in the degree of gas recovery. (Shown is the degree of recovery in four groups of experiments in water breakthrough and watered-out schemes, and the increase in the degree of recovery from water breakthrough to watered-out schemes is measured).
3.5. Law of the Gas–Water Interface Migration
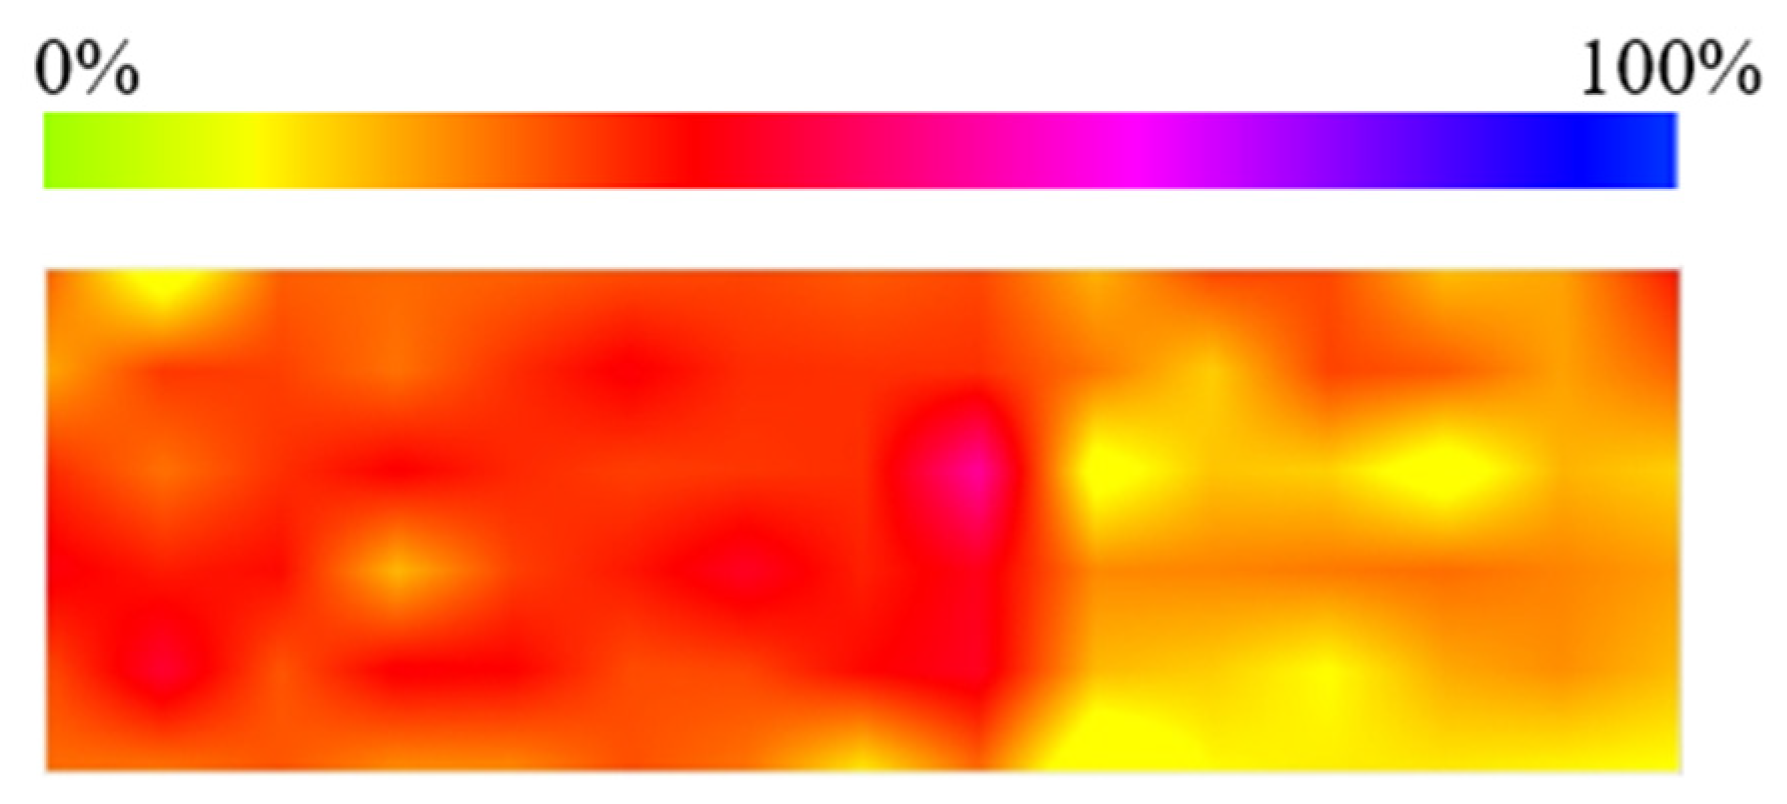
The saturation test probe was used to scan the profile model regularly during the experiment. The real-time saturation distribution of the gas–water two-phase flow of the profile model was obtained, as shown in Figure 14, and the invasion direction of the edge water was from left to right. As the existing saturation-testing principle on the large-scale physical model is mostly direct current logging, the probe or electrode must be in direct contact with the rock slab to perform signal acquisition, which results in reducing the degree of sealing of the rock slab, and point-to-point will bring about a large number of signal leads, which have to be led out from the external model under high-temperature and high-pressure conditions, which greatly increases the risk of leakage [42]. Compared to other scholars’ research on water invasion, we can visually observe the real-time distribution of gas–water saturation and the movement of the gas–water interface under high pressure (37 MPa) using a resistivity scanning device. This is a significant advantage of this study, as it does not affect the internal fluid seepage of the model and can monitor the fluid seepage state under formation pressure, providing insights for future researchers studying water intrusion and gas–water migration patterns.
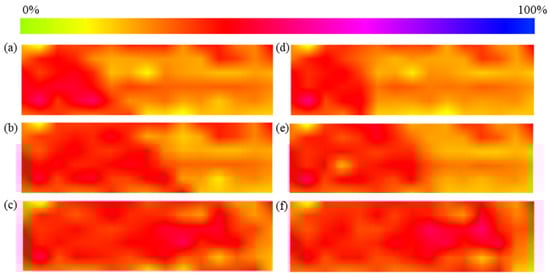
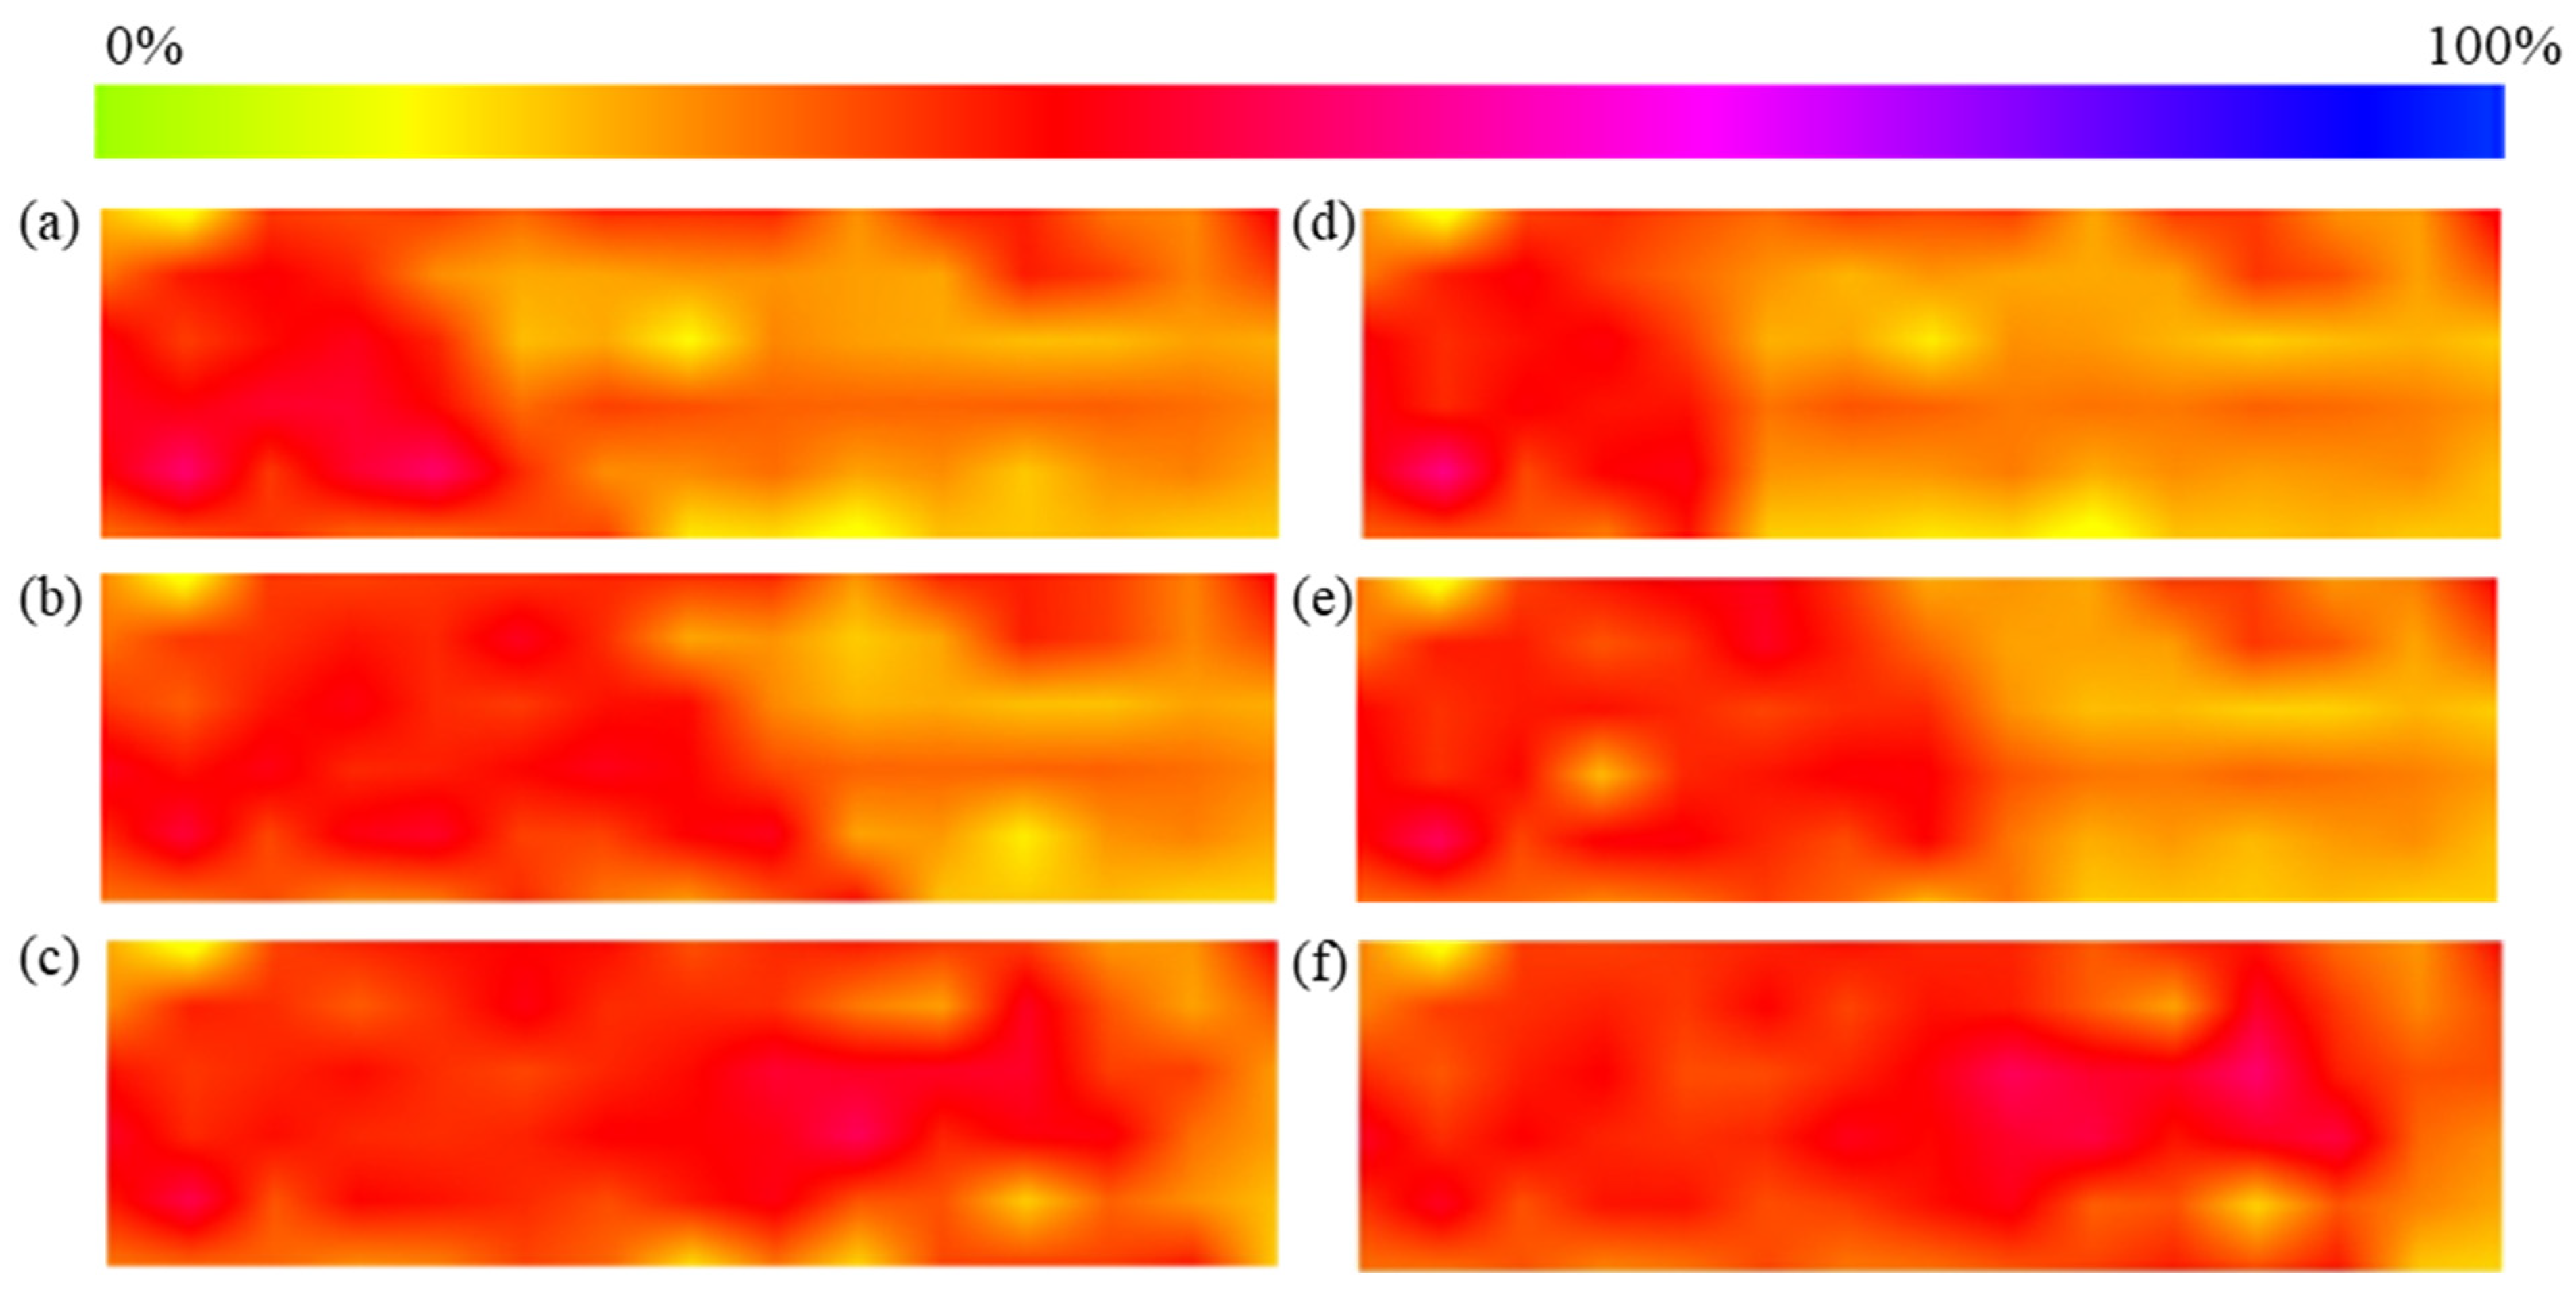
Figure 14.
Variation in the model water saturation when the gas production rate is 1000 mL/min. (Water saturation distributions of the profile model in (a) 25 min, (b) 41 min, and (c) 57 min when the gas layer is all perforated and in (d) 25 min, (e) 41 min, and (f) 57 min when the gas layer is perforated by two-thirds).
Because of the differences in pores and permeability at various scales in the F layer of the X gas reservoir, the invasion path of water in the reservoir will undergo multiple turns and diversions. This will lead to the instability of the water intrusion speed and path, resulting in nonuniform propulsion of the gas–water interface. When the gas layer is all perforated, and the edge water flows through the high-permeability zone (200 mD) at the bottom of the model, the seepage resistance is low and the flow velocity is high. When the water flows through the low-permeability area in the upper part of the gas layer, the seepage resistance is high and the flow velocity is low. This inconsistency in the rate of edge-water intrusion will lead to the gas–water boundary tilting to the left, as shown in Figure 14a–c, which will advance the water breakthrough time of the gas well and is not conducive to the normal production of natural gas. Only perforating the upper two-thirds of the gas layer can effectively prevent edge water influx from the bottom of the high-permeability zone, and the gas–water interface is close to the parallel advance, as shown in Figure 14d–f. Therefore, during the actual development of the X gas reservoir, it is important to reasonably control the gas extraction rate and select the perforation location at two-thirds of the gas layer, avoiding perforating the high-permeability zone at the bottom to prevent premature breakthrough of edge water, which could affect production.
3.6. Optimization of Development Strategy
To effectively develop the X gas reservoir and mitigate the adverse effects brought by significant water influx, we will optimize the development strategy for the X gas reservoir. First, we will establish a real-time monitoring system to continuously track changes in key parameters such as the water–gas ratio, water production rate, and formation pressure of the gas wells. This will ensure that we can capture early signals of formation water intrusion in a timely manner, allowing us to quickly implement countermeasures to reduce the risk of the gas well entering a watered-out stage. Second, when determining the production rate of the gas wells, it is necessary to comprehensively consider the difficulty of water discharge and the overall production efficiency of the gas wells. We will adjust the production speed in a timely manner based on dynamic monitoring data, delaying breakthrough time and water production time, thus ensuring the normal production of the gas reservoir. Third, we will also consider adopting a layered development approach, prioritizing perforation of the upper part of the gas layer and avoiding perforation at the bottom of high-permeability zones to slow down the rate of edge-water intrusion, thereby extending the effective production period of the gas wells. Specifically, consideration should be given to limiting the perforation depth to the upper one-half or two-thirds of the gas layer to reduce rapid water intrusion. By monitoring the migration of the gas–water interface and reasonably adjusting the production strategy of the gas wells, we can maintain relative stability of the gas–water interface and prevent production instability caused by uneven advancement of the interface.
Finally, we will flexibly adjust our development strategy according to the development stage of the gas reservoir. In the early stages of water intrusion, we will appropriately increase the production rate of the gas wells to leverage water intrusion for powering the gas reservoir. However, as water intrusion intensifies, we should lower the production rate to mitigate the impact of water on the gas wells.
4. Conclusions
A water invasion seepage experiment for an edge-water gas reservoir was successfully conducted using our laboratory’s developed high-temperature and high-pressure profile model [42]. The experiment yielded the following conclusions:
- (1)
- The edge-water gas reservoir with strong vertical heterogeneity has the characteristics of a short water-free gas production period and high watered-out speed. Under the same gas layer perforation degree, a higher gas production rate will produce a greater production pressure difference, thus accelerating the advance speed of the edge-water leading edge, making the edge water invade the production well faster, shortening the nonaquatic gas period of the gas well, and reducing the gas recovery rate.
- (2)
- In heterogeneous reservoirs, the high-permeability zone controls the invasion path of edge water, which is the main reason for the uneven invasion of edge water. The edge water flowing rapidly along the high-permeability zone will increase the seepage resistance of natural gas in the formation, which is not conducive to the exploitation of natural gas.
- (3)
- For the positive-rhythm profile of the F layer in an X gas reservoir, the edge water will flow rapidly along the high-permeability zone at the bottom of the model, and the full perforation of the F layer will accelerate the advance speed of the edge-water leading edge. Perforating the upper two-thirds can inhibit edge-water breakthrough and prolong the water-free gas recovery period of the gas well; the gas–water interface advances nearly uniformly, and the recovery degree is higher when the water breaks through.
- (4)
- Therefore, during the development of the X gas reservoir, it is advisable to avoid perforating the high-permeability zone at the bottom and to reasonably control the gas production rate in order to achieve prolonged water-free gas extraction and maintain uniform advancement of the gas–water interface, thereby obtaining a higher recovery rate. In addition, further research should be conducted on the influence of the plane heterogeneity of the X gas reservoir on gas–water seepage to realize more efficient gas reservoir development.
Author Contributions
Conceptualization, P.G. and J.Z.; methodology, P.G. and J.Z.; software, P.G., C.D. and Z.W.; validation, P.G., J.Z. and C.D.; formal analysis, P.G. and J.Z.; investigation, P.G., J.Z., C.D. and Z.W.; resources, P.G. and H.L.; data curation, P.G., J.Z. and Z.W.; writing—original draft preparation, P.G. and J.Z.; writing—review and editing, P.G., J.Z. and H.F.; visualization, P.G.; supervision, P.G.; project administration, P.G. and H.L.; funding acquisition, P.G. All authors have read and agreed to the published version of the manuscript.
Funding
This research received no external funding.
Data Availability Statement
The original contributions presented in the study are included in the article, further inquiries can be directed to the corresponding author.
Conflicts of Interest
The authors declare no conflict of interest. Author Hengjie Liao was employed by the China National Offshore Oil Corporation Limited Shanghai Branch.
References
- Qi, Z.; Li, J.; Hu, S.; Liang, B.; Yuan, Y.; Jiang, N. Mathematical Model for Prediction of Dynamic Reserves Loss Due to Water Invasion in Water-Drive Gas Reservoir. J. Porous Media 2019, 22, 1507–1518. [Google Scholar] [CrossRef]
- Li, X.; Guo, Z.; Wan, Y.; Liu, X.; Zhang, M.; Xie, W.; Su, Y.; Hu, Y.; Feng, J.; Yang, B.; et al. Geological characteristics and development strategies for Cambrian Longwangmiao Formation gas reservoir in Anyue gas field, Sichuan Basin, SW China. Pet. Explor. Dev. 2017, 44, 428–436. [Google Scholar] [CrossRef]
- Jia, A.; Yan, H.; Guo, J.; He, D.; Wei, T. Characteristics and experiences of the development of various giant gas fields all over the world. Nat. Gas Ind. 2014, 34, 33–46. [Google Scholar] [CrossRef]
- Feng, X.; Peng, X.; Li, L.; Yang, X.; Wang, J.; Li, Q.; Zhang, C.; Deng, H. Influence of reservoir heterogeneity on water invasion differentiation in carbonate gas reservoirs. Nat. Gas Ind. B 2019, 6, 7–15. [Google Scholar] [CrossRef]
- Yan, W.; Qi, Z.; Yuan, Y.; Huang, X.; Li, J. Influencing factor analysis of water invasion in condensate gas reservoir with bottom water based on fuzzy comprehensive evaluation and orthogonal experiment. Geosystem Eng. 2019, 22, 299–309. [Google Scholar] [CrossRef]
- Fang, F.; Shen, W.; Gao, S.; Liu, H.; Wang, Q.; Li, Y. Experimental Study on the Physical Simulation of Water Invasion in Carbonate Gas Reservoirs. Appl. Sci. 2017, 7, 697. [Google Scholar] [CrossRef]
- Liu, F.; Yang, F.; Zhang, Y.; Liu, X.; Sun, B. A New Prediction Model of Water Breakthrough Time of Horizontal Well in Inclined Edge-Water Low Permeability Gas Reservoir. Chem. Technol. Fuels Oils. 2021, 56, 941–949. [Google Scholar] [CrossRef]
- Geng, S.; Li, C.; Zhai, S.; Gong, Y.; Jing, M. Modeling the Mechanism of Water Flux in Fractured Gas Reservoirs with Edge Water Aquifers Using an Embedded Discrete Fracture Model. J. Energy Resour. Technol. 2023, 145, 033002. [Google Scholar] [CrossRef]
- Hekmatzadeh, M.; Dadvar, M.; Emadi, M. Pore Network Modeling for Prediction of Residual Gas Saturation in Water Invasion Process. J. Porous Media 2014, 17, 503–520. [Google Scholar] [CrossRef]
- Shi, L.; Gao, S.-S.; Xiong, W. Physical simulation of the mechanism for operation of water-encroached (flooded) underground gas storage facilities. Chem. Technol. Fuels Oils 2012, 47, 426–433. [Google Scholar] [CrossRef]
- Xu, X.; Li, J.; Xu, Y.; Liu, J.; Hu, Y.; Jiao, C.; Guo, C. Water imbibition and water sealing in water-driven gas reservoirs development. Energy Explor. Exploit. 2023, 41, 136–153. [Google Scholar] [CrossRef]
- Tian, J.; Kang, Y.; You, L.; Jia, N.; Xi, Z.; Luo, P. Investigation on water phase trapping mechanisms in tight gas reservoirs: Pore-scale visualization observation and core-scale flooding analysis. J. Pet. Sci. Eng. 2021, 198, 108185. [Google Scholar] [CrossRef]
- Wu, W.; Zhao, J.; Wei, X.; Wang, Y.; Zhang, J.; Wu, H.; Li, J. Evaluation of gas-rich “sweet-spot” and controlling factors of gas–water distribution in tight sandstone gas provinces: An example from the Permian He8 Member in Sulige Gas Province, central Ordos Basin, Northern China. J. Asian Earth Sci. 2022, 227, 105098. [Google Scholar] [CrossRef]
- Li, G.; Tian, J.; Duan, X.; Yang, H.; Tang, Y.; Bi, H.; Zhang, C.; Xian, C.; Liu, H. Research and Practice on Enhancing Recovery of Tight Sandstone Gas Reservoirs in Kelasu Gas Field, Tarim Basin. In Proceedings of the SPE/AAPG/SEG Asia Pacific Unconventional Resources Technology Conference, Online, 16–18 November 2021. [Google Scholar]
- Feifei, F.; Shusheng, G.; Huaxun, L. Simulation Experimental Study on Water Invasion Rules of Gas Reservoir with Multiwell Development. In Proceedings of the 2nd International Symposium on Computer Science and Intelligent Control, Stockholm, Sweden, 21–23 September 2018; pp. 1–6. [Google Scholar]
- Wu, K.; Zhu, Q.; Chen, Z.; Li, J.; Feng, D.; Wang, M.; Guo, S.; Guo, Y. Microscopic gas displacement efficiency of enhanced gas recovery in carbonate gas reservoirs with edge and bottom water. Nat. Gas Ind. B 2023, 10, 372–382. [Google Scholar] [CrossRef]
- Fang, F.; Shen, W.; Li, X.; Gao, S.; Liu, H.; Li, J. Experimental study on water invasion mechanism of fractured carbonate gas reservoirs in Longwangmiao Formation, Moxi block, Sichuan Basin. Environ. Earth Sci. 2019, 78, 316. [Google Scholar] [CrossRef]
- Huang, X.; Guo, X.; Zhou, X.; Shen, C.; Lu, X.; Qi, Z.; Xiao, Q.; Yan, W. Effects of water invasion law on gas wells in high temperature and high pressure gas reservoir with a large accumulation of water-soluble gas. J. Nat. Gas Sci. Eng. 2019, 62, 68–78. [Google Scholar] [CrossRef]
- Huang, W.; Zhan, Z.; Niu, N.; Xiao, Y.; Shi, Y. Reasonable production allocation model of gas wells for deep tight gas reservoirs with the edge water. Front. Earth Sci. 2023, 11, 1139663. [Google Scholar] [CrossRef]
- Song, H.; Cao, Y.; Yu, M.; Wang, Y.; Killough, J.E.; Leung, J. Impact of permeability heterogeneity on production characteristics in water-bearing tight gas reservoirs with threshold pressure gradient. J. Nat. Gas Sci. Eng. 2015, 22, 172–181. [Google Scholar] [CrossRef]
- Wu, G.Y.; Li, J. Rational Production Proration of Gas Wells in Unconsolidated Sandstone Gas Reservoir. Appl. Mech. Mater. 2011, 121, 1249–1253. [Google Scholar] [CrossRef]
- Hu, Y.; Li, X.; Shen, W.; Guo, C.; Jiao, C.; Xu, X.; Jia, Y. Study on the Water Invasion and Its Effect on the Production from Multilayer Unconsolidated Sandstone Gas Reservoirs. Geofluids 2021, 2021, 5135159. [Google Scholar] [CrossRef]
- Wang, R.; Zhang, C.; Chen, D.; Yang, F.; Li, H.; Li, M. Microscopic Seepage Mechanism of Gas and Water in Ultra-Deep Fractured Sandstone Gas Reservoirs of Low Porosity: A Case Study of Keshen Gas Field in Kuqa Depression of Tarim Basin, China. Front. Earth Sci. 2022, 10, 893701. [Google Scholar] [CrossRef]
- Zhang, H.; Wang, L.; Wang, X.; Zhou, W.; Zeng, X.; Liu, C.; Zhao, N.; Wang, L.; Wang, X.; Wang, W. Productivity analysis method for gas-water wells in abnormal overpressure gas reservoirs. Pet. Explor. Dev. 2017, 44, 280–285. [Google Scholar] [CrossRef]
- Meng, S.; Li, Y.; Wang, L.; Wang, K.; Pan, Z. A mathematical model for gas and water production from overlapping fractured coalbed methane and tight gas reservoirs. J. Pet. Sci. Eng. 2018, 171, 959–973. [Google Scholar] [CrossRef]
- Xu, J.; Hu, J.; Luo, M.; Wang, S.; Qi, B.; Qiao, Z. Optimisation of perforation distribution in HTHP vertical wells. Can. J. Chem. Eng. 2013, 91, 332–343. [Google Scholar] [CrossRef]
- Jin, G.; Su, Z.; Zhai, H.; Feng, C.; Liu, J.; Peng, Y.; Liu, L. Enhancement of gas production from hydrate reservoir using a novel deployment of multilateral horizontal well. Energy 2023, 270, 126867. [Google Scholar] [CrossRef]
- Zhan, H.; Fang, F.; Li, X.; Hu, Z.; Zhang, J. Shale Reservoir Heterogeneity: A Case Study of Organic-Rich Longmaxi Shale in Southern Sichuan, China. Energies 2022, 15, 913. [Google Scholar] [CrossRef]
- Safari, A.; Dowlatabad, M.M.; Hassani, A.; Rashidi, F. Numerical simulation and X-ray imaging validation of wormhole propagation during acid core-flood experiments in a carbonate gas reservoir. J. Nat. Gas Sci. Eng. 2016, 30, 539–547. [Google Scholar] [CrossRef]
- Wang, L.; Yang, S.; Liu, Y.; Xu, W.; Deng, H.; Meng, Z.; Han, W.; Qian, K. Experiments on gas supply capability of commingled production in a fracture-cavity carbonate gas reservoir. Pet. Explor. Dev. 2017, 44, 824–833. [Google Scholar] [CrossRef]
- Wang, J.; Zhou, F.-J. Cause analysis and solutions of water blocking damage in cracked/non-cracked tight sandstone gas reservoirs. Pet. Sci. 2021, 18, 219–233. [Google Scholar] [CrossRef]
- Xu, X.; Li, X.; Hu, Y.; Mei, Q.; Shi, Y.; Jiao, C. Physical simulation for water invasion and water control optimization in water drive gas reservoirs. Sci. Rep. 2021, 11, 6301. [Google Scholar] [CrossRef]
- Chen, D.; Zhang, C.; Yang, M.; Li, H.; Wang, C.; Diwu, P.; Jiang, H.; Wang, Y. Research on Water Invasion Law and Control Measures for Ultradeep, Fractured, and Low-Porosity Sandstone Gas Reservoirs: A Case Study of Kelasu Gas Reservoirs in Tarim Basin. Processes 2024, 12, 310. [Google Scholar] [CrossRef]
- Fan, Z.; Cheng, L.; Song, H.; Wu, X.; Zhang, A. Fluid interface moving for the concurrent production of gas cap and oil ring of gas cap reservoirs. Pet. Explor. Dev. 2015, 42, 683–690. [Google Scholar] [CrossRef]
- Fernø, M.A.; Haugen, Å.; Wickramathilaka, S.; Howard, J.; Graue, A.; Mason, G.; Morrow, N.R. Magnetic resonance imaging of the development of fronts during spontaneous imbibition. J. Pet. Sci. Eng. 2013, 101, 1–11. [Google Scholar] [CrossRef]
- Zhou, M.; Li, X.; Hu, Y.; Xu, X.; Jiang, L.; Li, Y. Physical Simulation Experimental Technology and Mechanism of Water Invasion in Fractured-Porous Gas Reservoir: A Review. Energies 2021, 14, 3918. [Google Scholar] [CrossRef]
- Sun, K.; Liu, H.; Leung, J.Y.; Yang, M.; Wang, J.; Li, X.; Kang, Z.; Zhang, Y. Investigation on water-drive performance of a fault-karst carbonate reservoir under different well patterns and injection-production modes based on 2D visualized physical models. J. Pet. Sci. Eng. 2022, 218, 110925. [Google Scholar] [CrossRef]
- Wang, Z.; Li, Z.; Sarma, H.K.; Xu, Y.; Wu, P.; Yang, J.; Wang, H.; Lu, T. A visualization experimental study on gas penetration through interlayer to improve SAGD performance. J. Pet. Sci. Eng. 2019, 177, 959–970. [Google Scholar] [CrossRef]
- Rahnema, H.; Barrufet, M.A.; Mamora, D.D. Experimental analysis of Combustion Assisted Gravity Drainage. J. Pet. Sci. Eng. 2013, 103, 85–96. [Google Scholar] [CrossRef]
- Feng, X.; Yang, X.; Deng, H.; Chen, L.; Zhu, Z. Identification of the water invasion law in high-sulfur and edge-water gas reservoirs based on the characteristics of pressure variation in the water zone. Nat. Gas Ind. 2013, 33, 75–78. [Google Scholar] [CrossRef]
- Mahmoud, T.; Rao, D.N. Range of operability of gas-assisted gravity drainage process. In Proceedings of the SPE Symposium on Improved Oil Recovery, Tulsa, OK, USA, 20–23 April 2008. Paper No. SPE-113474-MS. [Google Scholar]
- Guo, P.; Zhouhua, W.; Chen, Y.; Sun, B.; Dong, C.; Yisheng, H.; Wang, S. Device and Method for Testing the Three-Phase Saturation of Oil, Gas and Water in High-Temperature and High-Pressure Planar Model. U.S. Patent 11668191, 6 June 2023. [Google Scholar]
- Liu, Y.; Wang, S.; Zhao, W.; Yan, H.; Guo, P.; Zhang, J.; Bai, Z.; Wang, Z.; Ou, L. Multi-dimensional Experimental Study of Hydrocarbon Gas-Assisted Gravity Drainage. Arab J. Sci. Eng. 2023, 48, 17031–17048. [Google Scholar] [CrossRef]
- Zhang, C.; Giberti, F.; Sevgen, E.; de Pablo, J.J.; Gygi, F.; Galli, G. Dissociation of salts in water under pressure. Nat. Commun. 2020, 11, 3037. [Google Scholar] [CrossRef]
- Han, K.; Guo, X.; Wang, X.; Zhang, J.; Ozaydin, S.; Li, D.; Clark, S.M. The electrical conductivity of granite: The role of hydrous accessory minerals and the structure water in major minerals. Tectonophysics 2023, 856, 229857. [Google Scholar] [CrossRef]
- Archie, G.E. The Electrical Resistivity Log as an Aid in Determining Some Reservoir Characteristics. Trans. AIME 1942, 146, 54–62. [Google Scholar] [CrossRef]
- Olsen, P.A. Coarse-scale resistivity for saturation estimation in heterogeneous reservoirs based on Archie’s formula. Geophysics 2011, 76, E35–E43. [Google Scholar] [CrossRef]
- Ji, G.; Jia, A.; Meng, D.; Guo, Z.; Wang, G.; Cheng, L.; Zhao, X. Technical strategies for effective development and gas recovery enhancement of a large tight gas field: A case study of Sulige gas field, Ordos Basin, NW China. Pet. Explor. Dev. 2019, 46, 629–641. [Google Scholar] [CrossRef]

Disclaimer/Publisher’s Note: The statements, opinions and data contained in all publications are solely those of the individual author(s) and contributor(s) and not of MDPI and/or the editor(s). MDPI and/or the editor(s) disclaim responsibility for any injury to people or property resulting from any ideas, methods, instructions or products referred to in the content. |
© 2024 by the authors. Licensee MDPI, Basel, Switzerland. This article is an open access article distributed under the terms and conditions of the Creative Commons Attribution (CC BY) license (https://creativecommons.org/licenses/by/4.0/).