Abstract
In the era of dual carbon, the rapid development of various types of microgrid parks featuring multi-heterogeneous energy coupling presents new challenges in accurately modeling spatial and temporal load characteristics due to increasingly complex source–load characteristics and diversified interaction patterns. This study proposes a short-term load forecasting method for an interconnected park-level integrated energy system using a data center as the case study. By leveraging spatially transferable load characteristics and the heterogeneous energy correlation among electricity–cooling–heat loads, an optimal feature set is selected to effectively characterize the spatial and temporal coupling of multi-heterogeneous loads using Spearman correlation analysis. This optimal feature set is fed into the multi-task learning (MTL) combined with the convolutional neural network (CNN) and long- and short-term memory (LSTM) network model to generate prediction results. The simulation results demonstrate the efficacy of our proposed approach in characterizing the spatial and temporal energy coupling across different parks, enhancing track load “spikes” and achieving superior prediction accuracy.
1. Introduction
To promote the coordination and optimization of heterogeneous energy sources in micro-energy park areas [1], the flexibility of source–load–storage is increasing, along with the emergence of new load types with spatially and temporally transferable characteristics such as Internet data centers (IDCs) [2] [Appendix A]. This deepening coupling degree between park areas presents challenges for planning decision-making [3], demand response [4], and optimization scheduling [5]. Achieving refined control and efficient low-carbon operation of the park-level integrated energy systems requires accurate identification and prediction of the spatiotemporal characteristics of loads in strongly coupled multi-park interconnected integrated energy systems.
Comprehensive energy load forecasting approaches are primarily categorized into modeling heterogeneous loads independently and joint modeling of multiple heterogeneous loads [6,7,8,9]. The former employs strongly correlated parameters with each heterogeneous load type as feature variables, and independent models are implemented for predicting each load type [10,11]. This approach performs well for low-dimensional feature sets but faces challenges in parameter tuning and longer training times as dimensionality increases. The latter approach considers shared characteristics of heterogeneous loads, leveraging complex shared information on energy conversion. While valuable for short-term and ultra-short-term forecasting with high real-time requirements, this approach entails increased model complexity. Some studies not only explore temporal correlations of historical load sequences but also incorporate spatial correlations of loads for comprehensive forecasting in energy systems [10], distribution networks [12], and residential user clusters [13]. Spatial load correlations often stem from external factors such as shared meteorological conditions and time-of-use energy prices in the same vicinity. The energy consumption of IDCs is directly linked to data load volume [14,15], which can be transmitted through multiple IDCs across regions via deployed communication networks. IDC load is a novel type of spatially transferable load generated through active scheduling of data loads [16,17,18,19,20]. However, an in-depth analysis of spatial transfer characteristics for loads such as IDCs, reliant on communication networks for rapid control, is still lacking. Similarly, the coupling dynamics of energy usage among various parks in interconnected energy systems require further investigation.
Machine learning-based load forecasting models include Random Forest [21,22], Support Vector Regression (SVR) [23,24] [Appendix A], XGBoost [25,26], and Prophet [27,28]. These models are more complex in adjusting the structure and parameters and require specialized knowledge and experience. In addition, these methods are deficient in capturing the temporal relationship of power load data, which may lead to a temporal lag in the prediction results. In contrast, deep learning models such as long short-term memory (LSTM) [29,30] [Appendix A] and the convolutional neural network (CNN) [Appendix A] [31,32] can better capture the complex relationships between data and improve the prediction accuracy and robustness of the model. However, these deep learning models also have their drawbacks. For example, temporal convolutional network (TCN) [33,34] [Appendix A] models may require careful tuning of the expansion factor and convolutional filter and may have high memory usage due to large filter sizes. Recurrent neural network (RNN) [35,36] [Appendix A] models require more parameters to be set during training, improving the prediction accuracy and lengthening the training time. Improper initialization of the weights may lead to vanishing or exploding gradients, which affects the model stability. Gated Recurrent Unit (GRU) [37,38] [Appendix A] models are prone to losing sequence information. Existing studies lack in-depth spatial transfer characteristic analysis for data center loads, which rely on communication networks to achieve rapid regulation, and do not adequately explore the coupling characteristics of energy use among integrated energy systems in multiple interconnected parks. Therefore, the existing methods are insufficient to provide comprehensive and practical prediction information in the load forecasting of interconnected campus integrated energy systems with integrated data centers.
This study proposes a novel approach for load forecasting in interconnected energy systems with spatially transferable loads such as IDCs. Initially, optimal features representing spatially transferable loads are selected via correlation analysis. Then, a CNN is employed for feature fusion in the shared learning layer of multi-task learning [39], yielding high-dimensional comprehensive features. Subsequently, LSTM is utilized in the specific task layer of multi-task learning (MTL) [Appendix A] to explore the coupling correlation of these high-dimensional features across different time sequences. Finally, joint prediction of various parks’ electric, cooling, and heating loads is achieved through fully connected layers.
2. Analysis of Load Characteristics in Interconnected Park-Level Integrated Energy Systems
2.1. Temporal Characteristics Analysis
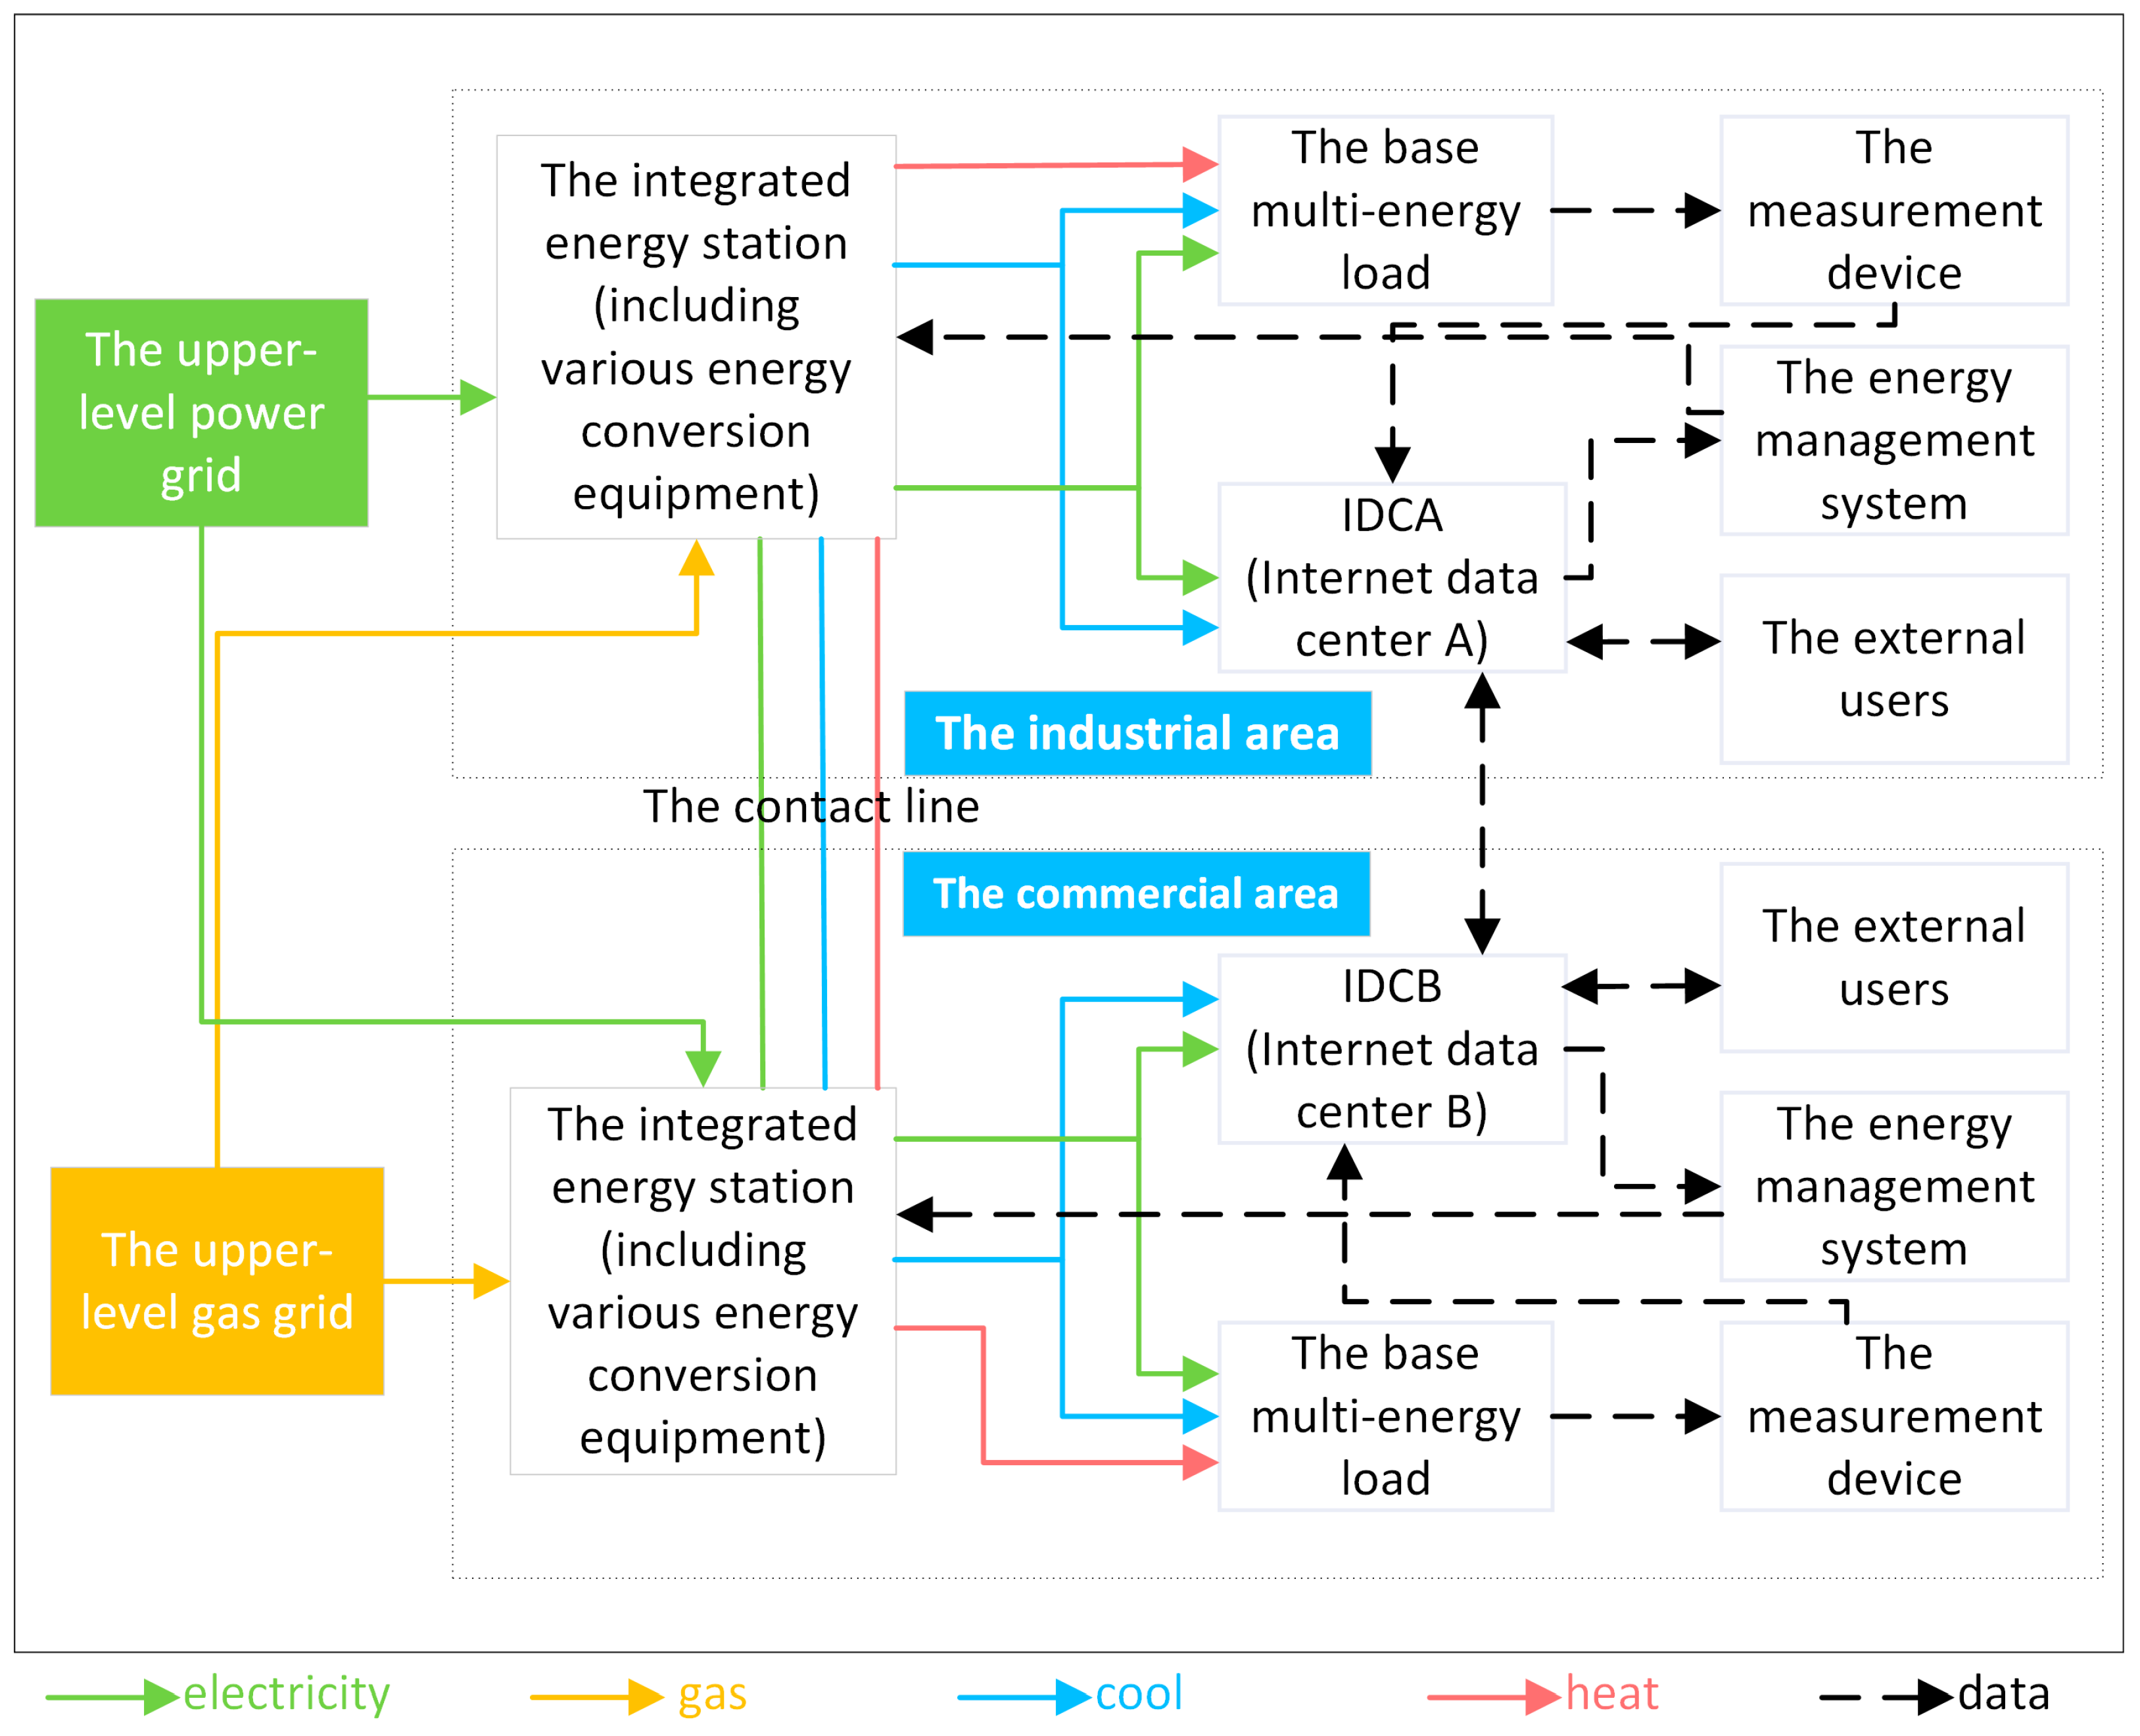
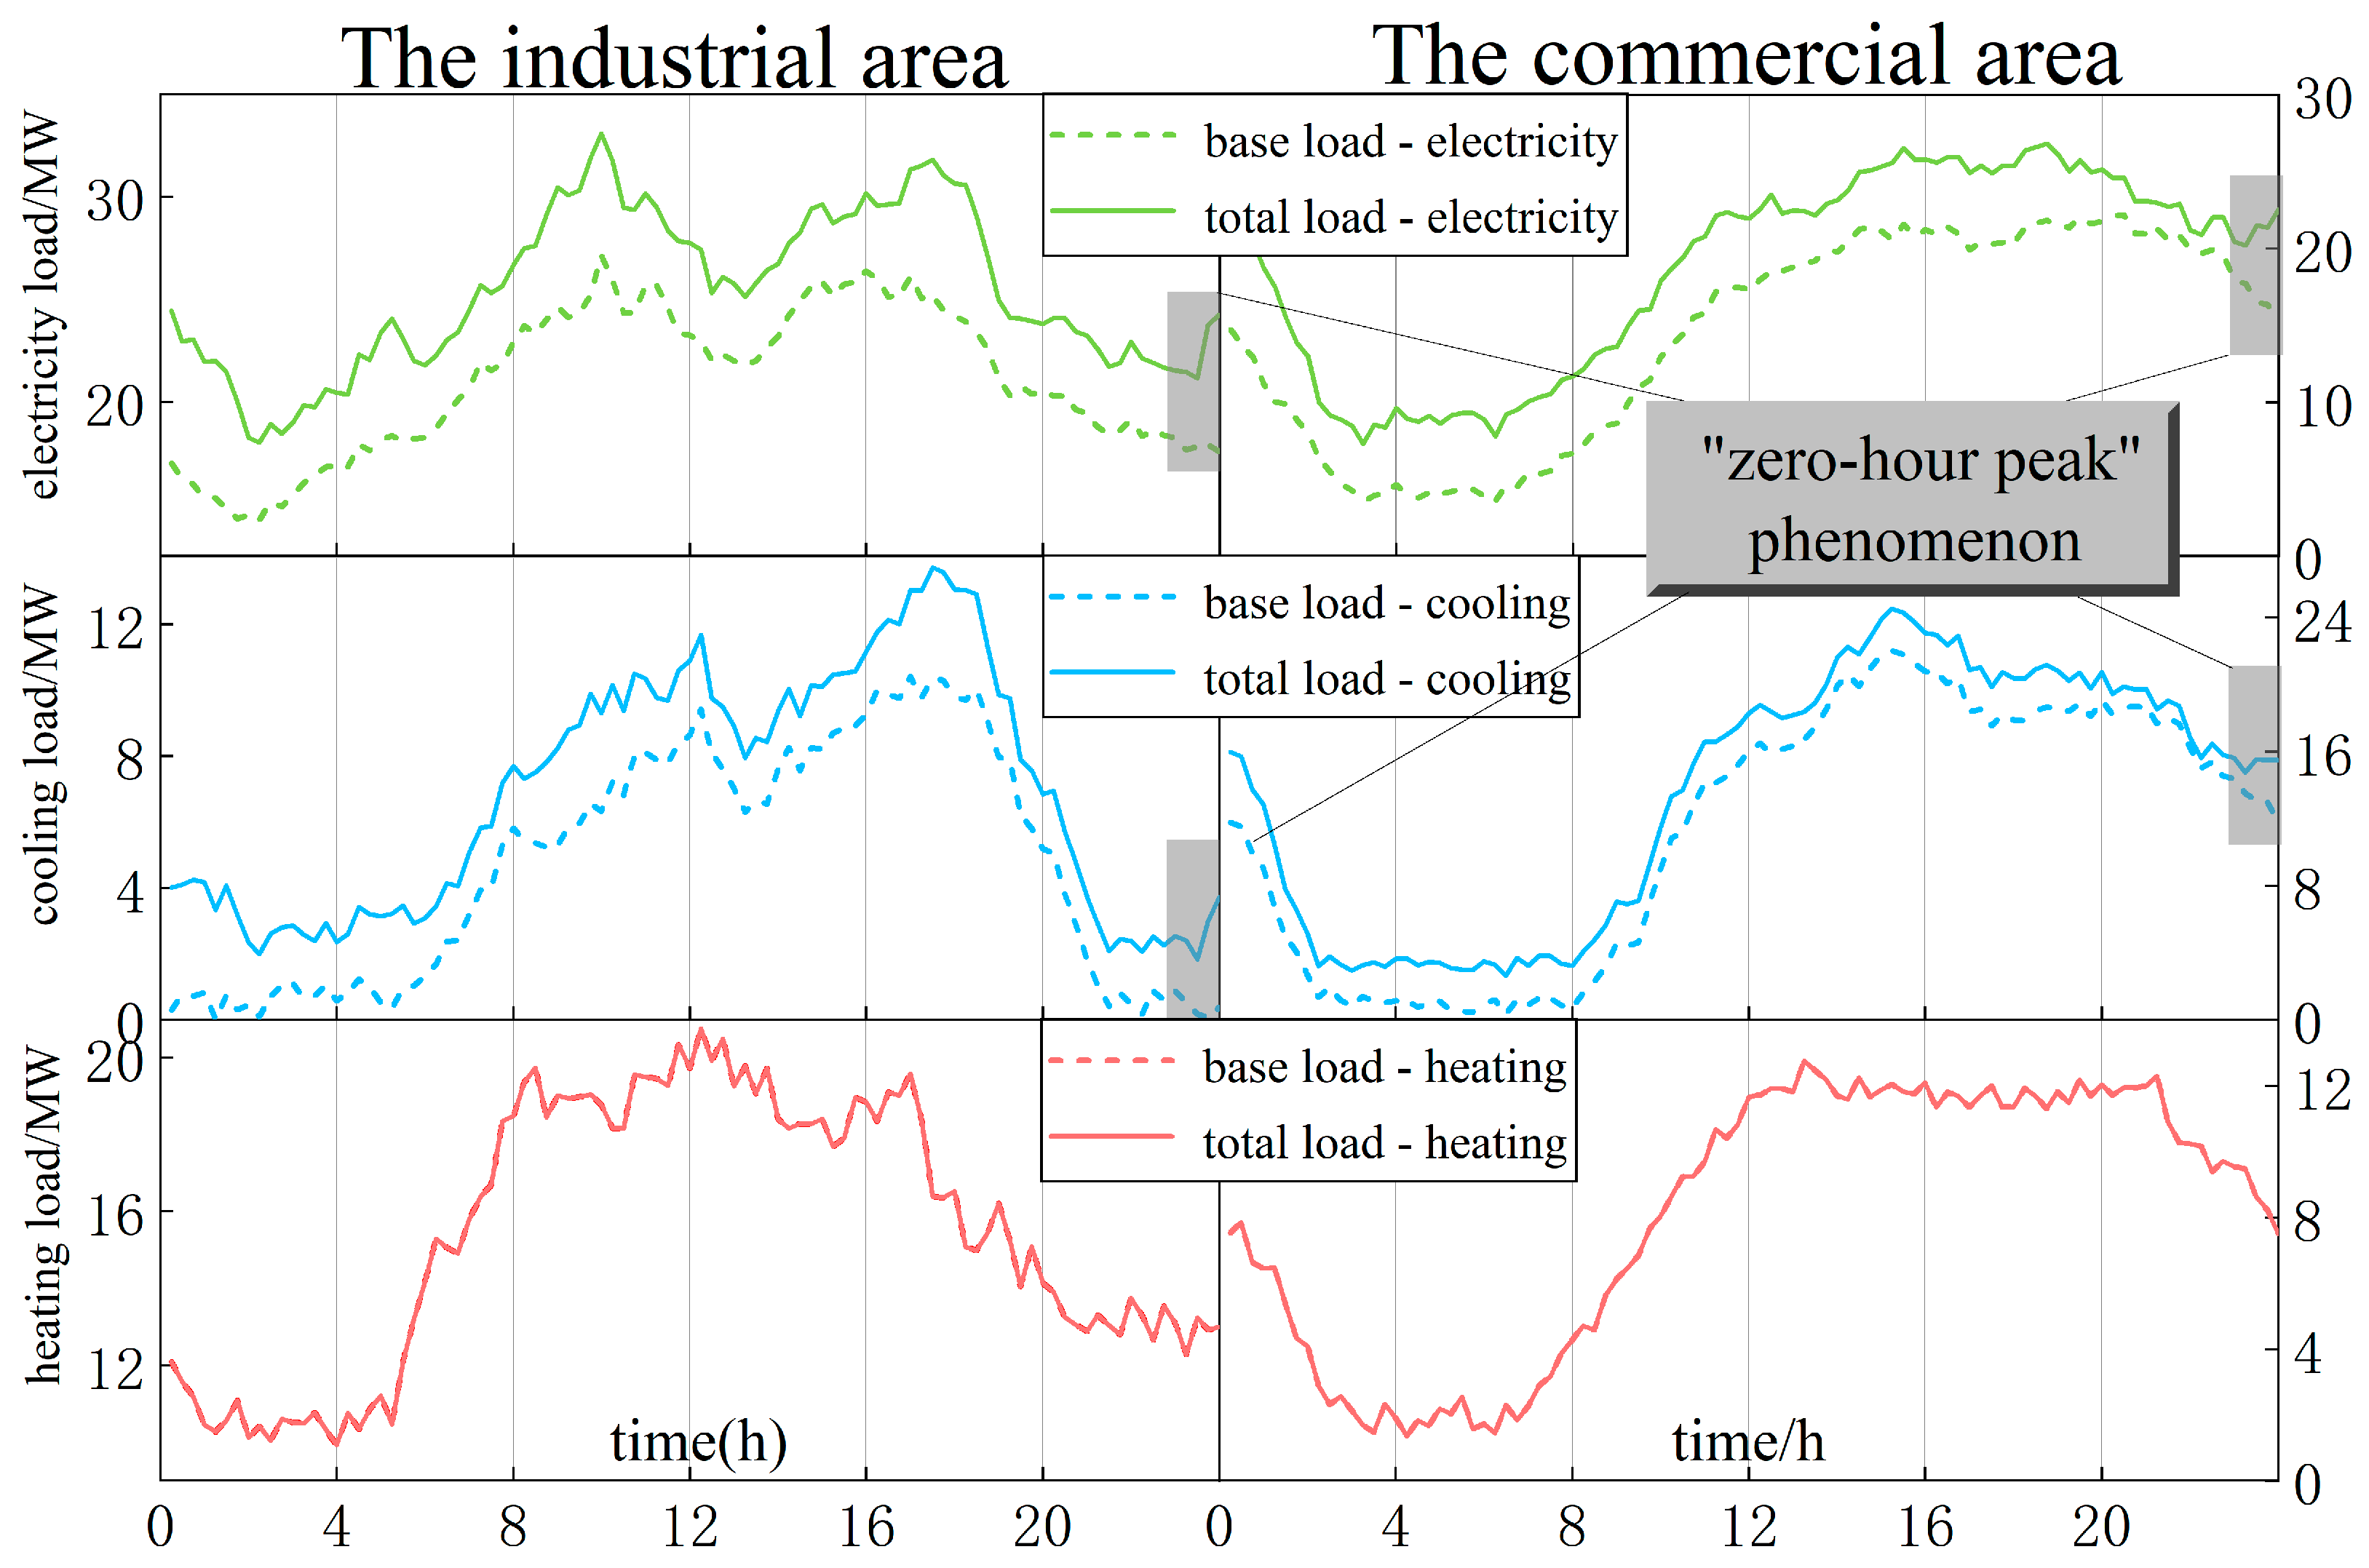
Common interconnected park-integrated energy systems encompass electricity, cooling, heating, and other energy loads. For instance, in the “Industrial + Commercial” interconnected park (Figure 1), IDCs establish spatial connections through Internet task distribution and via physical interconnections through connecting pipelines. In this scenario, industrial and commercial parks exhibit bimodal and unimodal load characteristics, respectively. IDCs generate significant electricity and cooling load demands during data load processing, which feature “zero-hour peaks” (in Figure 2) due to statistical analysis and backups of daily business data occurring around midnight, leading to short-term spikes in data load.
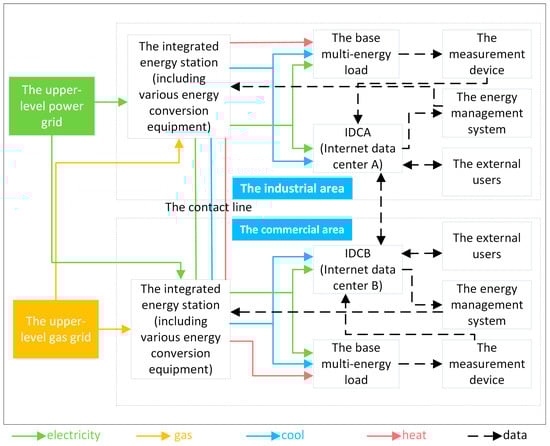
Figure 1.
“Industrial + commercial” interconnected park-level integrated energy system diagram.
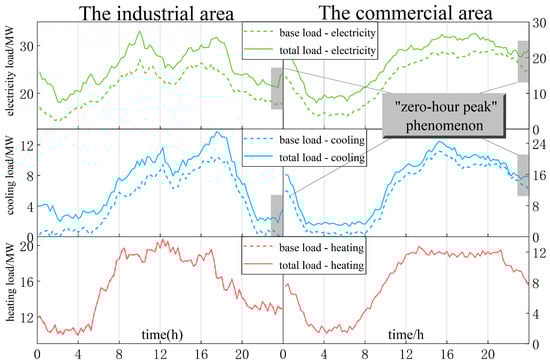
Figure 2.
Typical daily load characteristics in the industrial and commercial park.
2.2. Spatial Characteristics Analysis
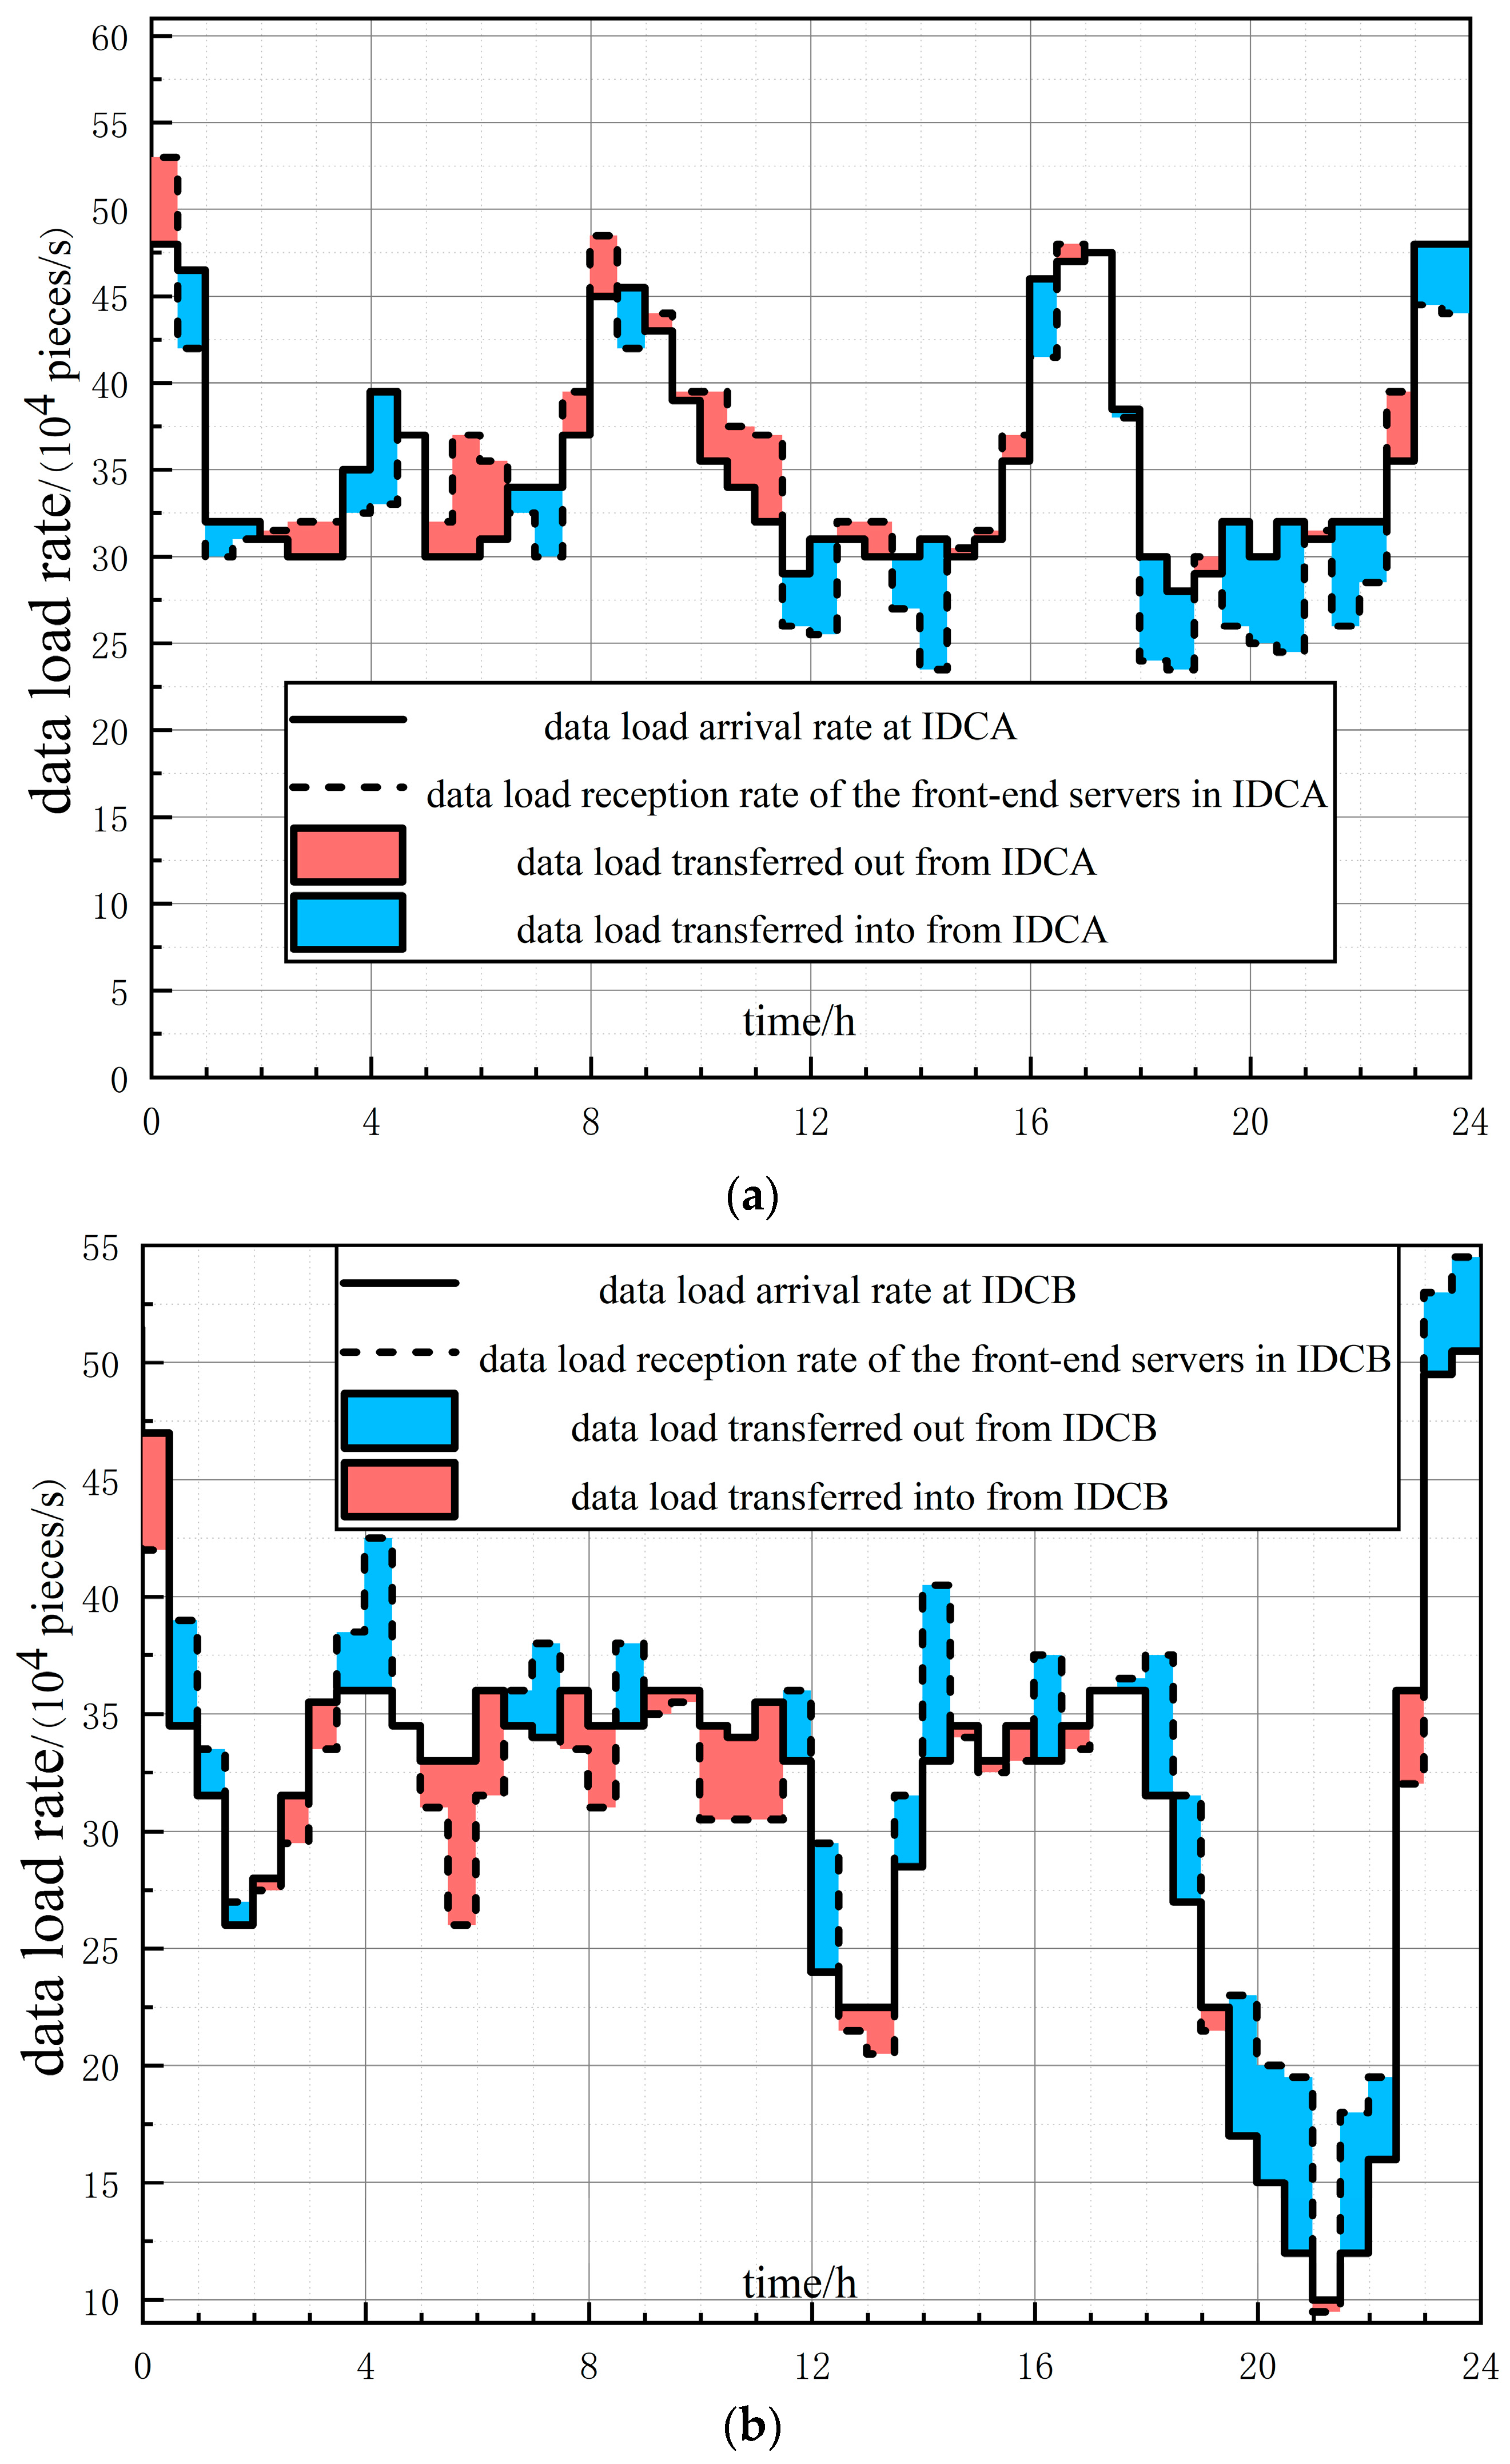
The integrated energy system of interconnected parks featuring IDCs facilitates the spatial transfer of multi-energy loads through adjustments in data processing and computing task volumes. Figure 3 shows the schematic diagram of data load adjustments for each IDC within the integrated energy system of interconnected parks on a typical day. Data Center A (IDCA) [Appendix A] and Data Center B (IDCB) [Appendix A] transfer equal amounts of data load within the same period.

Figure 3.
Typical daily data load adjustment diagram for data center. (a) IDC of industrial area. (b) IDC of industrial area.
2.3. Correlation Analysis of Feature Parameters
Utilizing dynamic voltage frequency regulation technology, IDCs dynamically adjust each server’s operating frequency based on the actual data load arrival rates. Therefore, IDC load, data load arrival rate, and the number of servers operating at different frequencies are closely correlated [14]. In addition to conventional load influencing factors such as historical load data and weather-related elements [19], the candidate input features also encompass the data load arrival rate, characterizing the spatial transfer characteristics of transferable loads. The number of servers operating at various frequencies (IDCA servers at frequencies 1–4 and IDCB servers at frequencies 5–8) is considered. Spearman correlation analysis is conducted on these candidate input features, yielding the correlation heatmap depicted in Figure 4. In the figure, , , and denote electricity, cooling, and heating loads, respectively (where i = A and B, signifying industrial and commercial areas, respectively); and represent the complementary and synchronous coefficients, respectively, between k loads and g loads [7] (where k, g = p, c, h denote electricity, cooling, and heating loads, respectively); and refer to data load arrival rates and the number of servers operating at the m-th frequency (where m = 1, 2, 3, 4, 5, 6, 7, 8), respectively; and T, H, and Ws correspond to temperature, humidity, and wind speed, respectively. Strong correlations are observed among heterogeneous loads within each park. Moreover, temperature, humidity, the data load arrival rate, and the number of servers operating at specific frequencies exhibit moderate correlations with various heterogeneous energy loads in the two parks.
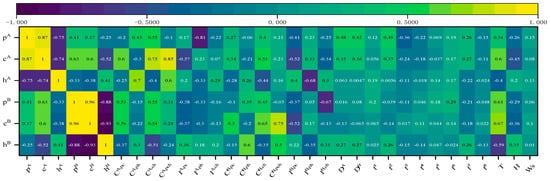
Figure 4.
Correlation heatmap of characteristic parameters to be selected.
3. Load Prediction Method Based on MTL-CNN-LSTM
3.1. Basic Principles
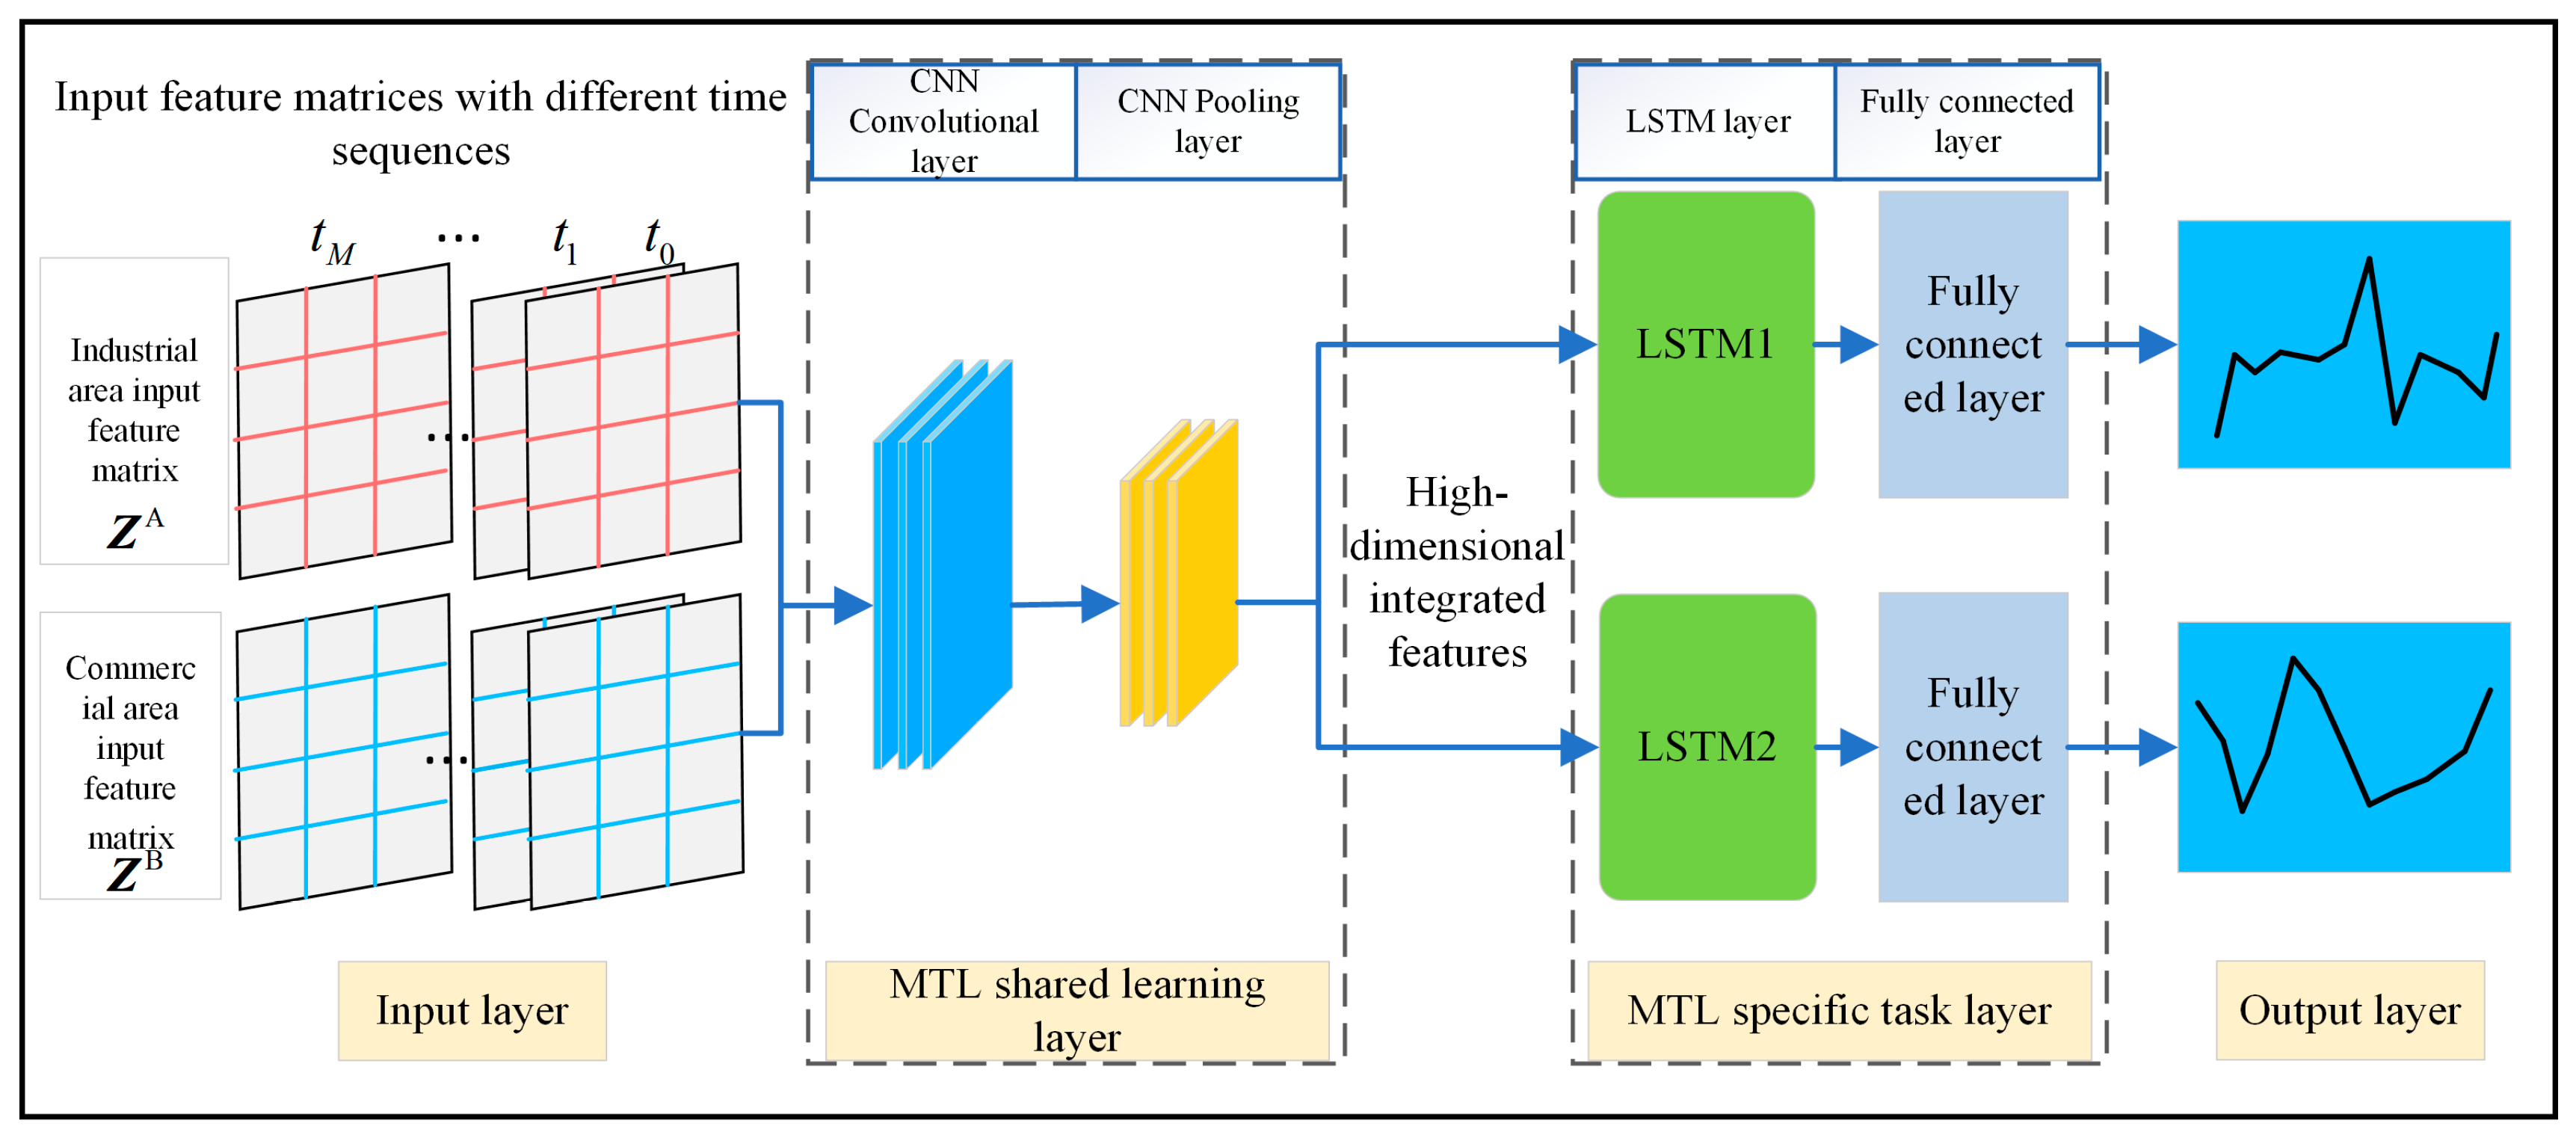
To enhance the generalization of the multi-park joint prediction model and characterize the correlation between energy consumption among parks [40], we employ a prediction approach based on the hard parameter sharing mechanism MTL (Figure 5).
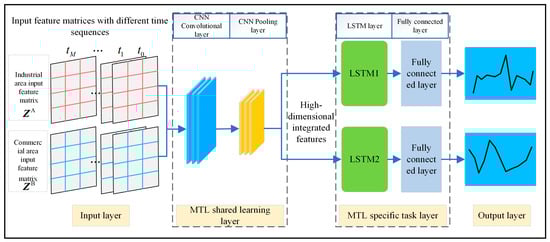
Figure 5.
MTL-CNN-LSTM-based load forecasting approaches.
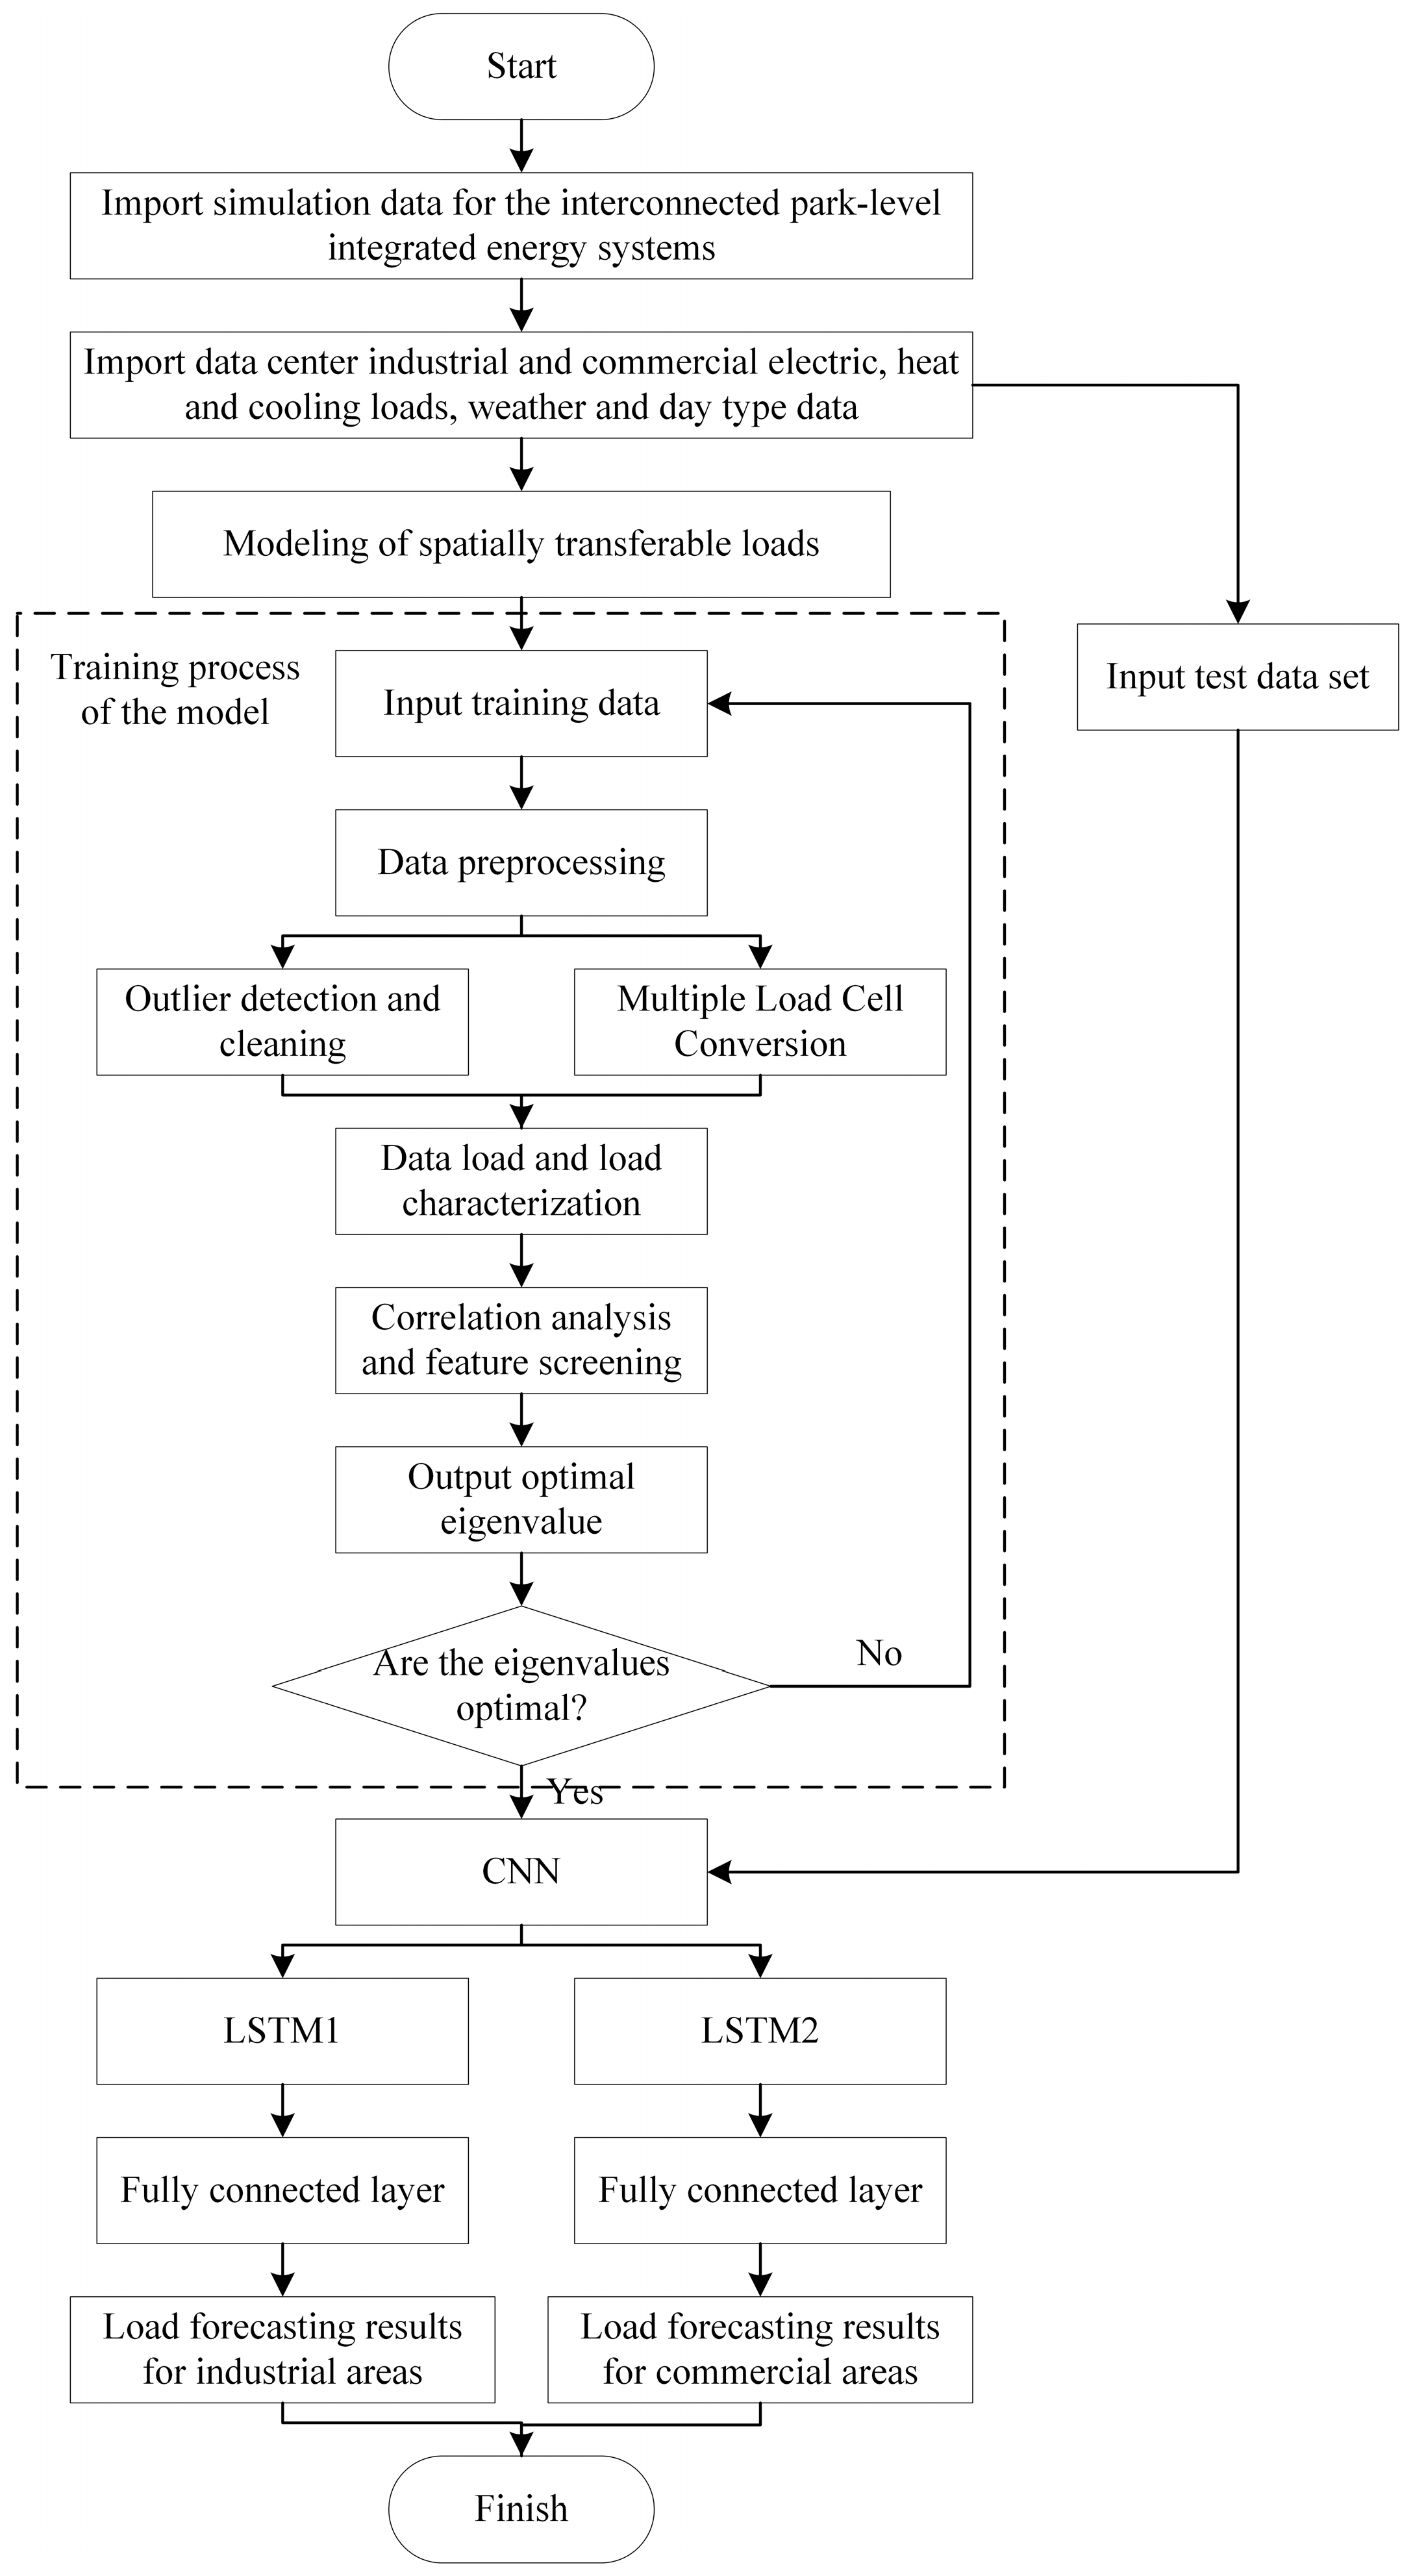
First, CNN is employed in the shared learning layer to perform feature fusion on the input feature matrix, acquiring high-dimensional composite features comprising heterogeneous energy loads, meteorological data, day types, and load transfer characteristics across multiple parks. Second, LSTM is utilized in the task-specific layer to explore temporal coupling relationships among high-dimensional composite features over different time steps. Finally, the prediction results are generated through linear processing in the fully connected layer. The specific flow is shown in Figure 6.
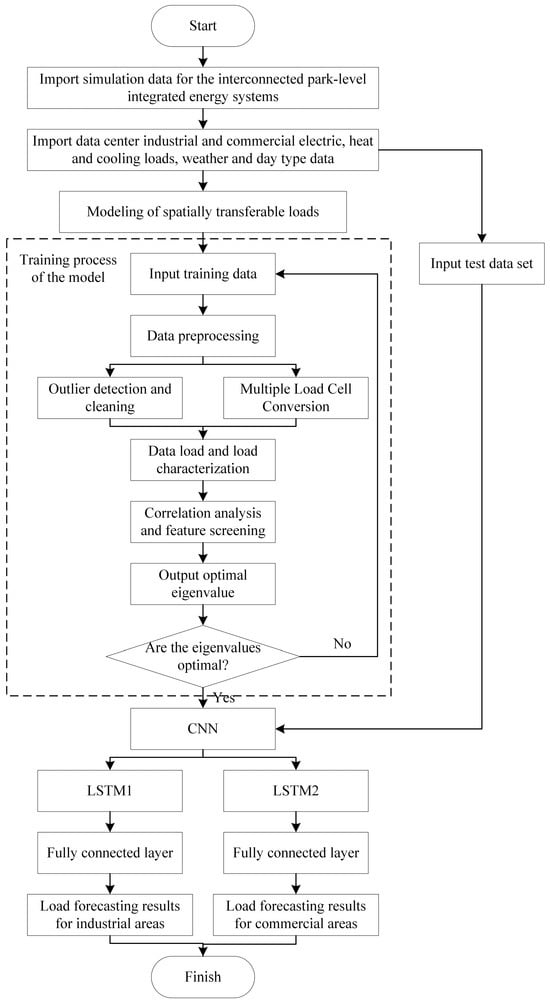
Figure 6.
MTL-CNN-LSTM-based load forecasting flowchart.
3.2. Selection of Optimal Feature Set
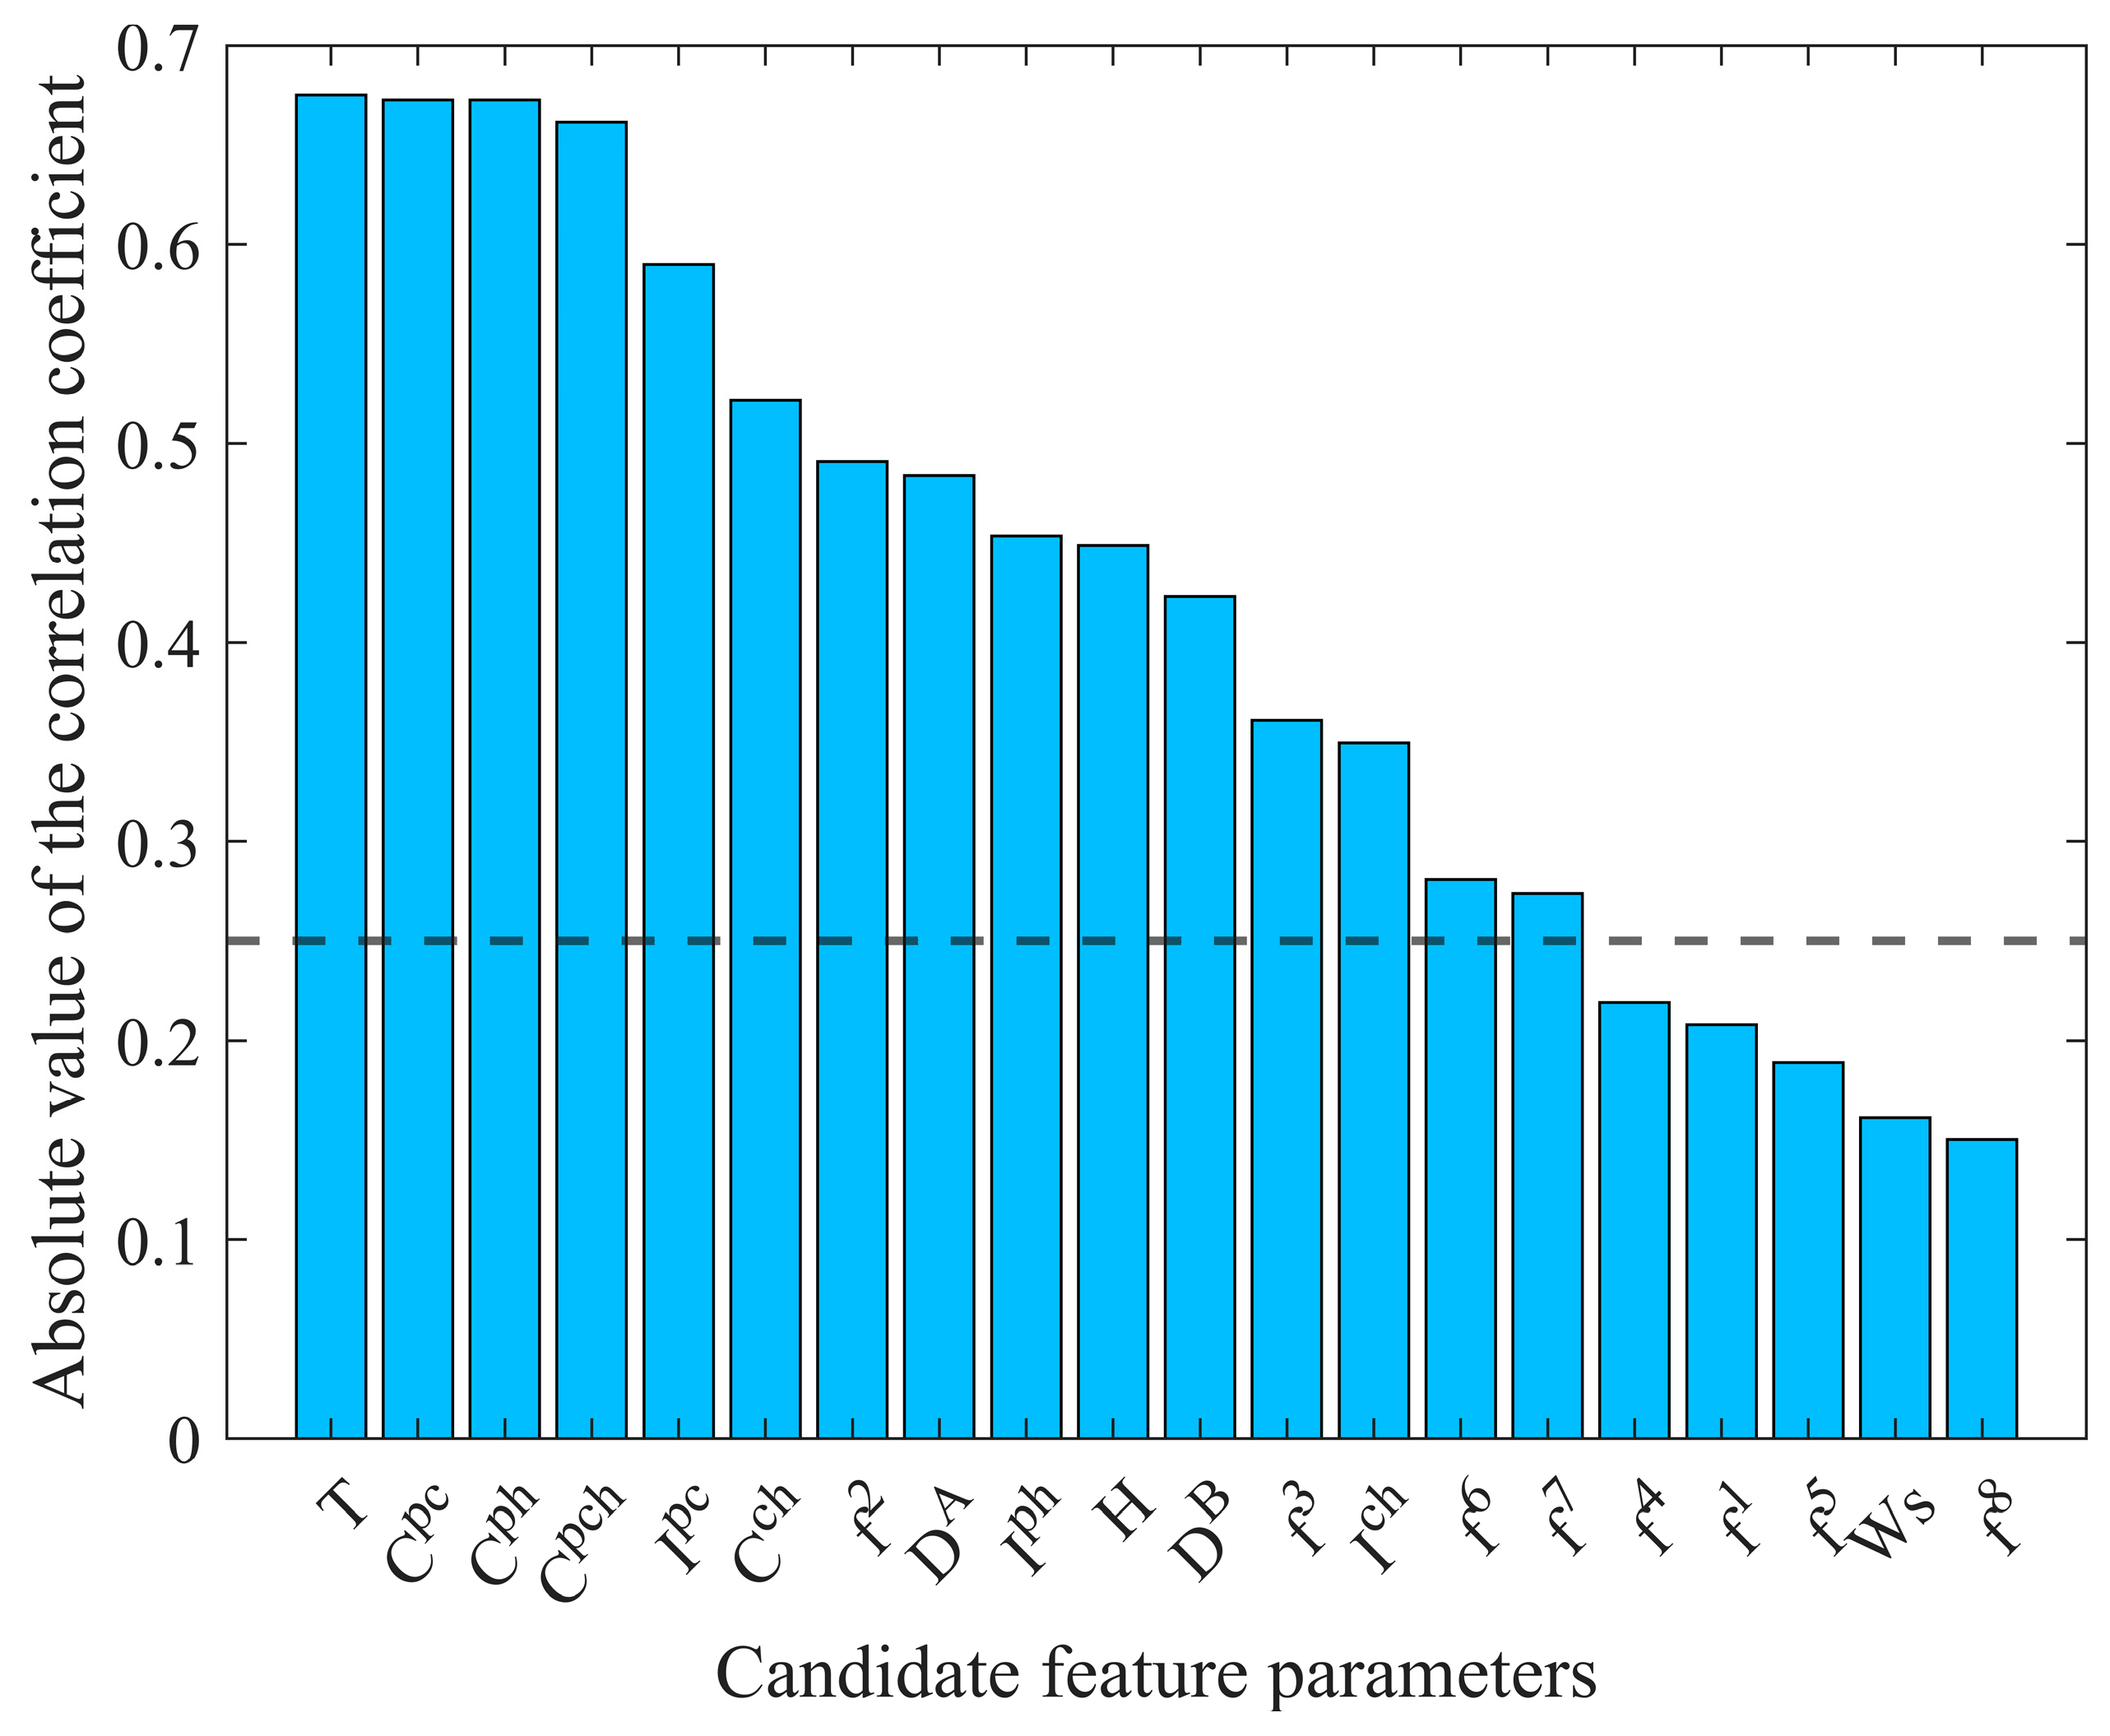
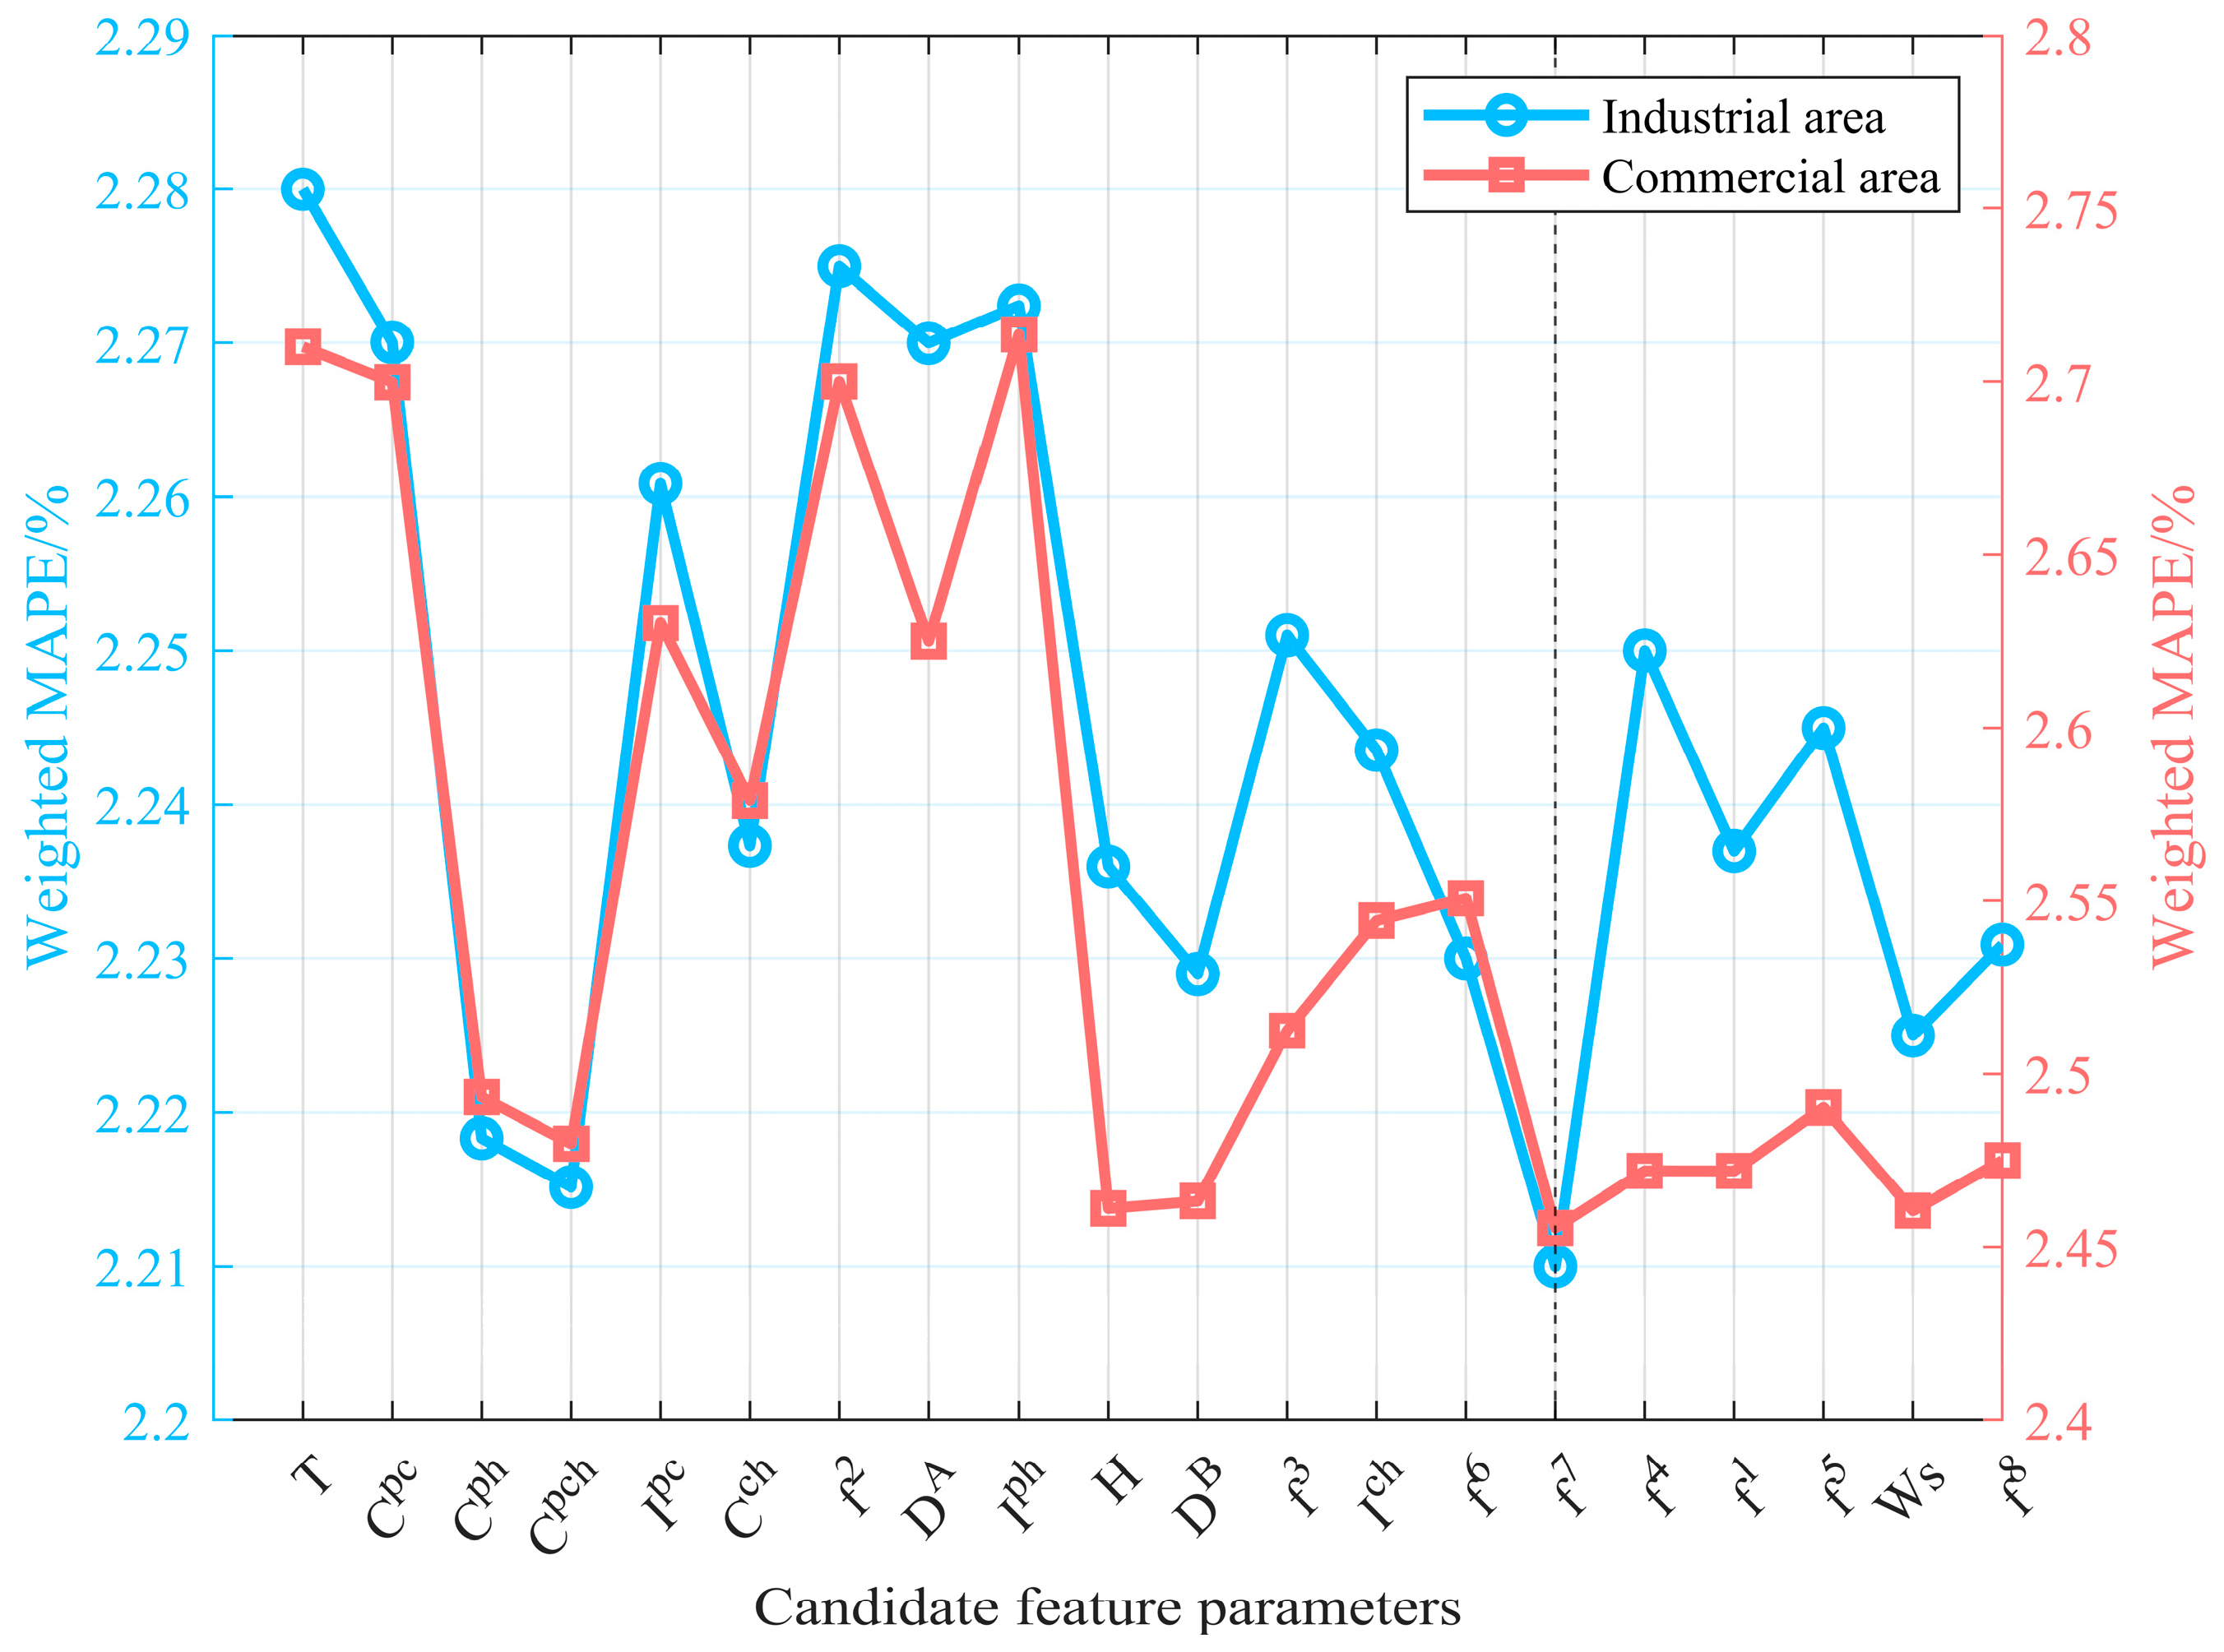
Following the correlation coefficients computed in the preceding section, candidate feature parameters are sorted in ascending order (Figure 7). Based on the time series features of electricity, cooling, and heating loads of two parks, along with the day type feature, features are incrementally included based on their correlation magnitude to monitor the prediction error validation. The prediction error reaches its minimum value when the 15th feature is integrated (Figure 8).

Figure 7.
Absolute values of the correlation coefficients of some of the characteristic parameters to be selected.
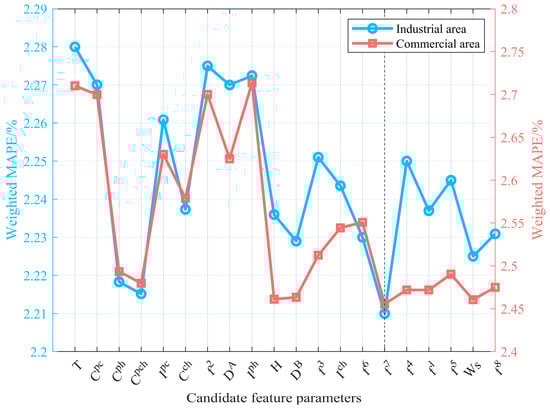
Figure 8.
Effect of characteristic parameters to be selected on prediction error.
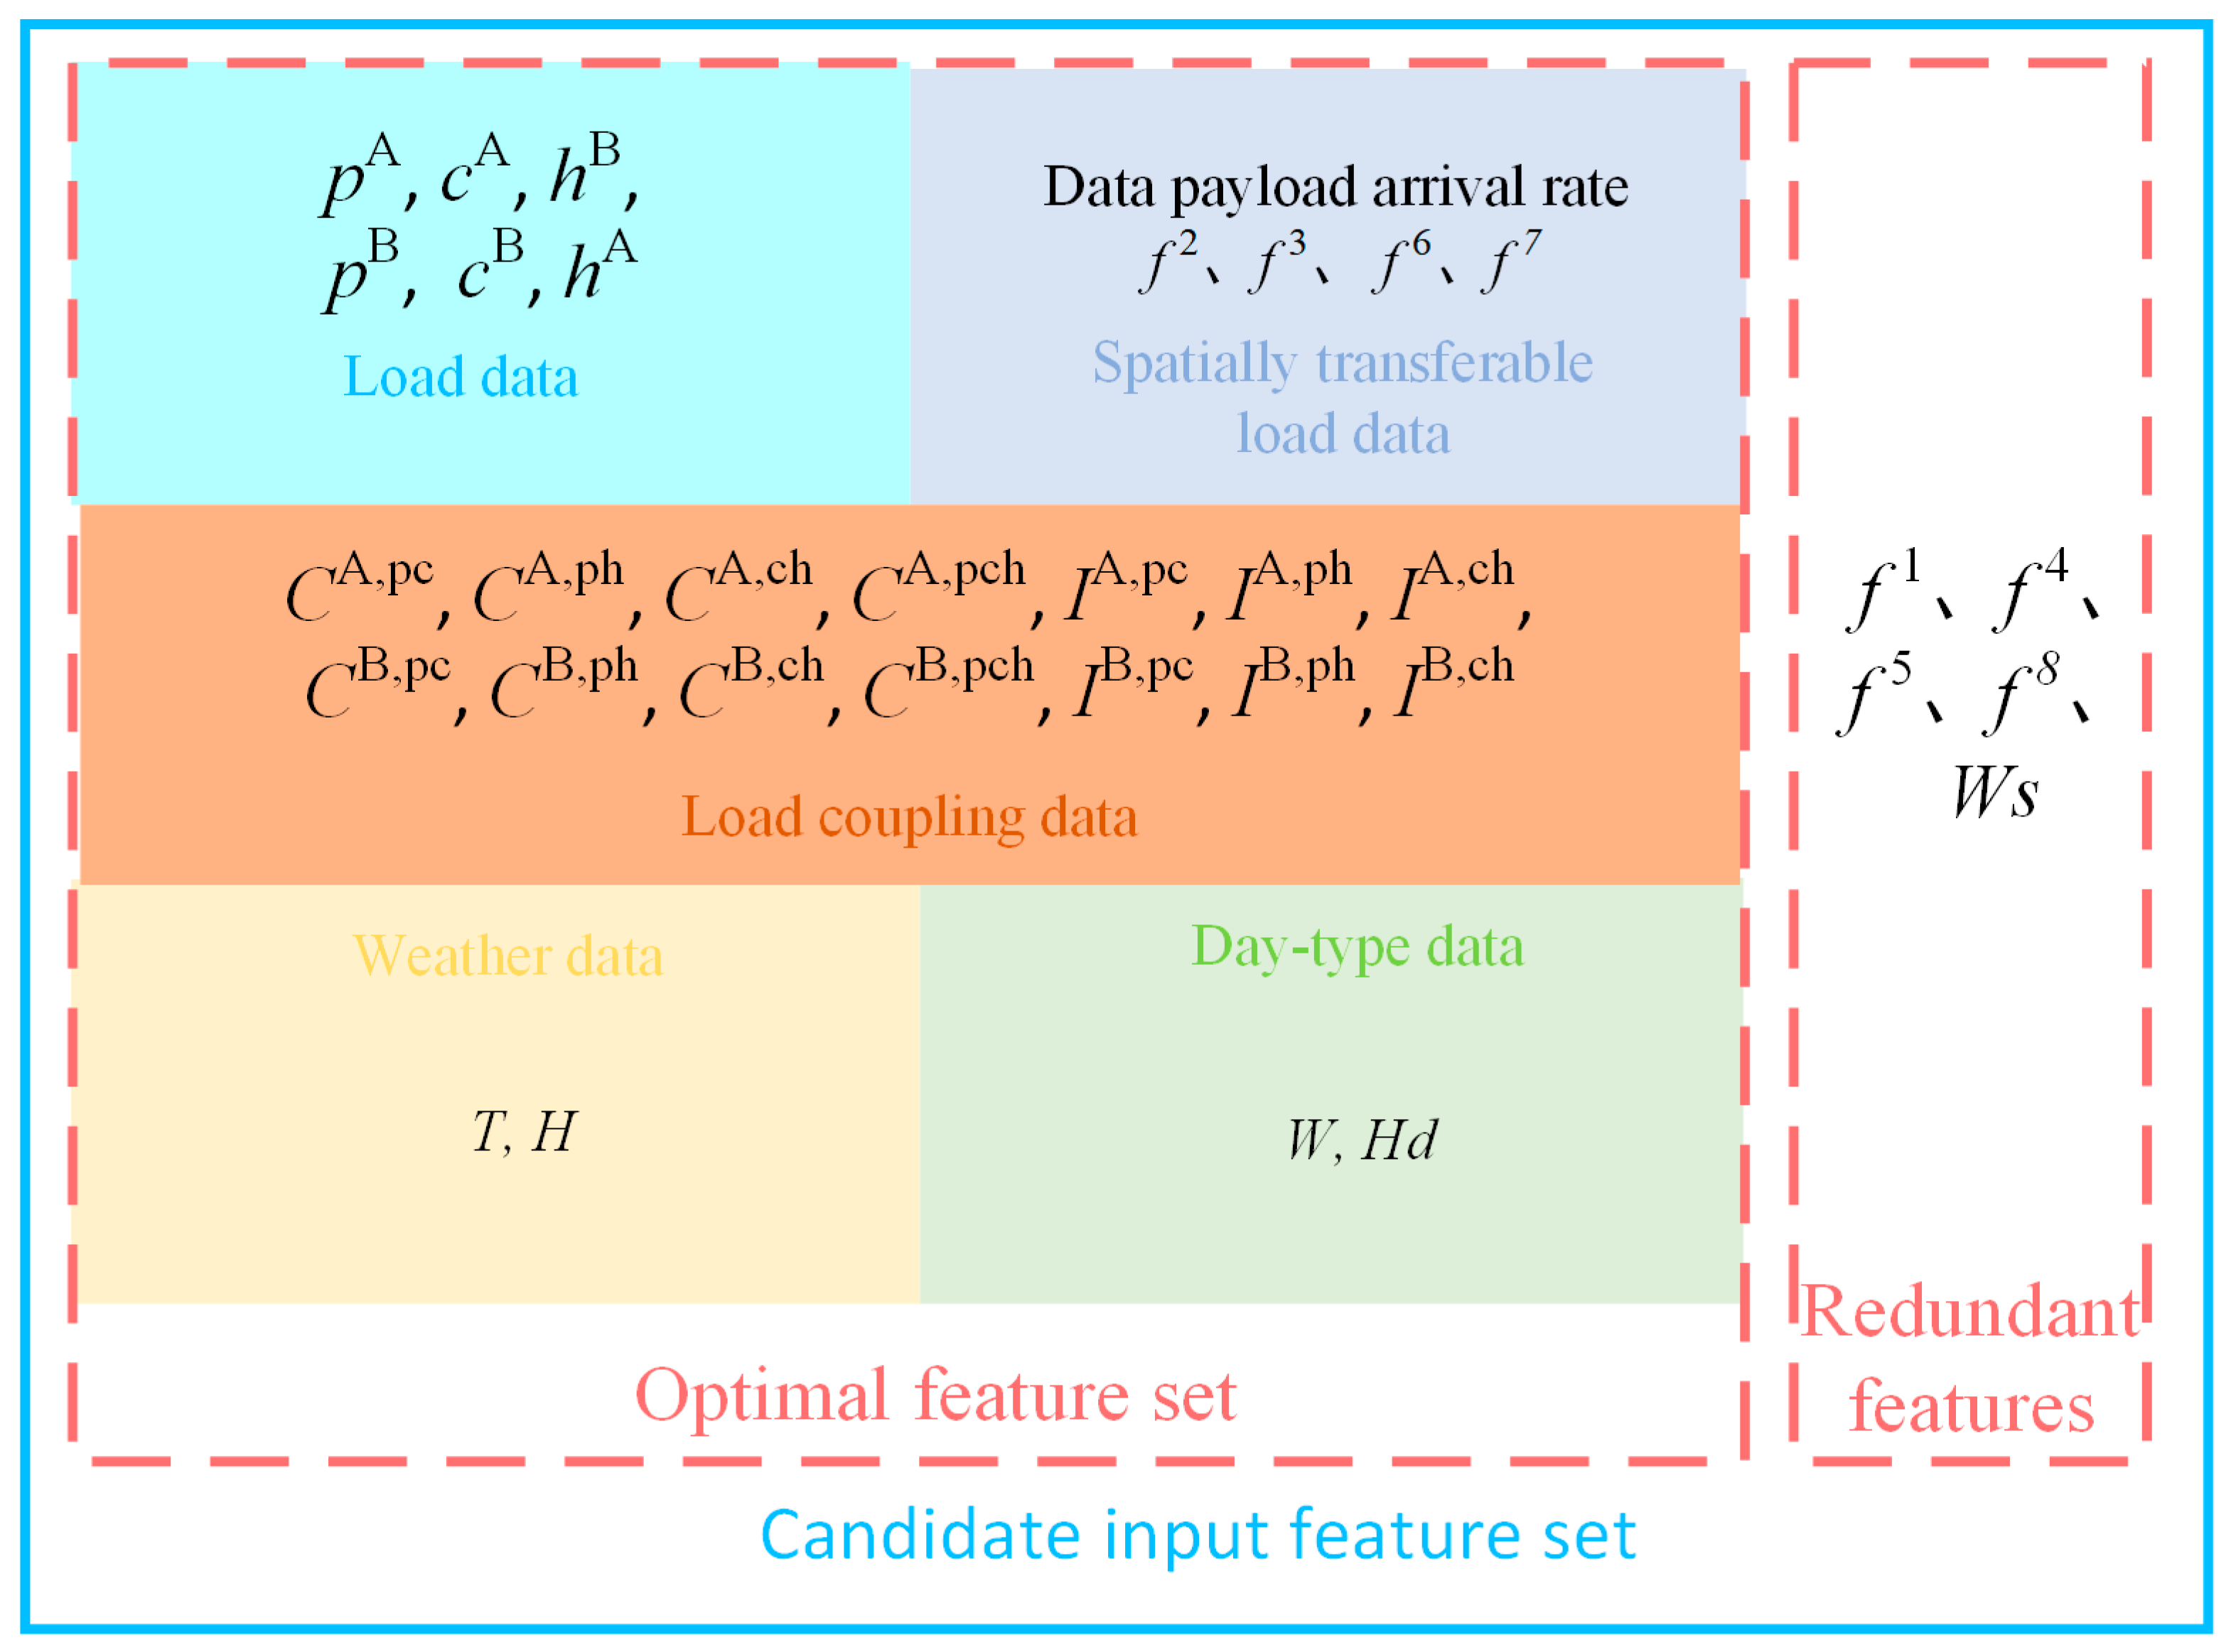
Therefore, the optimal feature set is chosen, comprising load time series sequences, day types, temperature, humidity, data load arrival rates, synchronous coefficients, and complementary coefficients between electricity, cooling, and heating loads [7], along with the number of servers at specific operating frequencies (, m = 2, 3, 6, 7) (Figure 9).
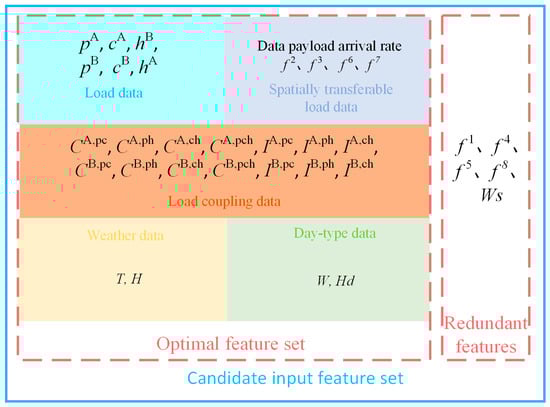
Figure 9.
Filter results for the feature set.
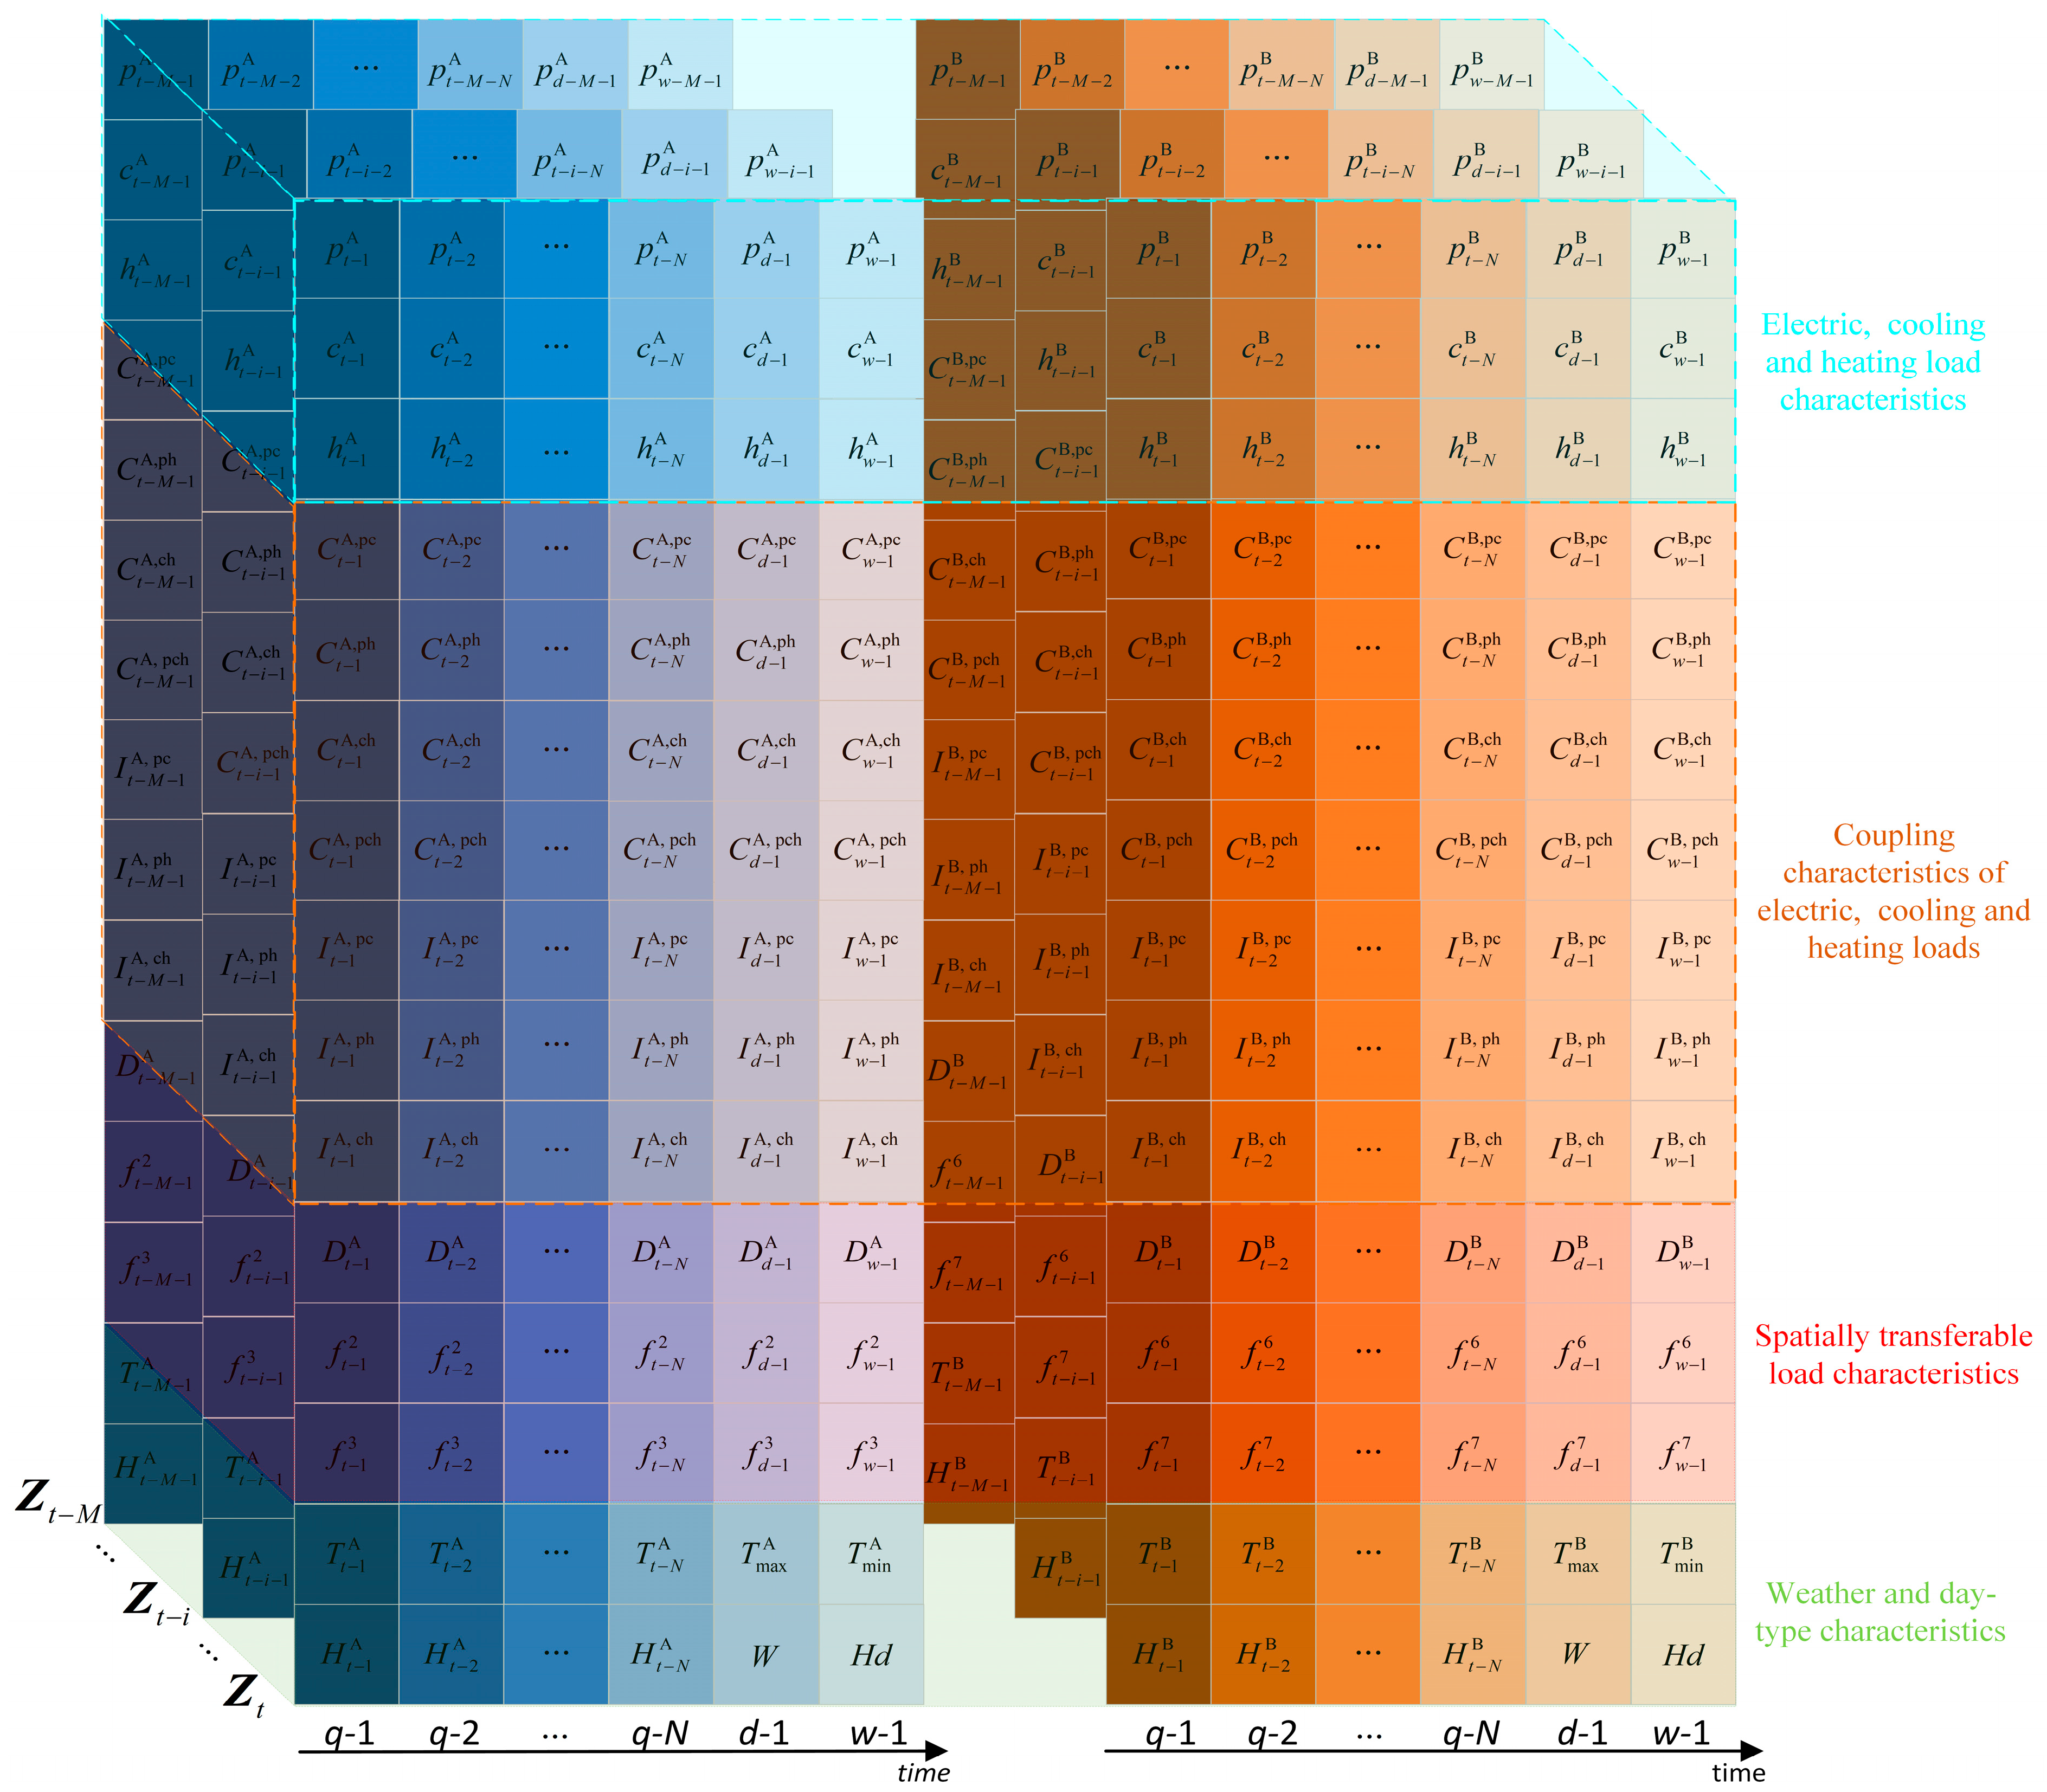
For capturing short-term repetitive characteristics in adjacent time steps and long-term repetitive characteristics with daily and weekly cycles [9], the optimal feature set is depicted as a matrix (Figure 10). In this matrix, , , and denote the input feature matrices at time t, t − i, and t − M, respectively, where M denotes the total number of predictions. The first three rows of the input feature matrix , , and represent , , and , respectively, at time j, with N denoting the sliding window length. The subsequent seven rows and signify and , respectively, at time j. The following three rows and represent and , respectively, at time j. The last two rows comprise weather and day type data, where W and Hd denote working days and holidays, respectively. and correspond to the maximum and minimum temperatures, respectively, in park i on the day preceding the predicted time.
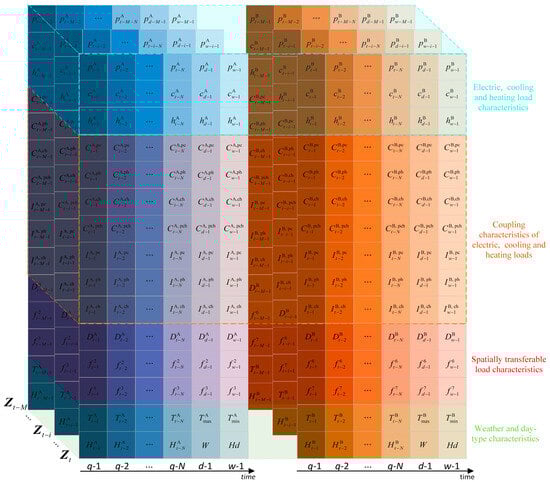
Figure 10.
Feature matrix diagram.
3.3. Evaluation Metrics
This study evaluates the prediction performance of individual loads in the park using the Mean Absolute Percentage Error (MAPE).
where i = A and B denote industrial and commercial areas, respectively; and y = p, c, and h refer to electricity, cooling, and heating loads, respectively. The overall prediction performance for a single park is assessed utilizing the weighted average of the MAPE, as follows:
where , , and denote the error weights for the electricity, cooling, and heating loads, respectively, of park i. These weights are collectively determined after analyzing each park’s electricity, cooling, and heating load levels and characteristics, and .
4. Case Study Analysis
4.1. Case Data
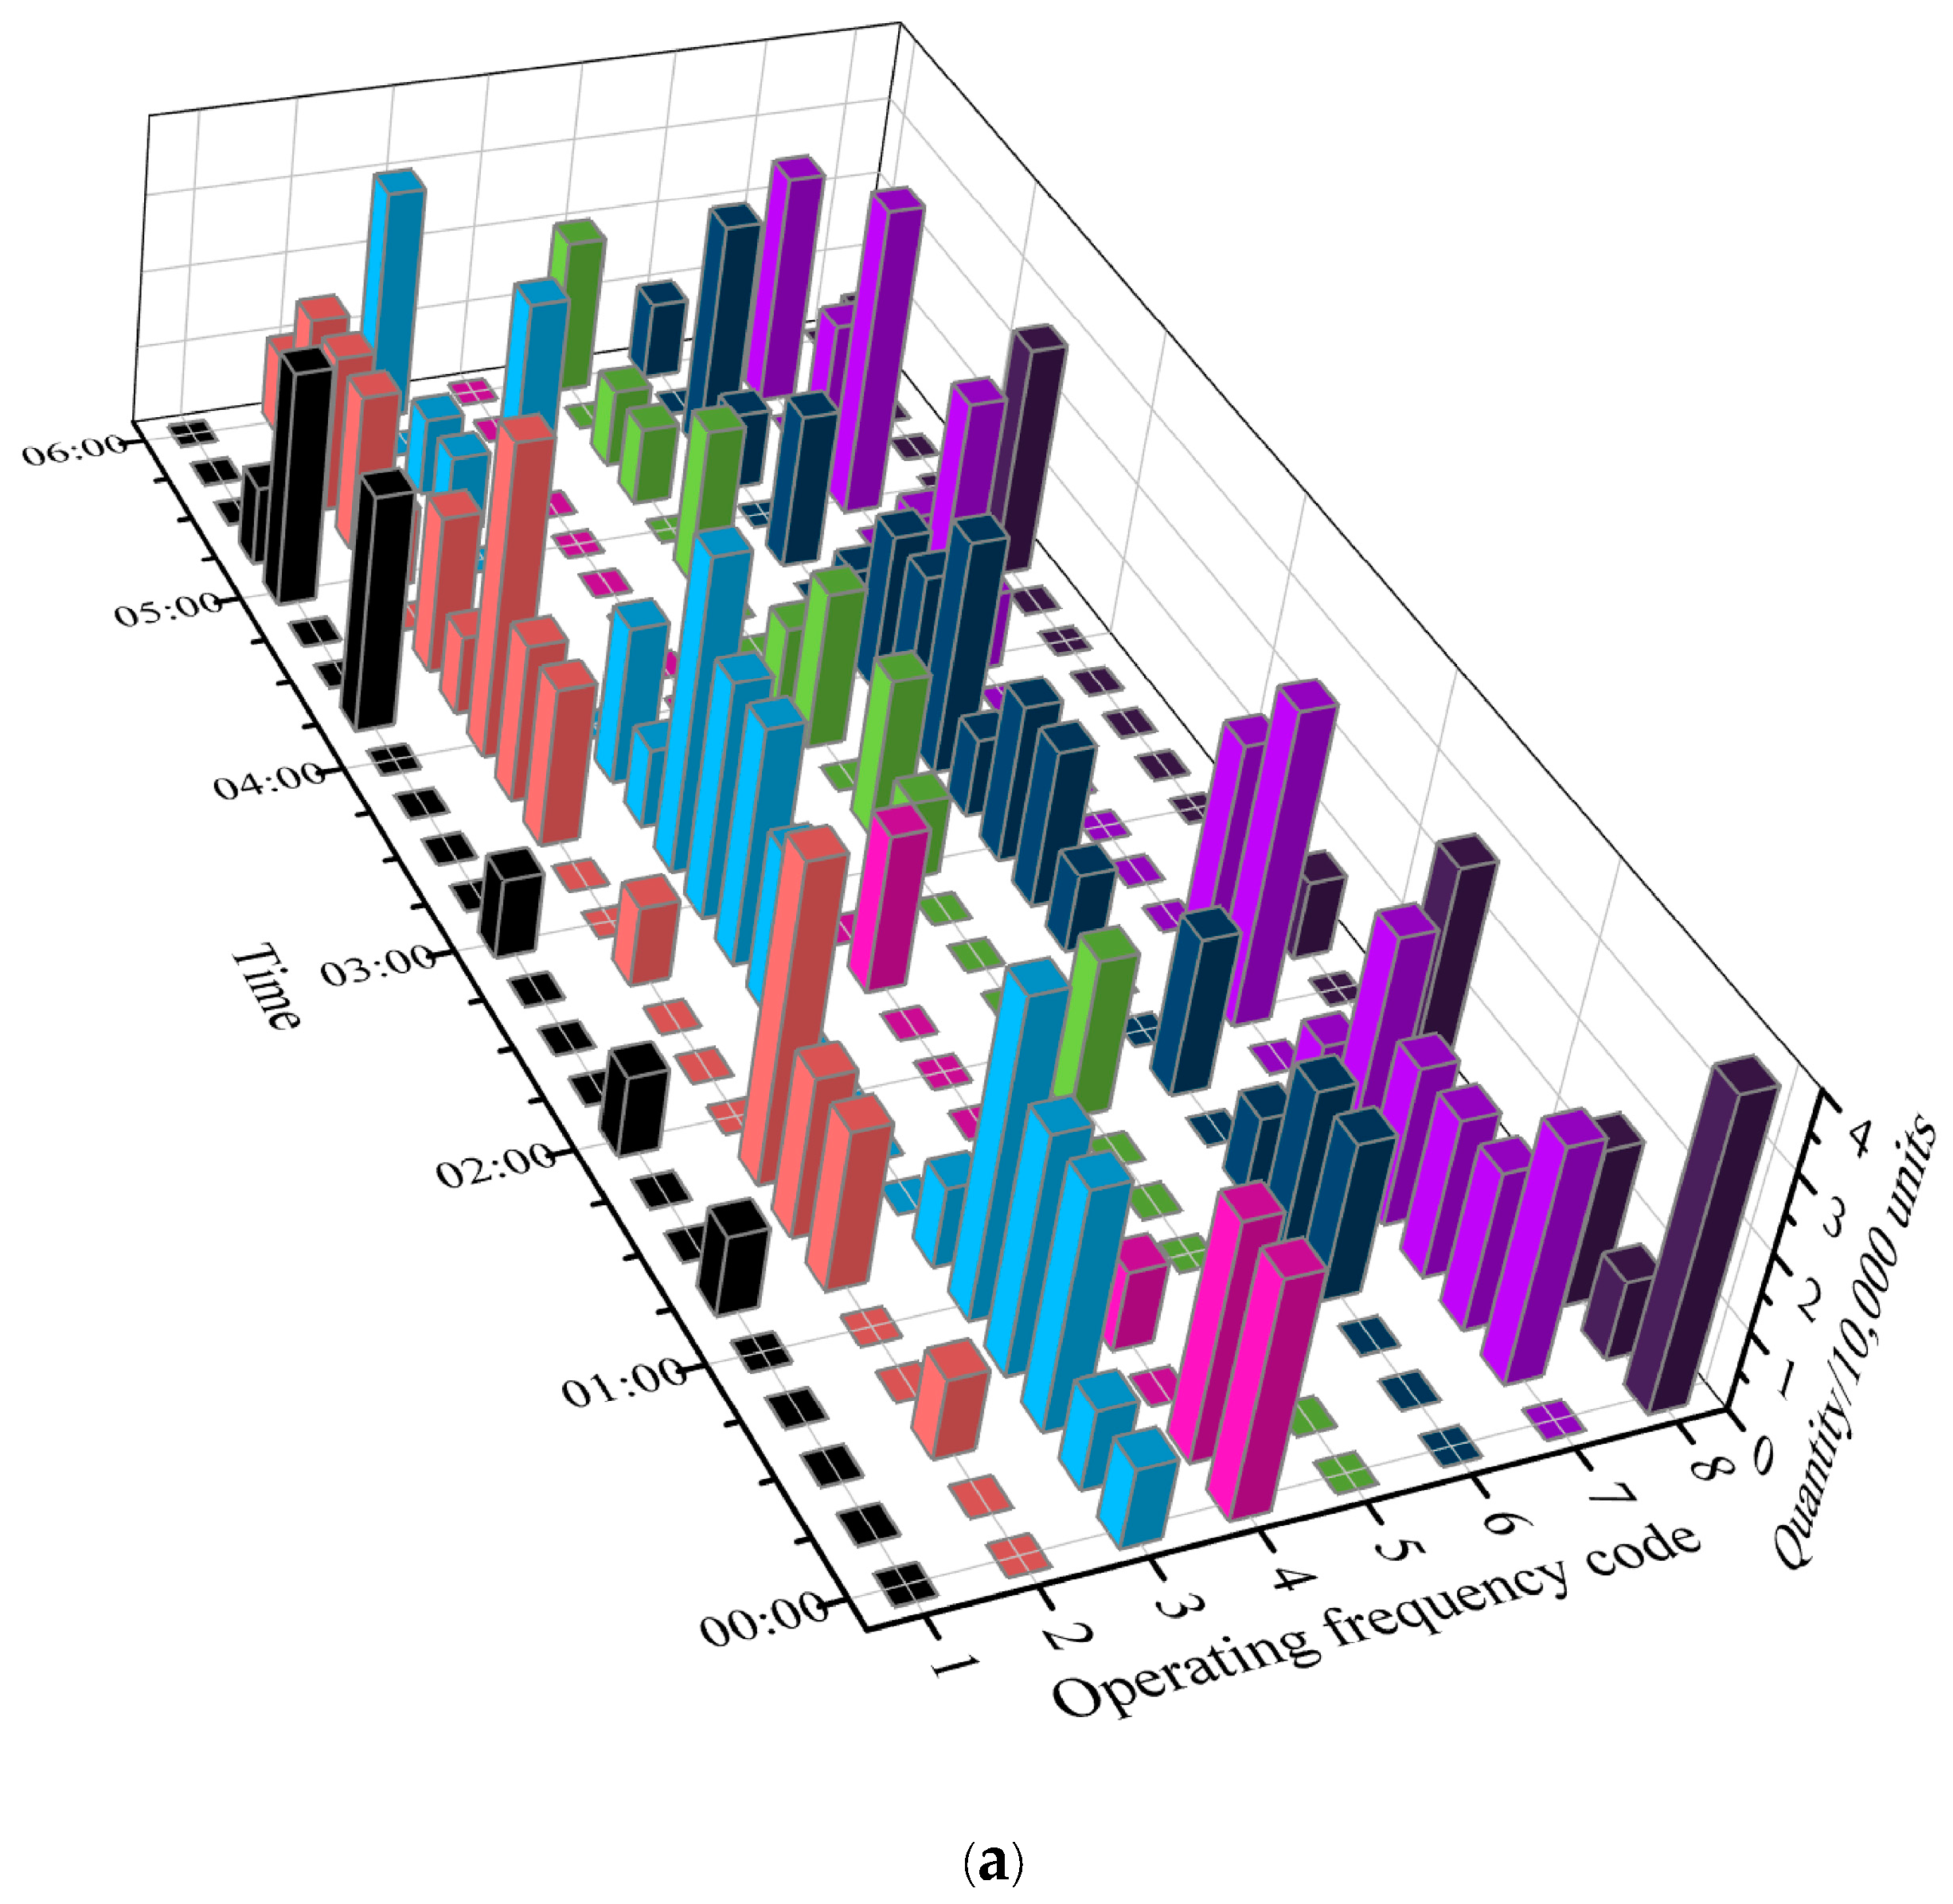
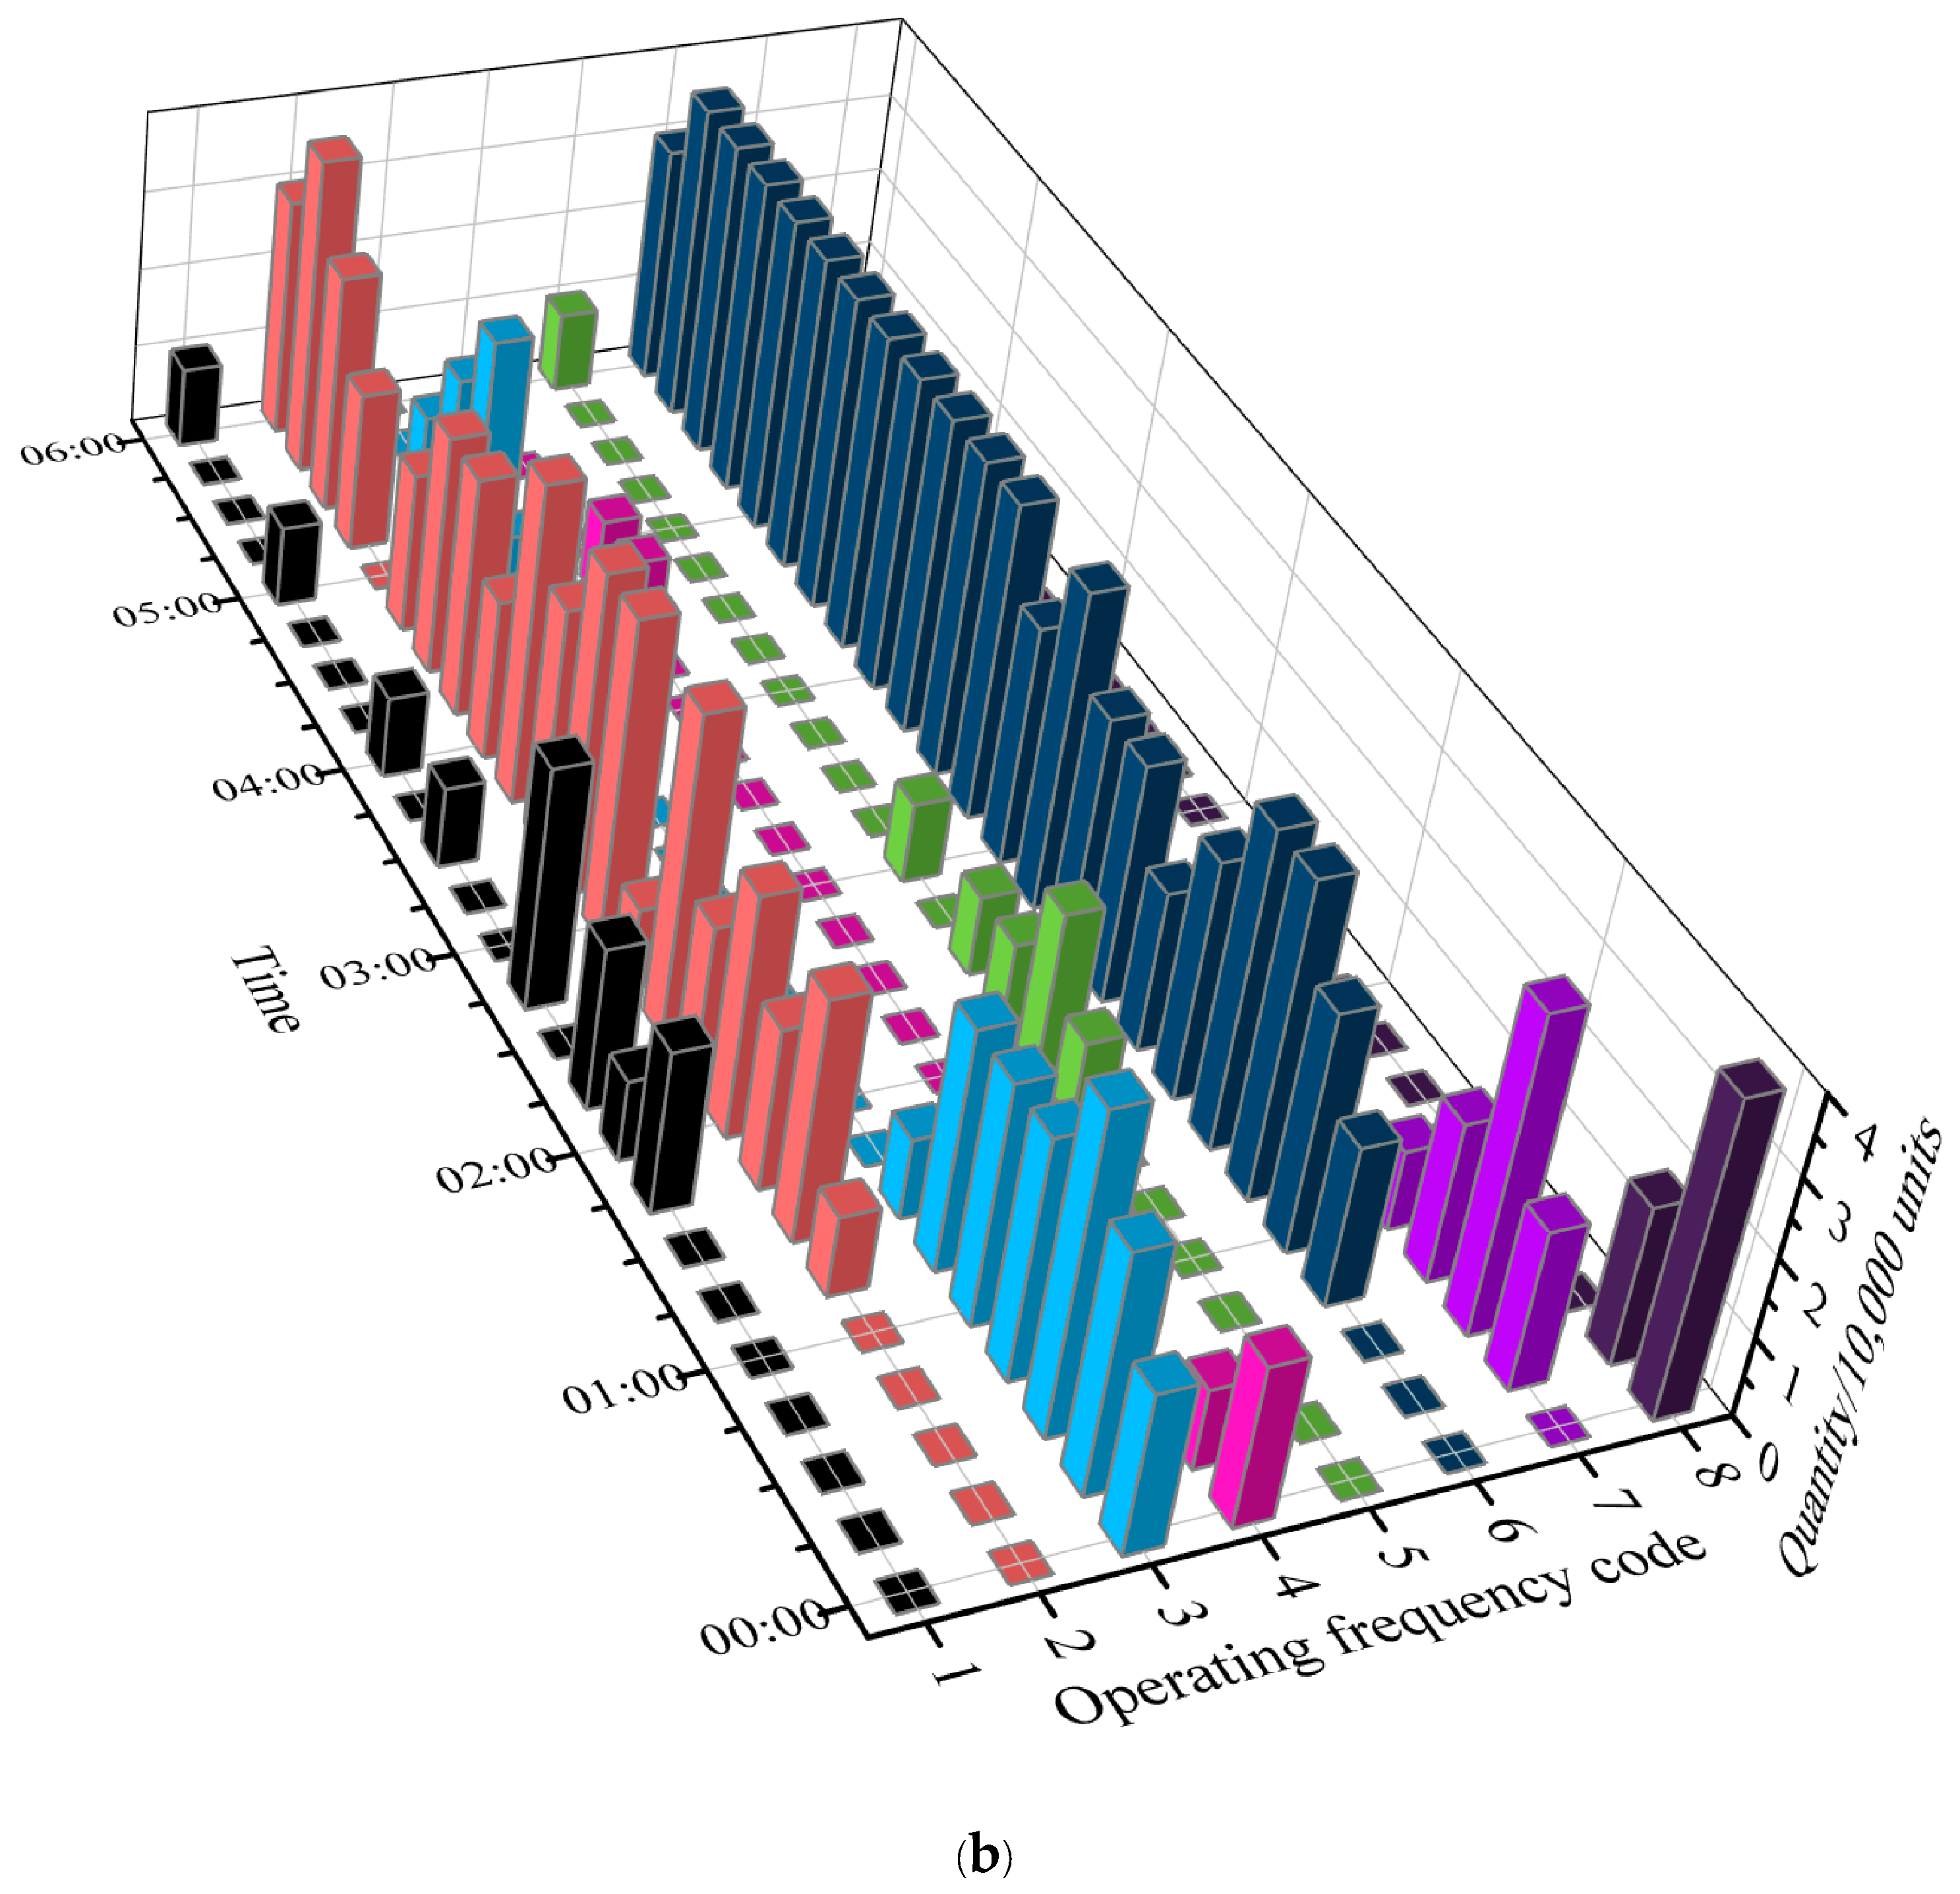
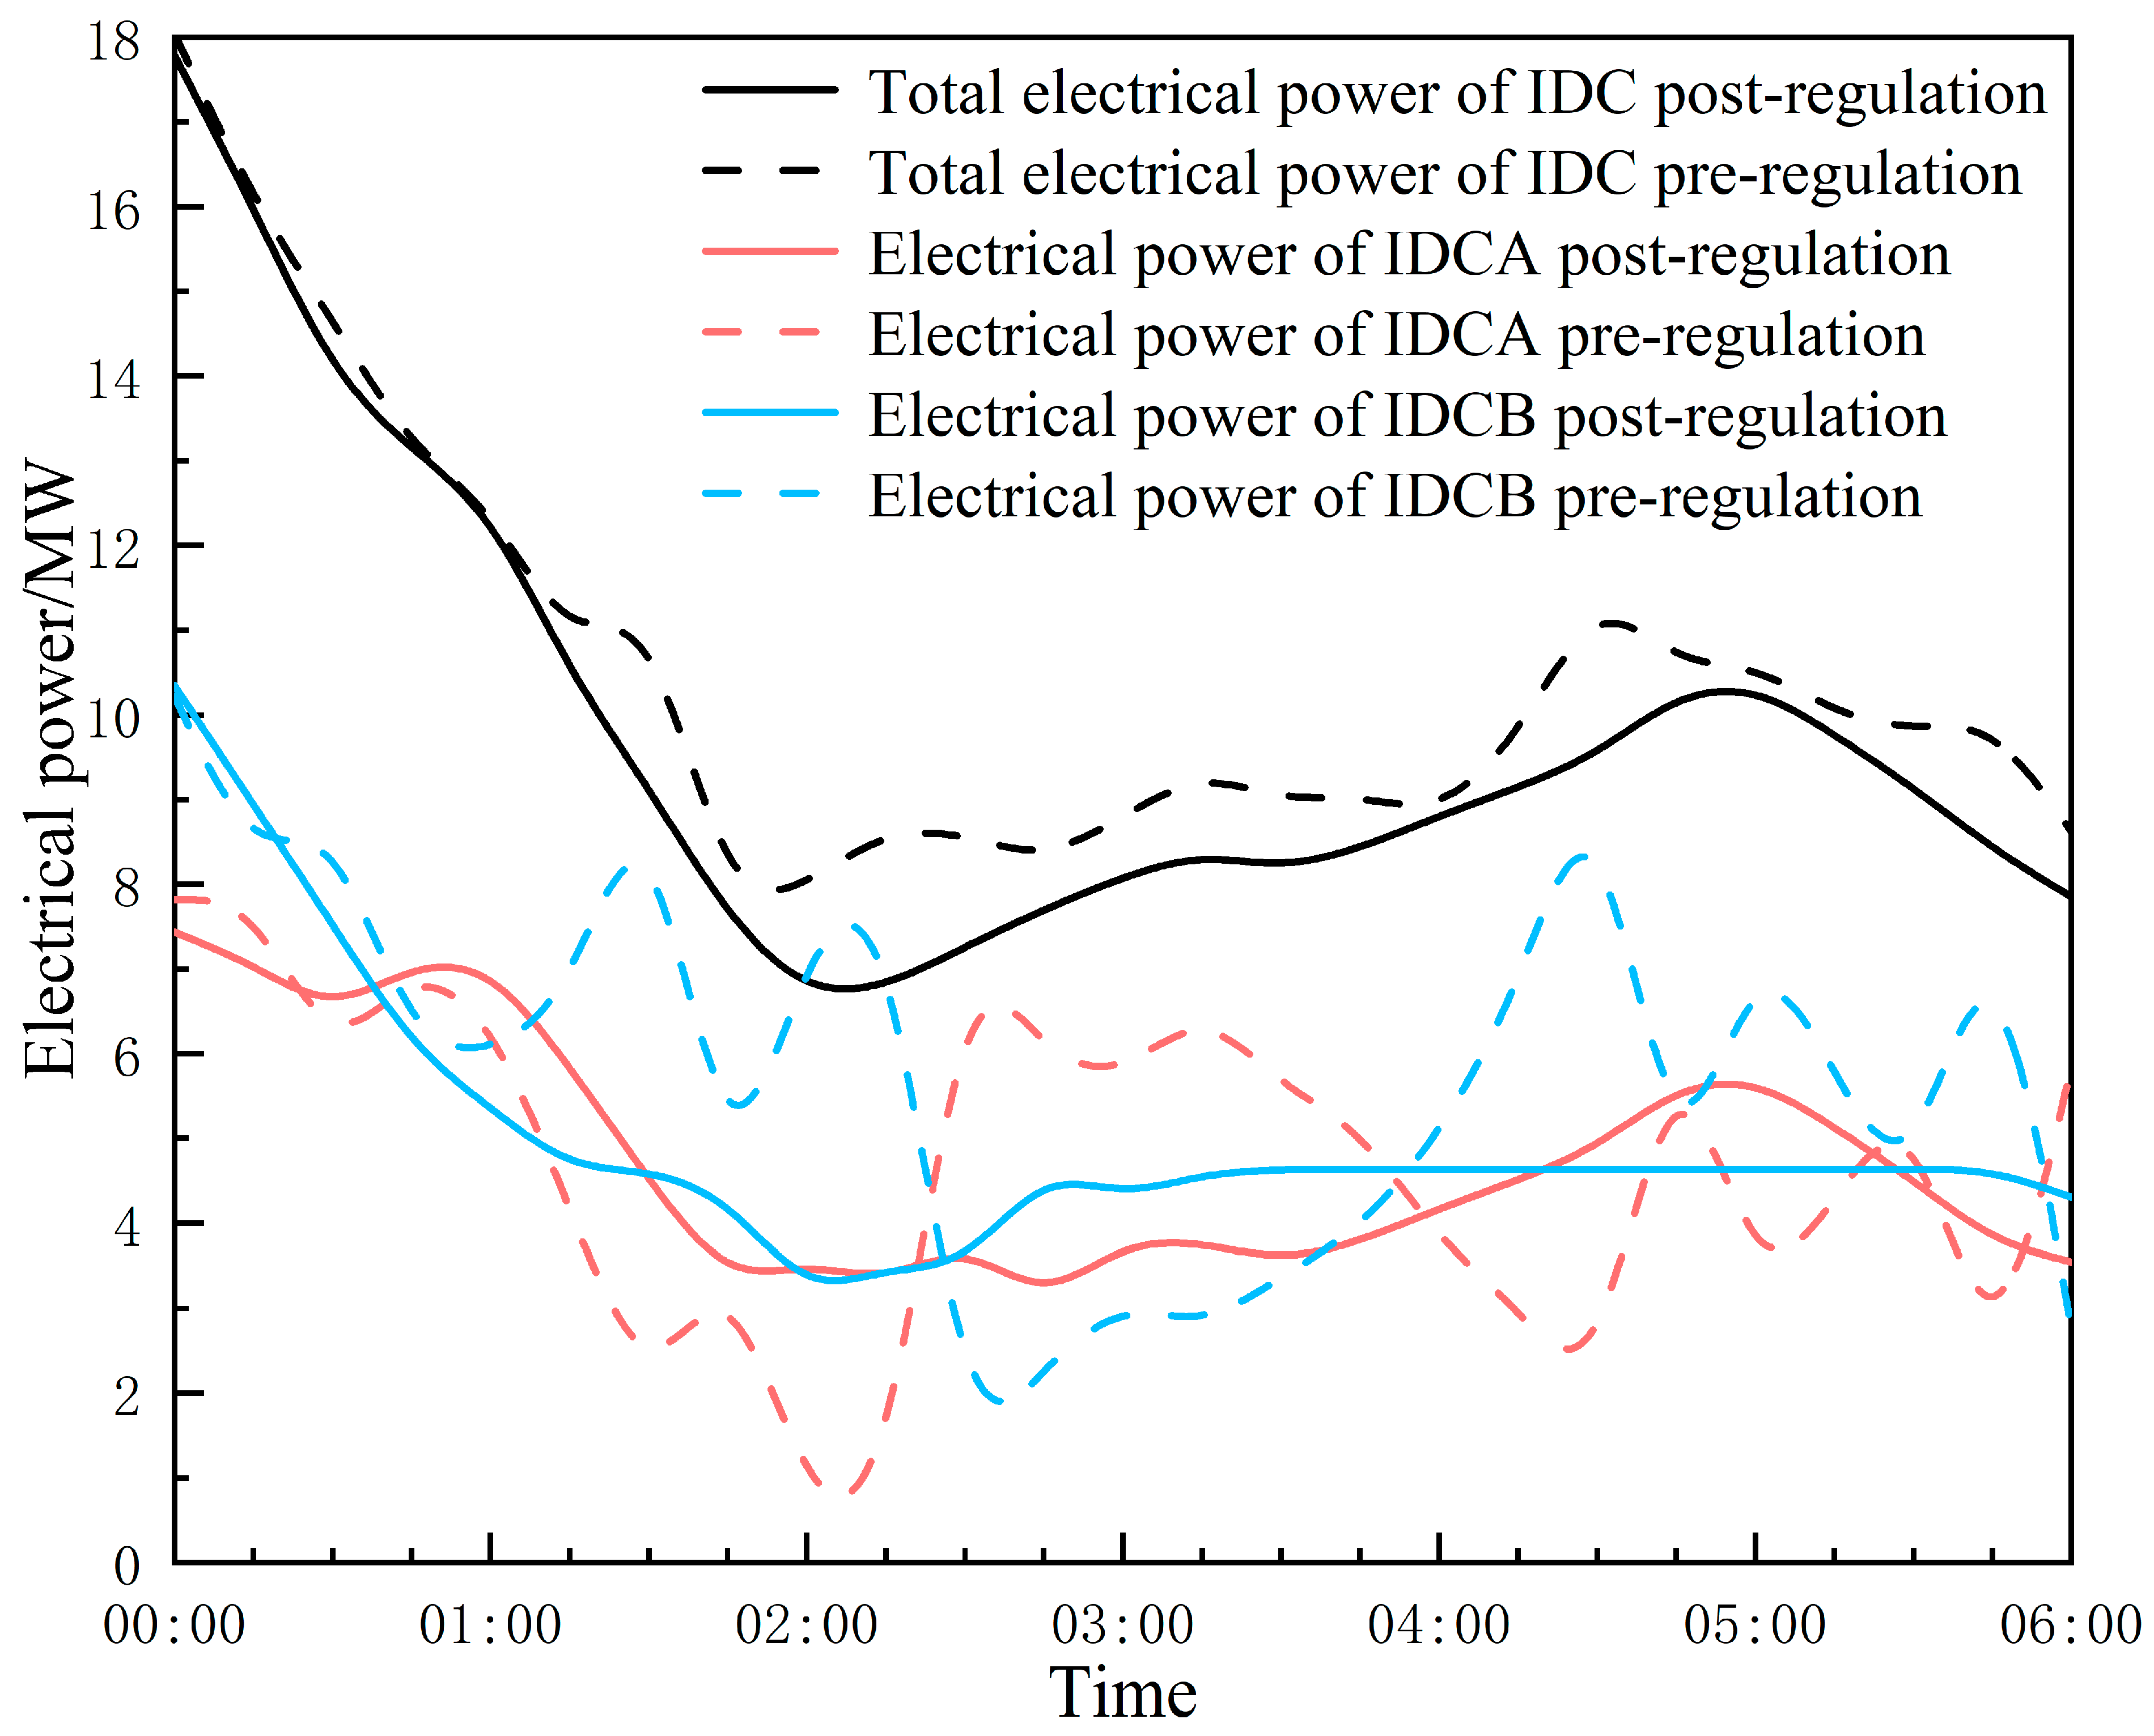
Utilizing the integrated system of interconnected parks (Figure 1) as a simulation case study, we employ the load data from an interconnected park’s integrated energy system in South China as our base load. The data arrival rate of the IDCs is sourced from the cluster-trace-gpu-v2020 dataset [41]. Both parks feature 40,000 IDC servers, and the IDC load to the frontend portal is managed at the 15 min level using a total IDC energy consumption minimization strategy [19,20]. Subsequently, IDC load data are acquired. Figure 11 illustrates the number of servers at various frequencies pre- and post-optimization, and Figure 12 depicts their corresponding load adjustment curves.

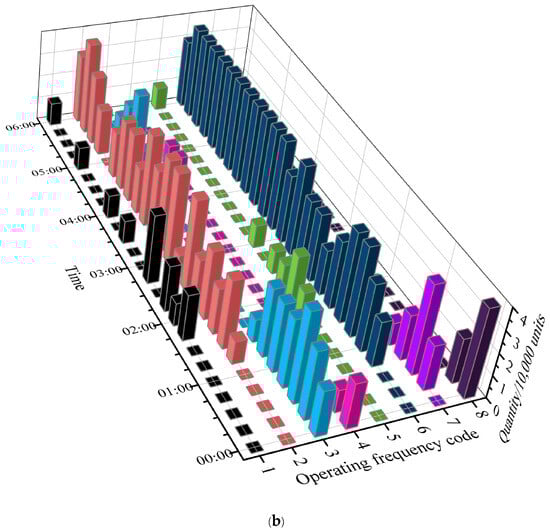
Figure 11.
Dynamic distribution of the number of servers at various operating frequencies in an IDC. (a) Before optimization. (b) After optimization.
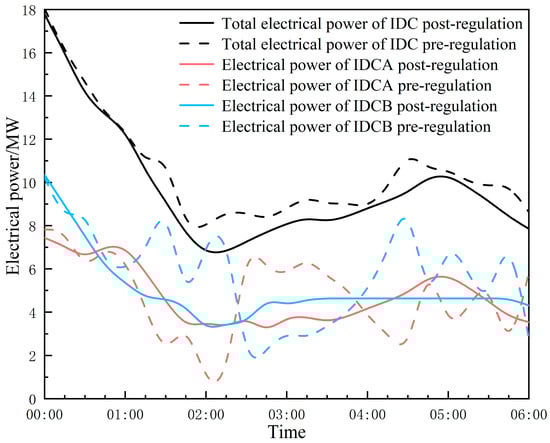
Figure 12.
Loads in data centers pre- and post-regulation.
We selected data samples from 15 June 2020 to 11 July 2021, with a 15 min time step, and split the dataset into training, validation, and test sets in a 70%:15%:15% ratio. To address missing values and outliers in the original data, the mean interpolation method is employed. The units of various loads are standardized to kW as follows:
1 kW = 0.284 Tons = 0.0034 mmBtu
The weights of various load types in the industrial area , , and are set to 0.4, 0.2, and 0.4, respectively. The weights of various load types in the commercial area , , and are set to 0.5, 0.5, and 0, respectively.
4.2. Parameter Settings
By employing a controlled variable approach while balancing prediction accuracy and model complexity, the hyperparameters chosen are as follows:
- The CNN kernel size is 4 × 4;
- The pooling size is 2 × 2;
- The number of LSTM neurons is 96;
- The number of neurons in the fully connected (FC) [Appendix A] layer is 24;
- The number of iterations is 100.
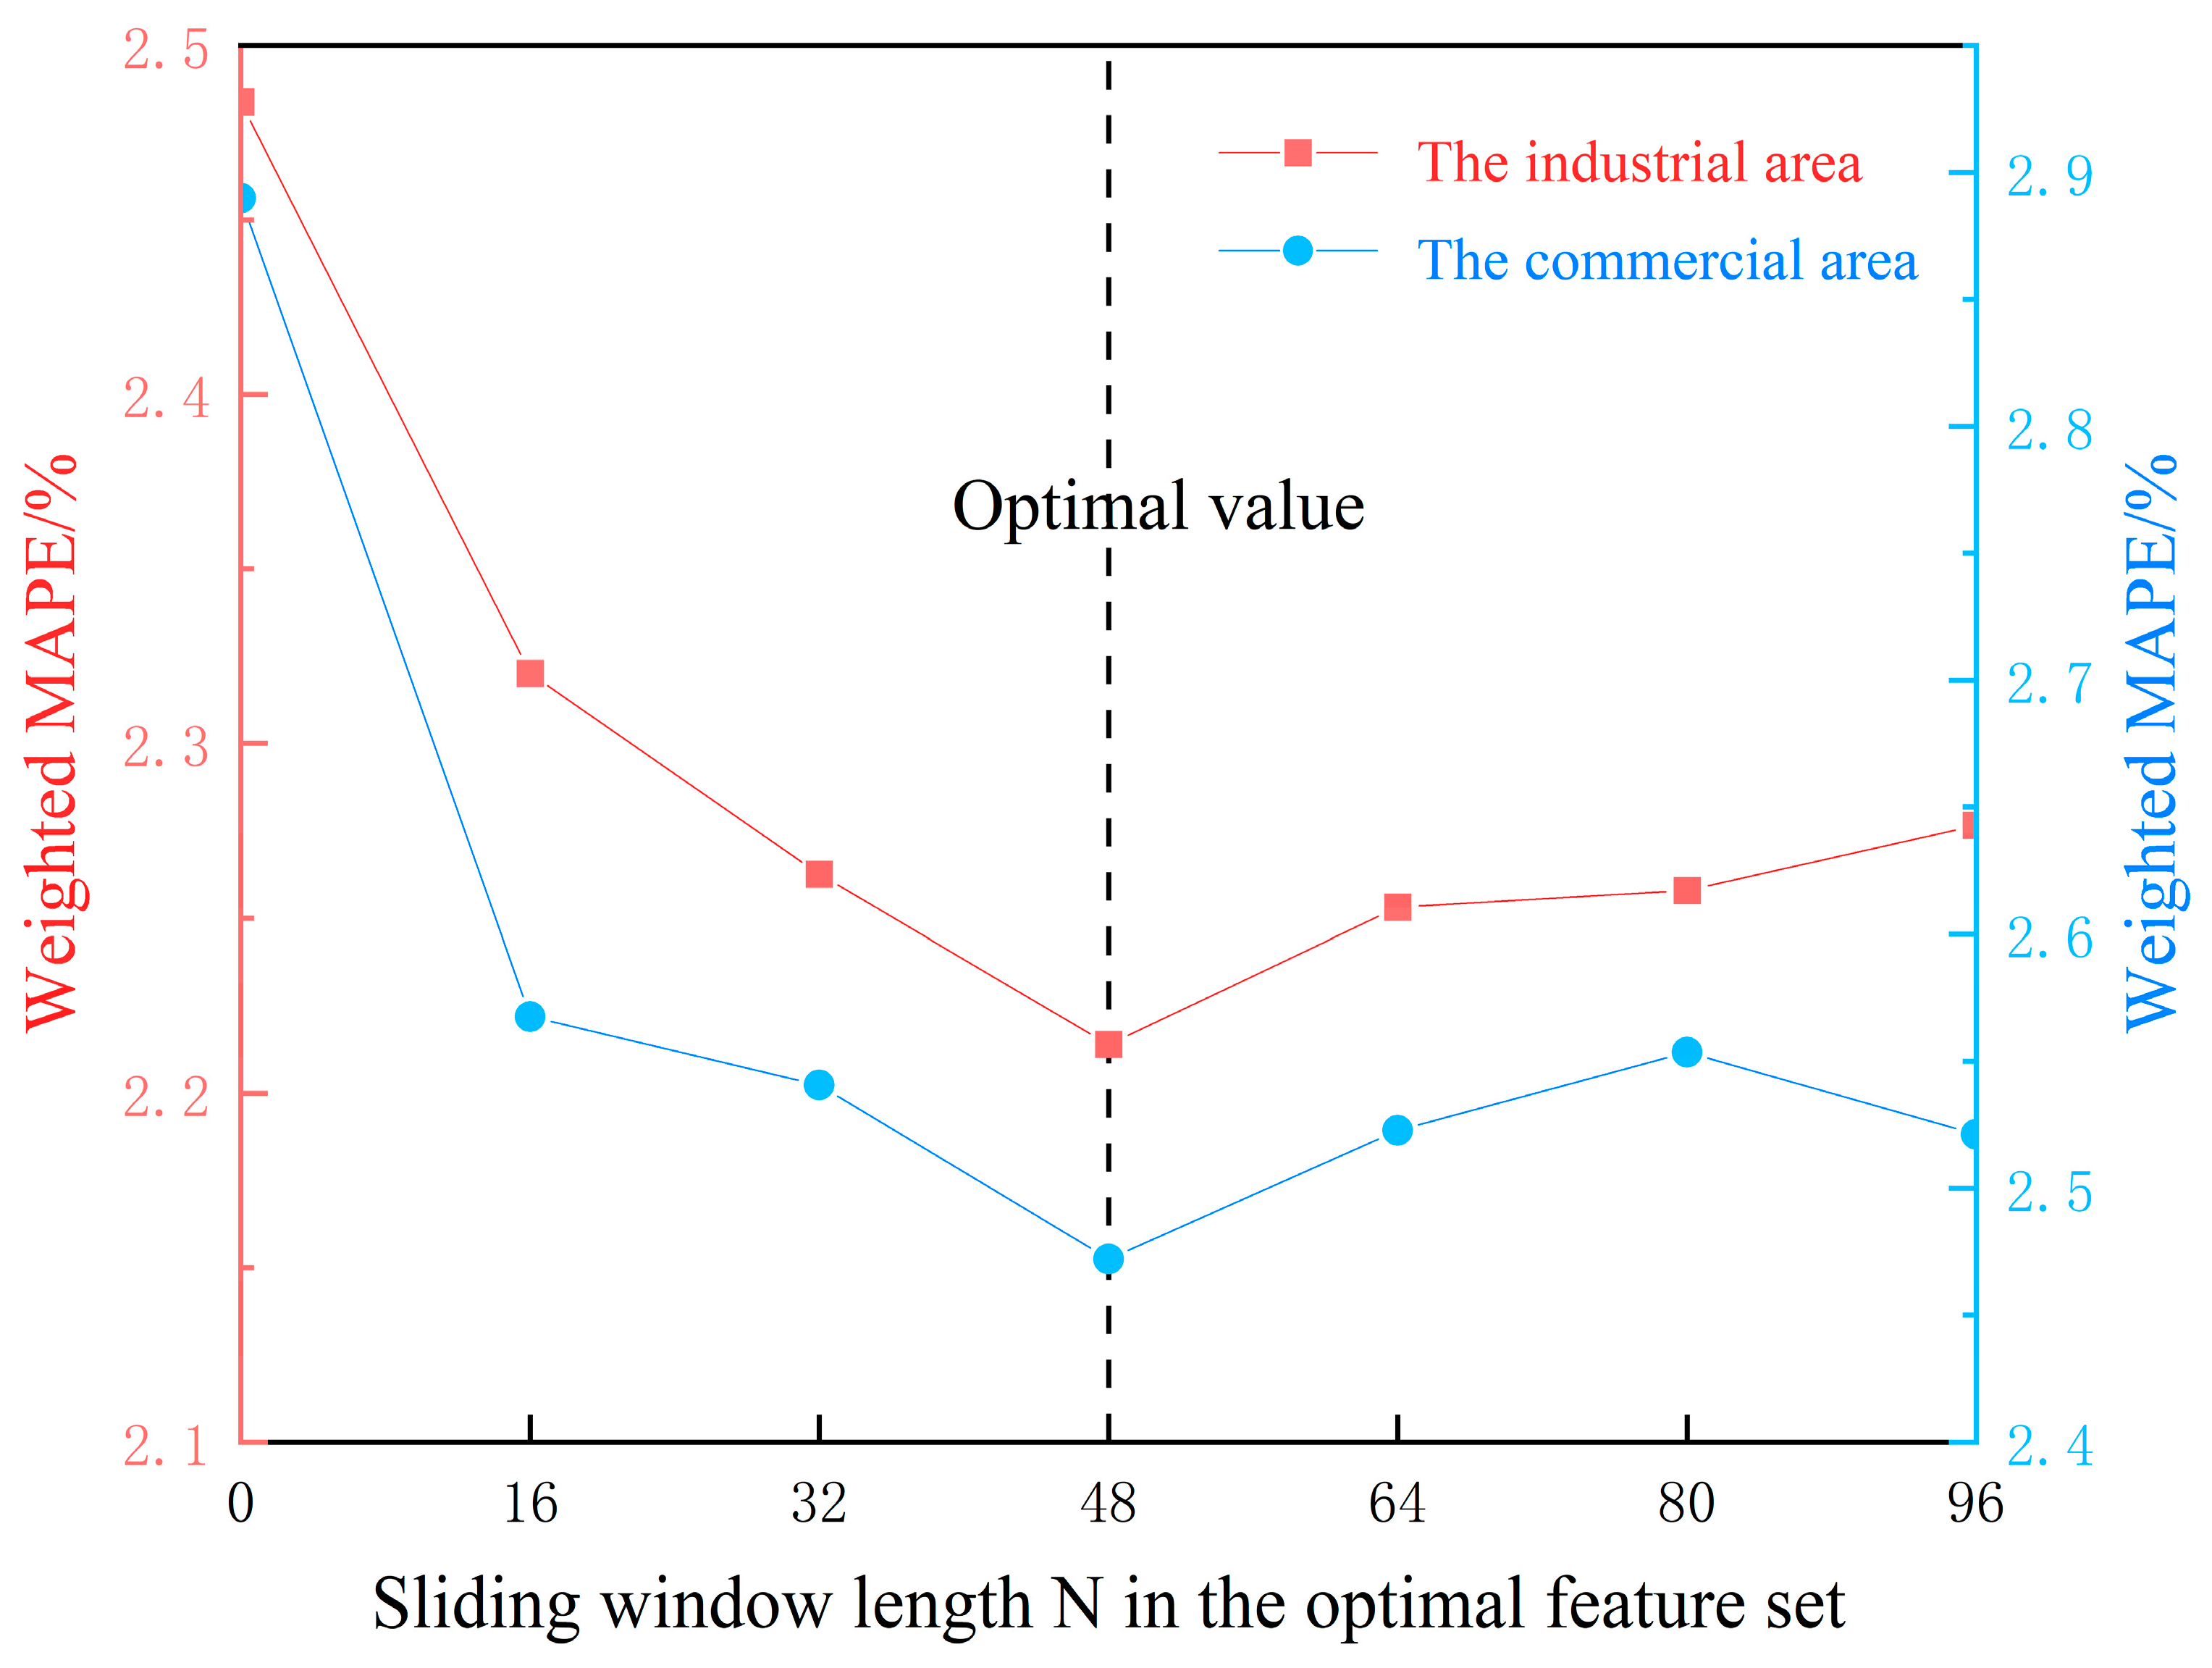
By varying the length N of the sliding window within the optimal feature set, prediction errors are evaluated across different values of N (Figure 13). Minimum prediction errors are achieved for the industrial and commercial areas when N = 48. Therefore, this study selected N = 48 for subsequent experiments.
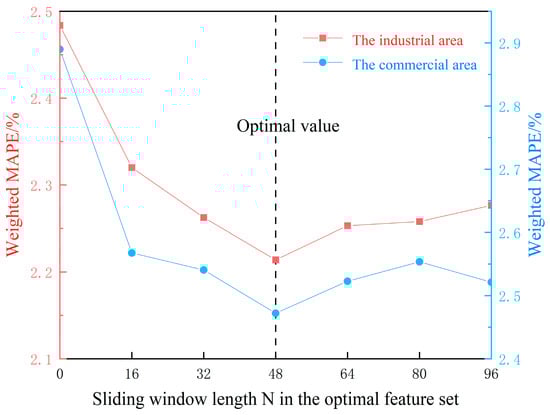
Figure 13.
The effect of sliding window length on the prediction error.
4.3. Comparative Analysis of Prediction Results Using Different Forecasting Method
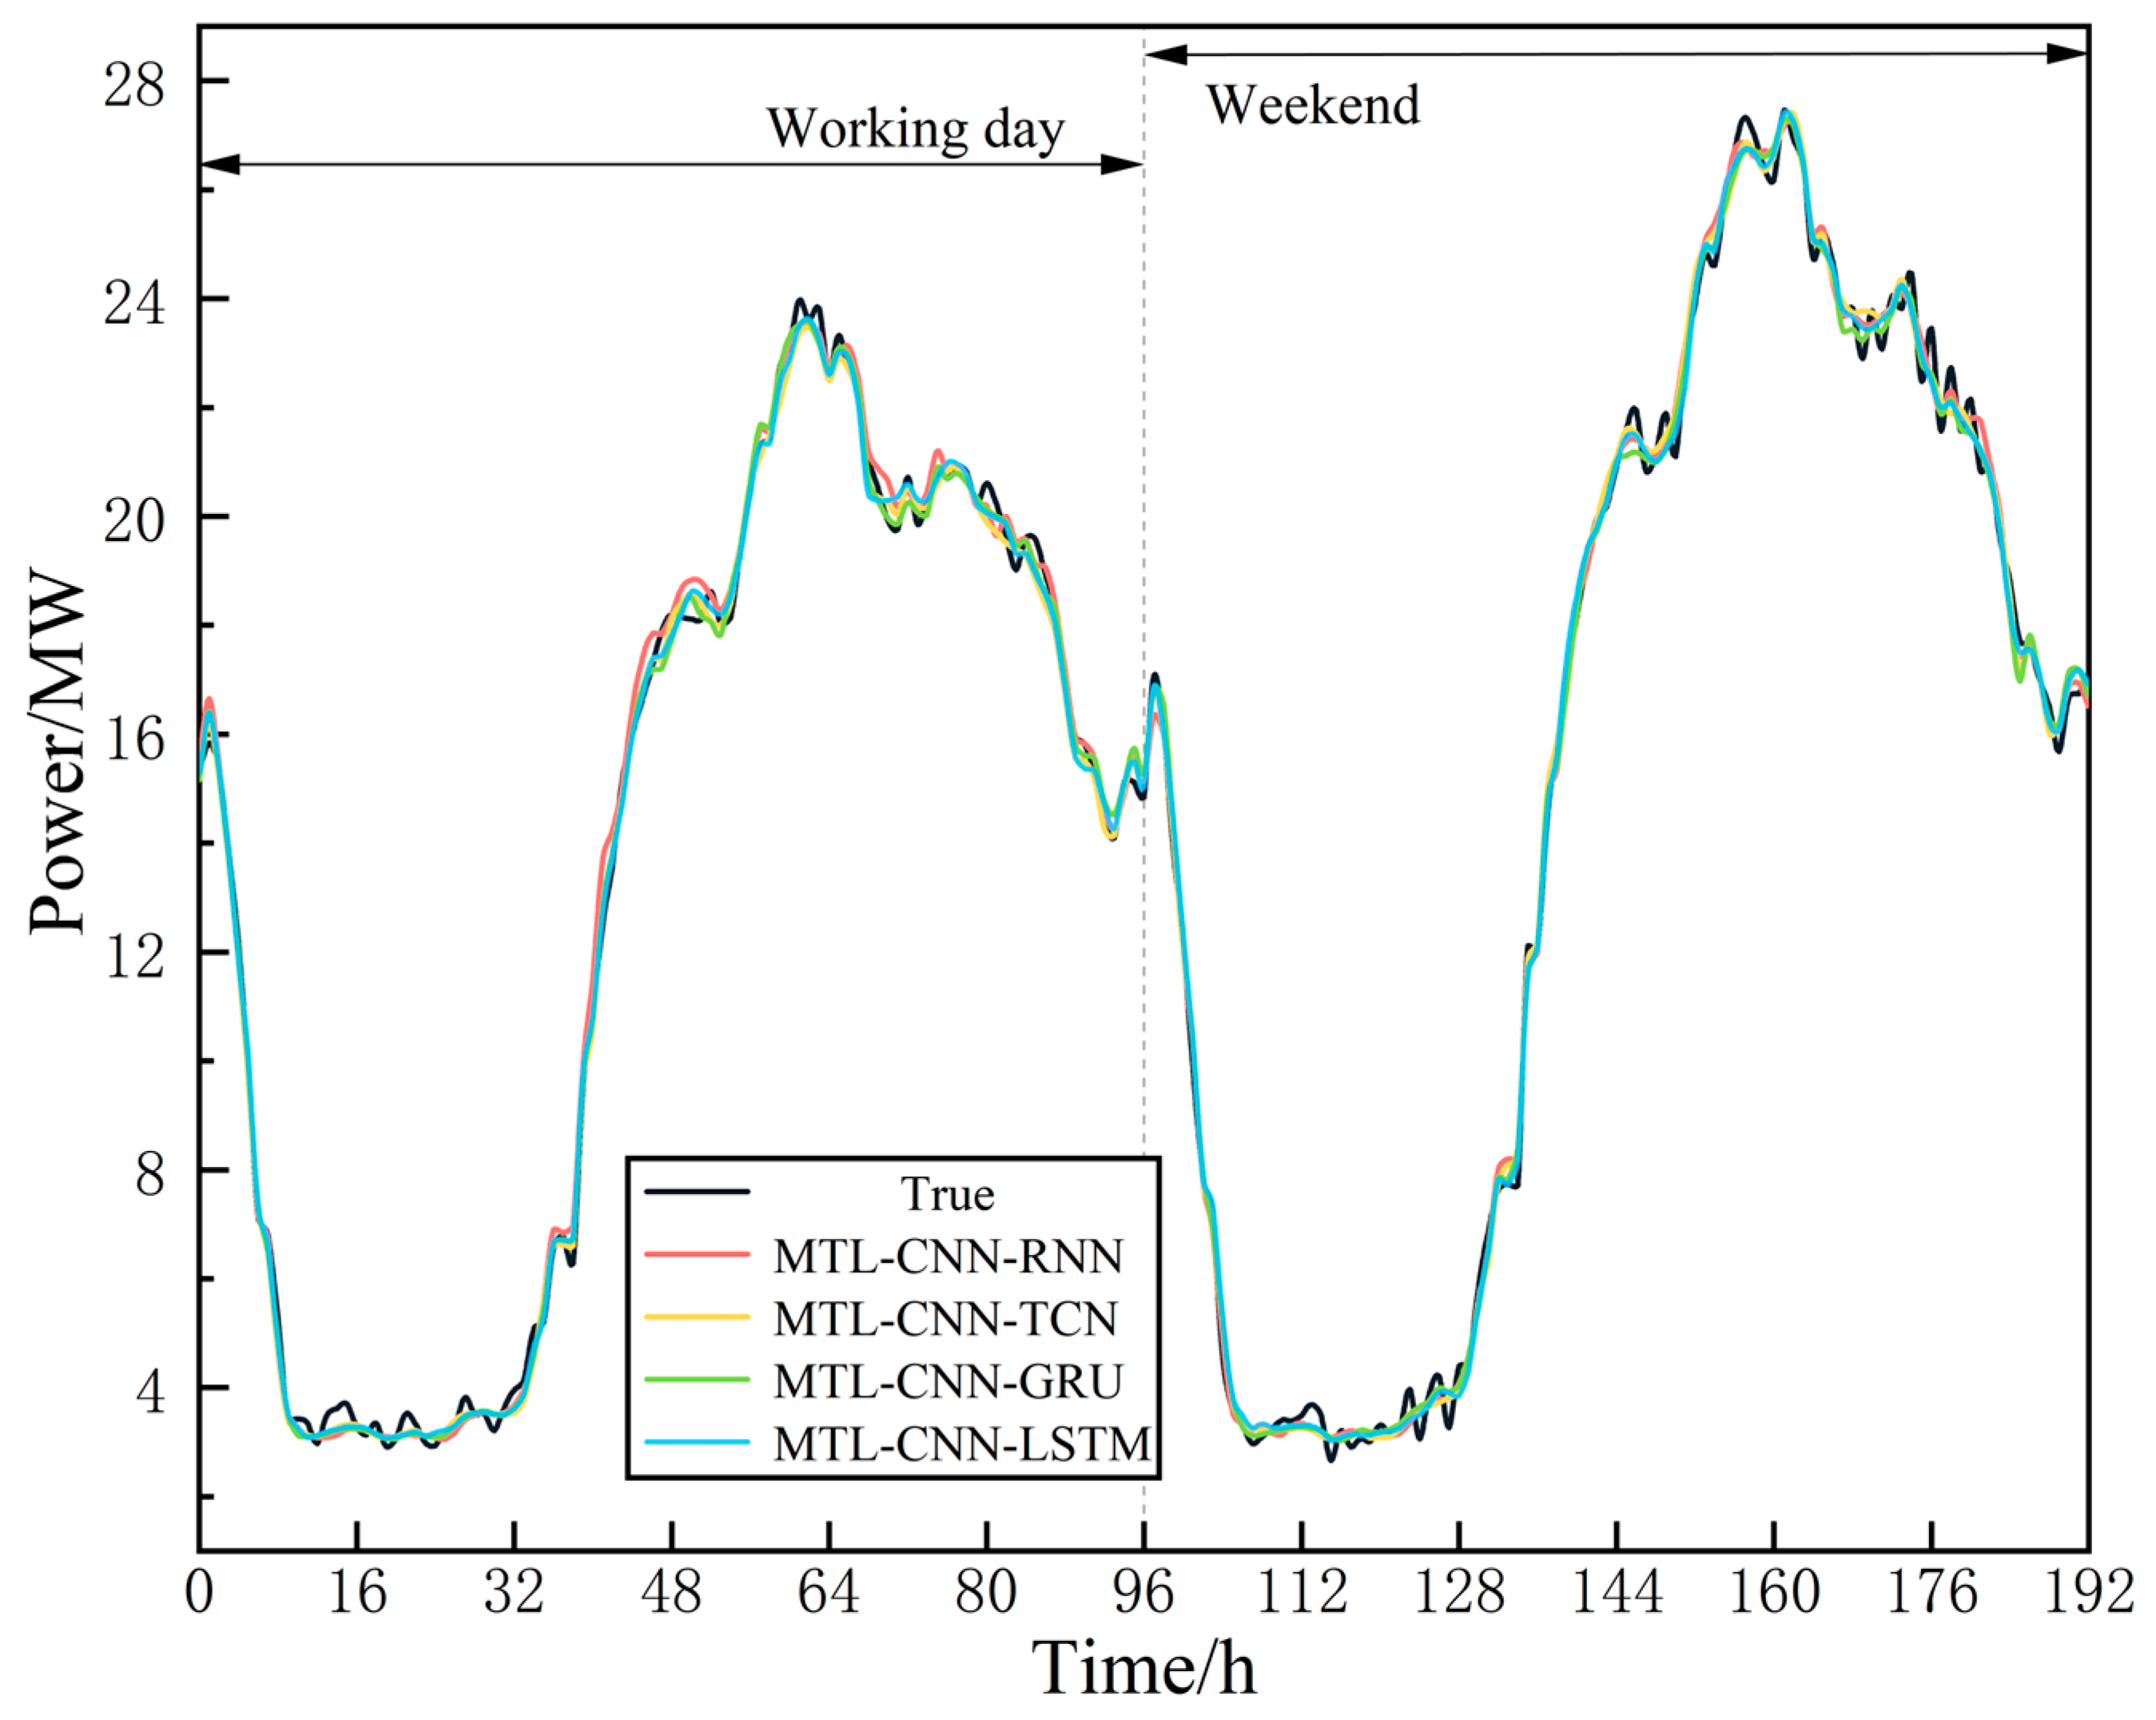
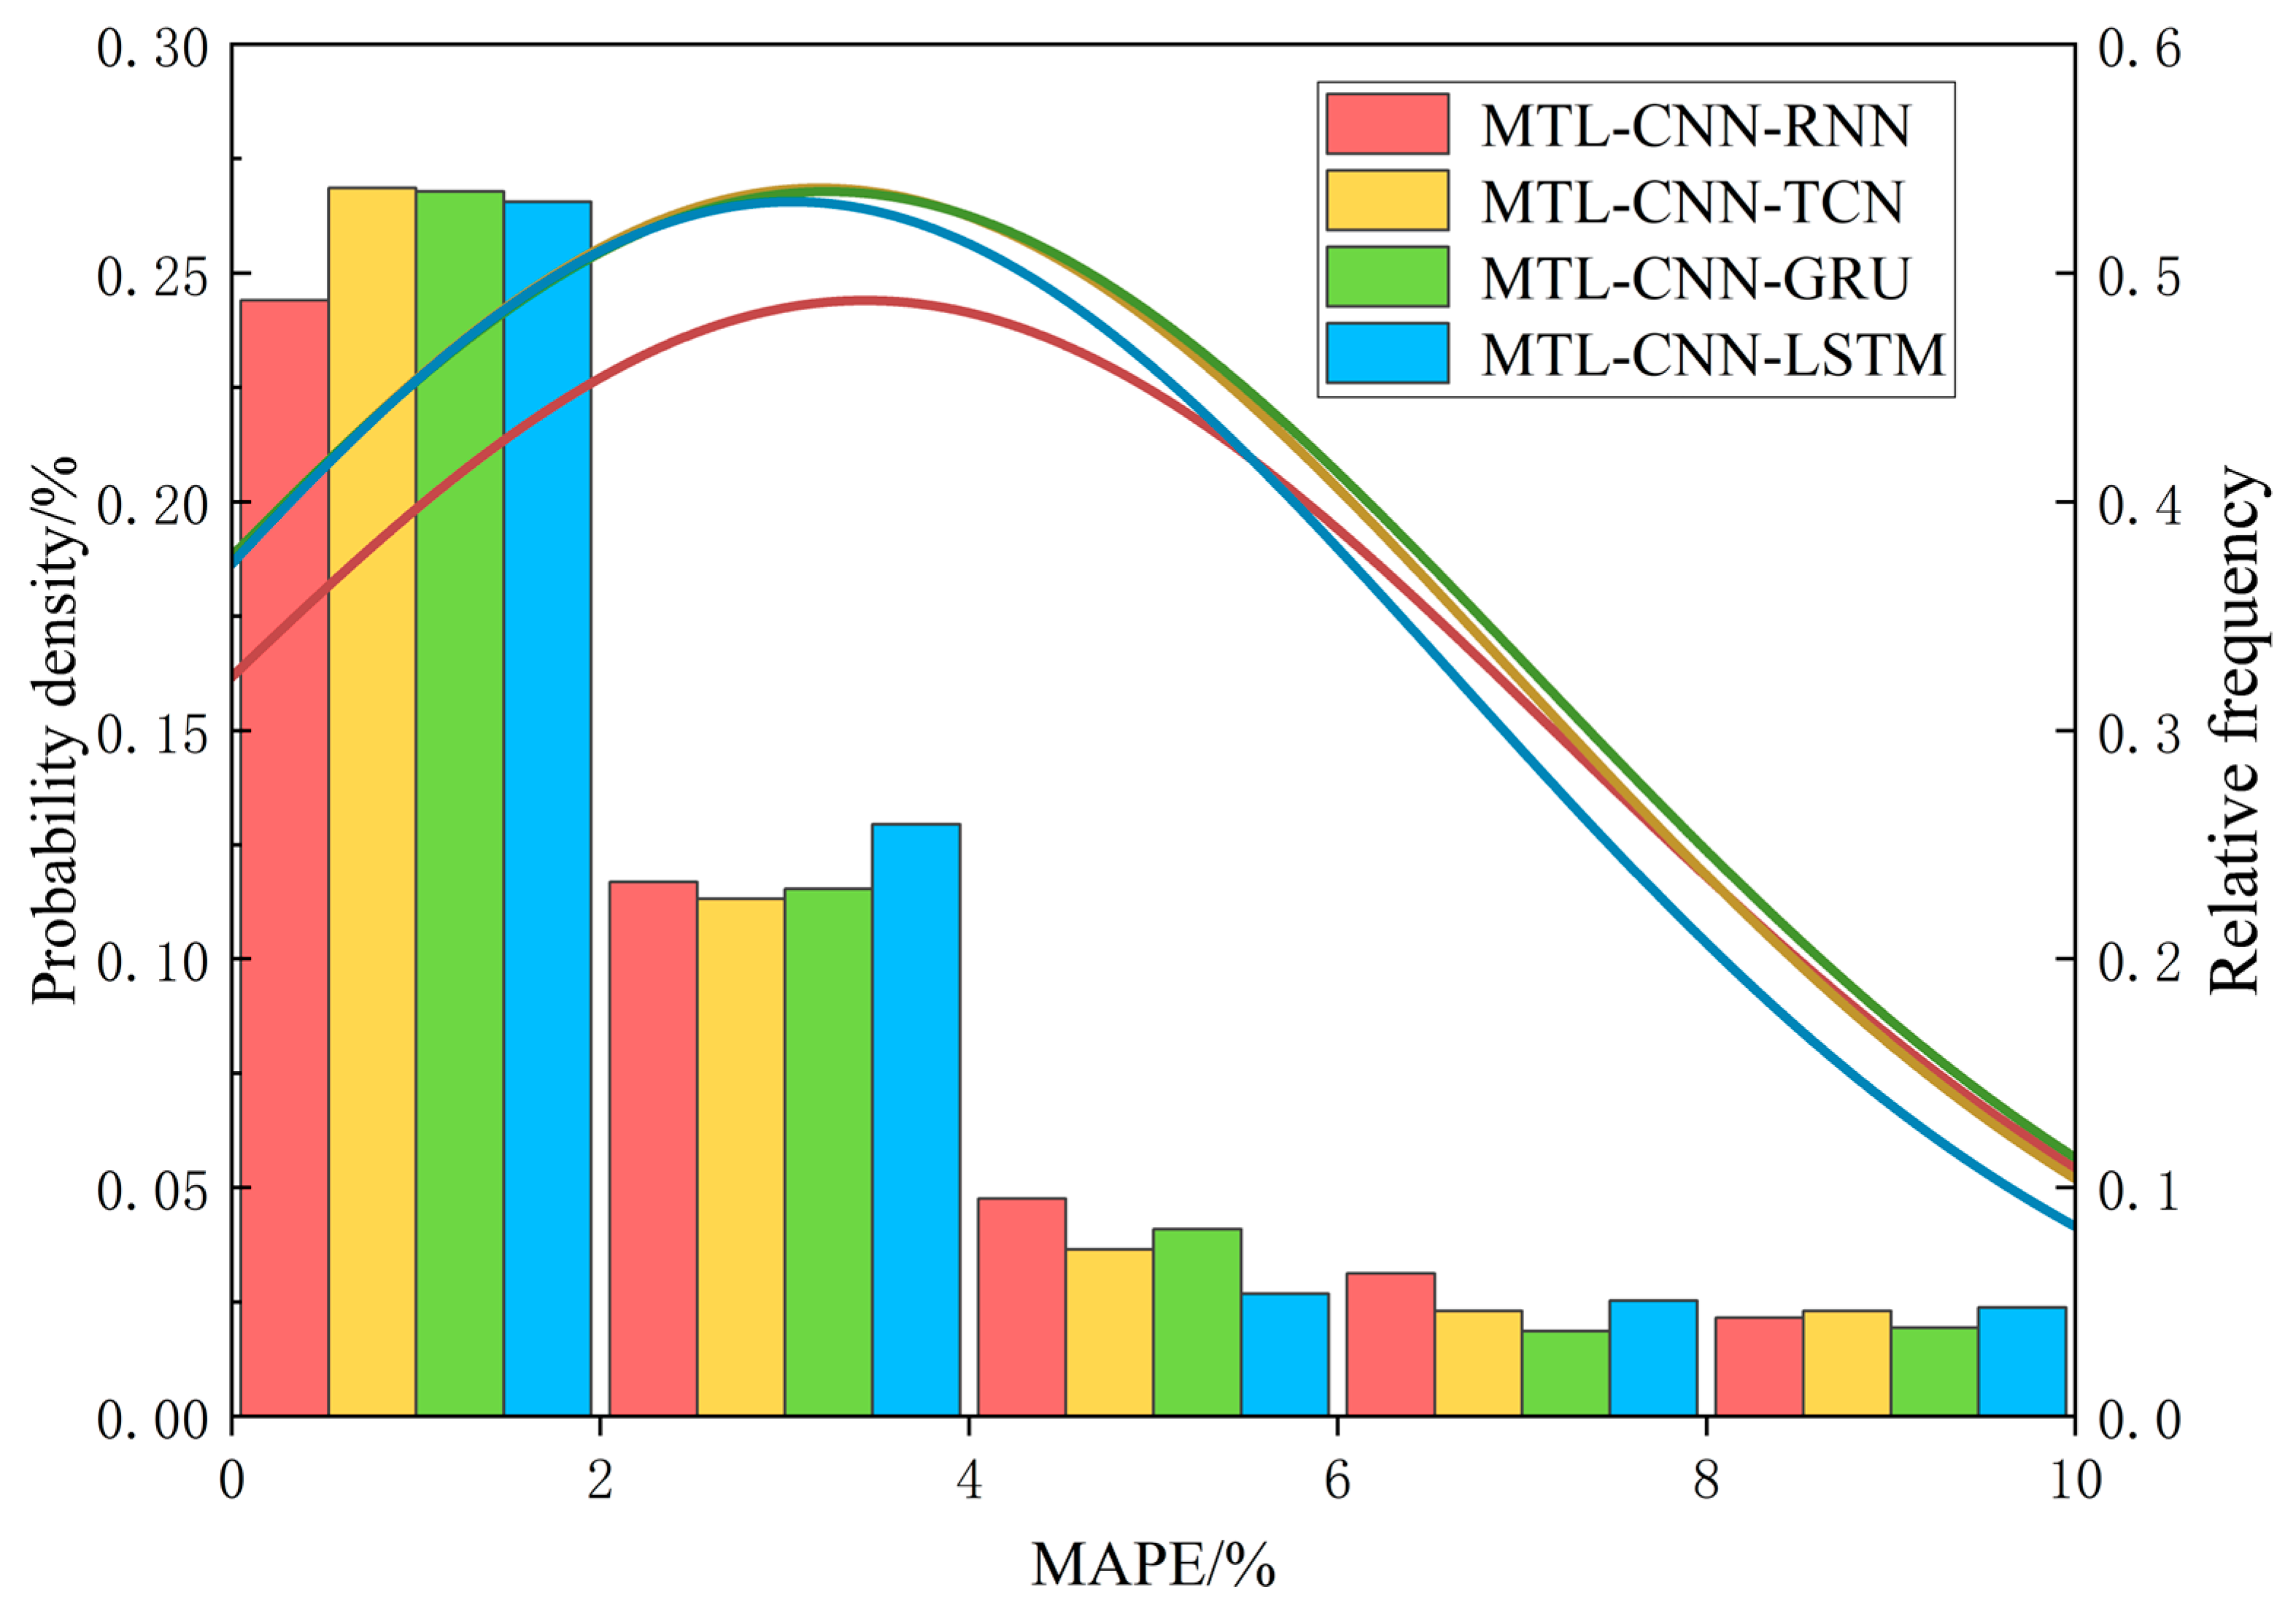
As the task-specific output layer in multi-task learning governs the prediction outcomes of each task, the accuracy of our proposed approach is evaluated by comparing it with commonly used RNN, GRU, and TCN models, known for their efficacy in time series prediction. For commercial area cooling load as the case study, the prediction curves of various forecasting methods are depicted in Figure 14, and their error distribution histograms and Gaussian distribution plots are illustrated in Figure 15.
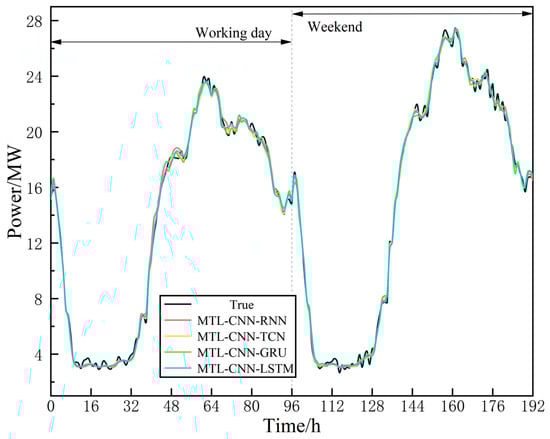
Figure 14.
Comparison of the effects of choosing different algorithms for forecasting electrical loads in industrial areas at a specific task level.

Figure 15.
Comparison of the effects of choosing different algorithms for predicting cooling loads in commercial areas at a specific task level.
Figure 15 reveals that when the statistical interval length is two, it can be seen that the prediction errors of each model are mostly below 2% from the histogram analysis of prediction errors. Additionally, the Gaussian distribution plot of prediction errors, compared to other models, exhibits a leftward shift in the symmetry axis and converges more swiftly toward zero in regions with elevated prediction errors. These results indicate that the mean prediction error of our proposed model for the commercial area’s cooling load is lower than that of other models, and the distribution of the prediction error is more concentrated.
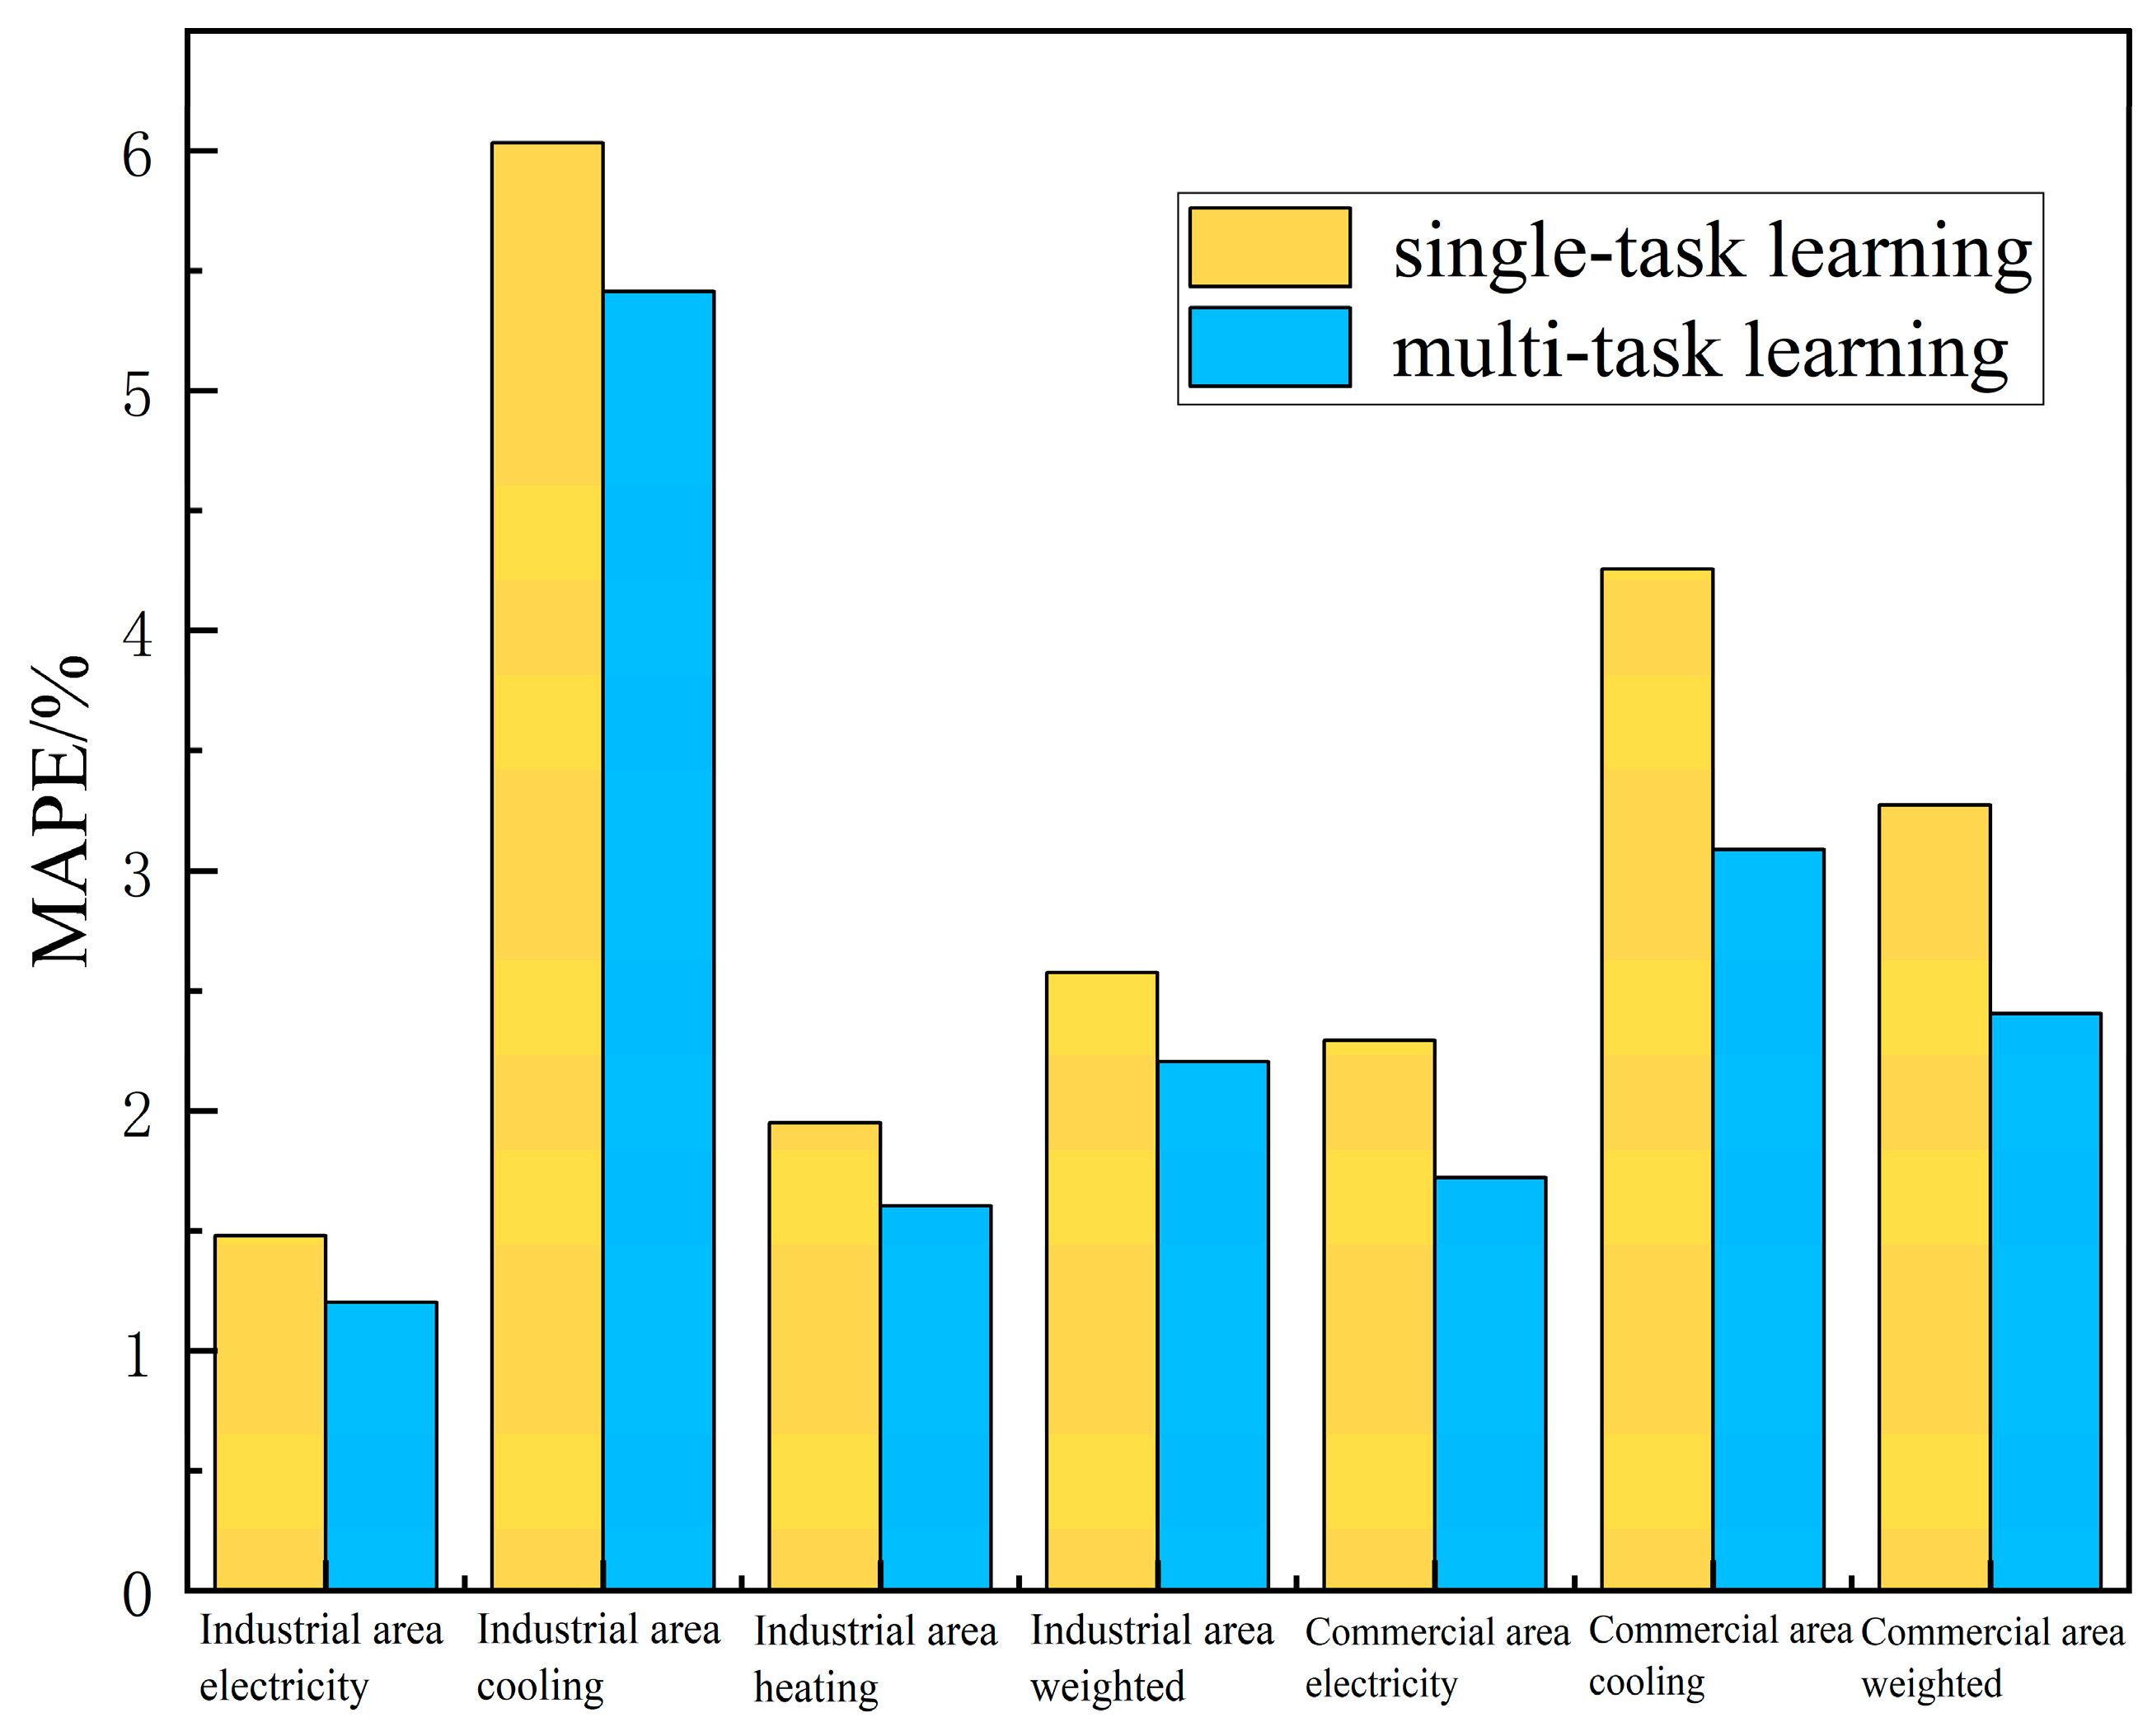
4.4. Comparative Analysis between Single-Task Learning and Multi-Task Learning
Comparative analysis between single-task learning (STL) [Appendix A] and MTL was conducted through simulations, with the prediction errors of both approaches on the test set presented in Table 1 and Figure 16. Relative to single-task learning, the multi-task learning mode reduces the weighted error of electric, cooling, and heating loads in industrial zones from 2.578 to 2.187, which is a reduction of 17.9%. In addition, the weighted error of electric and cooling loads in commercial zones is reduced from 3.275 to 2.357, which is a reduction of 38.9%. Simulation comparisons show that under the connection of contact lines and optical fibers, the integrated energy system of interconnected parks has strong coupling characteristics of electric cooling and heating loads within their respective parks and a specific correlation of loads between the parks. If the correlation of loads between parks is ignored and single-task learning is used to model each park individually, the prediction error will increase. Using multi-task learning to model the interconnected system of multi-energy parks jointly allows the load forecasts of different parks to learn from each other to extract good features, i.e., to extract high-dimensional integrated features among them in the shared CNN layer and pass them to the parallel LSTM layer, to improve the load forecast accuracy of the whole system.

Table 1.
Prediction errors for single-task learning and multi-task learning.
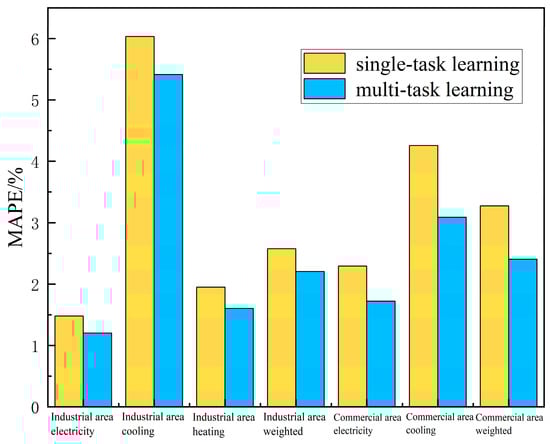
Figure 16.
Comparison of load prediction error for STL and MTL.
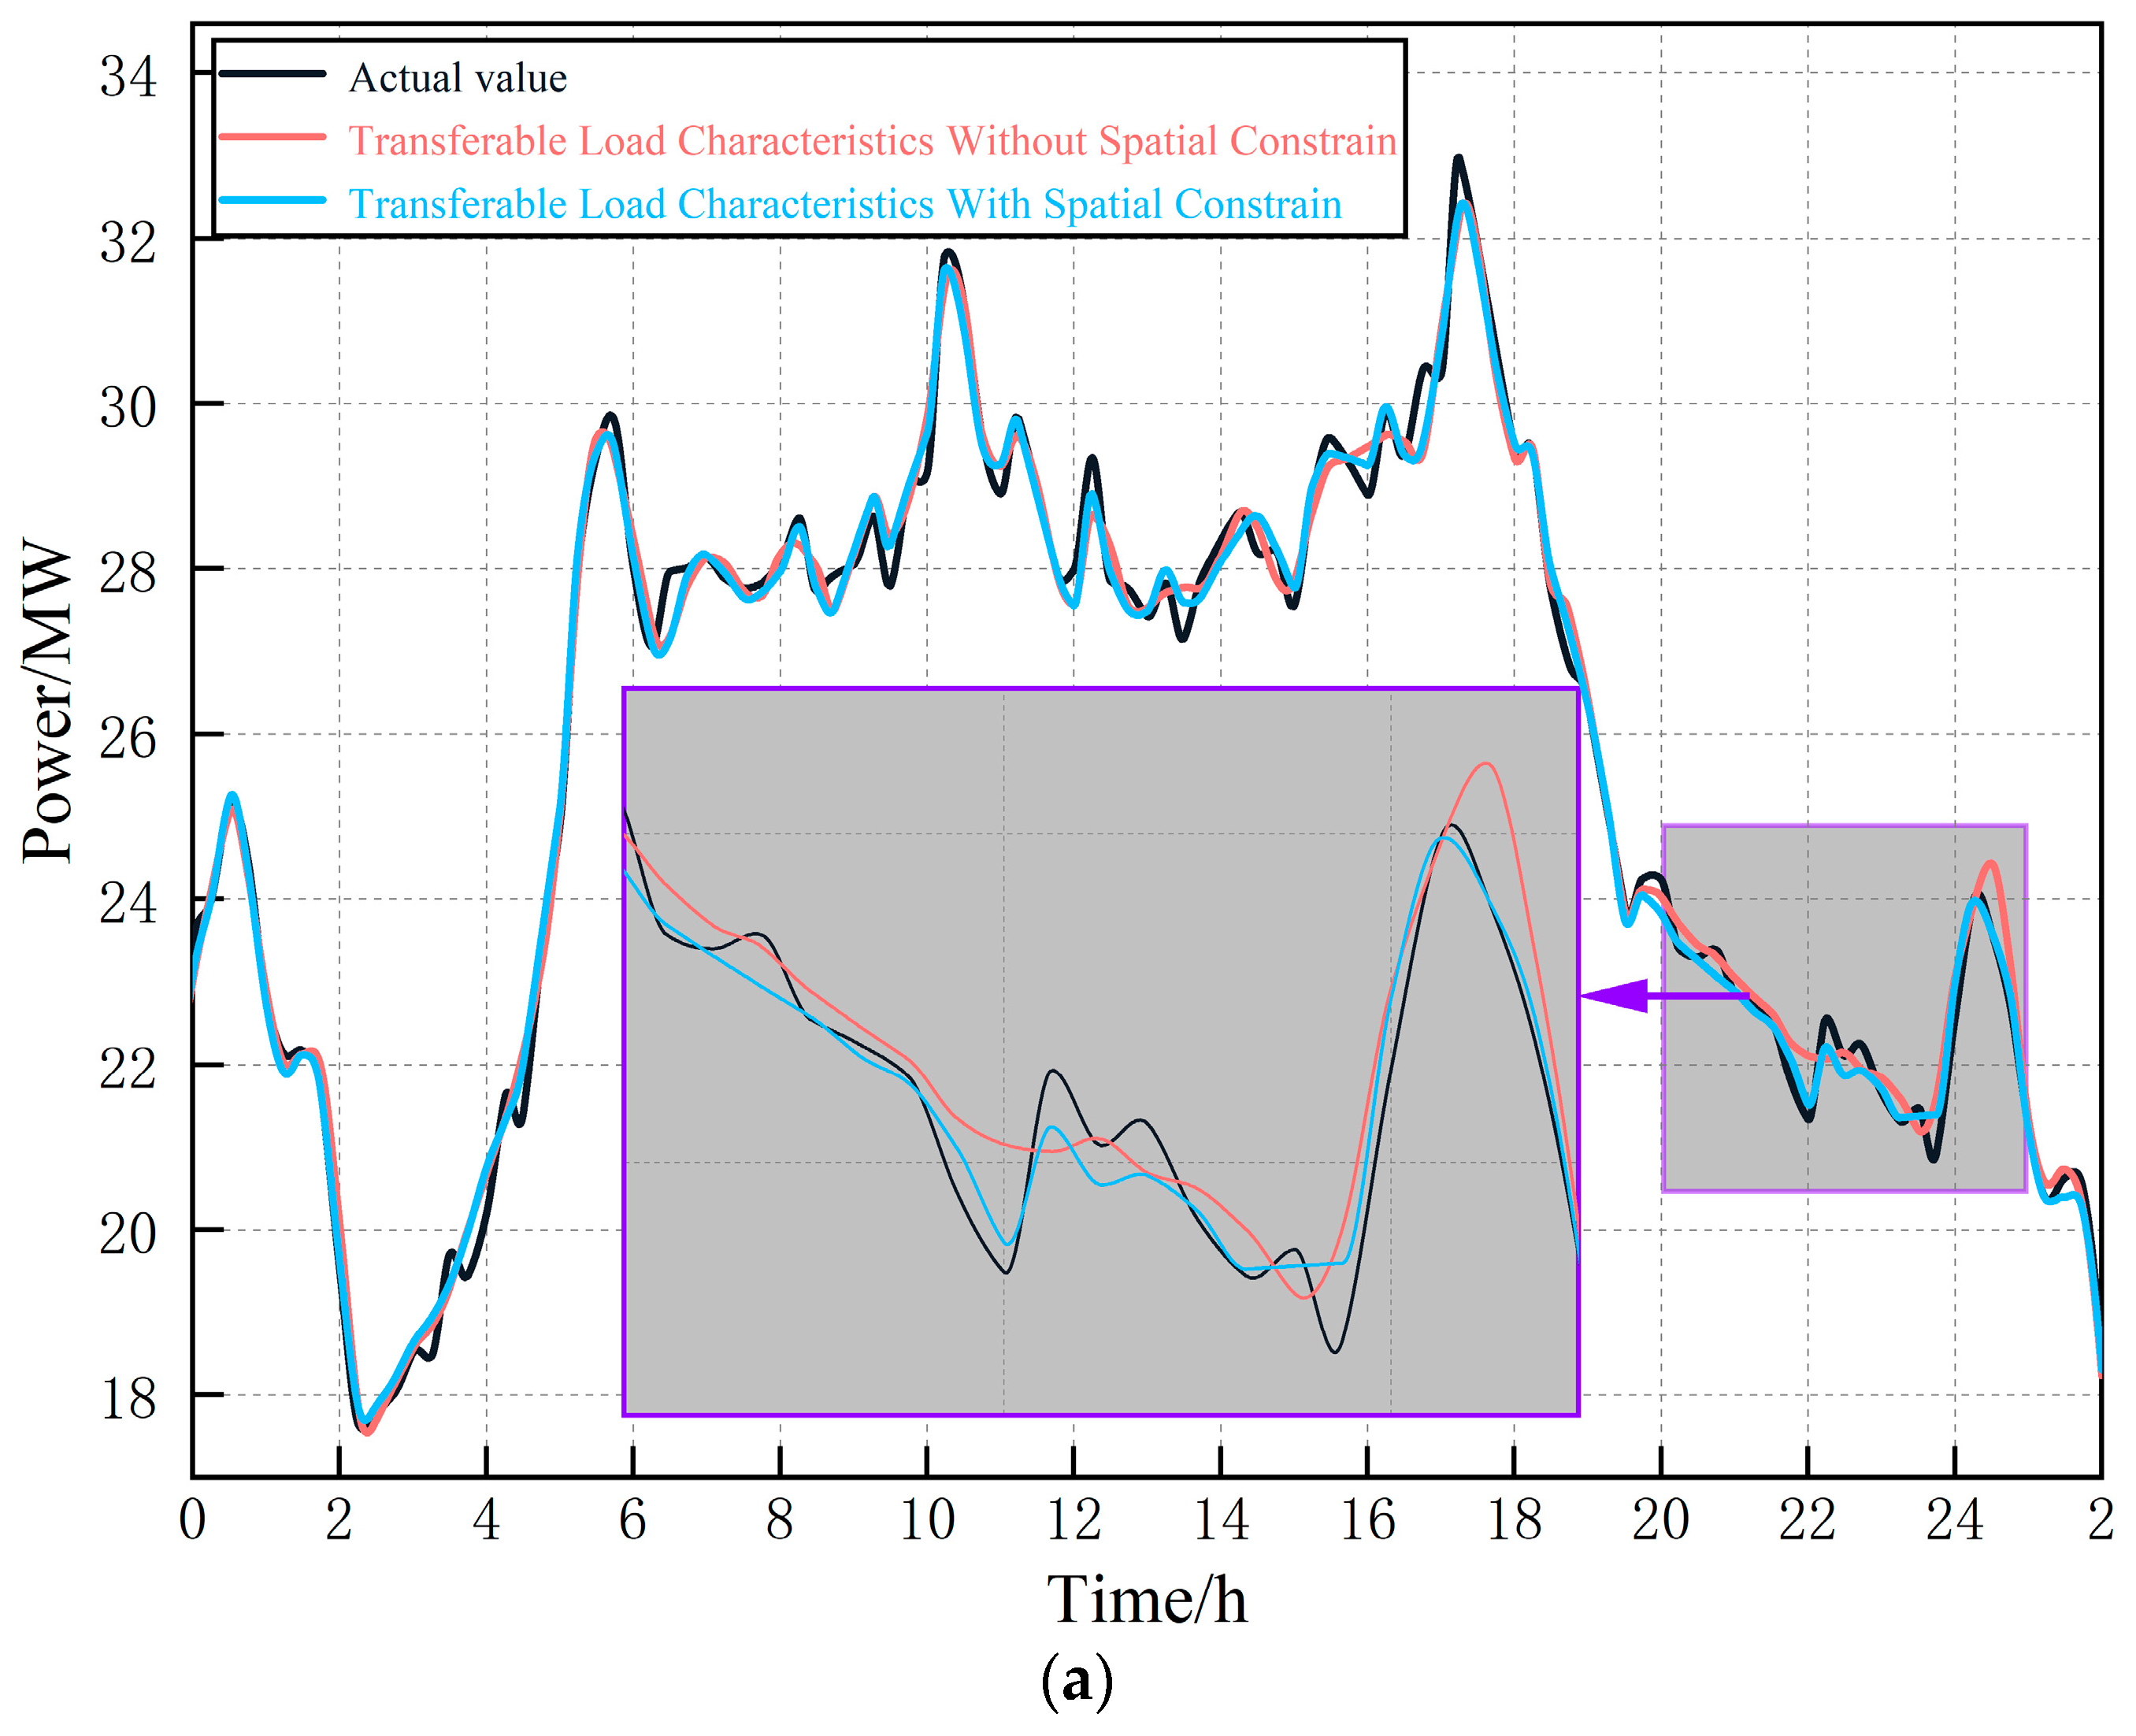
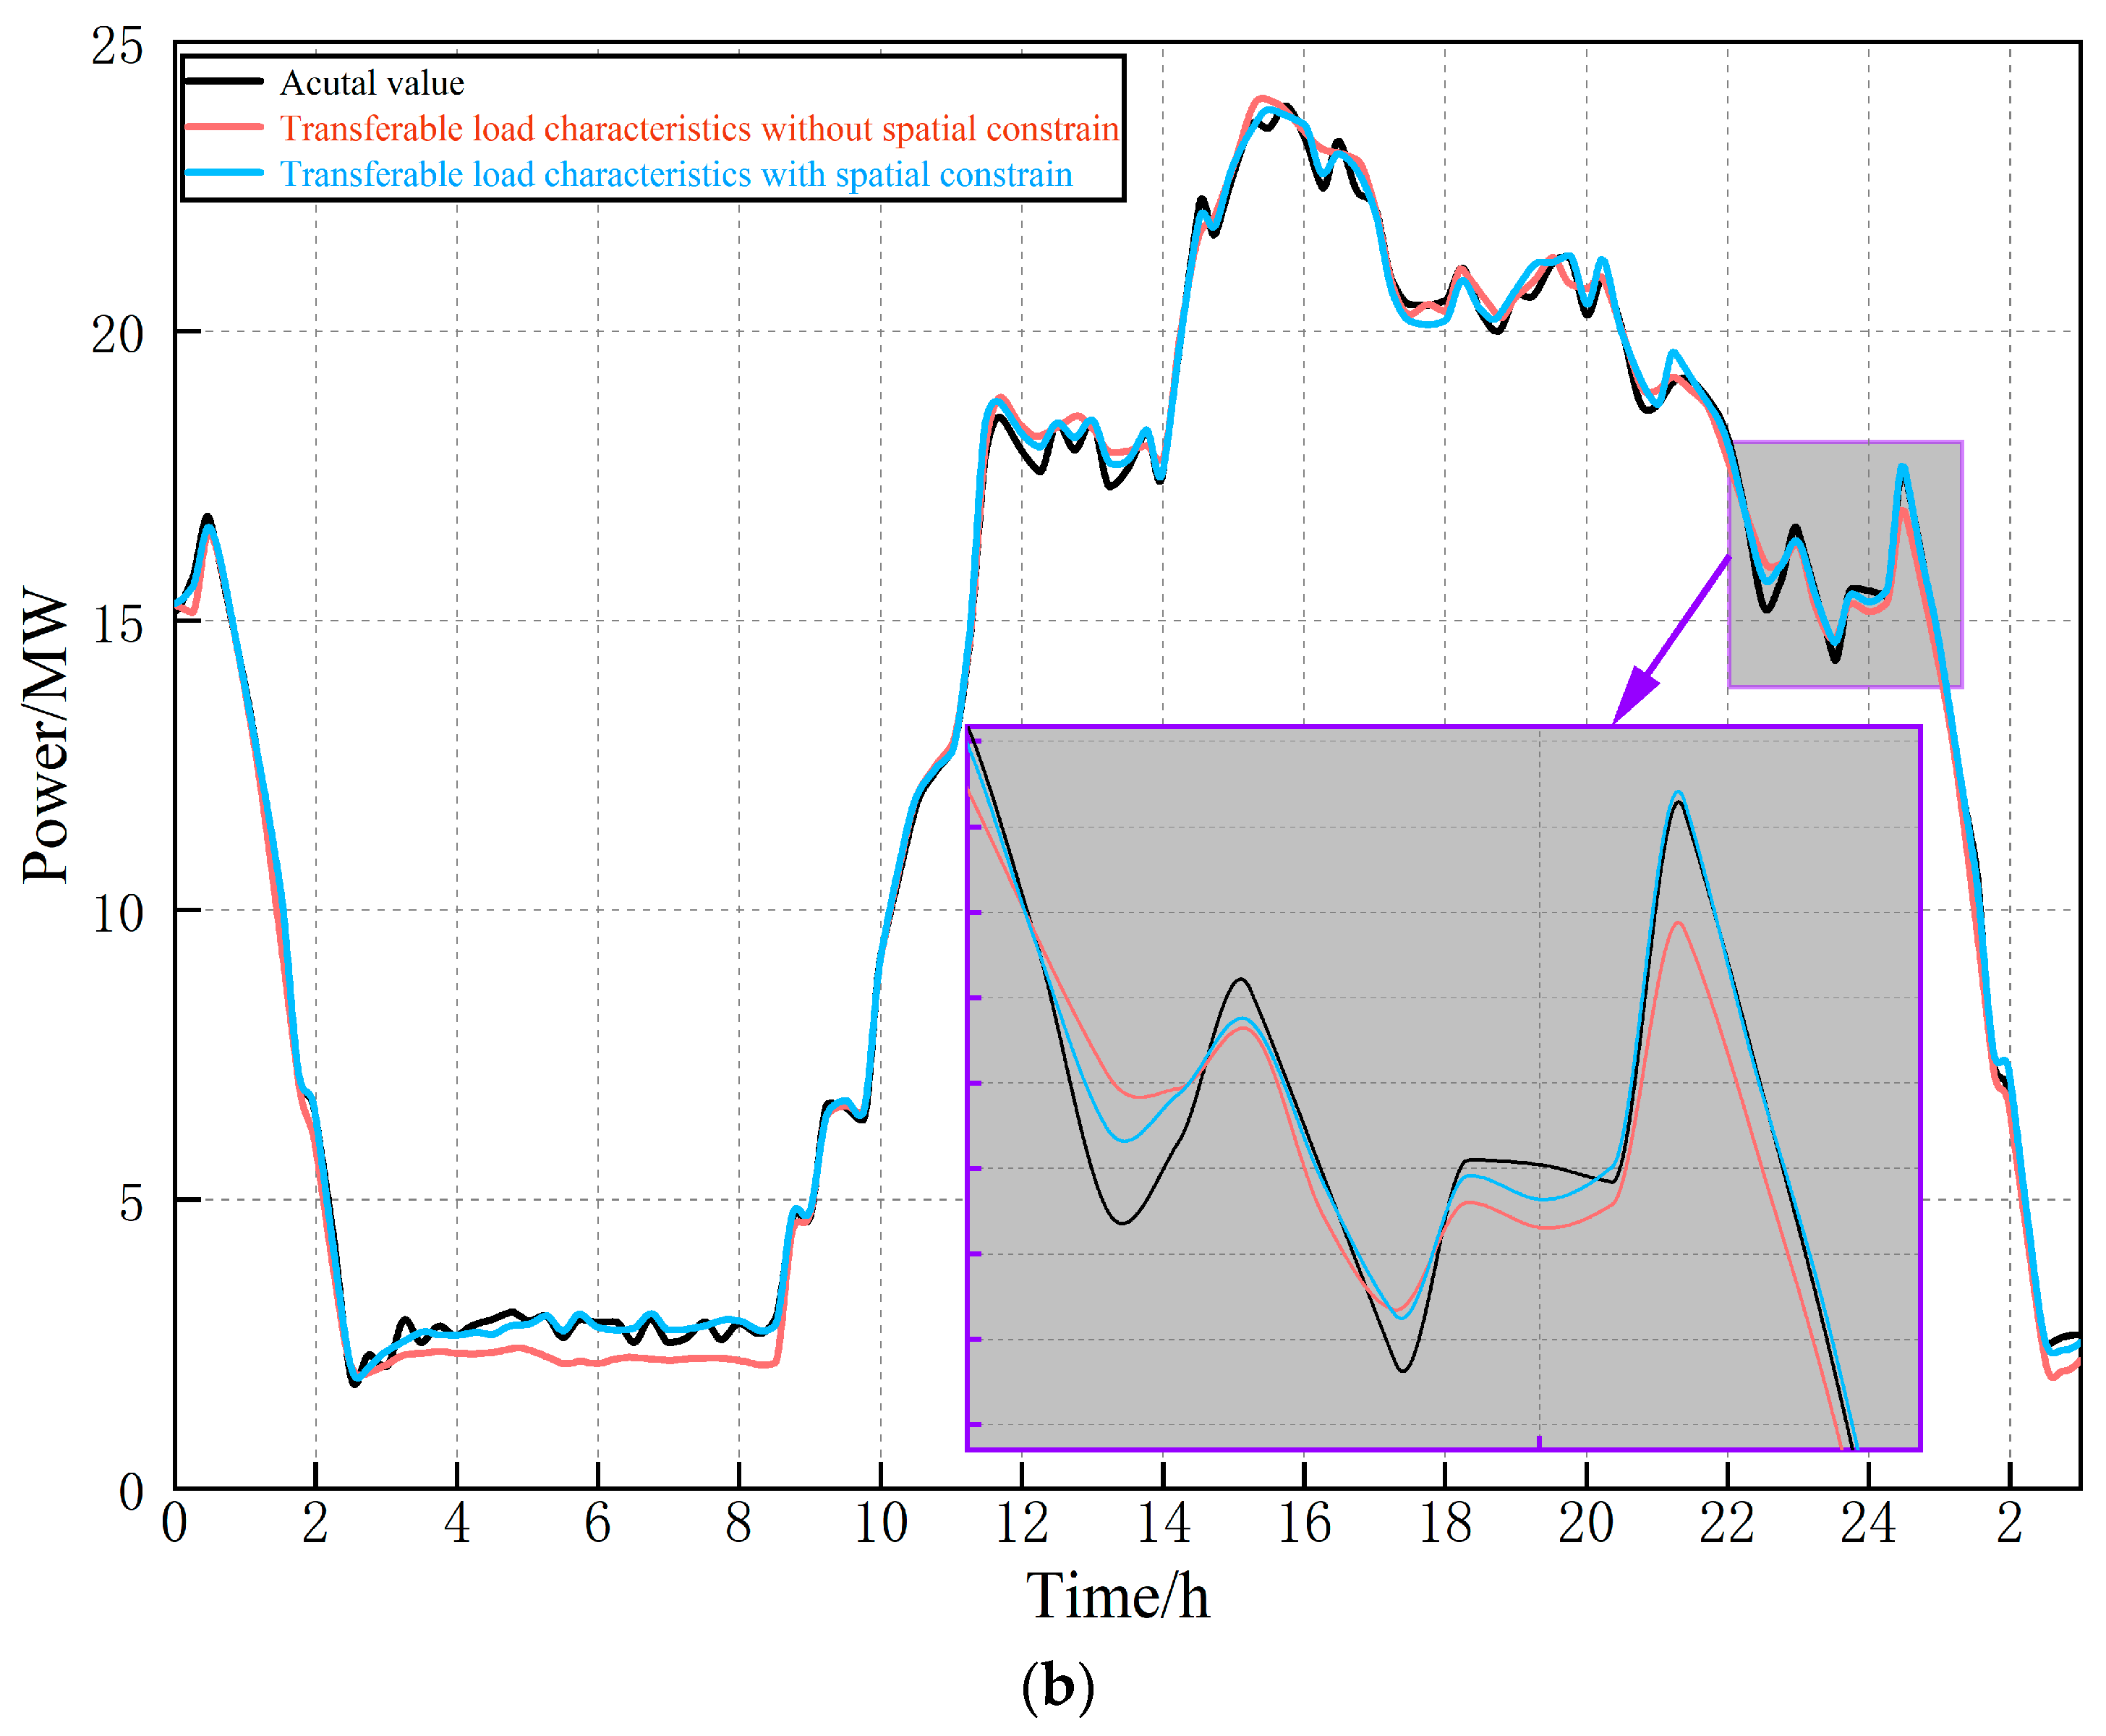
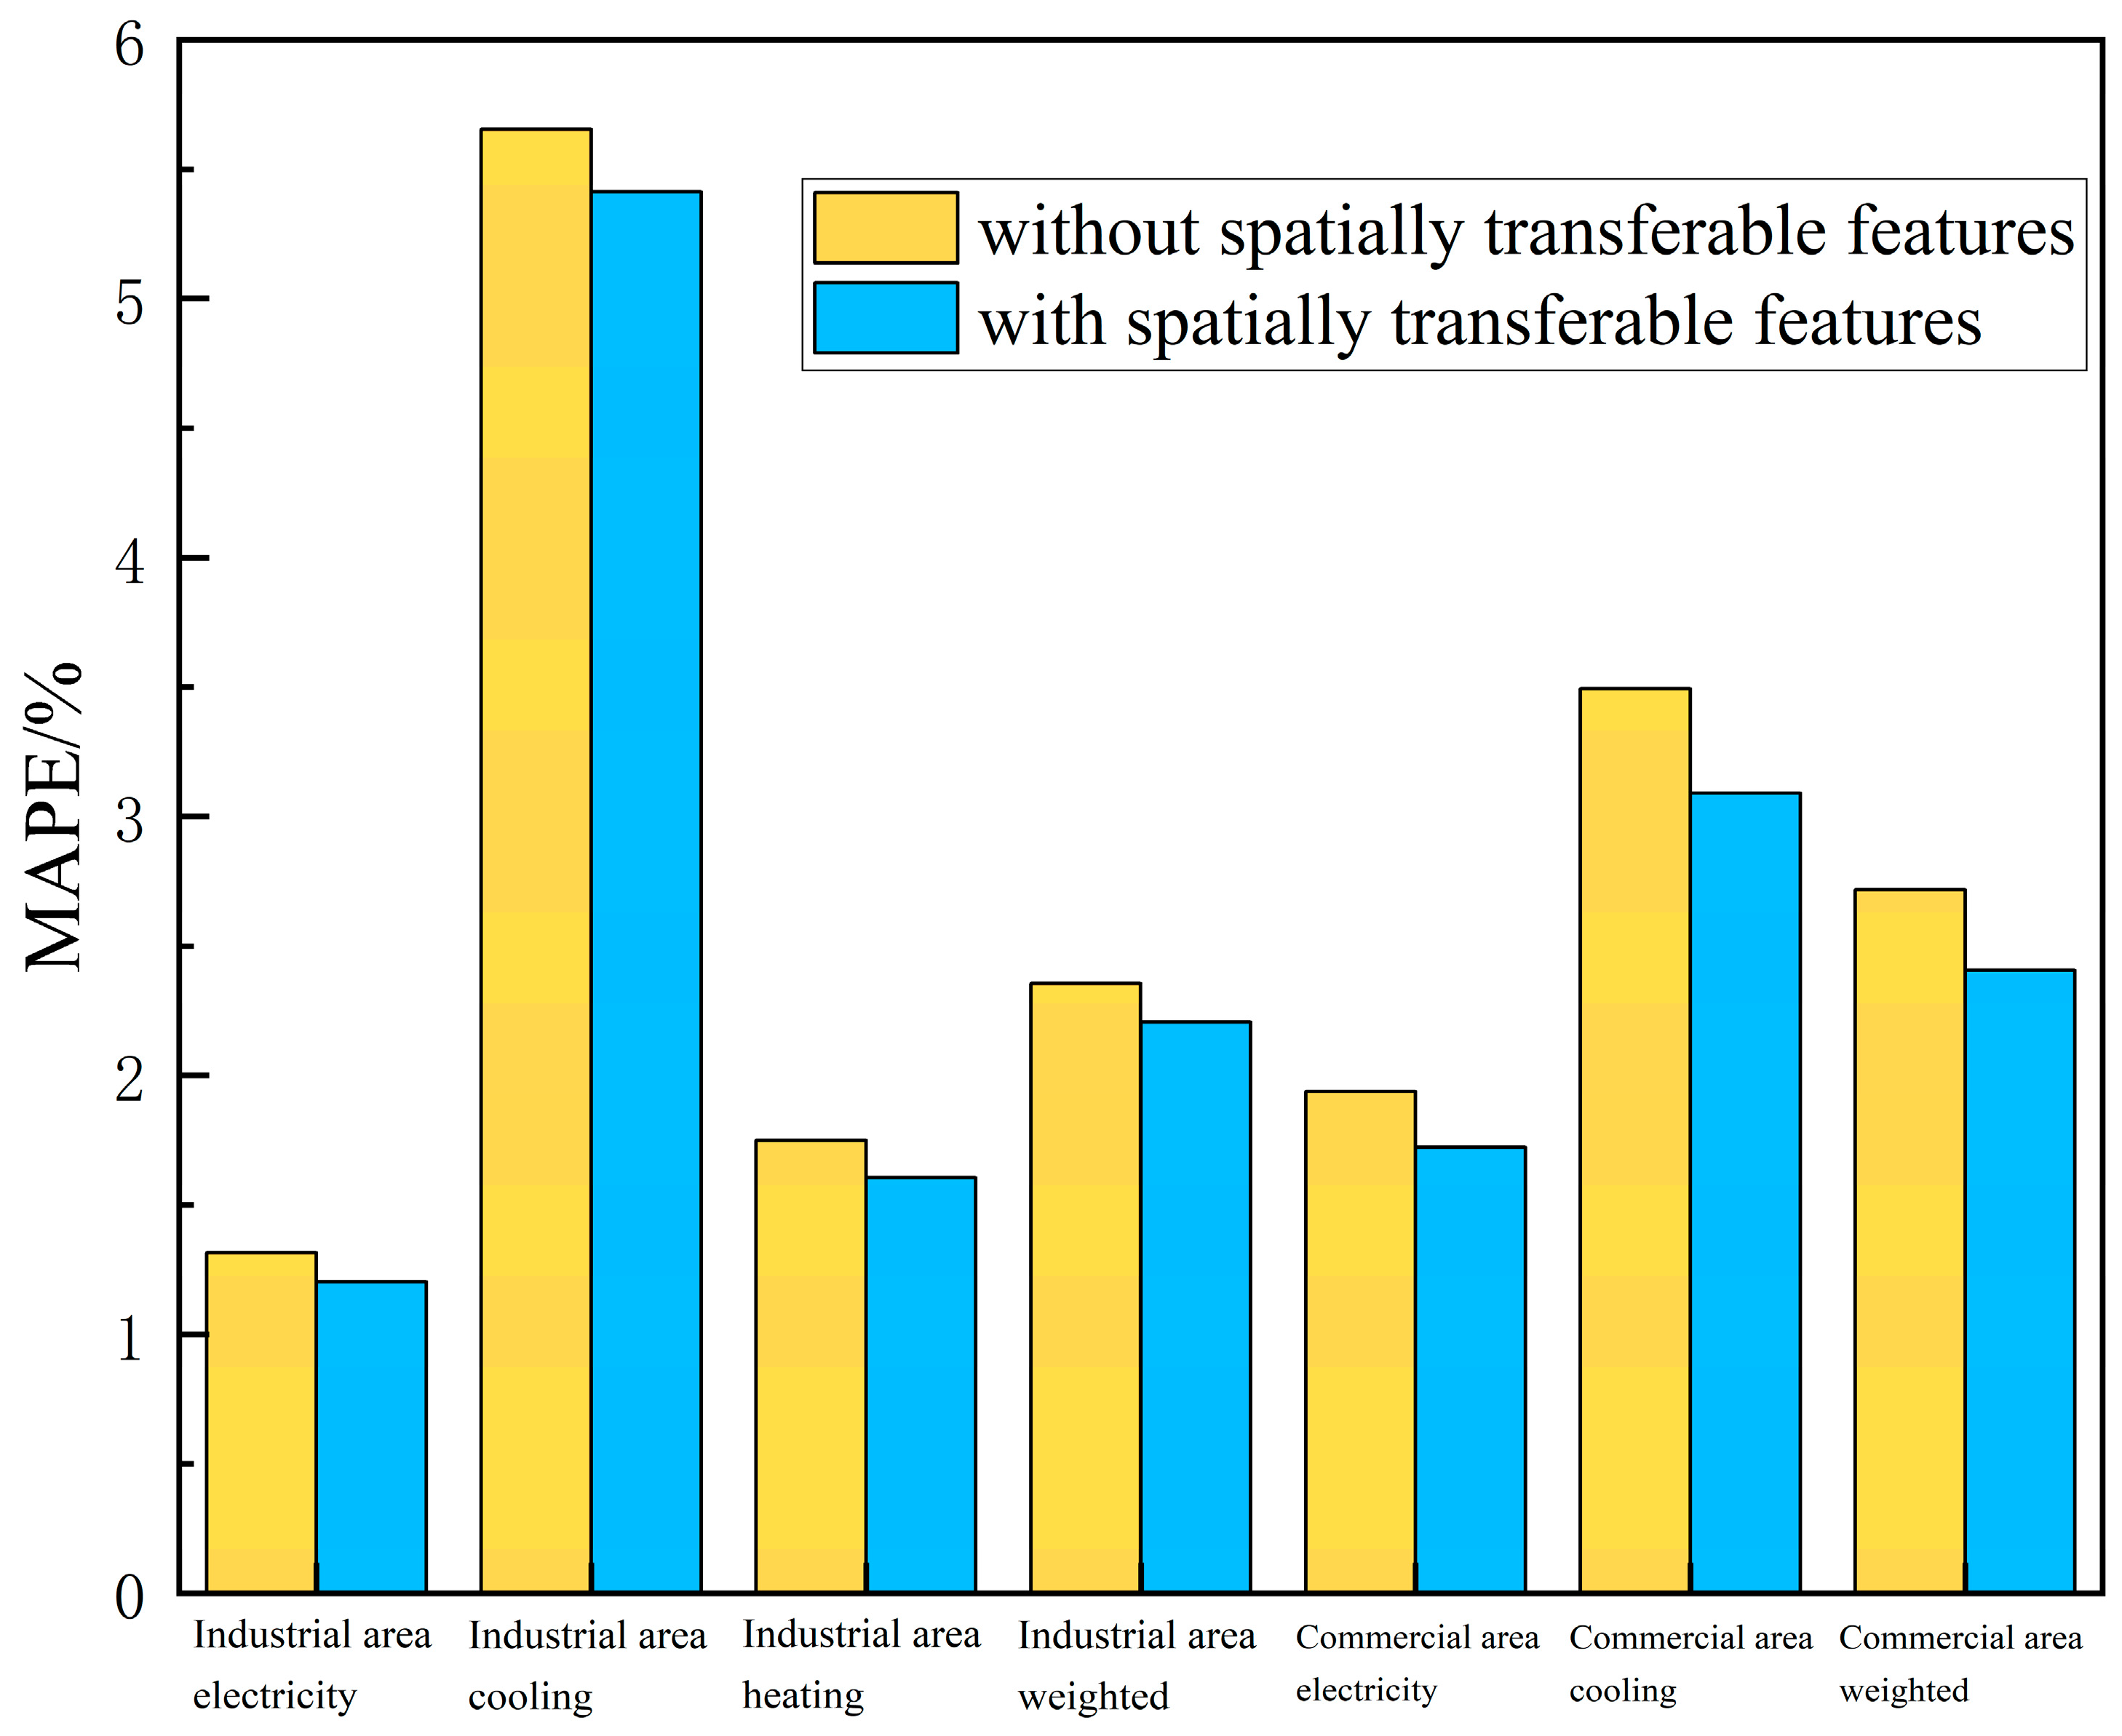
4.5. Analysis of the Impact of Spatial Transfer Characteristics on Prediction Performance
Comparative simulations were conducted to evaluate models with and without incorporating IDC spatial transfer feature parameters. Figure 17 and Figure 18 illustrate that integrating these parameters enhances the accuracy of predicting “peak” loads compared to models lacking these parameters. Additionally, models with these parameters significantly alleviate the “time lag” issue associated with peak tracking.
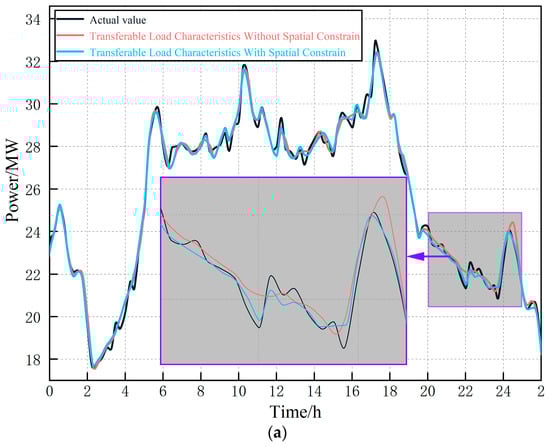
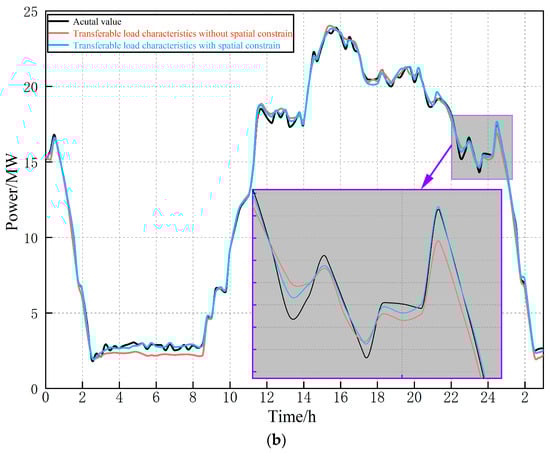
Figure 17.
The impact of spatially transferable characteristics on load forecasting. (a) Industrial area electricity load. (b) Commercial area cooling load.
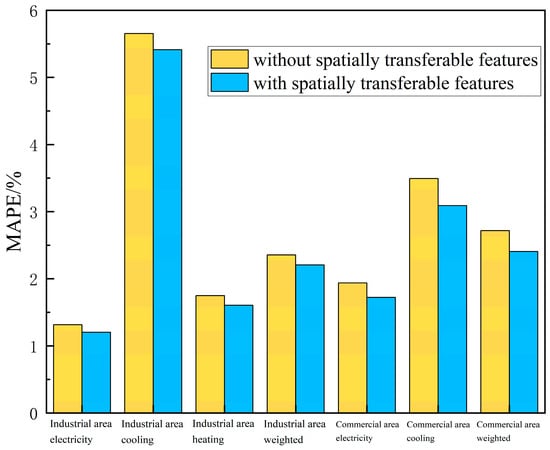
Figure 18.
The effect of spatially transferable characteristics on prediction error.
4.6. Analysis of the Impact of the Proportion of Spatially Transferable Loads on Prediction Results
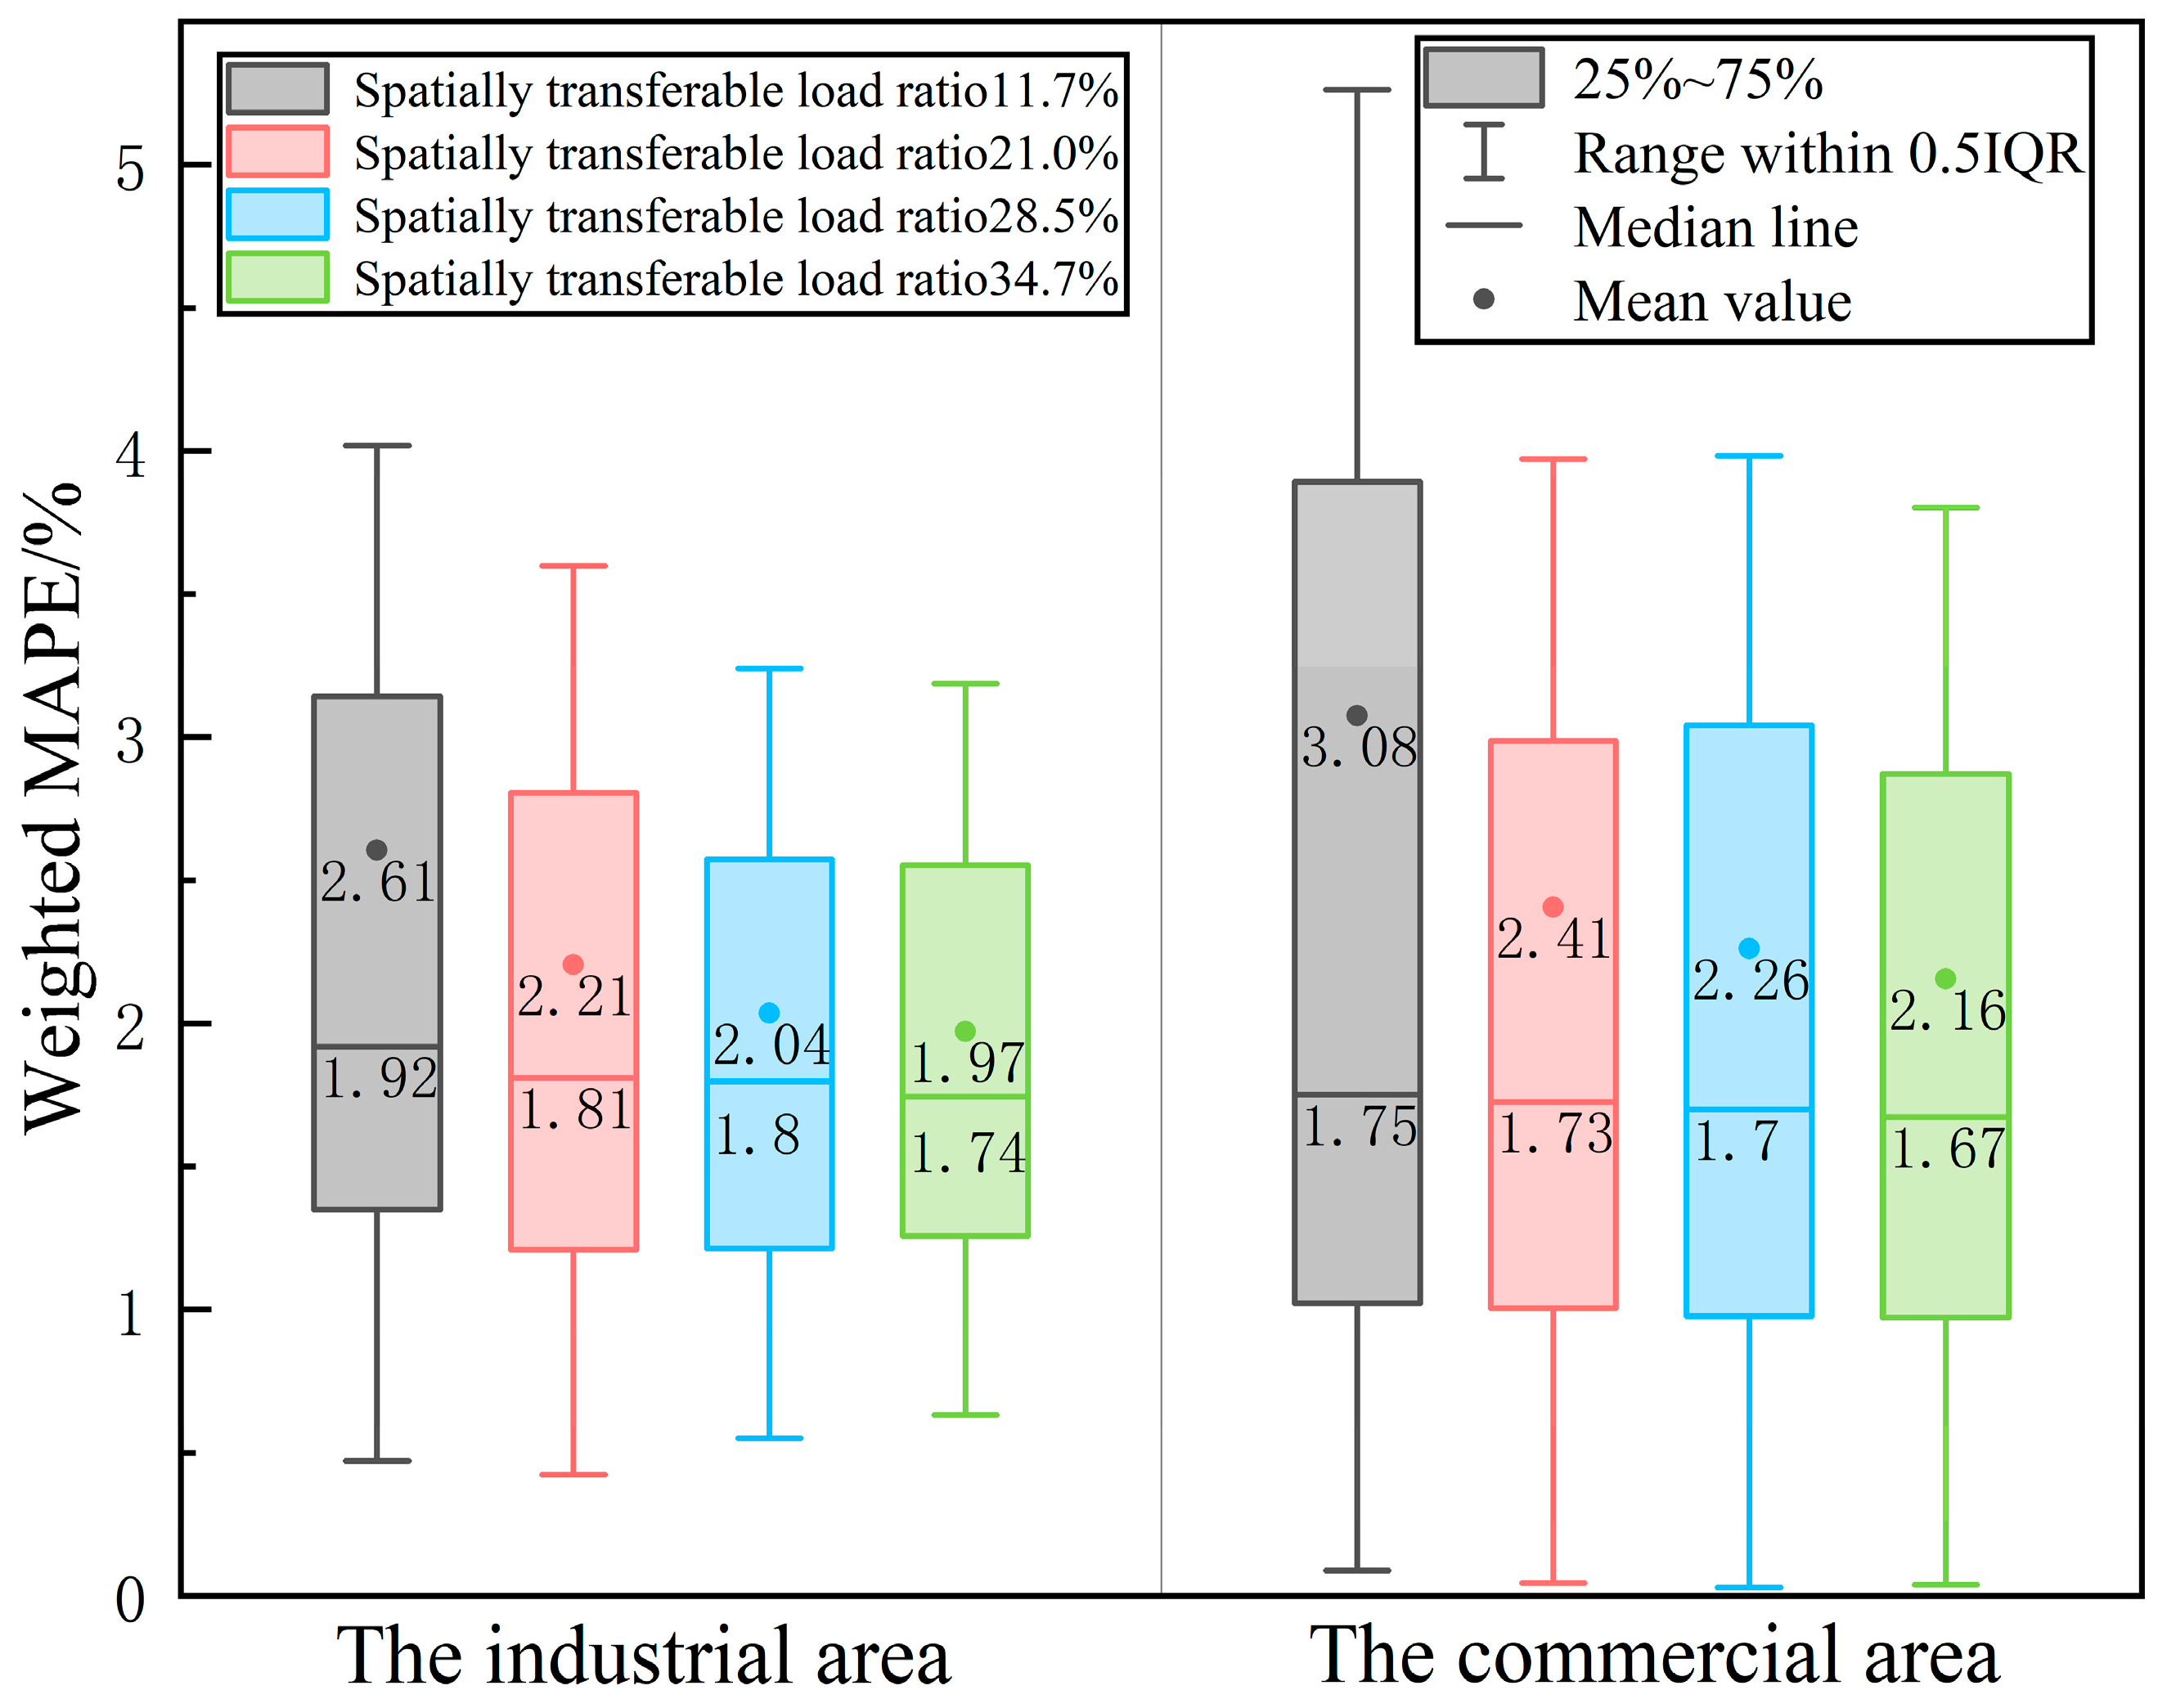
By progressively augmenting the number of servers at various frequencies, the proportion of IDC loads gradually increases, reaching 11.7%, 21.0%, 28.5%, and 34.7% of the total load within the interconnected park. Figure 19 illustrates the boxplot of load prediction errors for each park.
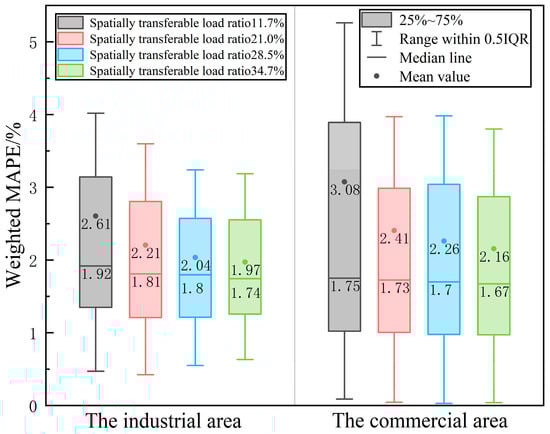
Figure 19.
Box plot of prediction error for spatially transferable loads with different energy use shares.
As the proportion of spatially transferable loads within the interconnected park system increases, the boxplots gradually flatten, and their position shifts downward. This trend indicates a continuous reduction in the mean and dispersion of prediction errors, enhancing prediction performance.
5. Conclusions
This study investigates the coupling relationship between energy consumption in interconnected parks with IDCs, proposing a joint load prediction approach based on MTL-CNN-LSTM. The case analysis underscores the following key points:
- Employing MTL for joint modeling of parks characterizes the energy consumption coupling among different parks, enhancing the prediction accuracy of the overall energy load in interconnected parks;
- Integrating features of spatial transfer characteristics into the feature set of the prediction model enhances the accuracy of predicting load “peaks” and alleviates the “delay” issue associated with peak tracking;
- As the proportion of spatially transferable loads increases, our proposed model and approach yield improved prediction results.
Author Contributions
Conceptualization, L.L. (Ling Li); methodology, H.Q.; software, Z.D.; validation, K.Z.; formal analysis, J.H.; investigation, C.L.; resources, L.L. (Le Liang); data curation, N.Q.; writing—original draft preparation, H.Q.; writing—review and editing, L.L. (Ling Li); visualization, K.Z.; supervision, J.H.; project administration, C.L.; funding acquisition, Z.D. All authors have read and agreed to the published version of the manuscript.
Funding
This research was funded by the Innovation Project of China Southern Grid Co., Ltd., grant number GXKJXM20222151.
Data Availability Statement
The original contributions presented in the study are included in the article, further inquiries can be directed to the corresponding author.
Conflicts of Interest
All authors were employed by Nanning Power Supply Bureau of Guangxi Power Grid Co., Ltd. All authors declare that the research was conducted in the absence of any commercial or financial relationships that could be construed as a potential conflict of interest.
Appendix A
There is a list of abbreviations.
| Abbreviation | Full Form | Abbreviations | Full Form |
| MTL | multi-task learning | RNN | recurrent neural network |
| CNN | convolutional neural network | GRU | gated recurrent unit |
| LSTM | data | IDCA | Internet Data Center A |
| IDCs | Internet data centers | IDCB | Internet Data Center B |
| SVR | support vector regression | FC | fully connected |
| TCN | temporal convolutional network | STL | single-task learning |
References
- Lyu, J.; Zhang, S.; Cheng, H.; Han, F.; Yuan, K.; Song, Y.; Fang, S. Review on district-level integrated energy system planning considering interconnection and interaction. Proc. CSEE 2021, 41, 4001–4021. [Google Scholar]
- Lyu, J.; Zhang, S.; Cheng, H.; Han, F.; Yuan, K.; Song, Y.; Fang, S. Review and prospect on coordinated planning of energy flow and workload flow in the integrated energy system containing data centers. Proc. CSEE 2021, 41, 5500–5521. [Google Scholar]
- Wang, J.; Gu, W.; Lu, S.; Zhang, C.; Wang, Z.; Tang, X. Coordinated planning of multi-district integrated energy system combining heating network model. Autom. Electr. Power Syst. 2016, 40, 17–24. [Google Scholar]
- Teng, Y.; Liu, S.; Hui, Q.; Chen, Z. Integrated demand side response model considering collaborative optimization of regional multi-energy system clusters. Proc. CSEE 2020, 40, 7282–7296. [Google Scholar]
- Wei, Z.; Wei, P.; Guo, Y.; Huang, Y.; Lu, B. Distributed dispatch method for multi-region electricity-gas integrated energy systems considering cross-region energy flow interaction plan. Electr. Power Constr. 2020, 41, 66–79. [Google Scholar]
- Sun, Q.; Wang, X.; Zhang, Y.; Zhang, F.; Zhang, P.; Gao, W. Multiple load prediction of integrated energy system based on long short-term memory and multi-task learning. Autom. Electr. Power Syst. 2021, 45, 63–70. [Google Scholar]
- Lyu, Z.; Gu, J.; Meng, L. Short-term load forecasting for integrated energy system based on coupling features and multi-task learning. Autom. Electr. Power Syst. 2022, 46, 58–66. [Google Scholar]
- Chen, J.; Hu, Z.; Chen, W.; Gao, M.; Du, Y.; Lin, M. Load prediction of integrated energy system based on combination of quadratic modal decomposition and deep bidirectional long short-term memory and multiple linear regression. Autom. Electr. Power Syst. 2021, 45, 85–94. [Google Scholar]
- Lu, B.; Huo, Z.; Yu, M. Multi Load Ultra Short-term Forecasting of Integrated Energy System Based on LSTNet-Skip. Proc. CSEE 2023, 43, 2273–2283. [Google Scholar]
- Li, R.; Sun, F.; Ding, X.; Han, Y.; Liu, Y.; Yan, J. Ultra short-term load forecasting method for user-level integrated energy system considering spatio-temporal coupling of multi-energy. Power Syst. Technol. 2020, 44, 4121–4134. [Google Scholar]
- Chen, B.; Wang, Y. Short-Term Electric Load Forecasting of Integrated Energy System Considering Nonlinear Synergy Between Different Loads. IEEE Access 2021, 9, 43562–43573. [Google Scholar] [CrossRef]
- Yu, Q.; Li, Y. Correlated load forecasting in active distribution networks using spatial-temporal synchronous graph convolutional networks. IET Energy Syst. Integr. 2021, 3, 355–366. [Google Scholar] [CrossRef]
- Dong, L.; Chen, Z.; Han, F.; Wang, X.; Pu, T. Short-term Load Forecasting of Residential User Groups Based on Graph Convolutional Neural Network and K-means Clustering. Power Syst. Technol. 2023, 47, 4291–4301. [Google Scholar]
- Ding, Z.; Cao, Y.; Zhang, S.; Wang, P.; Liu, J.; Cheng, M.; Mao, H. Coordinated operation for data center and power system in the context of energy internet: Energy demand management model of data center. Proc. CSEE 2022, 42, 3161–3177. [Google Scholar]
- Chen, M.; Gao, C.; Shahidehpour, M.; Li, Z.; Chen, S.; Li, D. Internet data center load modeling for demand response considering the coupling of multiple regulation methods. IEEE Trans. Smart Grid 2021, 12, 2060–2076. [Google Scholar] [CrossRef]
- Chen, M.; Gao, C.; Guo, Q.; Li, Z. Load modeling and coordinated optimization of spatiotemporally-coupled internet data center: Motivation and architecture. Proc. CSEE 2022, 42, 6945–6958. [Google Scholar]
- Wang, D.; Zhang, S.; Cheng, H.; Han, F.; Song, Y. Coordinated Planning of Multi-regional Energy Stations Considering Spatio-Temporal Adjustment of Energy Consumption in Data Centers. Autom. Electr. Power Syst. 2023, 47, 77–85. [Google Scholar]
- Cao, Y.; Ding, Z.; Wang, P.; Zhang, S.; Liu, J.; Liu, W.; Cheng, M. Coordinated operation for data center and power system in the context of energy internet: Opportunities and challenges. Proc. CSEE 2022, 42, 3512–3527. [Google Scholar]
- Wang, D.; Zhang, S.; Cheng, H.; Han, F.; Song, Y.; Yuan, K. Calculation of Maximum Allowable Access Capacity of Distributed Photovoltaic in Electricity-gas Integrated Energy System Considering Spatio-temporal Adjustability of Energy Consumption by Data Centers. Proc. CSU-EPSA 2023, 35, 121–131. [Google Scholar]
- Gao, C.; Wu, G.; Chen, S. A model aimed at reducing power net loss considering frequency scaling of servers in geo-distributed data centers. Proc. CSEE 2019, 39, 1673–1681. [Google Scholar]
- Wang, S.; Ma, J. A Novel Ensemble Model for Load Forecasting: Integrating Random Forest, XGBoost, and Seasonal Naive Methods. In Proceedings of the 2023 2nd Asian Conference on Frontiers of Power and Energy (ACFPE), Chengdu, China, 20–22 October 2023; pp. 114–118. [Google Scholar]
- Magalhães, B.; Bento, P.; Pombo, J.; Calado, M.D.R.; Mariano, S. Short-Term Load Forecasting Based on Optimized Random Forest and Optimal Feature Selection. Energies 2024, 17, 1926. [Google Scholar] [CrossRef]
- Tan, Z.; Zhang, J.; He, Y.; Zhang, Y.; Xiong, G.; Liu, Y. Short-Term Load Forecasting Based on Integration of SVR and Stacking. IEEE Access 2020, 8, 227719–227728. [Google Scholar] [CrossRef]
- Li, M.W.; Geng, J.; Hong, W.C.; Zhang, Y. Hybridizing Chaotic and Quantum Mechanisms and Fruit Fly Optimization Algorithm with Least Squares Support Vector Regression Model in Electric Load Forecasting. Energies 2024, 17, 2778. [Google Scholar] [CrossRef]
- Bae, D.J.; Kwon, B.S.; Song, K. XGBoost-Based Day-Ahead Load Forecasting Algorithm Considering Behind-the-Meter Solar PV Generation. Energies 2022, 15, 128. [Google Scholar] [CrossRef]
- Song, J.; Jin, L.; Xie, Y.; Wei, C. Optimized XGBoost based sparrow search algorithm for short-term load forecasting. In Proceedings of the 2021 IEEE International Conference on Computer Science, Artificial Intelligence and Electronic Engineering (CSAIEE), Beijing, China, 20–22 August 2021; pp. 213–217. [Google Scholar]
- Ge, Q.; Guo, C.; Jiang, H.Y.; Lu, Z.Y.; Yao, G.; Zhang, J.M.; Hua, Q. Industrial Power Load Forecasting Method Based on Reinforcement Learning and PSO-LSSVM. IEEE Trans. Cybern. 2022, 52, 1112–1124. [Google Scholar] [CrossRef]
- Shohan, M.J.A.; Faruque, M.O.; Foo, S.Y. Forecasting of Electric Load Using a Hybrid LSTM-Neural Prophet Model. Energies 2022, 15, 2158. [Google Scholar] [CrossRef]
- Ajit, A.M.; Chirag, N.M.; Madhu, G.M.; Chintamani, V. Designing a Robust and Accurate Model for Consumer-Centric Short-Term Load Forecasting in Microgrid Environment. IEEE Syst. J. 2022, 16, 2448–2459. [Google Scholar]
- You, Y.W.; Wang, Z.H.; Liu, Z.H.; Guo, C.M.; Yang, B. Load Prediction of Regional Heat Exchange Station Based on Fuzzy Clustering Based on Fourier Distance and Convolutional Neural Network–Bidirectional Long Short-Term Memory Network. Energies 2024, 17, 4190. [Google Scholar] [CrossRef]
- Liu, M.X.; Mo, C.G.; Wang, H.L. Short-term Power Load Forecasting Model Based on CNN-GRU and Dual Attention Mechanism Hybrid Neural Network Model. In Proceedings of the 2023 8th Asia Conference on Power and Electrical Engineering (ACPEE), Tianjin, China, 14–16 April 2023; pp. 1769–1773. [Google Scholar]
- Ahmed, Z.; Jamil, M.; Khan, A.A. Short-Term Campus Load Forecasting Using CNN-Based Encoder–Decoder Network with Attention. Energies 2024, 17, 4457. [Google Scholar] [CrossRef]
- Cen, S.F.; Chang, G.L. Multi-Task Learning of the PatchTCN-TST Model for Short-Term Multi-Load Energy Forecasting Considering Indoor Environments in a Smart Building. IEEE Access 2024, 12, 19553–19568. [Google Scholar] [CrossRef]
- Xiang, X.J.; Yuan, T.S.; Cao, G.K.; Zheng, Y.P. Short-Term Electric Load Forecasting Based on Signal Decomposition and Improved TCN Algorithm. Energies 2024, 17, 1815. [Google Scholar] [CrossRef]
- Ehsan, R.; Ali, A.; David, S.; Gerard, L. Privacy-Preserved Framework for Short-Term Probabilistic Net Energy Forecasting. IEEE Trans. Ind. Inform. 2023, 6, 7613–7623. [Google Scholar]
- Mobarak, A.; Amani, Y.O.; Majdi, O. Electrical Load Forecasting Using LSTM, GRU, and RNN Algorithms. Energies 2023, 15, 2283. [Google Scholar]
- Wang, X.T.; Wu, B.B.; Wu, D.; Wang, W.; Ma, X.T. Enhanced ES-adRNNe Load Forecasting With Contextual Augmentation on Similar Load Days. IEEE Access 2023, 11, 93727–93738. [Google Scholar] [CrossRef]
- Fatma, M.A.M.; Yomma, S.; Rania, A.A.S. Forecasting of Solar Power Using GRU–Temporal Fusion Transformer Model and DILATE Loss Function. Energies 2023, 16, 8105. [Google Scholar] [CrossRef]
- Zhu, J.; Dong, H.; Li, S.; Chen, Z.; Luo, T. Review of data-driven load forecasting for integrated energy system. Proc. CSEE 2021, 41, 7905–7924. [Google Scholar]
- Zhang, Y.; Liu, J.; Zuo, X. Survey of multi- task learning. Chin. J. Comput. 2020, 43, 1340–1378. [Google Scholar] [CrossRef]
- Cluster-trace-gpu-v2020. Available online: https://github.com/alibaba/clusterdata/tree/master/cluster-trace-gpu-v2020 (accessed on 1 January 2022).

Disclaimer/Publisher’s Note: The statements, opinions and data contained in all publications are solely those of the individual author(s) and contributor(s) and not of MDPI and/or the editor(s). MDPI and/or the editor(s) disclaim responsibility for any injury to people or property resulting from any ideas, methods, instructions or products referred to in the content. |
© 2024 by the authors. Licensee MDPI, Basel, Switzerland. This article is an open access article distributed under the terms and conditions of the Creative Commons Attribution (CC BY) license (https://creativecommons.org/licenses/by/4.0/).