The Effect of a Reduction in the Catalyst Loading on a Mini Passive Direct Methanol Fuel Cell
Abstract
:1. Introduction
2. Materials and Methods
3. Results and Discussion
3.1. Electrochemical Characterization of a Mini pDMFC
3.2. Analysis of the Mini pDMFC with Reduced Anode and Cathode Catalyst Loadings
3.3. Effect of the Methanol Concentration
4. Conclusions
Author Contributions
Funding
Data Availability Statement
Acknowledgments

Conflicts of Interest
References
- Yuan, W.; Zhang, X.; Hou, C.; Zhang, Y.; Wang, H.; Liu, X. Enhanced Water Management via the Optimization of Cathode Microporous Layer Using 3D Graphene Frameworks for Direct Methanol Fuel Cell. J. Power Sources 2020, 451, 227800. [Google Scholar] [CrossRef]
- Abraham, B.G.; Chetty, R. Design and Fabrication of a Quick-Fit Architecture Air Breathing Direct Methanol Fuel Cell. Int. J. Hydrogen Energy 2021, 46, 6845–6856. [Google Scholar] [CrossRef]
- Baruah, B.; Deb, P. Performance and Application of Carbon-Based Electrocatalysts in Direct Methanol Fuel Cell. Mater. Adv. 2021, 2, 5344–5364. [Google Scholar] [CrossRef]
- Xia, Z.; Zhang, X.; Sun, H.; Wang, S.; Sun, G. Recent Advances in Multi-Scale Design and Construction of Materials for Direct Methanol Fuel Cells. Nano Energy 2019, 65, 104048. [Google Scholar] [CrossRef]
- Tian, H.; Yu, Y.; Wang, Q.; Li, J.; Rao, P.; Li, R.; Du, Y.; Jia, C.; Luo, J.; Deng, P.; et al. Recent Advances in Two-Dimensional Pt Based Electrocatalysts for Methanol Oxidation Reaction. Int. J. Hydrogen Energy 2021, 46, 31202–31215. [Google Scholar] [CrossRef]
- Mansor, M.; Timmiati, S.N.; Lim, K.L.; Wong, W.Y.; Kamarudin, S.K.; Nazirah Kamarudin, N.H. Recent Progress of Anode Catalysts and Their Support Materials for Methanol Electrooxidation Reaction. Int. J. Hydrogen Energy 2019, 44, 14744–14769. [Google Scholar] [CrossRef]
- Yang, L.; Ge, J.; Liu, C.; Wang, G.; Xing, W. Approaches to Improve the Performance of Anode Methanol Oxidation Reaction—A Short Review. Curr. Opin. Electrochem. 2017, 4, 83–88. [Google Scholar] [CrossRef]
- de Sá, M.H.; Moreira, C.S.; Pinto, A.M.F.R.; Oliveira, V.B. Recent Advances in the Development of Nanocatalysts for Direct Methanol Fuel Cells. Energies 2022, 15, 6335. [Google Scholar] [CrossRef]
- Wang, L.; Holewinski, A.; Wang, C. Prospects of Platinum-Based Nanostructures for the Electrocatalytic Reduction of Oxygen. ACS Catal. 2018, 8, 9388–9398. [Google Scholar] [CrossRef]
- Zhang, C.; Shen, X.; Pan, Y.; Peng, Z. A Review of Pt-Based Electrocatalysts for Oxygen Reduction Reaction. Front. Energy 2017, 11, 268–285. [Google Scholar] [CrossRef]
- Kulkarni, A.; Siahrostami, S.; Patel, A.; Nørskov, J.K. Understanding Catalytic Activity Trends in the Oxygen Reduction Reaction. Chem. Rev. 2018, 118, 2302–2312. [Google Scholar] [CrossRef] [PubMed]
- Stacy, J.; Regmi, Y.N.; Leonard, B.; Fan, M. The Recent Progress and Future of Oxygen Reduction Reaction Catalysis: A Review. Renew. Sustain. Energy Rev. 2017, 69, 401–414. [Google Scholar] [CrossRef]
- Kang, S.Y.; Kim, H.J.; Chung, Y.H. Recent Developments of Nano-Structured Materials as the Catalysts for Oxygen Reduction Reaction. Nano Converg. 2018, 5, 1–15. [Google Scholar] [CrossRef]
- Zuo, Y.; Sheng, W.; Tao, W.; Li, Z. Direct Methanol Fuel Cells System–A Review of Dual-Role Electrocatalysts for Oxygen Reduction and Methanol Oxidation. J. Mater. Sci. Technol. 2022, 114, 29–41. [Google Scholar] [CrossRef]
- Braz, B.A.; Moreira, C.S.; Oliveira, V.B.; Pinto, A. Effect of the Current Collector Design on the Performance of a Passive Direct Methanol Fuel Cell. Electrochim. Acta 2019, 300, 306–315. [Google Scholar] [CrossRef]
- Ismail, A.; Kee, Y.W. Investigation on Voltage Loss Mechanism for Direct Methanol Fuel Cell. Energy Rep. 2023, 10, 535–543. [Google Scholar] [CrossRef]
- Braz, B.A.; Moreira, C.S.; Oliveira, V.B.; Pinto, A. Electrochemical Impedance Spectroscopy as a Diagnostic Tool for Passive Direct Methanol Fuel Cells. Energy Rep. 2022, 8, 7964–7975. [Google Scholar] [CrossRef]
- Pivac, I.; Barbir, F. Inductive Phenomena at Low Frequencies in Impedance Spectra of Proton Exchange Membrane Fuel Cells—A Review. J. Power Sources 2016, 326, 112–119. [Google Scholar] [CrossRef]
- Mallick, R.K.; Thombre, S.B.; Motghare, R.V.; Chillawar, R.R. Analysis of the Clamping Effects on the Passive Direct Methanol Fuel Cell Performance Using Electrochemical Impedance Spectroscopy. Electrochim. Acta 2016, 215, 150–161. [Google Scholar] [CrossRef]
- Abdelkareem, M.A.; Sayed, E.T.; Nakagawa, N. Significance of Diffusion Layers on the Performance of Liquid and Vapor Feed Passive Direct Methanol Fuel Cells. Energy 2020, 209, 118492. [Google Scholar] [CrossRef]
- Munjewar, S.S.; Thombre, S.B. Effect of Current Collector Roughness on Performance of Passive Direct Methanol Fuel Cell. Renew. Energy 2019, 138, 272–283. [Google Scholar] [CrossRef]
- Xue, R.; Zhang, Y.; Li, X.; Liu, X. Performance Investigation and Effect of Temperature on a Passive ΜDMFC with Stainless Steel Mesh. Appl. Therm. Eng. 2018, 141, 642–647. [Google Scholar] [CrossRef]
- Gago, A.S.; Esquivel, J.-P.; Sabaté, N.; Santander, J.; Alonso-Vante, N. Comprehensive Characterization and Understanding of Micro-Fuel Cells Operating at High Methanol Concentrations. Beilstein J. Nanotechnol. 2015, 6, 2000–2006. [Google Scholar] [CrossRef] [PubMed]
- Wu, H.; Yuan, T.; Huang, Q.; Zhang, H.; Zou, Z.; Zheng, J.; Yang, H. Polypyrrole Nanowire Networks as Anodic Micro-Porous Layer for Passive Direct Methanol Fuel Cells. Electrochim. Acta 2014, 141, 1–5. [Google Scholar] [CrossRef]
- Alias, M.S.; Kamarudin, S.K.; Zainoodin, A.M.; Masdar, M.S. Structural Mechanism Investigation on Methanol Crossover and Stability of a Passive Direct Methanol Fuel Cell Performance via Modified Micro-Porous Layer. Int. J. Energy Res. 2021, 45, 12928–12943. [Google Scholar] [CrossRef]
- Pu, L.; Jiang, J.; Yuan, T.; Chai, J.; Zhang, H.; Zou, Z.; Li, X.M.; Yang, H. Performance Improvement of Passive Direct Methanol Fuel Cells with Surface-Patterned Nafion® Membranes. Appl. Surf. Sci. 2015, 327, 205–212. [Google Scholar] [CrossRef]
- Braz, B.A.; Oliveira, V.B.; Pinto, A.M.F.R. Optimization of a Passive Direct Methanol Fuel Cell with Different Current Collector Materials. Energy 2020, 208, 118394. [Google Scholar] [CrossRef]
- Braz, B.A.; Oliveira, V.B.; Pinto, A. Experimental Studies of the Effect of Cathode Diffusion Layer Properties on a Passive Direct Methanol Fuel Cell Power Output. Int. J. Hydrogen Energy 2019, 44, 19334–19343. [Google Scholar] [CrossRef]
- Huang, Q.; Jiang, J.; Chai, J.; Yuan, T.; Zhang, H.; Zou, Z.; Zhang, X.; Yang, H. Construction of Porous Anode by Sacrificial Template for a Passive Direct Methanol Fuel Cell. J. Power Sources 2014, 262, 213–218. [Google Scholar] [CrossRef]
- Chen, P.; Wu, H.; Yuan, T.; Zou, Z.; Zhang, H.; Zheng, J.; Yang, H. Electronspun Nanofiber Network Anode for a Passive Direct Methanol Fuel Cell. J. Power Sources 2014, 255, 70–75. [Google Scholar] [CrossRef]
- Siracusano, S.; Trocino, S.; Briguglio, N.; Baglio, V.; Aricò, A.S. Electrochemical Impedance Spectroscopy as a Diagnostic Tool in Polymer Electrolyte Membrane Electrolysis. Materials 2018, 11, 1368. [Google Scholar] [CrossRef] [PubMed]
- Munjewar, S.S.; Thombre, S.B.; Mallick, R.K. Approaches to Overcome the Barrier Issues of Passive Direct Methanol Fuel Cell—Review. Renew. Sustain. Energy Rev. 2017, 67, 1087–1104. [Google Scholar] [CrossRef]
- Shou-Shing, H.; Ling-Ching, H.; Ching-Chi, L.; Ching-Feng, H. Analyses of Electrochemical Impedance Spectroscopy and Cyclic Voltammetry in Micro-Direct Methanol Fuel Cell Stacks. Energy Res. 2016, 40, 2162–2175. [Google Scholar] [CrossRef]
- Shrivastava, N.K.; Thombre, S.B.; Chadge, R.B. Liquid Feed Passive Direct Methanol Fuel Cell: Challenges and Recent Advances. Ionics 2016, 22, 1–23. [Google Scholar] [CrossRef]
- Abdullah, N.; Kamarudin, S.K.; Shyuan, L.K. Novel Anodic Catalyst Support for Direct Methanol Fuel Cell: Characterizations and Single-Cell Performances. Nanoscale Res. Lett. 2018, 13, 90. [Google Scholar] [CrossRef]
- Zuo, K.; Yuan, Z.; Cao, C.; Hao, Y. The Mass Transport Based on Convection Effects in a Passive DMFC under Open-Circuit Conditions. Int. J. Hydrogen Energy 2018, 43, 23463–23474. [Google Scholar] [CrossRef]


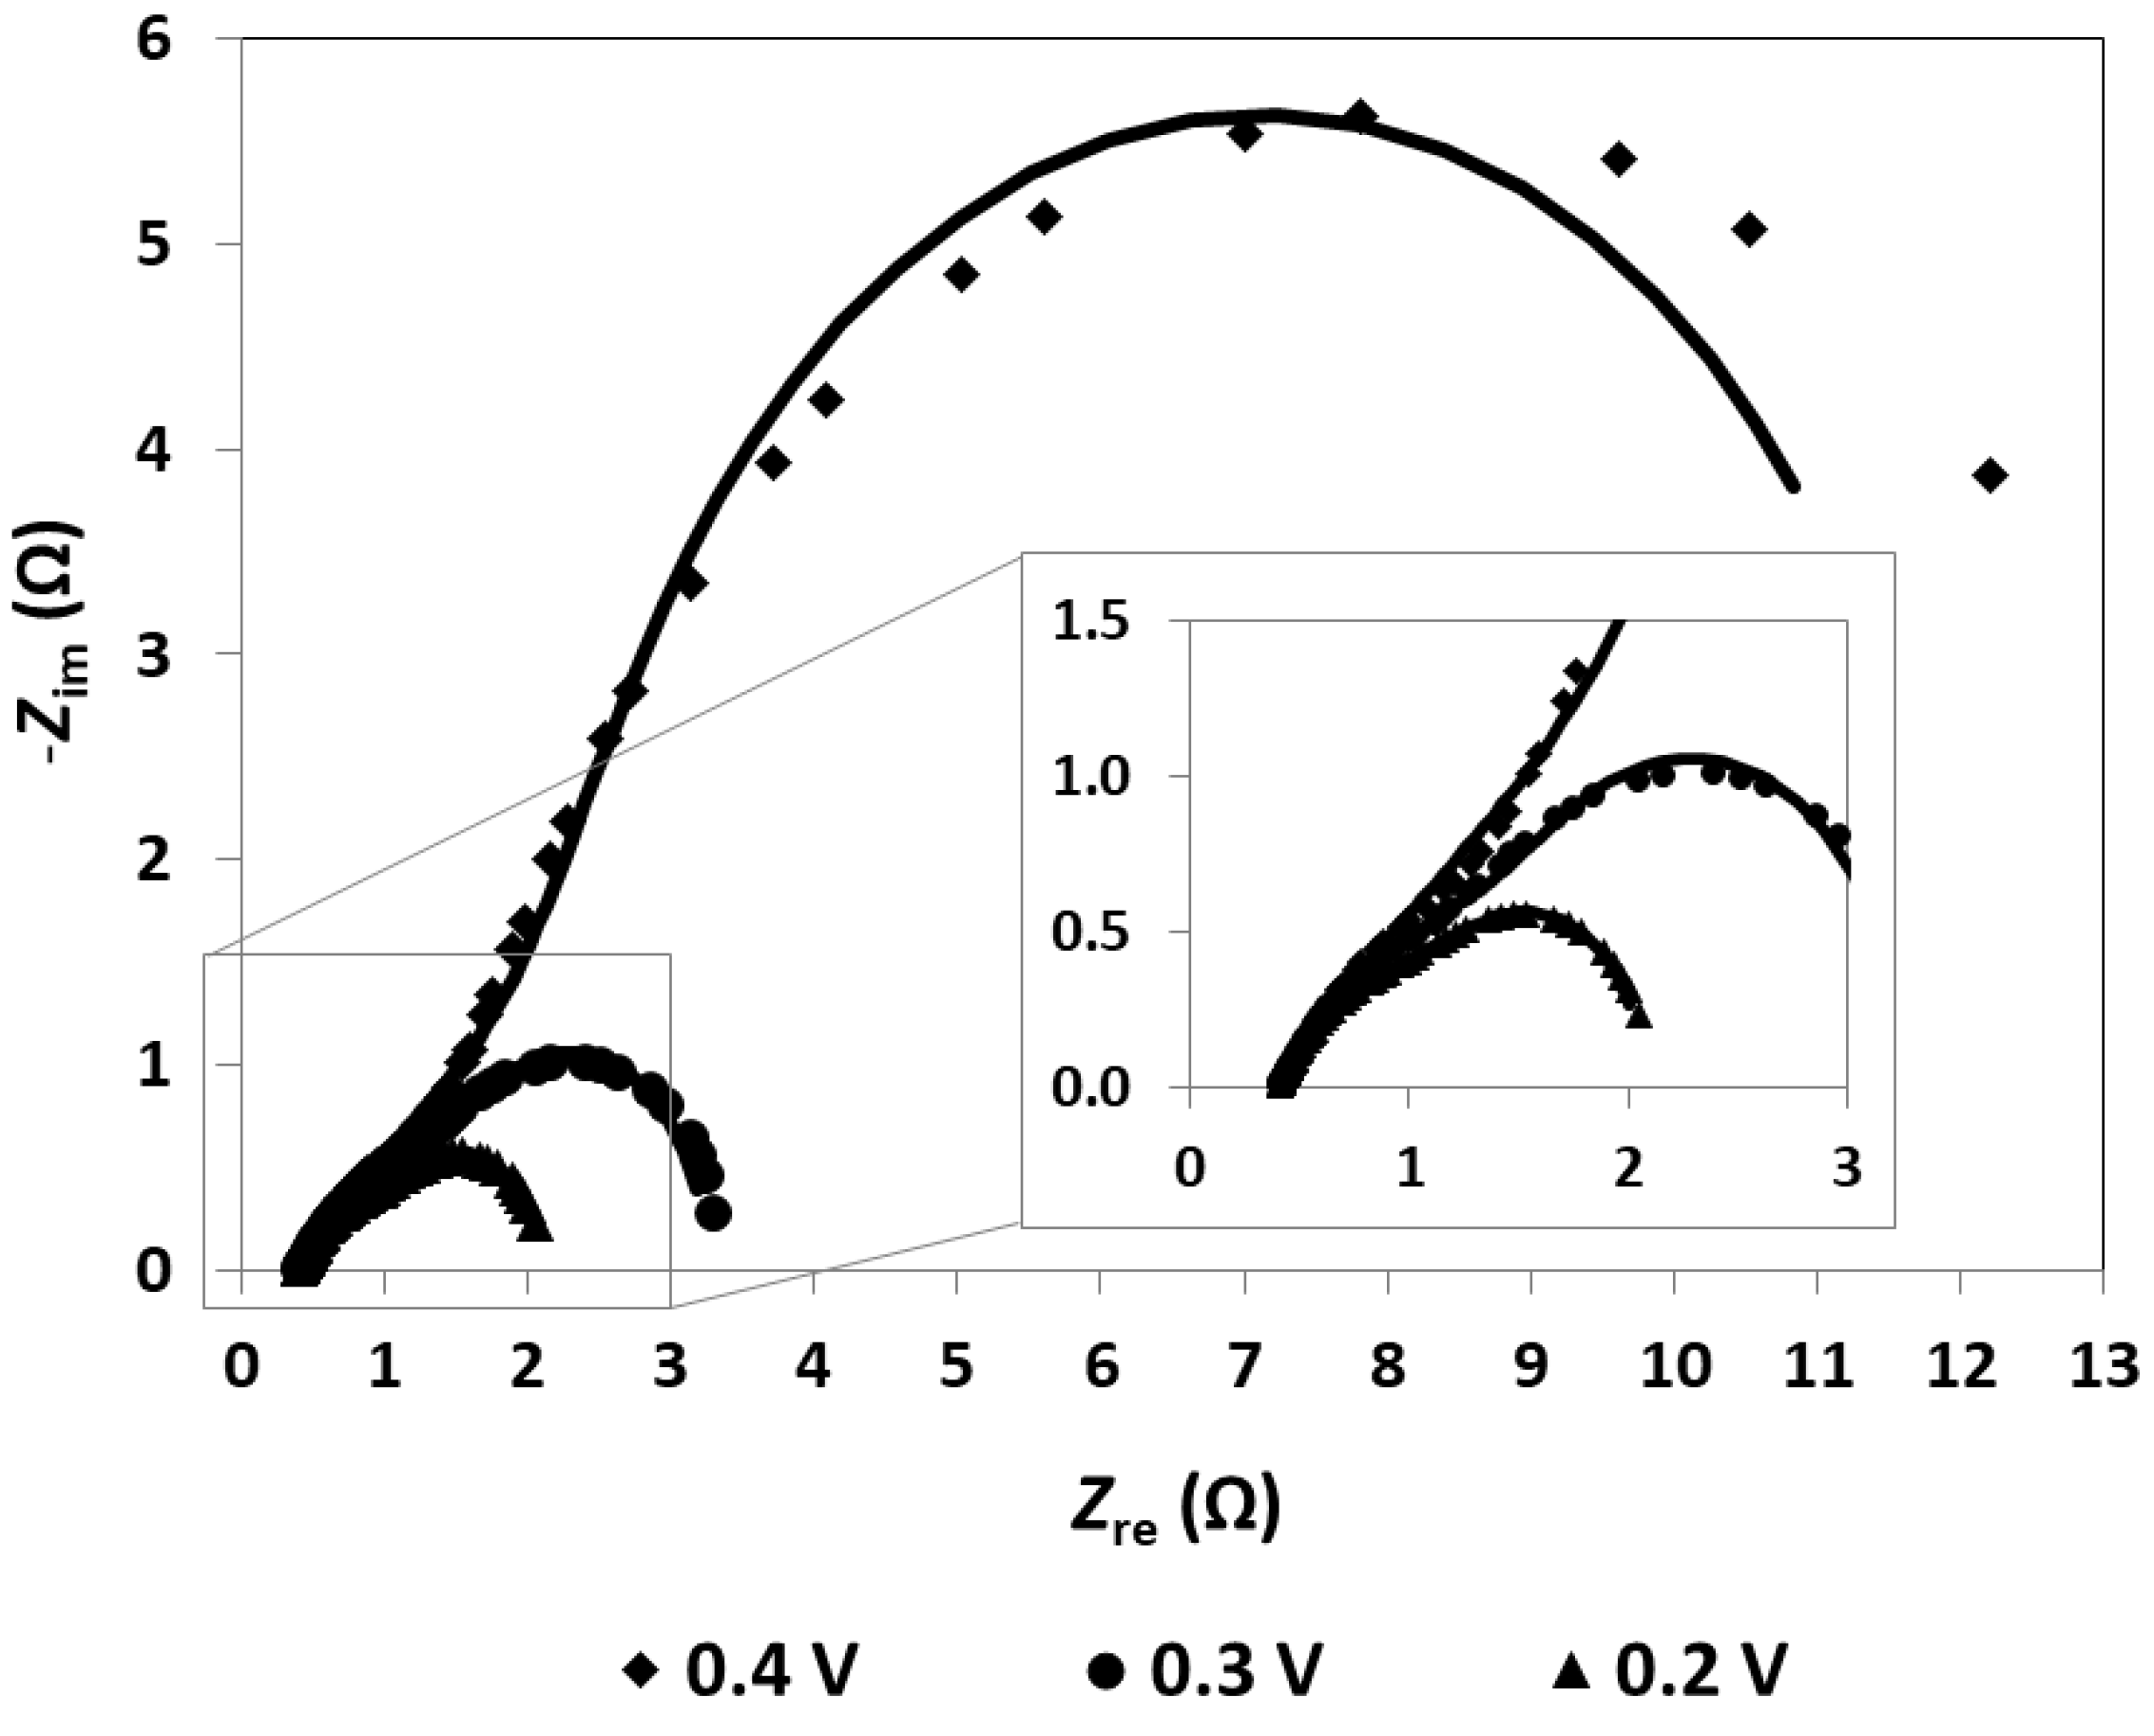
| Voltage (V) | Rohm (Ω) | Ract1 (Ω) | Ract2 (Ω) |
|---|---|---|---|
| 0.4 | 0.411 | 0.789 | 10.6 |
| 0.3 | 0.409 | 0.691 | 2.28 |
| 0.2 | 0.405 | 0.534 | 1.15 |
| Cmethanol (M) | Maximum Power Density (mW cm−2) | ||
|---|---|---|---|
| Cathode Catalyst | |||
| 4 mg cm−2 PtB | 2 mg cm−2 PtB | 0.5 mg cm−2 PtB | |
| 1 | 5.34 | 2.92 | 0.778 |
| 2 | 7.04 | 3.34 | 1.32 |
| 3 | 6.54 | 3.40 | 1.71 |
| 4 | - | 3.79 | 1.89 |
| 5 | - | 4.00 | 2.03 |
| 6 | - | 3.95 | 2.05 |
| 7 | - | 3.21 | 2.74 |
| 8 | - | - | 2.54 |
| Cmethanol (M) | Maximum Power Density (mW cm−2) | ||
|---|---|---|---|
| Anode Catalyst | |||
| 4 mg cm−2 Pt-RuB | 2 mg cm−2 Pt-RuB | 0.5 mg cm−2 Pt-RuB | |
| 1 | 5.34 | 2.57 | 0.23 |
| 2 | 7.04 | 2.98 | 0.60 |
| 3 | 6.54 | 4.06 | 0.98 |
| 4 | - | 5.42 | 1.12 |
| 5 | - | 7.07 | 1.39 |
| 6 | - | 6.64 | 1.98 |
| 7 | - | - | 2.50 |
| 8 | - | - | 2.92 |
| 9 | - | - | 2.55 |
| Cmethanol: 1 M | Cmethanol: 3 M | ||||||
|---|---|---|---|---|---|---|---|
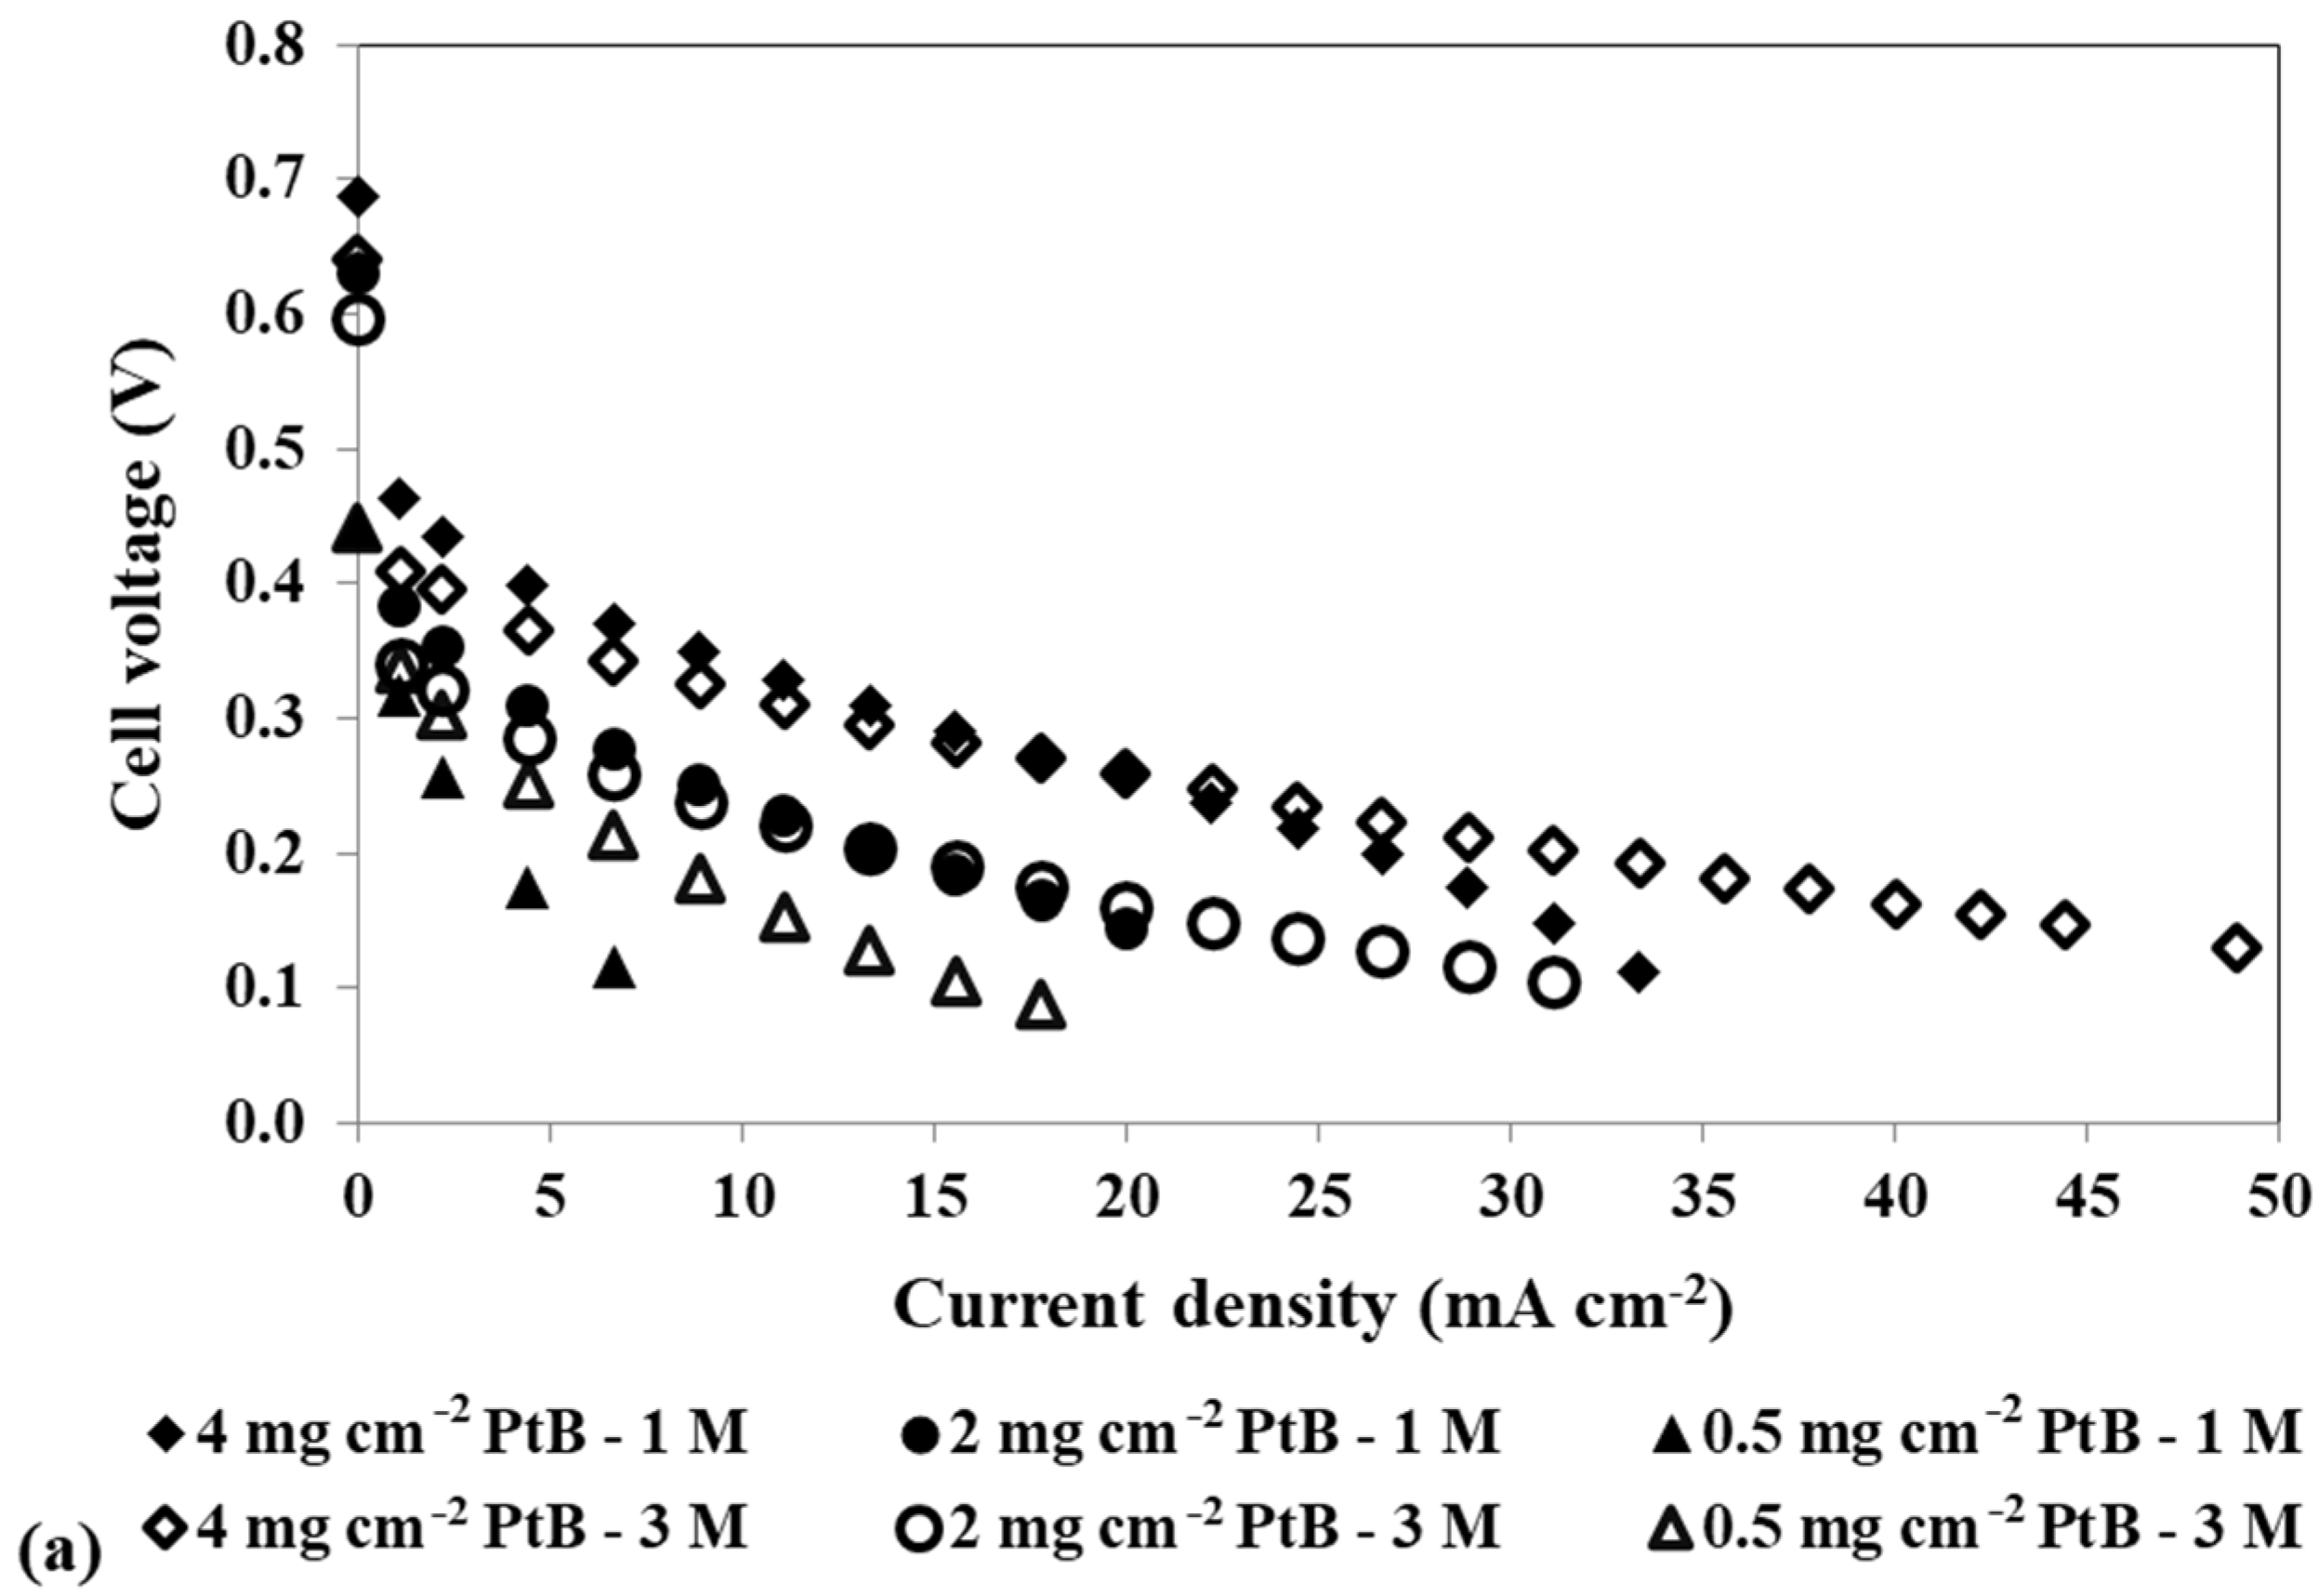
| Voltage (V) | 4 mg cm−2 PtB | 2 mg cm−2 PtB | 0.5 mg cm−2 PtB | 4 mg cm−2 PtB | 2 mg cm−2 PtB | 0.5 mg cm−2 PtB | |
| Rohm (Ω) | 0.4 | 0.452 | 0.413 | 0.441 | 0.411 | 0.395 | 0.497 |
| 0.3 | 0.449 | 0.409 | 0.444 | 0.409 | 0.390 | 0.495 | |
| 0.2 | 0.446 | 0.407 | 0.439 | 0.405 | 0.384 | 0.490 | |
| Ract1 (Ω) | 0.4 | 2.38 | 5.33 | 19.0 | 0.789 | 3.79 | 8.60 |
| 0.3 | 1.51 | 3.70 | 14.9 | 0.691 | 2.94 | 7.09 | |
| 0.2 | 1.11 | 2.31 | 8.94 | 0.534 | 1.58 | 4.74 | |
| Ract2 (Ω) | 0.4 | 6.50 | 19.1 | 13.6 | 10.6 | 20.3 | 13.2 |
| 0.3 | 2.54 | 4.81 | 11.6 | 2.28 | 6.97 | 10.0 | |
| 0.2 | 2.50 | 1.89 | 7.32 | 1.15 | 1.82 | 2.76 | |
| Maximum power density (mW cm−2) | 5.34 | 2.92 | 0.778 | 6.54 | 3.40 | 1.71 | |
| Cmethanol: 1 M | Cmethanol: 3 M | ||||||
|---|---|---|---|---|---|---|---|
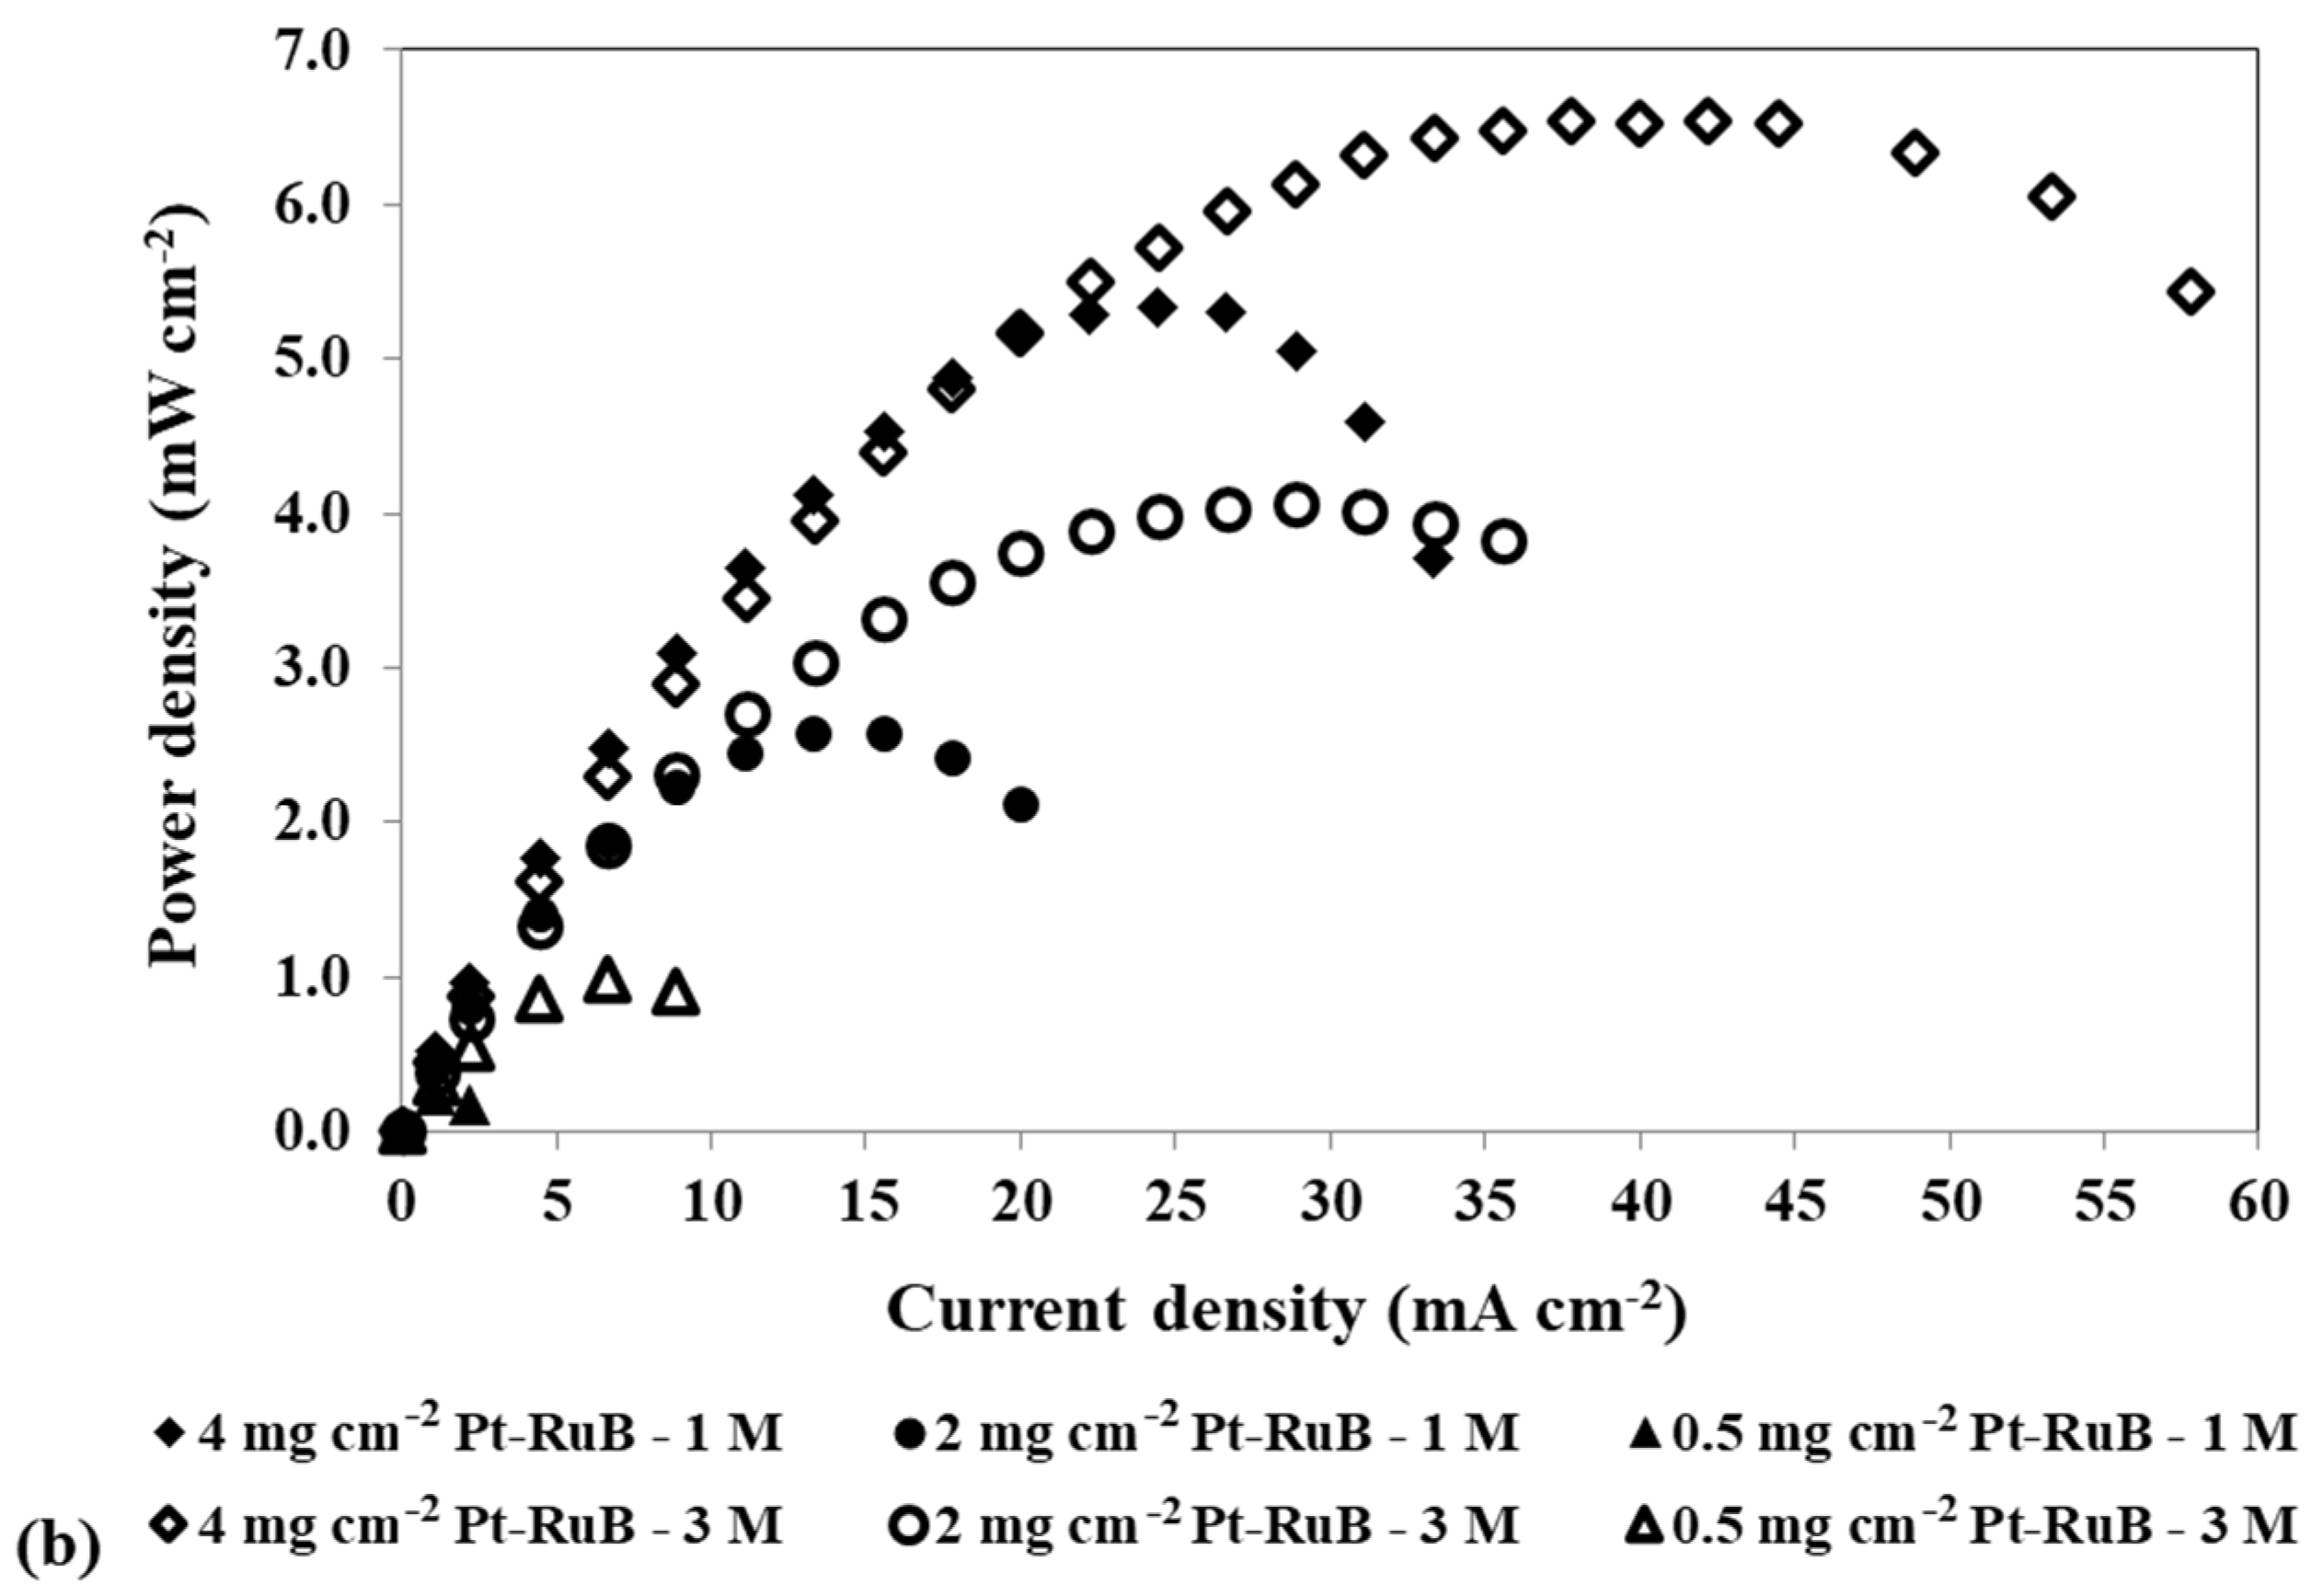
| Voltage (V) | 4 mg cm−2 Pt-RuB | 2 mg cm−2 Pt-RuB | 0.5 mg cm−2 Pt-RuB | 4 mg cm−2 Pt-RuB | 2 mg cm−2 Pt-RuB | 0.5 mg cm−2 Pt-RuB | |
| Rohm (Ω) | 0.4 | 0.452 | 0.405 | * | 0.411 | 0.383 | * |
| 0.3 | 0.449 | 0.402 | 0.378 | 0.409 | 0.377 | 0.494 | |
| 0.2 | 0.446 | 0.397 | 0.377 | 0.405 | 0.370 | 0.492 | |
| Ract1 (Ω) | 0.4 | 2.38 | 3.58 | * | 0.789 | 1.78 | * |
| 0.3 | 1.51 | 2.84 | 2.89 | 0.691 | 1.33 | 1.30 | |
| 0.2 | 1.11 | 2.26 | 2.55 | 0.534 | 0.980 | 1.04 | |
| Ract2 (Ω) | 0.4 | 6.50 | 17.9 | * | 10.6 | 26.3 | * |
| 0.3 | 2.54 | 5.10 | 58.4 | 2.28 | 4.65 | 27.3 | |
| 0.2 | 2.50 | 2.91 | 38.9 | 1.15 | 1.50 | 9.47 | |
| Maximum power density (mW cm−2) | 5.34 | 2.57 | 0.233 | 6.54 | 4.06 | 0.980 | |
| Voltage (V) | Cmethanol (M) | ||||||
|---|---|---|---|---|---|---|---|
| 1 | 2 | 3 | 4 | 5 | 6 | ||
| Rohm (Ω) | 0.4 | 0.405 | 0.351 | 0.383 | 0.330 | 0.367 | 0.285 |
| 0.3 | 0.402 | 0.346 | 0.377 | 0.324 | 0.363 | 0.284 | |
| 0.2 | 0.397 | 0.339 | 0.370 | 0.324 | 0.357 | 0.282 | |
| Ract1 (Ω) | 0.4 | 3.58 | 2.57 | 1.78 | 1.27 | 0.768 | 0.675 |
| 0.3 | 2.84 | 1.94 | 1.33 | 0.966 | 0.647 | 0.610 | |
| 0.2 | 2.26 | 1.43 | 0.980 | 0.696 | 0.482 | 0.432 | |
| Ract2 (Ω) | 0.4 | 17.9 | 26.2 | 26.3 | 27.4 | 30.4 | 31.8 |
| 0.3 | 5.10 | 5.50 | 4.65 | 4.46 | 4.36 | 6.46 | |
| 0.2 | 2.91 | 2.09 | 1.50 | 1.23 | 1.05 | 1.49 | |
| Maximum power density (mW cm−2) | 2.57 | 2.98 | 4.06 | 5.42 | 7.07 | 6.64 | |
| Active Area (cm2) | Cmethanol (M) | Anode Catalyst | Cathode Catalyst | Maximum Power Density (mW cm−2) | |
|---|---|---|---|---|---|
| Present work | 2.25 | 5 | 2 mg cm−2 Pt-RuB | 4 mg cm−2 PtB | 7.07 |
| Zuo et al. [36] (2018) | 4 | 2 | 4 mg cm−2 Pt-Ru | 4 mg cm−2 Pt | 12.05 |
| Abdullah et al. [35] (2018) | 4 | 3 | 2 mg cm−2 Pt-Ru/C | 2 mg cm−2 Pt/C | 2.2 |
Disclaimer/Publisher’s Note: The statements, opinions and data contained in all publications are solely those of the individual author(s) and contributor(s) and not of MDPI and/or the editor(s). MDPI and/or the editor(s) disclaim responsibility for any injury to people or property resulting from any ideas, methods, instructions or products referred to in the content. |
© 2024 by the authors. Licensee MDPI, Basel, Switzerland. This article is an open access article distributed under the terms and conditions of the Creative Commons Attribution (CC BY) license (https://creativecommons.org/licenses/by/4.0/).
Share and Cite
Moreira, C.S.; Pinto, A.M.F.R.; Oliveira, V.B. The Effect of a Reduction in the Catalyst Loading on a Mini Passive Direct Methanol Fuel Cell. Energies 2024, 17, 5174. https://doi.org/10.3390/en17205174
Moreira CS, Pinto AMFR, Oliveira VB. The Effect of a Reduction in the Catalyst Loading on a Mini Passive Direct Methanol Fuel Cell. Energies. 2024; 17(20):5174. https://doi.org/10.3390/en17205174
Chicago/Turabian StyleMoreira, C. S., A. M. F. R. Pinto, and V. B. Oliveira. 2024. "The Effect of a Reduction in the Catalyst Loading on a Mini Passive Direct Methanol Fuel Cell" Energies 17, no. 20: 5174. https://doi.org/10.3390/en17205174
APA StyleMoreira, C. S., Pinto, A. M. F. R., & Oliveira, V. B. (2024). The Effect of a Reduction in the Catalyst Loading on a Mini Passive Direct Methanol Fuel Cell. Energies, 17(20), 5174. https://doi.org/10.3390/en17205174


