

Differences and Causal Mechanisms in the Lithospheric Thermal Structures in the Cratons in East China: Implications for Their Geothermal Resource Potential

 ,
,
Abstract
1. Introduction
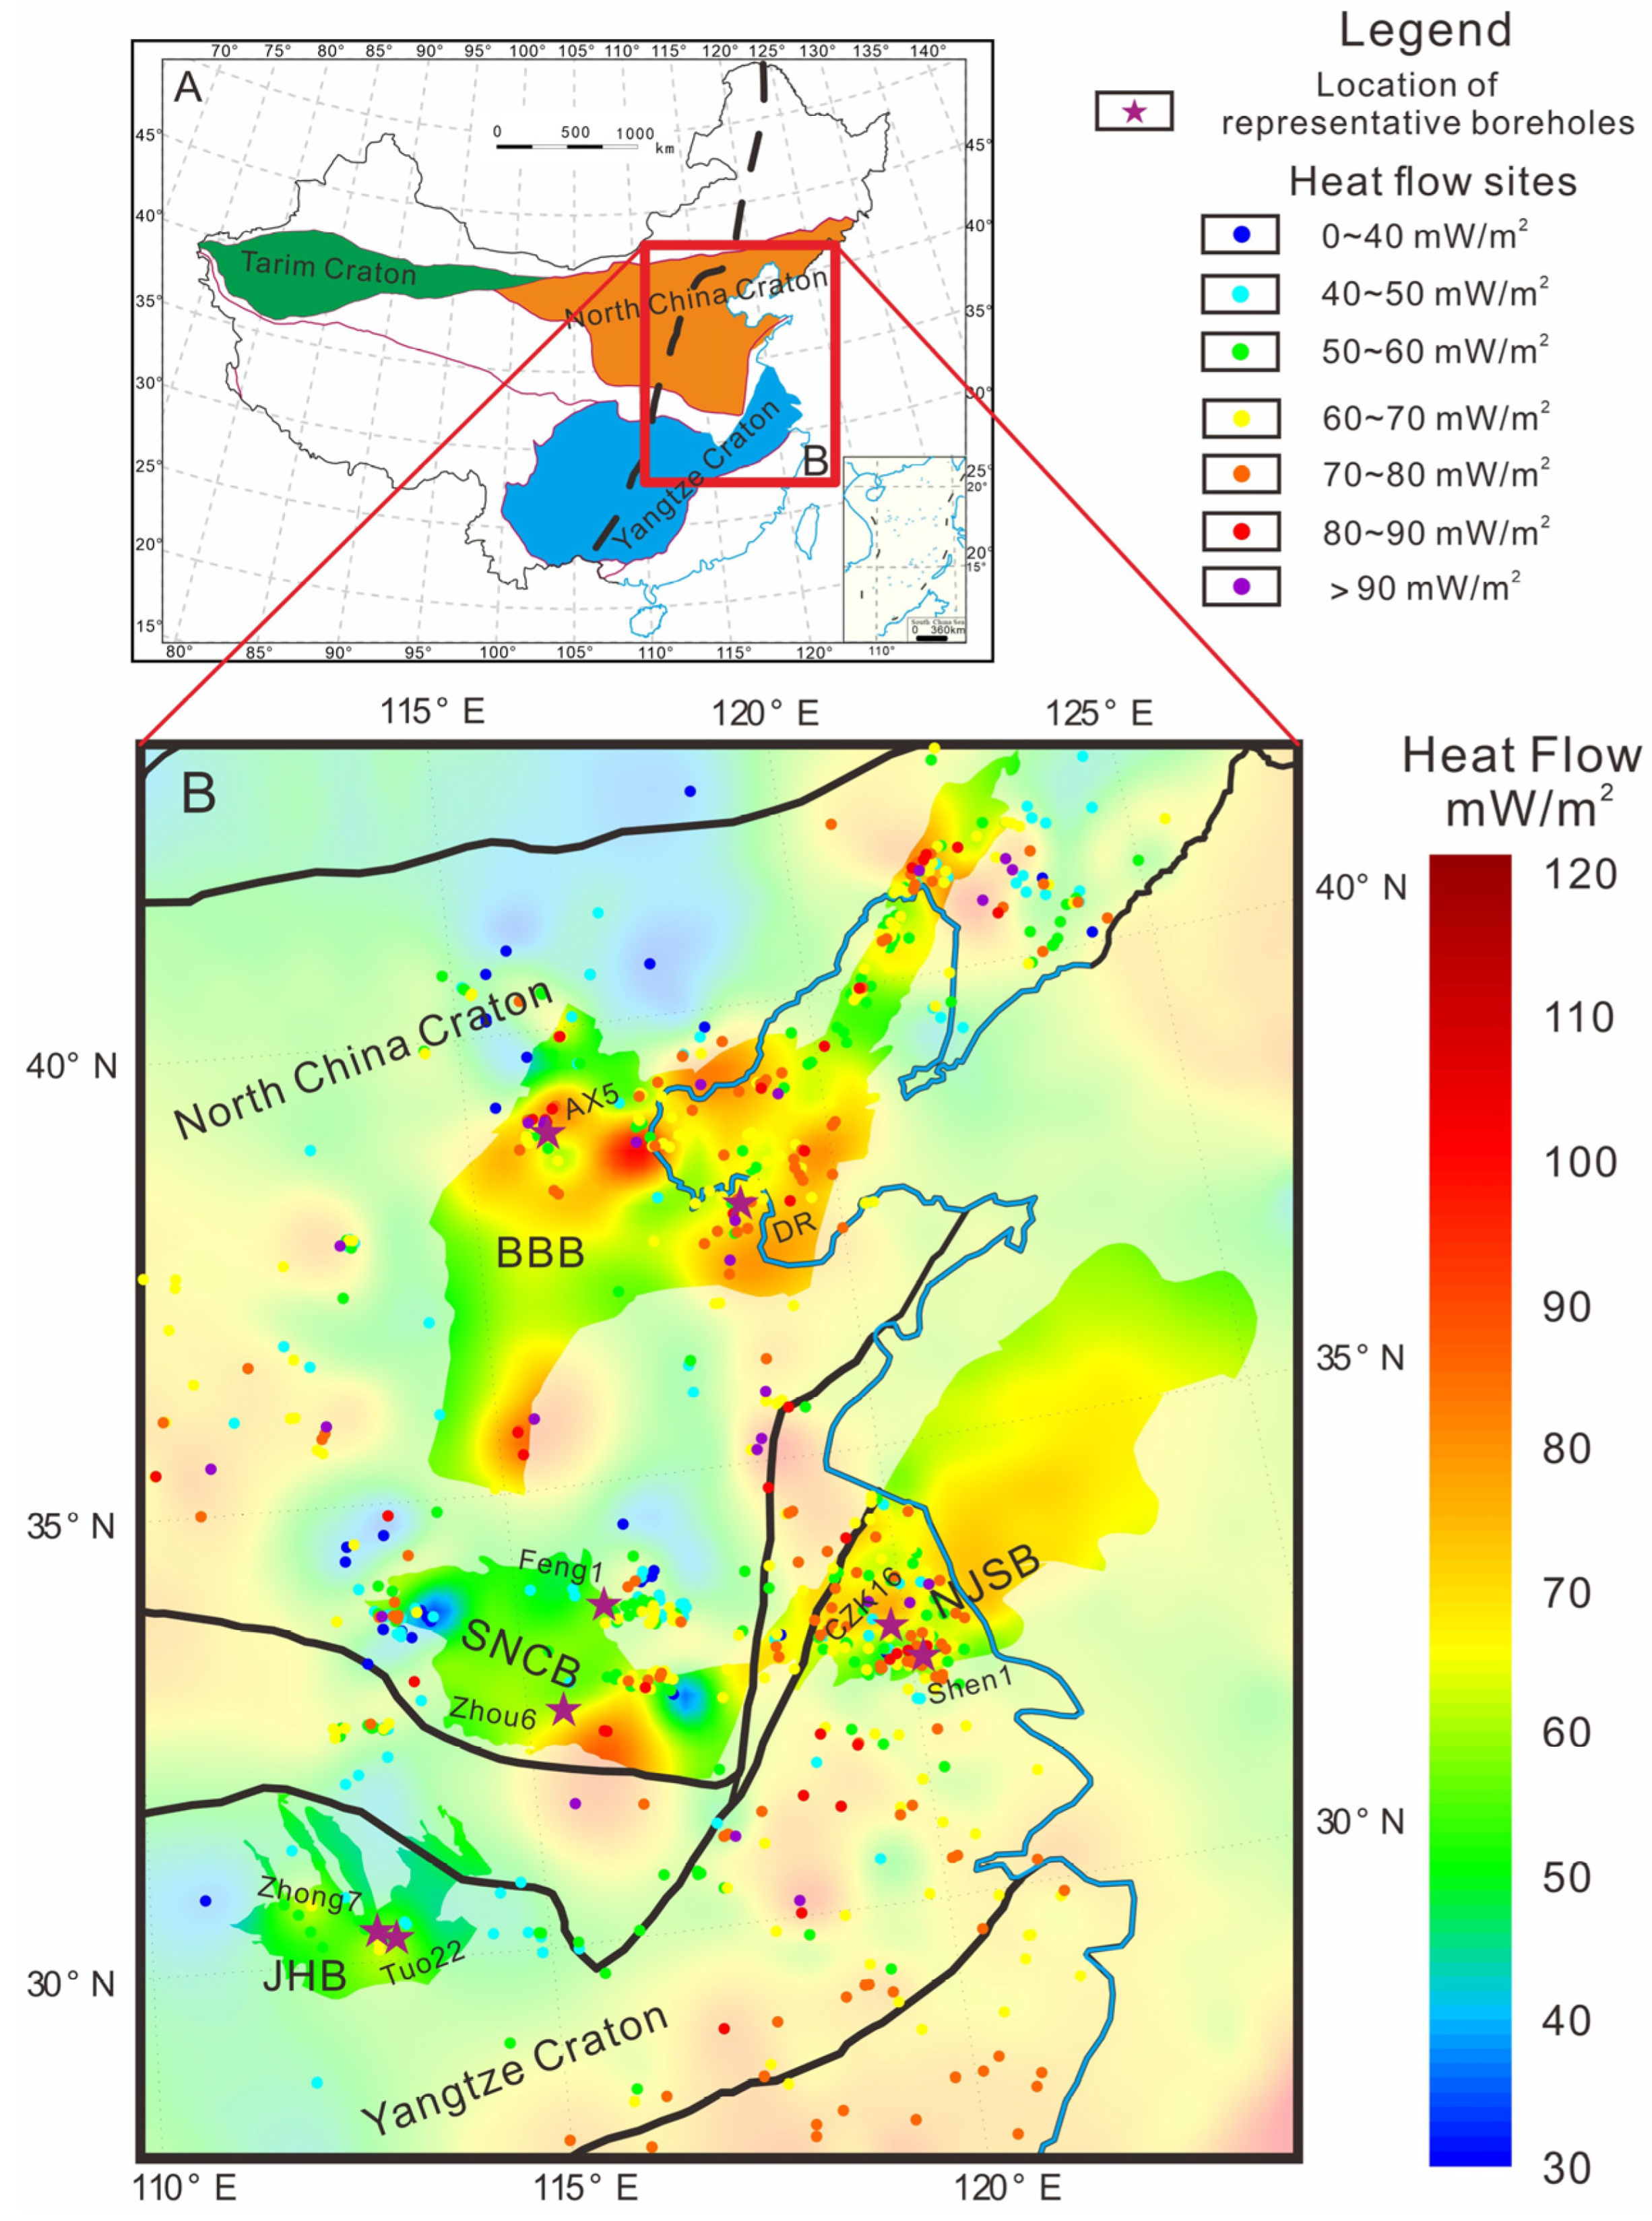
2. Geologic Setting
3. Materials and Methods
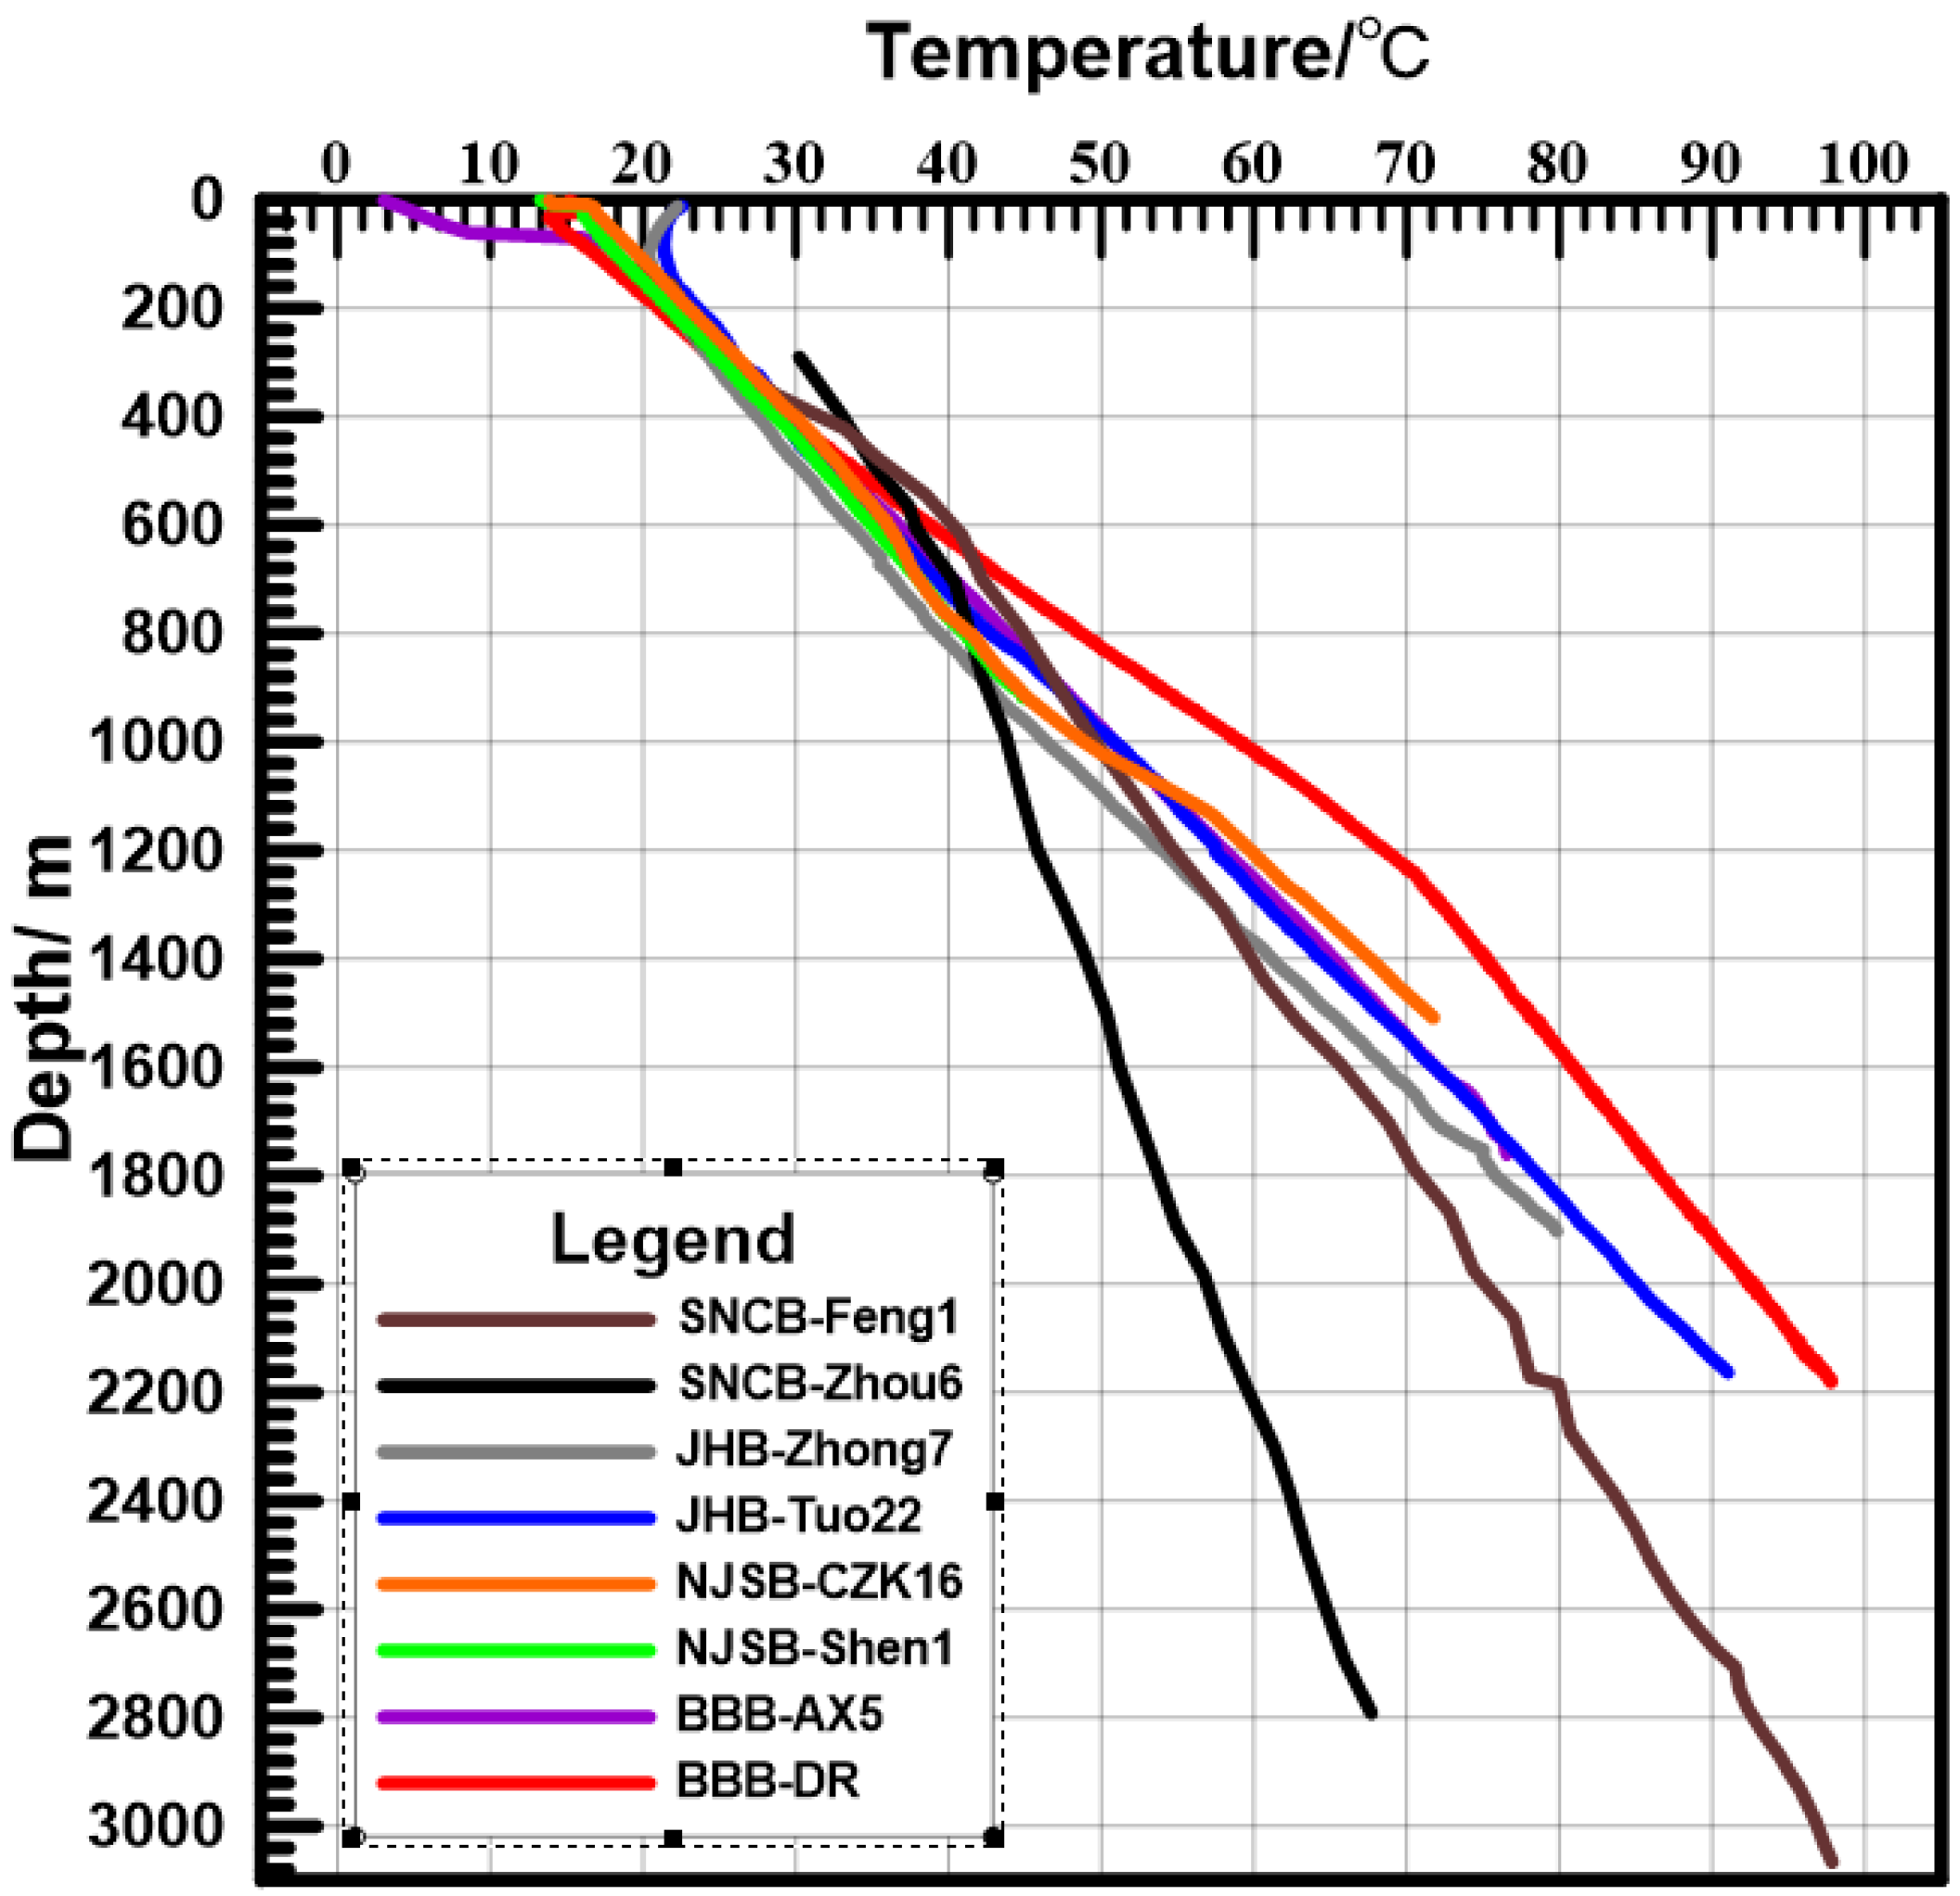
3.1. Geothermal Database
3.1.1. Terrestrial Heat Flow
3.1.2. Type and Temperature of Thermal Reservoir
3.1.3. Crustal Structure and Thermophysical Parameters
3.2. Methods
3.2.1. Changes in Vertical Heat Flow
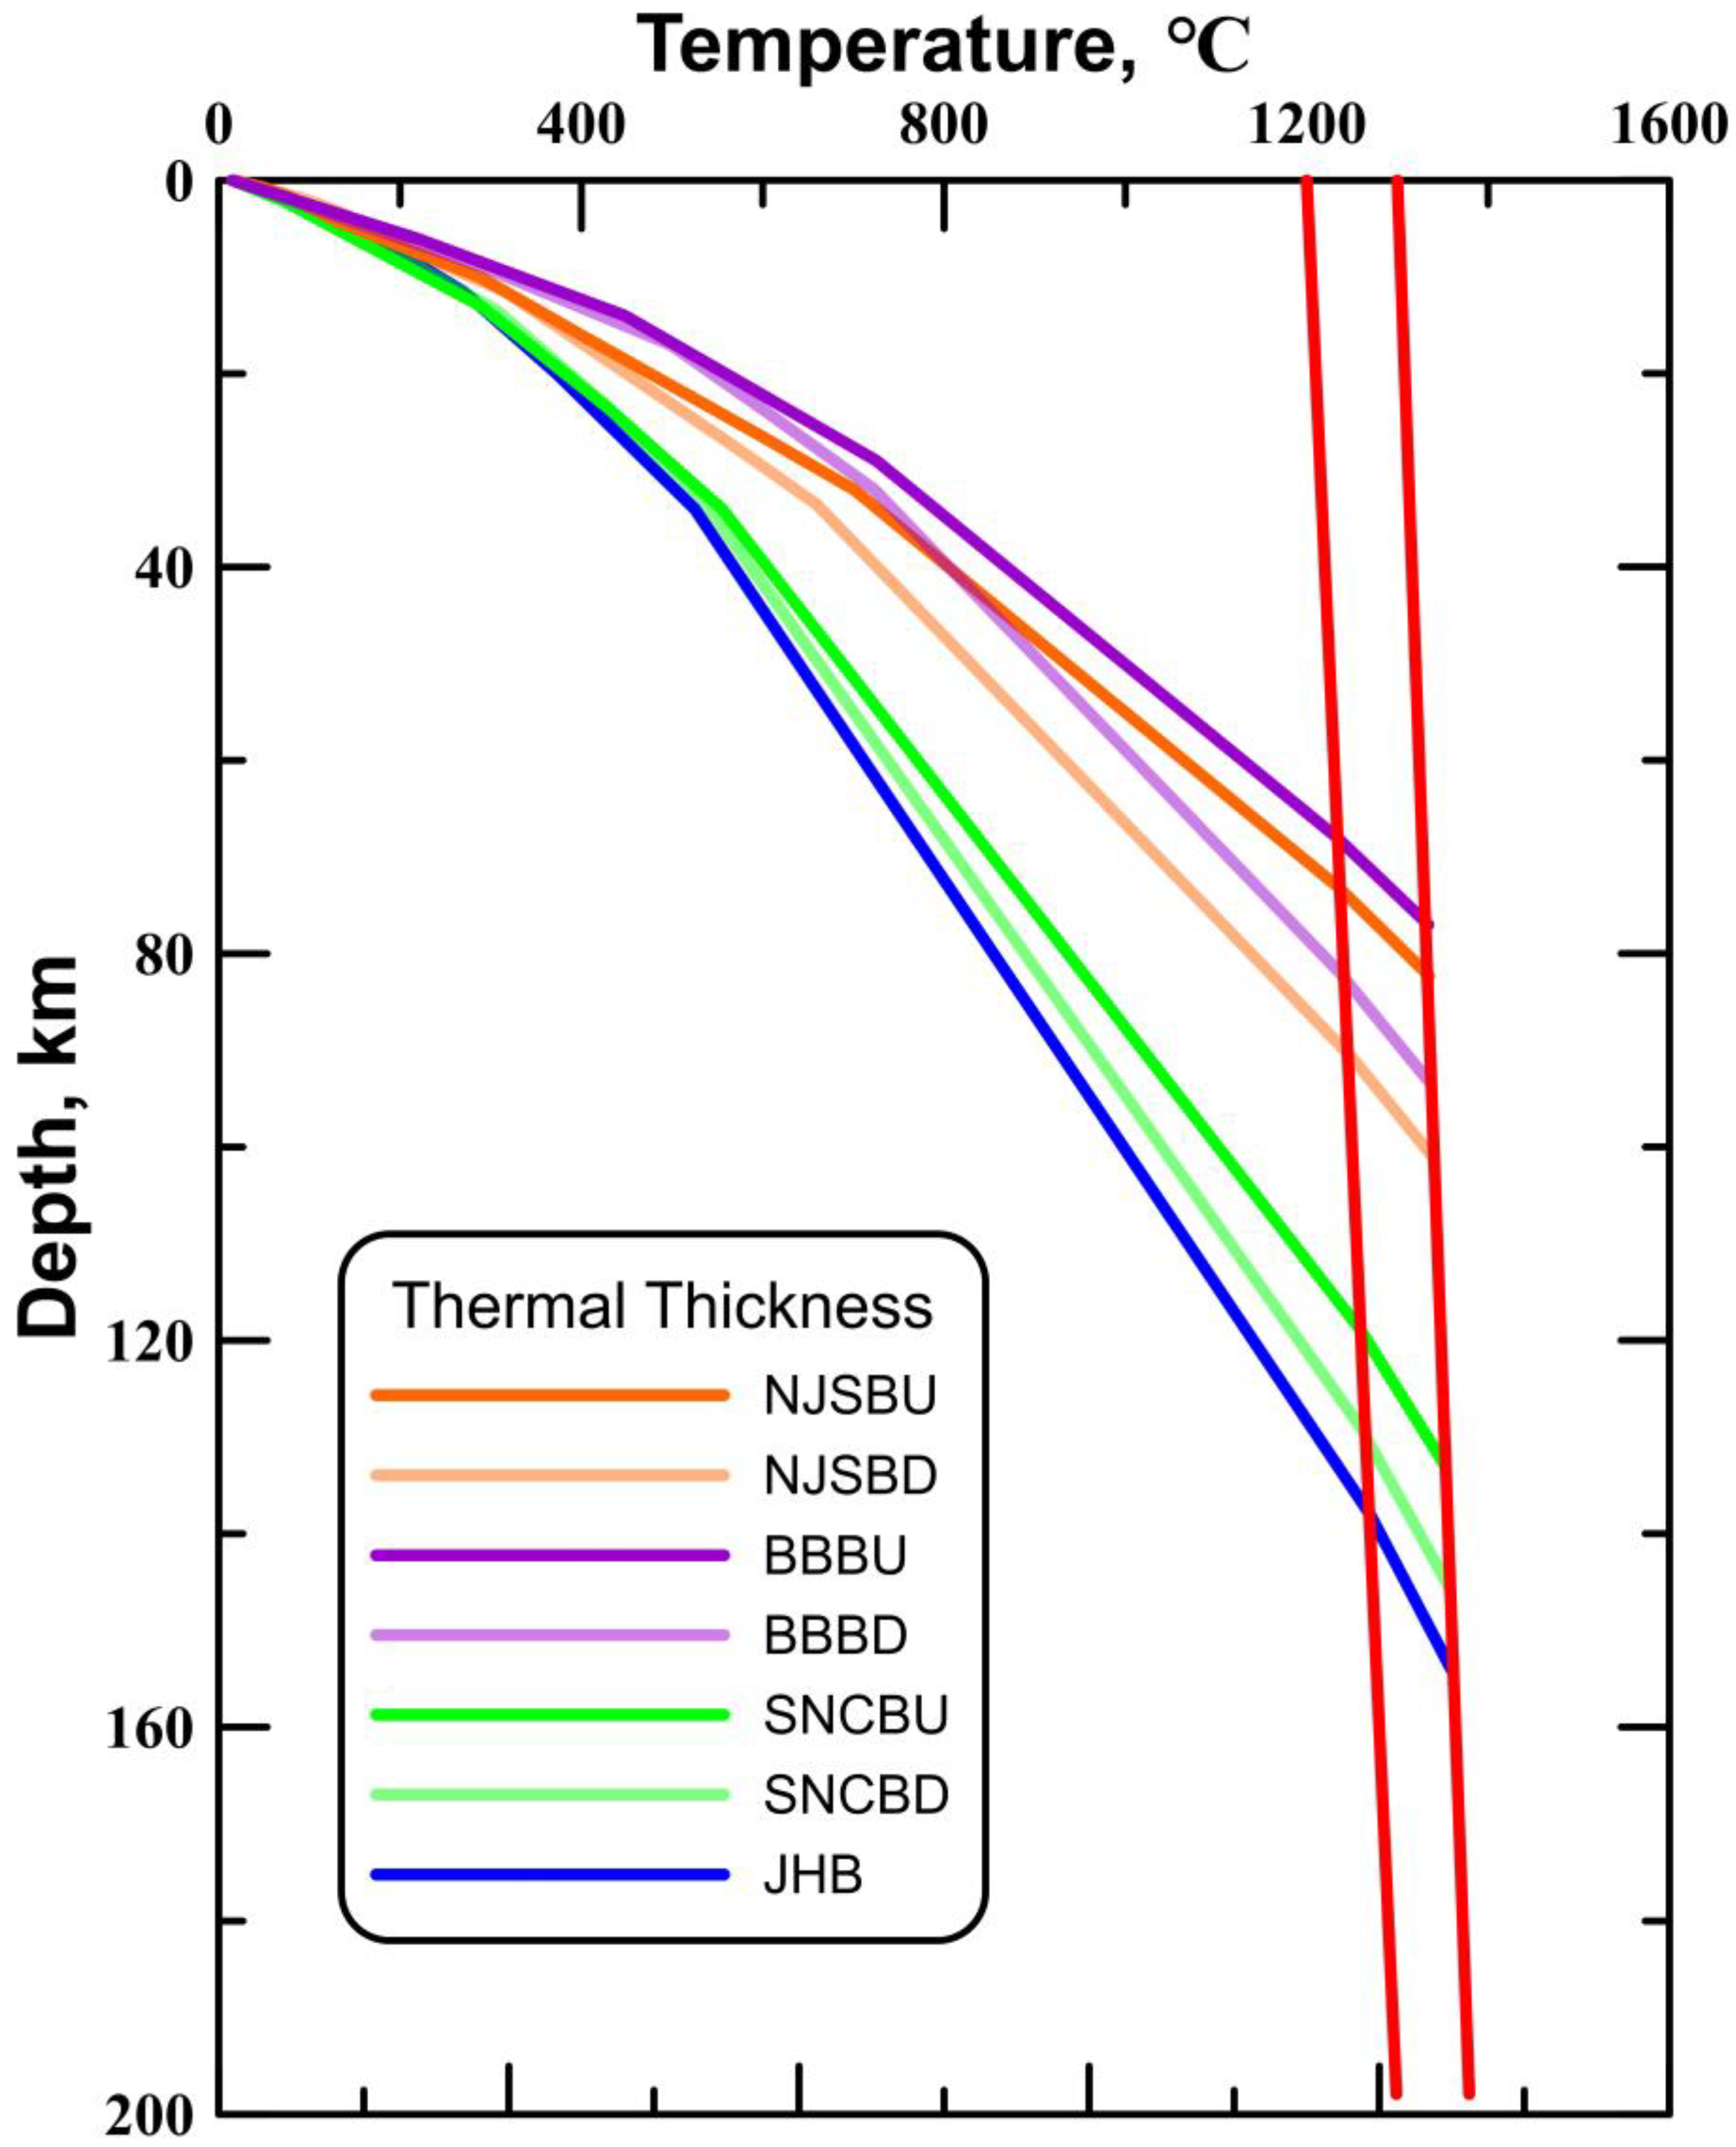
3.2.2. Temperature Curve of the Lithosphere
3.2.3. Calculation of Thermal Lithosphere Thickness
4. Results
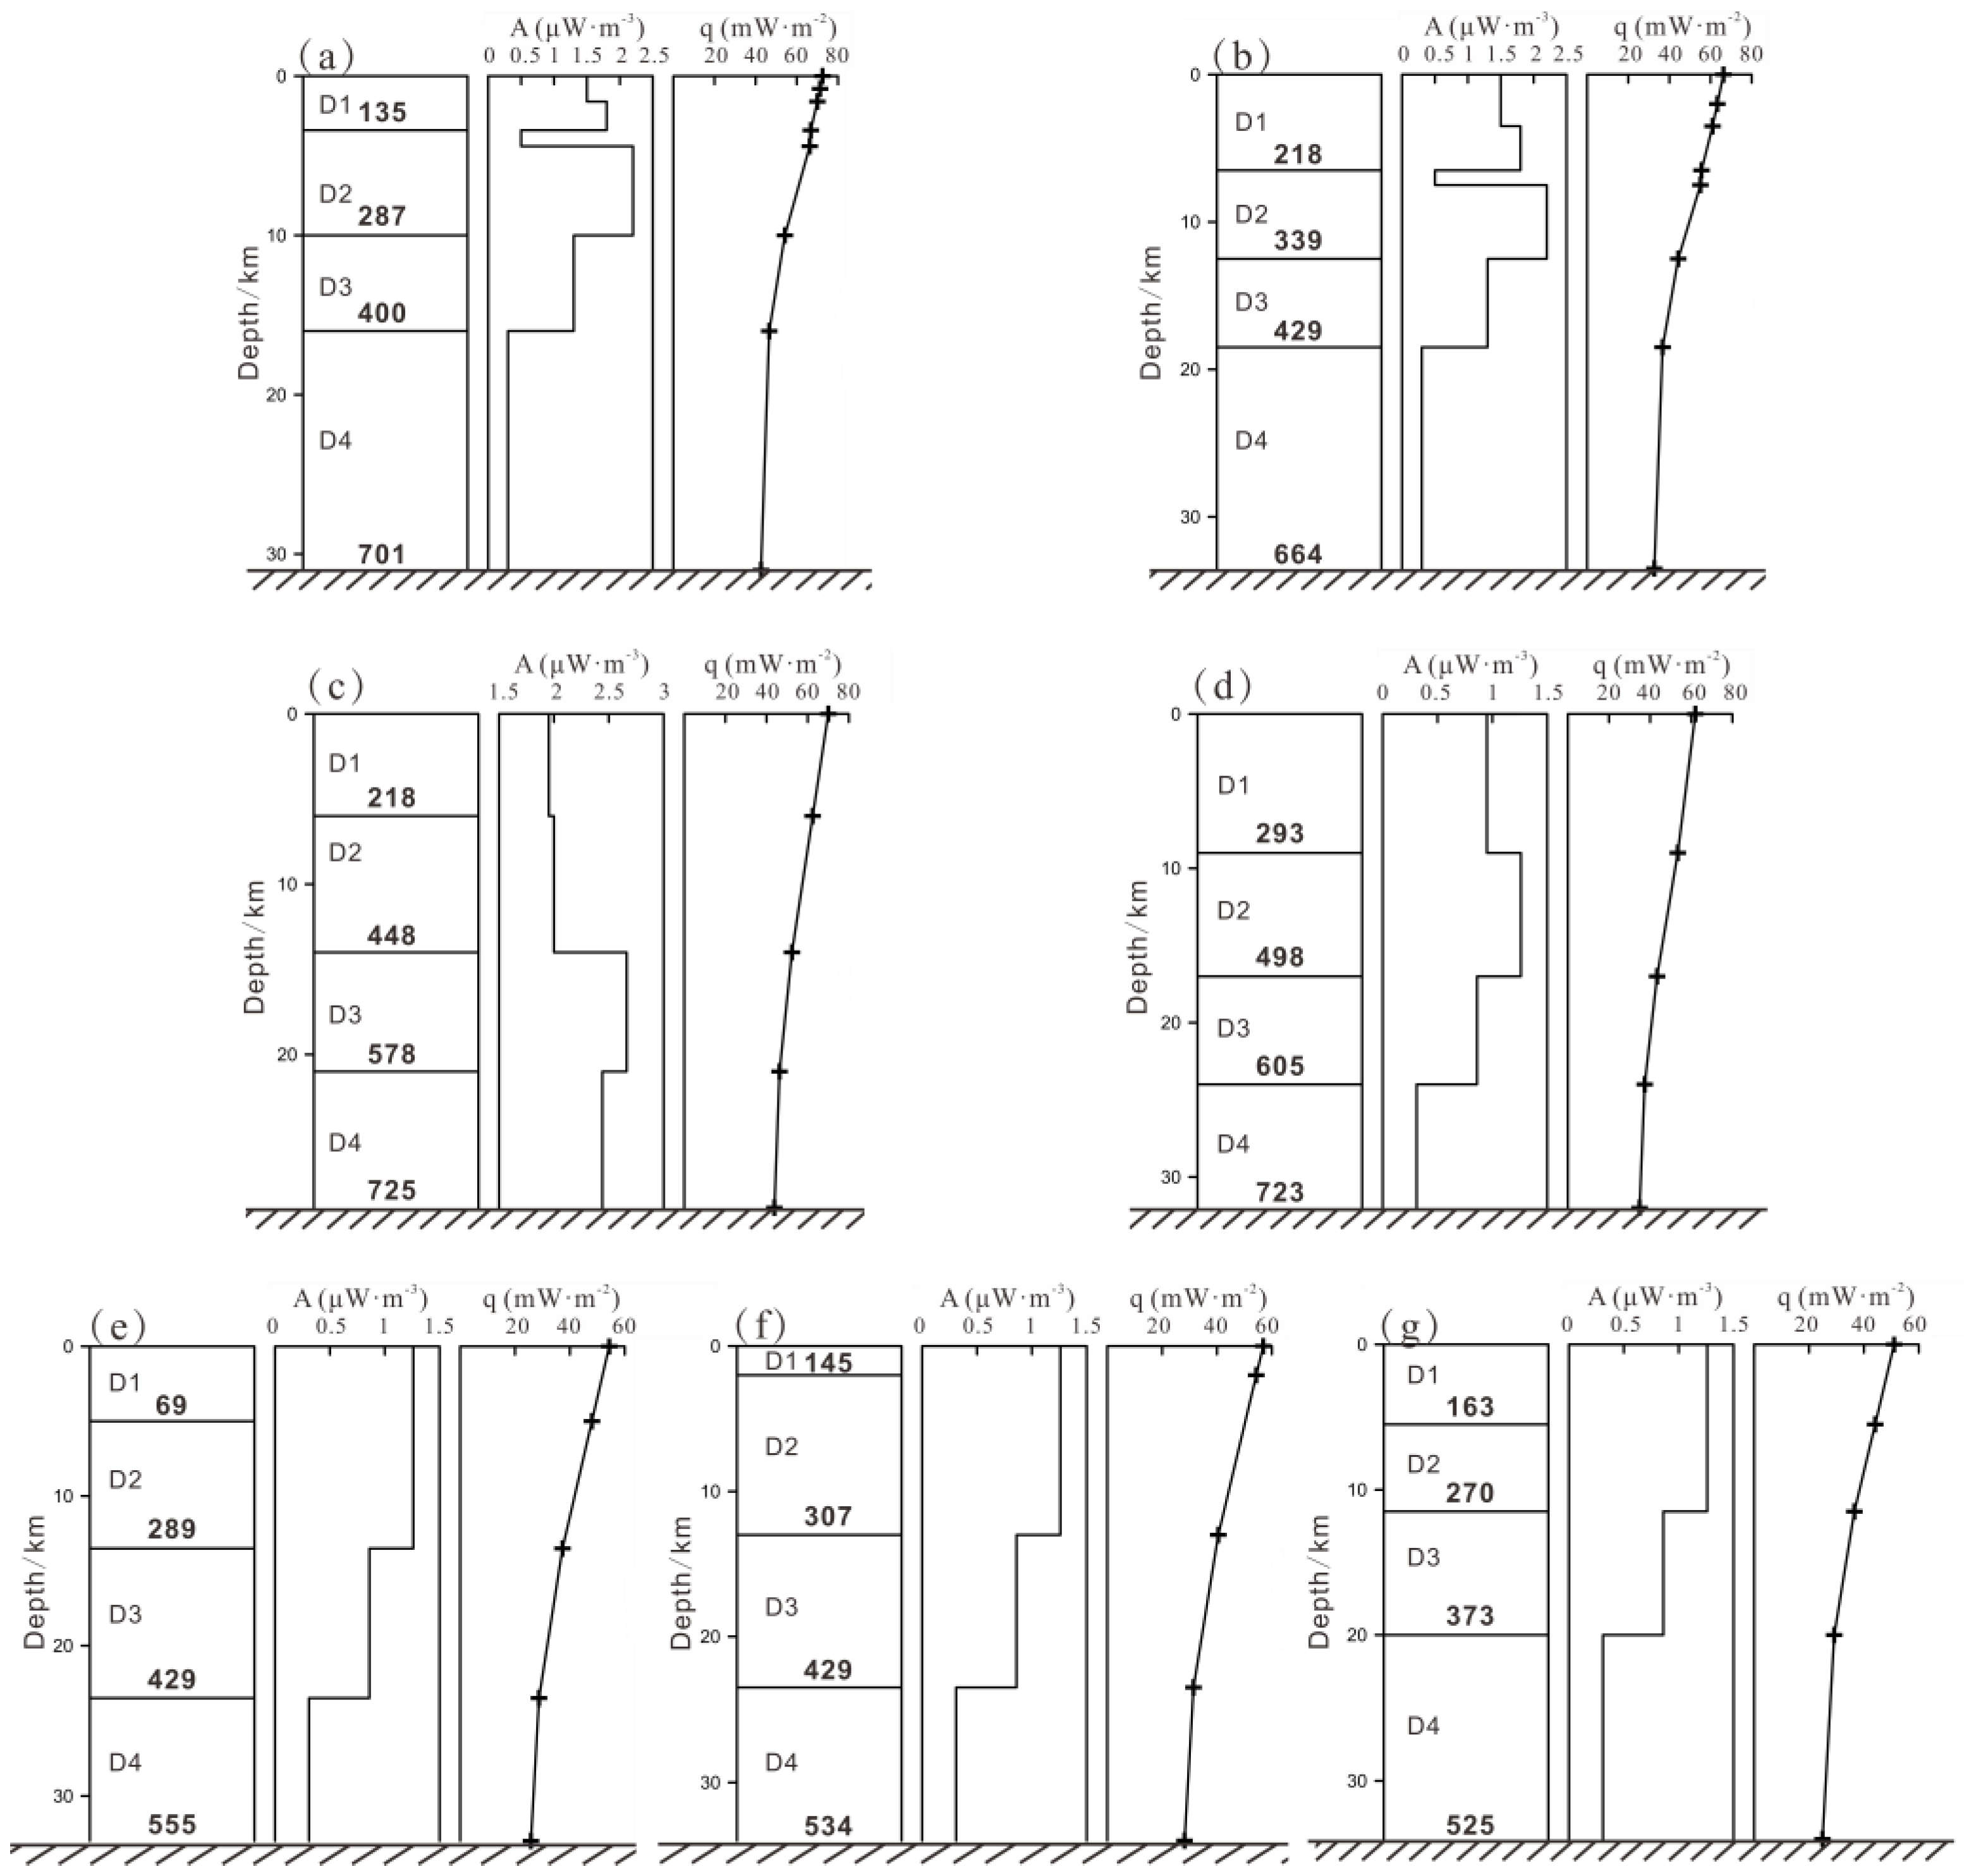
4.1. Contribution of Heat Flow from the Crust and Mantle
4.2. Comparison of Lithospheric Thermal Thicknesses
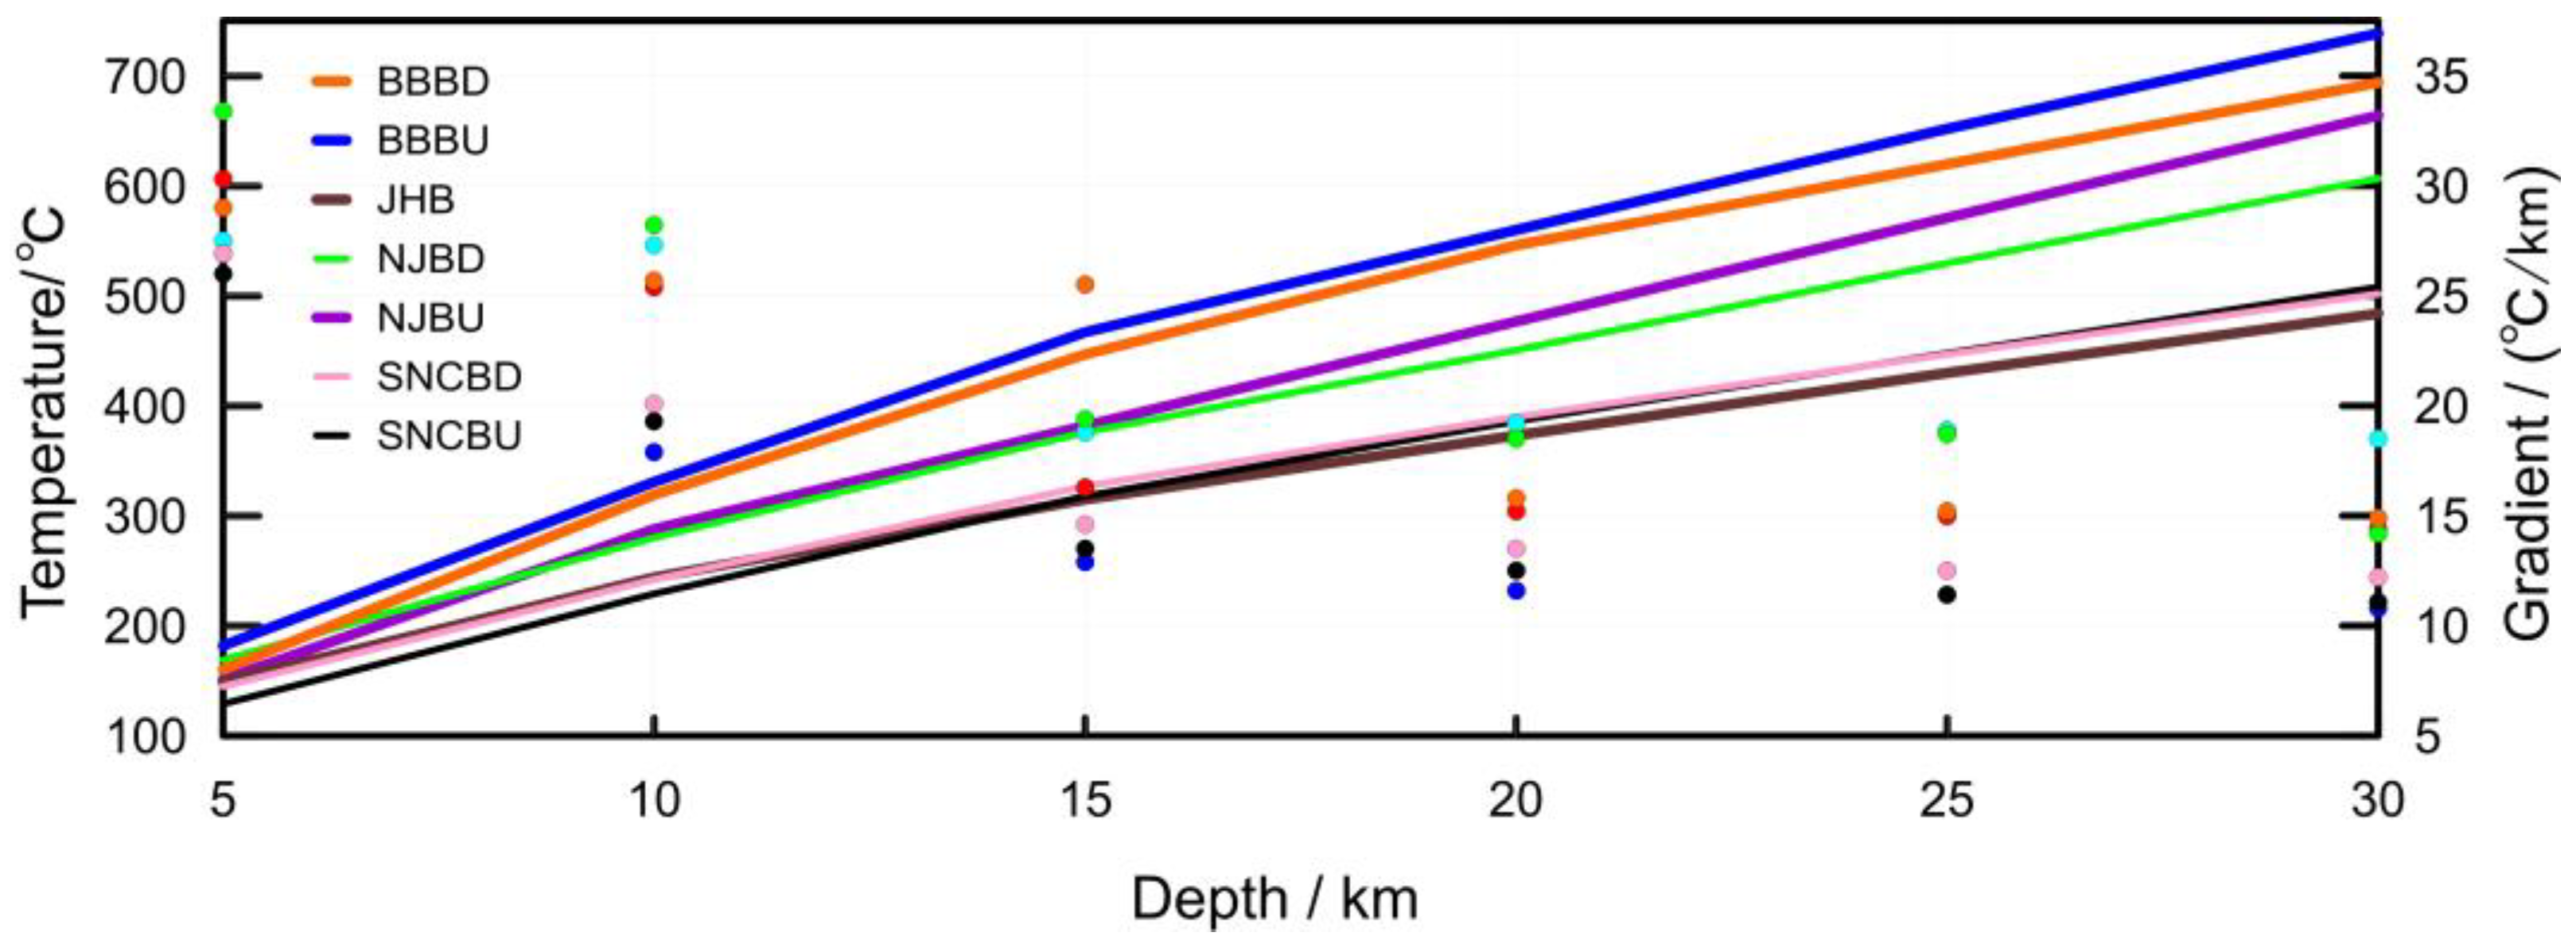
4.3. Lithospheric Temperature Variations at Different Depths and Implications for Geothermal Resource Potential
5. Discussion
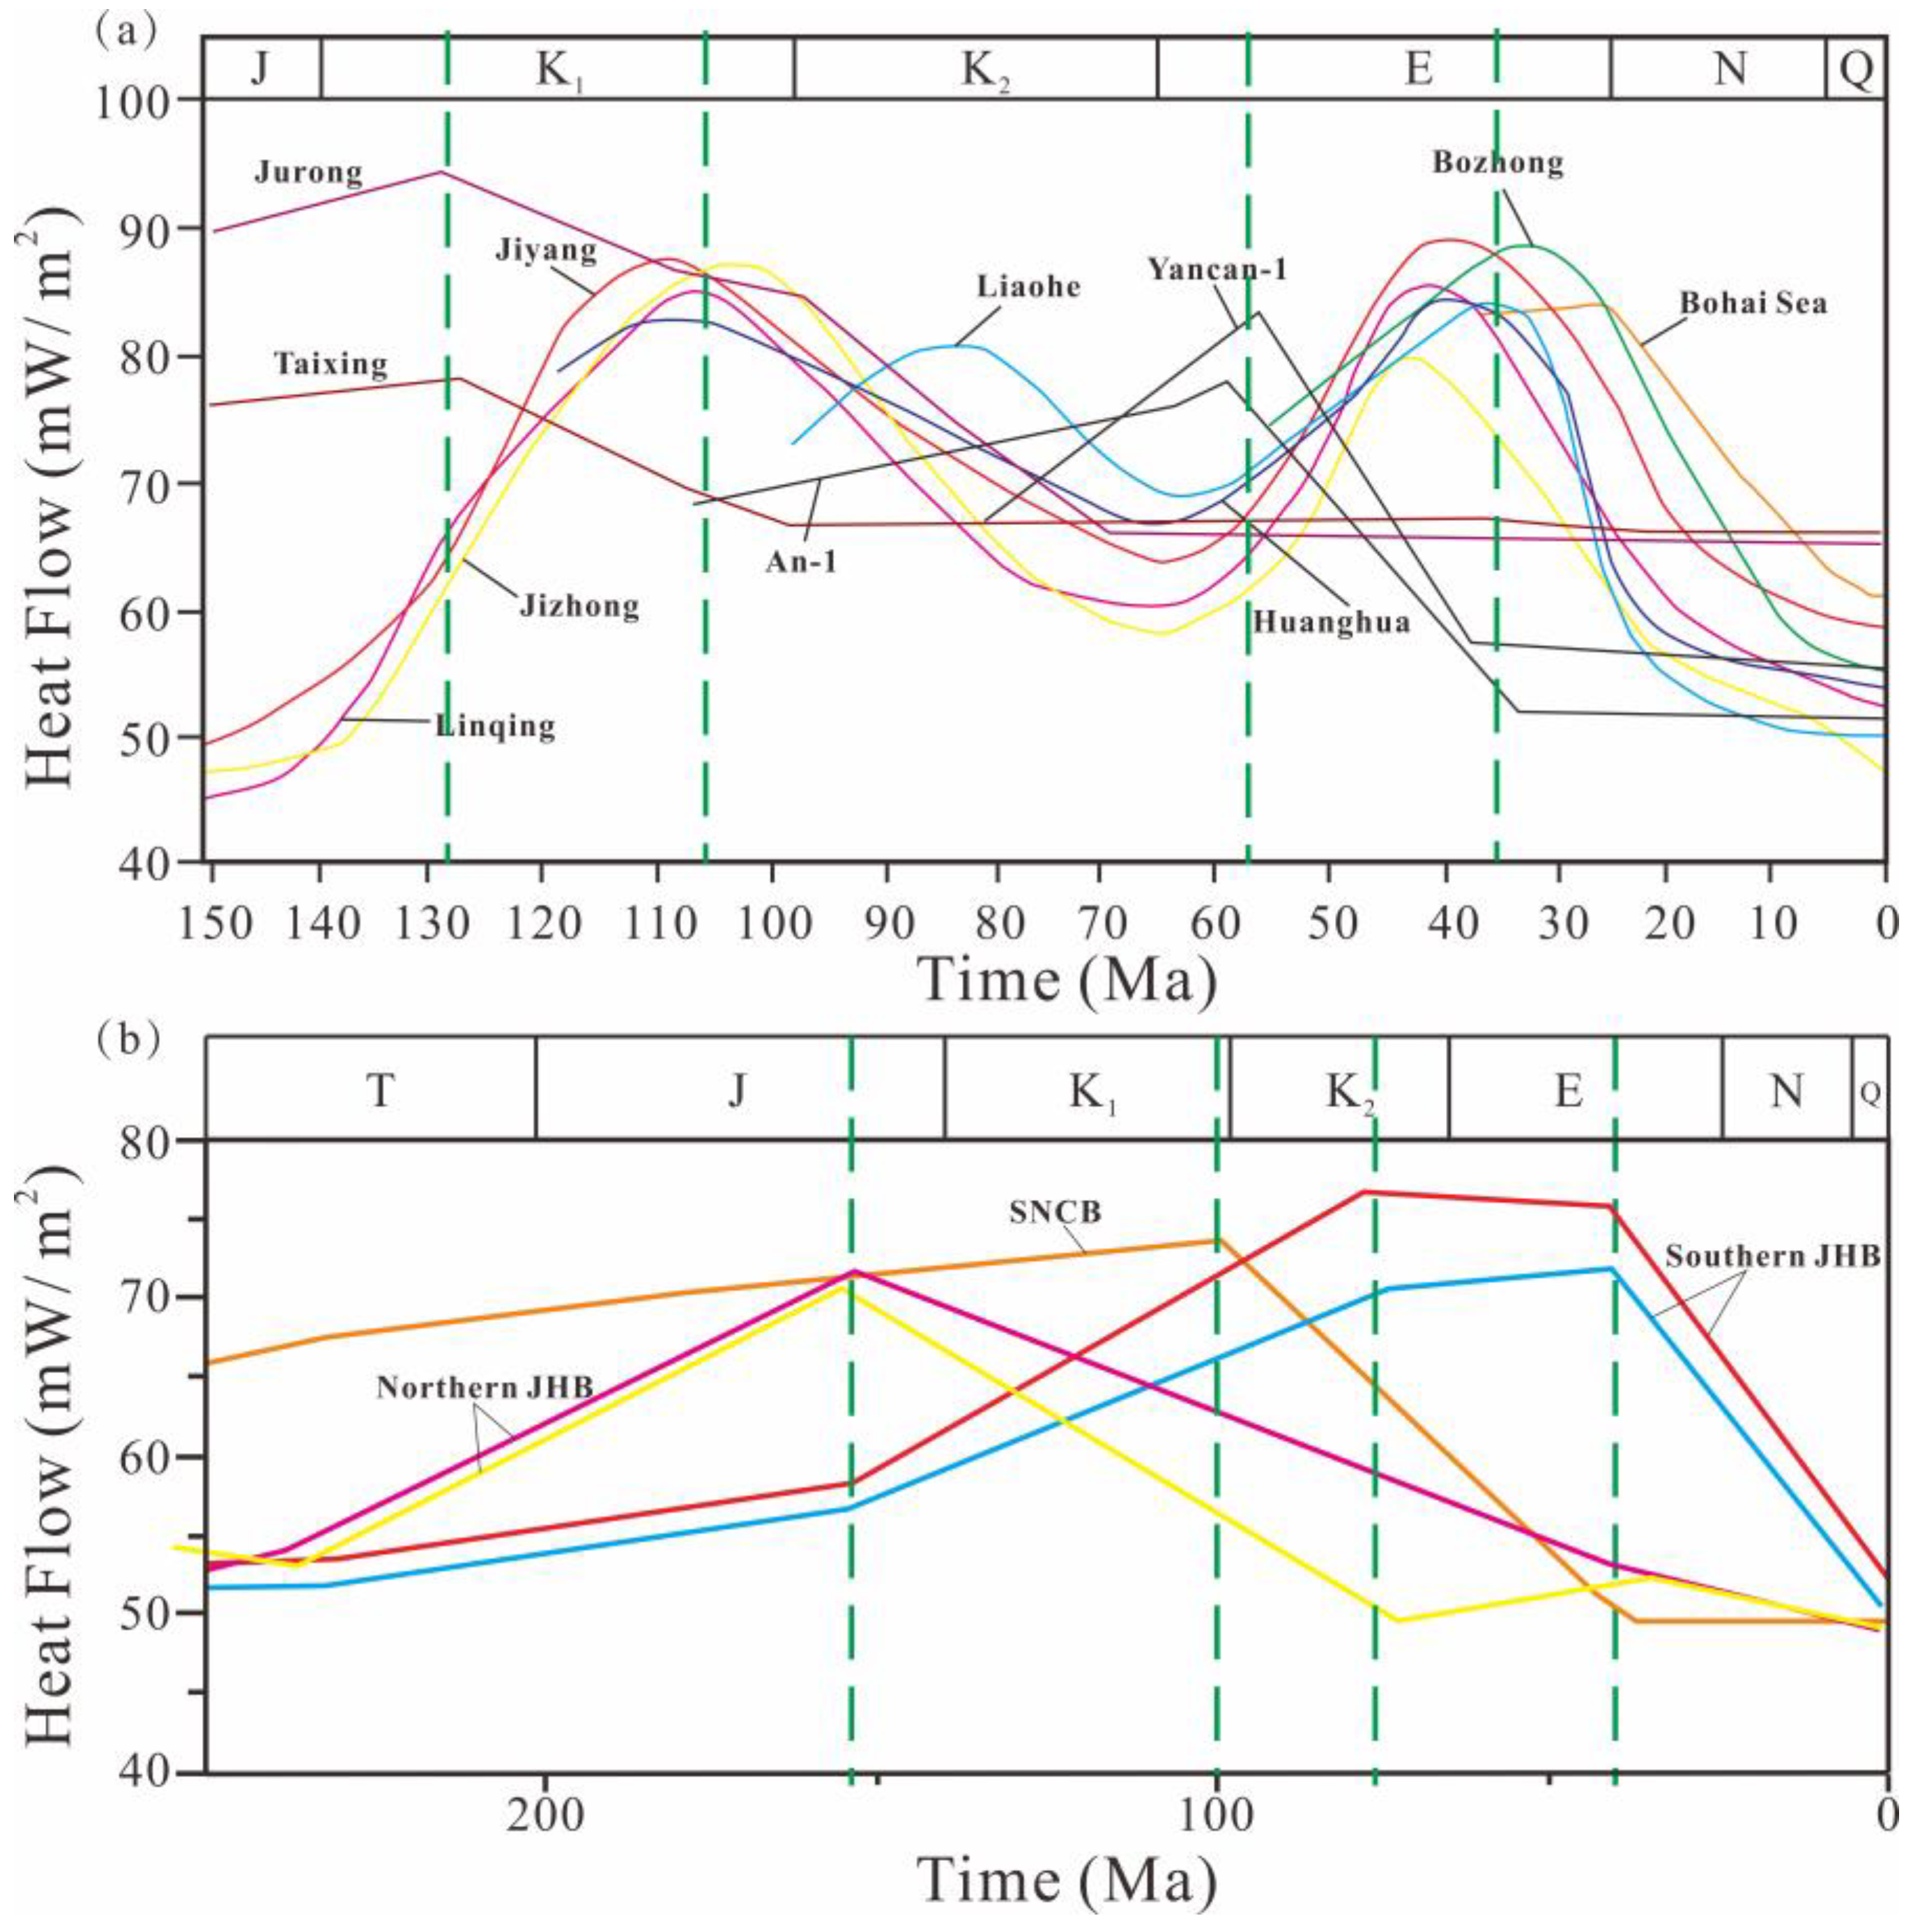
5.1. Analysis of Tectonic Activity and Thermal Regime Variability in the Cratons in East China
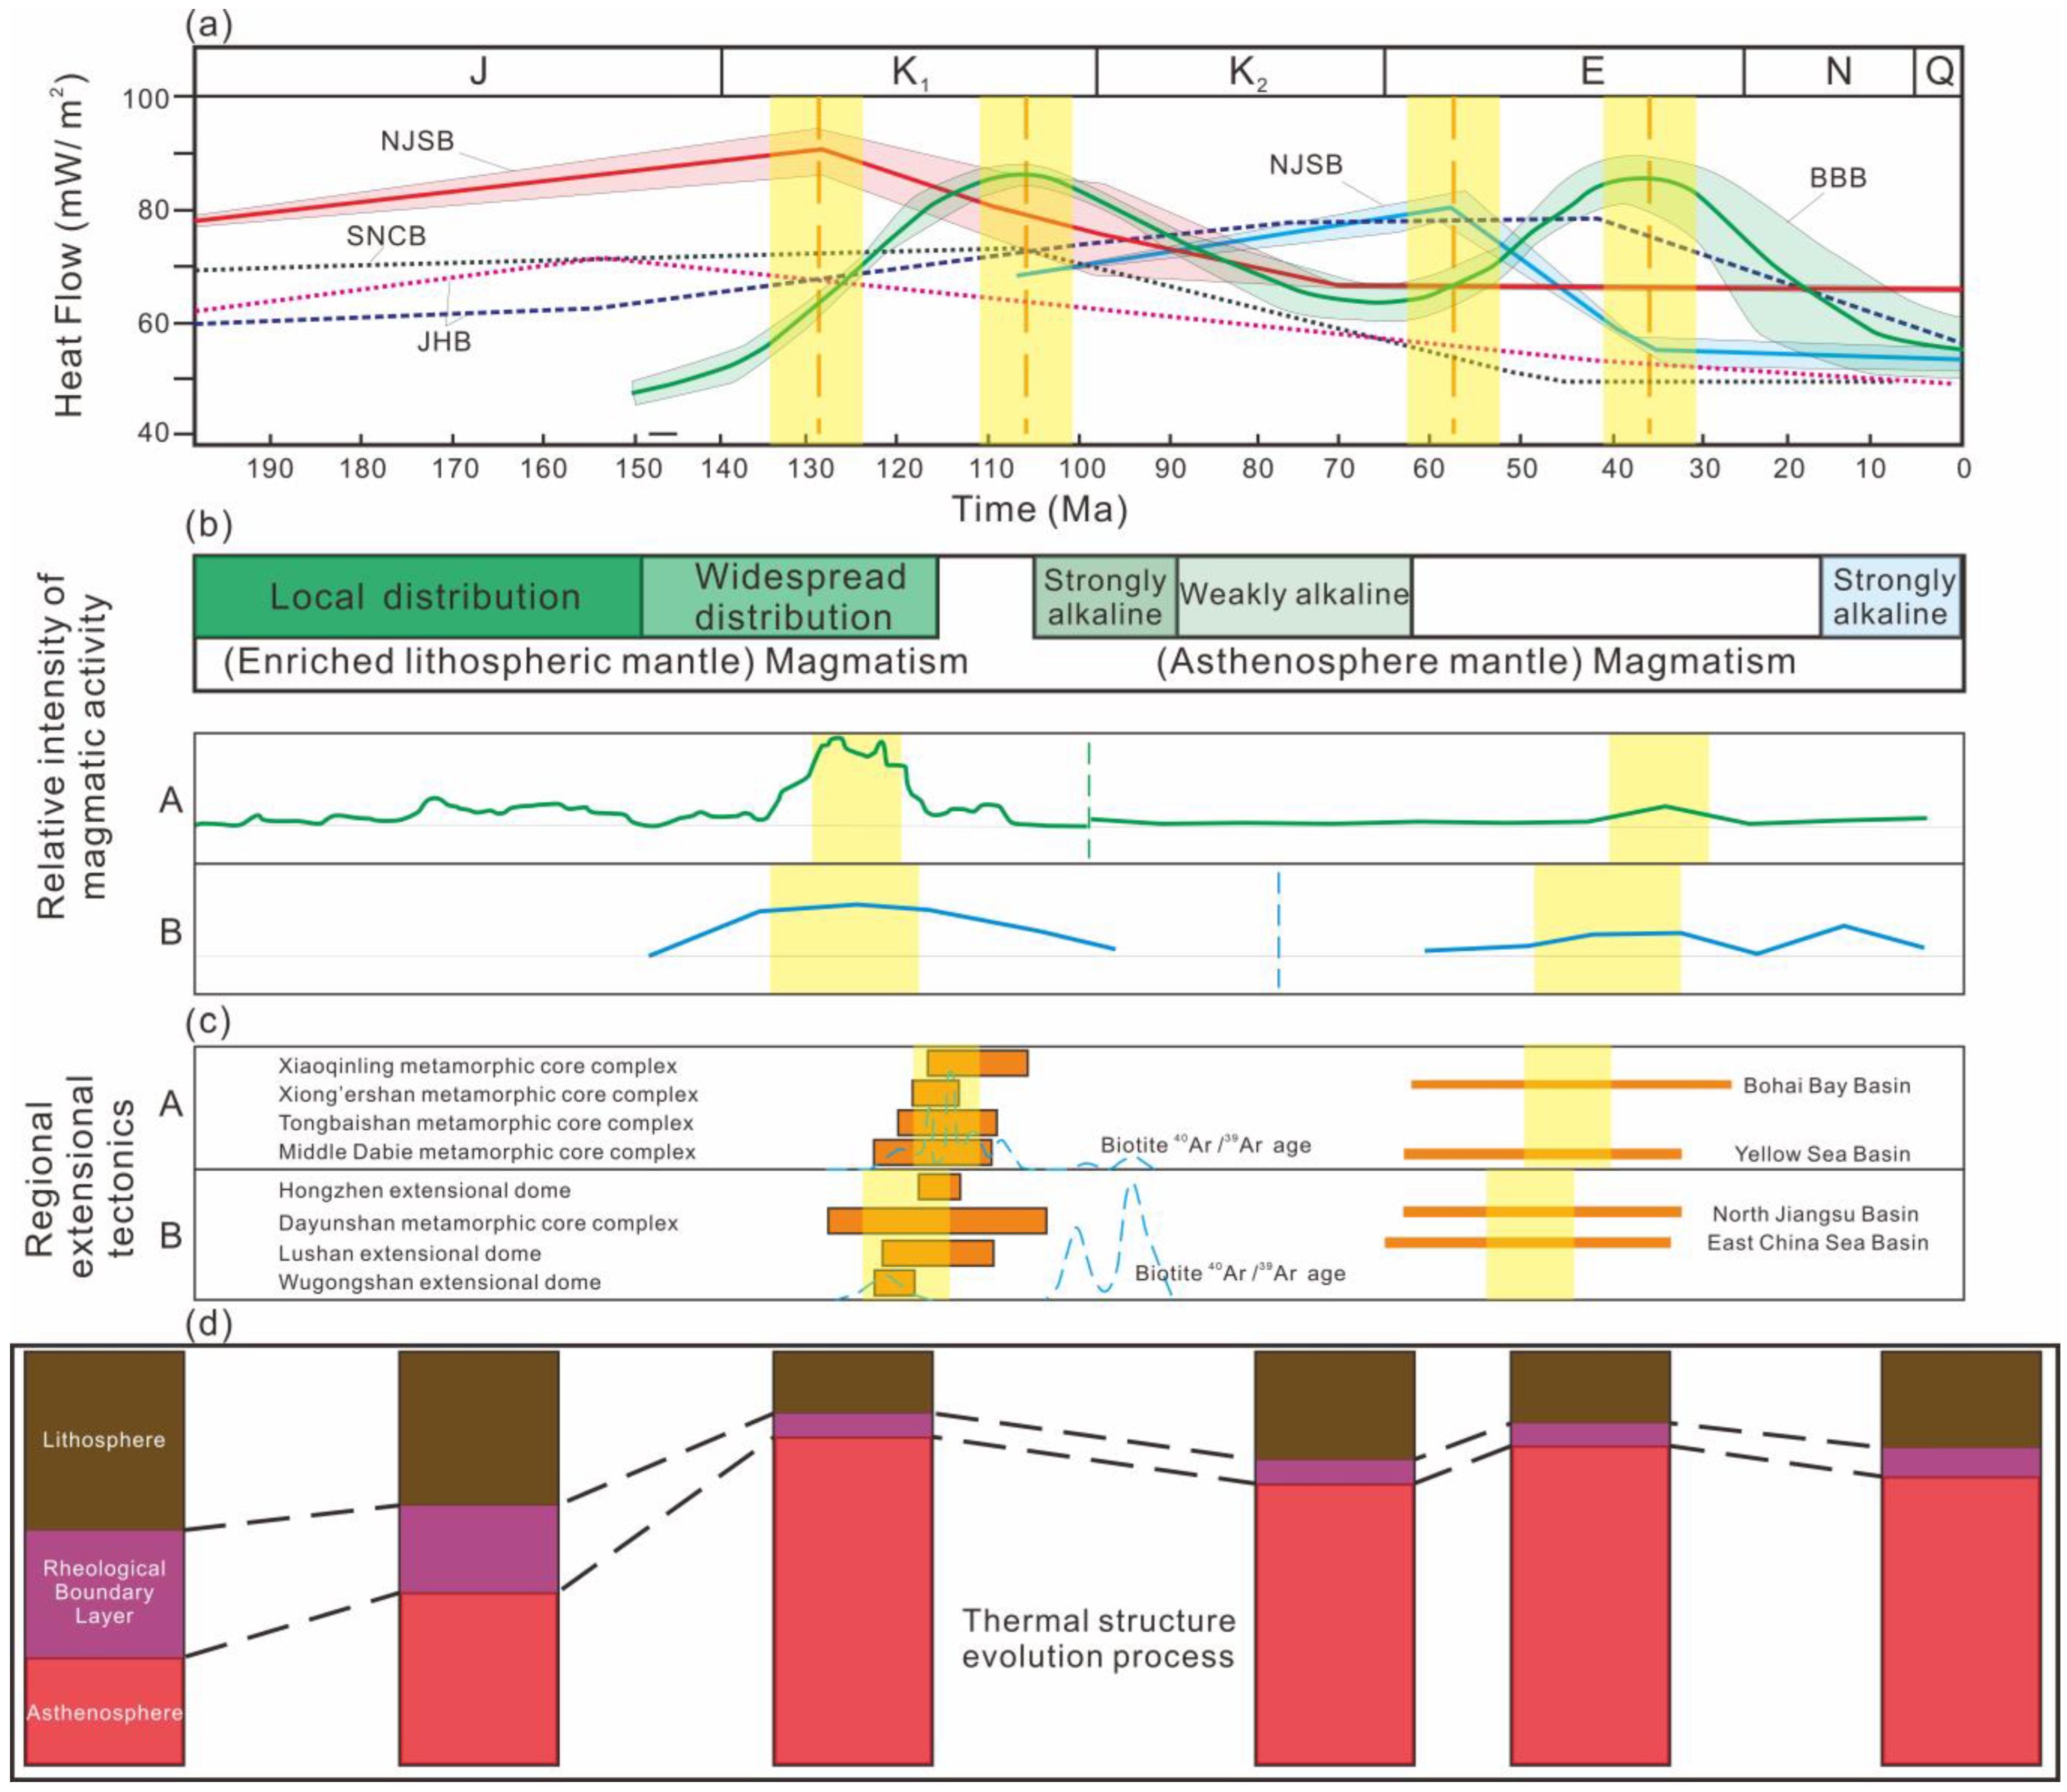
5.2. Tectonic Indicators and Dynamic Background

6. Conclusions
Author Contributions
Funding
Data Availability Statement
Conflicts of Interest
References
- Carlson, R.W.; Irving, A.J.; Schulze, D.J.; Hearn, B.C. Timing of lithospheric mantle modification beneath the Wyoming Craton. Int. Kimberl. Conf. Ext. Abstr. 2003, 8. [Google Scholar] [CrossRef]
- Lévy, F.; Jaupart, C. Temperature and rheological properties of the mantle beneath the North American craton from an analysis of heat flux and seismic data. J. Geophys. Res. 2011, 116, 1–25. [Google Scholar] [CrossRef]
- Peslier, A.H.; Woodland, A.B.; Bell, D.R.; Lazarov, M. Olivine water contents in the continental lithosphere and the longevity of cratons. Nature 2010, 467, 78–81. [Google Scholar] [CrossRef]
- Kusky, T.M.; Windley, B.F.; Wang, L.; Wang, Z.; Li, X.; Zhu, P. Flat slab subduction, trench suction, and craton destruction: Comparison of the North China, Wyoming, and Brazilian cratons. Tectonophysics 2014, 630, 208–221. [Google Scholar] [CrossRef]
- Xu, W.; Qiu, N.S. Heat flow and destabilized cratons: A comparative study of the North China, Siberian, and Wyoming cratons. Int. Geol. Rev. 2017, 59, 884–907. [Google Scholar] [CrossRef]
- Pandey, O.P.; Dwivedi, S.K. Decratonised lithosphere associated with mantle plume upwelling in the Singhbhum craton, eastern India based on geophysical and geodynamic perspective. J. Asian Earth Sci. 2023, 246, 105572. [Google Scholar] [CrossRef]
- Wang, Y.Y.; Cao, Z.B.; Peng, L.H.; Liu, L.J.; Chen, L.; Lundstrom, C.; Peng, D.D.; Yang, X.T. Secular craton evolution due to cyclic deformation of underlying dense mantle lithosphere. Nat. Geosci. 2023, 16, 637–645. [Google Scholar] [CrossRef]
- Chen, L.; Wang, T.; Zhao, L.; Zheng, T.Y. Distinct lateral variation of lithospheric thickness in the Northeastern North China Craton. Earth Planet. Sci. Lett. 2008, 267, 56–68. [Google Scholar] [CrossRef]
- Griffin, W.L.; Zhang, A.; O’Reilly, S.Y.; Ryan, C.G. Phanerozoic evolution of the lithosphere beneath the Sino-Korean Craton. In Mantle Dynamics and Plate Interactions in East Asia; American Geophysical Union: Washington, DC, USA, 1998; pp. 107–126. [Google Scholar]
- Menzies, M.A.; Fan, W.; Zhang, M. Palaeozoic and Cenozoic lithoprobes and the loss of >120 km of Archaean lithosphere, Sino-Korean craton, China. Geol. Soc. Lond. Spec. Publ. 1993, 76, 71–81. [Google Scholar] [CrossRef]
- Wu, F.Y.; Yang, J.H.; Xu, Y.G.; Wilde, S.A.; Walker, R.J. Destruction of the North China Craton in the Mesozoic. Annu. Rev. Earth Planet. Sci. 2019, 47, 173–195. [Google Scholar] [CrossRef]
- Xu, Y.G. Thermo-tectonic destruction of the Archaean lithospheric keel beneath the Sino-Korean Craton in China: Evidence, timing and mechanism. Phys. Chem. Earth Part A Solid Earth Geod. 2001, 26, 747–757. [Google Scholar] [CrossRef]
- Zhang, S.H.; Zhao, Y.; Davis, G.A.; Ye, H.; Wu, F. Temporal and spatial variations of Mesozoic magmatism and deformation in the North China Craton: Implications for lithospheric thinning and decratonization. Earth-Sci. Rev. 2014, 131, 49–87. [Google Scholar] [CrossRef]
- Chen, H.; Tang, M.; Song, S.G. Catastrophic craton destruction via wholesale lithosphere delamination. Geology 2023, 51, 460–464. [Google Scholar] [CrossRef]
- Wang, L.; Liu, J.; Xu, Q.H.; Xia, Q.K. Craton destruction induced by drastic drops in lithospheric mantle viscosity. Earth Space Sci. 2022, 9, e2022EA002455. [Google Scholar] [CrossRef]
- Xu, Y.X.; Zhang, Y.; Yang, B.; Bao, X.W. Phanerozoic evolution of lithospheric structures of the North China Craton. Geophys. Res. Lett. 2022, 49, e2022GL098341. [Google Scholar] [CrossRef]
- He, L.J.; Zhang, L.Y. Thermal evolution of cratons in China. J. Asian Earth Sci. 2018, 164, 237–247. [Google Scholar] [CrossRef]
- Qiu, N.S.; Zuo, Y.H.; Xu, W.; Li, W.Z.; Chang, J.; Zhu, C.Q. Meso-Cenozoic lithosphere thinning in the eastern North China Craton: Evidence from thermal history of the Bohai Bay Basin, North China. J. Geol. 2016, 124, 195–219. [Google Scholar] [CrossRef]
- Jiang, G.Z.; Hu, S.B.; Shi, Y.Z.; Zhang, C.; Wang, Z.T.; Hu, D. Terrestrial heat flow of continental China: Updated dataset and tectonic implications. Tectonophysics 2019, 753, 36–48. [Google Scholar] [CrossRef]
- Wang, Y.B.; Bai, Y.; Wang, L.J.; Guan, J.P.; Wang, Y.Q.; Wang, Z.T.; Hu, J.; Hu, S.B. Exploration process and genesis mechanism of deep geothermal resources in the North Jiangsu Basin, East China: From nothing to something. Front. Earth Sci. 2021, 9, 784600. [Google Scholar] [CrossRef]
- Wang, Y.B.; Furlong, K.; Fuchs, S.; He, L.J.; Hu, S.B. Terrestrial heat flow variation with depth caused by anomalously high radiogenic heat production. Geophys. Res. Lett. 2023, 50, e2022GL102312. [Google Scholar] [CrossRef]
- Wang, Y.B.; Hu, D.; Guan, J.P.; Wang, L.J.; Bai, Y.; Wang, Z.T.; Jiang, G.Z.; Hu, J.; Tang, B.N.; Zhu, C.Q.; et al. The present-day geothermal regime of the North Jiangsu Basin, East China. Geothermics 2020, 88, 101829. [Google Scholar] [CrossRef]
- He, L.J.; Hu, S.B.; Wang, J.Y. Characteristics of the lithospheric thermal structure in the eastern continental region of China. Prog. Nat. Sci. 2001, 11, 966–969. [Google Scholar]
- Zang, S.X.; Liu, Y.G.; Ning, J.Y. Thermal Structure of the Lithosphere in North China. Chin. J. Geophys. Chin. Ed. 2002, 45, 56–66. [Google Scholar]
- Wang, K.; Xiong, X.; Zhou, Y.M.; Feng, Y.S. Three-Dimensional Thermo-Rheological Structure of the Lithosphere in the North China Craton Determined by Integrating Multiple Observations: Implications for the Formation of Rifts. Sci. China Earth Sci. 2020, 63, 969–984. [Google Scholar] [CrossRef]
- Liu, S.W.; Wang, L.S.; Gong, Y.L.; Li, C.; Li, H.; Han, Y.B. Thermo-rheological structure of the lithosphere of the Jiyang depression and its geodynamic significance. Sci. China Earth Sci. 2005, 35, 203–214. [Google Scholar]
- Peng, B.; Zou, H.Y. Presentday Geothermal Structure of Lithosphere and the Cenozoic Tectonothermal Evolution of Bohai Basin. Geoscience 2013, 27, 1399–1406. [Google Scholar]
- Zuo, Y.H.; Qiu, N.S.; Chang, J.; Hao, Q.Q.; Li, Z.X.; Li, J.W.; Li, W.Z.; Xie, C.H. Meso-Cenozoic Lithospheric Thermal Structure in the Bohai Bay Basin. Acta Geol. Sin. 2013, 87, 145–153. [Google Scholar]
- He, Z.G.; Liu, C.Y.; Zhao, J.F.; Liu, Y.T. A Study on Geothermal Field and Its Geological Significance in Southern Area of the North China Craton. Geol. Rev. 2009, 55, 428–434. [Google Scholar]
- Zhang, P.; Wang, L.S.; Liu, S.W.; Li, C.; Ding, Z.Y. Thermo-Rheological Structure of the Lithosphere in the South Huabei Basins. Geol. J. China Univ. 2006, 12, 530–536. [Google Scholar]
- Zhang, P.; Wang, L.S.; Liu, S.W.; Li, C.; Ding, Z.Y. Geothermal Field in the South Huabei Basins. Prog. Geophys. 2007, 22, 604–608. [Google Scholar]
- Huang, F.; Liu, Q.Y.; He, L.J. Deep Temperature and Thermal Structure along the Fengjie-Guanyindang Geotraverse in Mid-Upper Yangtze Area. Chin. J. Geol. 2014, 49, 799–811. [Google Scholar]
- Xu, M.; Zhao, P.; Zhu, C.Q.; Shan, J.N.; Hu, S.B. Borehole Temperature Logging and Terrestrial Heat Flow Distribution in Jianghan Basin. Sci. Geol. Sin. 2010, 45, 317–323. [Google Scholar]
- Wang, L.S.; Shi, Y.S. Geothermal Research in Hydrocarbon Basins; Nanjing University Press: Nanjing, China, 1989; pp. 21–42. [Google Scholar]
- Wang, L.S.; Li, C.; Shi, Y.S.; Wang, Y.H. Distribution of geothermal fields and geodetic heat flow density in the Lower Yangzi region. Chin. J. Geophys. Chin. Ed. 1995, 38, 469–476. [Google Scholar]
- Deng, Y.F.; Xu, Y.G.; Chen, Y. Formation mechanism of the north–south gravity lineament in East China. Tectonophysics 2021, 818, 229074. [Google Scholar] [CrossRef]
- Zhao, G.C.; Zhai, M.G. Lithotectonic elements of Precambrian basement in the North China Craton: Review and tectonic implications. Gondwana Res. 2013, 23, 1207–1240. [Google Scholar] [CrossRef]
- Liu, D.Y.; Wan, Y.S.; Wu, J.S.; Wilde, S.A.; Dong, C.Y.; Zhou, H.Y.; Yin, X.Y. Archean Crustal Evolution and the Oldest Rocks in the North China Craton. Geol. Bull. China 2007, 26, 1131–1138. [Google Scholar]
- Li, Y.H. Crust Evolutional Process of Yangtze Craton during Archean-Paleoproterozoic Period. Ph.D. Thesis, China University of Geosciences, Wuhan, China, 2016. [Google Scholar]
- Li, S.R.; Santosh, M. Metallogeny and craton destruction: Records from the North China Craton. Ore Geol. Rev. 2014, 56, 376–414. [Google Scholar] [CrossRef]
- Ma, Q.; Xu, Y.G. Magmatic perspective on subduction of Paleo-Pacific plate and initiation of big mantle wedge in East Asia. Earth-Sci. Rev. 2021, 213, 103473. [Google Scholar] [CrossRef]
- Li, S.; Wang, Y. Formation time of the big mantle wedge beneath East China and a new lithospheric thinning mechanism of the North China craton—Geodynamic effects of deep recycled carbon. Sci. China Earth Sci. 2018, 61, 16. [Google Scholar] [CrossRef]
- Zhu, G.; Liu, C.; Gu, C.C.; Zhang, S.; Li, Y.J.; Su, N.; Xiao, S.Y. Oceanic plate subduction history in the western Pacific Ocean: Constraint from late Mesozoic evolution of the Tan-Lu Fault Zone. Sci. China Earth Sci. 2018, 61, 386–405. [Google Scholar] [CrossRef]
- Zhu, R.X.; Xu, Y.G. The subduction of the west Pacific plate and the destruction of the North China Craton. Sci. China Earth Sci. 2019, 62, 1340–1350. [Google Scholar] [CrossRef]
- Liu, C.Y.; Huang, L.; Zhang, D.D.; Zhao, J.F.; Deng, Y.; Guo, P.; Huang, Y.J.; Wang, J.Q. Genetic causes of oil-rich and-poor reservoirs: Implications from two Cenozoic basins in the eastern North China Craton. Sci. China Earth Sci. 2018, 48, 1506–1526. [Google Scholar] [CrossRef]
- Yang, P.X.; Gao, Z.W.; Zhang, J. Structure model and evolution of the jianghan basin and relation with moderate to strong earthquakes. Earthquake 2021, 29, 123–130. [Google Scholar]
- Qiu, X.M.; Chen, W.; Li, H.Y.; Duan, H.L. Strike⁃slip structures and hydrocarbon accumulation in complex fault blocks in Subei Basin. Pet. Geol. Exp. 2023, 45, 393–401. [Google Scholar]
- Deng, X.; Wang, J.A. The Terrestrial Heat Flow in Anhui Province; Cultural Relics Press: Beijing, China, 1982; pp. 82–87. [Google Scholar]
- Wang, Z.T.; Rao, S.; Xiao, H.P.; Wang, Y.B.; Jiang, G.Z.; Hu, S.B.; Zhang, C. Terrestrial heat flow of Jizhong depression, China, Western Bohai Bay basin and its influencing factors. Geothermics 2021, 96, 102210. [Google Scholar] [CrossRef]
- Jiang, G.Z.; Tang, X.Y.; Rao, S.; Gao, P.; Zhang, L.Y.; Zhao, P.; Hu, S.B. High-quality heat flow determination from the crystalline basement of the south-east margin of North China Craton. J. Asian Earth Sci. 2016, 118, 1–10. [Google Scholar] [CrossRef]
- Wang, Z.T.; Jiang, G.Z.; Zhang, C.; Tang, X.C.; Hu, S.B. Estimating geothermal resources in Bohai Bay Basin, East China, using Monte Carlo simulation. Environ. Earth Sci. 2019, 78, 355. [Google Scholar] [CrossRef]
- Liu, Q.Y.; Zhang, L.Y.; Zhang, C.; He, L.J. Lithospheric thermal structure of the North China Craton and its geodynamic implications. J. Geodyn. 2016, 102, 139–150. [Google Scholar] [CrossRef]
- Duan, Y.H.; Liu, B.J.; Zhao, J.R.; Liu, B.F.; Zhang, C.K.; Pan, S.Z.; Lin, J.Y.; Guo, W.B. 2-D P-Wave Velocity Structure of Lithosphere in the North China Tectonic Zone: Constraints from the Yancheng-Baotou Deep Seismic Profile. Sci. China Earth Sci. 2015, 58, 1577–1591. [Google Scholar] [CrossRef]
- Huang, R. Seismic Study of Crust and Upper Mantle Structure and Tectonics in Middle-to-Lower Yangtze Craton and Its Adjacent Regions. Ph.D. Thesis, China University of Geosciences, Wuhan, China, 2014. [Google Scholar]
- Liu, Z.; Wang, F.Y.; Zhang, X.K.; Duan, Y.H.; Yang, Z.L.; Lin, J.Y. Seismic Structure of the Lithosphere beneath Eastern North China Craton Results from Long Distance Deep Seismic Sounding. Chin. J. Geophys. Chin. Ed. 2015, 58, 1145–1157. [Google Scholar] [CrossRef]
- Wang, C.Y.; Bai, Z.M. P-wave velocity structure of the Lower Yangtze crust: Reinterpretation of the Fuli Ji-Fengxian seismic bathymetry profile. Chin. Sci. Bull. 2006, 51, 2534–2541. [Google Scholar]
- Xu, T.; Zhang, Z.J.; Tian, X.B.; Liu, B.F.; Bai, Z.M.; Lü, Q.T.; Teng, J.W. Crustal Structure beneath the Middle-Lower Yangtze Metallogenic Belt and Its Surrounding Areas: Constraints from Active Source Seismic Experiment along the Lixin to Yixing Profile in East China. Acta Petrol. Sin. 2014, 30, 918–930. [Google Scholar]
- Zheng, Y.; Teng, J.W. Crustal and upper-earth slow structure of the Suixian-Ma’anshan belt and some features of the southern section of the Zhenglu tectonic belt. Chin. J. Geophys. Chin. Ed. 1989, 32, 648–659. [Google Scholar]
- Wang, Y.B.; Hu, S.B.; Wang, Z.T.; Jiang, G.Z.; Hu, D.; Zhang, K.S.; Gao, P.; Hu, J.; Zhang, T. Heat flow, heat production, thermal structure and its tectonic implication of the southern Tan-Lu Fault Zone, East–Central China. Geothermics 2019, 82, 254–266. [Google Scholar] [CrossRef]
- Chapman, D. Thermal gradients in the continental crust. Geol. Soc. Lond. Spec. Publ. 1986, 24, 63–70. [Google Scholar] [CrossRef]
- Kukkonen, I.T.; Golovanova, I.V.; Khachay, Y.V.; Druzhinin, V.S.; Kosarev, A.M.; Schapov, V.A. Low geothermal heat flow of the Urals fold belt—Implication of low heat production, fluid circulation or palaeoclimate? Tectonophysics 1997, 276, 63–85. [Google Scholar] [CrossRef]
- Roy, S.; Rao, R.U.M. Geothermal Investigations In The 1993 Latur Earthquake Area, Deccan Volcanic Province, India. Tectonophysics 1999, 306, 237–252. [Google Scholar] [CrossRef]
- Correia, A.; Šafanda, J. Geothermal modeling along a two-dimensional crustal profile in Southern Portugal. J. Geodyn. 2002, 34, 47–61. [Google Scholar] [CrossRef]
- Schatz, J.F.; Simmons, G. Thermal conductivity of Earth materials at high temperature. J. Geophys. Res. 1972, 77, 6966–6983. [Google Scholar] [CrossRef]
- Petitjean, S.; Rabinowicz, M.; Grégoire, M.; Chevrot, S. Differences between Archean and Proterozoic lithospheres: Assessment of the possible major role of thermal conductivity. Geochem. Geophys. Geosystems 2006, 7, 1–26. [Google Scholar] [CrossRef]
- Lewis, T.J.; Hyndman, R.D.; Flück, P. Heat flow, heat generation, and crustal temperature in the northern Canadian Cordillera: Thermal control of tectonics. J. Geophys. Res. Solid Earth 2003, 108, 2316–2332. [Google Scholar] [CrossRef]
- Artemieva, I.M.; Mooney, W.D. Thermal thickness and evolution of Precambrian lithosphere: A global study. J. Geophys. Res. Solid Earth 2001, 106, 16387–16414. [Google Scholar] [CrossRef]
- He, L.J.; Hu, S.B.; Yang, W.C.; Wang, J.Y. Radiogenic heat production in the lithosphere of Sulu ultrahigh-pressure metamorphic belt. Earth Planet. Sci. Lett. 2009, 277, 525–538. [Google Scholar] [CrossRef]
- Rudnick, R.L.; McDonough, W.F.; O’Connell, R.J. Thermal structure, thickness and composition of continental lithosphere. Chem. Geol. 1998, 145, 395–411. [Google Scholar] [CrossRef]
- Abbey, A.L.; Wildman, M.; Stevens, G.A.L.; Murray, K.E. Thermal history modeling techniques and interpretation strategies: Applications using QTQt. Geosphere 2023, 19, 493–530. [Google Scholar] [CrossRef]
- Hu, S.B.; Sullivan, P.B.O.; Raza, A.; Kohn, B.P. Thermal history and tectonic subsidence of the Bohai Basin, northern China: A Cenozoic rifted and local pull-apart basin. Phys. Earth Planet. Inter. 2001, 126, 221–235. [Google Scholar] [CrossRef]
- Hu, S.B.; Zhang, R.Y.; Luo, Y.H.; Cai, D.S. Thermal history and tectonothermal evolution evolution characteristics of the Bohai Basin. Chin. J. Geophys. Chin. Ed. 1999, 42, 748–755. [Google Scholar]
- Zeng, P. The Application of the Thermometric Indicators to the Study of Thermal Evolution in the Lower-Yangtze Region; China University of Geosciences: Beijing, China, 2005; (In Chinese with English Abstract). [Google Scholar]
- Li, Z.X.; Zhao, P.; Sun, Z.X.; Yuan, Y.S.; Zhao, Y.Q. A Study on Maturity Evolution of Lower Silurian Marine Hydrocarbon Source Rocks and Thermal History in the Southern Jianghan Basin. Chin. J. Geophys. Chin. Ed. 2010, 53, 2918–2928. [Google Scholar] [CrossRef]
- Lin, X.Y.; Liu, J.; Chen, Q.L.; Gao, H.P.; Jiang, W. Thermal History Modeling of Permian Source Rocks in Tanzhuang-Shenqiu Sag. J. Oil Gas Technol. 2010, 32, 16–20. [Google Scholar]
- Yuan, Y.S.; Zhu, C.Q.; Hu, S.B. Heat Flow History, Tectono-Sedimentary Evolution and Thermal Events of the Jianghan Basin. Prog. Geophys. 2007, 22, 934–939. [Google Scholar]
- Wu, F.Y.; Lin, J.Q.; Wilde, S.A.; Zhang, X.O.; Yang, J.H. Nature and significance of the Early Cretaceous giant igneous event in East China. Earth Planet. Sci. Lett. 2005, 233, 103–119. [Google Scholar] [CrossRef]
- Lin, W.; Charles, N.; Chen, Y.; Chen, K.; Faure, M.; Wu, L.; Wang, F.; Li, Q.L.; Wang, J.; Wang, Q.C. Late Mesozoic compressional to extensional tectonics in the Yiwulüshan massif, NE China and their bearing on the Yinshan–Yanshan orogenic belt. Gondwana Res. 2013, 23, 78–94. [Google Scholar] [CrossRef]
- Liu, S.F.; Gurnis, M.; Ma, P.F.; Zhang, B. Reconstruction of northeast Asian deformation integrated with western Pacific plate subduction since 200 Ma. Earth-Sci. Rev. 2017, 175, 114–142. [Google Scholar] [CrossRef]
- Müller, R.D.; Seton, M.; Zahirovic, S.; Williams, S.E.; Cannon, J. Ocean Basin Evolution and Global-Scale Plate Reorganization Events Since Pangea Breakup. Annu. Rev. Earth Planet. Sci. 2016, 44, 107–138. [Google Scholar] [CrossRef]
- Seton, M.; Müller, R.D.; Zahirovic, S.; Gaina, C.; Torsvik, T.; Shephard, G.; Talsma, A.; Gurnis, M.; Turner, M.; Maus, S. Global continental and ocean basin reconstructions since 200. Earth-Sci. Rev. 2012, 113, 212–270. [Google Scholar] [CrossRef]
- Sun, P.; Guo, P.Y.; Niu, Y.L. Eastern China Continental Lithosphere Thinning Is a Consequence of Paleo-Pacific Plate Subduction: A Review and New Perspectives. Earth-Sci. Rev. 2021, 218, 103680. [Google Scholar] [CrossRef]
- Hao, Y.; Yu, J.; Wang, Y.; Li, C.; Pang, J.; Wang, Y.; Zheng, D. Coupling between Cenozoic Extensional Exhumation in North China and the Subduction of the Pacific Plate. Palaeogeogr. Palaeoclimatol. Palaeoecol. 2023, 620, 111546. [Google Scholar] [CrossRef]


| Tectonic Unit | NJBU | NJBD | JHB | BBBU | BBBD | SNCBU | SNCBD | |
|---|---|---|---|---|---|---|---|---|
| Heat flow (mW·m−2) | 72 | 66 | 51 | 70 | 62 | 57 | 54 | |
| Thickness (km) | D1 | 4.4 | 7.5 | 5.5 | 6.0 | 9.0 | 2.0 | 5.0 |
| D2 | 5.6 | 4.0 | 6.0 | 8.0 | 8.0 | 11.0 | 8.5 | |
| D3 | 6.0 | 6.0 | 8.5 | 7.0 | 7.0 | 10.5 | 10.0 | |
| D4 | 16.0 | 16.0 | 14.0 | 8.0 | 8.0 | 10.5 | 9.5 | |
| Thermal conductivity (W·m−1·K−1) | D1 | / | / | 2.0 | 2.3 | 2.3 | 2.2 | 2.2 |
| D2 | 2.9 | 2.9 | 3.0 | 3.0 | 3.0 | 3.0 | 3.0 | |
| D3 | 2.8 | 2.8 | 2.8 | 2.8 | 2.8 | 2.8 | 2.8 | |
| D4 | 2.5 | 2.5 | 2.6 | 2.6 | 2.6 | 2.6 | 2.6 | |
| D5 | 3.0 | 3.0 | 3.0 | 3.0 | 3.0 | 3.0 | 3.0 | |
| Heat production (μW·m−3) | D1 | / | / | 1.26 | 1.26 | 1.26 | 1.26 | 1.26 |
| D2 | 2.16 | 2.16 | 1.26 | 1.26 | 1.26 | 1.26 | 1.26 | |
| D3 | 1.26 | 1.26 | 0.86 | 0.86 | 0.86 | 0.86 | 0.86 | |
| D4 | 0.25 | 0.25 | 0.31 | 0.31 | 0.31 | 0.31 | 0.31 | |
| D5 | 0.03 | 0.03 | 0.03 | 0.03 | 0.03 | 0.03 | 0.03 | |
| Tectonic Unit | NJBU | NJBD | BBBU | BBBD | SNCBU | SNCBD | JHB | ||
|---|---|---|---|---|---|---|---|---|---|
| Heat flow contribution (mW·m−2) | D1 | 6.2 | 11.2 | 7.6 | 8.6 | 2.5 | 6.3 | 6.9 | |
| D2 | 12.1 | 10.8 | 10.1 | 10.1 | 13.9 | 10.7 | 7.6 | ||
| D3 | 7.6 | 7.6 | 6.0 | 6.0 | 9.0 | 8.6 | 7.3 | ||
| D4 | 4.0 | 4.0 | 2.5 | 2.5 | 3.3 | 3.0 | 4.3 | ||
| Crust | 29.9 | 31.4 | 26.1 | 27.1 | 28.7 | 28.6 | 26.1 | ||
| Mantle | 42.6 | 34.8 | 43.9 | 34.9 | 28.2 | 25.8 | 24.9 | ||
| 0.70 | 0.90 | 0.59 | 0.78 | 1.02 | 1.11 | 1.05 | |||
| Thermal thickness | Range | 73–82 | 92–104 | 68–77 | 82–93 | 119–133 | 129–145 | 138–154 | |
| Mean | 78 | 98 | 73 | 88 | 126 | 137 | 146 | ||
| Bottom boundary temperature (°C) | D1 | 135 | 218 | 218 | 293 | 69 | 145 | 163 | |
| D2 | 287 | 339 | 448 | 498 | 289 | 307 | 270 | ||
| D3 | 400 | 429 | 578 | 605 | 429 | 429 | 373 | ||
| D4 | 701 | 664 | 725 | 723 | 555 | 534 | 525 | ||
| Lithosphere | Range | 1237–1335 | 1242–1339 | 1233–1334 | 1237–1333 | 1260–1353 | 1259–1354 | 1270–1359 | |
| Mean | 1286 | 1291 | 1284 | 1285 | 1307 | 1307 | 1351 | ||
| Depths | 5 km | 10 km | 15 km | 20 km | 25 km | 30 km | |
|---|---|---|---|---|---|---|---|
| Tectonic Units | |||||||
| NJBU | Temperature (°C) | 151 | 288 | 382 | 477 | 571 | 664 |
| Gradient (°C·km−1) | 27.5 | 27.3 | 18.8 | 19.2 | 18.9 | 18.5 | |
| NJBD | Temperature (°C) | 169 | 280 | 376 | 451 | 530 | 607 |
| Gradient (°C·km−1) | 30.3 | 25.4 | 16.3 | 15.2 | 15.0 | 14.4 | |
| JHB | Temperature (°C) | 149 | 244 | 315 | 373 | 430 | 484 |
| Gradient (°C·km−1) | 26.9 | 17.9 | 12.9 | 11.6 | 11.4 | 10.8 | |
| BBBU | Temperature (°C) | 182 | 331 | 467 | 560 | 652 | 739 |
| Gradient (°C·km−1) | 33.4 | 28.2 | 19.4 | 18.5 | 18.7 | 14.2 | |
| BBBD | Temperature (°C) | 160 | 319 | 447 | 546 | 620 | 694 |
| Gradient (°C·km−1) | 29.0 | 25.7 | 25.5 | 15.8 | 15.2 | 14.9 | |
| SNCBU | Temperature (°C) | 129 | 229 | 318 | 386 | 448 | 508 |
| Gradient (°C·km−1) | 26.9 | 20.1 | 14.6 | 13.5 | 12.5 | 12.2 | |
| SNCBD | Temperature (°C) | 145 | 242 | 327 | 390 | 447 | 502 |
| Gradient (°C·km−1) | 26.0 | 19.3 | 13.5 | 12.5 | 11.4 | 11.1 |
Disclaimer/Publisher’s Note: The statements, opinions and data contained in all publications are solely those of the individual author(s) and contributor(s) and not of MDPI and/or the editor(s). MDPI and/or the editor(s) disclaim responsibility for any injury to people or property resulting from any ideas, methods, instructions or products referred to in the content. |
© 2024 by the authors. Licensee MDPI, Basel, Switzerland. This article is an open access article distributed under the terms and conditions of the Creative Commons Attribution (CC BY) license (https://creativecommons.org/licenses/by/4.0/).
Share and Cite
Wu, J.; Wang, Y.; He, L.; Wang, L.; Guan, J.; Chen, J.; Wang, Z.; Wang, Y.; Hu, S. Differences and Causal Mechanisms in the Lithospheric Thermal Structures in the Cratons in East China: Implications for Their Geothermal Resource Potential. Energies 2024, 17, 1752. https://doi.org/10.3390/en17071752
Wu J, Wang Y, He L, Wang L, Guan J, Chen J, Wang Z, Wang Y, Hu S. Differences and Causal Mechanisms in the Lithospheric Thermal Structures in the Cratons in East China: Implications for Their Geothermal Resource Potential. Energies. 2024; 17(7):1752. https://doi.org/10.3390/en17071752
Chicago/Turabian StyleWu, Jinhui, Yibo Wang, Lijuan He, Lijuan Wang, Junpeng Guan, Jun Chen, Zhuting Wang, Yaqi Wang, and Shengbiao Hu. 2024. "Differences and Causal Mechanisms in the Lithospheric Thermal Structures in the Cratons in East China: Implications for Their Geothermal Resource Potential" Energies 17, no. 7: 1752. https://doi.org/10.3390/en17071752
APA StyleWu, J., Wang, Y., He, L., Wang, L., Guan, J., Chen, J., Wang, Z., Wang, Y., & Hu, S. (2024). Differences and Causal Mechanisms in the Lithospheric Thermal Structures in the Cratons in East China: Implications for Their Geothermal Resource Potential. Energies, 17(7), 1752. https://doi.org/10.3390/en17071752