Article

Towards Energy Transformation: A Case Study of EU Countries

1
Department of Electrical Engineering and Automation in Industry, Faculty of Mining, Safety Engineering and Industrial Automation, Silesian University of Technology, 44-100 Gliwice, Poland
2
Department of Safety Engineering, Faculty of Mining, Safety Engineering and Industrial Automation, Silesian University of Technology, 44-100 Gliwice, Poland
3
Department of Business Intelligence in Management, Wroclaw University of Economics, 53-345 Wroclaw, Poland
4
JSW IT SYSTEMS Spółka z o.o., ul. Armii Krajowej 56, 44-330 Jastrzębie-Zdrój, Poland
*
Authors to whom correspondence should be addressed.
Energies 2024, 17(7), 1778; https://doi.org/10.3390/en17071778
Submission received: 23 February 2024 / Revised: 21 March 2024 / Accepted: 6 April 2024 / Published: 8 April 2024

Abstract

:
The decarbonization of European economies is an established reality that has been accelerating in recent years. The focus of EU policy is on the dynamic transformation of the energy balances of Member States, which most significantly impacts economies reliant on coal. In the context of emerging megatrends, this study sets out to determine the extent of changes occurring in the economies of European Union countries in relation to the Green Deal paradigm. The objective of this article is to introduce a comprehensive method developed by the authors for assessing the dynamics of energy transformation in the European Union countries under study. This method is divided into two phases. Initially, countries are classified according to the energy transformation dynamics matrix. Subsequently, the actual assessment of energy transformation dynamics is conducted using a novel composite indicator, the ETPI (Energy Transition Progress Index), based on analyses for 2022 and 2013 using Eurostat data. The results identify leaders in energy transformation, such as Sweden, Germany, Denmark, France, Italy, Spain, Austria, Finland, and the Netherlands, while highlighting significant challenges facing Poland and Bulgaria.

1. Introduction

In the 1970s, the world experienced the first energy crisis, which had serious consequences for the world economy. This crisis was mainly caused by several factors, including restrictions on oil supplies by OPEC (the Organization of the Petroleum Exporting Countries), as well as problems related to energy policy and geopolitical changes. The Club of Rome published the report “The Limits to Growth” in 1972. It was a report that had a huge impact on the debate on sustainable development and the limits to growth. The report’s authors, including Donella Meadows, Dennis Meadows and Jørgen Randers [1], developed a computer model that analyzed the effects of long-term economic growth, natural resources and the environment. The Limits to Growth report warned that if humanity continues to exploit natural resources at the current rate, it will lead to a crisis in which economic growth will be halted by a lack of available resources. This report has become an important point of reference for discussions on sustainable development and the need to change the economic growth model to a more sustainable one.
The concepts of socio-economic development and environmental protection are interrelated, and in scientific publications, it is stated that they function under many synonyms, such as ecological development [2], development without destruction [3], or environmentally friendly development [4]. However, currently, the most widely used concept is sustainable development, which was introduced in 1987 by the United Nations Commission on Environment and Development (also known as the Brundtland Commission). A report published by this committee, “Our Common Future” [5], defined sustainable development as “development that meets the needs of the present without compromising the ability of future generations to meet their own needs”. This report has had a huge impact on the debate on social, economic and environmental development, becoming a reference point for sustainable development activities around the world. The term “sustainable development” has become a key element of the political, economic and social agenda, and its importance continues to grow in the face of increasingly obvious challenges related to environmental degradation and climate change. This report raised the issue of the threat of global warming and environmental acidification with the increasing use of natural resources for electricity production. It was pointed out that each new era of economic growth must, therefore, be less energy-intensive than economic growth. Energy efficiency policies must be at the forefront of national sustainable energy strategies. It was pointed out that there are many opportunities for improvement in this direction through modern devices that can be redesigned to provide the same amount of energy services and use up to half of the original energy needed to power traditional devices. Energy efficiency solutions are, therefore, cost-effective. Energy efficiency can only give the world time to develop “low energy pathways” based on it. Renewable sources, which should form the basis of the global energy structure, could provide a significant amount of the necessary energy. The substantial changes required in the present global energy mix will not be achieved by market pressures alone, given the dominant role of governments as producers of energy and their importance as consumers. If the recent momentum behind annual gains in energy efficiency is to be maintained and extended, governments need to make it an explicit goal of their policies for energy pricing to consumers, prices needed to encourage the adoption of energy-saving.
Additionally, the instability of the geopolitical situation of European Union countries and the disruption of the stability of energy raw materials supplies have led to a reorientation of strategic actions in the field of energy security. In 2022, the European Union introduced the REPowerEU plan, whose main premise is the diversification of supplies and acceleration of the green transformation process to increase energy security. This argument was a major contribution to the analyses presented in this article, considering the aspect of dependency on imported energy raw materials in assessing energy transformations [6].
The article presents a new method for assessing the dynamics of the energy transformation process, filling a gap identified in the literature. The comprehensive assessment method was conducted in two stages of research. The first stage involved a preliminary diagnosis of the dynamics of change based on a matrix that classifies European Union countries according to the dynamics of changes occurring in their energy systems in 2022 in relation to the base year 2013. The preliminary diagnosis stage was based on the use of the two most popular indicators describing energy systems, namely the level of greenhouse gas emissions and the energy efficiency index. In the second stage of the research, the development of our own aggregated index, the ETPI (Energy Transition Progress Index), was presented, which allows for a synthetic assessment of countries in terms of energy transformation. The comprehensive method of assessing the dynamics of the energy transformation process presented in the study represents a new approach in the studied area and makes a significant contribution to the chosen topic.
The structure of the article is as follows: It begins with an introduction that contextualizes the study within the global and European Union’s energy landscape, focusing on the historical shift towards sustainable development and the imperative of decarbonization. The literature review section then examines various methodologies for assessing energy transformation, analyzing existing indices and advocating for a novel approach that incorporates energy import dependency. The materials and method section provides a detailed explanation of the two-stage research process, which includes the initial classification of EU countries based on energy and emission metrics, followed by the development of the Energy Transition Progress Index (ETPI) for a comprehensive assessment. The results section presents the outcomes of applying this methodology, highlighting the diverse energy transformation dynamics across EU countries and the specific challenges faced by those heavily reliant on coal. The discussion interprets these findings within the broader context of EU energy policy and sustainability goals, exploring their implications for policymaking and the broader transition to a decarbonized energy system. Finally, the article concludes by summarizing the key contributions of the study to the understanding of energy transformation in the EU, emphasizing the utility of the ETPI in assessing progress and calling for targeted innovation, policy support, and investment to overcome the decarbonization challenges ahead.

2. Literature Review

Energy transformation, defined as the process of transitioning from fossil fuels to renewable energy sources, is a key component of global efforts towards sustainable development and combating climate change [7,8,9]. This process encompasses a wide range of activities aimed at reducing greenhouse gas emissions [10], improving energy efficiency, increasing the share of renewable energy, and reducing dependency on fossil fuels [11]. Assessing progress in energy transformation requires the use of indicators and metrics that help monitor and evaluate changes in the energy system [12,13].
The literature presents various methodologies for assessing energy transformation, the most popular of which are based on quantitative indicators. These methods rely on numerical data, including monitoring progress in terms of energy efficiency, the share of energy from renewable sources, and the reduction of greenhouse gas emissions [14,15]. Aggregated indexes, such as the Energy Transition Index (ETI) and the World Energy Trilemma Index (WETI), are widely used to assess progress in energy transformation, focusing on energy supply security, availability, and environmentally friendly energy production [16,17,18].
When measuring the energy transition, it is important to take into account various aspects, such as social, economic and environmental, and to adapt the indicators to the specific conditions of the country or region. Furthermore, monitoring progress in the energy transition should be regular and include long-term trends to enable effective assessment of changes in the energy system. One of the most popular composite indicators is the Energy Transition Index. The Energy Transition Index has been published since 2018 by the World Economic Forum to comprehensively monitor the global energy transition. The ETI is an analytical framework measuring progress in the evolution of energy systems toward supporting sustainability, security and availability. The authors of ETI assume that the energy transformation should lead to economic and social development while maintaining a balance between the three categories forming the so-called energy triangle, which includes the following aspects: economic development and growth, universal access to safe and reliable supplies, and environmental sustainability. The ETI composite index is the sum of two sub-indexes (with equal weights), which are system performance and transition readiness. System performance assesses countries’ energy systems in three categories: ability to support economic development and growth; security, reliability and universal availability of energy; and environmental sustainability throughout the chain of energy values. Transformation readiness assesses the quality of the environment conducive to energy transformation. The pace of progress in the country’s energy transformation depends directly on the extent to which it is successful. ETI builds such an environment. This sub-index includes the following categories: regulations and political will, institutions and governance, capital and investments, infrastructure and innovative business environments, human capital and consumer participation, and the structure of the energy system. Sub-index scores are obtained through the (arbitrary) aggregation of data from categories. In 2021, the ETI index will be aggregated from 38 indices. The ranking results for 2023 show the following classification for the top five places: Sweden (78.5), Denmark (76.1), Norway (73.7), Finland (72.8), and Switzerland (72.4). Next were Germany (67.5), Portugal (65.8), Spain (65), Greece (60.9), Italy (60.6), and Poland (59.7) [16].
The second most popular indicator is the World Energy Trilemma Index. The Index is presented annually by the World Energy Council in cooperation with consulting companies Oliver Wyman and Marsh & McLennan Insights. WETI is a quantification of the “Energy Trilemma”, which the World Energy Council defines as the need to provide energy that is safe, widely available and manufactured in an environmentally friendly way. The WETI index is an annual assessment that evaluates the energy sustainability of countries around the world. It ranks the energy performance of 127 countries on the three dimensions based on global and national data and includes recommended areas for improvements in policy coherence and integrated policy innovation, helping to develop well-calibrated energy systems. It measures each country’s performance based on three core dimensions: 1. Energy Security—evaluates a country’s ability to meet its energy needs reliably and affordably. It considers factors such as the diversity of energy sources, energy infrastructure resilience, and geopolitical stability; 2. Energy Equity—assesses the accessibility and affordability of energy services for all segments of society within a country. It looks at metrics such as energy access, energy poverty rates, and the affordability of energy relative to income levels; 3. Environmental Sustainability—examines the environmental impact of a country’s energy system, including its greenhouse gas emissions, air and water pollution levels, and overall environmental policies and initiatives. The index serves as a valuable tool for policymakers, energy industry stakeholders, and researchers to identify best practices, track progress over time, and inform strategic decision-making in the pursuit of a more sustainable energy future [17]. The highest positions in the ranking in 2022 were occupied by the following countries: Sweden (84.3), Switzerland (83.4), Denmark (83.3), Finland (82.7), the UK (82.4), Canada (82.3), Austria (82.2), France (81.1), Norway (81), and Germany (80.6) [18]. The construction of both indexes in key aspects is not consistent with the OECD and JRC recommendations of the European Commission in the field of building indicators composites. Members of the WEF team working on the ETI2022 ranking are aware of these problems. They emphasize that proposed by the distribution of weights used in the process of creating the index in the ETI is only illustrative and does not take into account many statistical problems arising in the case of arbitrary applications (in particular equal) weights [19]. The WETI index has also been subjected to analyses, which show the need to refine the methodology at the selection level of variables (indicators) and index construction composite, especially weight determination at the levels of categories and dimensions [20]. As it has been shown, the issue of assessing the energy transformation process is a multidimensional phenomenon [21], requiring the assessment of various variables for many studied objects, which include different countries. Each method will, therefore, provide some synthetic information, but one should be aware of the imperfections of synthetic measures.
However, both in the ETI and WETI, there is a lack of consideration for a key aspect, which is dependency on energy imports. This limitation indicates a significant research gap, as dependency on imported energy resources is a fundamental dimension in assessing energy security and sustainable development [19,20]. Therefore, it is essential to develop a new, integrated approach that fully reflects the complexity of energy transformation, taking into account both energy policy objectives and challenges related to energy security and reducing import dependency.
In response to the identified research gap, the development of the Energy Transition Progress Index (ETPI) is proposed, which includes dependency on imports as one of the dimensions for assessing progress in energy transformation. Such a composite indicator offers a new perspective on the progress of countries in achieving goals related to emission reduction, energy security, and sustainable development [21].
Diversification of energy sources, investments in renewable technologies, and energy efficiency are crucial for reducing dependency on fossil fuel imports and achieving energy transformation goals. Recognizing import dependency can also stimulate the development of local renewable energy sectors and technological innovations aimed at increasing energy self-sufficiency [22].
The developed methodology consists of two main stages. The first stage involves the preliminary classification of countries in a dynamics change matrix, which allows for identifying initial trends and differences between states. The second stage focuses on the development of the ETPI indicator.
This different approach to studying the energy transition process represents an example of using the TOPSIS analysis (Technique for Order of Preference by Similarity to Ideal Solution), which is a multi-criteria decision analysis method used to choose the best solution from a set of alternatives. This process involves comparing alternatives regarding their similarity to the “ideal” and “anti-ideal” solutions. Meanwhile, aggregated indexes, such as synthetic indicators, aggregate various indicators or variables into one value, which allows for assessing the overall situation or results in the researched area.
Research on the directions of green transformation in the EU countries was conducted by Cheba and others. Using the described TOPSIS analysis, a ranking of EU countries is presented according to the developed aggregated GG indicator. To construct the taxonomic measure of the green economy GG, four areas defined by the OECD [23] were used, which include environmental and resource productivity, natural asset base, environmental dimensions of quality of life, economic opportunities, and policy responses. The ranking results indicated that the best situation in terms of the green economy in 2005 occurred in three Northern European countries: Ireland, Sweden, and Finland. However, the correlation analysis showed that the natural asset base has the most significant impact on the value of the aggregated GG indicator of the green economy.
Given the main limitations of synthetic indicators, as in the mentioned example, where the synthetic indicator consisted of several dozen partial indicators, the final result might overly reduce the complexity of the researched phenomenon and may lead to the loss of essential information contained in individual component variables. Considering the above arguments, the authors of this study chose one main research area, which is energy transformation.
The assessment of progress in energy transformation was also conducted by Paweł Ziemba and Abdullah Zair using a temporal analysis of the energy transformation process towards the transition to RES and limiting the use of fossil fuels in energy production. For this purpose, a new Temporal/Dynamic Multi-Criteria Decision Making (T/DMCDM) method named Temporal PROSA, based on the families of PROMETHEE and PROSA methods, was developed. The Temporal PROSA method allows for aggregating data from multiple periods into one final assessment and directly transferring information from the studied periods to the overall result. In this study, 11 criteria related to energy productivity, energy consumption, the share of RES in the energy mix, and energy prices were used. As a result of these studies, EU countries that dominated in terms of progress in energy transformation towards RES in the years 2004–2021 were identified as Sweden and Portugal, as well as Denmark and Finland. On the other hand, countries such as Belgium, Bulgaria, Cyprus, Luxembourg, and Poland made the least progress in the years 2004–2021 [24].
The topic of assessing energy transformation in the European Union was also taken up by Pietrzak and others. The authors conducted research on two aspects related to transformation, namely in terms of categories—smart and efficient energy systems- and macroeconomic uniformity categories. The analysis based on taxonomic methods allowed for the identification of clusters of European countries according to their ability to achieve goals related to energy transformation. The analysis showed that Estonia, Denmark, Finland, and Sweden are countries where the energy transformation should proceed smoothly and simultaneously translate into further economic growth. Countries were also identified where there is a risk of not meeting the conditions provided for in the applicable EU legal acts. These are Bulgaria, Croatia, Greece, Latvia, Lithuania, Romania, and Portugal. This means that EU policy should take into account possible difficulties with meeting the required environmental criteria by some countries or regions [25].

3. Materials and Method

Based on a literature review that identified a gap in the comprehensive assessment of energy transformation considering the dependency on energy imports, this chapter presents a detailed methodology applied in analyzing the level of advancement of energy transformation in the European Union member states. This methodology responds to the identified research needs, offering new analytical tools for assessing progress in energy transformation.
The research methodology is based on a two-stage process: the preliminary classification of European Union member states in a change dynamics matrix and the development of ETPI as a composite indicator for assessing progress.
Measures used, such as greenhouse gas emissions, energy efficiency, and the share of renewable energy, were obtained from Eurostat for the period 2013–2022. This analysis enables the identification of trends and changes over time, forming the foundation for further analysis.
The study attempts to answer the following problem question: Is the energy transformation process progressing at a comparable pace in European countries?
Based on this assumption of the European Commission, an original model for assessing the dynamics of energy transformation for European Union countries was constructed. The first preliminary stage of the model is the general classification of the studied European Union countries according to two indicators, i.e., the energy intensity index in 2022 compared to 2013 and the emission intensity index of the economies in 2022 compared to 2013.
In the preliminary classification in the matrix of the dynamics of energy transformation in the analyzed member countries, indices representing relative values from 2022 in relation to the base year of 2013 were used. The use of absolute values in the research could lead to an incorrect diagnosis because countries significantly differ from each other in terms of both economic aspects and population size; hence, the dispersion of absolute data sizes is large, and therefore, indices were applied.
The results of this approach enable the classification of countries according to the four levels of energy transformation dynamics presented in Figure 1.
Indicators from 2022 were used as diagnostic variables in the assessment of the transformation process in relation to the levels of energy intensity indicators and carbon dioxide emission levels from 2013. A dynamic approach to this data allowed us to assess the degree of changes taking place toward achieving a zero-emission economy. As a measure of progress in energy transformation processes, a change dynamics matrix for measuring the progress of decarbonization was proposed. The matrix identified four assessment areas. The first quarter of the matrix represents the most dynamic transformation process; the second quarter represents a moderate transformation process; the third quarter includes a reduction in emissions but at the expense of production potential related to the lack of implementation of technologically innovative solutions, which means stagnation in the pace of change; and the fourth quarter classifies countries where the transformation process does not take place.
The second stage of the comprehensive method for assessing the dynamics of energy transformation is the construction of a composite indicator based on five diagnostic variables. Based on the literature review and preliminary data analysis, it was decided to develop the Energy Transition Progress Index (ETPI). ETPI is a composite indicator constructed to holistically assess the progress of energy transformation at the national level. The ETPI stands out from other indicators by comprehensively assessing progress in the energy transformation, combining various aspects such as energy efficiency, energy productivity, the share of renewable energy, energy intensity and dependence on imports of energy raw materials. This allows the indicator to offer a more comprehensive look at the energy transition than other single measures. Including dependence on the import of energy raw materials in the analysis as one of the dimensions of the assessment is an innovative approach that allows for a better understanding of aspects of energy security and the risk associated with the instability of external supplies. This new approach indicates the need to diversify energy sources and increase countries’ energy self-sufficiency.
The ETPI Energy Transition Progress Index (Formula (1)) includes:
-
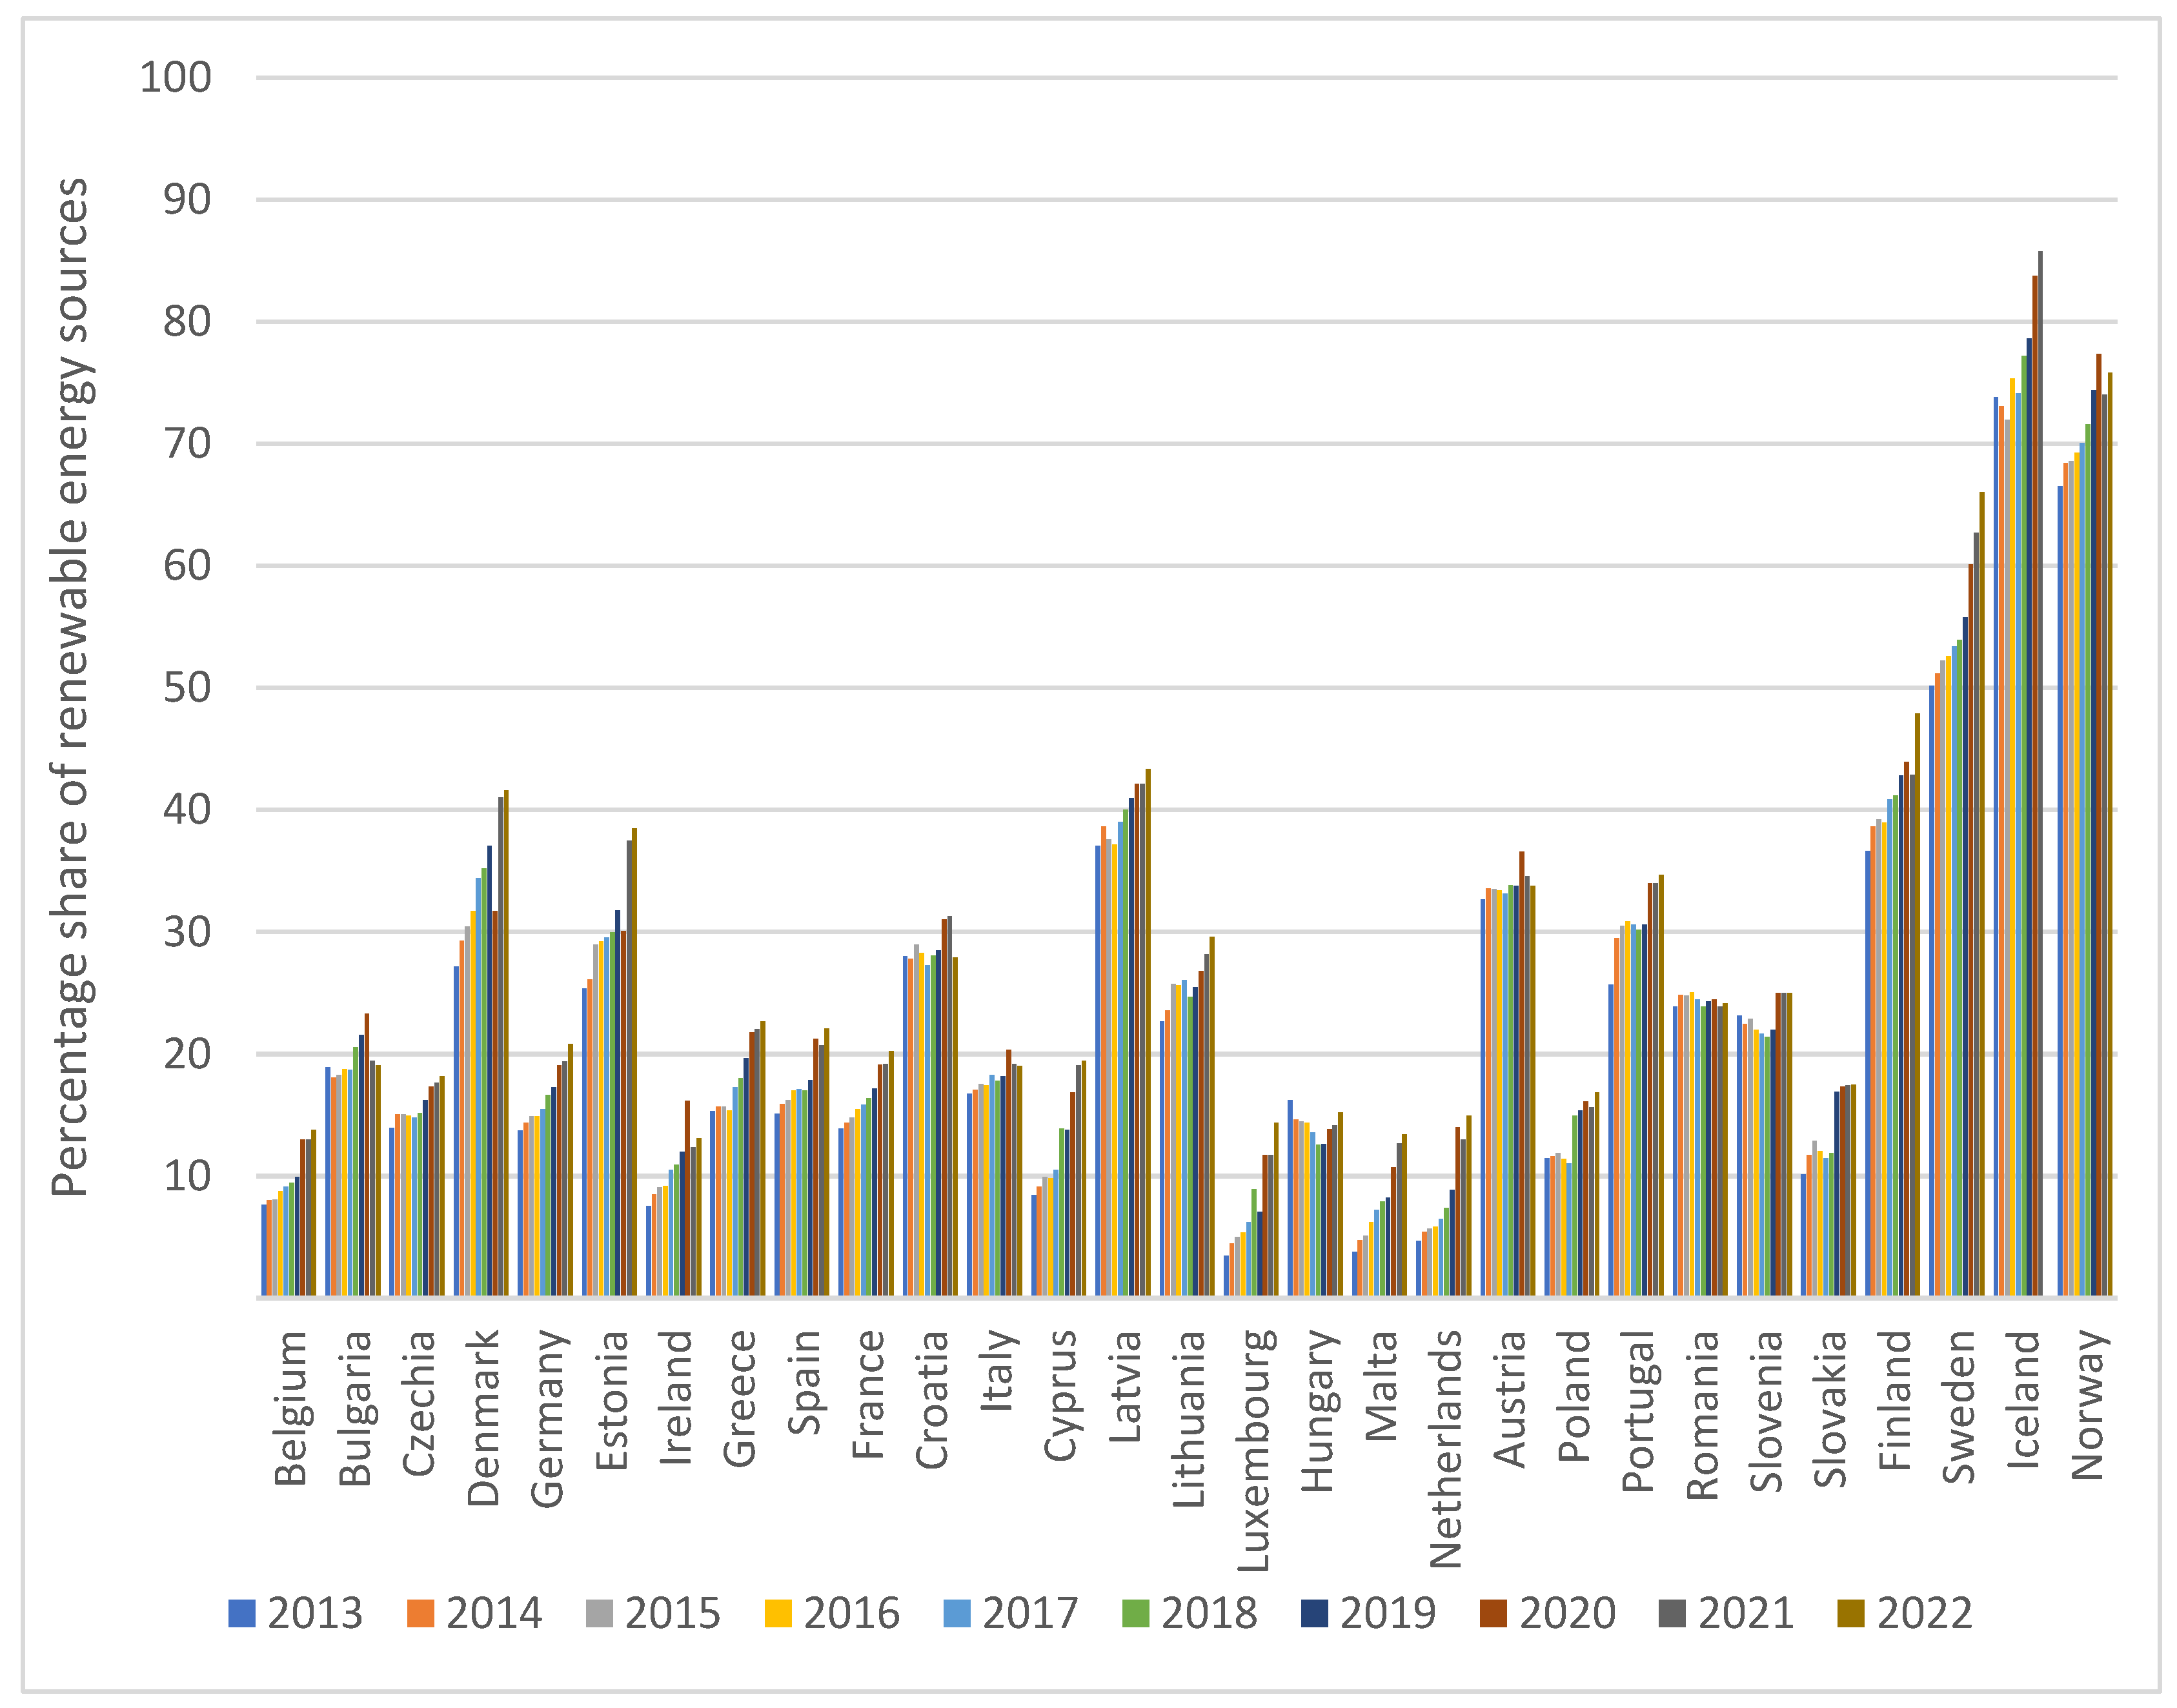
A percentage share of renewable energy sources in the energy mix (%RES) will show the processes of reducing greenhouse gas emissions and mitigating climate change. ETPI also reflects the country’s commitment to clean energy generation.
-
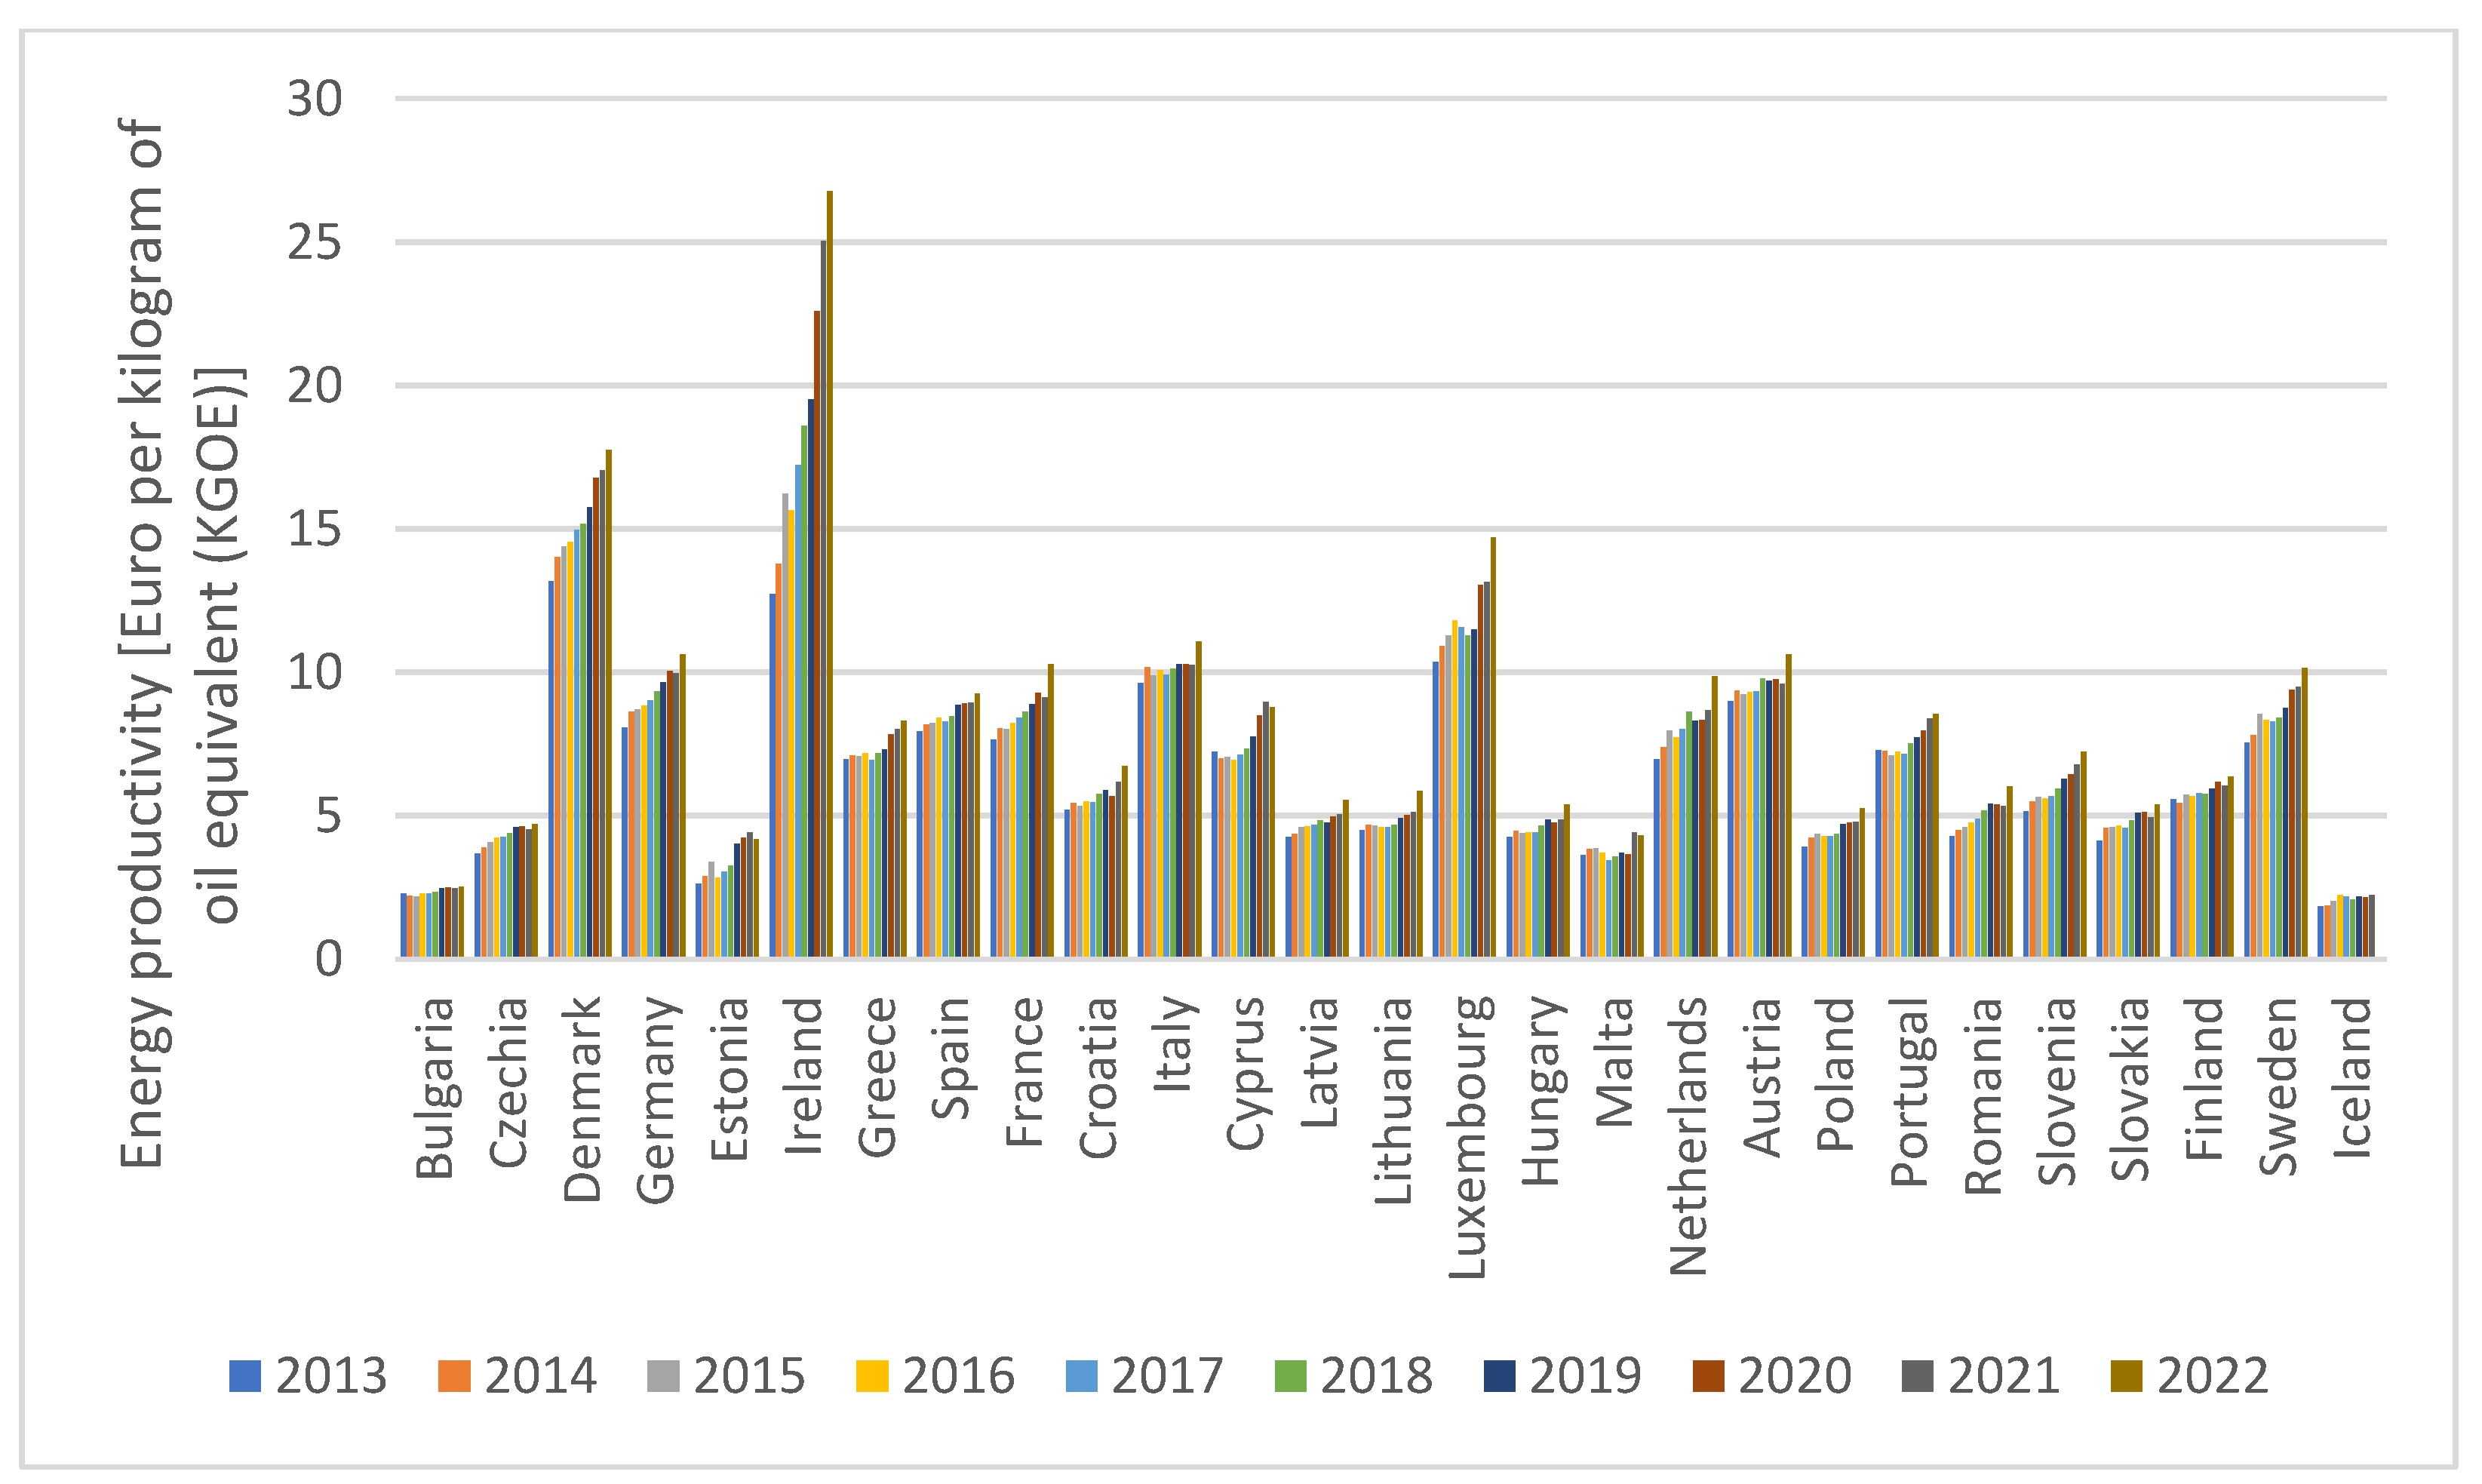
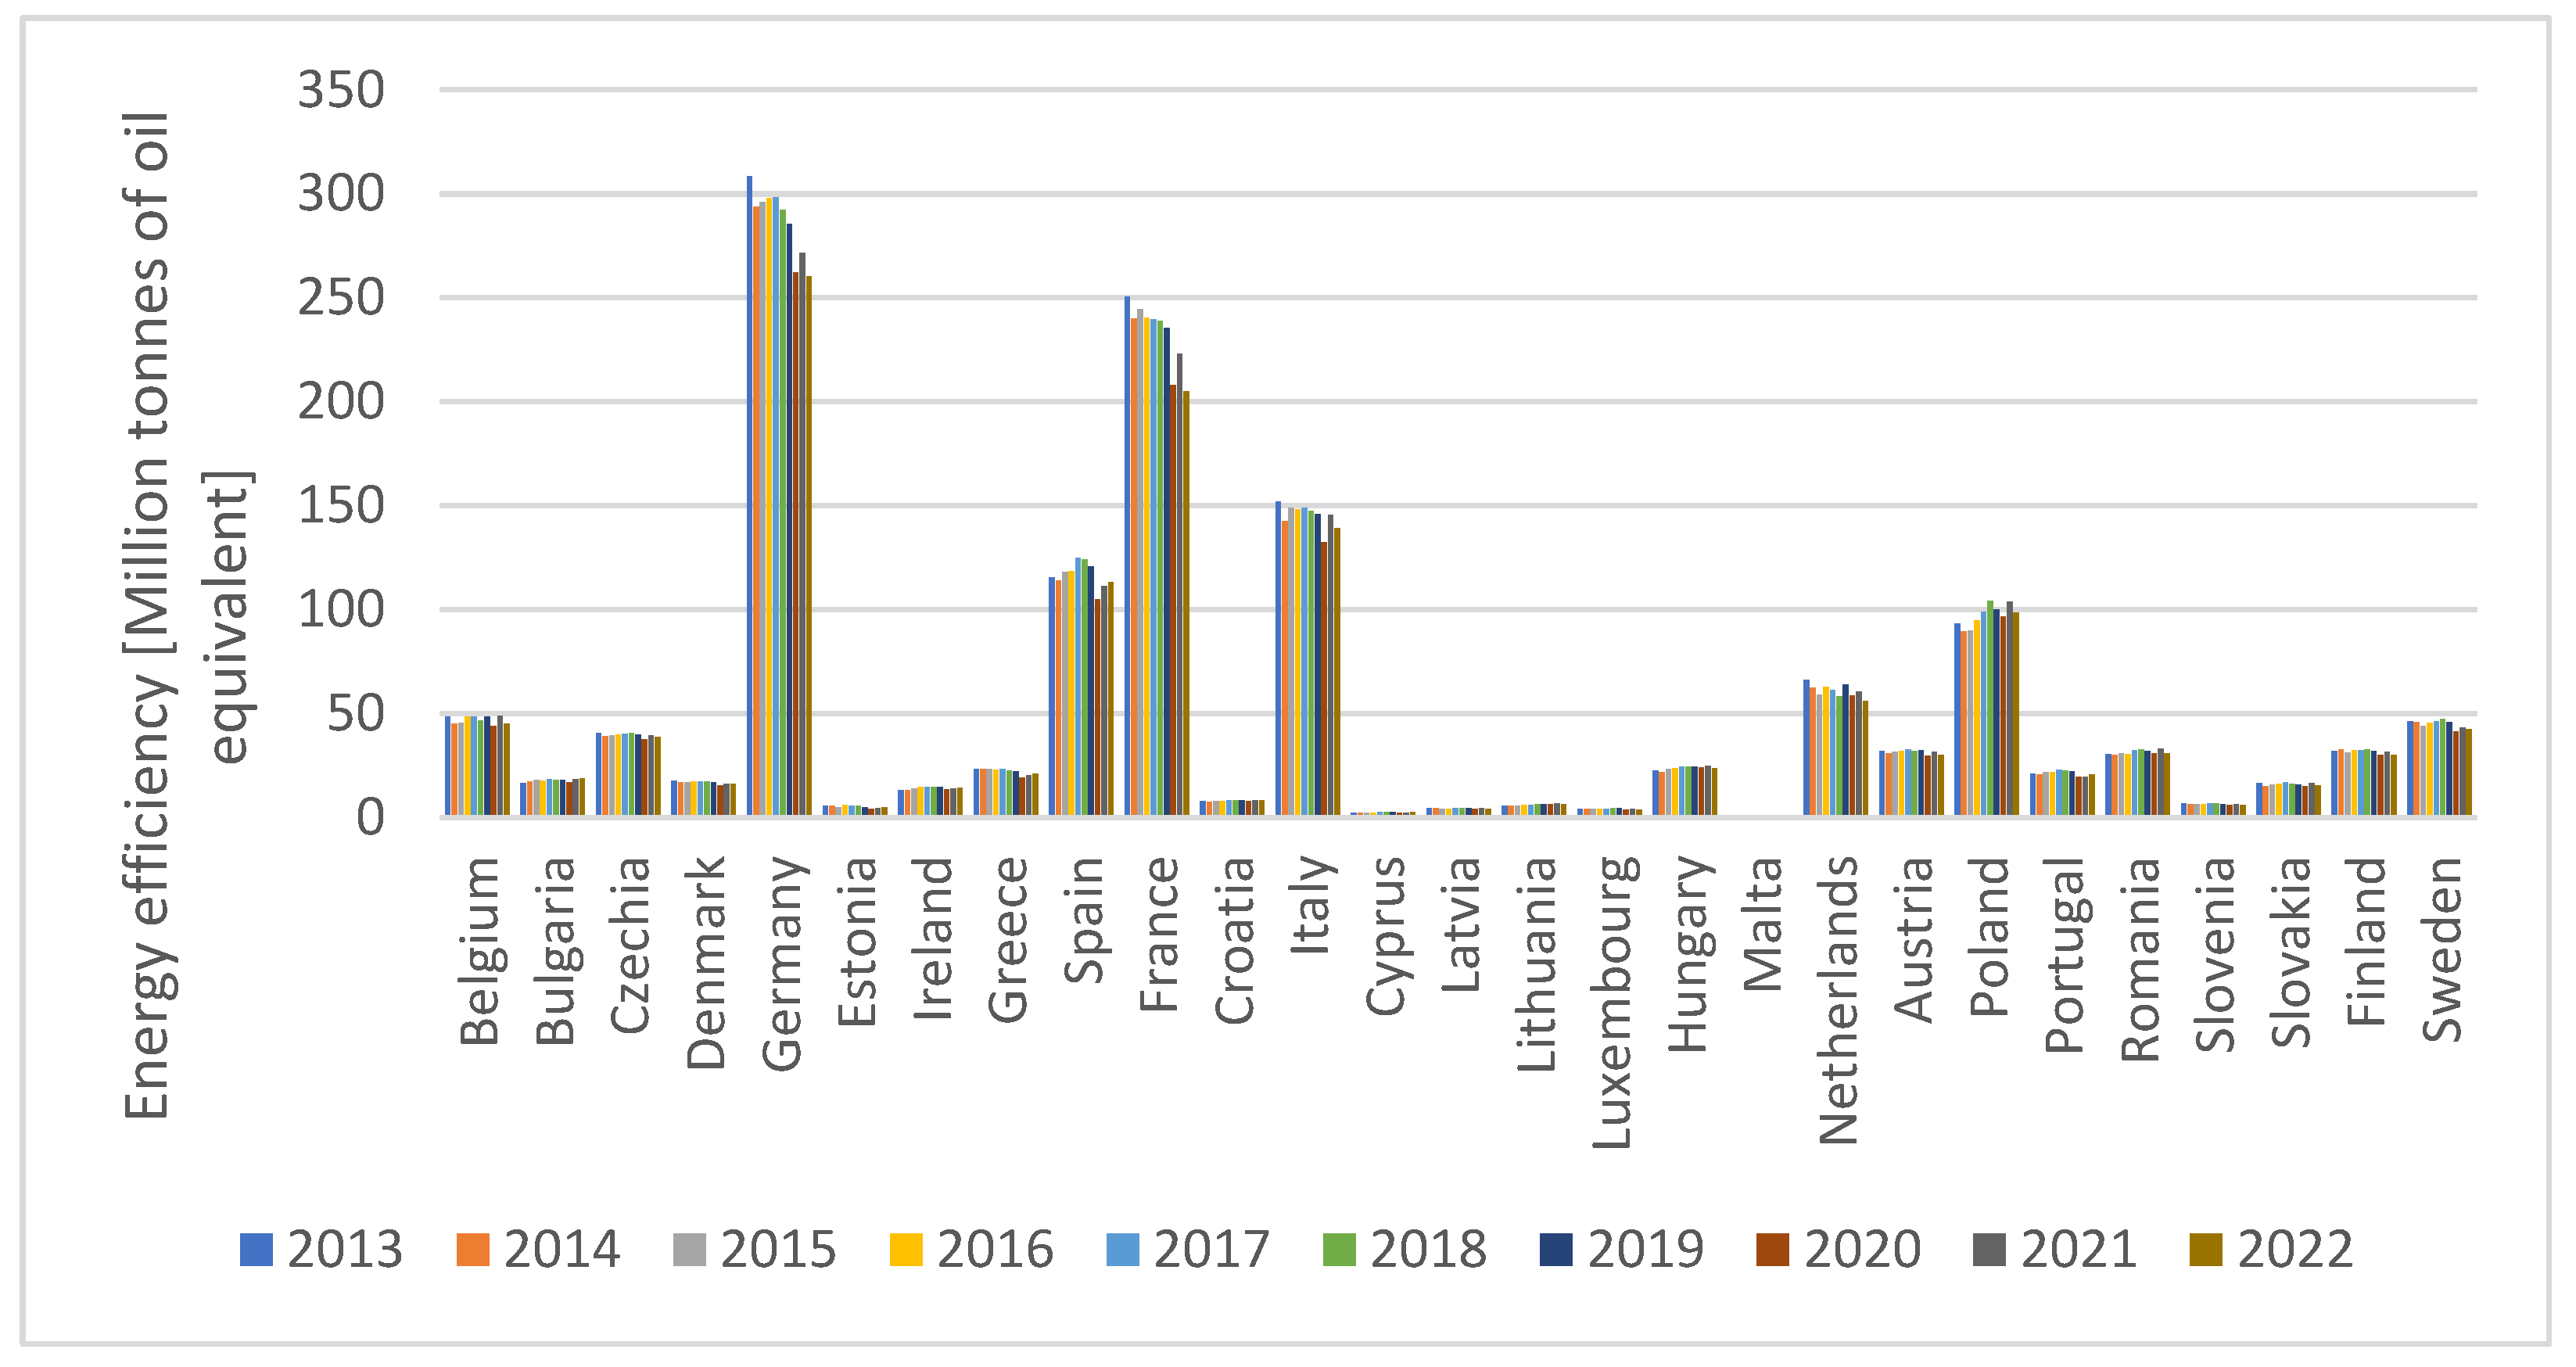
Energy efficiency (EE) and energy productivity (EP) are key indicators of the efficiency of a country’s use of energy resources. Improvements in these areas contribute to achieving environmental goals and increase economic competitiveness by lowering energy costs and increasing efficiency per unit of energy consumed. ETPI normalizes these values to ensure comparability between different economies and energy systems.
-
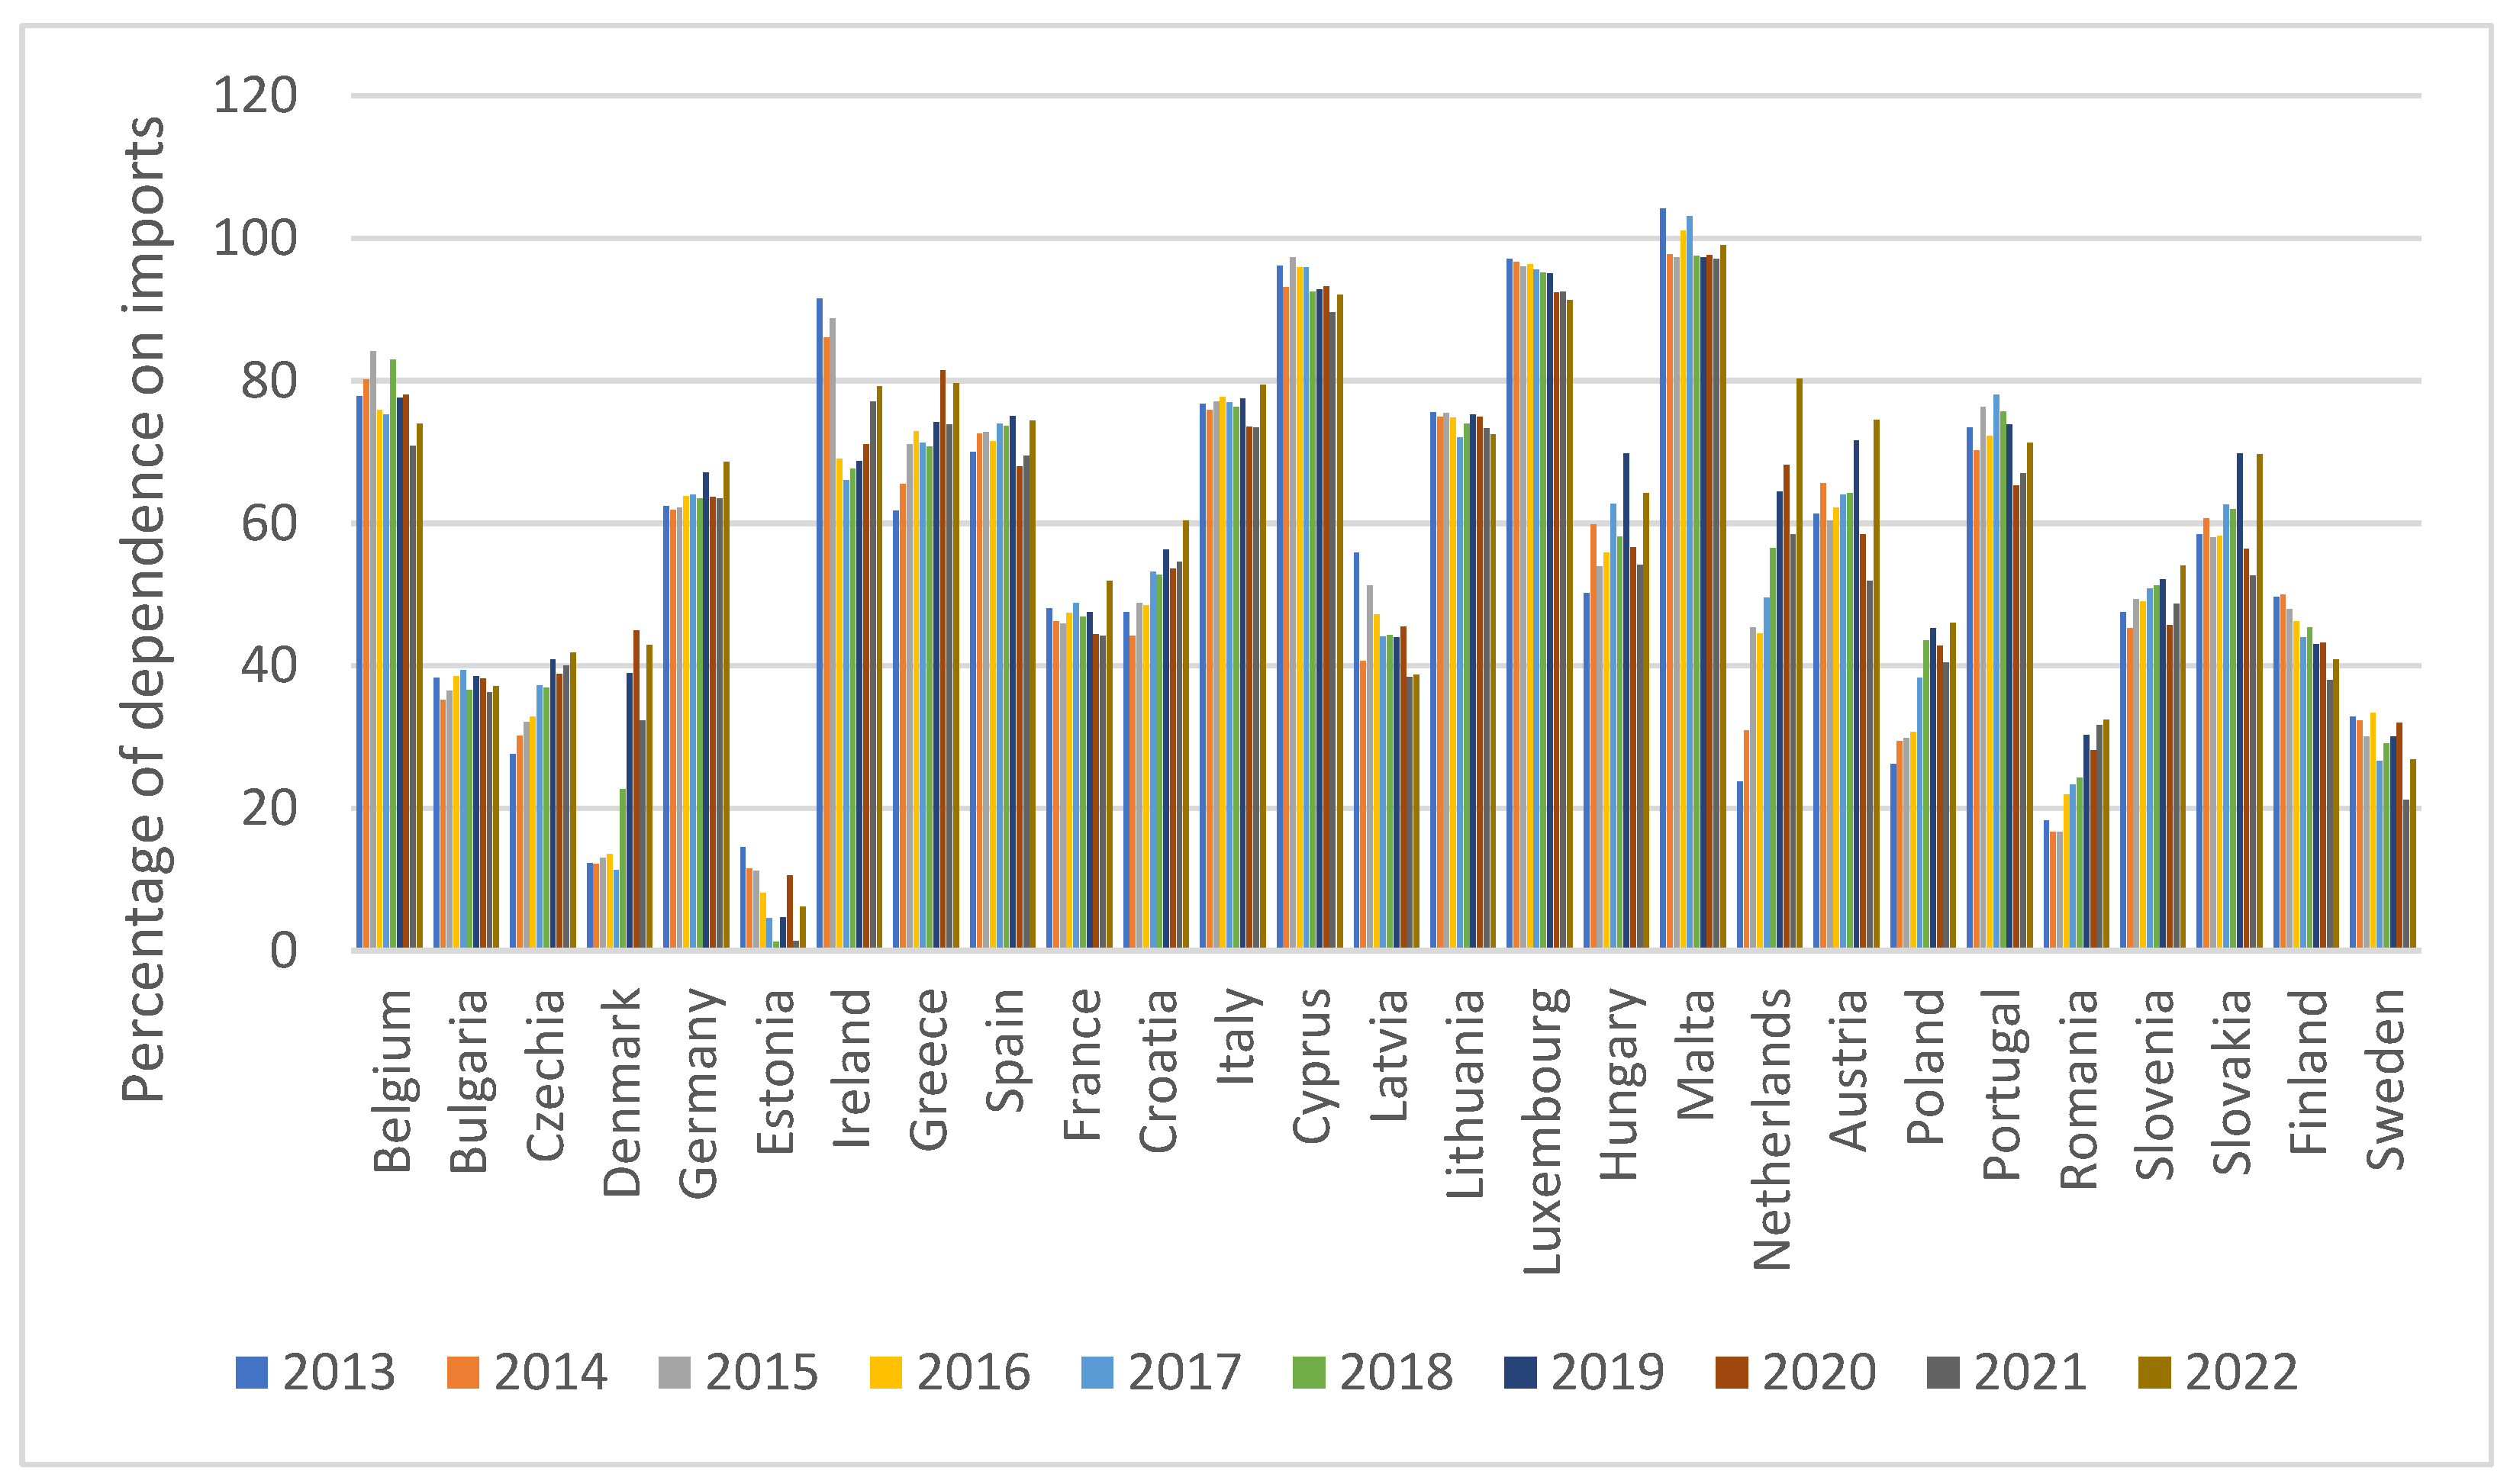
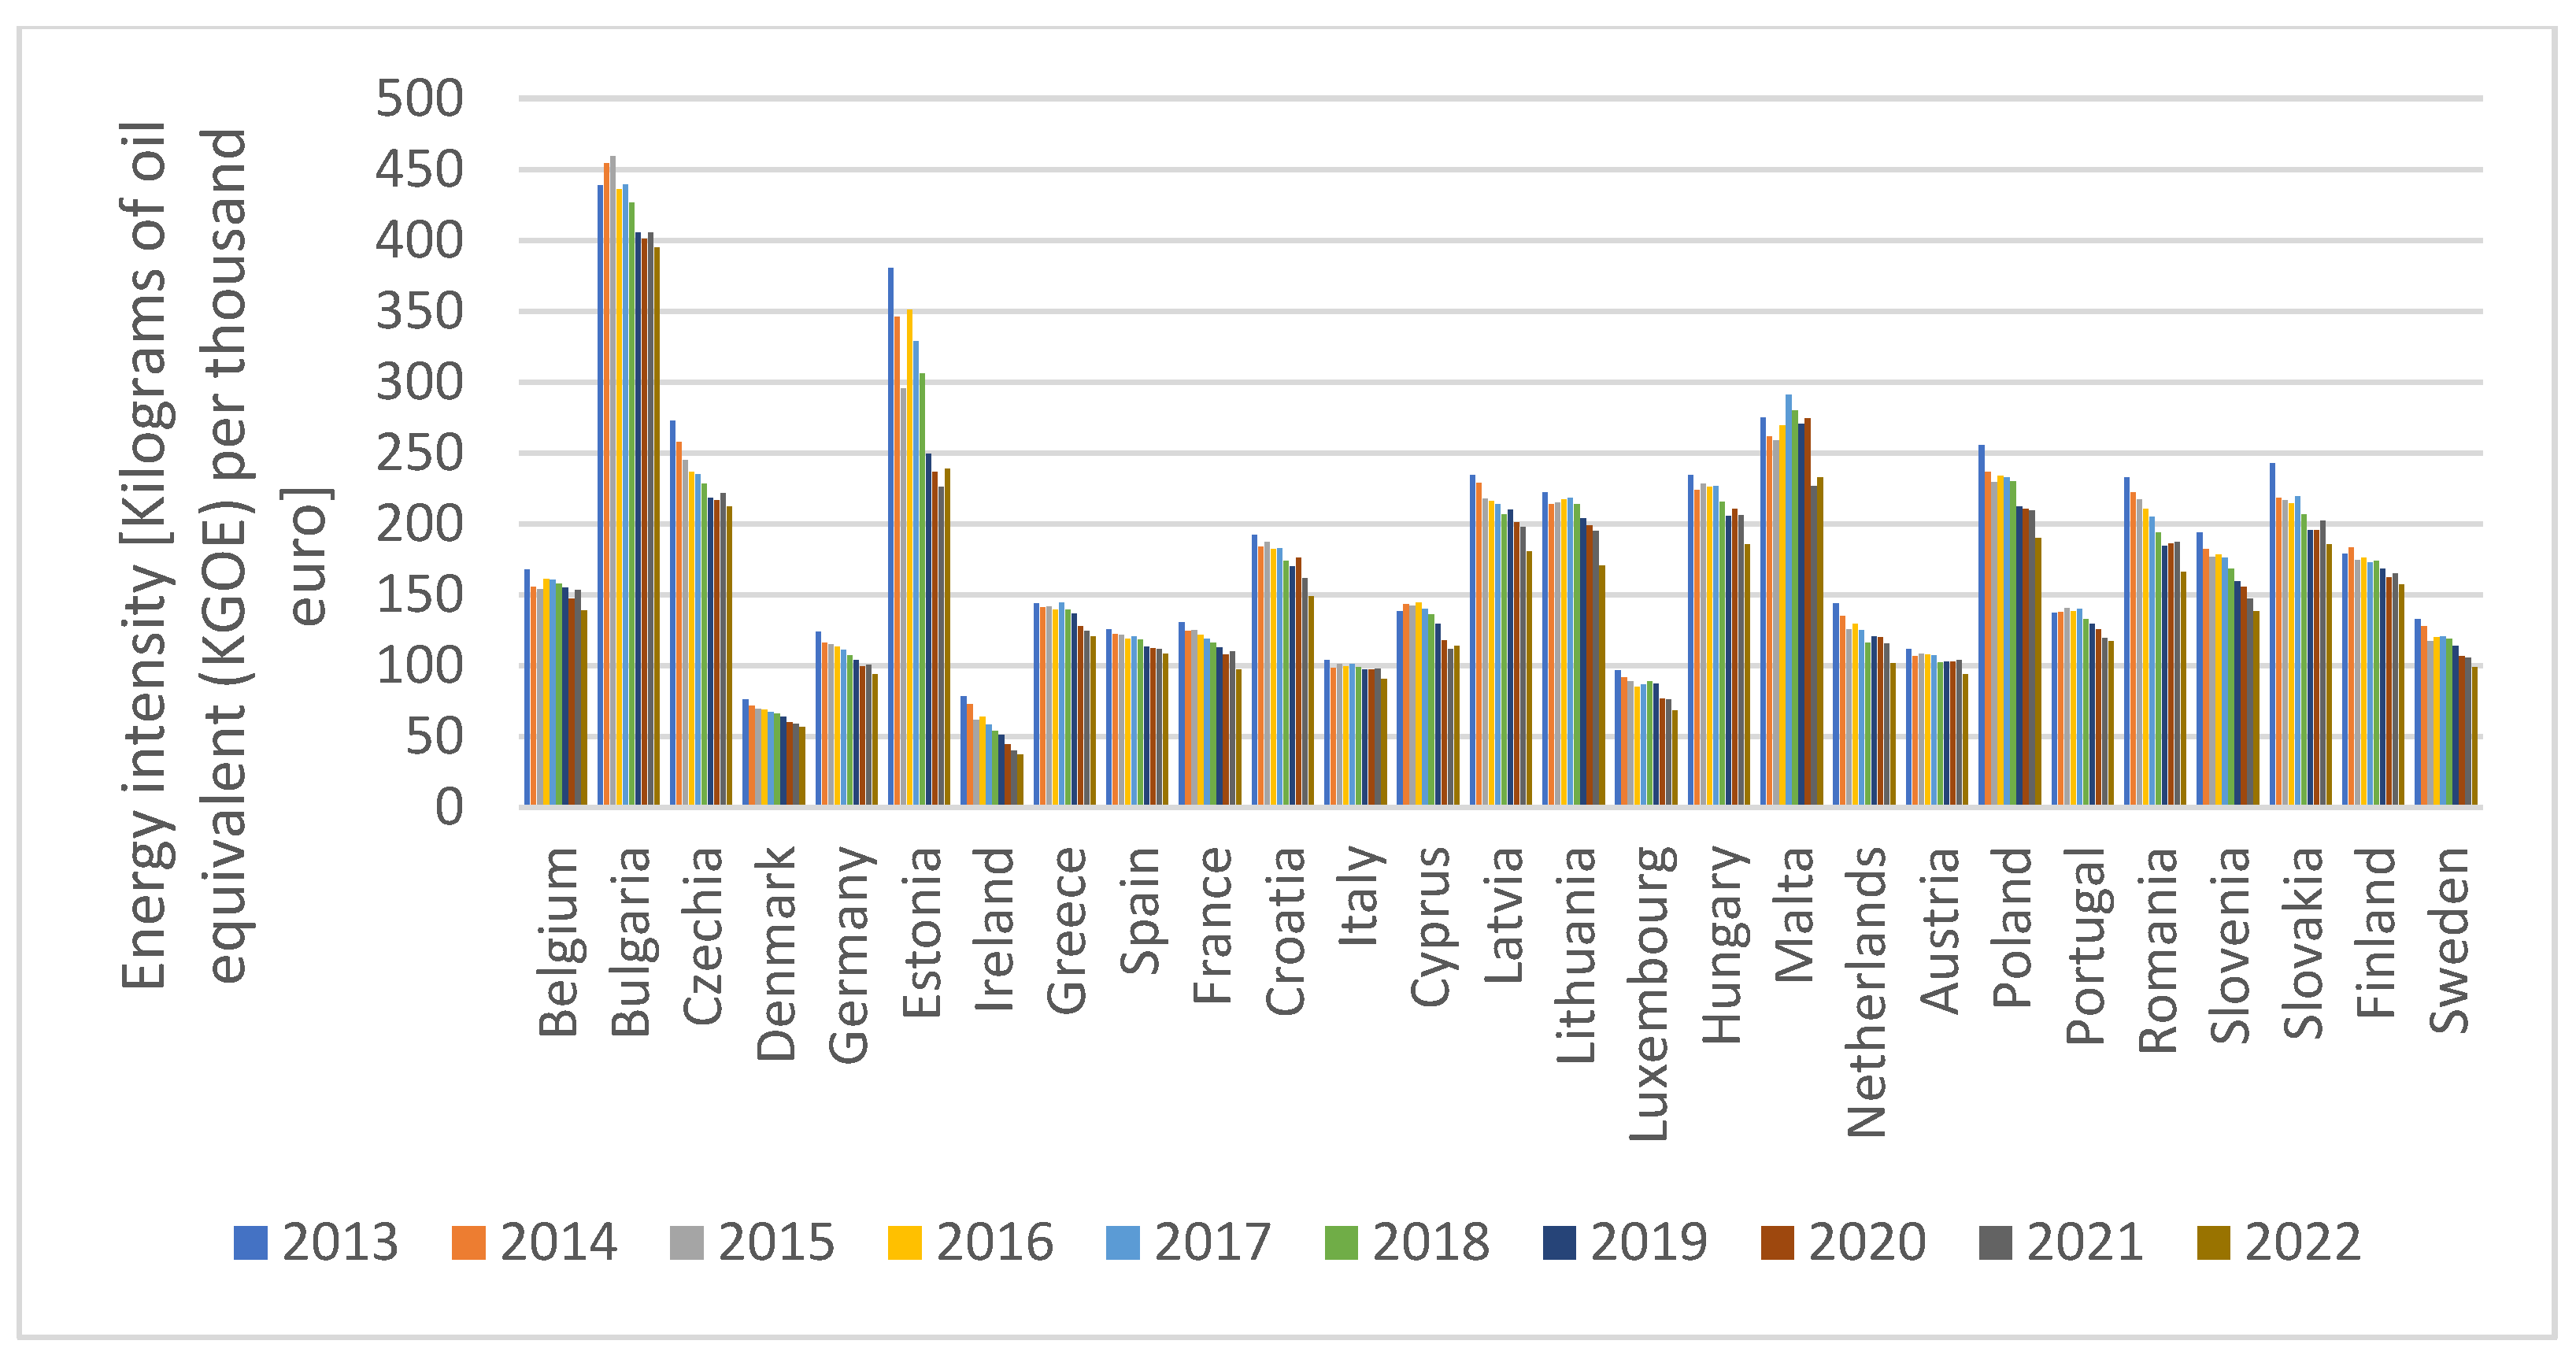
Energy intensity (EI) provides insight into the amount of energy needed for business activities, with lower intensity indicating a leaner and more efficient economy. Conversely, energy import dependence (%Import) shows the extent to which a country relies on external sources for its energy needs, with lower dependence indicating greater energy security.
The mathematical formula of the indicator is as follows:
E T P I = % R E S · N E E · N E P E I · % I M
where:
  • (%RES)—the percentage of renewable energy sources.
  • (NEE)—the normalized energy efficiency.
  • (NEP)—the normalized energy productivity.
  • (EI)—the energy intensity.
  • (%IM)—the energy import dependency.
The presented methodology not only provides tools for assessing progress in energy transformation at the level of EU member states but also enables the identification of key challenges and opportunities. The results of the study can serve as a basis for formulating recommendations aimed at accelerating energy transformation and enhancing energy security. It should also be noted that a higher ETPI score indicates a more favorable state of energy transition, suggesting that the country is on a sustainable development path that is consistent with global energy and climate goals.

4. Results

In general speaking, the energy transformation process [26] requires moving away from coal due to its negative effects on the environment and human health. The energy system is responsible for two-thirds of global greenhouse emissions [27]. Burning coal generates significant amounts of carbon dioxide, which is the main greenhouse gas responsible for climate change. Moving away from coal and replacing it with clean energy sources such as renewable energy can help reduce CO2 emissions and limit global warming [28,29,30]. Coal is one of the main sources of air pollution, emitting substances harmful to health, such as dust, sulfur, nitrogen oxides and heavy metals. Switching to cleaner energy sources can improve air quality and reduce the risk of air pollution-related diseases. Coal is a non-renewable resource, which means that its resources are limited and exhaustible [31,32,33,34,35]. Moving away from coal towards renewable energy can reduce dependence on fossil raw materials and contribute to the sustainable use of natural resources. The energy transition can create new jobs in sectors related to renewable energy, energy efficiency and clean transport technologies. A shift to a more sustainable energy model can also drive innovation and contribute to long-term economic growth [12,36]. Therefore, moving away from coal is an important element of the energy transformation that aims to build a more sustainable and ecological energy system [37]. However, this process may require time, investment and commitment from governments, businesses and society as a whole.
The implementation level of renewable sources is a multi-year process, with the newest EU member states facing the greatest challenges. The lowest levels of renewable sources in the energy balance in 2019 were recorded by Poland (12.16%), Hungary (12.61%), the Czech Republic (16.24%), and Bulgaria (21.56%) [38]. To illustrate the current state of coal utilization in the energy balances of member countries, a categorization of the countries was carried out, as presented in Figure 2.
Due to the fact that the economies of the European Union are very diverse in terms of the sources used to produce electricity, a classification of countries was carried out in terms of the level of coal consumption in 2020. The figure shows the division into four groups of similar countries in this area. The leader among the countries with the highest coal consumption is Germany, followed by Poland and the Czech Republic; the third group is Romania, Bulgaria, Greece and France, while the remaining countries have a less significant share of coal in their energy balances. Based on the analysis of this data, it is clear that the process of moving away from coal must take into account the diversity of countries and their economic potential to transform energy systems [39,40]. Poland’s situation, as shown by the data presented, is unique compared to other countries in that over 80% of the country’s electricity comes from coal due to the rich deposits of this raw material. Therefore, the process of transformation in the energy sector requires a different and careful approach to the issue due to socio-economic considerations [41,42,43].
One of the most important proposed variants of decarbonization in the European energy sector is the use of renewable energy sources [44]. In this way, it will be possible to transform the European Union into an economy with high energy efficiency [45] and low carbon dioxide emissions.
In 2022, the European Court of Auditors designed the process of the gradual phase-out of coal in individual EU countries based on information obtained by the Commission. The countries were divided into groups: the first group includes countries where coal does not appear in the energy balance, i.e., Sweden, Estonia, Lithuania, Latvia, Belgium, Austria, and Portugal. The second group includes countries that have adopted a commitment to phase out coal by 2030, i.e., Finland, Slovakia, Hungary, Greece, Italy, France, Spain, the Netherlands, and Denmark. The third group is countries that have committed to moving away from coal in their energy balances after 2030. This group includes Germany and Romania. The fourth group includes countries in which the intention to move away from coal after 2030 was announced, but the Commission was not officially informed about it—Poland, Bulgaria, and the Czech Republic [46].

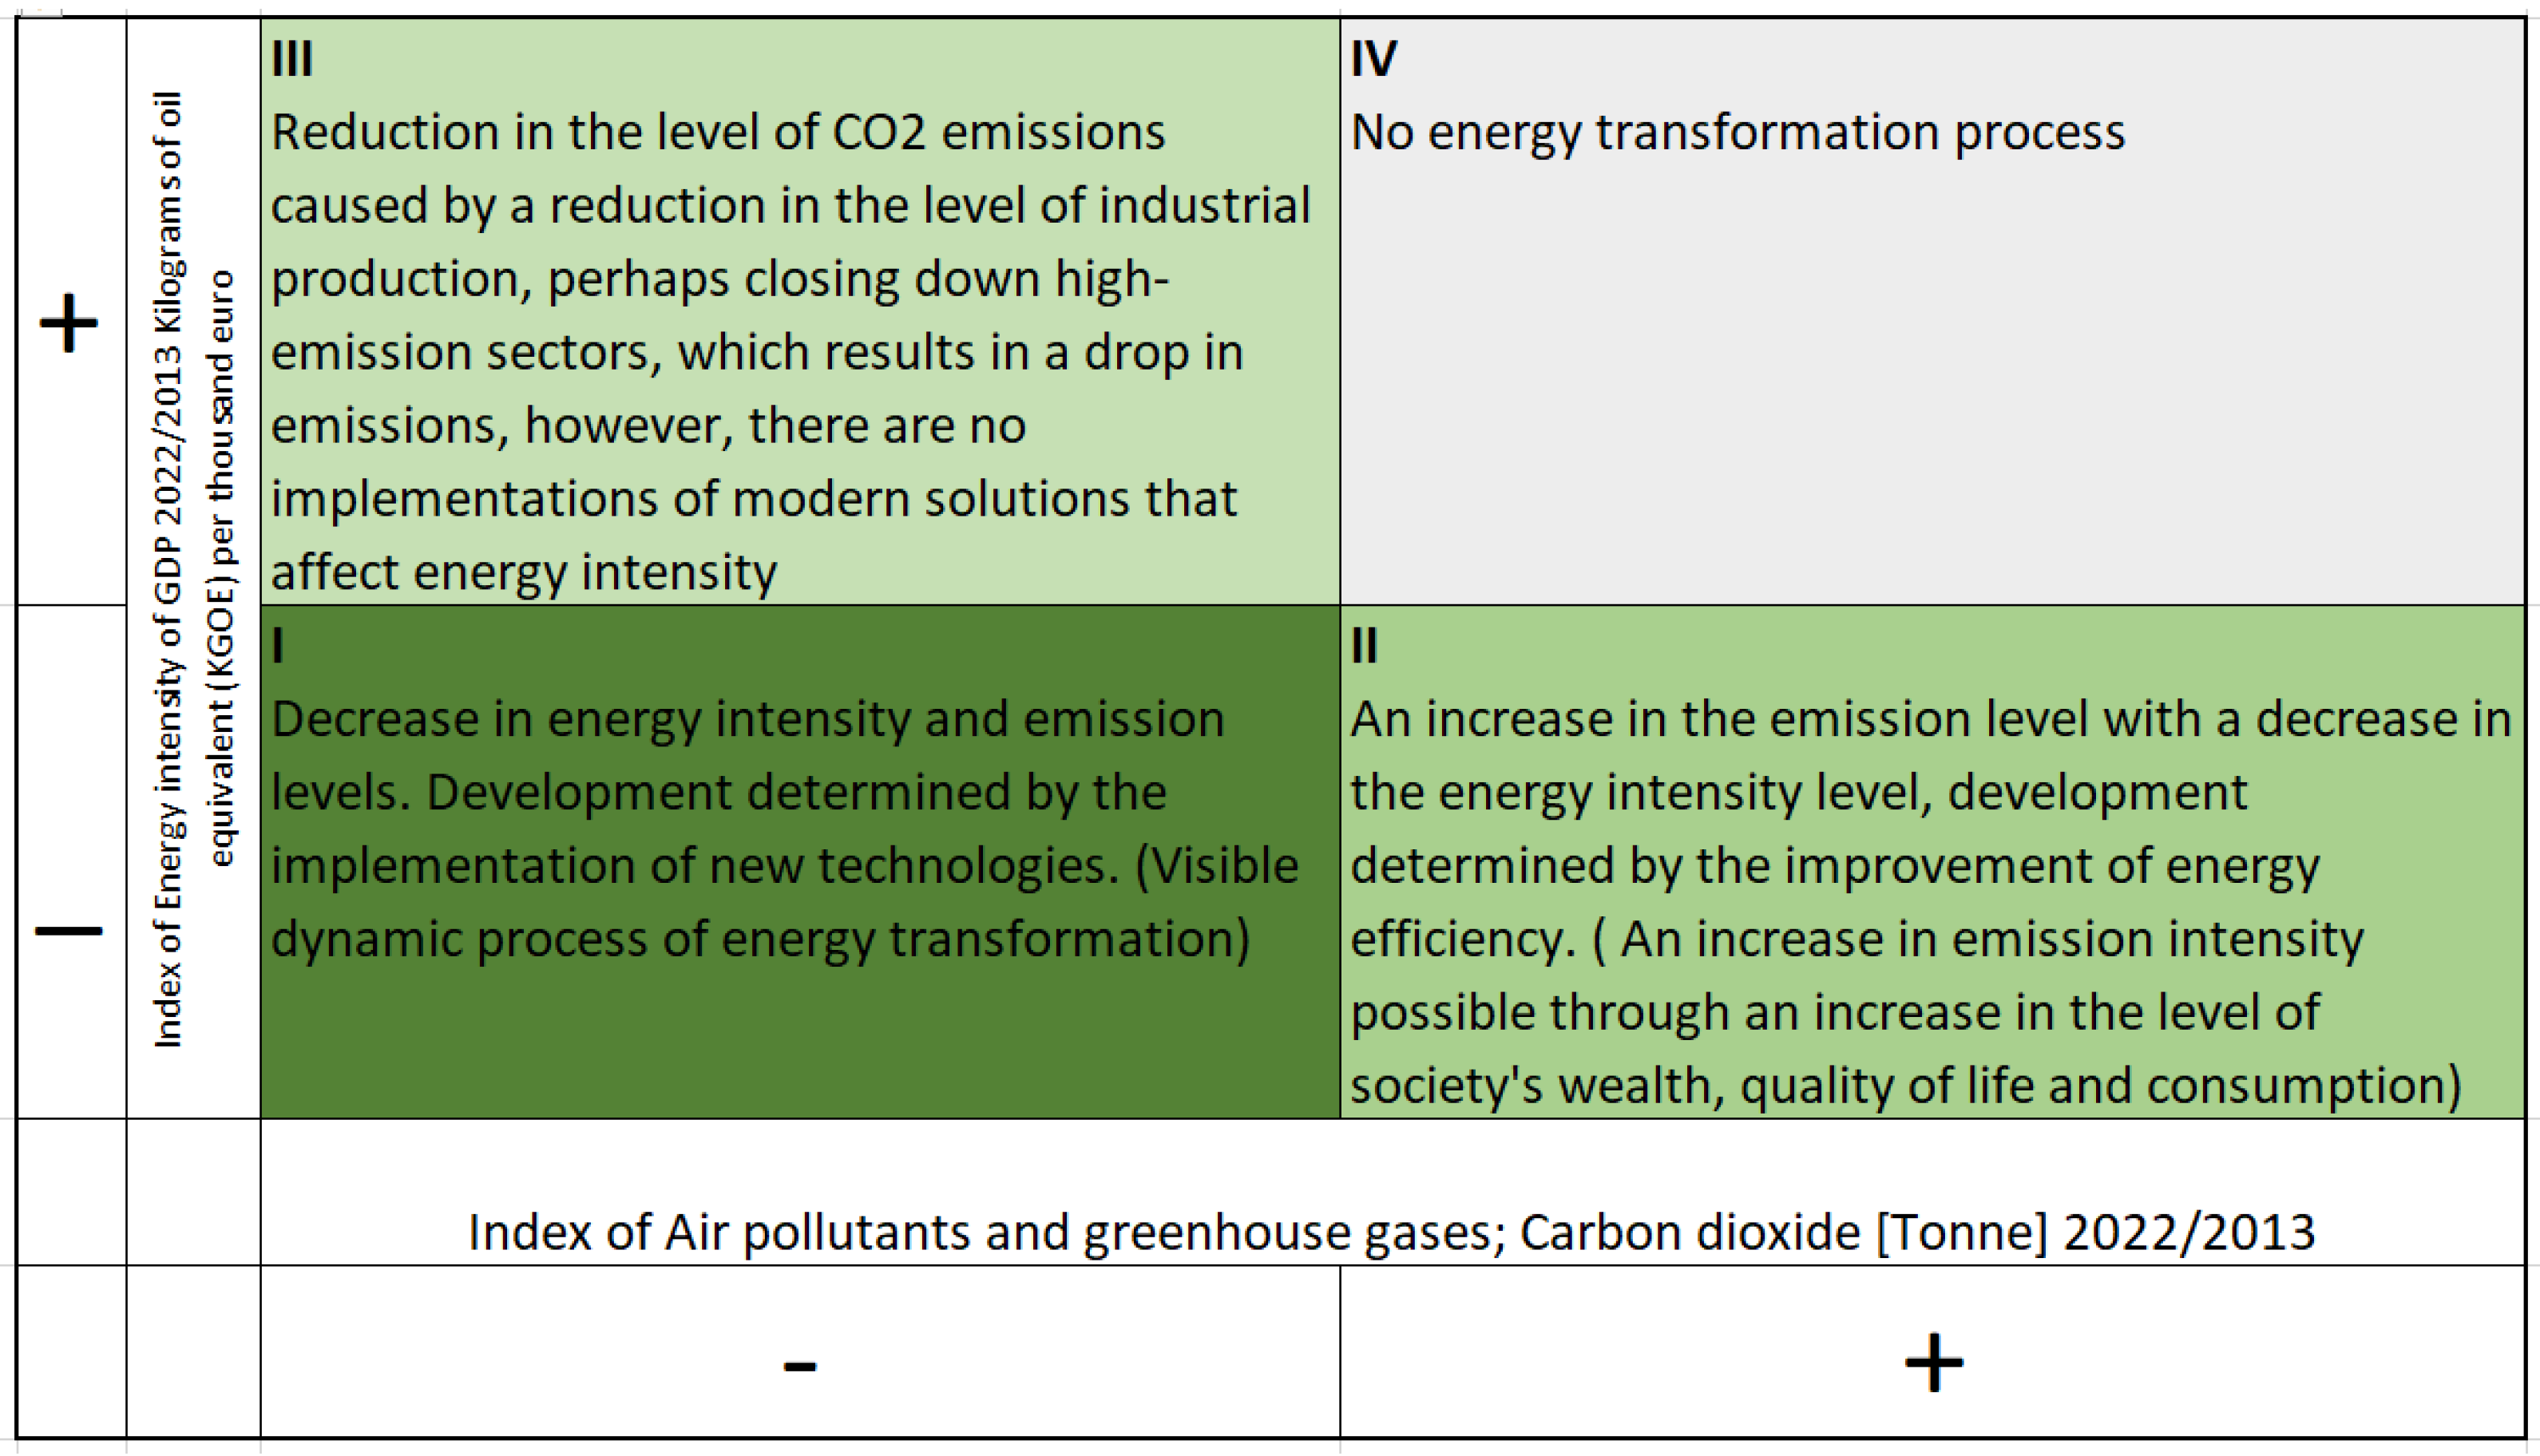
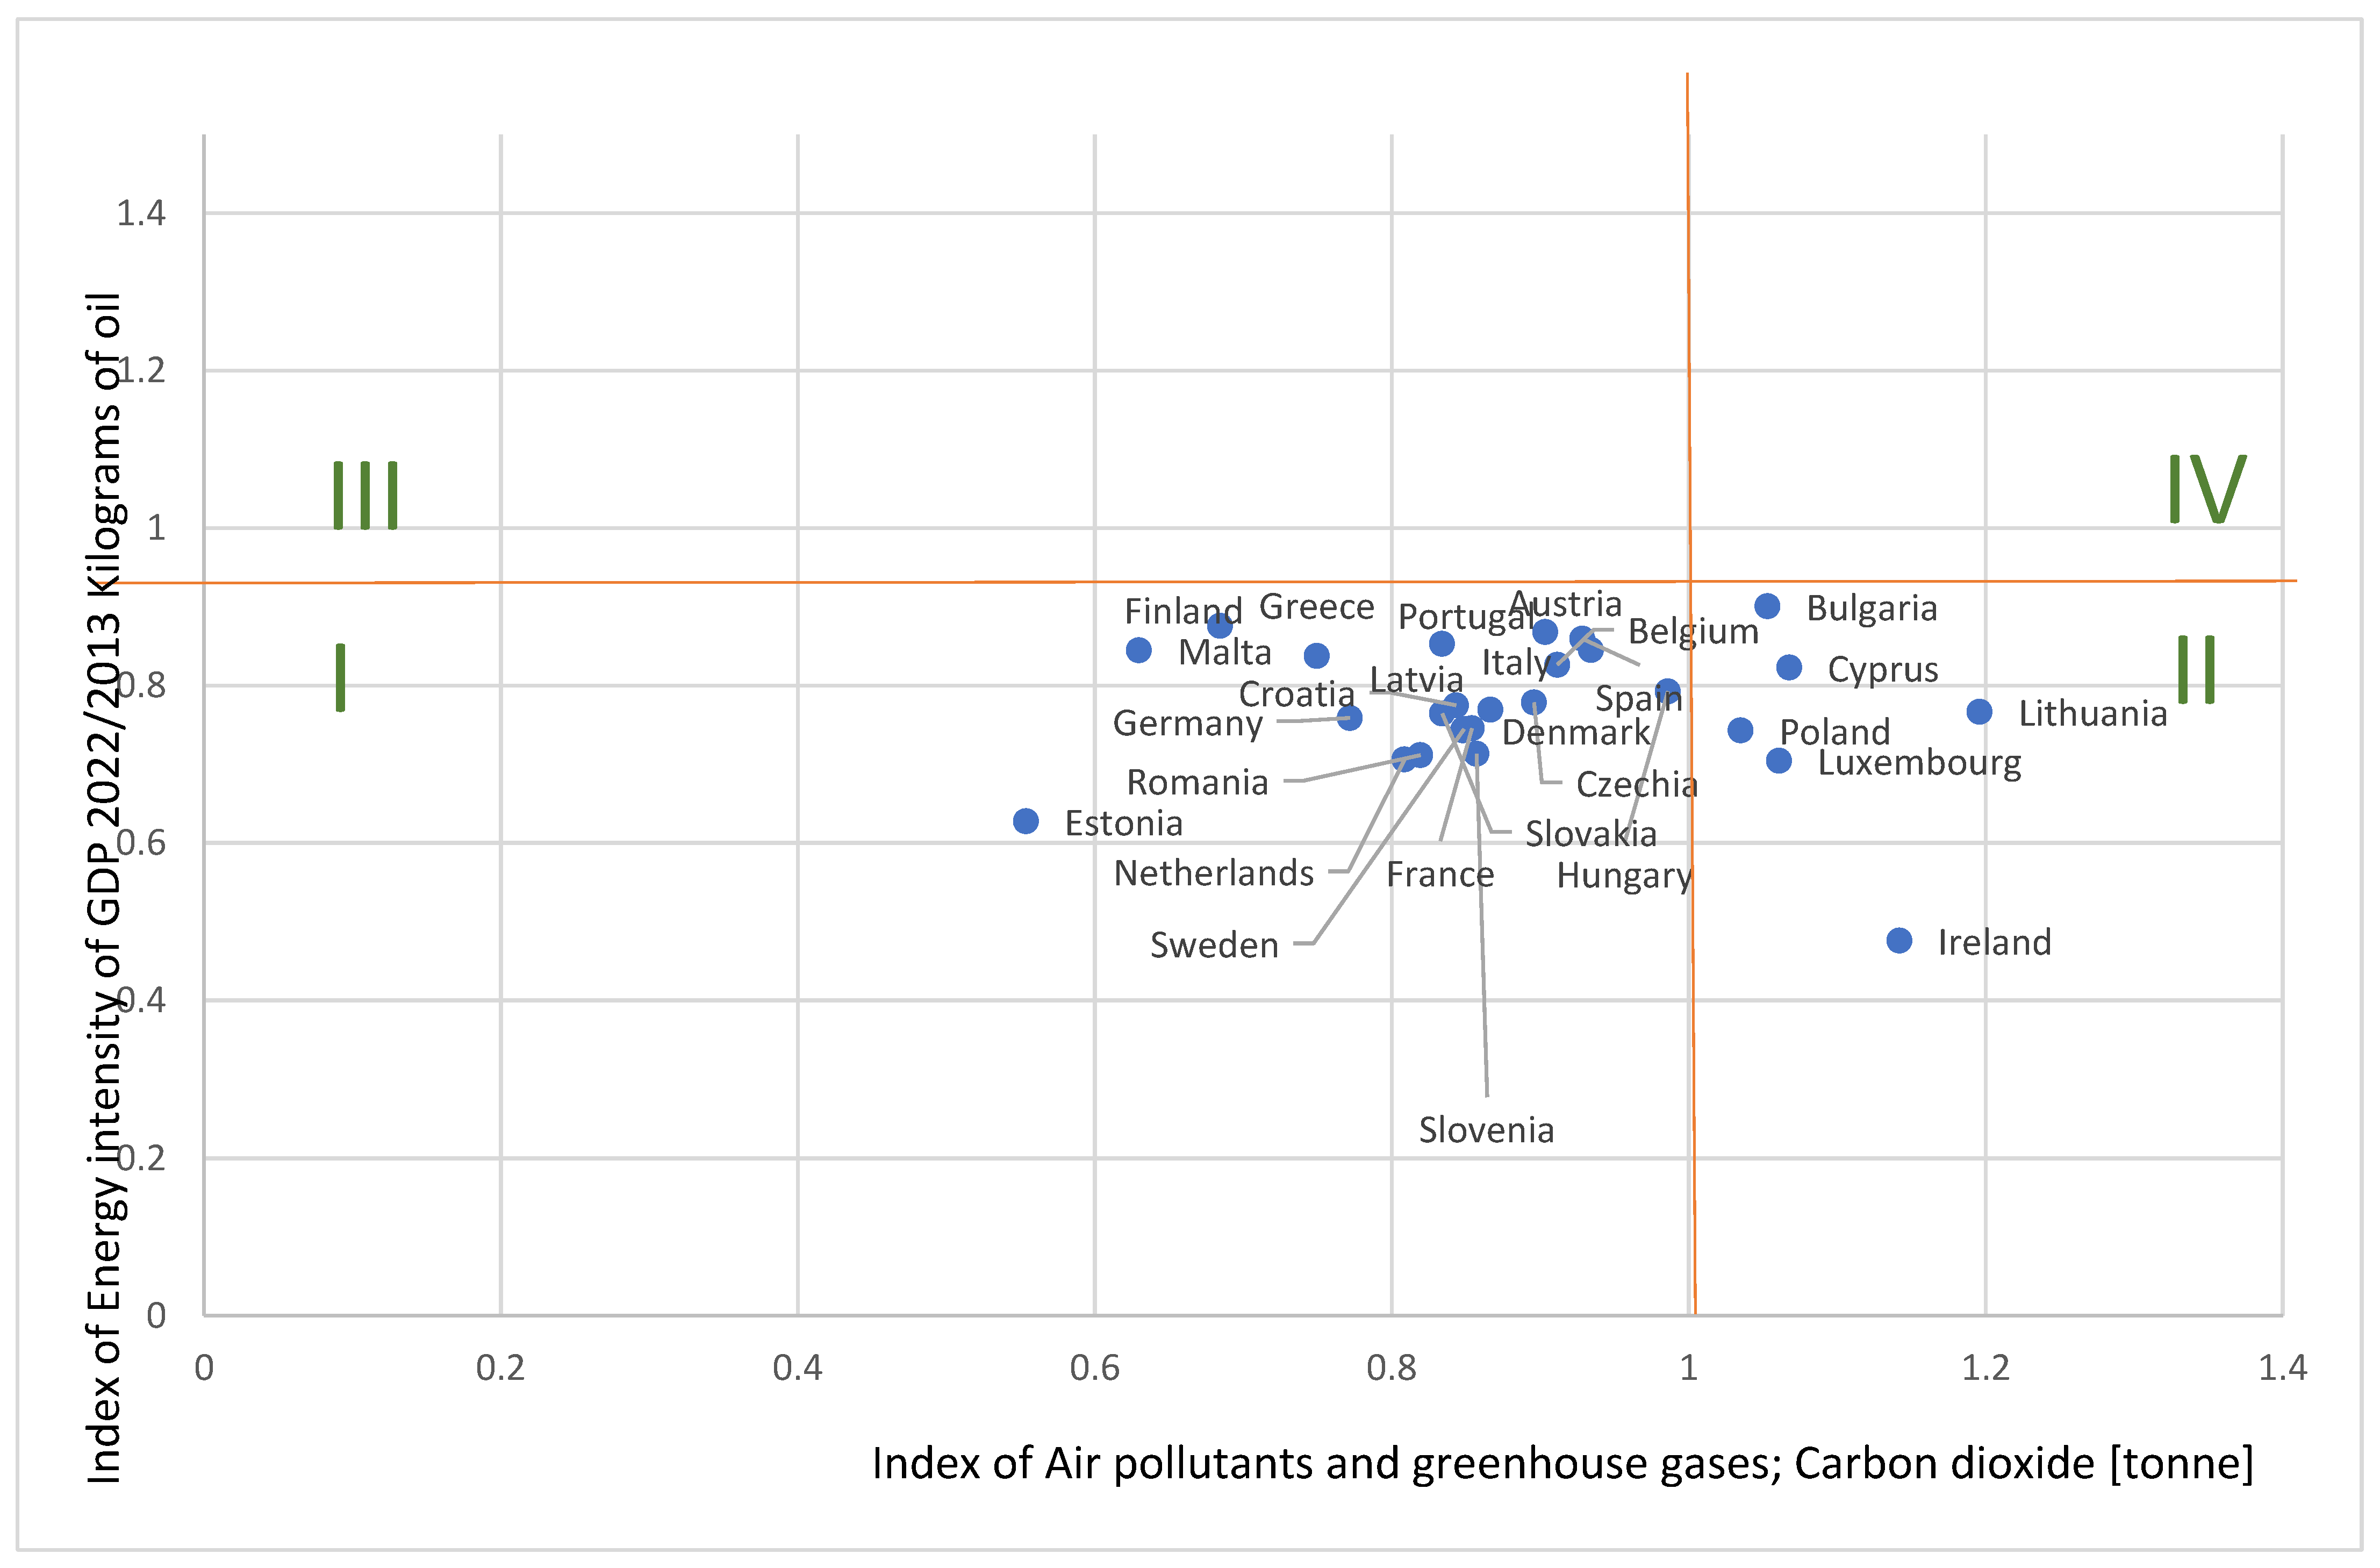
4.1. The First Stage of a Comprehensive Method for Assessing the Dynamics of Energy Transformation: Preliminary Classification of Countries in the Dynamic Matrix

Table 1 presents the indexes of the levels of two variables, i.e., the energy intensity level and the emission intensity levels expressed in CO2 in tons. The data include an index of the level in 2022 in relation to the level in 2013, which allows for the measurement of the dynamics of the changes taking place.
Based on the data from Table 1, a graph of the transformation dynamics matrix was drawn up, shown in Figure 3.
The matrix is divided into four categories: the first group contains countries with a decrease in energy intensity and emission levels. Development is determined by the implementation of new technologies. (a visible, dynamic process of energy transformation). II group- An increase in the emission level with a decrease in the energy intensity level; development is determined by the improvement of energy efficiency. (An increase in emission intensity is possible through an increase in the level of society’s wealth, quality of life and consumption.). III group: reduction in the level of CO2 emissions caused by a reduction in the level of industrial production, perhaps closing down high-emission sectors, which results in a drop in emissions; however, there are no implementations of modern solutions that affect energy intensity. IV group: no energy transformation process. Based on the assessment of the ongoing dynamics of the energy transformation process, two groups of member states were identified (Figure 3 and Figure 4). The first group represents countries in which the transformation process is proceeding dynamically in relation to the other countries. This is the most numerous group, which included 19 countries out of the 26 surveyed. The second group is made up of countries in which the process of energy transition is proceeding to a moderate degree. This group includes countries such as Italy, Bulgaria, Cyprus, Poland, Luxembourg, Lithuania, and Ireland. Factors that may have a significant impact on the observed increase in CO2 levels in the EU havens studied include human population growth and increasing consumption of energy and goods. Thus, Luxembourg is one of the countries experiencing demographic growth mainly due to migration from other countries, both within and outside the EU. Luxembourg’s high level of employment and relatively stable economic situation make it an attractive destination for migrants seeking work and better living conditions.
In summary, and in response to the first defined research problem, it should be noted that the preliminary diagnosis of the dynamics of changes in the energy transition process has shown diversity among member states in terms of advancement in the energy transition process. Two groups of member states have been selected, characterized by different paces of change in the energy sector. In most of the studied states, there is a dynamic process of energy transition, while in the second group of states, the pace of change is moderate. The results of this diagnosis bring significant knowledge from the perspective of implemented strategic objectives and environmental requirements, which may pose a challenge for countries with a moderate degree of changes implemented in energy systems. The research on the dynamics of changes clearly indicates that the countries facing the greatest challenges in the energy transition are Poland and Bulgaria. These countries belonged to the group where the process of transformation dynamics was stable (Figure 3); however, due to the problem of high coal share in the energy balances (Figure 2), the pace of change may be insufficient to achieve the EU’s assumed goal of zero coal share in the energy sector by 2030. The situation in the Czech Republic is different, as despite also having a high share of coal in the balance, it showed significantly more dynamic changes in the studied period of 2022 in relation to 2013, indicating more optimistic prospects for achieving the mentioned goal. Luxembourg, Lithuania, Cyprus, and Ireland, despite a stable level of change dynamics, belong to countries characterized by the lowest share of coal, and achieving the set goals does not pose a threat.

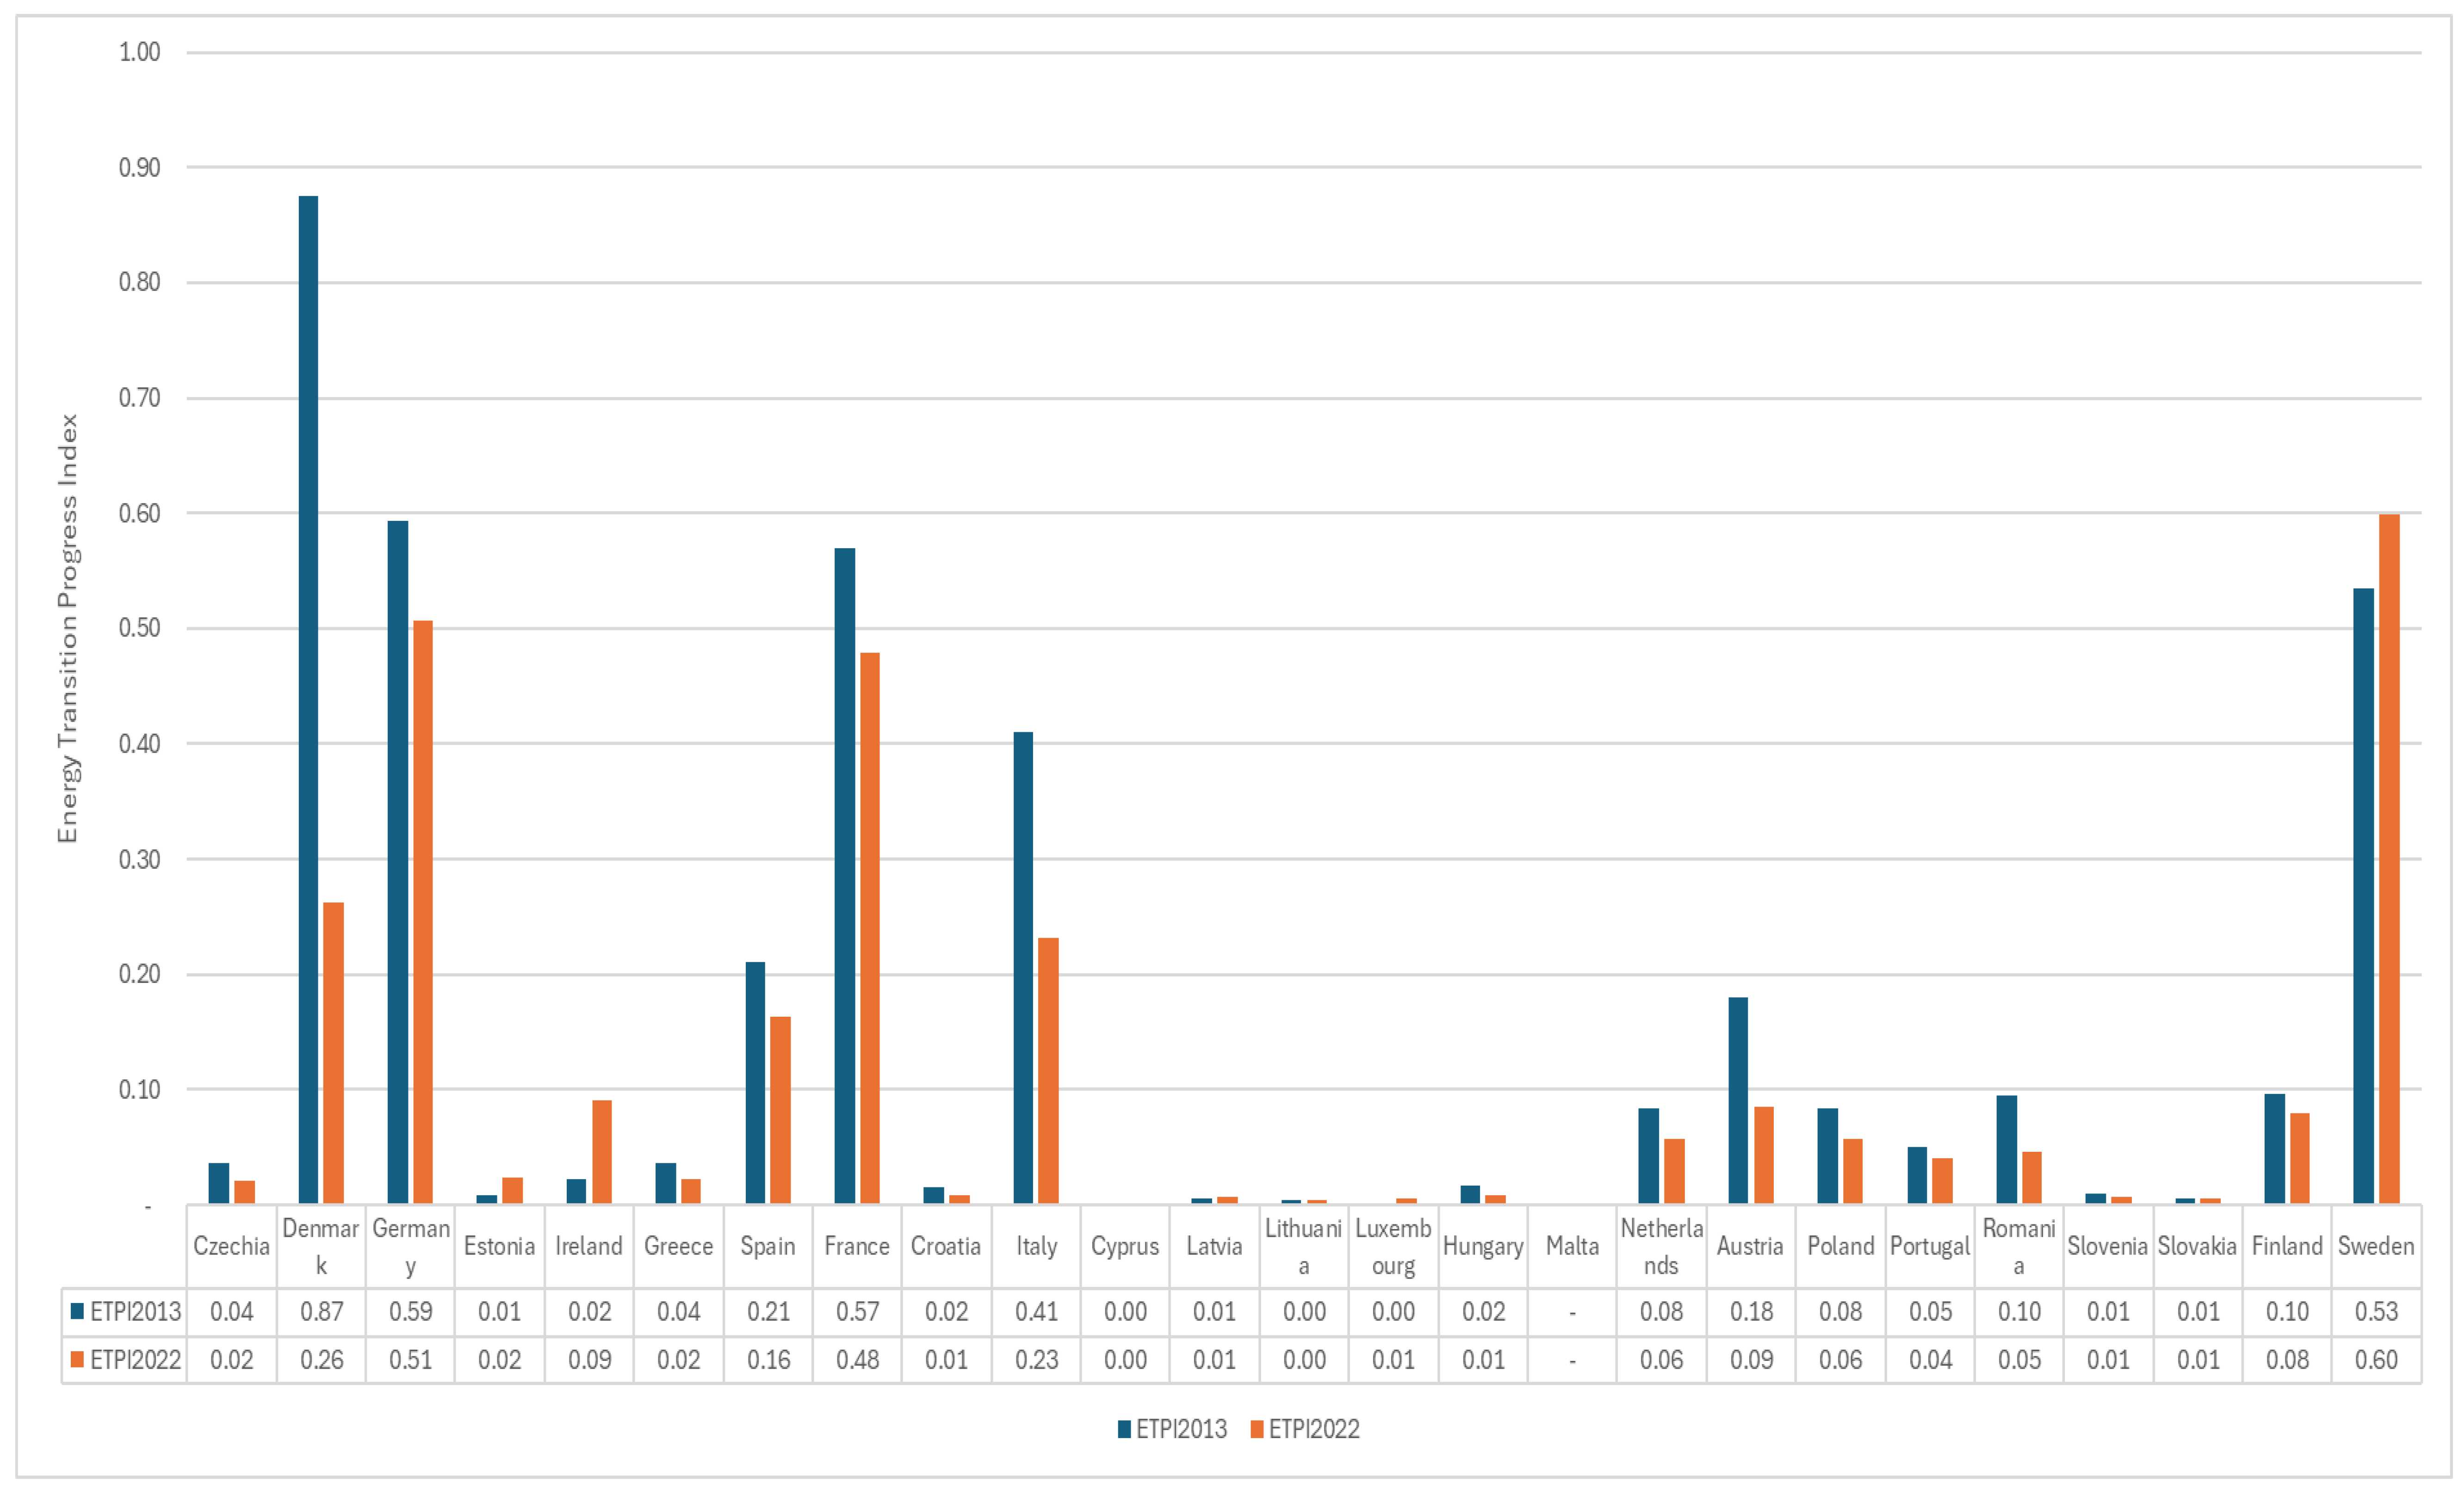
4.2. The Second Stage of the Comprehensive Method for Assessing the Dynamic of Energy Transformation: Construction of a Synthetic Indicator Measure Energy Transition Progress Index ETPI

The introduction to constructing a synthetic measure of energy transformation is a diagnosis of the structure of energy mixes in member states.
The European Union’s (EU) energy mix has been ever-evolving, and this is reflecting the bloc’s ambitious commitment to transitioning to a more sustainable and secure energy future (Figure 5).
As the EU moves to meet its ambitious climate targets, including reducing greenhouse gas emissions by at least 55% by 2030 compared to 1990 levels and reaching climate neutrality by 2050, the energy mix across member states is transforming at a pace [48,49,50,51]. Coal, which has long fueled many EU countries’ energy systems, is on the way out in favor of wind, solar and biomass. The decline in coal is most pronounced in countries such as Germany and Poland, which have a very high dependence on this fossil fuel. However, the speed of this transition varies, with some member states moving faster than others towards renewables [52,53,54,55]. The share of renewable energy in the EU’s energy mix has seen consistent growth, supported by technological improvements, lower costs and enabling policy frameworks. Wind, primarily offshore, has seen significant growth in countries such as Denmark and the Netherlands, while solar power incorporates a rising share of installed capacity, particularly in nations such as Spain and Germany [56]. Biomass and hydropower have continued to contribute significantly, particularly in countries with geography that allow for these sources. Energy storage and smart grid technologies have started to be integrated into power systems, allowing wind and solar power to deal with their inherent intermittency. These advancements have been complemented by widespread implementation of energy efficiency measures, contributing to an overall decrease in the EU’s economy’s energy intensity. As a bridge fuel facilitating the transition to a low-carbon economy, natural gas continues to play a significant role in the European energy mix. The EU has sought to improve energy security by reducing its dependency on imported natural gas, particularly from Russia, through supply source diversification and growing production of biogas and other renewable gases. In the EU, the role of nuclear energy remains a matter of great contention, with some EU member states pursuing the construction of new reactors and lifetime extensions for older facilities while others are committed to phasing out nuclear power. Safety, cost, radioactive waste management, and a stand on nuclear technology have been the points of contention among member states of the EU, reflecting a wider debate on the place of nuclear energy in the EU energy mix. The EU’s energy mix is also shaped by the ongoing process of developing an Internal Energy Market. The Internal Energy Market seeks to integrate national energy systems and markets into an EU-wide market. By enabling cross-border energy trade, increasing market competition, and contributing to energy security of supply, the Internal Energy Market has directly influenced the EU energy mix. The EU’s energy mix has evolved with a clear move towards renewables, a gradual phase-out of coal, a strategic use of natural gas, and a complex positioning with respect to nuclear energy. This shift over the coming decades benefits not only from one of the most robust regulatory frameworks globally, underpinned by the European Green Deal, which is the architecture for a sustainable energy transition. This transition overcomes the challenges of energy security, affordability and sustainability and will continue to evolve over the coming decades as it becomes the global reference for the transition to clean energy.
In the face of global challenges related to climate change, energy transformation has become one of the key priorities for countries around the world. The European Union, as one of the leaders in the field of sustainable development, has undertaken a number of initiatives aimed at accelerating the transition to clean and renewable energy sources. In this context, the analysis of energy transition indicators such as the share of renewable energy (%RES), energy efficiency (NEE), energy productivity (NEP), energy intensity (EI) and dependence on energy imports (%IM) becomes essential to assessing progress and determining further directions of action [57]. Much attention has been paid in the scientific literature to the study and evaluation of these indicators, which allows for a deeper understanding of the dynamics and effectiveness of energy policies implemented at the national and EU levels. Authors such as Smith and colleagues [58] and Johnson and Jones [59] emphasize the importance of the share of renewable energy in reducing greenhouse gas emissions. In turn, the works of Forsberg and Liu [60] and Evans [61] focus on energy efficiency as a key element of improving energy security and reducing dependence on fossil fuels. Energy productivity, as discussed by Takahashi and Tanaka [62], is analyzed in the context of economic growth and competitiveness. Energy intensity, studied by Zimmerman and colleagues [63], and dependence on energy imports, highlighted by Patel and Kumar [64], are indicators reflecting the efficiency of resource use and energy independence. Based on literature research, a detailed analysis of the above-mentioned energy transformation indicators in European Union countries will be carried out. It analyzed how individual Member States cope with the challenges related to the transition to more sustainable energy systems and what progress has been achieved in the last decade [65,66,67]. The second stage of the comprehensive method for assessing the dynamics of energy transformation is the construction of a composite ETPI indicator based on five diagnostic variables, such as the percentage of renewable energy sources, the normalized energy efficiency, the normalized energy productivity, the energy intensity, and the energy import dependency, expressed by the formula that indicates a synthetic measure determining the level of energy transformation. In order to implement the second stage, it is necessary to present the levels of partial indicators for the examined European Union countries, which are presented in Figure 6, Figure 7, Figure 8, Figure 9 and Figure 10. The percentage share of renewable energy in the energy mix is a measure determining the percentage of energy from renewable sources (such as solar, wind, geothermal, or biomass) in total energy consumption. It is a key indicator in assessing progress in the energy transition and the pursuit of sustainable development, as it promotes the use of clean energy sources and the reduction of greenhouse gas emissions. Analyzing the %RES indicator for European Union countries (Figure 6), it can be noticed that most countries recorded an increase between 2013 and 2022. Germany increased its share of renewable energy from 13.76% in 2013 to 20.80% in 2022, which proves significant progress towards increasing the share of clean energy in the country’s energy mix. Similar upward trends can be observed in other countries, such as Estonia, which increased its share from 25.36% to 38.47%, or Ireland, which increased from 7.52% to 13.11%. These changes are in line with the European Union’s goals to increase the share of renewable energy to achieve climate neutrality by 2050. The increase in the %RES indicator in many EU countries is the result of policies supporting the development of renewable energy sources, investments in new technologies, and improved energy efficiency. It is also a response to the growing public awareness of climate change and the need to act to protect the environment. However, it is worth noting that despite the overall increase in the %RES indicator, the rate of its increase varies depending on the country, which may be related to the availability of local renewable resources, energy policy, as well as the level of economic and technological development.
The Energy Import Dependence Index (%IM) is a measure of the extent to which a country imports energy to meet its needs. It is the percentage of imported energy in relation to the total energy consumption in a given period. This indicator is important from the point of view of energy security because high dependence on imports may mean susceptibility to price or political changes. The energy import dependence index for European Union countries, based on data from 2013 and 2022, has changed significantly (Figure 7). During this decade, many EU countries took action to reduce import dependence by diversifying energy sources, investing in renewable energy sources, and improving energy efficiency. During the analysis period, countries such as Denmark and Germany recorded an increase in dependence on energy imports due to the phasing out of energy production from fossil fuels without a sufficient increase in domestic energy production from renewable sources or due to an increase in overall energy demand that exceeded the capacity of domestic production. Dependence on energy imports is an indicator that requires special attention because high dependence can lead to vulnerability to price volatility in global markets and to political and supply risks. Therefore, policies and investments in domestic energy sources, energy efficiency and infrastructure are key to reducing this rate and increasing energy security.
Energy productivity is a key economic indicator that measures the amount of gross domestic product (GDP) produced per unit of energy consumed. It is a measure of the efficiency with which an economy transforms energy into economic value. High-energy productivity indicates that a country is able to generate greater economic value while using less energy, which is desirable from both an economic and environmental point of view. In the years 2013 to 2022, this indicator in European Union countries shows an increasing trend (Figure 8), which suggests an improvement in energy efficiency. Belgium increased its productivity from 5.97 [KGOE] in 2013 to 7.21 [KGOE] in 2022, Germany from 8.07 [KGOE] to 10.64 [KGOE] and France from 7.67 [KGOE] to 10.28 [KGOE]. These increases indicate that these countries have managed to create more economic value using the same amount of energy or even less energy.
Energy efficiency is a measure that refers to the amount of energy needed to produce a unit of a product or service. In other words, it is the ratio of the effect obtained (e.g., work, heat, or light) to the amount of energy consumed. Higher energy efficiency means that less energy is needed to do the same job, which translates into lower costs and fewer emissions of harmful substances into the environment. In the context of European Union countries, energy efficiency is a key element of energy policy, aiming to achieve the goals of reducing greenhouse gas emissions, improving energy security, and reducing costs for consumers and businesses. EU countries are taking a variety of actions to improve energy efficiency (Figure 9), including modernizing infrastructure, introducing standards and regulations on the energy efficiency of buildings and equipment, and promoting technological innovation and pro-ecological behavior. When analyzing energy efficiency in individual countries, it can be seen that countries achieve different results. For example, Scandinavian countries such as Sweden and Denmark are leaders in energy efficiency due to their long-term investments in renewable energy sources, efficient heating systems and innovative technologies. In turn, Central and Eastern European countries have lower energy efficiency, which is partly due to historical heritage, less efficient energy systems, and the need to modernize infrastructure.
The Energy Intensity Index (EI) is a measure of the amount of energy needed to produce a unit of gross domestic product (GDP). This indicator is the inverse of energy productivity—a lower EI value indicates greater energy efficiency in the economy because less energy is needed to produce the same amount of goods and services. Analyzing changes in the energy intensity index in European Union countries between 2013 and 2022, the following trends can be noticed (Figure 10): Belgium reduced its energy intensity from 167.61 [KGOE] in 2013 to 138.52 [KGOE] in 2022. Germany reduced EI from 123.91 to 94.03 [KGOE]. France reduced EI from 130.49 to 97.29 [KGOE]. This data shows that energy efficiency is improving in these countries, meaning they are able to create more economic value using less energy.
It has been observed that energy intensity may vary depending on the economic structure of the country. Countries with high industrial production may have higher energy intensity due to greater energy demand in production processes. In contrast, countries with economies dominated by services may have lower energy intensity. In the years 2013–2022, there has been a trend of reducing energy intensity in most EU countries, which is consistent with the goals of the European Union’s energy and climate policy. Striving to increase energy efficiency is a key element of the strategy for sustainable development and the fight against climate change. Improving EI is also important from the point of view of the competitiveness of economies because it allows for reducing production costs and increasing profits.
Based on the presented analysis of diagnostic variables, it is possible to aggregate the variables into a synthetic composite index.
The Energy Transition Progress Index (ETPI) has been developed to serve as a comprehensive measure, taking into account the multi-aspect nature of the energy transformation. ETPI integrates several key dimensions of the energy transition, including the adoption of renewable energy sources, improving energy efficiency, advancing energy productivity and reducing dependence on energy imports. By combining these values into one indicator, it is possible to analyze the energy structure of countries and their trajectories toward a more sustainable and autonomous energy future.
In contrast to other popular indicators, such as the Energy Transition Index (ETI) and the World Energy Trilemma Index (WETI), which mainly focus on the security of energy supply, availability, and environmental sustainability [68,69,70,71,72,73,74], ETPI adds a dimension of dependence on the import of energy resources, offering a fuller picture of a country’s energy security by considering not just domestic production but also potential risks associated with external sources of energy. While other indicators may concentrate on single aspects of energy transformation, ETPI offers a holistic approach by integrating several key dimensions, such as energy efficiency, energy intensity, energy productivity, the share of renewable energy, and the mentioned dependence on imports. This provides a comprehensive tool for assessing progress in energy transformation that takes into account various goals related to energy policy.
The Energy Transition Progress Index (ETPI) was calculated for the European Union member states (Figure 11) based on Formula (1).
ETPI, being a composite measure that integrates several important dimensions of the energy transformation, allows for the analysis of the energy structure of individual countries and their trajectory towards a more sustainable and autonomous energy future. In this way, lessons can be drawn from observed changes in ETPI that can be used to shape strategies and priorities in the context of sustainability efforts. This analysis allows an understanding of where a given country is currently in the energy transformation process but also assesses which actions have proven effective and which require further development and support. The results are shown in Table 2.
Analyzing the data from Table 2 in conjunction with the general trends in changes to the ETPI (Energy Transition Performance Index) for European Union countries between 2013 and 2022 reveals significant insights into the progress of the energy transition. ETPI is an indicator that measures progress in the energy transition, accounting for factors such as the share of renewable energy, energy efficiency, energy productivity, energy intensity, and dependence on energy imports.
In 2013, countries like Denmark, Germany, and France had relatively high ETPI values, at 87%, 59%, and 57%, respectively. This indicates that these countries were leaders in the EU’s energy transition. Conversely, countries such as Poland, Romania, and Bulgaria had lower ETPI values, suggesting they had more work to do towards the energy transition.
Over the decade from 2013 to 2022, we observed various changes in the ETPI of individual countries. Some countries, like Sweden, increased their ETPI from 53% to 60%, demonstrating their progress and commitment to the energy transition. Other countries, like Denmark, experienced a significant drop from 87% to 26%, which may indicate that the designated actions are not achieving the desired results.
It can also be observed that the dependency on energy imports (%IM) has a varied impact on the ETPI (Energy Transition Progress Index) across different European Union countries. The ETPI takes into account, among other factors, the dependency on imported energy raw materials as one dimension of assessing progress in energy transformation. The analysis shows that most countries demonstrate changes in their dependency on energy imports between 2013 and 2022. For instance, Estonia reduced its dependency on energy imports from 14.522% in 2013 to 6.159% in 2022, indicating an increase in energy self-sufficiency. Conversely, Germany increased its dependency from 62.411% to 68.555%, which may indicate that growing energy needs were not met by domestic production. Changes in dependency on energy imports have a direct impact on the ETPI, reflecting shifts in energy security and energy independence of the countries. For example, the improvement in Estonia’s energy self-sufficiency is reflected in a positive change in its ETPI by 2%, suggesting an improvement in the progress of energy transformation.
The analysis illustrates differences in import dependency among EU countries and its impact on ETPI. Countries that have managed to reduce their dependency on imported energy resources or maintain it at a stable level often record positive or stable changes in their ETPI, suggesting they are on the right path toward achieving greater energy independence and sustainable energy transformation.
Increased dependency on imports in some countries, like Germany, highlights the challenges associated with ensuring energy security during the energy transformation process. At the same time, it points to opportunities for further development of domestic renewable energy production and energy efficiency to reduce this dependency.
Generally, most EU countries have increased the share of renewable energy in their energy mix, which is a positive sign towards achieving climate and sustainability goals. However, changes in energy efficiency, energy productivity, energy intensity, and dependence on energy imports vary among member countries.
Taking a closer look at the data from Table 2, we see two main trends characterizing the dynamics of changes in the ETPI. On the one hand, countries like Belgium, Bulgaria, and the Czech Republic maintain their ETPI at a stable level or note slight changes, indicating gradual progress in the energy transition. On the other hand, countries such as Denmark and Germany, despite initially being leaders, show a decline in their ETPI, suggesting a need to review and adjust actions to enhance the efficiency of the transition.
ETPI is just one of many indicators that can be used to assess progress in the energy transition and should be considered from a broader perspective. The integration of various aspects of the energy transition, such as increasing the share of renewable energy, improving energy efficiency, and reducing dependence on imported energy sources, is crucial for achieving a sustainable energy future. In the context of these analyses, it is important for EU countries to continue and strengthen their efforts towards the energy transition, taking into account both the challenges and opportunities that lie ahead.

5. Discussion

The analysis of progress in energy transformation in the European Union countries, conducted based on the developed two-stage methodology, provides significant insights into the dynamics of change and the diversity of approaches to energy transformation. This methodology, integrating the ETPI (Energy Transition Progress Index), allowed for a detailed assessment of progress in energy transformation, identifying both leaders and countries lagging in this process.
In the first stage of the analysis, EU countries were classified in a change dynamics matrix, considering two indicators: energy intensity in 2022 compared to 2013 and the intensity of greenhouse gas emissions in 2022 relative to 2013. This preliminary classification enabled the identification of countries that have made the most progress, as well as those that have encountered difficulties in the energy transformation process.
The ETPI, being a key element of the second stage of the analysis, encompasses aspects of energy transformation such as the share of renewable energy, energy efficiency, energy productivity, energy intensity, and dependency on the import of energy raw materials. This indicator, through a comprehensive assessment, facilitated the evaluation of progress in the energy transformation of individual EU countries from a more integrated perspective.
Based on the analysis, countries that have made significant progress in energy transformation were highlighted, as well as those that have faced challenges in this process:
  • Significant Progress: Sweden noted an increase in its ETPI from 53% in 2013 to 60% in 2022, indicating its progress and commitment to energy transformation.
  • Challenges in the Process: On the other hand, Denmark experienced a significant decrease in its ETPI from 87% to 26%, which may suggest that the actions taken are not yielding the expected results.
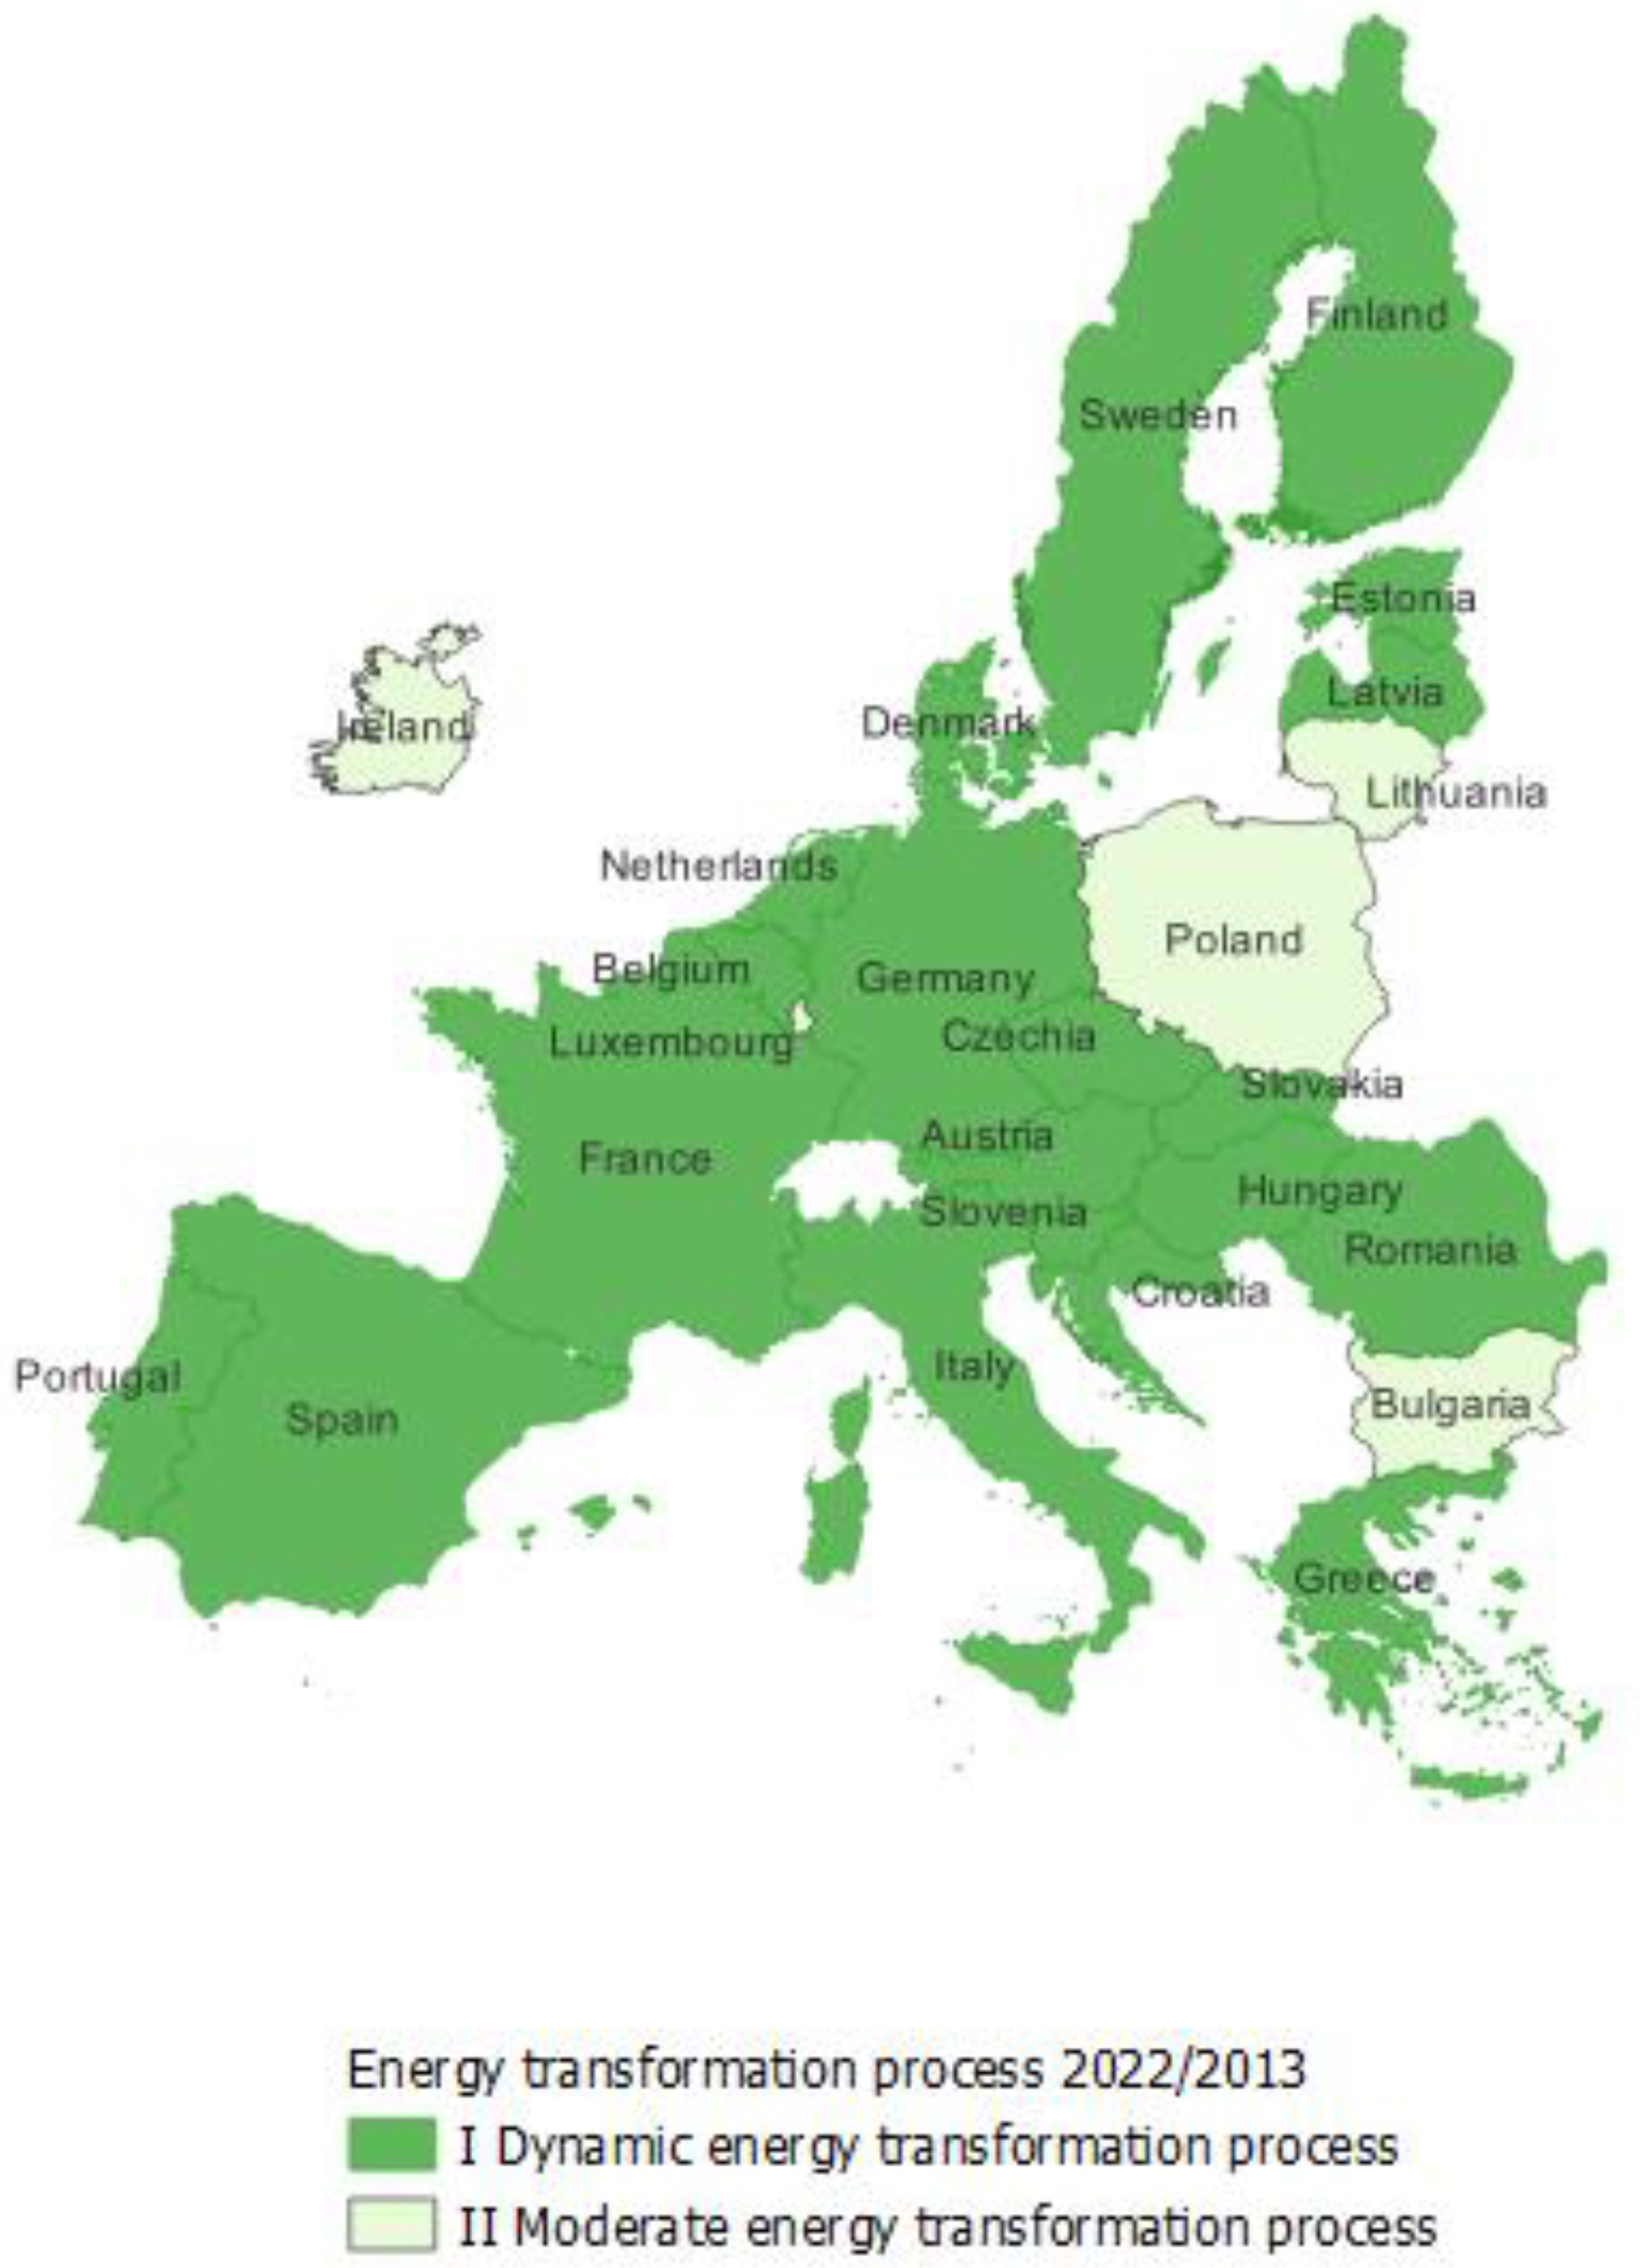
  • Countries with Moderate Progress: In the group of countries where the energy transformation process is proceeding at a moderate pace, Italy, Bulgaria, Cyprus, Poland, Luxembourg, Lithuania, and Ireland were found.
  • Countries with Stable Dynamics of Change: Poland and Bulgaria, despite their high share of coal in their energy balances, were included in the group of countries with stable dynamics of transformation.
A key conclusion from the analysis is the confirmation that energy transformation in the EU is a dynamic and diverse process, requiring continuous efforts, innovation, and cooperation among all stakeholders to achieve the ambitious goals of the Green Deal and global climate commitments. Insights from the study offer valuable knowledge for further shaping strategies and priorities in the context of sustainable development actions, emphasizing the importance of a holistic approach to assessing progress in energy transformation.

6. Conclusions

Energy transformation in the European Union is a key component of the strategy for sustainable development, aimed at transitioning from economies based on fossil fuels to energy systems dominated by renewable sources of energy. It is a complex process that involves technological, regulatory, economic, and social changes aimed at reducing greenhouse gas emissions, increasing energy efficiency, and improving energy security.
The article presents a two-stage research methodology designed to assess the dynamics of energy transformation in the European Union member states. This innovative methodology allows for a detailed analysis and assessment of the progress made by individual countries towards sustainable energy transformation.
The first stage of the methodology involves the preliminary classification of countries based on the energy transformation dynamics matrix. For this purpose, two indicators were used: energy intensity and carbon dioxide emissions intensity. This analysis allowed for the identification of the initial level of advancement of individual member states in the energy transformation process, taking into account their individual conditions and challenges.
The second stage focuses on the construction of the Energy Transition Progress Index (ETPI), which is a composite indicator encompassing five diagnostic variables: the share of renewable energy in the energy mix, energy efficiency, energy productivity, energy intensity, and dependence on energy imports. ETPI allows for a synthetic assessment of the level of energy transformation in the studied countries, integrating various aspects of transformation into one comprehensive indicator. The results presented in the article unequivocally indicate the leaders in energy transformation during the studied period among the EU countries, including Sweden, Germany, Denmark, France, Italy, Spain, Austria, Finland, and the Netherlands. The calculation results show a significant similarity to the global ETI and WETI indices, where the mentioned countries are also classified in the top positions of global rankings.
The analysis of the study results shows a clear diversity in the progress of energy transformation among European Union countries, which is reflected in the different values of the ETPI indicator for individual states:
  • Sweden and Denmark are examples of countries that have made significant progress in energy transformation, resulting from effective policies supporting the development of renewable energy sources, high energy efficiency, and investments in modern technologies. These countries have demonstrated a considerable increase in the share of renewable energy in their energy mixes and improvements in energy efficiency.
  • Poland and Bulgaria are examples of states facing greater challenges in the energy transformation process. This is mainly due to historical dependence on coal as the main energy source. In these countries, progress in the field of renewable energy sources and energy efficiency is slower, which requires additional actions and support to accelerate the transition to sustainable energy systems.
  • Germany, being one of the leaders in innovation and technology, also faces challenges related to the decarbonization of the energy sector. Despite significant investments in renewable energy sources and ambitious climate goals, Germany still struggles with coal dependency and the need to balance energy needs with environmental protection.
This methodology enables a deep understanding of the energy transformation process in the European Union, identifying key trends, challenges, and areas where further action is necessary. The study results indicate a diverse level of progress in energy transformation across individual member states, emphasizing the importance of strategies and energy policies tailored to the specific context.
In response to the research question: “Does the process of energy transformation proceed at a comparable pace in European countries?”, the analysis showed that progress in energy transformation varies by country. These differences stem from several factors, including the availability of renewable resources, energy policy, and the economic capabilities of individual states. Therefore, although the overall direction of transformation is consistent with EU goals related to sustainable energy and decarbonization, the pace and scale of changes differ among countries.

Author Contributions

Conceptualization, A.M. and A.B.; methodology, A.M. and A.B.; software, I.C.-O.; validation, A.M. and A.B.; formal analysis, A.M. and A.B.; investigation, A.M. and A.B.; resources, A.B.; data curation, A.M. and A.B.; writing—original draft preparation, R.W.; writing—review and editing, I.C.-O.; visualization, I.C.-O. and R.W.; supervision, R.W.; project administration, A.M.; funding acquisition, A.M. and A.B. All authors have read and agreed to the published version of the manuscript.

Funding

This research was funded by Statutory Research BK2024.

Institutional Review Board Statement

Not applicable.

Informed Consent Statement

Not applicable.

Data Availability Statement

The original contributions presented in the study are included in the article, further inquiries can be directed to the corresponding authors.

Conflicts of Interest

The authors declare no conflicts of interest.

References

  1. Meadows, D.H.; Meadows, D.L.; Randers, J.; Behrens, W. Granice Wzrostu; Raport dla Klubu Rzymskiego; PWE: Warszawa, Poland, 1973. [Google Scholar]
  2. Sachs, I. Eco-development: A definition. Ambio 1979, 8, 111–113. [Google Scholar]
  3. Tolba, M.K. Development without Destruction: Evolving Environmental Perceptions; Tycooly Publishing: Dublin, Ireland, 1976. [Google Scholar]
  4. David, L.S.; Duckstein, L. Multicriterion ranking of alternative long-range water resources systems. Water Resour. Bull. 1976, 12, 731–754. [Google Scholar] [CrossRef]
  5. Report of the World Commission on Environment and Development (1987): Our Common Future. Available online: https://sustainabledevelopment.un.org/content/documents/5987our-common-future.pdf (accessed on 14 February 2024).
  6. RePowerEU. Available online: https://eur-lex.europa.eu/legal-content/EN/TXT/?uri=COM%3A2022%3A230%3AFIN&qid=1653033742483 (accessed on 20 March 2024).
  7. Ellabban, O.; Abu-Rub, H.; Blaabjerg, F. Renewable energy resources: Current status, future prospects and their enabling technology. Renew. Sustain. Energy Rev. 2014, 39, 748–764. [Google Scholar] [CrossRef]
  8. Bluszcz, A.; Manowska, A. The use of hierarchical agglomeration methods in assessing the Polish energy market. Energies 2021, 14, 3958. [Google Scholar] [CrossRef]
  9. Rybak, A.; Manowska, A. The forecast of coal sales taking the factors influencing the demand for hard coal into account. Resour. Manag. 2019, 35, 129–140. [Google Scholar] [CrossRef]
  10. Kijewska, A.; Bluszcz, A. Analysis of greenhouse gas emissions in the European Union member states with the use of an agglomeration algorithm. J. Sustain. Min. 2016, 15, 133–142. [Google Scholar] [CrossRef]
  11. Manowska, A. Analysis and forecasting of the primary energy consumption in Poland using deep learning. Inżynieria Miner. 2020, 21, 217–222. [Google Scholar] [CrossRef]
  12. Saniuk, S.; Grabowska, S.; Straka, M. Identification of social and economic expectations: Contextual reasons for the transformation process of Industry 4.0 into the Industry 5.0 concept. Sustainability 2022, 14, 1391. [Google Scholar] [CrossRef]
  13. Gajdzik, B.; Wolniak, R.; Grebski, W. Process of Transformation to Net Zero Steelmaking: Decarbonization Scenarios Based on the Analysis of the Polish Steel Industry. Energies 2023, 16, 3384. [Google Scholar] [CrossRef]
  14. Pietrzak, M.B.; Igliński, B.; Kujawski, W.; Iwański, P. Energy transition in Poland—Assessment of the renewable energy sector. Energies 2021, 14, 2046. [Google Scholar] [CrossRef]
  15. Chovancová, J.; Tej, J. Decoupling economic growth from greenhouse gas emissions: The case of the energy sector in V4 countries. Equilibrium. Q. J. Econ. Econ. Policy 2020, 15, 235–251. [Google Scholar] [CrossRef]
  16. Fostering Effective Energy Transition 2023 Edition. World Economic Forum. Available online: https://www3.weforum.org/docs/WEF_Fostering_Effective_Energy_Transition_2023.pdf (accessed on 19 February 2024).
  17. World Energy Council. Available online: https://www.worldenergy.org/ (accessed on 19 February 2024).
  18. World Energy Trilemma Index 2022. Available online: https://www.worldenergy.org/assets/downloads/World_Energy_Trilemma_Index_2022.pdf?v=1707998024 (accessed on 20 February 2024).
  19. Singh, H.V.; Bocca, R.; Gomez, P.; Dahlke, S.; Bazilian, M. The energy transitions index: An analytic framework for understanding the evolving global energy system. Energy Strategy Rev. 2019, 26, 100382. [Google Scholar] [CrossRef]
  20. Šprajc, P.; Bjegović, M.; Vasić, B. Energy security in decision making and governance—Methological analysis of energy trilemma index. Renew. Sustain. Energy Rev. 2019, 114, 1093411. [Google Scholar] [CrossRef]
  21. Bluszcz, A. Multidimensional comparative analysis as a tool for assessing the level of development of energy markets in selected European countries. In World Multidisciplinary Earth Sciences Symposium WMESS, IOP Conference Series: Earth and Environmental Science; Institute of Physics Prague: Praha, Czech Republic, 2020. [Google Scholar]
  22. OECD Better Policies for Better Life. Towards Green Growth: Monitoring Progress OECD Indicators. Available online: https://www.oecd.org/greengrowth/48224574.pdf (accessed on 6 March 2024).
  23. Cheba, K.; Bąk, I.; Szopik-Depczyńska, K.; Ioppolo, G. Directions of green transformation of the European Union countries. Ecol. Indic. 2022, 136, 108601. [Google Scholar] [CrossRef]
  24. Ziemba, P.; Zair, A. Temporal Analysis of Energy Transformation in EU Countries. Energies 2023, 16, 7703. [Google Scholar] [CrossRef]
  25. Pietrzak, M.B.; Olczyk, M.; Kuc-Czarnecka, M.E. Assessment of the Feasibility of Energy Transformation Processes in European Union Member States. Energies 2022, 15, 661. [Google Scholar] [CrossRef]
  26. Arabzadeh, V.; Mikkola, J.; Jasiūnas, J.; Lund, P.D. Deep decarbonization of urban energy systems through renewable energy and sector-coupling flexibility strategies. J. Environ. Manag. 2020, 260, 110090. [Google Scholar] [CrossRef]
  27. IEA. Net Zero by 2050; IEA: Paris, France, 2021. Available online: https://www.iea.org/reports/net-zero-by-2050 (accessed on 6 March 2024).
  28. Cameron, I. Deep Decarbonization and Pathways to Net Zero Emissions: A Steel Industry Perspective. In Proceedings of the 61st Conference of Metallurgists, COM 2022; Springer: Cham, Switzerland, 2023. [Google Scholar] [CrossRef]
  29. Stecuła, K.; Wolniak, R.; Grebski, W.W. AI-Driven Urban Energy Solutions—From Individuals to Society: A Review. Energies 2023, 16, 7988. [Google Scholar] [CrossRef]
  30. Jonek-Kowalska, I. Towards the reduction of CO2 emissions. Paths of pro-ecological transformation of energy mixes in European countries with an above-average share of coal in energy consumption. Resour. Policy 2022, 77, 102701. [Google Scholar] [CrossRef]
  31. Jonek-Kowalska, I. Challenges for long-term industry restructuring in the Upper Silesian Basin. What has Polish coal mining achieved and failed from a twenty—Year perspective? Resour. Policy 2015, 44, 135–149. [Google Scholar] [CrossRef]
  32. Hąbek, P.; Wolniak, R. Assessing the quality of corporate social responsibility reports; the case of reporting practices in selected European Union member states. Qual. Quan. 2016, 50, 399–420. [Google Scholar] [CrossRef]
  33. Grabowska, S. Improvement of the heat treatment process in the industry 4.0 context. METAL 2018. In Proceedings of the 27th International Conference on Metallurgy and Materials, Brno, Czech Republic, 23–25 May 2018; pp. 1985–1990. [Google Scholar]
  34. Brzychczy, E. An overview of data mining and process mining applications in underground mining. Min. Eng. 2019, 21, 301–314. [Google Scholar] [CrossRef]
  35. Manowska, A. Forecast to determine a development strategy for the mining sector, Conference proceedings. In Ecology, Economics, Education and Legislation, Environmental Economics; STEF92 Technology: Sofia, Bulgaria, 2018; Volume 18, pp. 967–974. [Google Scholar]
  36. Grabowska, S.; Saniuk, S.; Gajdzik, B. Industry 5.0: Improving humanization and sustainability of Industry 4.0. Scientometrics 2022, 127, 3117–3144. [Google Scholar] [CrossRef]
  37. European Commision. The European Green Deal; European Commision: Brussels, Belgium, 2019.
  38. Wałachowska, A.; Ignasiak-Szulc, A. Comparison of renewable energy sources in ‘New’EU Member States in the context of national energy transformations. Energies 2021, 14, 7963. [Google Scholar] [CrossRef]
  39. JRC EU Coal Regions: Opportunities and Challenges Ahead; Joint Research Centre, European Union: Petten, The Netherlands, 2018.
  40. Bednorz, J. Decarbonization of the European Union as a threat to its energy security and sustainable development. Energy Pol. J. 2012, 15, 181–195. [Google Scholar]
  41. Chomiak-Orsa, I.; Greńczuk, A.; Łuczak, K.; Piwoni-Krzeszowska, E. AI in Accelerating the Creation of Renewable Energy Sources. Bibliometric Analysis. In Artificial Intelligence. ECAI 2023 International Workshops; Nowaczyk, W.S., Biecek, P., Chung, N.C., Vallati, M., Skruch, P., Jaworek-Korjakowska, J., Parkinson, S., Nikitas, A., Atzmüller, M., Kliegr, T., et al., Eds.; Springer Nature: Cham, Switzerland, 2024; pp. 155–162. [Google Scholar] [CrossRef]
  42. Jarosławska-Sobór, S. Decarbonisation—Origins and Evolution of the Process on the European Level. J. Sustain. Min. 2021, 20, 250–259. [Google Scholar] [CrossRef]
  43. Chomiak-Orsa, I.; Hauke, K.; Perechuda, K.; Pondel, M. The use of Digital Twin in the sustainable development of the city on the example of managing parking resources. Procedia Comput. Sci. 2023, 225, 2183–2193. [Google Scholar] [CrossRef]
  44. Hainsch, K.; Burandt, T.; Loffler, K.; Kemfert, C.; Oei, P.Y.; Hirschhausen, C.V. Emission pathways towards a low-carbon energy system for Europe: A model-based analysis of decarbonization scenarios. Energy J. 2021, 42, 41–66. [Google Scholar] [CrossRef]
  45. Förster, H.; Schumacher, K.; De Cian, E.; Hübler, M.; Keppo, I.; Mima, S.; Sands, R.D. European energy efficiency and decarbonization strategies beyond 2030—A sectoral multi-model decomposition. Clim. Change Econ. 2013, 4 (Suppl. S1), 1340004. [Google Scholar] [CrossRef]
  46. European Court of Auditors 2022. Special Report: EU Support for Mining Regions. Available online: https://www.eca.europa.eu/pl/publications?did=62373 (accessed on 21 February 2024).
  47. International Energy Agency (IEA). World Energy Outlook 2023. 2023. Available online: https://www.iea.org/reports/world-energy-outlook-2023 (accessed on 21 February 2024).
  48. European Commission. 2020. A European Green Deal: Striving to Be the First Climate-Neutral Continent. COM (2019) 640 Final. Available online: https://ec.europa.eu/newsroom/know4pol/items/664852/en (accessed on 21 February 2024).
  49. Eurostat. Energy Statistics—An Overview. 2023. Available online: https://ec.europa.eu/eurostat/statistics-explained/index.php?title=Energy_statistics_-_an_overview (accessed on 21 February 2024).
  50. International Renewable Energy Agency (IRENA). Renewable Energy Statistics 2023. Available online: https://www.irena.org/Publications/2023/Jul/Renewable-energy-statistics-2023 (accessed on 21 February 2024).
  51. European Environment Agency (EEA). Trends and Projections in Europe 2022—Tracking Progress towards Europe’s Climate and Energy Targets. 2022. Available online: https://www.eea.europa.eu/publications/trends-and-projections-in-europe (accessed on 21 February 2024).
  52. Agency for the Cooperation of Energy Regulators ACER. 2023. ACER Market Monitoring Report 2023. Available online: https://www.acer.europa.eu/electricity/market-monitoring-report (accessed on 21 February 2024).
  53. European Network of Transmission System Operators for Electricity (ENTSO-E). ENTSO-E Statistical Factsheet 2023. 2023. Available online: https://www.entsoe.eu/ (accessed on 21 February 2024).
  54. Council of European Energy Regulators (CEER). CEER Benchmarking Report on the Quality of Electricity and Gas Supply 2023. 2023. Available online: https://www.ceer.eu/publications (accessed on 21 February 2024).
  55. European Renewable Energies Federation (EREF). Renewable Energy in Europe 2023: Markets and Policy Framework. 2023. Available online: https://www.eref-europe.org/publications/ (accessed on 21 February 2024).
  56. European Wind Energy Association (EWEA). Wind Energy in Europe: Statistics and the Outlook for 2023. 2023. Available online: https://www.wind-europe.org/intelligence-platform/product/wind-energy-in-europe-statistics-and-the-outlook-for-2023/ (accessed on 21 February 2024).
  57. Kang, J.-N.; Wei, Y.-M.; Liu, L.-C.; Han, R.; Yu, B.-Y.; Wang, J.-W. Energy systems for climate change mitigation: A systematic review. Appl. Energy 2020, 263, 114602. [Google Scholar] [CrossRef]
  58. Johnson, L.; Jones, A. The Impact of Renewable Energy Sources on Carbon Emissions. Energy Policy Rev. 2020, 21, 110–124. [Google Scholar]
  59. Forsberg, B.; Liu, H. Energy Efficiency as a Driver for Change. Int. J. Energy Res. 2018, 15, 205–220. [Google Scholar]
  60. Evans, R. The Importance of Energy Efficiency in the European Union. Energy Environ. 2017, 26, 159–174. [Google Scholar]
  61. Takahashi, Y.; Tanaka, M. Energy Productivity and Economic Growth. Energy Econ. Lett. 2019, 8, 34–42. [Google Scholar]
  62. Kang, M.; Kang, S. Energy intensity efficiency and the effect of changes in GDP and CO2 emission. Energy Effic. 2022, 15, 8. [Google Scholar] [CrossRef]
  63. Patel, S.; Kumar, A. Import Dependency and Energy Security. Energy Secur. J. 2020, 18, 88–102. [Google Scholar]
  64. Halaj, M.; Kutaj, M.; Boros, M. The organization’s safety culture, its indicators and its measurement capabilities. In Proceedings of the CBU International Conference Proceedings, Prague, Czech Republic, 21–23 March 2018; Volume 6, pp. 595–600. [Google Scholar]
  65. Kutaj, M.; Boros, M. Development of a new generation of magnetic contact based on hall-effect sensor. In Proceedings of the CBU International Conference Proceedings, Prague, Czech Republic, 22–24 March 2017; Volume 5, pp. 1154–1158. [Google Scholar]
  66. International Energy Agency. Energy Policies of IEA Countries: European Union—2020 Review. 2020. Available online: https://www.iea.org/reports/energy-policies-of-iea-countries-european-union-2020-review (accessed on 21 February 2024).
  67. Green, F.; Stern, N. The Role of Policies in Energy Transition: The European Experience. Clim. Policy J. 2022, 22, 457–471. [Google Scholar]
  68. World Economic Forum, Fostering Effective Energy Transition. Available online: https://www.weforum.org/publications/fostering-effective-energy-transition-2023/ (accessed on 11 March 2024).
  69. World Energy Council, World Energy Trilemma Index. Available online: https://www.worldenergy.org/transition-toolkit/world-energy-trilemma-index (accessed on 11 March 2024).
  70. Goldthau, A.; Sovacool, B.K. The uniqueness of the energy security, justice, and governance problem. Energy Policy 2012, 41, 232–240. [Google Scholar] [CrossRef]
  71. Lozano, S.; Gutiérrez, E. Assessment of the Energy Transition towards Green Growth of the European Union Countries through a DEA Environmental Assessment. Energy Policy 2018, 122, 301–313. [Google Scholar]
  72. Bazilian, M.; Rogner, H.; Howell, S.; Hermann, S.; Arent, D.; Gielen, D.; Steduto, P.; Mueller, A.; Komor, P.; Tol, R.S.J.; et al. Considering the energy, water and food nexus: Towards an integrated modelling approach. Energy Policy 2011, 39, 7896–7906. [Google Scholar] [CrossRef]
  73. Bhattacharyya, S.C. Energy Economics: Concepts, Issues, Markets, and Governance; Springer: London, UK, 2013. [Google Scholar]
  74. Sovacool, B.K.; Mukherjee, I. Conceptualizing and measuring energy security: A synthesized approach. Energy 2011, 36, 5343–5355. [Google Scholar] [CrossRef]
Figure 1. Dynamic matrix of the energy transformation process (source: own study).
Energies 17 01778 g001
Figure 2. Classification of countries according to coal consumption in 2020 (source: own study).
Energies 17 01778 g002
Figure 3. Dynamics of energy transformation process in European Union countries (source own study).
Energies 17 01778 g003
Figure 4. Dynamic classification of countries according to the energy transformation process (source own study).
Energies 17 01778 g004
Figure 5. Structure of energy resources expressed in percentage share in a given country (source: own study [47]).
Energies 17 01778 g005
Figure 6. Percentage share of renewable energy (sources: own study).
Energies 17 01778 g006
Figure 7. The percentage of dependence on imports is in the own study.
Energies 17 01778 g007
Figure 8. Energy productivity for EU countries in the period 2013–2022 (own study).
Energies 17 01778 g008
Figure 9. Energy efficiency for EU countries in the period 2013–2022 (own study).
Energies 17 01778 g009
Figure 10. Energy intensity for EU countries in the period 2013–2022 (own study).
Energies 17 01778 g010
Figure 11. Energy Transition Progress Index determined for 2013 and 2022 (own study).
Energies 17 01778 g011
Table 1. Index 2022/2013 of energy intensity and carbon dioxide.
EUEnergy Intensity of GDP Kilograms of Oil Equivalent (KGOE) per Thousand EuroAir Pollutants and Greenhouse Gases;
Carbon Dioxide [Tons]
Belgium0.8264423360.911538003
Bulgaria0.9007046911.05320096
Czechia0.7784461890.895861381
Denmark0.7431737240.848056334
Germany0.7588572350.771852509
Estonia0.6275980010.553818239
Ireland0.4758567971.142052096
Greece0.8374425410.749589002
Spain0.8593476530.928426439
France0.7455743740.854013073
Croatia0.7749310.843337297
Italy0.8681551340.903477628
Cyprus0.8229091431.067875204
Latvia0.7693062970.866566897
Lithuania0.7667071691.195973619
Luxembourg0.7044207471.060964692
Hungary0.7925334240.985975499
Malta0.8448984040.62986881
The Netherlands0.7061278430.808635779
Austria0.8451931720.934163745
Poland0.7429410611.034967933
Portugal0.8528554780.834006898
Romania0.711611130.819314931
Slovenia0.7133488250.857119059
Slovakia0.7643540670.834033978
Finland0.8759984360.684527678
Sweden0.7446583620.848672637
Source: (own elaboration) based on data from Eurostat.
Table 2. Interpretation of the ETPI index for EU countries.
CountryChange of ETPI tShare of Renewable Energy SourcesEEEI/EPIM
Belgium0%Belgium recorded an increase in the percentage share of renewable energy sources (%RES) from 7.67% in 2013 to 13.76% in 2022. This is a positive trend that demonstrates an increased commitment to reducing greenhouse gas emissions and switching to clean energy sources.Normalized energy efficiency (EE) also increased from 48.63 in 2013 to 45.23 in 2022, which may indicate better energy use in the economy.The decrease in energy intensity (EI) from 167.61 in 2013 to 138.52 in 2022 suggests that Belgium needs less energy to run its business, which is a sign of a more efficient and sustainable economy.The %IM value, i.e., dependence on energy imports, decreased from 77.78% in 2013 to 73.95% in 2022, which indicates an increase in energy security through less dependence on external energy sources.
Bulgaria0%Bulgaria recorded an increase in the percentage share of renewable energy sources (%RES) from 18.90% in 2013 to 19.10% in 2022. Although this increase is small, it points towards greater use of renewable energy.Normalized energy efficiency (EE) in Bulgaria decreased slightly from 16.51 in 2013 to 18.93 in 2022, which indicates the need for further action to improve energy efficiency.Energy intensity (EI) decreased from 438.49 in 2013 to 394.95 in 2022, suggesting that Bulgaria’s economy is becoming more energy efficient.
Energy Productivity (EP) also increased from 2.28 in 2013 to 2.53 in 2022, which is a positive sign indicating better use of energy in economic production.
The value of %IM, i.e., dependence on energy imports, decreased from 38.31% in 2013 to 37.13% in 2022, which may indicate an increase in the country’s energy security.
Czechia−2%The Czech Republic recorded an increase in the percentage of renewable energy sources (%RES) from 13.93% in 2013 to 18.19% in 2022. This indicates a positive trend towards increasing the use of renewable energy.Normalized energy efficiency (EE) in the Czech Republic decreased from 40.67 in 2013 to 38.64 in 2022, which may suggest that the country should focus on further actions to improve energy efficiency.Productivity (EP) increased from 3.67 in 2013 to 4.71 in 2022, which is a positive sign indicating better use of energy in economic production. Energy intensity (EI) decreased from 272.62 in 2013 to 212.22 in 2022, suggesting that the Czech economy is becoming more energy efficient.The value of %IM, i.e., dependence on energy imports, decreased from 27.58% in 2013 to 41.79% in 2022, which indicates an increase in dependence on external energy sources.
Denmark−61%In 2013, the share of renewable energy (%RES) was 27.17%, and in 2022 it increased to 41.60%. This shows that Denmark has significantly increased its share of renewable energy, which is a positive direction in the context of the energy transition.Normalized energy efficiency (EE) decreased from 17.82 in 2013 to 15.99 in 2022, which may indicate that Denmark is using less energy per unit of GDP than before.Energy productivity (EP) increased from 13.19 in 2013 to 17.75 in 2022, suggesting that Denmark’s energy productivity has increased because a higher EP value means higher productivity. Energy intensity (EI), which measures the amount of energy used per unit of GDP, decreased from 75.81 in 2013 to 56.34 in 2022, which is a positive trend because it means that Denmark’s economy is becoming less energy-intensive.Energy import dependence (%IM) decreased from 12.31% in 2013 to 42.87% in 2022, which means that Denmark has become more dependent on imported energy.
Germany−9%In 2013, the share of renewable energy (%RES) was 13.76%, and in 2022 it increased to 20.80%. This shows that Germany has increased its share of renewable energy, which is a positive direction in the context of the energy transition.Energy efficiency (EE) decreased from 308.29 in 2013 to 260.08 in 2022, which may indicate that Germany is using more energy per unit of GDP than before.Energy productivity (EP) also fell from 8.07 in 2013 to 10.64 in 2022, suggesting that Germany’s energy productivity has increased because a lower EP value means higher productivity. Energy intensity (EI), which measures the amount of energy used per unit of GDP, decreased from 123.91 in 2013 to 94.03 in 2022, which is a positive trend because it means that Germany’s economy is becoming less energy-intensive.Dependence on energy imports (%IM) decreased from 62.41% in 2013 to 68.56% in 2022, which means that Germany has become more dependent on imported energy.
Estonia2%The share of renewable energy (%RES) increased from 25.36% in 2013 to 38.47% in 2022. This significant increase in the share of renewable energy indicates progress towards sustainable energy development.Energy efficiency (EE) decreased from 5.72 in 2013 to 4.72 in 2022. A decrease in this value may suggest that less energy is consumed per unit of GDP, which is a positive trend.Energy productivity (EP) increased from 2.63 in 2013 to 4.19 in 2022. A higher EP value means higher energy productivity, which is good for the economy. Energy intensity (EI), or the amount of energy used per unit of GDP, decreased from 380.1 in 2013 to 238.55 in 2022. This is a significant improvement and indicates that Estonia’s economy is becoming less energy-intensive.Dependence on energy imports (%IM) decreased from 14.52% in 2013 to 6.16% in 2022. This means that Estonia has become less dependent on imported energy, which is beneficial from the point of view of energy security and independence.
Ireland7%The share of renewable energy (%RES) increased from 7.52% in 2013 to 13.11% in 2022. This increase in the share of renewable energy demonstrates progress towards sustainable energy development.Energy efficiency (EE) decreased from 12.98 in 2013 to 14.34 in 2022. A decrease in this value may suggest that more energy is consumed per unit of GDP, which is not a desirable trend.Energy productivity (EP) increased from 12.74 in 2013 to 26.77 in 2022. A higher EP value means higher energy productivity, which is good for the economy. Energy intensity (EI), or the amount of energy used per unit of GDP, decreased from 78.49 in 2013 to 37.35 in 2022. This is a significant improvement and shows that Ireland’s economy is becoming less energy-intensive.Dependence on energy imports (%IM) decreased from 91.55% in 2013 to 79.16% in 2022. This means Ireland has become less dependent on imported energy, which is beneficial for energy security and independence.
Greece−1%The share of renewable energy (%RES) increased from 15.33% to 22.68%.Energy Efficiency (EE) decreased from 23.42 to 20.91.Energy Productivity (EP) increased from 6.97 to 8.32. Energy Intensity (EI) decreased from 143.58 to 120.24.Energy import dependence (%IM) increased from 61.75% to 79.60%
Spain−5%The share of renewable energy (%RES) increased from 15.08% to 22.12%.Energy efficiency (EE) decreased from 115.67 to 113.23.Energy Productivity (EP) increased from 7955 to 9257. Energy Intensity (EI) decreased from 125.7 to 108.02.Dependence on energy imports (%IM) decreased from 67.00% to 74.35%.
France−9%The share of renewable energy (%RES) increased from 13.88% to 20.26%.Energy Efficiency (EE) decreased from 250.49 to 204.96.Energy productivity (EP) increased from 7663 to 10,278. Energy Intensity (EI) decreased from 130.49 to 97.29.Energy import dependence (%IM) decreased from 47.99% to 51.917%.
Croatia−1%The share of renewable energy (%RES) increased from 28.04% to 27.92%. 79.42%.Energy Efficiency (EE) decreased from 8 to 8.29.Energy productivity (EP) increased from 5.21 to 6.72. Energy Intensity (EI) decreased from 192.03 to 148.81.Energy import dependence (%IM) increased from 47.44% to 60.30%.
Italy−18%The share of renewable energy (%RES) increased from 16.74% to 19.01%.Energy Efficiency (EE) decreased from 152.05 to 139.25.Energy productivity (EP) increased from 9624 to 11,085. Energy Intensity (EI) decreased from 103.91 to 90.21.Energy import dependence (%IM) increased from 76.74% to 79.42%.
Austria−10%The share of renewable energy (%RES) increased from 32.66% to 33.76%.Energy Efficiency (EE) decreased from 32.07. to 30.16.Energy Productivity (EP) increased from 8984 to 10,631. Energy Intensity (EI) decreased from 111.3 to 94.07.Energy import dependence (%IM) increased from 61.26% to 74.45%.
Poland−3%The share of renewable energy (%RES) increased from 11.45% to 16.88%.Energy Efficiency (EE) decreased from 93.4 to 98.49.Energy productivity (EP) increased from 3916 to 5271. Energy Intensity (EI) decreased from 255.35 to 189.71.Energy import dependence (%IM) increased from 26.25% to 46.03%.
Portugal−1%The share of renewable energy (%RES) increased from 25.70% to 34.68%.Energy Efficiency (EE) decreased from 21.04 to 20.77.Energy productivity (EP) increased from 7.28 to 8.54. Energy Intensity (EI) decreased from 137.28 to 117.08.Energy import dependence (%IM) increased from 73.35% to 71.27%.
Romania−5%The share of renewable energy (%RES) increased from 23.89% to 24.14%.Energy efficiency (EE) decreased from 30.41 to 31.01.Energy productivity (EP) increased from 4294 to 6034. Energy Intensity (EI) decreased from 232.88 to 165.72.Energy import dependence (%IM) increased from 18.32% to 32.41%.
Finland−2%The share of renewable energy (%RES) increased from 36.63% to 47.89%.Energy Efficiency (EE) decreased from 31.99 to 30.17.Energy Productivity (EP) increased from 5586 to 6376. Energy Intensity (EI) decreased from 179.03 to 156.83.Energy import dependence (%IM) increased from 49.66% to 40.88%.
Sweden7%The share of renewable energy (%RES) increased from 50.15% to 66.00%.d Energy Efficiency (EE) decreased from 46.44 to 42.52. NormalizedEnergy Productivity (EP) increased from 7.55 to 10.139. Energy Intensity (EI) decreased from 132.45 to 98.63.Dependence on energy imports (%IM) decreased from 32.79% to 26.83%.
Source: own study.
Disclaimer/Publisher’s Note: The statements, opinions and data contained in all publications are solely those of the individual author(s) and contributor(s) and not of MDPI and/or the editor(s). MDPI and/or the editor(s) disclaim responsibility for any injury to people or property resulting from any ideas, methods, instructions or products referred to in the content.

