Article

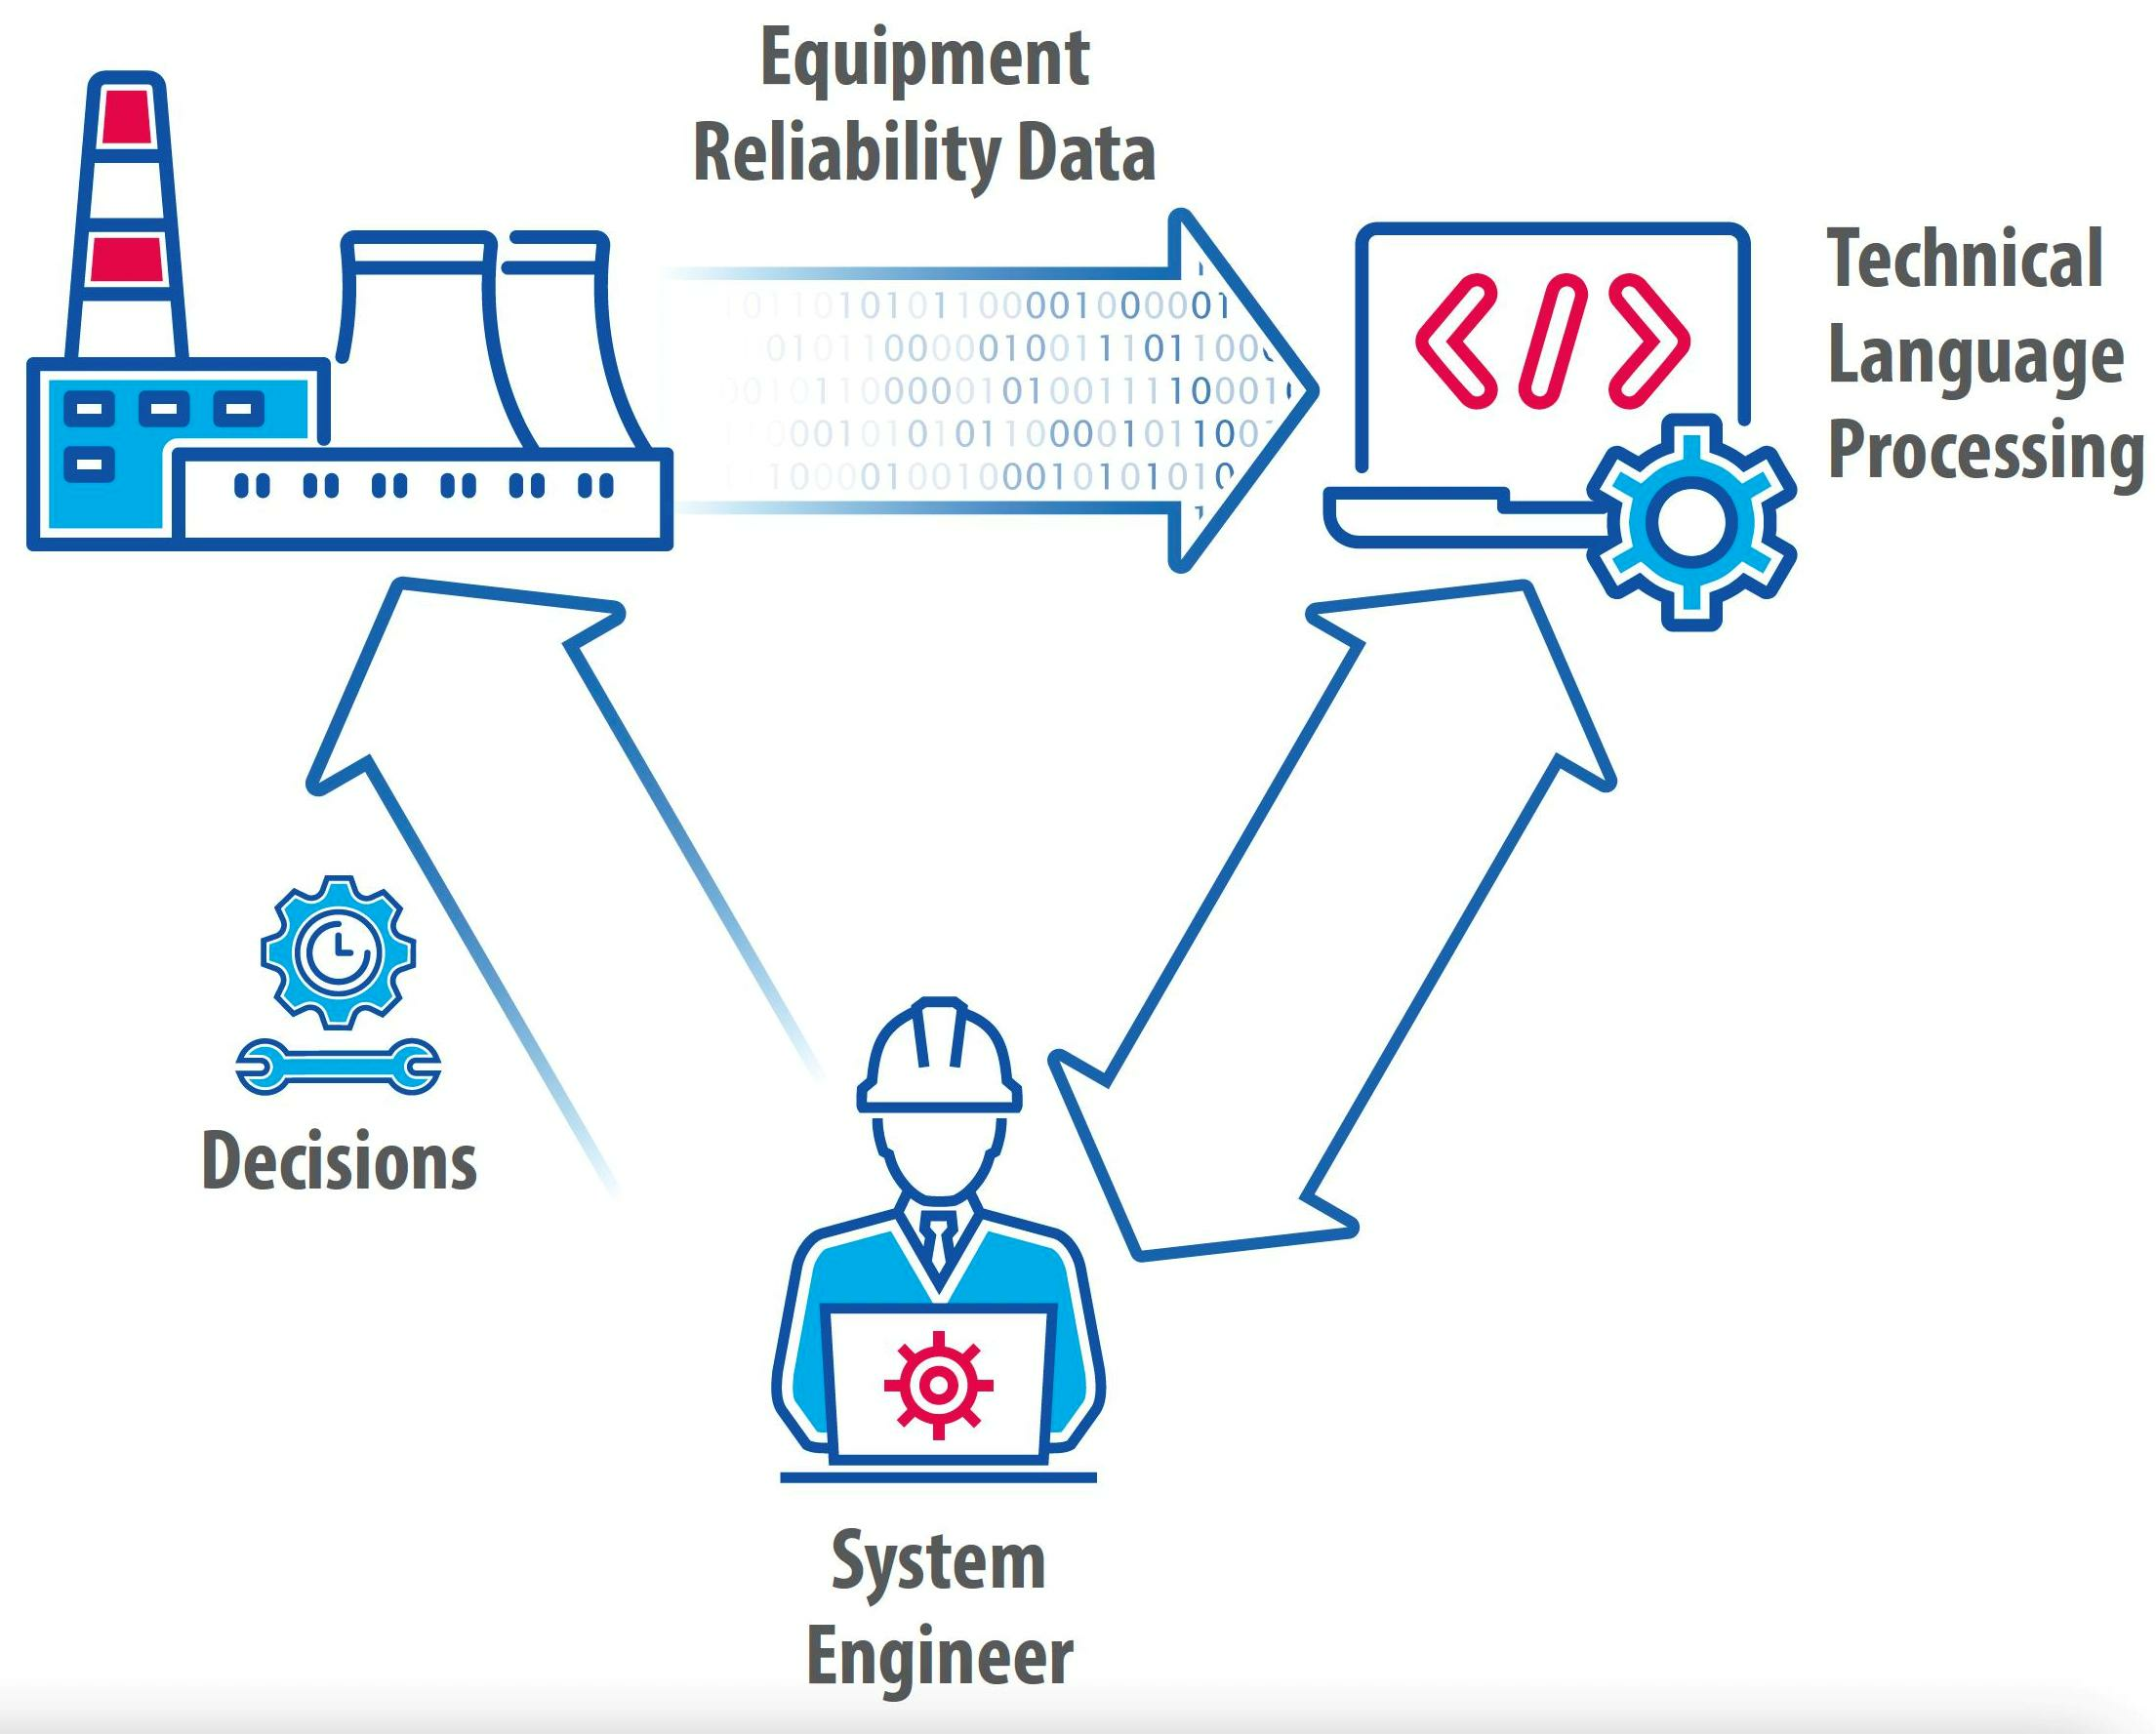
Technical Language Processing of Nuclear Power Plants Equipment Reliability Data

Idaho National Laboratory, 1955 Fremont Ave., Idaho Falls, ID 83415, USA
*
Author to whom correspondence should be addressed.
Energies 2024, 17(7), 1785; https://doi.org/10.3390/en17071785
Submission received: 1 February 2024 / Revised: 19 March 2024 / Accepted: 1 April 2024 / Published: 8 April 2024

Abstract

:
Operating nuclear power plants (NPPs) generate and collect large amounts of equipment reliability (ER) element data that contain information about the status of components, assets, and systems. Some of this information is in textual form where the occurrence of abnormal events or maintenance activities are described. Analyses of NPP textual data via natural language processing (NLP) methods have expanded in the last decade, and only recently the true potential of such analyses has emerged. So far, applications of NLP methods have been mostly limited to classification and prediction in order to identify the nature of the given textual element (e.g., safety or non-safety relevant). In this paper, we target a more complex problem: the automatic generation of knowledge based on a textual element in order to assist system engineers in assessing an asset’s historical health performance. The goal is to assist system engineers in the identification of anomalous behaviors, cause–effect relations between events, and their potential consequences, and to support decision-making such as the planning and scheduling of maintenance activities. “Knowledge extraction” is a very broad concept whose definition may vary depending on the application context. In our particular context, it refers to the process of examining an ER textual element to identify the systems or assets it mentions and the type of event it describes (e.g., component failure or maintenance activity). In addition, we wish to identify details such as measured quantities and temporal or cause–effect relations between events. This paper describes how ER textual data elements are first preprocessed to handle typos, acronyms, and abbreviations, then machine learning (ML) and rule-based algorithms are employed to identify physical entities (e.g., systems, assets, and components) and specific phenomena (e.g., failure or degradation). A few applications relevant from an NPP ER point of view are presented as well.

Graphical Abstract

1. Introduction

To reduce operation and maintenance costs [1,2], existing nuclear power plants (NPPs) are moving from corrective and periodic maintenance to predictive maintenance strategies [3]. This transition is designed so that maintenance occurs only when a component requires it (e.g., before its imminent failure). This guarantees that component availability is maximized and that maintenance costs are minimized. However, these benefits require changes in the data that need to be retrieved and the type of decision processes to be employed. Advanced monitoring and data analysis technologies [4,5,6,7] are essential for supporting predictive strategies, as they can provide precise information about the health of a system, structure, or component (SSC), track its degradation trends, and estimate its expected time of failure. With such information, maintenance operations can be performed on a component right before its expected failure time [8].
This dynamic context of operations and maintenance activities (i.e., predictive) requires new methods of processing and analyzing equipment reliability (ER) data [7,8]. One relevant issue is that ER data can be contained in heterogenous data formats: textual, numeric, image, etc. An analysis of numeric ER data has been addressed in many previous works [5,6,7,8,9] and applied to many operational directions including anomaly detection, diagnosis, and prognosis. Here we are targeting the analysis of textual ER data. The information contained in NPP textual ER data can either describe the occurrence of abnormal events (e.g., system, structure and components [SSC] failure or observed degradation)—with such documents being referred to here as issue reports (IRs)—or the conduct of maintenance or surveillance activities (referred to here as work orders [WOs]). Only recently has the analysis of textual data been investigated via machine learning (ML) methods [10,11,12,13] designed to assess the nature of the data (e.g., safety or non-safety related) by employing supervised or semi-supervised ML models [14,15].
This paper primarily focuses on applying natural language processing (NLP) methods [16,17,18,19] for ER data analysis in order to support robust decision-making in a plant operations context. In more detail, our methods are designed to assist system engineers in the identification of anomalous behaviors that might occur in a system (e.g., the periodic failure of a pump control board), the possible cause–effect relations between events (e.g., a lack of adequate flow rate generated by the pump prior to the failure of its control board), and their potential consequences (e.g., pump taken off line which causes power plant derate, and a consequent loss of production). The same methods are also designed to support decision-making such as the scheduling of the appropriate maintenance activities (e.g., a replacement of the pump control board which requires a specific procurement order) and planning based on past operational experience (e.g., identify average time to replace pump control board). In addition, note that trending at the plant level of events of a similar nature (which requires methods to parse a large amount of data automatically rather than relying on manual search) provides insights on key performance indicators of the plant itself, which are under regulatory oversight. All of these tasks are currently performed manually with all limitations that such processes entail (in terms of resources required and efficiency).
Here, the objective in analyzing textual ER data is to move away from supervised/semi-supervised ML model analysis tools [10,11,12,13] and to instead automate the extraction of quantitative knowledge from textual data in order to assist system engineers in assessing SSC health trends and identify SSC anomalous behaviors. Knowledge extraction [20,21,22,23,24] is a very broad concept whose definition may vary depending on the application context. When applied to NPP ER textual data (i.e., IRs or WOs), the knowledge extraction approach described herein is designed to extract its syntactic and semantic elements. In more detail, it is designed to identify elements of interest (e.g., types of phenomena described and types of SSCs affected), extract temporal and location attributes, understand the nature of the reported event, and extract causal or temporal relationships between events. This type of NLP analysis has especially been applied in the medical field as shown in [25,26]. However, recent interest has also emerged in other fields including energetic [27], chemical [28,29], bioinformatics [30,31], material science [32], arts and humanities [33], and patent [34] analysis.
Our approach relies on both ML- and rule-based NLP methods designed to identify specific keywords, sentence architecture relations, and structures within each sentence and paragraph. The choice of a rule-based system rather than relying on language models (as, for example, shown in [35]) was dictated by the limitations of the fine-tuning of such models (e.g., the availability of training data) for a very specific field of application (which can also be NPP dependent) and also by security reasons (e.g., sharing data on third-party servers). Applying such analyses to NPP ER textual datasets makes it possible to track the historical health performance of NPP assets and then use the observed health trends to adjust the schedule of future surveillance and maintenance operations [7]. Such a process can have a major impact on the reduction of NPP operational costs. The interest in NLP knowledge extraction methods applied to NPP ER textual data has started only recently. In particular, references [36,37] provide an overview of the advantages that can be reached using technical language processing (TLP) as an iterative human-in-the-loop approach to analyze NPP textual data to optimize plant operation and asset management. As a result of these considerations, reference [38] provides, to our knowledge, the first attempt to analyze WO textual data using an ontology-based approach. This paper can be seen as an extension of [38] where it also targets the analysis of IRs and other plant textual data (e.g., plant outage data elements). Such an extension does not rely on an ontology as indicated in [38] because of the challenges in constructing a general-purpose ontology that would encompass all possible use cases in an NPP context. Our approach follows some of the elements shown in [39,40,41], especially in terms or relation extraction and it adapts them into an NPP context.
A relevant observation here is that most of the time, NPP ER textual elements are composed by short (typically about 6–10 words long) sentences that are not properly structured from a grammatical point of view. This poses a challenge when applying the methods described in [21,23,24]. This paper is divided into two parts: Section 2 gives details on each NLP element that constitutes our knowledge extraction workflow, and Section 3 provides examples of applying the developed methods in order to support decision-making in an NPP operational context.

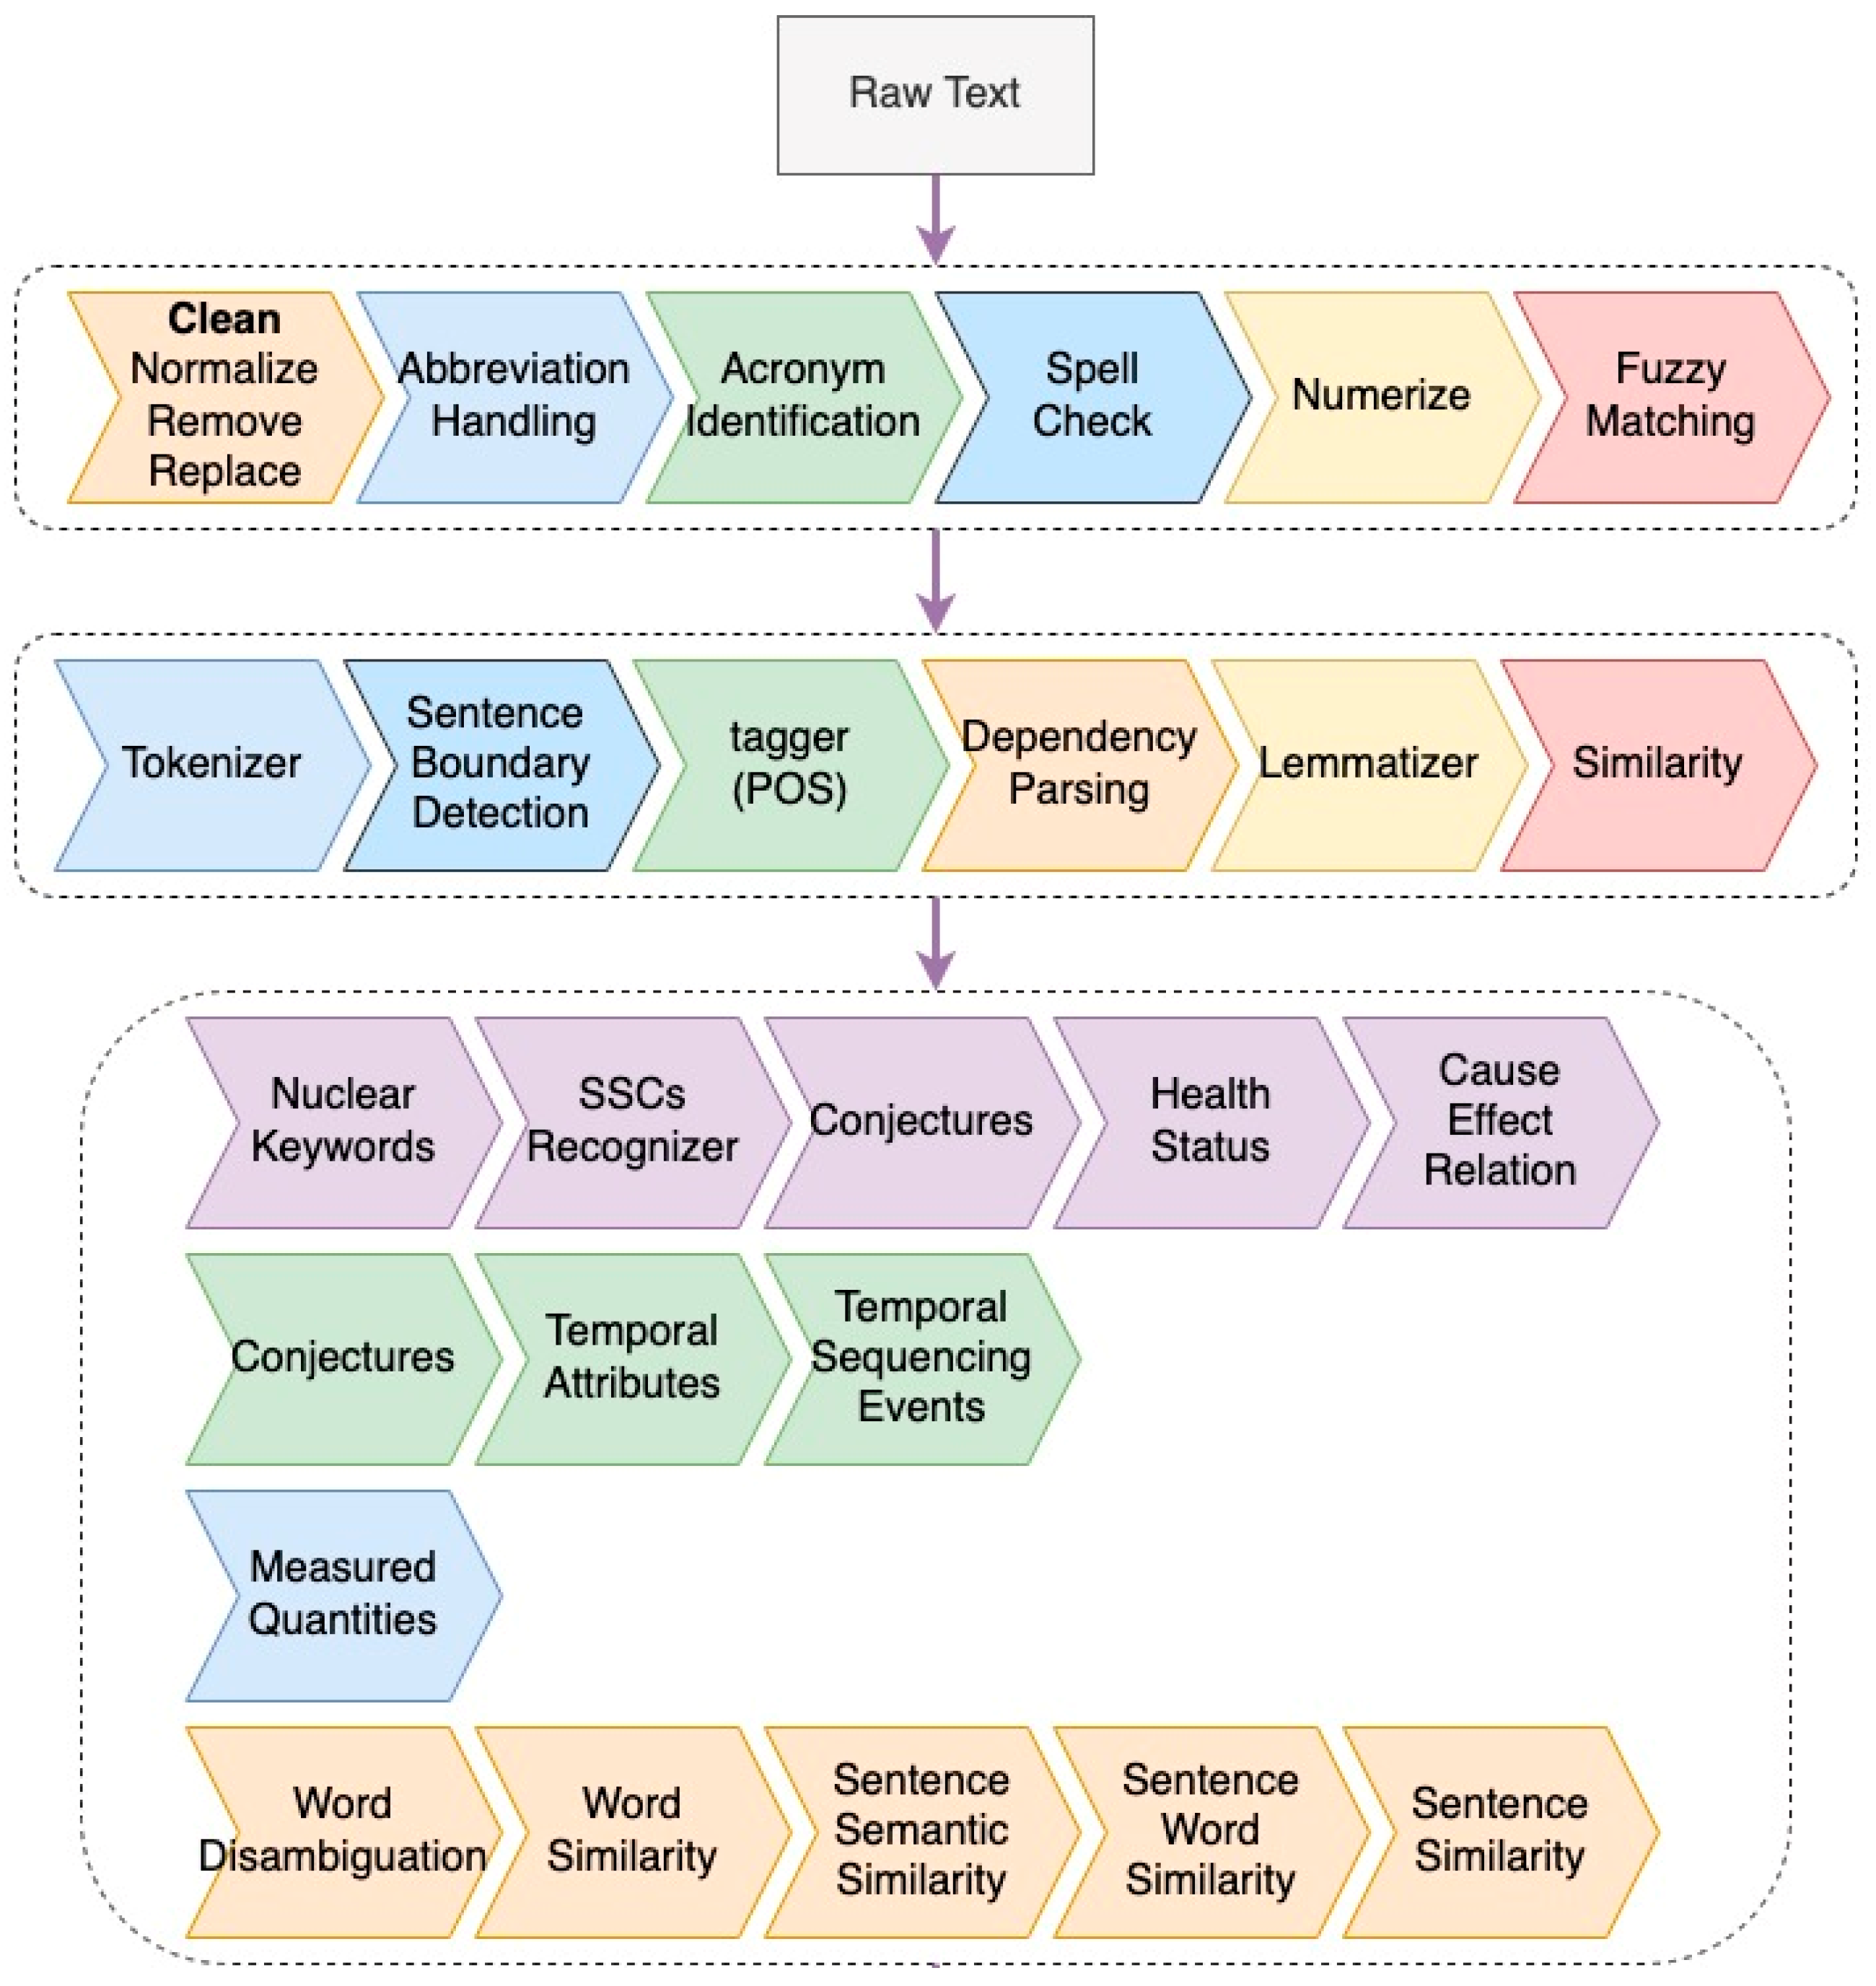
2. Knowledge Extraction Methods

Figure 1 provides an overview of the NLP methods that together constitute the knowledge extraction workflow. These methods are grouped into the following three main categories:
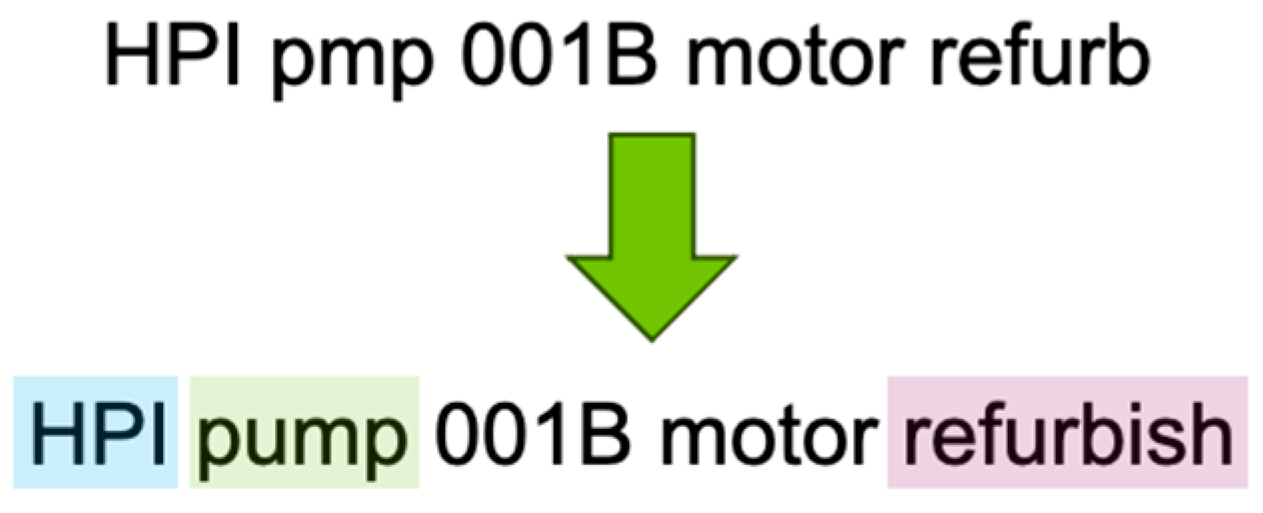
  • Text preprocessing: The provided raw text is cleaned and processed in order to identify specific nuclear entities and acronyms (e.g., HPI in reference to a high-pressure injection system), and to identify and correct typos (i.e., through a spell check method) and abbreviations (e.g., “pmp” meaning “pump”).
  • Syntactic analysis: The goal of this analysis is to identify the relationship between words contained within a sentence, the focus being on understanding the logical meaning of sentences or parts of sentences (e.g., subjects, predicates, and complements).
  • Semantic analysis: We rely on the results of this analysis to identify the nature of the event(s) described in the text, along with their possible relationships (temporal or causal).
In the following sections, we provide details on each different NLP method. The methods presented here have been coded in a Python-based coding environment and they leverage a few openly available NLP libraries: SpaCy [42], PySBD [43], and nltk [44]. The choice of the coding environment was also suggested based on current configurations of operating U.S. nuclear plant equipment reliability software suites which store IRs and WOs and allow externally developed data analytics methods to be easily interfaced.

2.1. Spellcheck, Acronym, and Abbreviation Handling

NPP IRs and WOs are often comprised of short sentences that often contain abbreviations. The presence of abbreviations negatively impacts our ability to extract knowledge from such texts. Thus, abbreviations must be identified and then replaced with the complete form of the words. The starting point is a library of word abbreviations collected from documents available online. This library is basically a dictionary that contains the corresponding set of words for each identified abbreviation. A challenge here is that a single abbreviation may have multiple words associated with it. Similarly, a word may be abbreviated in multiple different ways.
In each sentence, abbreviations are handled by first identifying any misspelled words. Each misspelled word is then searched for in the developed library. If an abbreviation in the library matches the misspelled word, the abbreviation is replaced by the complete form of the word. If no abbreviation is found, we proceed by searching for the closest one by employing the Levenshtein distance as a metric. If multiple words match the obtained abbreviation, the one that best fits the context of the sentence is selected.
Acronyms represent another class of textual elements often seen in ER textual data, and typically refer to specific NPP SSCs. They are handled similarly to abbreviations, with a library of acronyms having been compiled based on publicly available U.S. Nuclear Regulatory Commission (NRC) and Electric Power Research Institute (EPRI) documents.
Once the abbreviations and acronyms have been handled, the remaining misspelled words are run through our spell-checking methods for a final round of corrections. Figure 2 shows an example of spell checking and acronym/abbreviation handling being used to clean up specific words in the raw text.
Figure 1. Graphical illustration of the NLP elements that comprise the knowledge extraction workflow.
Energies 17 01785 g001

2.2. Sentence Segmentation
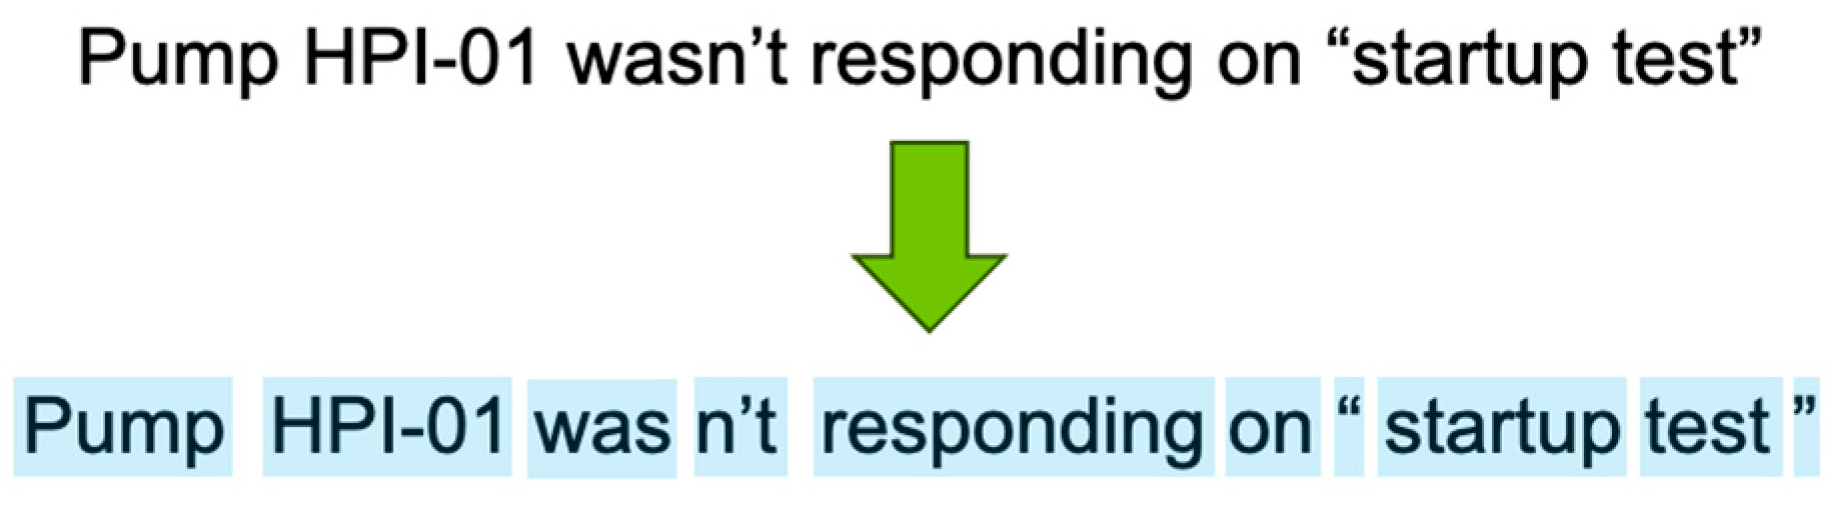
The next important step is to determine the sentence boundaries; that is, segment the text into a list of sentences. This is a key underlying task for NLP processes. For the present work, we employed PySBD—a rule-based sentence boundary disambiguation Python package—to detect the sentence boundaries. We developed a custom method that uses PySBD and SpaCy to split raw text into a list of sentences. In general, there are three different approaches to segmenting sentences [16,17]: (1) rule-based, requiring a list of hand-crafted rules; (2) supervised ML, requiring training datasets with labels and annotations; and (3) unsupervised ML, requiring distributional statistics derived from raw text. We chose the rule-based approach since the errors are interpretable and the rules can be adjusted incrementally. Moreover, the resulting performance can exceed that of the ML models. For example, PySBD passes 97.93% of the Golden Rule Set exemplars (i.e., a language-specific set of sentence boundary exemplars) for English—a 25% improvement over the next-best open-source Python 3.9 tool (43).

2.3. Tokenization

The next step in textual processing is to tokenize the text [16,17], a process basically designed to segment the text into a list of words or punctuations (see Figure 3). First, the raw text is split based on the whitespace characters. The tokenizer then processes the text from left to right. On each substring, it performs two checks:
(1)
Does the substring match a tokenizer exception rule? For example, “don’t” does not contain whitespace but should be split into two tokens, “do” and “n’t”.
(2)
Can a prefix, suffix, or infix be split off (e.g., punctuation such as commas, periods, hyphens, or quotation marks)?
If a match is found, the rule is applied and the tokenizer continues its loop, starting with the newly split substrings. In this manner, the tokenizer can split complex, nested tokens such as combinations of abbreviations and multiple punctuation marks.

2.4. Part of Speech

After the correct segmentation of sentences, we rely on the SpaCy tagger to parse each sentence and tag each token therein. The “TAG” and “POS” (part of speech) attributes are generated for each token (see Section 2.3). “POS” is the simple universal POS tag (https://universaldependencies.org/u/pos/ [accessed on 4 February 2024]) that does not include information on any morphological features and only covers the word type (e.g., adjectives, adverbs, verbs, and nouns). The morphology is the process by which a root form of a word is modified by adding prefixes or suffixes that specify its grammatical function but do not change its POS. These morphological features are added to each token after the POS process, and can be accessed through the token’s “morph” attribute.
The “TAG” attribute expresses both the POS and some amount of morphological information. For example, the POS “VERB” tag is expanded into six “TAG” tags: “VB” (verb, base form), “VBD” (verb, past tense), “VBG” (verb, gerund, or present participle), “VBN” (verb, past participle), “VBP” (verb, non-third-person singular present), and “VBP” (verb, third-person singular present). In this work, we heavily relied on these POS and TAG tags to determine the nature of a given IR or WO (see Section 2.14).

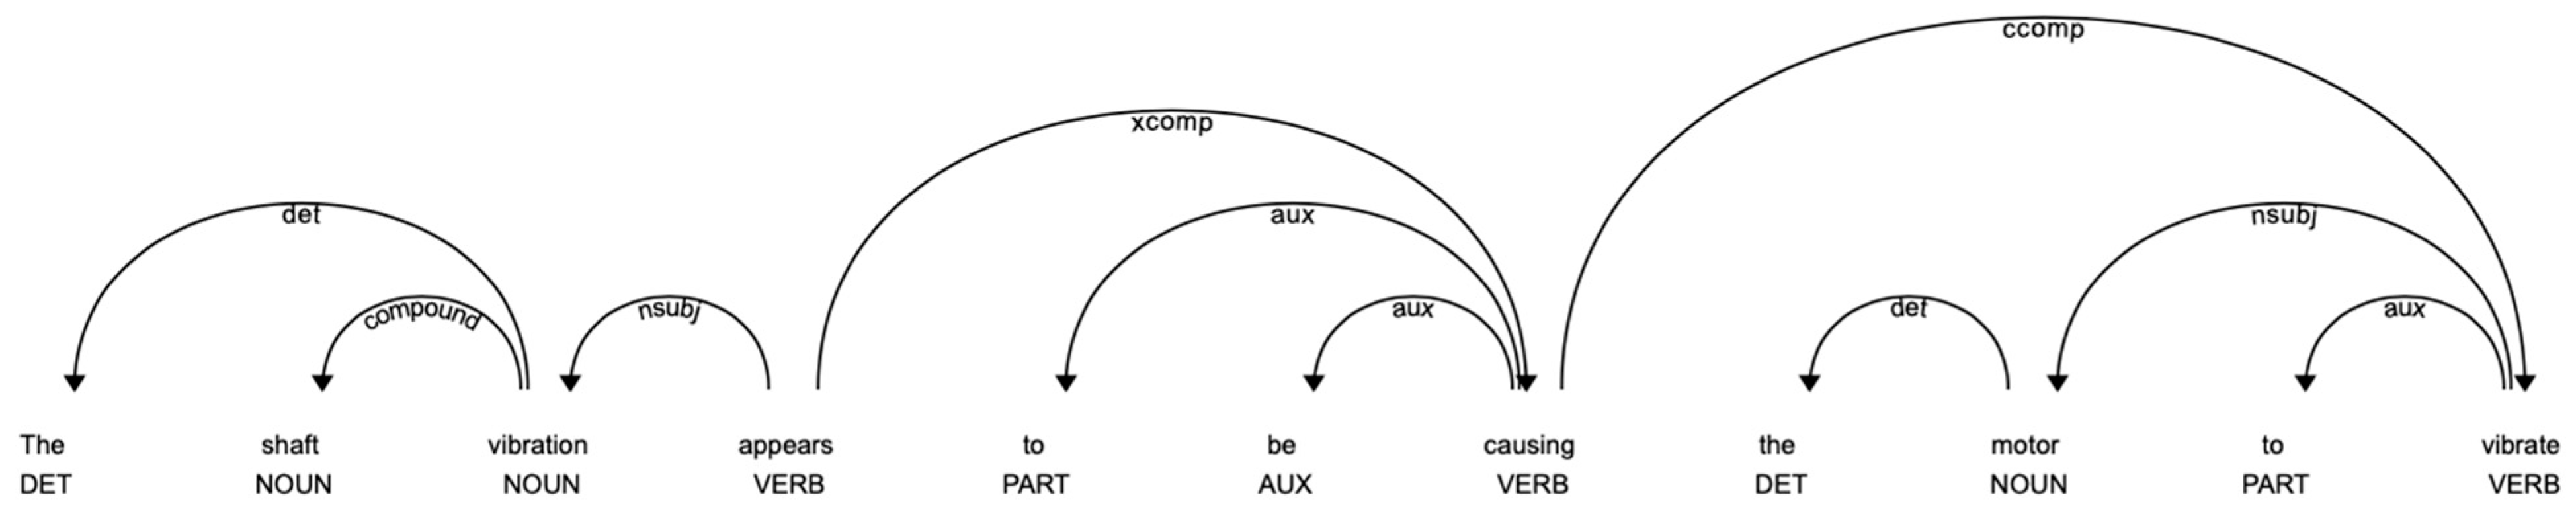
2.5. Dependency Parsing

POS [18] tagging provides information on word types and morphological features but not dependency information between words. Some examples of dependencies are nominal subject (nsubj), direct object (dobj), and indirect object (iobj). The parser uses a variant of the non-monotonic arc-eager transition system described in [42]. The parser uses the terms “head” and “child” to describe those words connected by a single arc in the dependency tree. The dependency labels are used for the arc label, which describes the type of syntactic relation that connects the child to the head. Figure 4 shows a graphic representation of a dependency tree created using SpaCy’s built-in displaCy visualizer, with the POS tag placed below each word. In the present work, we employed the dependency tree to develop rules for identifying health information and causal relationships between events (see Section 2.14 and Section 2.15, respectively).

2.6. Lemmatization

A lemma is the base form of a token. For example, the word “fail” is the lemma of “failing”, “fails”, and “failed”. Lemmatization is the process of reducing words to their base forms (or lemmas). For the present study, we employed the SpaCy lemmatizer to reduce inflectional or derivationally related forms of words to a common base form. In this case, we only needed to provide the keyword base forms that would significantly reduce the total number of keywords.

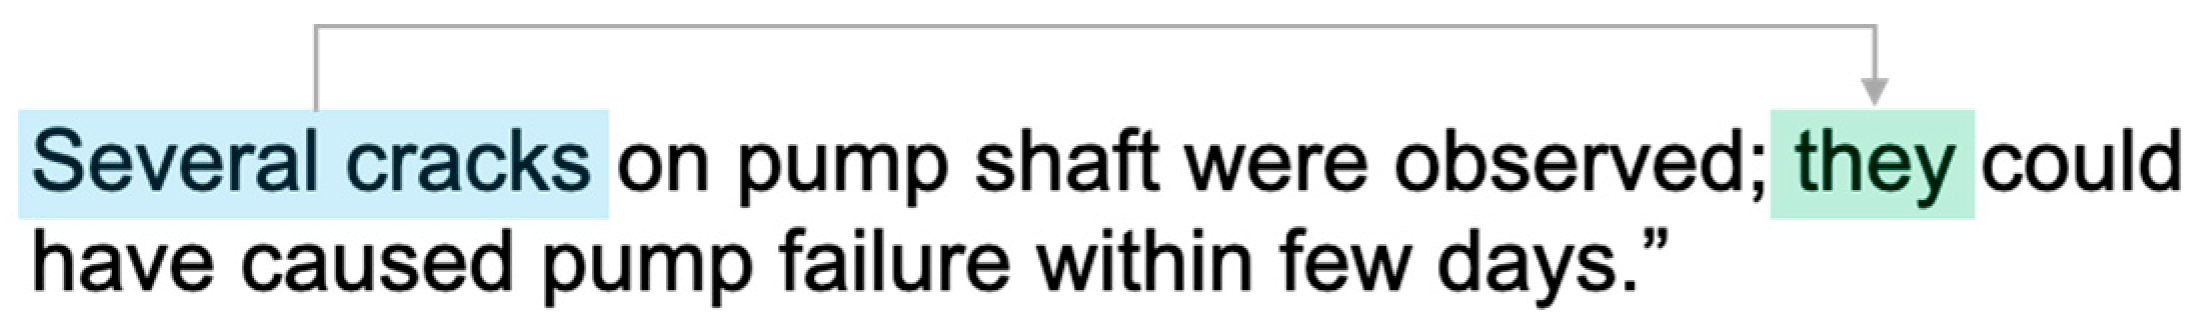
2.7. Coreference Resolution

Coreferences often occur in texts in which pronouns (e.g., it, they) are used to reference elements previously mentioned in the text. Coreference resolution is aimed at identifying the textual element linked to the given pronoun. For an example, see Figure 5, in which the pronoun “they” refers to the previously defined textual element “cracks”. From our analysis tools, we employed Coreferee to resolve coreferences within English texts. Coreferee uses a mixture of neural network and programmed rules to identify potential coreference mentions.

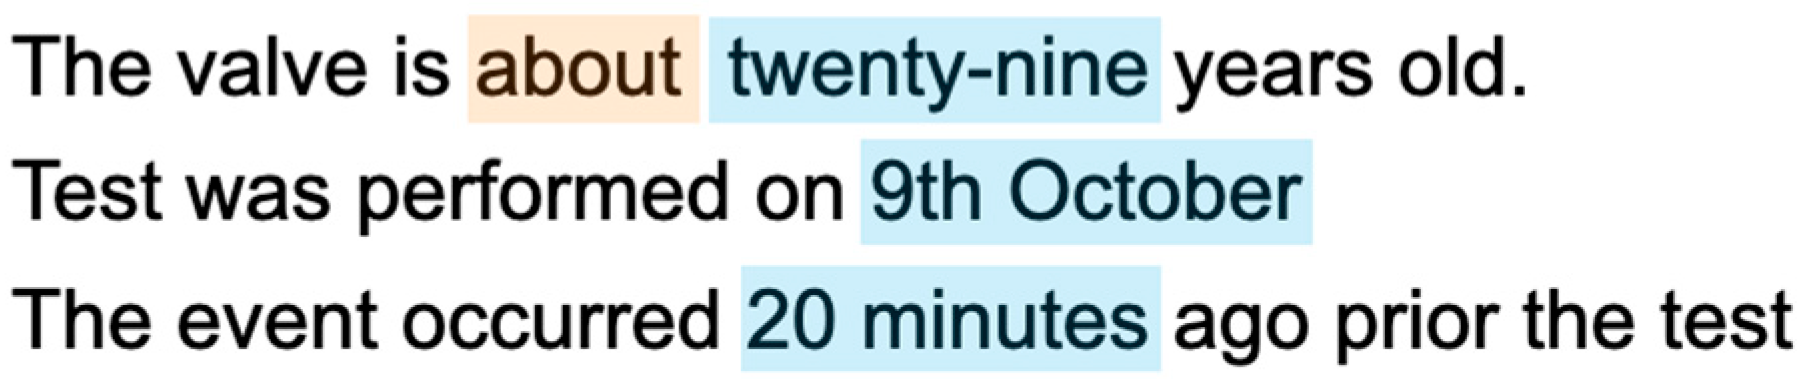
2.8. Identification of Temporal Quantities

Temporal quantities, which indicate time instances when specific events have occurred, can come in different forms. For the scope of this article, we partitioned these forms into four classes (see Table 1) that specify the occurrence of an event in absolute terms (i.e., date or time) or in relative terms (i.e., duration or frequency). A relevant observation is that the provided temporal information may contain some uncertainty (e.g., an approximated estimate of the temporal occurrence of an event). Such situations were handled by defining a specific list of keywords that indicate approximation, as well as their corresponding set of relations based on observed datasets (see Table 2). The set of temporal relations shown in Table 3 was developed based on [45] and by relying on the large TimeBank corpus [46]. Figure 6 shows an example outcome of our identification methods.

2.9. Identification of Temporal Sequencing of Events

Another class of textual data elements that can often be retrieved from NPPs is found in IRs covering multiple events linked by temporal relations. Temporal relations can be either quantitative (e.g., an event that occurred two hours after another event) or qualitative (e.g., an event that occurred prior to another event). Note that a temporal relation does not necessarily imply a causal relation. In this paper, we build on the work in [47], which lists the major temporal relations between events:
  • Order: sequential occurrence of events
  • Concurrency: (nearly) simultaneous occurrence of events from beginning to end
  • Coincidence: temporal intersection of events.
Note that event duration is considered a temporal attribute (see Section 2.8). An analysis of sentences containing temporal relations involves identifying specific keywords, relations, and grammatical structures in each sentence—similarly to what was presented in Section 2.8. In this respect, Table 4 and Table 5 provide the set of keywords (i.e., verbs, adjectives, and adverbs) that were identified for order, concurrence, and coincidence of events. A set of grammatical structures that indicate the order and coincidence of events was also developed (see Table 6 and Table 7, respectively). The example provided in Figure 7 shows two identified temporal attributes that indicate a temporal sequence and concurrency of events.

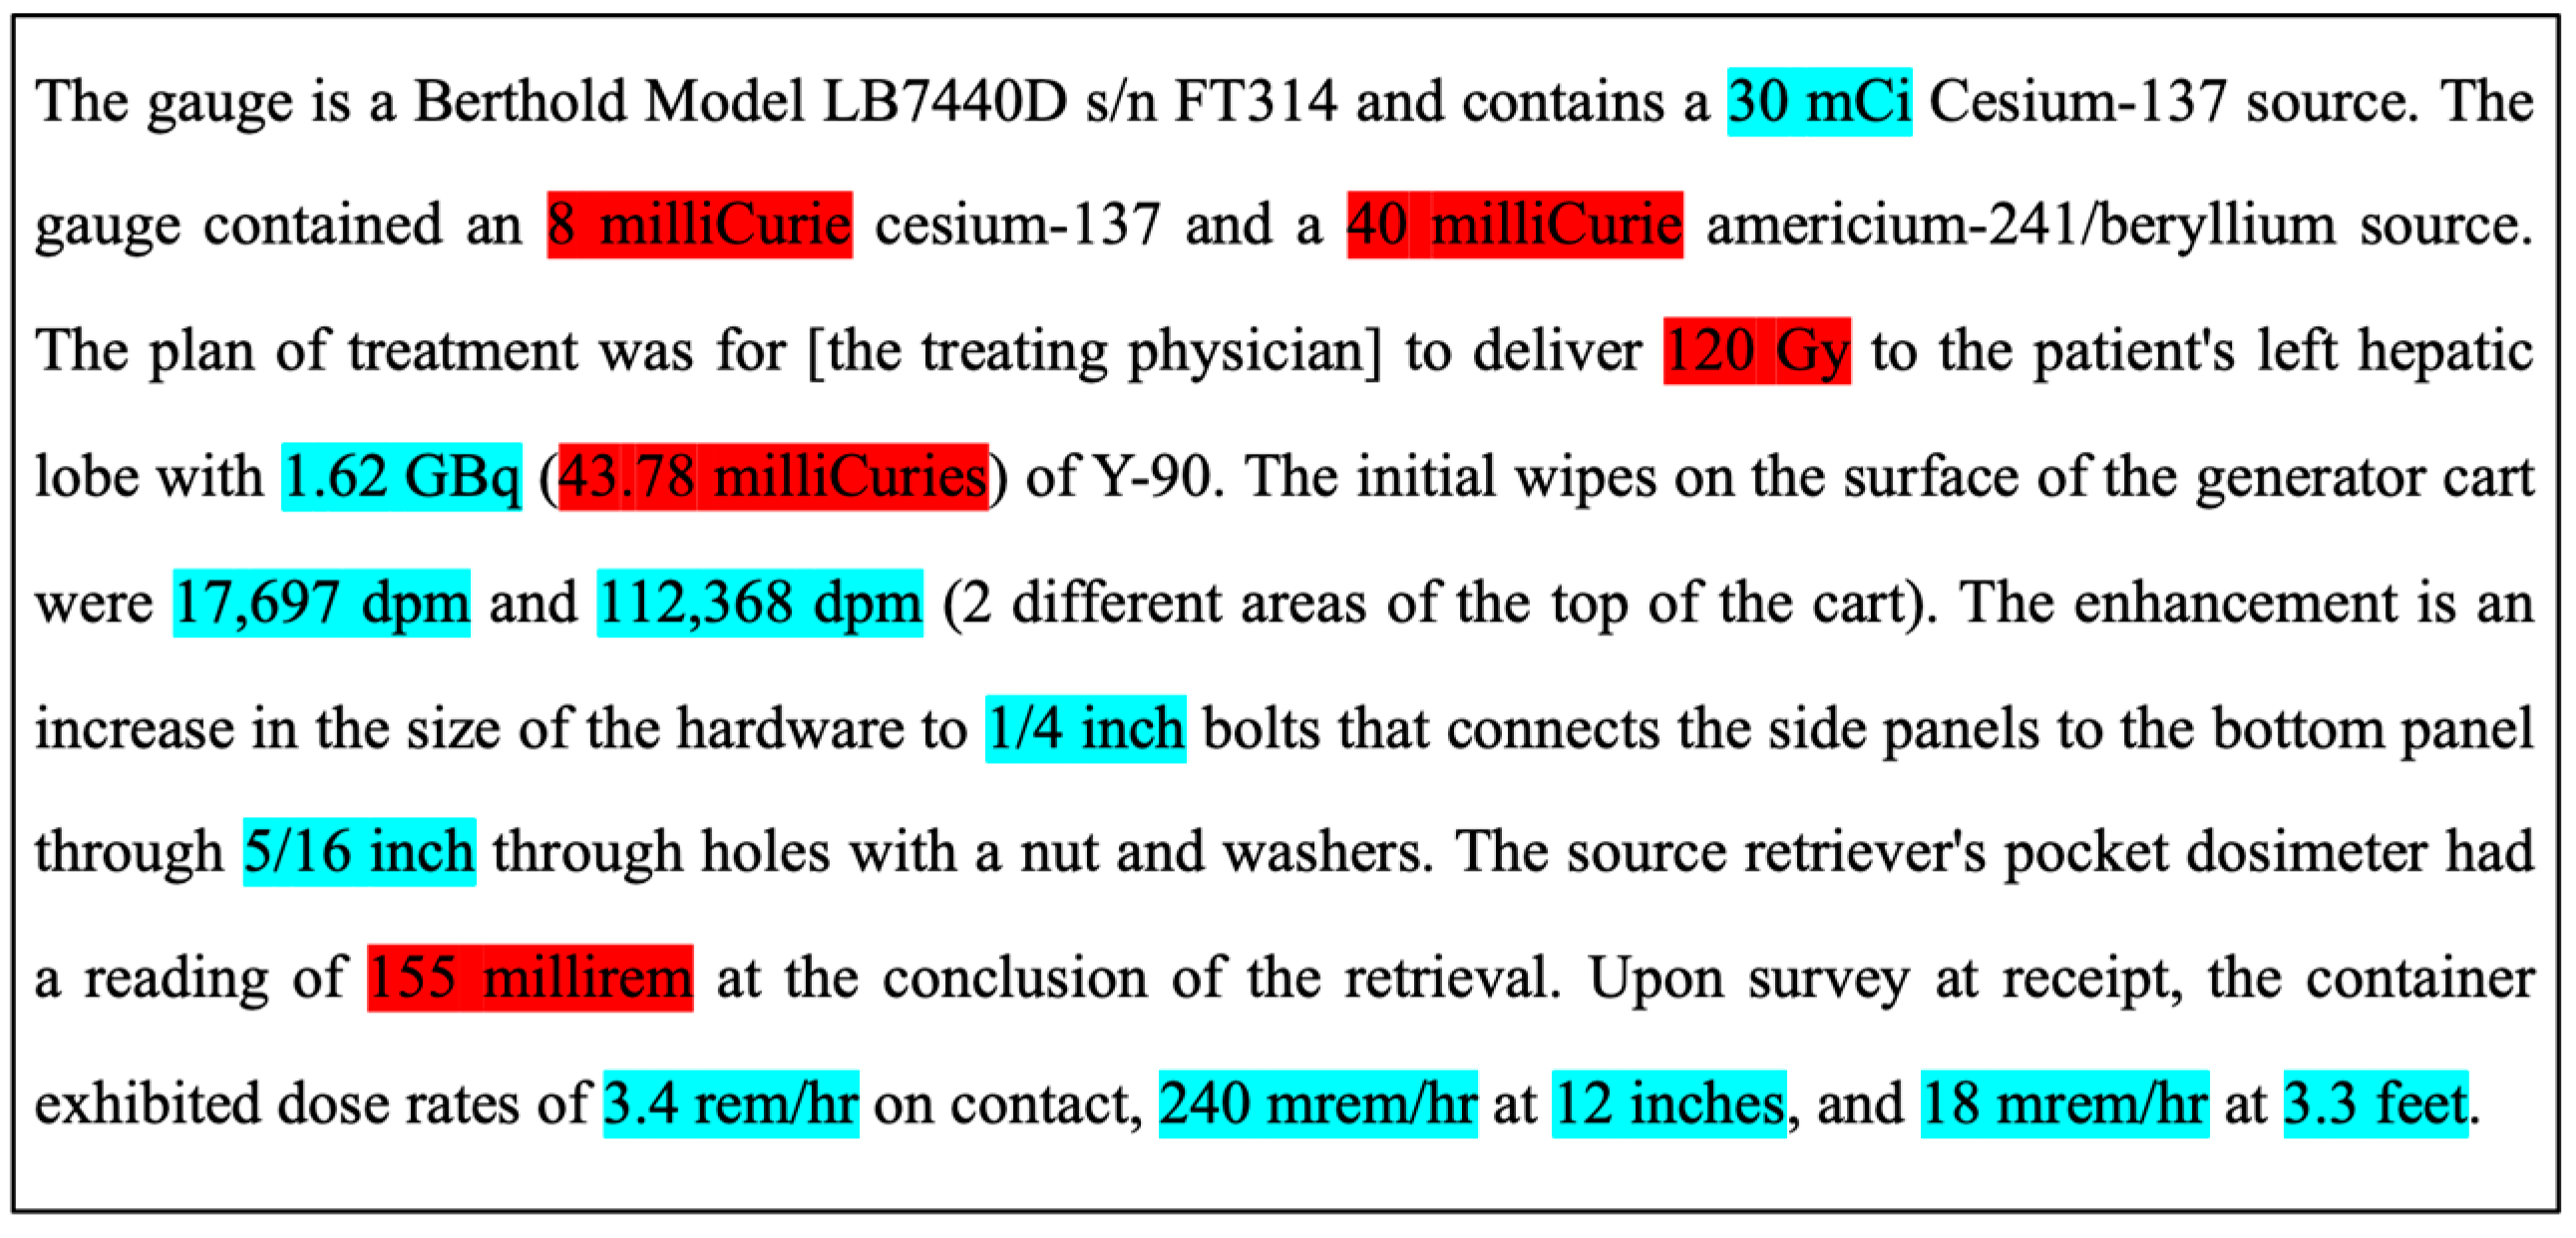
2.10. Identification of Measured Quantities

Next, we aimed to identify a precise observation (i.e., a measured point value or delta estimate) of a measured variable. This observation required a numeric value followed by its unit; however, it is not unusual for the unit to be missing. Note that, based on the observed NPP ER textual data, measured quantities can be specified in a large variety of ways (see Table 8 for examples), and not solely in the classic form “number + unit of measure”.
This list was based on [48] and it was tested using openly available scientific literature. We leverage quantulum3 and text syntactic relations listed in Table 9 to extract measured quantities. The tool quantulum3 can identify all possible numerical, values either with or without units, whereas syntactic information helps disambiguate the units from the natural language.
Figure 8 gives an example of identifying measured quantities. The textual elements were taken from a few different NRC licensee event reports. The correctly identified quantities are highlighted in blue, the rest are highlighted in red. As seen, the developed method leads to issues regarding certain specific situations: namely, unknown units of measures (e.g., Gy) and unit prefixes (e.g., milliRem instead of mRem). We are currently working to address such limitations by making new improvements to quantulum3 and implementing ad-hoc methods whenever these limiting situations are encountered.

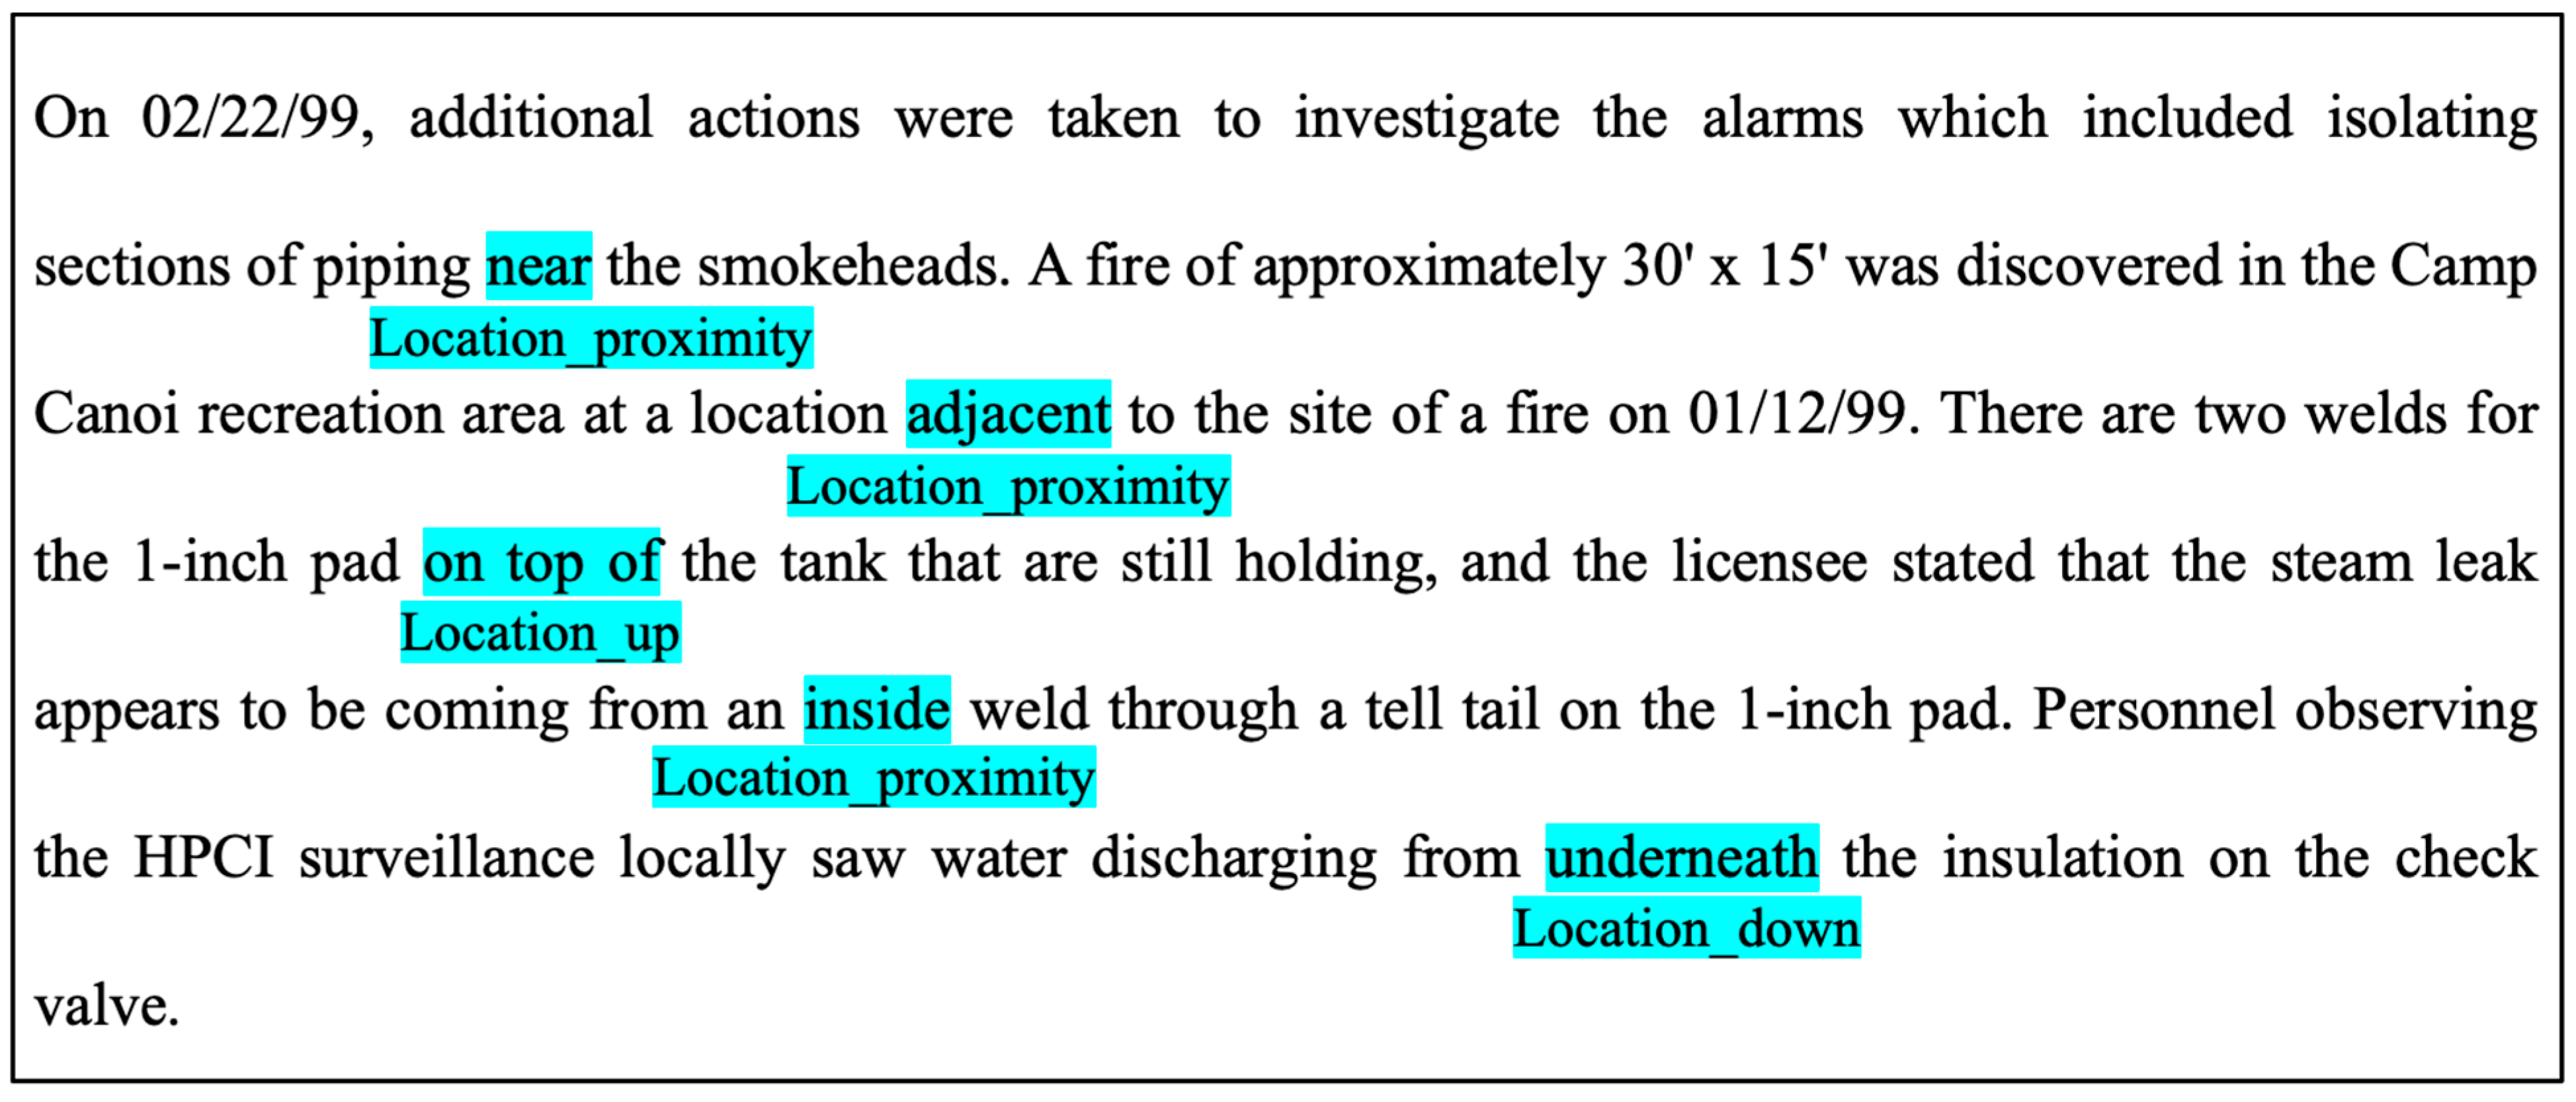
2.11. Identification of Location Attributes

As with temporal attributes, location attributes provide qualitative information, in this case, information on where specific events have occurred. While location information does not equip system engineers with any additional health information, it might give clues about the health of a specific component whenever a reported event has occurred nearby it. For example, the textual report “An oil puddle was found nearby pump MFW-1A” identifies an element (i.e., oil) that may have a relation to a nearby pump (i.e., MFW-1A pump). In the literature, this type of attribute search is not of interest; however, from a safety/reliability standpoint, such information can be crucial for identifying the causes behind abnormal behaviors observed throughout an NPP.
Location attributes are identified by looking at the specific keywords and relations listed in Table 10 and Table 11, respectively. Regarding the list of keywords listed in Table 10, we relied on an initial set of keywords that was then expanded using WordNet (WordNet is a lexical database originally created by Princeton University. It contains words, their meanings (e.g., synsets), and their semantic relationships, all of which are stored in a hierarchy-tree-like structure via linked synsets. Each synset denotes the precise meaning of a particular word, and its relative location to other synsets can be used to calculate the degree of similarity between them.) [49] synonym search capabilities. Figure 9 shows an example of identifying location attributes. (The textual elements were taken from a few NRC licensee event reports.) In this case, the identification of these attributes was very robust.

2.12. Identification of Nuclear Entities

NLP knowledge extraction methods require the ability to identify specific entities such as common SSCs that can be found in any NPP. A library for light water reactors has been developed in past years using available textual data form the NRC and EPRI. The entities contained in this library (numbering about 5000 and growing) are arranged into eight main classes and then subsequently divided into groups (mainly for data management purposes). Table 12 lists the various classes and groups created so far, along with examples of entities corresponding to each group.
Using this list, the goal is now to identify these types of entities within a textual data element. For the present work, we relied on SpaCy name entity recognition (NER) functions [50] to perform such searches. Identified entities were flagged with a specific tag ID and saved as part of the metadata associated with the textual data. Figure 7 provides an example of the outcome of the developed nuclear entity NER methods, with several elements, highlighted in blue, having been correctly identified.

2.13. Identification of Conjectures

In this step, we consider textual elements that contain information about future predictions (e.g., an event that may occur in the future) or hypotheses regarding past events (e.g., a failure that may have occurred). Even if the reported event has not occurred (or may not happen), this evaluation might be relevant for future diagnosis (identifying possible causes from observed events) or prognosis (identifying consequences from observed phenomena) purposes. In this context, verb tense plays a role in identifying this kind of report. Future predictions are characterized by present- and future-tense verbs, whereas hypotheses about past events are typically characterized by past-tense verbs. Hence, we rely on the outcomes of the methods presented in Section 2.4 and Section 2.5 in order to perform such syntactic analyses. Additionally, we developed an initial set of specific keywords (see Table 13) and relations (see Table 14) that can inform our methods whenever we are dealing with a conjecture observation. Once a conjecture is identified from a textual data element, a conjecture flag is set to “True” as part of the metadata associated with the textual data.

2.14. Identification of Health Status

So far, we have demonstrated the capability to identify quantitative health information associated with an SSC when the textual report provides a precise observation (i.e., numeric value) of a measured variable (see Section 2.10), its proximity location (see Section 2.11), and its temporal attributes (see Section 2.8). Often, IRs reflect qualitative information on abnormal observed events (e.g., failures, or precursors to a degradation phenomenon). From a reliability standpoint, identifying the nature of the reported event plays a major role, with the goal being to track the health performance of a single SSC or multiple SSCs operating in similar operating conditions.
Based on the large number of IRs and WOs gathered from operating NPPs in the United States, and using the methods presented in Section 2.4 and Section 2.5, we collected and extracted the underlying grammatical structures and converted them into relations (see Table 15). Similarly, a list of keywords (nouns, verbs, adverbs, and adjectives) for indicating the health status of a generic SSC is shown. These keywords have been partitioned into three main classes (see Table 16, Table 17 and Table 18) based on sentiment analysis [51], and then expanded using the WordNet [49] synonym search capabilities. Thus, identification of the health status of the textual clause can be assessed by searching in the text for the developed lists of relations and keywords.

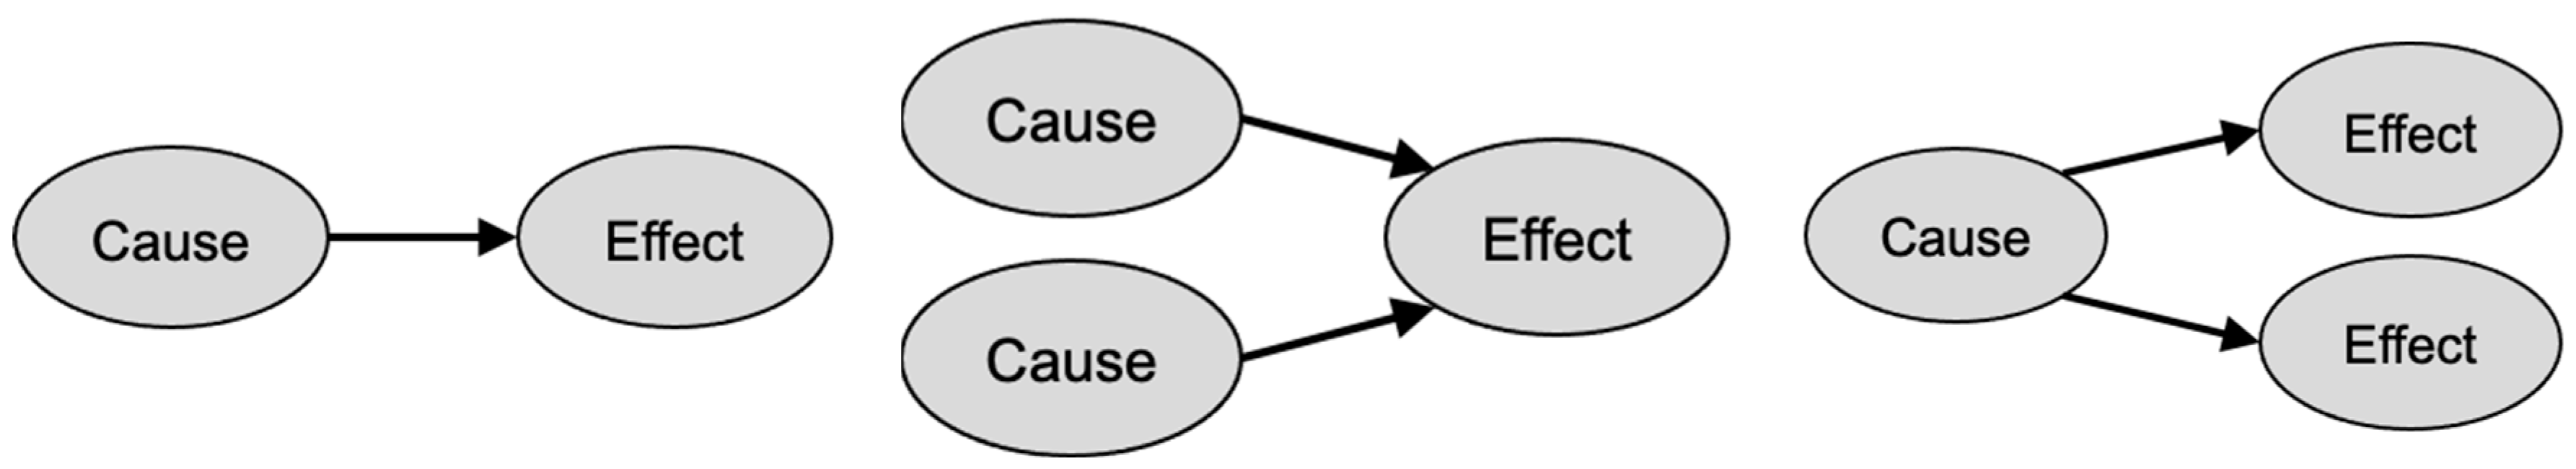
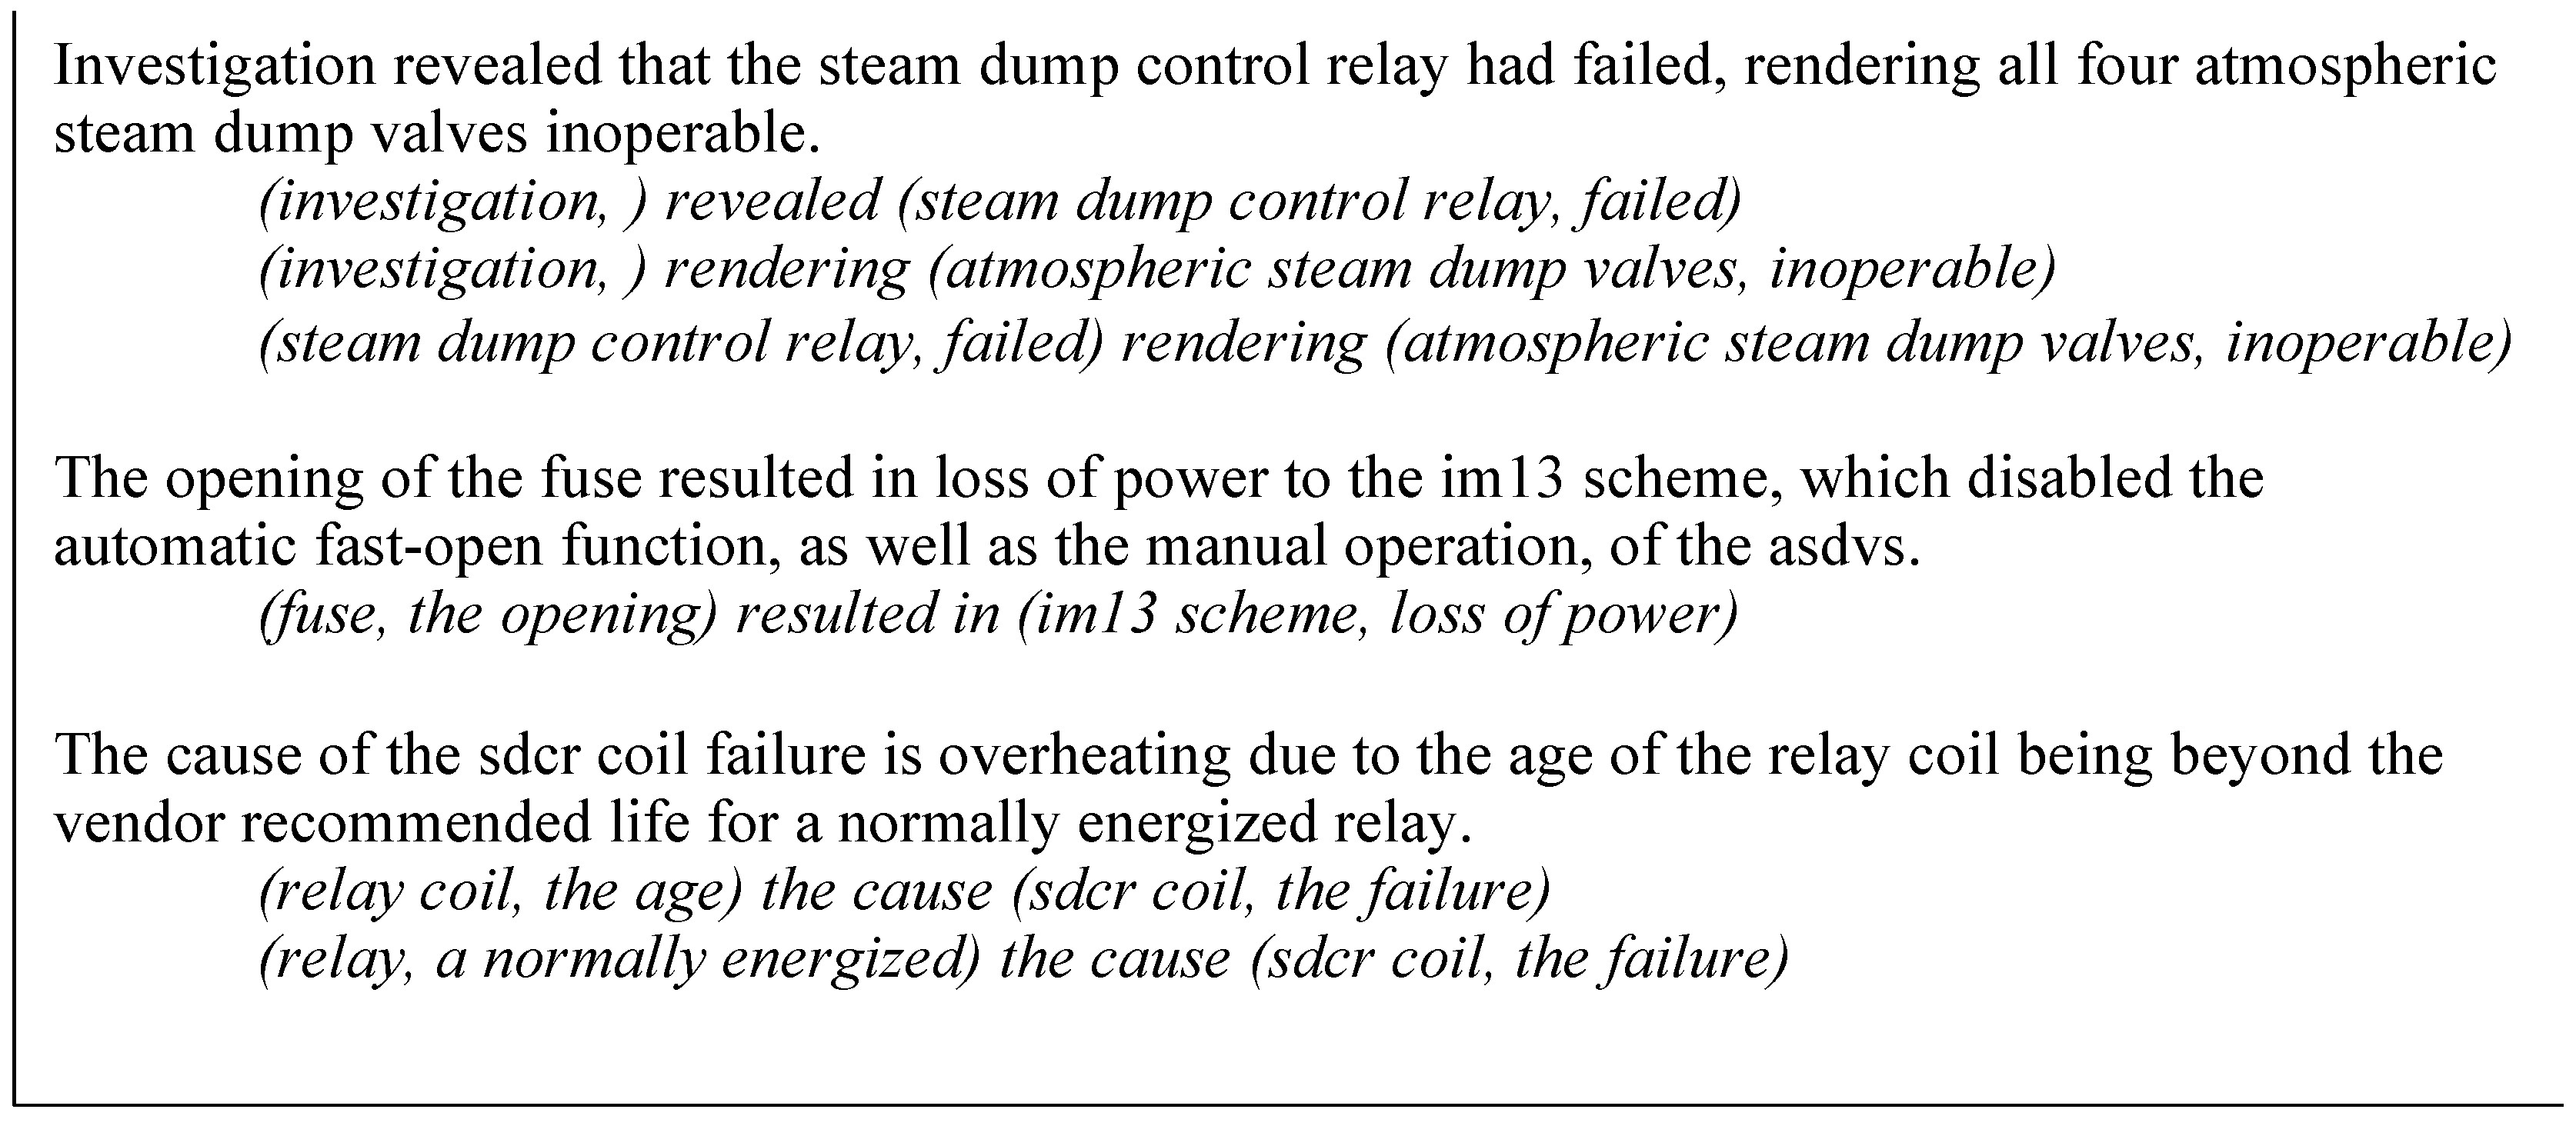
2.15. Identification of Cause–Effect Relations

An occasional pattern in textual ER data is the reporting of multiple events as well as the causal relationship among them. In this regard, the simplest type of paragraph found in textual ER data will refer to an event (i.e., the cause) that triggered a second event (i.e., the effect). However, variations in such paragraphs do exist (see Figure 10): multiple causes can trigger a single effect, or a single cause can trigger multiple effects.
Here, we did not employ ML algorithms (e.g., through the utilization of classification methods [52]), but instead once again relied on rule-based [53] methods, since our goal was to extract quantitative information from textual data rather than “classify” the nature of the raw text. In other terms, rather than just classifying the textual data element as to whether it does or does not contain a causal statement, we aim to identify which element is the cause and which is the effect. Similarly to what was described in Section 2.14, these rules are based on the identification of the following:
  • Keywords (e.g., nouns, verbs, and adverbs) that reflect that the sentence may contain a causal relation between its subject(s) and object(s) (see Table 19). We successfully expanded out the initial set of keywords by using the WordNet [49] synonym search capabilities.
  • Relations between subjects and verbs contained in a sentence that are designed to reconstruct the causal relations (see Table 20). The list of these relations was developed by applying the methods described in Section 2.4 and Section 2.5 to a portion of the CausalBank [54] dataset, which contains about 314 million pairs of cause–effect statements.
  • NLP relations composed of multiple words that indicate a casual transition between clauses contained in a sentence or between sentences (see Table 21).
We applied the developed cause–effect identification methods to the publicly available NRC LER 2021-001-00, “Atmospheric Steam Dump Valves Inoperable Due to Relay Failure”. In this context, Figure 11 presents a subset of three cause–effect relations that were identified. In particular, for each of the three identified relations, the figure shows the original text and details about the relation, per the following format: “(cause, status), cause-effect keyword, (effect, status)”.
An initial testing of the capabilities of the developed methods was performed on an openly available dataset generated within SemEval. In particular, we considered the SemVal2010_task8 dataset [55] built to test the performance of NLP methods regarding the discovery of causal relations. The performances were measured in terms of precision (as the ration between true positives over the sum of true positives and false positives) and recall (as the ration between true positives over the sum of true positives and false negatives). The obtained values for precision and recall were estimated as 68% and 88%, respectively. The performances were measured by looking at the subset of sentences in the dataset that were originally labeled as “cause-effect”. Through a careful investigation, our methods were labeling as “cause-effect” some sentences originally labeled as “Product-Producer”. In some of these cases those sentences were actually containing a cause–effect relation that we wanted to identify. Thus, the actual performances could be better.

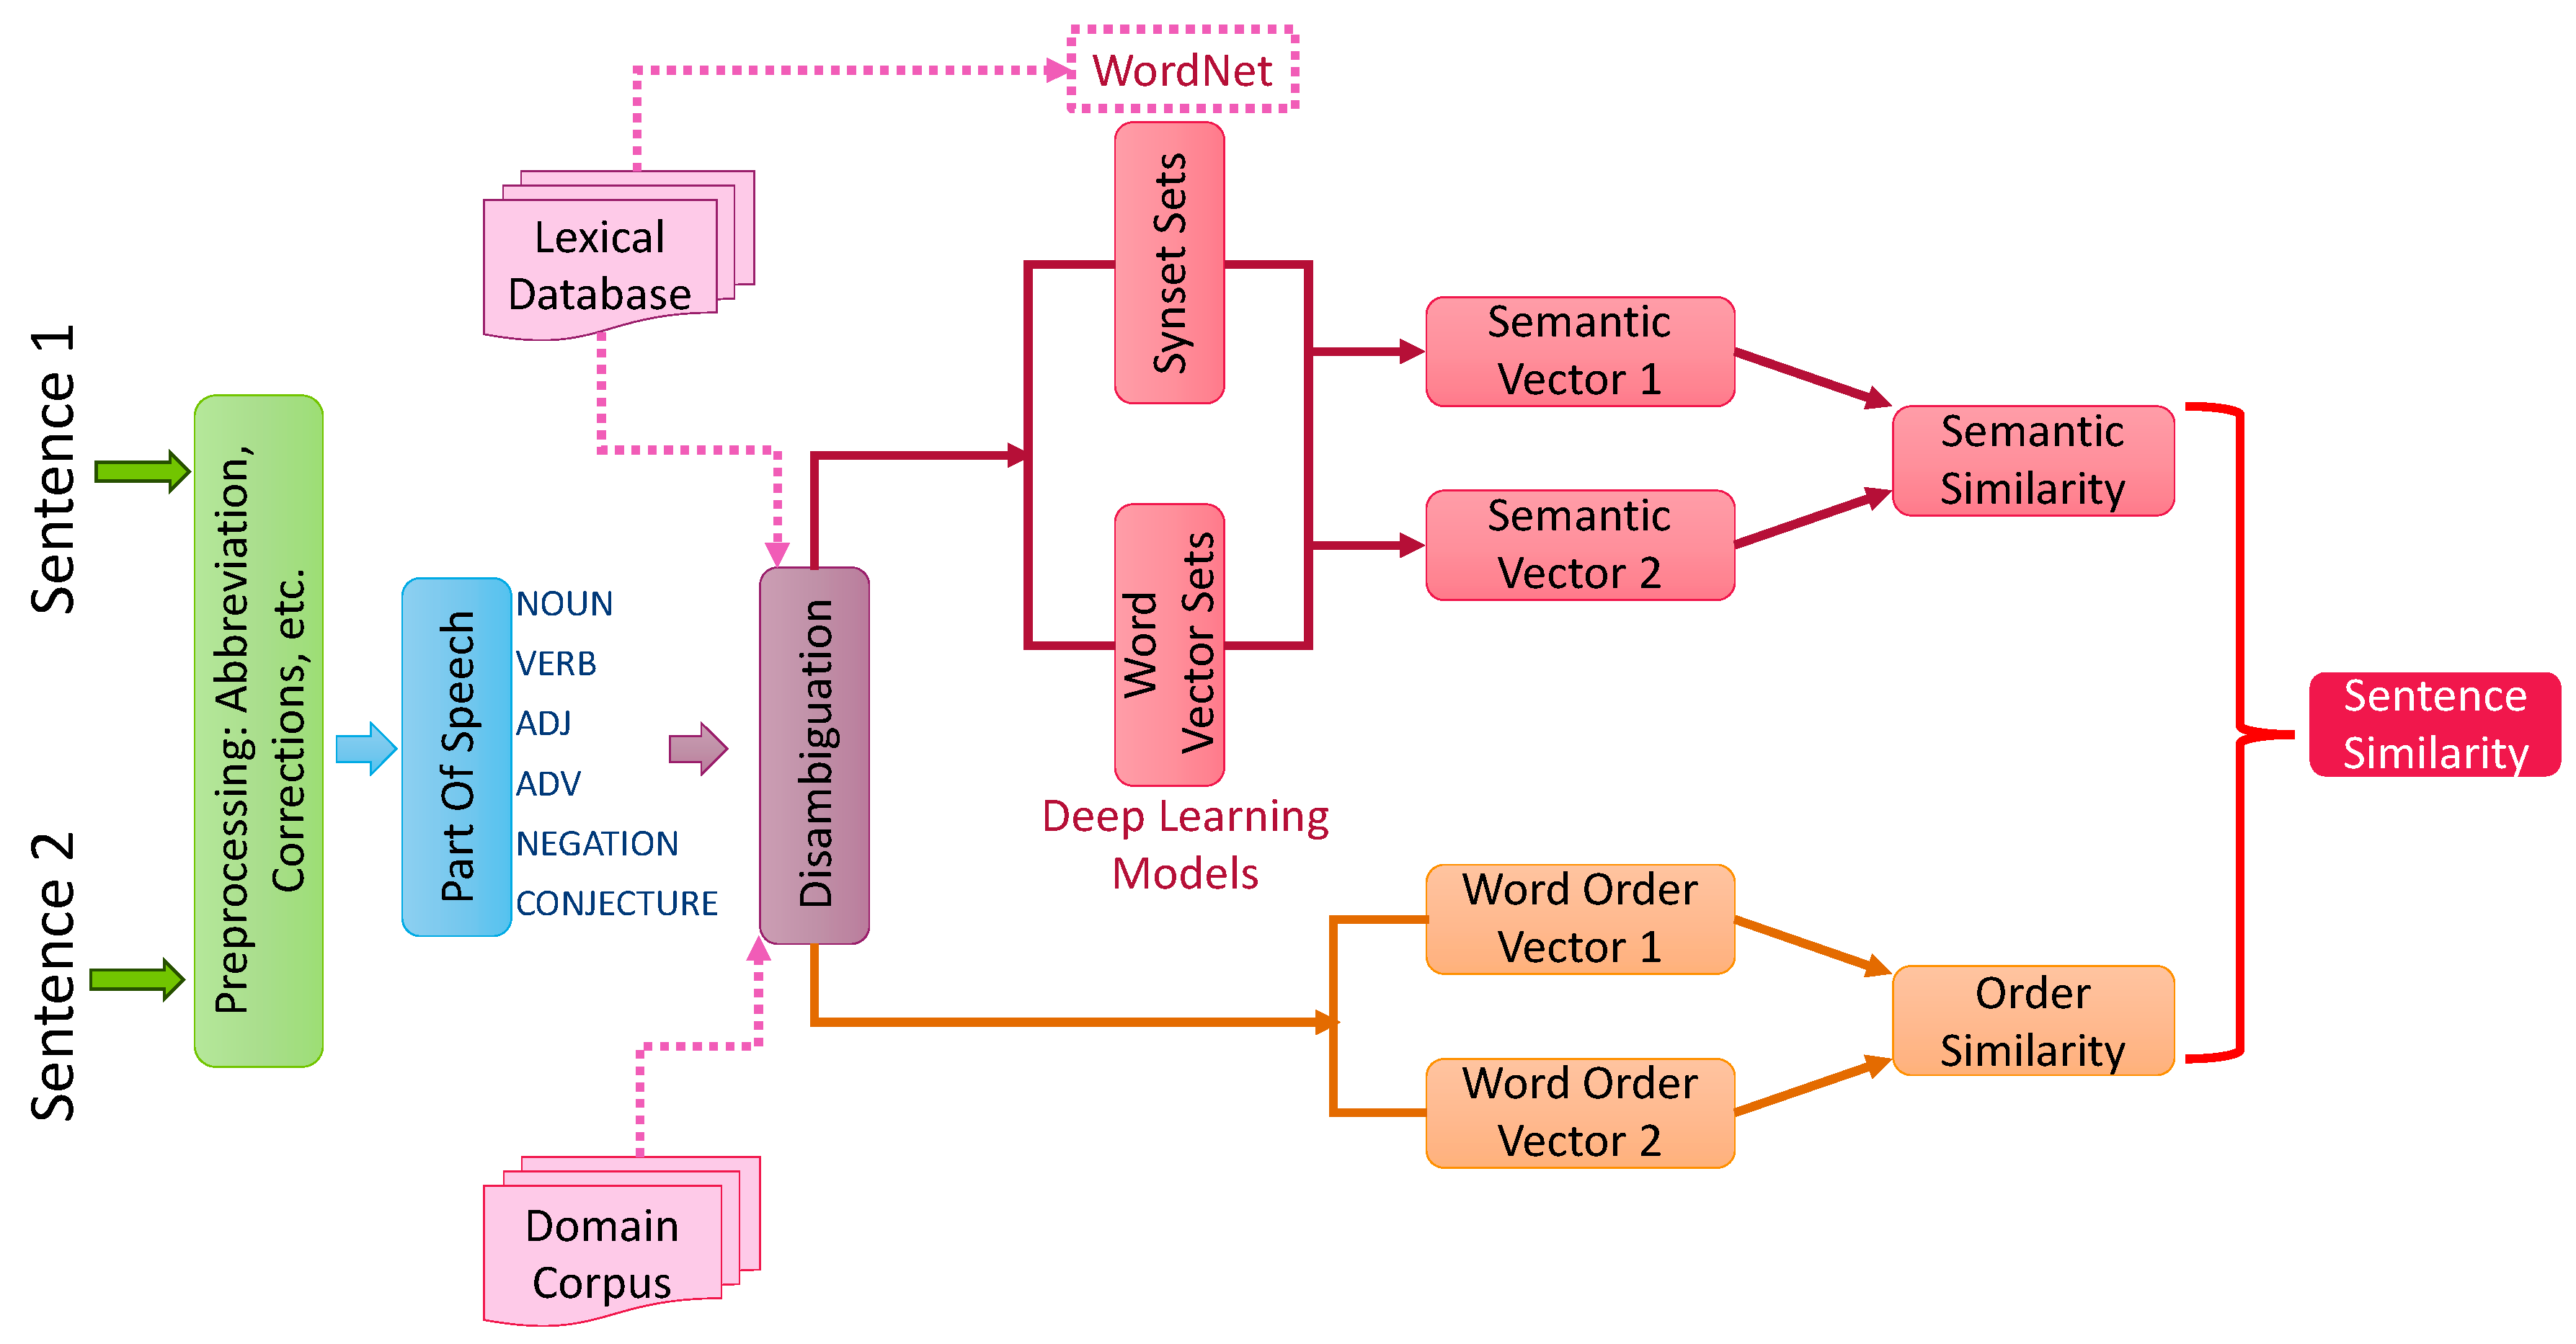
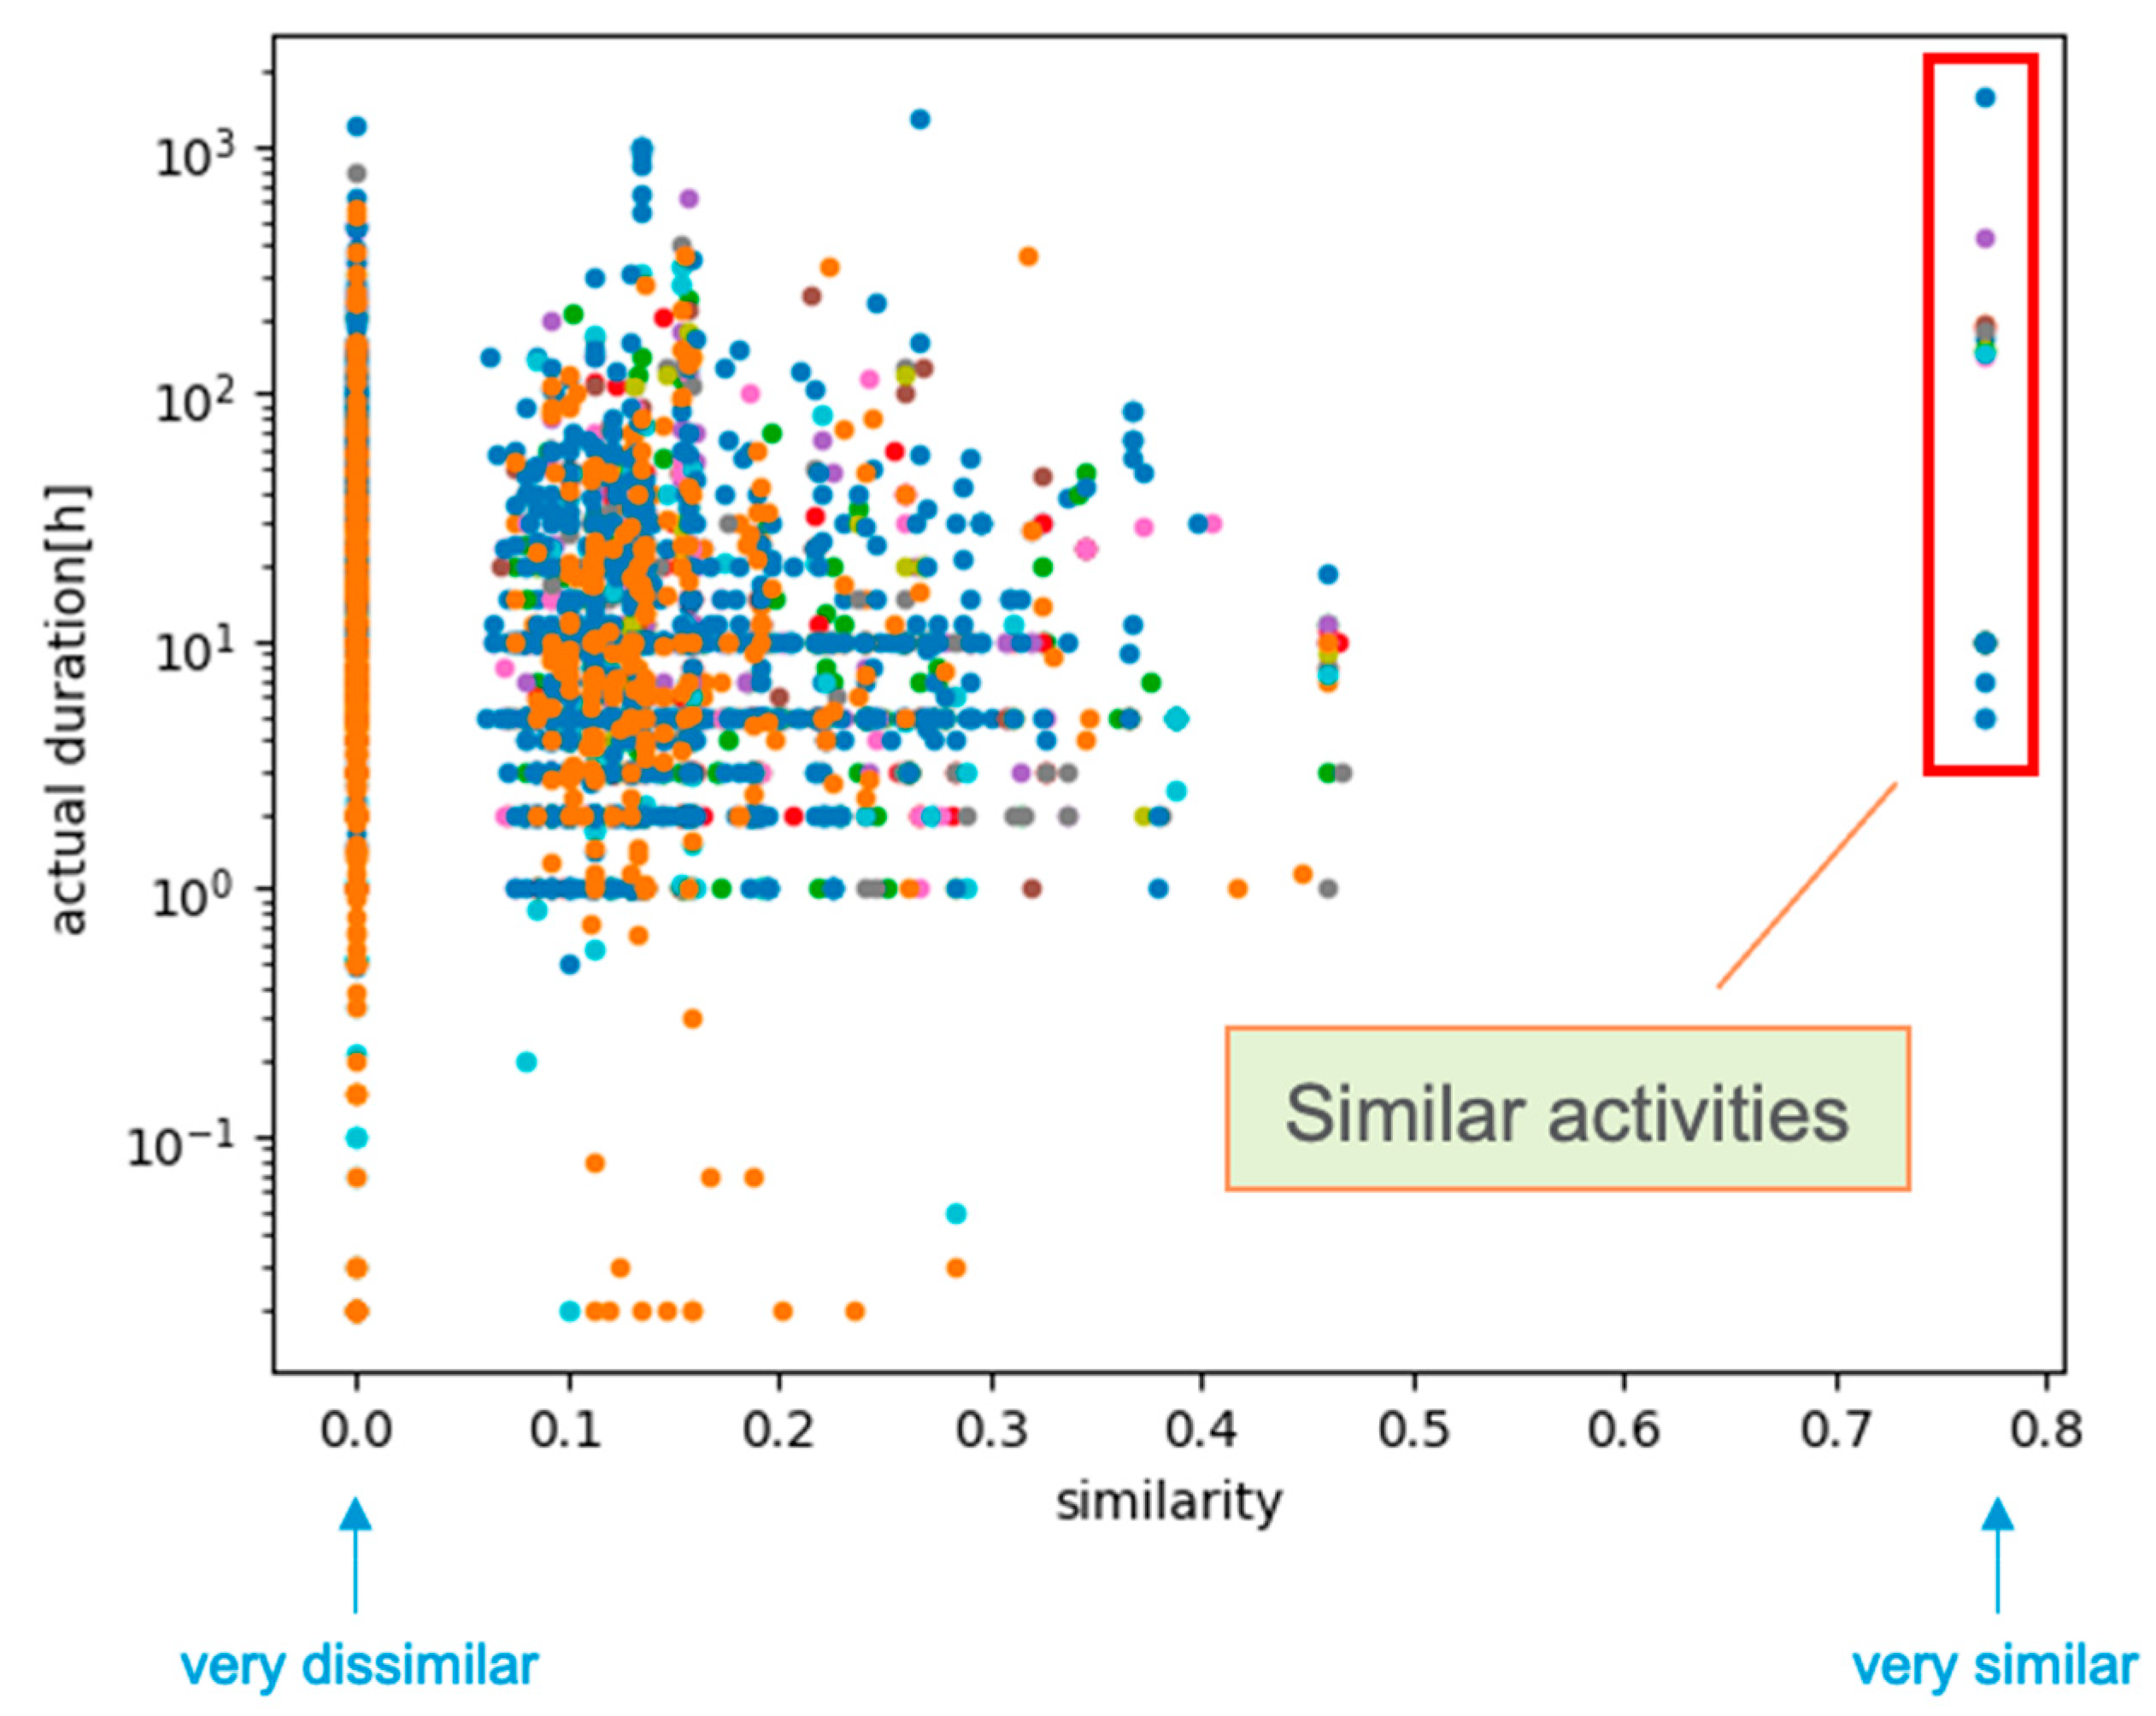
2.16. Identification of Text Similarity

Word, sentence, and document similarity analyses are part of NLP, and play a crucial role in text analytics (e.g., text summarization and representation, text categorization, and knowledge discovery). A wide variety of methodologies have been proposed during the last two decades [56,57], and can mostly be classified into five groups: (1) lexical knowledge base approaches, (2) statistical corpus approaches (word co-occurrence), (3) ML and deep learning approaches, (4) sentence-structure-based approaches, and (5) hybrid approaches. However, a few common major drawbacks stem from these approaches: computational inefficiency, a lack of automation, and a lack of adaptability and flexibility.
In the present work, we attempted to address these drawbacks by developing a tool that is generally usable in applications requiring similarity analysis. As shown in Figure 12, we leverage POS, disambiguation, lexical database, domain corpus, word embedding and vector similarity, sentence word order, and sentence semantic analysis to calculate sentence similarity. POS is used to parse a sentence and tag each word and token with a POS tag and a syntactic dependency (DEP) tag. Such data will provide syntactic structure information (i.e., negation, conjecture, and syntactic dependency) about the sentence, and this information can be used to guide the similarity measuring process.
Disambiguation is employed to determine the best sense of the word, especially when coupled with specific domain corpus. It ensures the right meaning of the words (e.g., the right synsets of the words in a lexical database) within the sentence is captured. A predefined word hierarchy from a lexical database (i.e., WordNet) is then used to calculate the degree of word similarity. However, some words are not contained in the lexical database, as it only connects four POS types: nouns, verbs, adjectives, and adverbs. Moreover, these words are grouped separately and do not feature any interconnections. For instance, nouns and verbs are not interlinked (i.e., the similarity score between “calibration” and “calibrate” is 0.091 when using WordNet). In this case, ML-based word embedding is introduced to enhance the similarity calculation. Regarding the previous example, the similarity score then becomes 0.715. The next step is to compute sentence similarity by leveraging both sentence semantic information and syntactic structure. The semantic vectors are constructed using the previously introduced word similarity approach, whereas syntactic similarity is measured based on word order similarity. The following sections further describe each of the steps in more detail.
As mentioned in Section 2.4 and Section 2.5, POS data provide information on word types and morphological features, and dependency parsing provides information on the syntactic dependency between words. Both POS and dependency parsing can help identify important information such as NOUN, VERB, ADJ, ADV, negation, conjecture, subject, and object, and this information is then used to compute the sentence syntactic similarity.
Lexical databases such as WordNet consider semantic connections between words, and this can be utilized to determine their semantic similarity. As summarized by [58], many different methods can be employed to compute word similarity using WordNet, and sometimes these methods are combined to enhance the similarity calculation. In this work, we employ the method proposed by [59,60] to compute the similarity score between two words/synsets, here indicated as w 1 and w 2 , as presented in Equation (1):
S w w 1 , w 2 = f l e n g t h l   g d e p t h d = e α l     e β d e β d e β d + e β d  
w i t h   f l e n g t h l = e α l     g d e p t h d = e β d e β d e β d + e β d  
where the following apply:
  • l indicates the path length between w 1 and w 2 .
  • d indicates the path depth between w 1 and w 2 .
  • f l e n g t h l and g d e p t h d are functions which decompose the contribution to S w respectively for path length and depth between w 1 and w 2 .
  • α ∈ [0, 1], β ∈ (0, 1] are scaling parameters for the contribution of the path length and depth, respectively.
The optimal values of α and β are dependent on the knowledge base used, and can be determined using a set of word pairs with human similarity ratings. For WordNet, the optimal parameters for the proposed measure are α = 0.2 and β = 0.45 , as reported in [60].
This method combines the shortest path distance between synsets and the depth of their subsumer (e.g., the relative root node of the compared synsets) in the hierarchy. In other words, the similarity score is higher when the synsets are close to each other in the hierarchy, or when their subsumer is located at the lower layer of the hierarchy. This is because the lower layer contains more specific features and semantic information than does the upper layer.
The “sense” of a given word represents its precise meaning under a specific context. Disambiguation is the process used to identify which sense of the word is best in the context of a particular statement. Without proper disambiguation, errors may be introduced at the early stage of the similarity calculation when using lexical databases. For example, in WordNet, synsets denote the senses of the word, and are linked to each other via their explicit semantic relationships. When different synsets are used to calculate word pair similarity, their semantic relationship can be drastically different, potentially having a significant effect on the similarity score. In the present work, we tried to disambiguate the word sense by considering the context of the word. One way to do this is to account for the surrounding words, since they can provide contextual information. However, this may not work for simple or short sentences. In such cases, the domain-specific corpus can be leveraged to disambiguate the word. Once the best senses are identified for the words, the word similarity measure can be employed.
As proposed in [58], sentence similarity encompasses both semantic and syntactic similarity. Semantic similarity is captured via word semantic similarity, as discussed in previous sections, whereas syntactic similarity is measured by word order similarity. Word order similarity affords a way to assess sentence similarity in consideration of word order. As is well described in [58], the constructed semantic vectors and word order vectors can be used to compute sentence similarity. Here, we will briefly introduce the methods of constructing these vectors, and recommend that the reader refer to [58] for additional details.
Given two sentences, T 1 and T 2 , a joint word set is formed (e.g., T = T 1 T 2 ) that incorporates all of the distinct words from T 1 and T 2 . The vectors derived from computing word similarities in T ,   T 1 and ( T ,   T 2 ) are called the semantic vectors, and are denoted by s 1 and s 2 , respectively. Each entry of the semantic vectors corresponds to the maximum similarity score between a word in T and a word in T 1 or T 2 , such that the dimension equals the number of words in the joint word set. The semantic similarity between two sentences is defined as the cosine coefficient between two vectors:
S s = s 1 s 2 s 1 s 2
As proposed in [58], the word order similarity of two sentences is defined as follows:
S r = 1 r 1 r 2 r 1 + r 2
where the word order vectors r 1 and r 2 are formed from T , T 1 and ( T ,   T 2 ) , respectively. For example, for each word w i in T , the r 1 vector with the same length of T 1 is formed as follows: if the same word is present in T 1 , the word index in T 1 is used as the value for r 1 . Otherwise, the index of the most similar word in T 1 will be used in r 1 . A preset threshold (i.e., 0.4) can also be used to remove spurious word similarities. In this case, the entry of w i in r 1 is 0.
Both semantic and syntactic information (in terms of word order)Both semantic and syntactic information (in terms of word order) play a role in measuring sentence similarity. Thus, the overall sentence similarity is defined in [58] as follows:
S T 1 ,   T 2 = δ S s + 1 δ S r
where δ ( 0 ,   1 ] represents the relative contribution of semantic information to the overall similarity computation.

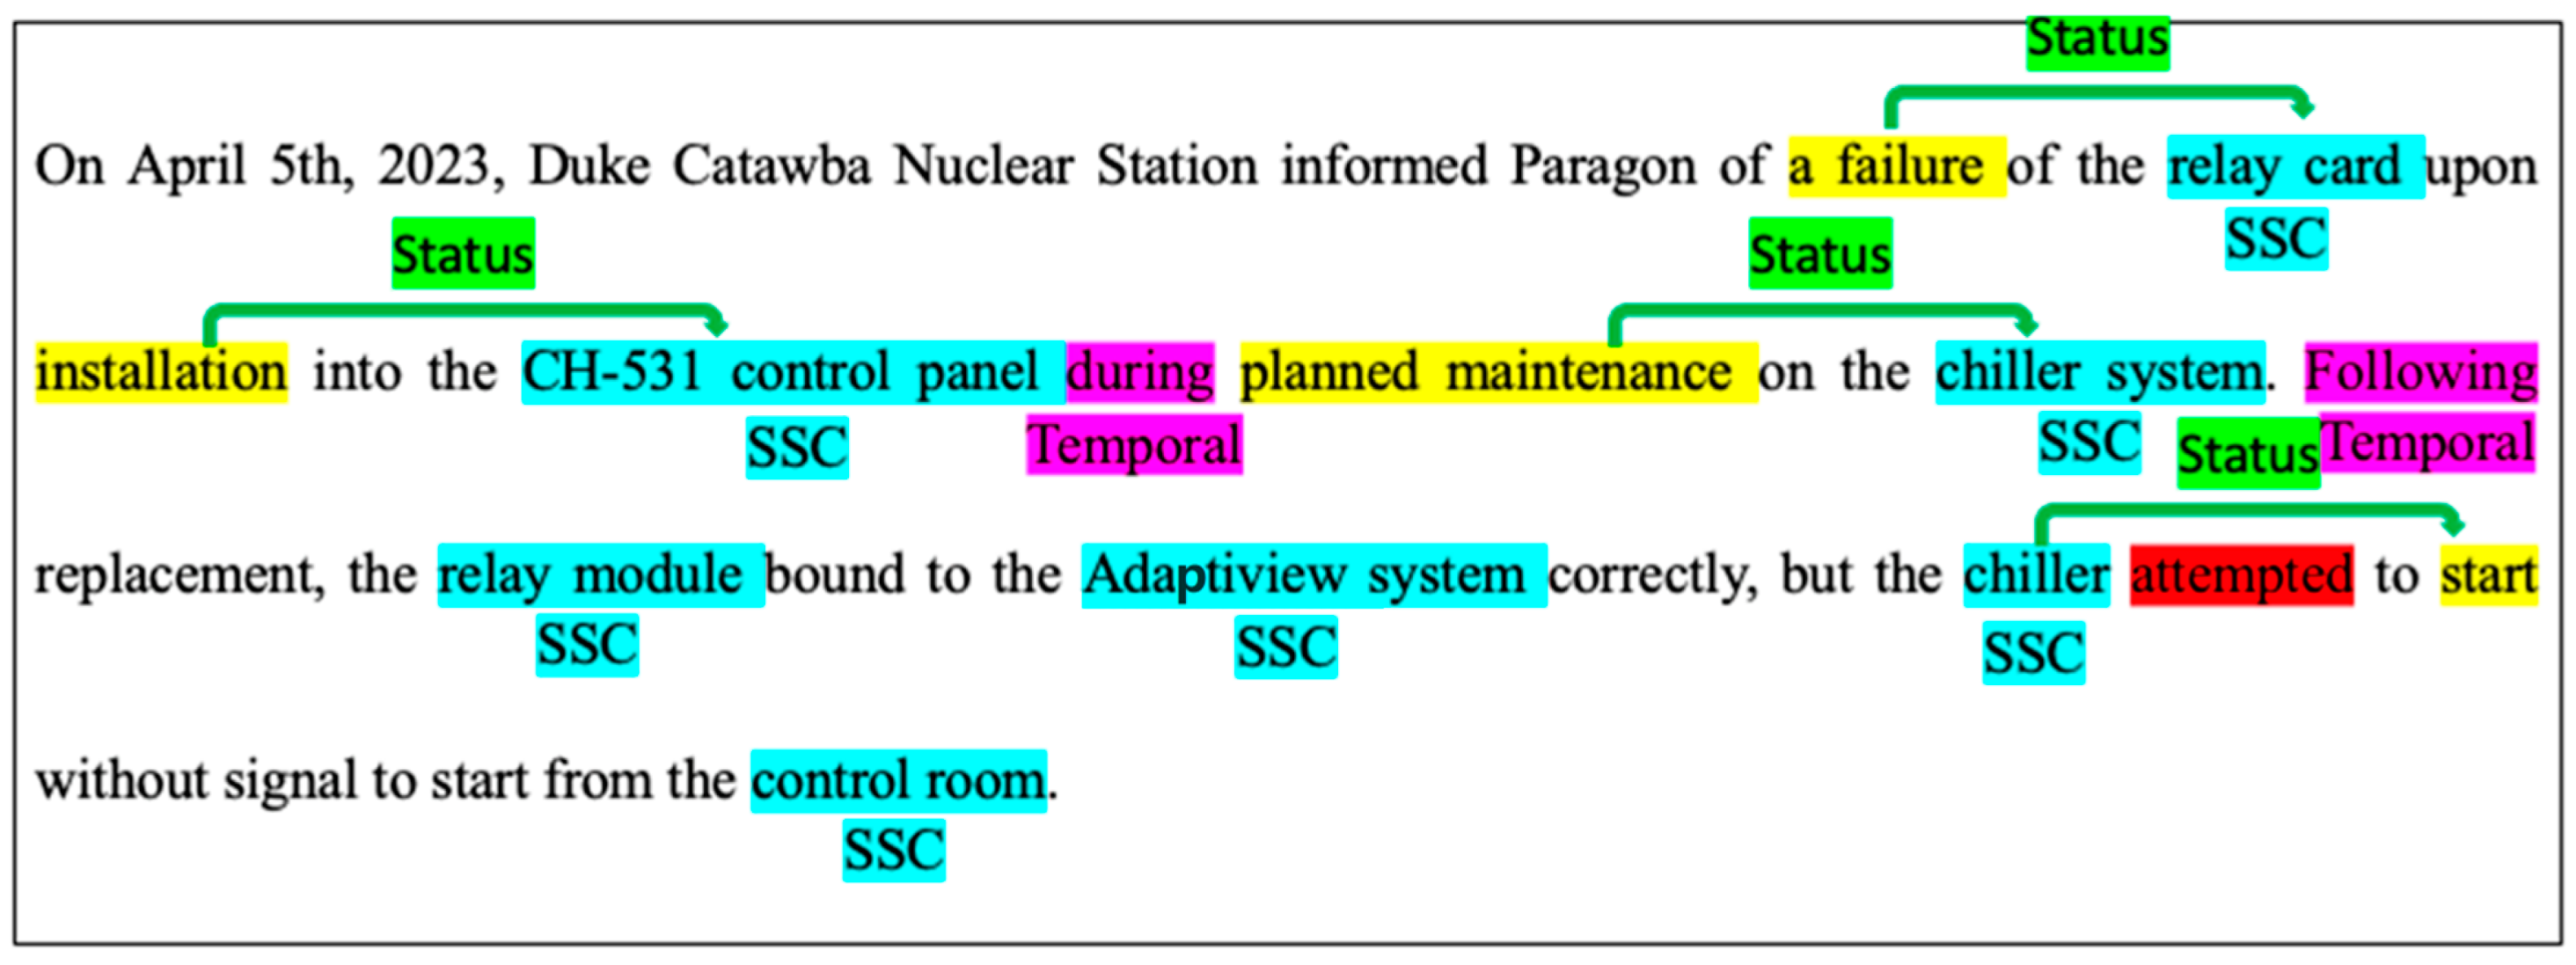
3. Applications of NLP Knowledge Extraction Methods

In current U.S. nuclear power plants, IRs and WOs are typically generated in digital form using pre-defined formats and they are stored in databases along with all of the information about plant operations (e.g., surveillance and maintenance). Such databases can be filtered depending on the type of analyses to be performed and locally downloaded in standard formats (typically in a comma separated value format). In our case, plant IRs and WOs are retrieved from plant databases as comma separated value format data files and then they are converted into a Pandas DataFrame. Each NLP function described in Section 2 has been coded as a stand-alone method that acts on a set of sentences which are stored as a Pandas DataFrame. Each method is designed to sequentially parse all sentences and either flag text elements (e.g., nuclear-related keyword) or populate a new column of the database (e.g., an assessment of conjecture or causal relation between events). Thus, depending on the desired application, the user can create workflows which consist of a set of methods described in Section 2 that operates sequentially on the same Pandas DataFrame. Note this modus operandi can be applied directly once a new IR or WO has been generated (i.e., online mode). Section 3.1 and Section 3.2 provide details about the application of the methods described in Section 2 in two different operational scenarios. The first one focuses directly on NER and knowledge extraction from textual data to identify anomalous behaviors while the second one is designed to support the planning of NPP outage.

3.1. Analysis of NPP ER Data

The examples provided here are designed to demonstrate how the methods described in Section 2 can be used to process NPP IRs. In general, such text preprocessing is manual and potentially very time-consuming. In these examples, we have collected a list of typical IR descriptions (see Table 22) to test the effectiveness of such methods.
Table 22 shows the first example, with the extracted SSC entities and their health status highlighted in blue and yellow, respectively. For a better illustration of the extracted data, Table 23 presents the pair of extracted SSC entities and their health statuses. Note that there are two misidentifications highlighted in green. The first, (pump, test), is easily resolved if we also include the health status keyword “failed” (highlighted in red) in the health status, as marked in Table 22. Two health status options exist for the second misidentification: “found in proximity of rcp” and “oil puddle”. To determine the correct health status for “pump”, we employed word/phrase/sentence similarity (see Section 2.16) in order to compute the similarity scores between the SSCs and their potential health statuses. The one with the highest similarity score is selected as the identified health status. In this case, the similarity score between “puddle” and “pump” is 0.25, whereas that between “proximity” and “pump” is 0.027. Thus, “puddle”—with the additional information “oil”—is selected as the final health status for “pump”.
In the second example, the extracted cause–effect relations between SSCs in regard to the text given in Table 22 are presented in Table 24. We employed a set of rule templates based on specific trigger words and relations (see Section 2.15). Once the SSCs entities and their health status were identified, we could apply these rules to identify the cause–effect relations. One cause–effect relation remained uncaptured, as “safety cage” was not originally listed as the identified SSC entity.
The third example focuses on coreference identification. This process is intended to find expressions that refer to the same entity in the text—something that is of particular relevance in light of a lengthy piece of text that refers to an entity by using a pronoun rather than its proper name. Using our methods, the coreferences in the text presented in Table 22 can be identified, as shown in Table 25.
Conjecture means that the information provided by the sentence pertains to a future prediction (e.g., an event that may occur in the future) or a hypothesis about past events (e.g., a failure that may have occurred). In this context, verb tense plays a role in identifying these kinds of attributes. Future predictions are characterized by both present- and future-tense verbs; hypotheses about past events are typically characterized by past-tense verbs. Based on the text provided in Table 22, the sentences containing conjecture information were correctly identified and are listed in Table 26.

3.2. Analysis of Plant Outage Data

Refueling outages are among the most challenging phases in an NPP’s operating cycle. NPP outages require the scheduling of thousands of activities within an average of 30 days. During the outage planning phase, the outage schedule is determined via optimization tools, given the estimated time to perform each activity. Such temporal estimation is performed manually based on past operational experience.
The goal here is to perform the same task—but by applying the text similarity methods described in Section 2.16 to past outage data regarding activities performed during past outages and the actual completion time for each activity. In other words, we aim to identify a subset of activities performed in previous outages that are similar to the activity being queried. The temporal distribution of the completion time associated with the queried activity can then be determined by collecting the historical completion time from the selected subset of (similar) past activities.
We now give an example of temporal distribution estimation—presented here for the queried activity “valve re-packing”—using a dataset provided by an existing U.S. NPP. The dataset contains activities performed over the course of five different outages. Data cleaning was performed for each of these activities. Once the historical plant outage data were cleaned via the methods presented in Section 2.1, Section 2.2 and Section 2.3, the similarity value between the queried activity and each historical activity was determined using the methods presented in Section 2.8. This resulted in an array of similarity values having dimensionality identical to the number of historical activities and the corresponding array (with identical dimensionality) containing the activity durations (see Figure 13). Note that the temporal values were intentionally perturbed to disguise proprietary data.
The temporal distribution of the queried activity was determined by considering both the similarity and duration arrays. More precisely, we selected activities such that the similarity measure exceeded a specified threshold (typically in the 0.7–0.9 range). Of particular note here is that if a queried activity was never completed in past outages, no similar past activities will be found. This approach does not in fact perform any type of regression. The output consists of a histogram representing the duration variance to complete the queried activity upon being provided past outage data (see Figure 14). Given these results, the analysis now carries the potential to statistically analyze the actual duration of similar activities in order to identify possible outliers obtained from the similarity search, track the historical trend in activity completion time, and evaluate the impact of employed human resources on completion time.

4. Conclusions

This paper presented an overview of a computational tool designed to extract information from ER textual data generated by NPPs. This tool consists of several methods aimed at parsing sentences in search-specific text entities (e.g., measured quantities, temporal dates, and SSC). The semantic analysis tools are designed to then capture the semantic meaning of the event(s) described in the provided texts, including health information, cause–effect relations, or temporal sequences of events. Of importance here is the set of preprocessing tools devised to clear textual elements from acronyms, abbreviations, and grammatical errors. Such cleaning methods are essential for improving the performance of the knowledge extraction methods.
We presented a few applications of the methodology that extended beyond the analysis of NPP IRs and WOs. In these applications, despite the ER textual elements being short by nature, our tools successfully extracted the semantic meaning and identified the vast majority of the specified entities. We also indicated how our sentence similarity measures can be used to parse past outage databases in order to inform plant outage managers of the historical durations required to complete specific activities. Analyses of NRC reports provided a few good examples of how our methods can capture the cause–effect or temporal relations among different events.
The capabilities of the developed tools are unique in the nuclear arena, and are based on the parallel development that is taking place in the medical field. As a matter of fact, we relied on a few libraries initially developed to conduct knowledge extraction from medical textual data elements (e.g., patients’ medical reports and doctor diagnoses). Extending such methods to a different field, namely, nuclear energy, required the development of additional methods and libraries to fit the new use cases.

Author Contributions

Methodology, C.W. and D.M.; Software, C.W., J.C. and D.M.; Formal analysis, D.M.; Writing—original draft, D.M. All authors have read and agreed to the published version of the manuscript.

Funding

This research was made possible through funding by the United States Department of Energy’s Light Water Reactor Sustainability Program under contract No. DE-AC05-00OR22725.

Data Availability Statement

Data employed in this paper was either proprietary or taken from openly available documents as indicated throughout the paper.

Conflicts of Interest

The authors declare no conflict of interest.

References

  1. Banks, J.; Merenich, J. Cost Benefit Analysis for Asset Health Management Technology. In Proceedings of the Proceedings Annual Reliability and Maintainability Symposium, Orlando, FL, USA, 22–25 January 2007; pp. 95–100. [Google Scholar]
  2. Zio, E.; Compare, M. Evaluating maintenance policies by quantitative modeling and analysis. Reliab. Eng. Syst. Saf. 2013, 109, 53–65. [Google Scholar] [CrossRef]
  3. Compare, M.; Baraldi, P.; Zio, E. Challenges to IoT-Enabled Predictive Maintenance for Industry 4.0. IEEE Internet Things J. 2020, 7, 4585–4597. [Google Scholar] [CrossRef]
  4. Pipe, K. Practical prognostics for Condition Based Maintenance. In Proceedings of the 2008 International Conference on Prognostics and Health Management (PHM), Denver, CO, USA, 6–9 October 2008; pp. 1–10. [Google Scholar]
  5. Vichare, N.; Pecht, M. Prognostics and health management of electronics. In Encyclopedia of Structural Health Monitoring; Wiley: Hoboken, NJ, USA, 2009. [Google Scholar] [CrossRef]
  6. Zhang, W.; Yang, D.; Wang, H. Data-Driven Methods for Predictive Maintenance of Industrial Equipment: A Survey. IEEE Syst. J. 2019, 13, 2213–2227. [Google Scholar] [CrossRef]
  7. Zio, E. Data-driven prognostics and health management (PHM) for predictive maintenance of industrial components and systems. Risk-Inf. Methods Appl. Nucl. Energy Eng. 2024, 2024, 113–137. [Google Scholar]
  8. Coble, J.; Ramuhalli, P.; Bond, L.; Hines, J.W.; Upadhyaya, B. A review of prognostics and health management applications in nuclear power plants. Int. J. Progn. Heal. Manag. 2015, 6, 2271. [Google Scholar] [CrossRef]
  9. Zhao, X.; Kim, J.; Warns, K.; Wang, X.; Ramuhalli, P.; Cetiner, S.; Kang, H.G.; Golay, M. Prognostics and Health Management in Nuclear Power Plants: An Updated Method-Centric Review With Special Focus on Data-Driven Methods. Front. Energy Res. 2021, 9, 696785. [Google Scholar] [CrossRef]
  10. Young, T.; Hazarika, D.; Poria, S.; Cambria, E. Recent Trends in Deep Learning Based Natural Language Processing. IEEE Comput. Intell. Mag. 2018, 13, 55–75. [Google Scholar] [CrossRef]
  11. Park, J.; Kim, Y.; Jung, W. Use of a Big Data Mining Technique to Extract Relative Importance of Performance Shaping Factors from Event Investigation Reports. In International Conference on Applied Human Factors and Ergonomics; Springer: Cham, Switzerland, 2017; pp. 230–238. [Google Scholar]
  12. Zhao, Y.; Diao, X.; Huang, J.; Smidts, C. Automated identification of causal relationships in nuclear power plant event reports. Nucl. Technol. 2019, 205, 1021–1034. [Google Scholar] [CrossRef]
  13. Al Rashdan, A.; Germain, S.S. Methods of data collection in nuclear power plants. Nucl. Technol. 2019, 205, 1062–1074. [Google Scholar] [CrossRef]
  14. Zhu, X.; Goldberg, A.B.; Brachman, R.; Dietterich, T. Introduction to Semi-Supervised Learning; Morgan and Claypool Publishers: San Rafael, CA, USA, 2009. [Google Scholar]
  15. Chapelle, O.; Schlkopf, B.; Zien, A. Semi-Supervised Learning, 1st ed.; The MIT Press: Cambridge, MA, USA, 2010. [Google Scholar]
  16. Jurafsky, D.; Martin, J. Speech and Language Processing; Pearson International Edition: London, UK, 2008. [Google Scholar]
  17. Indurkhya, N.; Damerau, F.J. Handbook of Natural Language Processing, 2nd ed.; Chapman & Hall/CRC: Boca Raton, FL, USA, 2010. [Google Scholar]
  18. Clark, A.; Fox, C.; Lappin, S. The Handbook of Computational Linguistics and Natural Language Processing, 1st ed.; John Wiley & Sons: New York, NY, USA, 2012. [Google Scholar]
  19. Khurana, D.; Koli, A.; Khatter, K.; Singh, S. Natural language processing: State of the art, current trends and challenges. Multimedia Tools Appl. 2023, 82, 3713–3744. [Google Scholar] [CrossRef]
  20. Baud, R.H.; Rassinoux, A.-M.; Scherrer, J.-R. Natural Language Processing and Semantical Representation of Medical Texts. Methods Inf. Med. 1992, 31, 117–125. [Google Scholar] [CrossRef] [PubMed]
  21. Mooney, R.J.; Bunescu, R. Mining knowledge from text using information extraction. ACM SIGKDD Explor. Newsl. 2005, 7, 3–10. [Google Scholar] [CrossRef]
  22. Sbattella, L.; Tedesco, R. Knowledge Extraction from Natural Language. In Methodologies and Technologies for Networked Enterprises; Lecture Notes in Computer Science; Anastasi, G., Bellini, E., Di Nitto, E., Ghezzi, C., Tanca, L., Zimeo, E., Eds.; Springer: Berlin/Heidelberg, Germany, 2012; Volume 7200. [Google Scholar] [CrossRef]
  23. Krallinger, M.; Rabal, O.; Lourenco, A.; Oyarzabal, J.; Valencia, A. Information retrieval and text mining technologies for chemistry. Chem. Rev. 2017, 117, 7673–7761. [Google Scholar] [CrossRef]
  24. Yan, R.; Jiang, X.; Wang, W.; Dang, D.; Su, Y. Materials information extraction via automatically generated corpus. Sci. Data 2022, 9, 401. [Google Scholar] [CrossRef] [PubMed]
  25. Chasseray, Y.; Barthe-Delanoë, A.-M.; Négny, S.; Le Lann, J.-M. Knowledge extraction from textual data and performance evaluation in an unsupervised context. Inf. Sci. 2023, 629, 324–343. [Google Scholar] [CrossRef]
  26. Björne, J.; Salakoski, T. Biomedical Event Extraction Using Convolutional Neural Networks and Dependency Parsing. In Proceedings of the BioNLP 2018 Workshop, Melbourne, Australia, July 2018; pp. 98–108. Available online: https://aclanthology.org/W18-2311/ (accessed on 1 February 2024).
  27. VanGessel, F.G.; Perry, E.; Mohan, S.; Barham, O.M.; Cavolowsky, M. Natural language processing for knowledge discovery and information extraction from energetics corpora. Propellants Explos. Pyrotech. 2023, 48, 109. [Google Scholar] [CrossRef]
  28. Shetty, P.; Ramprasad, R. Machine-Guided Polymer Knowledge Extraction Using Natural Language Processing: The Example of Named Entity Normalization. J. Chem. Inf. Model. 2021, 61, 5377–5385. [Google Scholar] [CrossRef]
  29. Yang, X.; Zhuo, Y.; Zuo, J.; Zhang, X.; Wilson, S.; Petzold, L. PcMSP: A dataset for scientific action graphs extraction from polycrystalline materials synthesis procedure text. In Proceedings of the Findings of the Association for Computational Linguistics: EMNLP 2022, Abu Dhabi, United Arab Emirates, 7–11 December 2022; pp. 6033–6046. [Google Scholar]
  30. Bravo, Á.; Piñero, J.; Queralt-Rosinach, N.; Rautschka, M.; Furlong, L.I. Extraction of relations between genes and diseases from text and large-scale data analysis: Implications for translational research. BMC Bioinform. 2015, 16, 55. [Google Scholar] [CrossRef]
  31. Giorgi, J.; Bader, G.; Wang, B. A sequence-to-sequence approach for document-level relation extraction. In Proceedings of the 21st Workshop on Biomedical Language Processing, Dublin, Ireland, 26 May 2022; pp. 10–25. [Google Scholar]
  32. Weston, L.; Tshitoyan, V.; Dagdelen, J.; Kononova, O.; Trewartha, A.; Persson, K.A.; Ceder, G.; Jain, A. Named entity recognition and normalization applied to large-scale information extraction from the materials science literature. J. Chem. Inf. Model. 2019, 59, 3692–3702. [Google Scholar] [CrossRef]
  33. Alani, H.; Kim, S.; Millard, D.E.; Hall, M.J.; Weal, W.W.; Hall, M.J.; Lewis, W.; Shadbolt, N.R.; Paul, H. Automatic ontology-based knowledge extraction and tailored biography generation from the web. IEEE Intell. Syst. 2002, 18, 14–21. [Google Scholar] [CrossRef]
  34. Souili, A.; Cavallucci, D.; Rousselot, F. Natural Language Processing (NLP)—A Solution for Knowledge Extraction from Patent Unstructured Data. Procedia Eng. 2015, 131, 635–643. [Google Scholar] [CrossRef]
  35. Dagdelen, J.; Dunn, A.; Lee, S.; Walker, N.; Rosen, A.S.; Ceder, G.; Persson, K.A.; Jain, A. Structured information extraction from scientific text with large language models. Nat. Commun. 2024, 15, 1418. [Google Scholar] [CrossRef] [PubMed]
  36. Brundage, M.P.; Sexton, T.; Hodkiewicz, M.; Dima, A.; Lukens, S. Technical language processing: Unlocking maintenance knowledge. Manuf. Lett. 2021, 27, 42–46. [Google Scholar] [CrossRef]
  37. Dima, A.; Lukens, S.; Hodkiewicz, M.; Sexton, T.; Brundage, M.P. Adapting natural language processing for technical text. Appl. AI Lett. 2021, 2, 33. [Google Scholar] [CrossRef] [PubMed]
  38. Woods, C.; Selway, M.; Bikauna, T.; Stumptnerb, M.; Hodkiewiczc, M. An Ontology for Maintenance Activities and Its Application to Data Quality. Semant. Web. 2023, 2023, 3067–4281. [Google Scholar] [CrossRef]
  39. Han, X.; Gao, T.; Lin, Y.; Peng, H.; Yang, Y.; Xiao, C.; Liu, Z.; Li, P.; Zhou, J.; Sun, M. More data, more relations, more context and more openness: A review and outlook for relation extraction. In Proceedings of the 1st Conference of the Asia-Pacific Chapter of the Association for Computational Linguistics and the 10th International Joint Conference on Natural Language Processing, Suzhou, China, 4–7 December 2020; pp. 745–758. Available online: https://aclanthology.org/2020.aacl-main.75 (accessed on 1 February 2024).
  40. Zhuang, W. Architecture of Knowledge Extraction System based on NLP. In Proceedings of the ICASIT 2021: 2021 International Conference on Aviation Safety and Information Technology, Changsha, China, 18–20 December 2021; pp. 294–297. [Google Scholar]
  41. Shimorina, A.; Heinecke, J.; Herledan, F. Knowledge Extraction From Texts Based on Wikidata. In Proceedings of the 2022 Conference of the North American Chapter of the Association for Computational Linguistics: Human Language Technologies: Industry Track, Seattle, WA, USA, 10–15 July 2022; pp. 297–304. [Google Scholar]
  42. Honnibal, M.; Montani, I. SpaCy 2: Natural language understanding with Bloom embeddings. Convolutional Neural Netw. Increm. Parsing 2017, 7, 411–420. [Google Scholar]
  43. Sadvilkar, N.; Neumann, M. PySBD: Pragmatic Sentence Boundary Disambiguation. In Proceedings of Second Workshop for NLP Open Source Software (NLP-OSS), Association for Computational Linguistics, Online, November 2020; pp. 110–114. Available online: https://aclanthology.org/2020.nlposs-1.15/ (accessed on 15 January 2024).
  44. Bird, S.; Loper, E.; Klein, E. Natural Language Processing with Python; O’Reilly Media Inc.: Sebastopol, CA, USA, 2009. [Google Scholar]
  45. Sanampudi, S.K.; Kumari, G. Temporal Reasoning in Natural Language Processing: A Survey. Int. J. Comput. Appl. 2010, 1, 68–72. [Google Scholar] [CrossRef]
  46. Pustejovsky, J.; Verhagen, M.; Sauri, R.; Littman, J.; Gaizauskas, R.; Katz, G.; Mani, I.; Knippen, R.; Setzer, A. TimeBank 1.2 LDC2006T08. Web Download; Linguistic Data Consortium: Philadelphia, PA, USA, 2006. [Google Scholar]
  47. Moerchen, F. Temporal pattern mining in symbolic time point and time interval data. In Proceedings of the KDD’10: The 16th ACM SIGKDD International Conference on Knowledge Discovery and Data Mining, Nashville, TN, USA, 30 March–2 April 2010; pp. 1–2. [Google Scholar]
  48. Gopfert, J.; Kuckertz, P.; Weinand, J.M.; Kotzur, L.; Stolten, D. Measurement Extraction with Natural Language Processing: A Review. Find. Assoc. Comput. Linguist. EMNLP 2022, 2022, 2191–2215. [Google Scholar]
  49. Miller, G.A. WordNet: A Lexical Database for English. Commun. ACM 1995, 11, 39–41. [Google Scholar] [CrossRef]
  50. Altinok, D. Mastering spaCy: An End-to-End Practical Guide to Implementing NLP Applications Using the Python Ecosystem; Packt Publishing: Birmingham, UK, 2021. [Google Scholar]
  51. Fang, X.; Zhan, J. Sentiment analysis using product review data. J. Big Data 2015, 2, 5. [Google Scholar] [CrossRef]
  52. Mohri, M.; Rostamizadeh, A.; Talwalkar, A. Foundations of Machine Learning; The MIT Press: Cambridge, MA, USA, 2012. [Google Scholar]
  53. Doan, S.; Yang, E.W.; Tilak, S.S.; Li, P.W.; Zisook, D.S.; Torii, M. Extracting health-related causality from twitter messages using natural language processing. BMC Med. Inform. Decis. Mak. 2019, 19, 71–77. [Google Scholar] [CrossRef] [PubMed]
  54. Li, Z.; Ding, X.; Liu, T.; Hu, J.E.; Van Durme, B. Guided Generation of Cause and Effect. In Proceedings of the Twenty-Ninth International Joint Conference on Artificial Intelligence IJCAI-20, Yokohama, Japan, 7–15 January 2020. [Google Scholar]
  55. Hendrickx, I.; Kim, S.; Kozareva, Z.; Nakov, P.; Séaghdha, D.Ó.; Padó, S.; Pennacchiotti, M.; Romano, L.; Szpakowicz, S. SemEval-2010 Task 8: Multi-Way Classification of Semantic Relations between Pairs of Nominals. In Proceedings of the 5th International Workshop on Semantic Evaluation, Uppsala, Sweden, 15–16 July 2010; pp. 33–38. [Google Scholar]
  56. Wang, J.; Dong, Y. Measurement of Text Similarity: A Survey. Information 2020, 11, 421. [Google Scholar] [CrossRef]
  57. Gomaa, W.H.; Fahmy, A. A survey of text similarity approaches. Int. J. Comput. Appl. 2013, 68, 13–18. [Google Scholar]
  58. Navigli, R.; Martelli, F. An Overview of Word and Sense Similarity. Nat. Lang. Eng. 2019, 25, 693–714. [Google Scholar] [CrossRef]
  59. Li, Y.; McLean, D.; Bandar, Z.; O’Shea, J.; Crockett, K. Sentence similarity based on semantic nets and corpus statistics. IEEE Trans. Knowl. Data Eng. 2006, 18, 1138–1150. [Google Scholar] [CrossRef]
  60. Li, Y.; Bandar, Z.; McLean, D. An approach for measuring semantic similarity between words using multiple information sources. IEEE Trans. Knowl. Data Eng. 2003, 15, 871–882. [Google Scholar] [CrossRef]
Figure 2. Example of spell checking (“pmp”) and acronym (HPI) and abbreviation (“refurb”) handling.
Energies 17 01785 g002
Figure 3. Tokenization process: The tokens obtained from the provided text are highlighted in blue.
Energies 17 01785 g003
Figure 4. POS tagging and dependency parsing.
Energies 17 01785 g004
Figure 5. Example of coreference resolution (indicated as an arrow): the pronoun “they” (highlighted in green) refers to the previously defined textual element “cracks” (highlighted in blue).
Energies 17 01785 g005
Figure 6. Example identification of temporal (blue) and approximation (orange) attributes.
Energies 17 01785 g006
Figure 7. Example analysis of sentences containing temporal entities (highlighted in purple) identified from https://www.nrc.gov/docs/ML2320/ML23207A076.pdf (accessed on 4 February 2024).
Energies 17 01785 g007
Figure 8. Example of identifying measured quantities from text taken from https://www.nrc.gov/reading-rm/doc-collections/event-status/event/2020/index.html (accessed on 4 February 2024).
Energies 17 01785 g008
Figure 9. Example of identifying location attributes from text taken from https://www.nrc.gov/reading-rm/doc-collections/index.html#event (accessed on 4 February 2024).
Energies 17 01785 g009
Figure 10. Graphical representation of elemental cause–effect structures: direct cause–effect association (left), multiple causes and single effect association (center), multiple effects and single cause association (right).
Energies 17 01785 g010
Figure 11. Example of identifying cause–effect relations (source: NRC LER 2021-001-00, “Atmospheric Steam Dump Valves Inoperable Due to Relay Failure”).
Energies 17 01785 g011
Figure 12. Illustration of the sentence similarity calculation.
Energies 17 01785 g012
Figure 13. Scatter plot of all past outage activities in terms of actual duration and similarity values. Activities similar to the queried one (i.e., “valve re-packing”) are highlighted in the red box.
Energies 17 01785 g013
Figure 14. Example similarity search results: a histogram representing the duration variance to complete the queried activity by selecting the activities highlighted in red in Figure 13.
Energies 17 01785 g014
Table 1. Examples of date, time, duration, and frequency temporal expression.
DateTimeDurationFrequency
11/3/2005
3 November 2005
Yesterday
Tomorrow
Thursday
Last Week
Friday morning
12:30 a.m.
3 p.m.
12:30
12:00 a.m.
20 min ago
10 h
last 5 months
2 days
2 days
couple of days
1988–1992
every Friday
every 4 h
every month
twice a year
thrice a day
Table 2. Portion of the list of approximations that might be associated with a temporal attribute.
Approximation
AboutAround
AlmostClosely
NearlyCirca
RoughlyClose
ApproximatelyMore or less
NearlyRoughly
Table 3. List of relations that indicate a temporal attribute.
Relations
[verb] + [at, on] + “time instance”
[verb] + [at, on] + [approximation] + “time instance”
[verb] + for + “time duration”
[verb] + for + [approximation] + “time duration”
[noun] + [verb] + “time duration”
[noun] + [verb] + [approximation] “time duration”
Table 4. Example of keywords and structures that indicate the order of events.
KeywordsStructures
VerbsAdjectivesAdverbs
Antedate
Follow
Postdate
Precede
Predate
Succeed
After
Before
Consecutive
Earlier
Following
Former
Later
Next
Past
Precedent
Previous
Afterward
Consecutively
Consequently
Directly
Hereafter
Later
Next
Previously
Subsequently
Successively
Then
Soon after
After that
After a while
Table 5. List of sample keywords that indicate the concurrence and coincidence of events.
KeywordsStructures
VerbsAdjectivesAdverbs
Accompany
Conform
Correspond
Harmonize
Parallel
Accompanying
Attending
Coexistent
Concomitant
Concurrent
Imminent
Simultaneous
Synchronic
When
Thereupon
While
During
At that point
At that moment
At that time
At that instant
In the end
On that occasion
Table 6. List of relations that indicate the order of events.
Relations
Event_1 + [order verb] + Event_2
Event_1 + [verb] + [adverb] + Event_2
Event_1 + [verb] + [adjective] + Event_2
Table 7. List of relations that indicate the concurrence and coincidence of events.
Relations
Event_1 + [verb] + [adverb] + Event_2
Event_1 + [verb] + [adjective] + Event_2
Table 8. Examples of quantitative observations.
one half
three halves
0.1
10%
3 cm
multiplied by 2
75–80%
4:1 ratio
5th percentile
within 5th and 95th percentile
the 3rd quartile
scored 6 on a 7 point scale
between three and four
Table 9. List of sentence relations for quantitative observation.
Relation
[neutral verb] + “quantity value”“quantity value” + [negative noun]
[neutral verb] + “quantity delta value”“quantity delta value” + [negative noun]
“quantity value” + [neutral noun][positive verb] + “quantity value”
“quantity delta value” + [neutral noun][positive verb] + “quantity delta value”
[negative verb] + “quantity value”“quantity value” + [positive noun]
[negative verb] + “quantity delta value”“quantity delta value” + [positive noun]
Table 10. Example keywords that indicate a location attribute.
ProximityLocated AboveLocated Below
Across from
Adjacent
Alongside
Approaching
Beside
Close
Close by
Contiguous
Distant from
In proximity
Near
Nearby
Next to
Above
Anterior
Atop
Beyond
High
On top of
Over
Overhead
Upward
Below
Beneath
Bottom
Deep
Down
Down from
Downward
Low
Posterior
Under
Underneath
Table 11. List of relations that indicate a location attribute.
Relations
[verb] + “location keyword” + noun
Subj + “location keyword” + obj
Table 12. Class and groups of nuclear-related keywords.
ClassGroupExamples
Mechanical componentsFastenersAnchor bolt, cap screw, latch, pin
Rotary elementsCam, shaft, gear, pulley
StructuralBeam, column, sleeve, socket
Purpose-specificFilter, manifold, blade
Non-mechanical componentsElectrical/electronicAmplifier, relay, buzzer, capacitor
Hydraulic/PneumaticCoupler, filter, pipe
AssetsMechanicalEngine, vessel
ElectricalAC bus, alternator, generator, transformer
Hydraulic/PneumaticPump, valve, condenser, fan
ElectronicComputer, tablet, controller
I&CDigital meter, FPGA, transmitter, sensor
Nuclear fuelFuel rod, control blade
NPP elementsSystemsFeedwater, switchyard, feedwater
ArchitecturalContainment, control room, pump house
Tools and treatmentsToolsJigsaw, solder gun, tape, crane
TreatmentsBolting, riveting, grinding, infrared testing
OperandsElectricalAC current, electromagnetic
Hydraulic/PneumaticCompressed air, steam, gasoline, water
CompoundsMaterialsPlastic, plywood, concrete, polyethylene
ReactionsChemical reactionCombustion, oxidation, evaporation
Degradation mechanismCorrosion, dissolution, fatigue
Failure typeLeak, rupture, brittle fracture
Table 13. Examples of keywords that indicate a conjecture observation.
Keyword
ExpectedHypothetical(ly)Anticipated
PossibleLikelyForeseen
ProbableUnlikelyImpending
FeasiblePotentialUpcoming
PlausibleUncertainBrewing
PresumedForthcomingLooming
Table 14. List of relations that indicate a conjecture observation.
RelationExample
Subj + “future verb”The pump will fail
Subj + “conjecture keyword” + “verb”The pump is likely to fail
Conditional + subj + “verb” + “conjecture keyword” + “verb”If the pump overheats, it is expected to fail
Subj + “past verb” + hypothesisThe pump failed because it overheated
Table 15. List of sentence relations for making qualitative observations.
RelationExample
Subj + “status verb”Pump was not functioning
Subj + “status verb” + “status adjective”Pump performance was acceptable
Subj + “status verb” + “status adverb” + objPump was partially working
“status adjective” + subj + “status verb”Unresponsive pump was observed
“status noun” + “prep” + “status verb”Deterioration of pump impeller was observed
Table 16. Partial list of keywords that indicate negative information.
NounsVerbsAdjectivesAdverbs
BreakdownDisabledUnacceptableInaccurately
CollapseRejectImproperErroneously
DeclineStopInadmissibleWrongly
DeficiencyBlockUndesirableInadequately
DeteriorationHaltUnsatisfactoryIncompletely
FailingOpposeUnacceptablePartially
DecayInhibitUnsuitableImperfectly
Table 17. Partial list of keywords that indicate positive information.
NounsVerbsAdjectivesAdverbs
Accomplishment
Achievement
Enhancement
Progression
Solution
Enable
Empower
Facilitate
Permit
Set up
Endow
Let
Make
Ready
Fit
Capable
Apt
Available
Adequate
Competent
Proficient
Accurately
Nicely
Perfectly
Precisely
Properly
Rightly
Accurately
Appropriately
Table 18. Partial list of keywords that indicate neutral information.
NounsVerbsAdjectives
Analysis
Assessment
Diagnosis
Evaluation
Exploration
Investigation
Probe
Inspect
Monitor
Measure
Witness
Examine
Note
Recognize
View
Watch
Acceptable
Usable
Attainable
Consistent
Constant
Stable
Unaffected
Uninterrupted
Untouched
Table 19. Partial list of keywords that indicate a cause–effect paragraph.
NounsVerbsAdverbs
Augment
Backfire
Begin
Bring about
Build-up
Cause
Change
Combat
Compensate
Counter
Create
Deactivate
Decelerate
Decrease
Augment
Backfire
Begin
Bring about
Build-up
Cause
Change
Combat
Compensate
Counter
Create
Deactivate
Decelerate
Decrease
Afterwards
Consequently
Eventually
Finally
Hence
So
Subsequently
Then
Therefore
Thus
Ultimately
Table 20. List of relations that indicate a cause–effect paragraph.
RelationsDAG
Event_A + “causal verb” (active) + Event_BA → B
Event_A + “causal verb” (passive) + Event_BB → A
Event_A + [to be] a “causal noun” + Event_BA → B
Event_A + [to be] a “effect noun” + Event_BB → A
The “causal noun” of + Event_A + [to be] + Event_BB → A
The “effect noun” of + Event_A + [to be] + Event_BA → B
Clause_A; + “cause/effect structure” + Clause_BA → B or B → A
“Cause/effect structure” + Clause_A; + Clause_BA → B or B → A
Clause_A. “Cause/effect structure” + Clause_BA → B or B → A
Event_A + (verb, “causal adverb”) + Event_BA → B
Table 21. List of structures that indicate a cause–effect paragraphs.
Structures
In response to
Attributed to
As a result of
For this reason
In consequence
In this way
In such a way
Table 22. Example of information extraction. The following are identified in the text: nuclear entities (highlighted in blue), health status (highlighted in yellow), keywords indicating health status (highlighted in red).
A leak was noticed from the RCP pump 1A. RCP pump 1A pressure gauge was found not operating. RCP pump 1A pressure gauge was found inoperative. RCP pump 1A had signs of past leakage. The Pump is not experiencing enough flow during test. Slight Vibrations is noticedlikely from pump shaft deflection. Pump flow meter was not responding. Rupture of pump bearings caused pump shaft degradation. Rupture of pump bearings caused pump shaft degradation and consequent flow reduction. Power supply has been found burnout. Pump test failed due to power supply failure. Pump inspection revealed excessive impeller degradation. Pump inspection revealed excessive impeller degradation likely due to cavitation. Oil puddle was found in proximity of RCP pump 1A. Anomalous vibrations were observed for RCP pump 1A. Several cracks on pump shaft were observed; they could have caused pump failure within few days. RCP pump 1A was cavitating and vibrating to some degree during test. This is most likely due to low flow conditions rather than mechanical issues. Cavitation was noticed but did not seem severe. The pump shaft vibration appears to be causing the motor to vibrate as well. Pump had noise of cavitation which became faint after OPS bled off the air. Low flow conditions most likely causing cavitation. The pump shaft deflection is causing the safety cage to rattle. The Pump is not experiencing enough flow for the pumps to keep the check valves open during test. Pump shaft made noise. Vibration seems like it is coming from the pump shaft. Visible pump shaft deflection. Pump bearings appear in acceptable condition. Pump made noisesnot enough to affect performance. Pump shaft has a slight deflection.
Table 23. Extracted SSC entities and their health status from the text provided in Table 22. Misidentifications are highlighted in green.
SSC EntitiesStatus/Health StatusSSC EntitiesStatus/Health Status
PumpA leak from rcpImpellerExcessive degradation
PumpNot gauge operatingPumpFound in proximity of rcp (Oil puddle)
PumpGauge inoperativePumpAnomalous vibrations for 1a
Pump1a signs of past leakagePump shaftSeveral cracks
PumpNot enough flow during testPumpFailure
Pump shaftDeflectionPumpcavitating
PumpNot meter respondingPump shaftVibration
Pump bearingsRuptureMotorVibrate
Pump shaftDegradationPumpNoise of cavitation …
Pump bearingsRupturePump shaftDeflection
Pump shaftDegradationPumpNot enough flow for the pumps
Power supplyBurnoutPump shaftNoise
PumpTestPump shaftVibration
Pump supplyFailurePump shaftDeflection
PumpInspectionPump bearingsAcceptable condition
ImpellerExcessive degradationPumpNoises
PumpInspectionPump shaftA slight deflection
Table 24. Causal relations identified (nuclear keywords are highlighted in blue while health status are highlighted in yellow).
Text after Rule-Based NERIdentified Cause–Effect Relations
Rupture of pump bearings caused pump shaft degradation.(pump bearings: Rupture) “caused” (pump shaft: degradation)
Rupture of pump bearings caused pump shaft degradation and consequent flow reduction.(pump bearings: Rupture) “caused” (pump shaft: degradation)
Pump test failed due to power supply failure.(Pump: test failed) “due to” (power supply: failure)
Pump inspection revealed excessive impeller degradation.(Pump: inspection) “revealed” (impeller: degradation)
Pump inspection revealed excessive impeller degradation likely due to cavitation.(Pump: inspection) “revealed” (impeller: degradation)
Several cracks on pump shaft were observed; they could have caused pump failure within few days.(pump shaft: Several cracks) “caused” (pump: failure)
The pump shaft deflection is causing the safety cage to rattle.None
Table 25. Example of coreference identification.
Coreference ExamplesIdentified Coreference
Several cracks on pump shaft were observed; they could have caused pump failure within few days.(Several cracks, they)
Vibration seems like it is coming from the pump shaft.(Vibration, it)
Table 26. Identified conjecture sentences.
Pump Inspection Revealed Excessive Impeller Degradation Likely Due to Cavitation.
Several cracks on pump shaft were observed; they could have caused pump failure within few days.
Vibration seems like it is coming from the pump shaft.
Disclaimer/Publisher’s Note: The statements, opinions and data contained in all publications are solely those of the individual author(s) and contributor(s) and not of MDPI and/or the editor(s). MDPI and/or the editor(s) disclaim responsibility for any injury to people or property resulting from any ideas, methods, instructions or products referred to in the content.

