
Energy Harnessing Performance of Oscillating Foil Submerged in the Wake of a Fixed Cylinder

Abstract
:1. Introduction
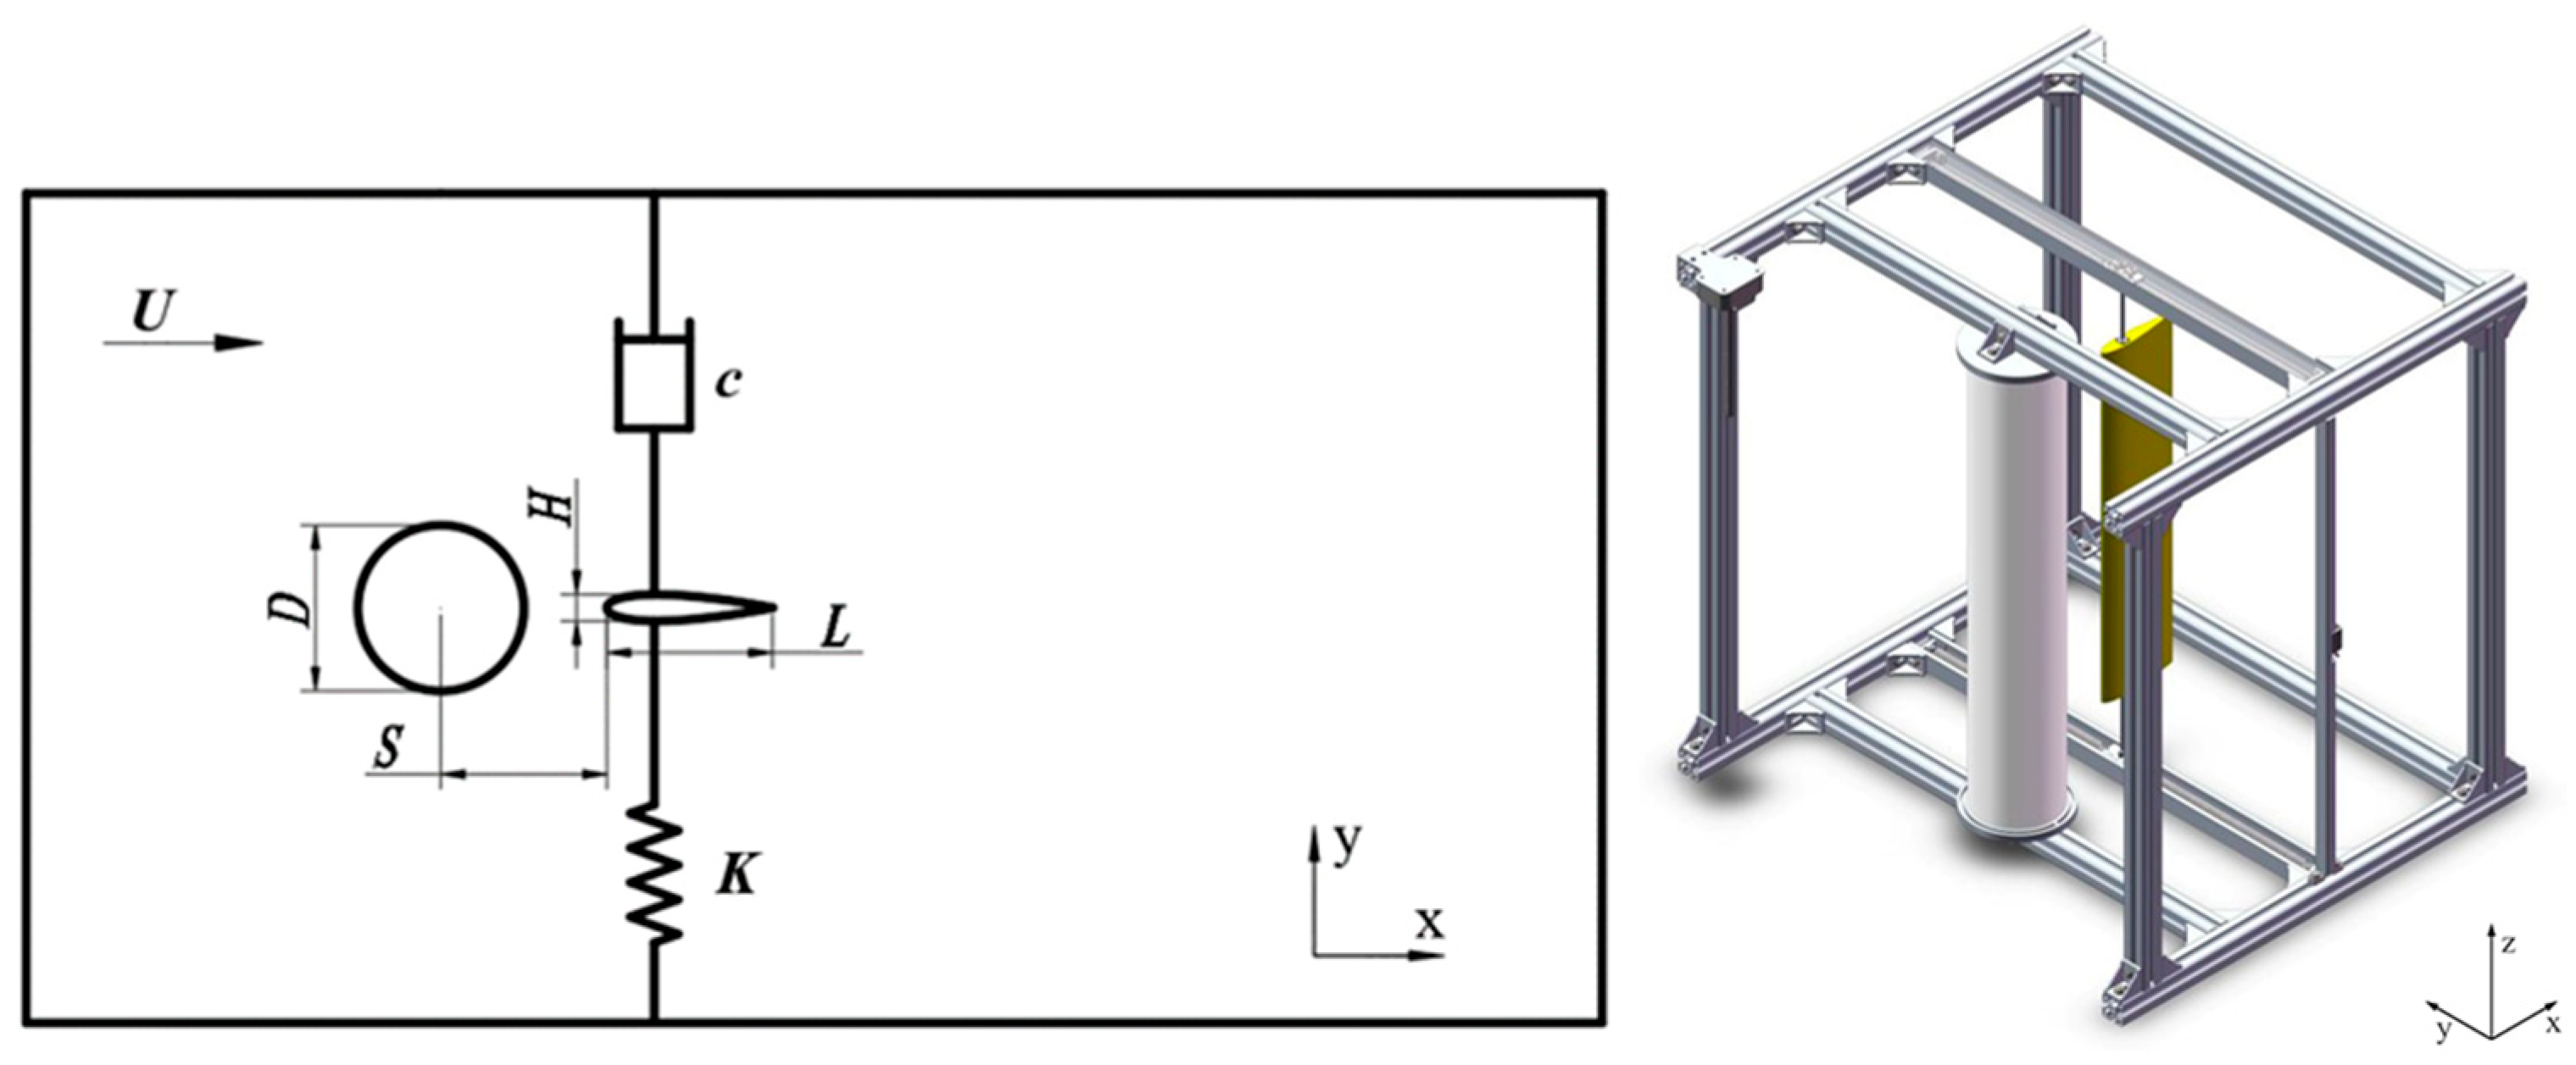
2. Physical Model
3. Numerical Method and Mathematical Modeling
3.1. Governing Equations
3.1.1. Fluid Dynamics
3.1.2. Turbulence Model and Numerical Schemes
3.1.3. Motion Kinematics
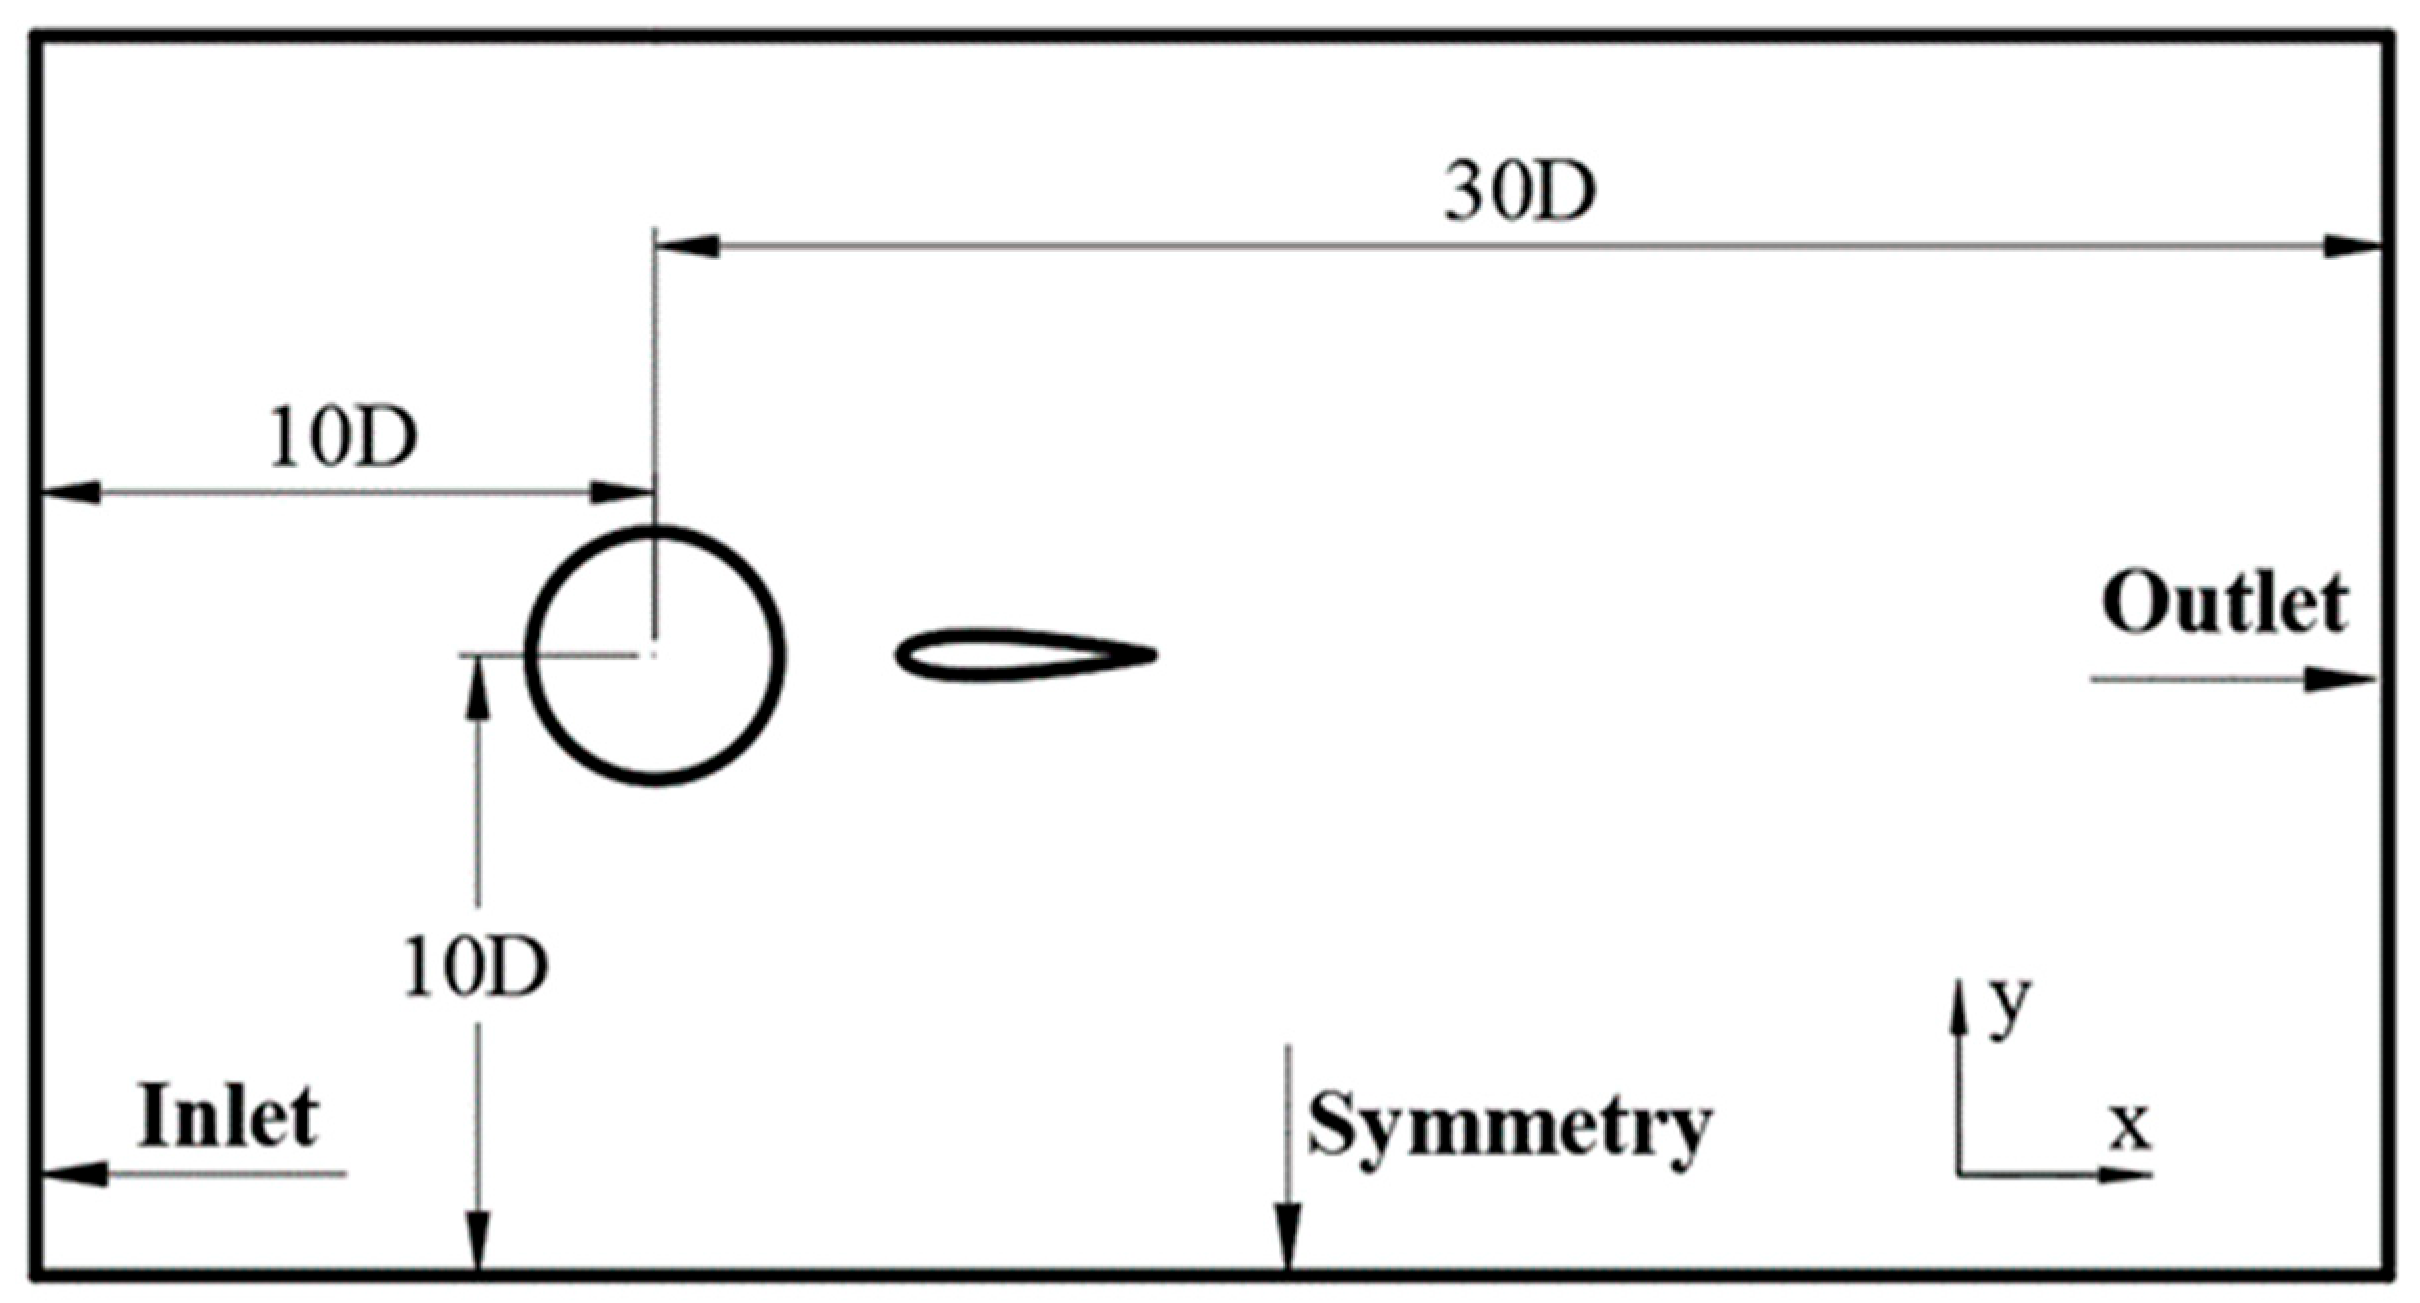
3.2. Computational Domain
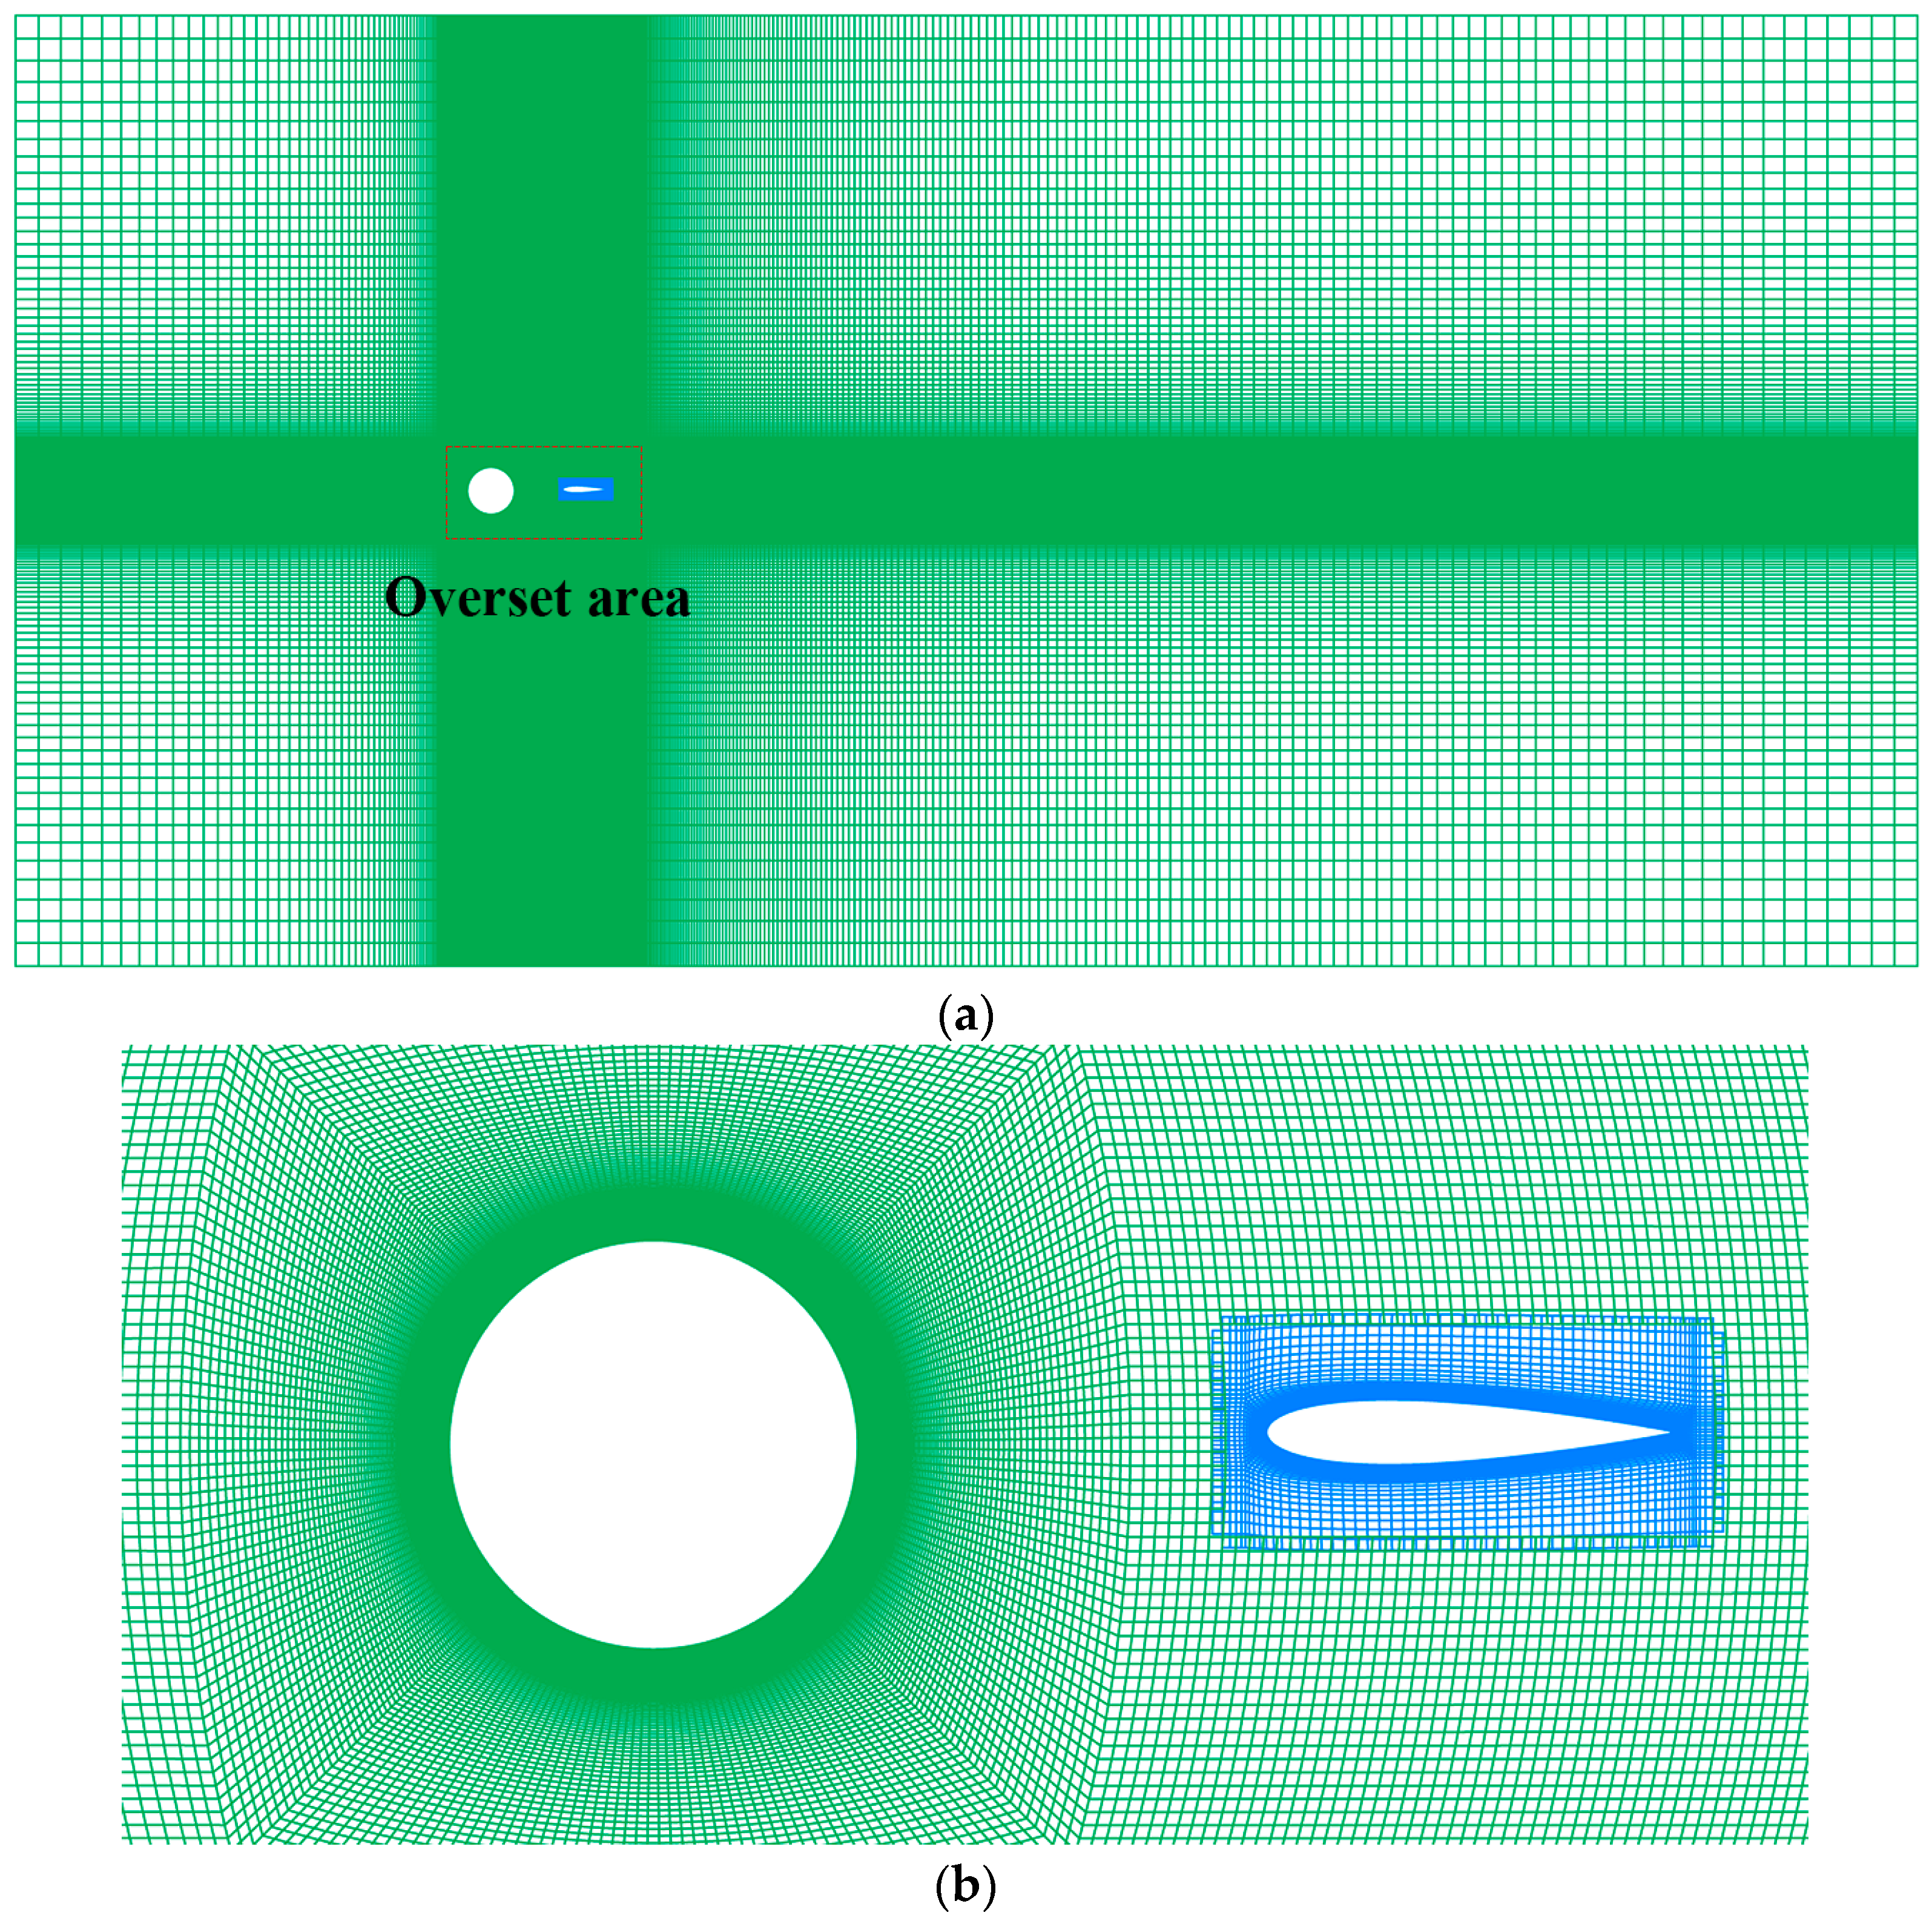
3.3. Grid Generation
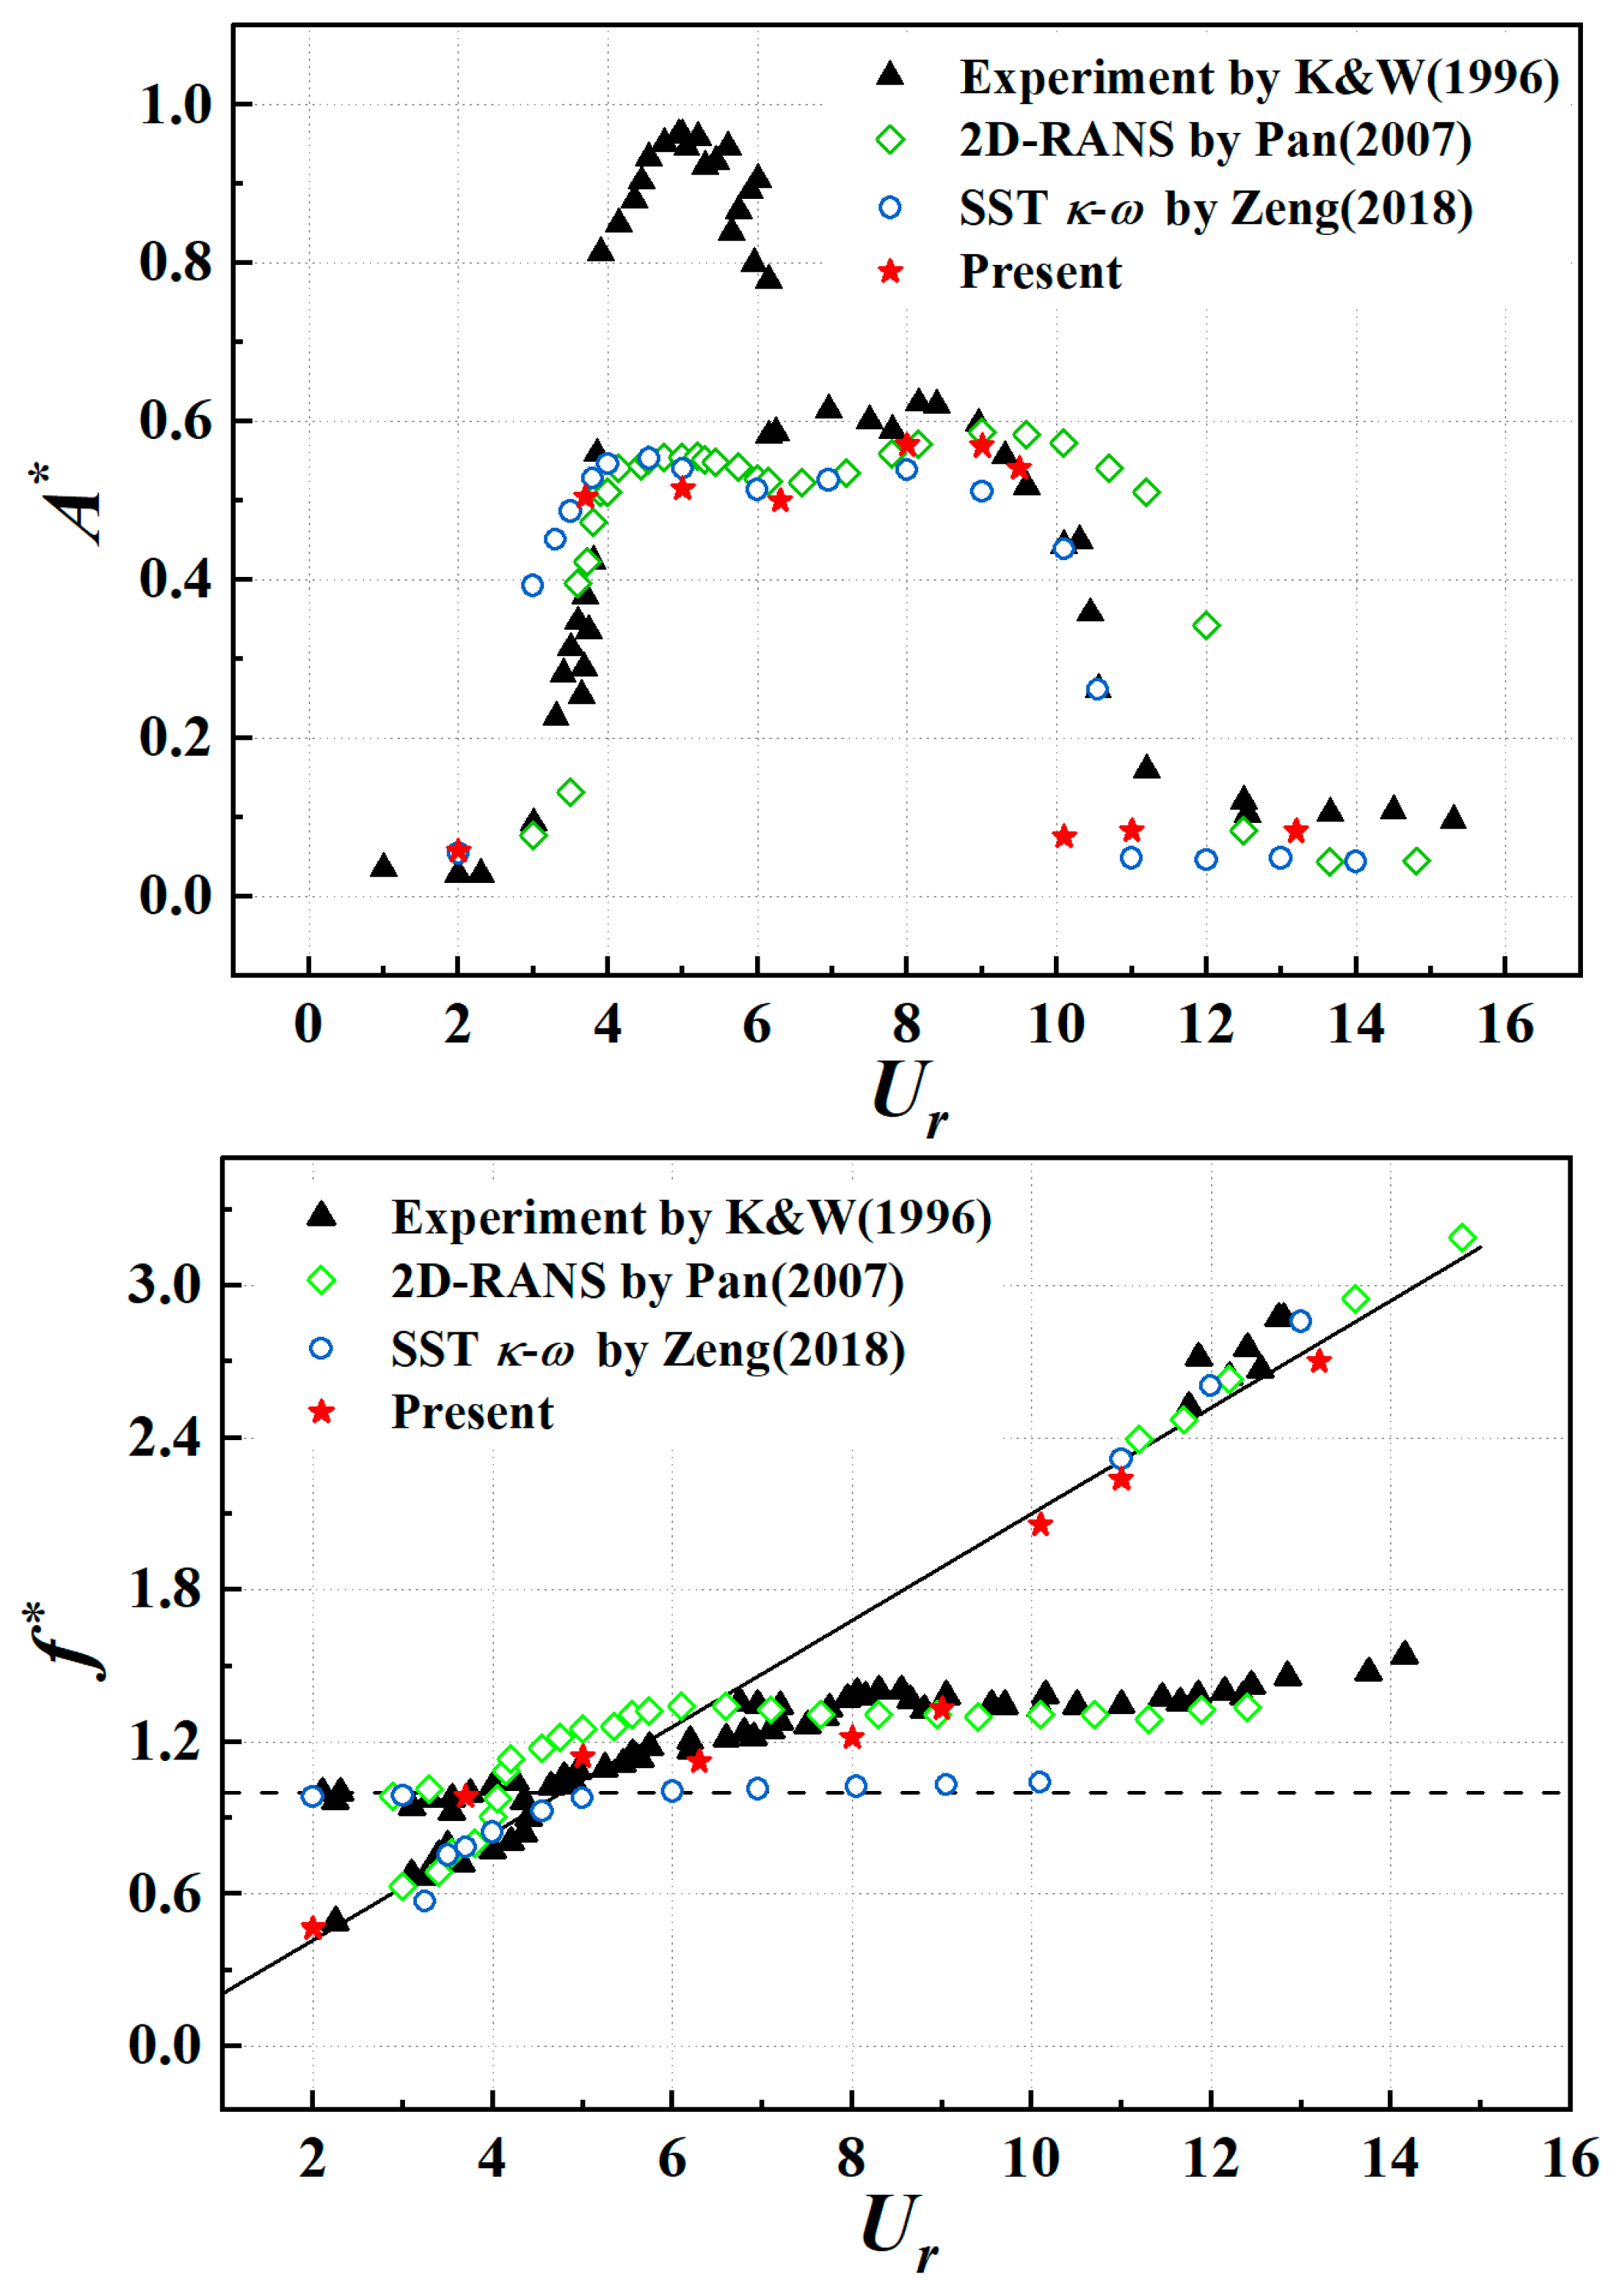
3.4. Validation of the Numerical Model
4. Results and Analysis
4.1. Amplitude Responses
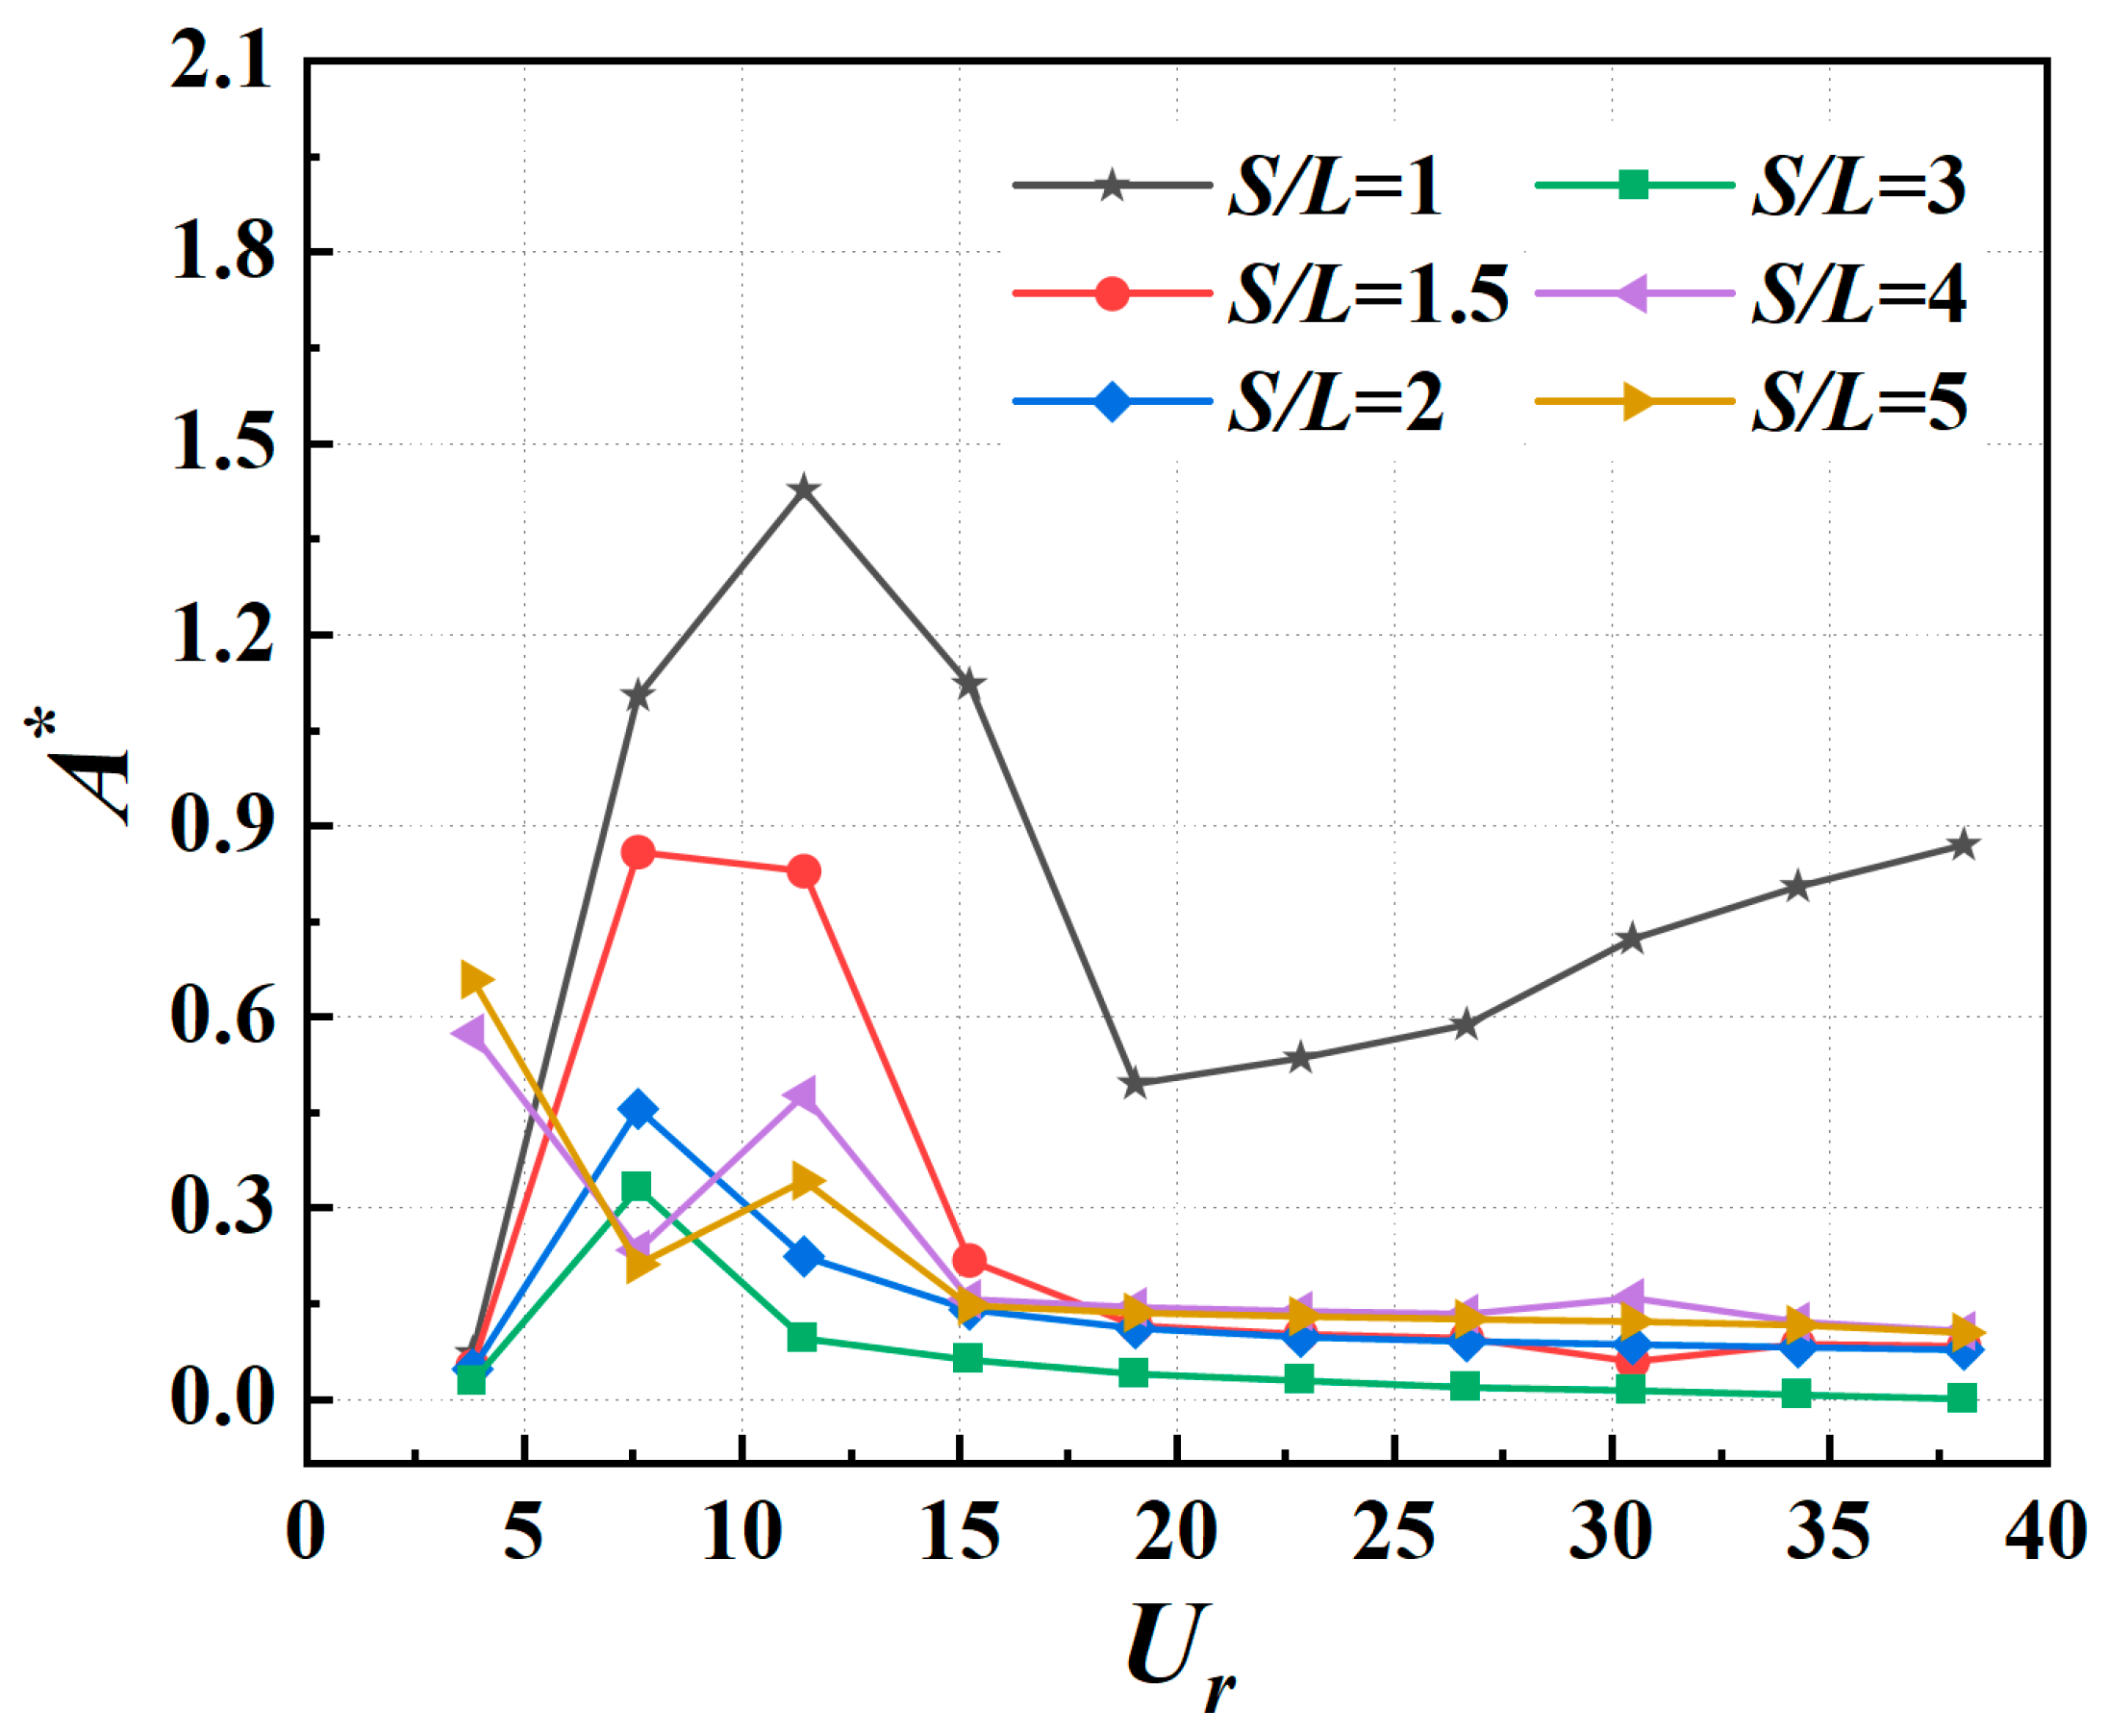
- At S/L ≤ 3.0, the amplitude ratio first increases with an increasing reduced velocity and then drops suddenly to around 0.15 at S/L = 1.5–3.0. The A* drops earlier as the S/L increases because the effect of vortexes shedding from the cylinder is weaker when the gap is larger between the cylinder and the foil at the same Ur. Bokaian et al. investigated the behavior of an oscillating circular cylinder submerged in the wake of a stationary rigid body with various values of cylinder separation ranging from 0.59 to 3, and the system mass-damping ratio is 0.109 [47]. The cylinder exhibited four types of resonances, including vortex-resonance (S/L > 2.5), galloping (S/L = 0.59), combined vortex-resonance and galloping (S/L = 1.0), and separated vortex-resonance and galloping (1.5 < S/L < 2.5). In the present study, the amplitude ratio at S/L = 1.0 first increases until Ur = 11.43 and declines at Ur = 11.43–19.04; then, it rises at a smaller rate again as Ur grows. The trend at S/L = 1.0 can be divided into combined vortex-resonance and galloping, which is in good agreement with the previous conclusion. However, the amplitude resonances at the other space ratios in Figure 6 are different from Bokaian’s results, which can be attributed to the shape differences in oscillators between the two investigations.
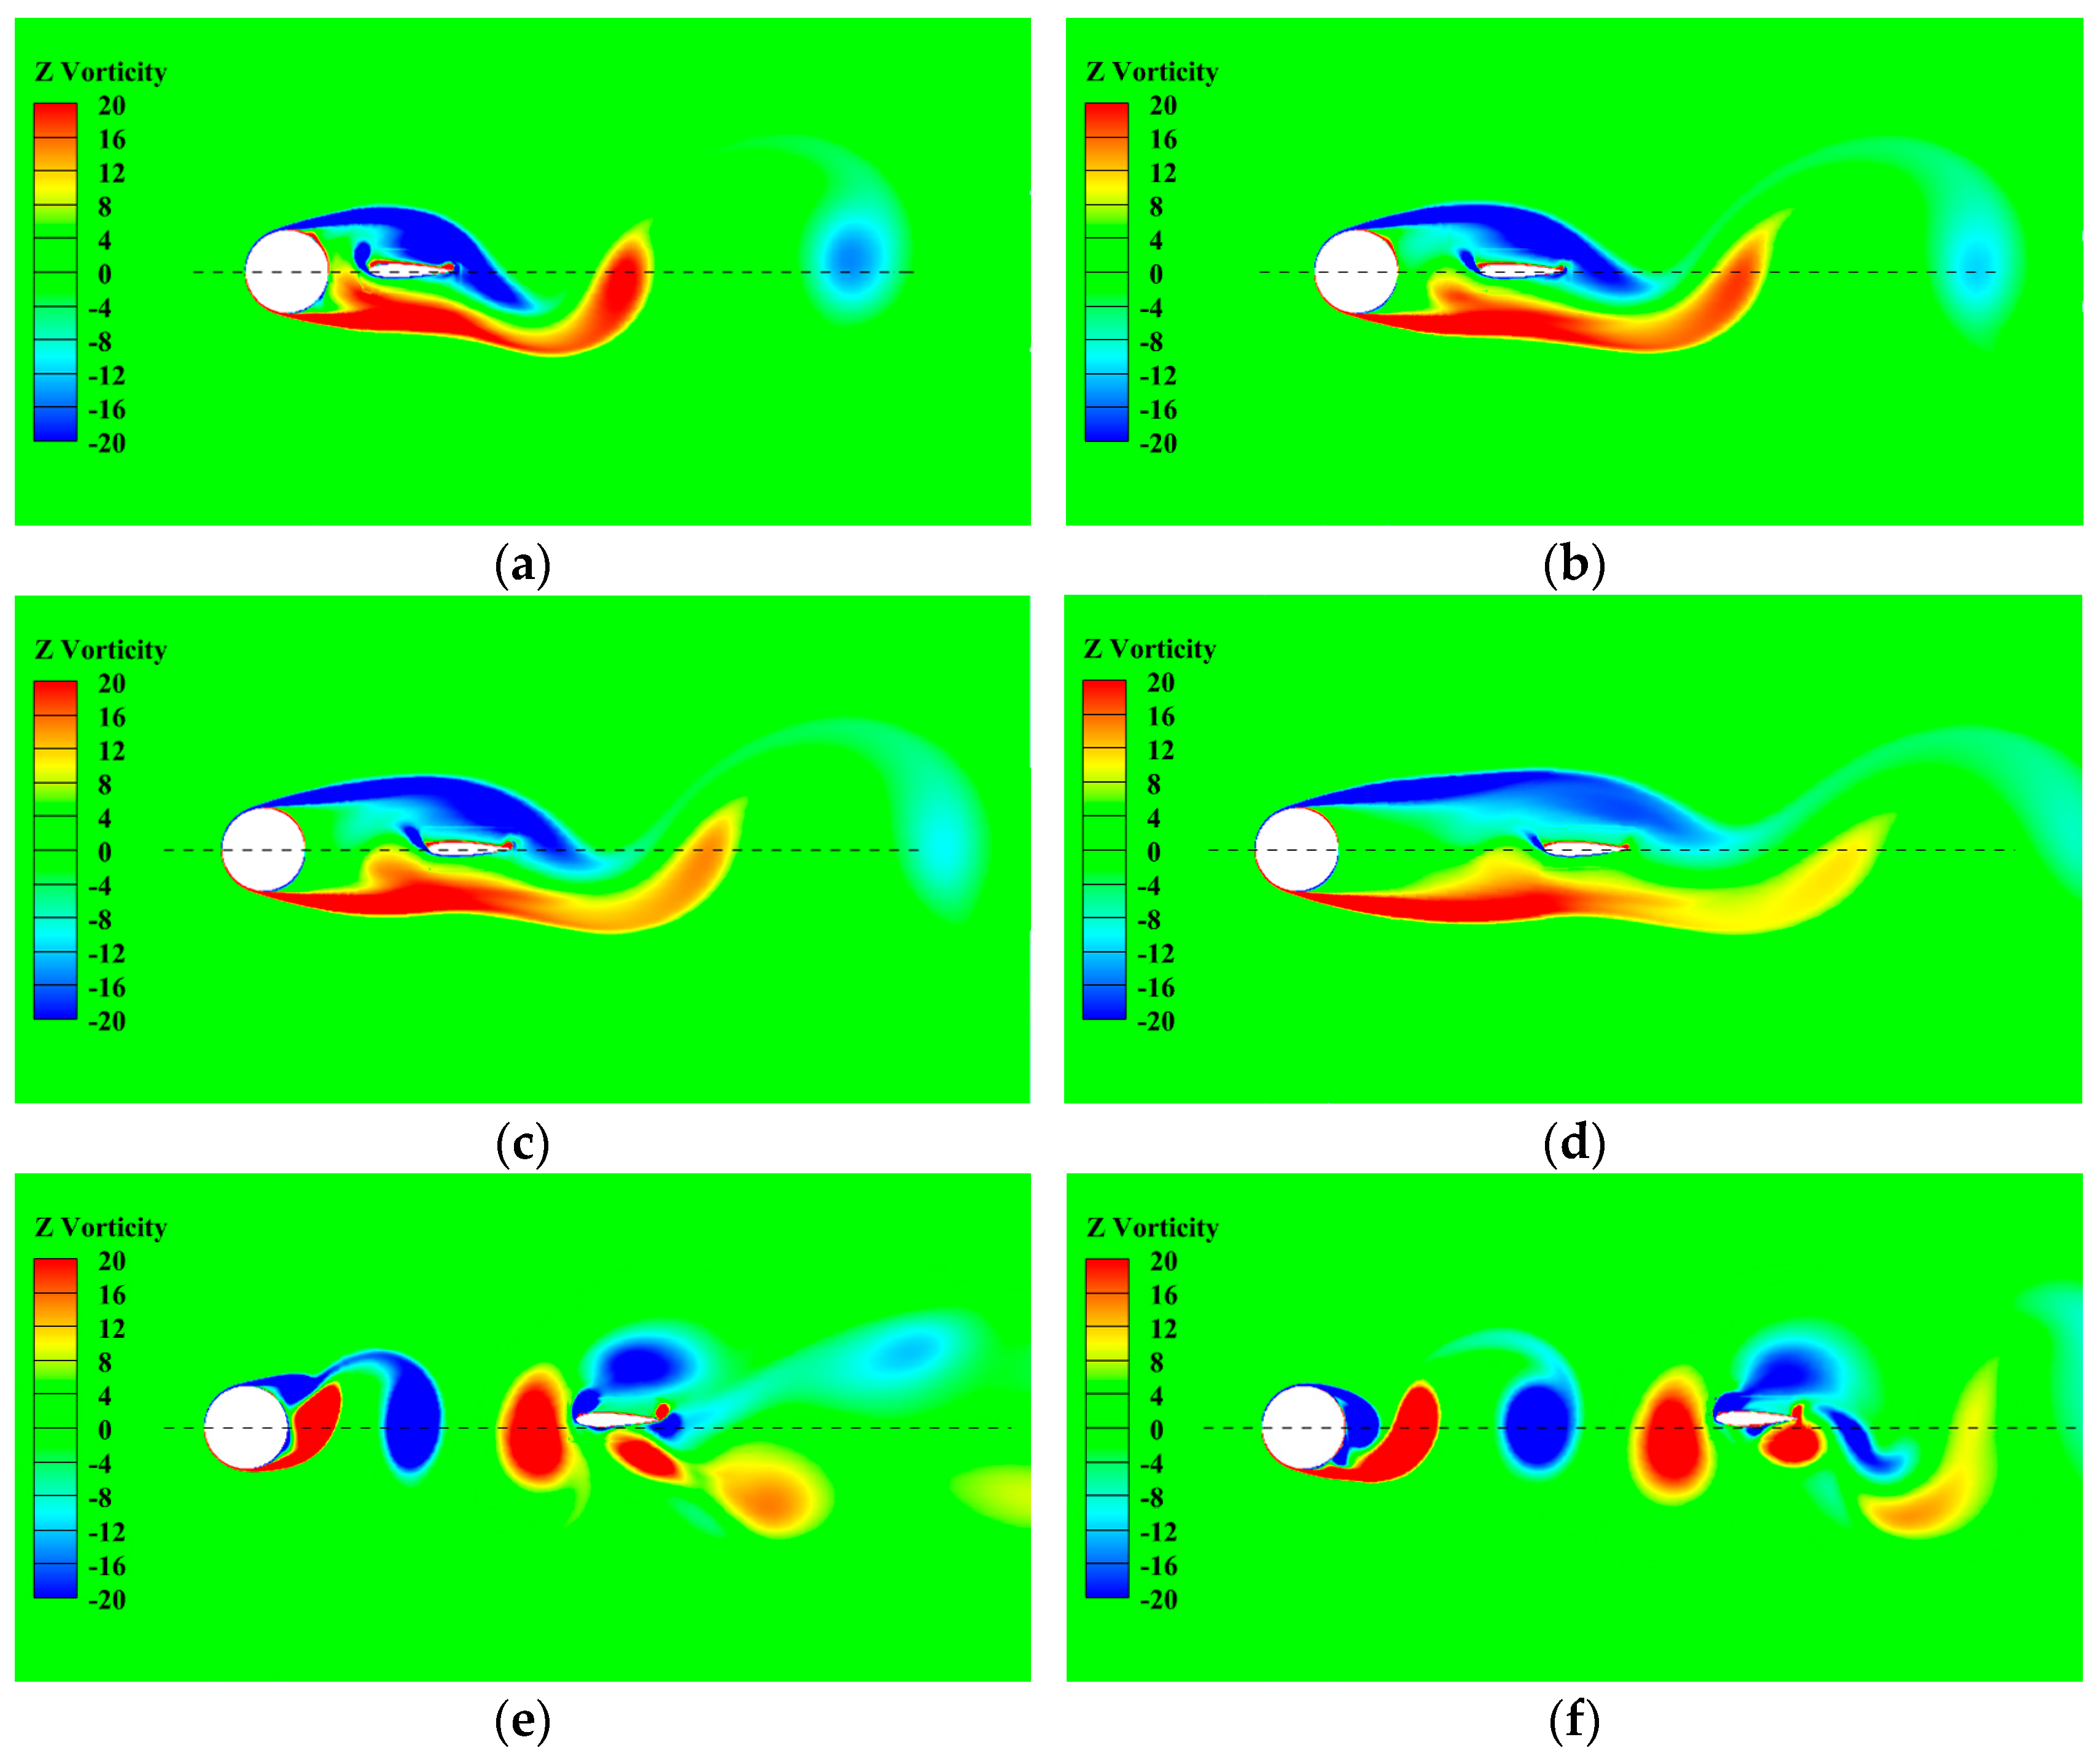
- The amplitude ratios of the foil reach about 0.6 when S/L = 4.0 and S/L = 5.0 at Ur = 3.81, which are obvious differences from the conditions on which S/L ≤ 3.0 corresponds to A* < 0.1. Figure 7 shows the vorticity contours at the moment, pointing at the maximum displacement of the foil at Ur = 3.81 and every space ratio, respectively. The dashed line in the picture is the initial position of the foil. Figure 7a–d shows that the vortex shedding position is located downstream of the foil, and the shear layer affected by the foil is prolonged by the present configuration, which is considered as a whole body consisting of the cylinder. As shown in Figure 7e,f, the vortexes shed in the gap between two rigid bodies and flow downstream along the direction of the incoming velocity, finally forcing the foil to oscillate in the y-direction with a higher amplitude than the former.
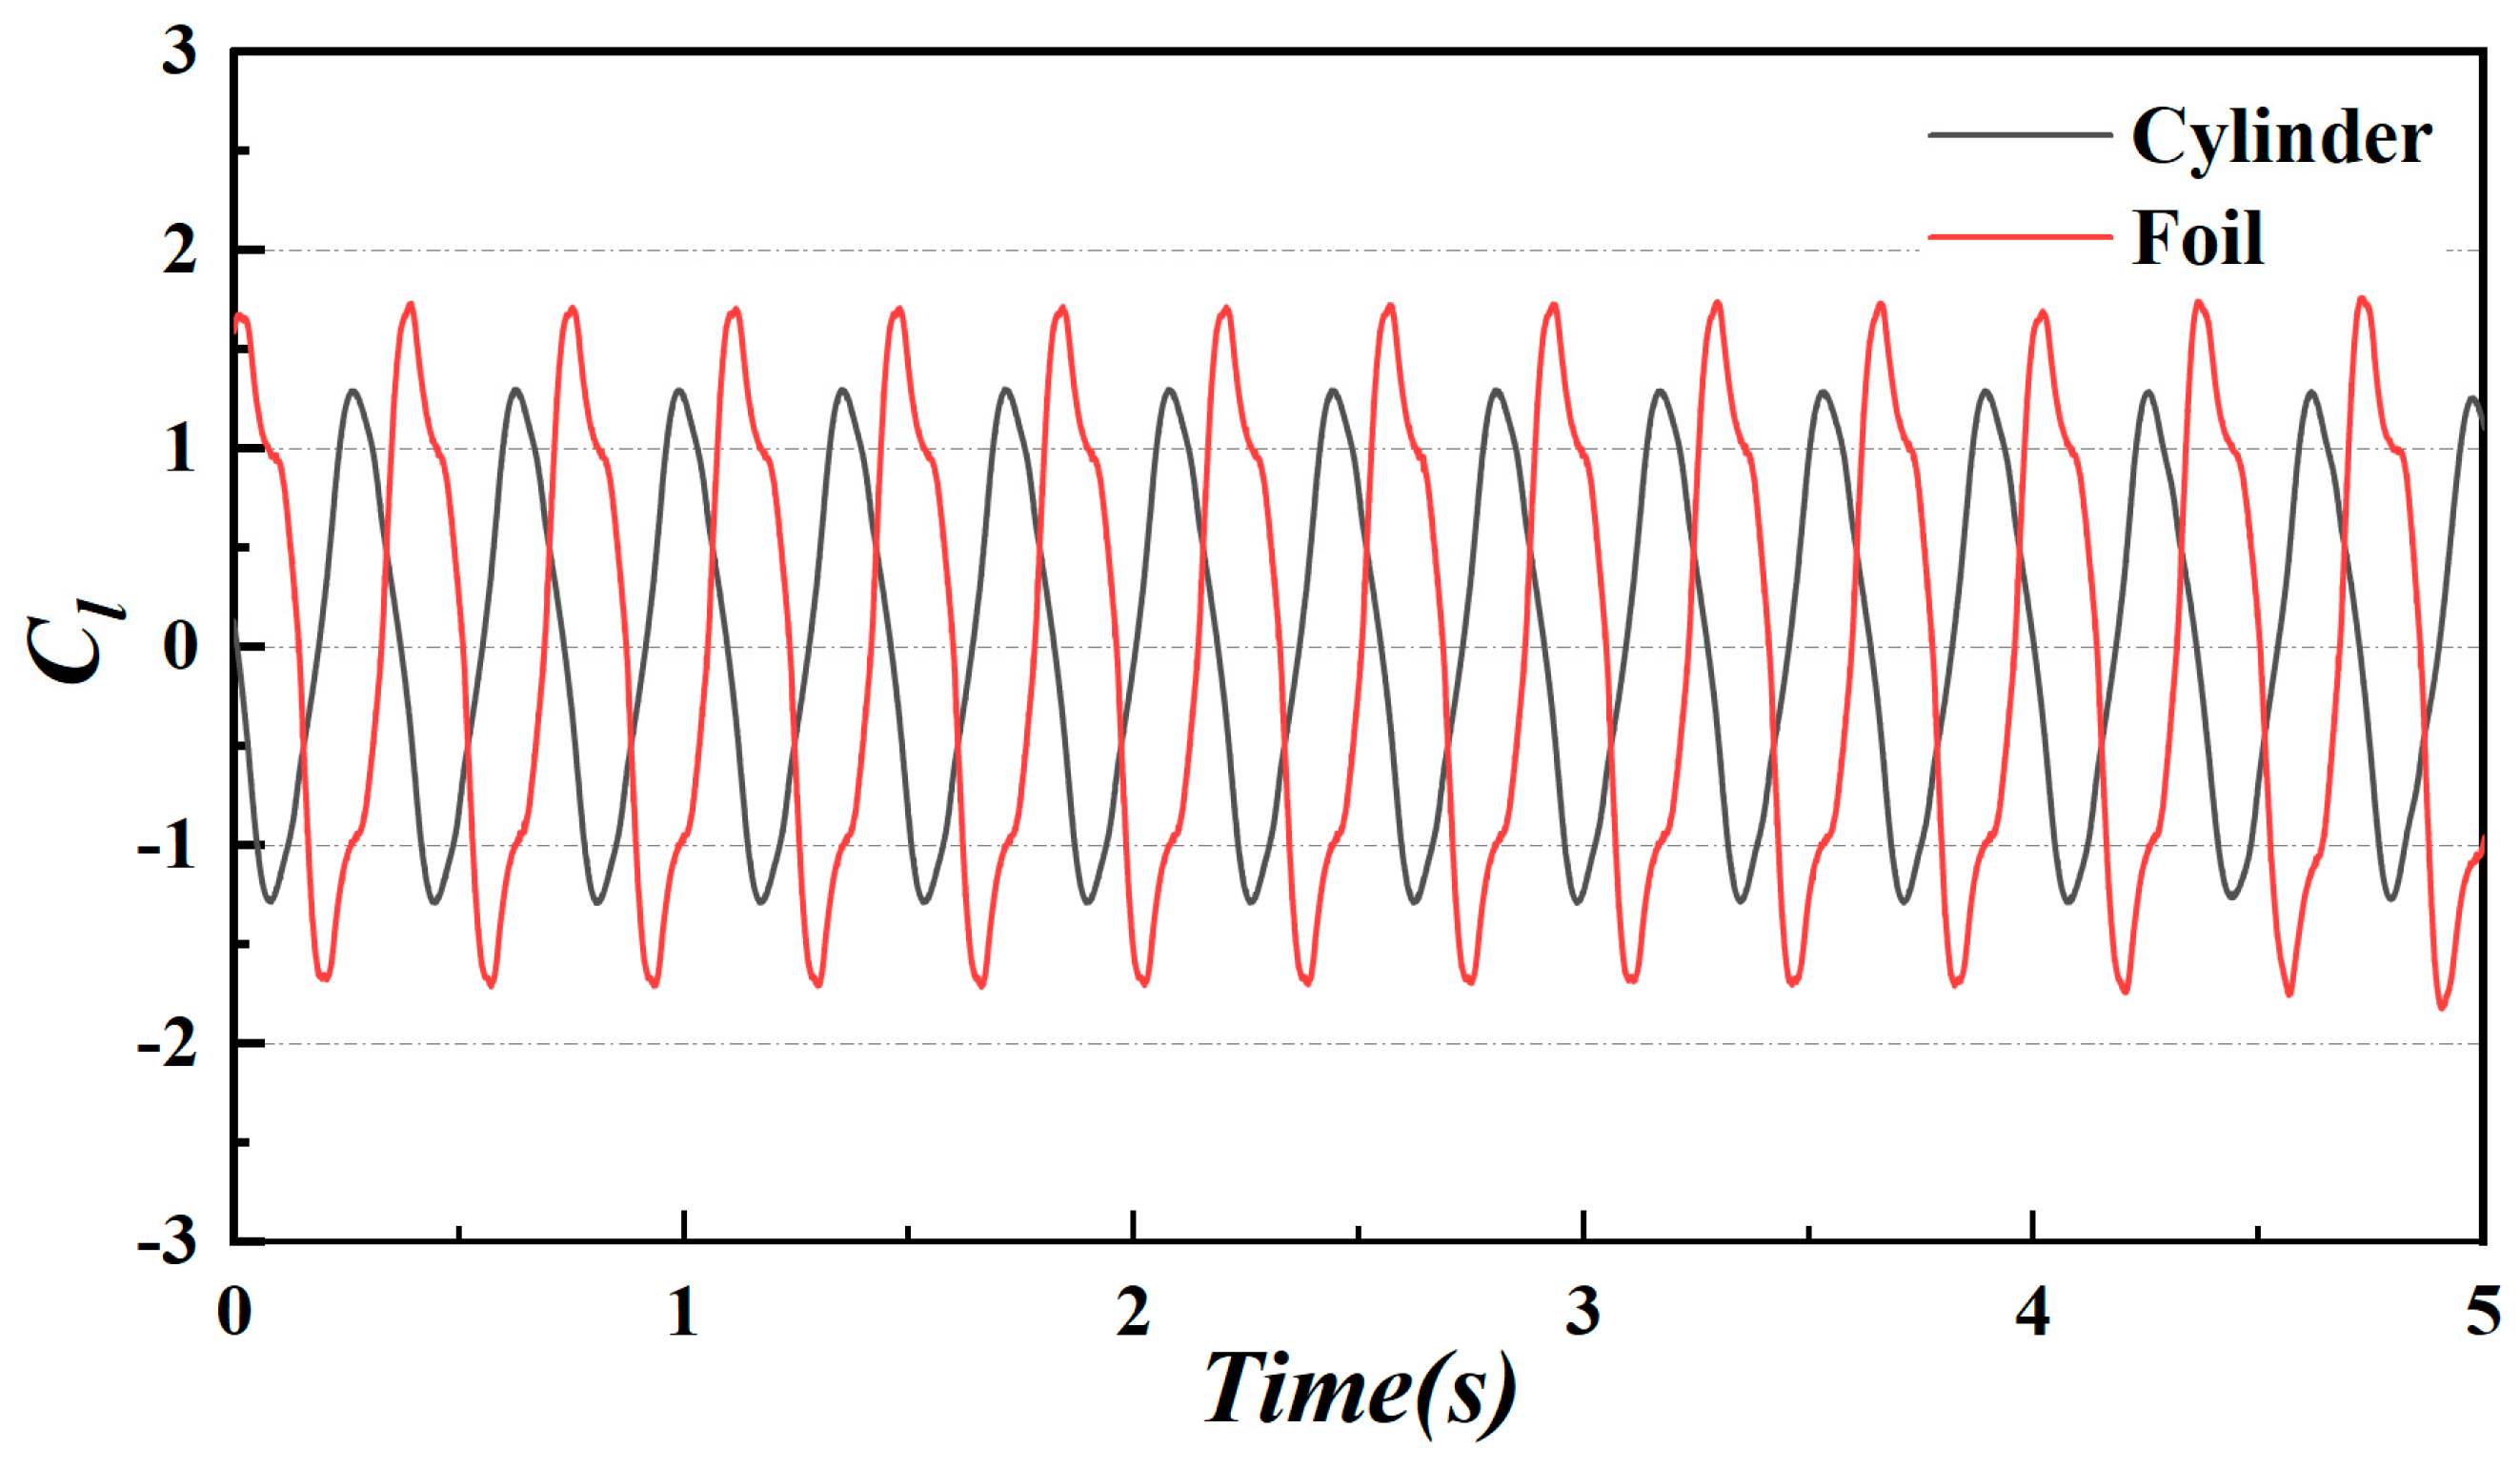
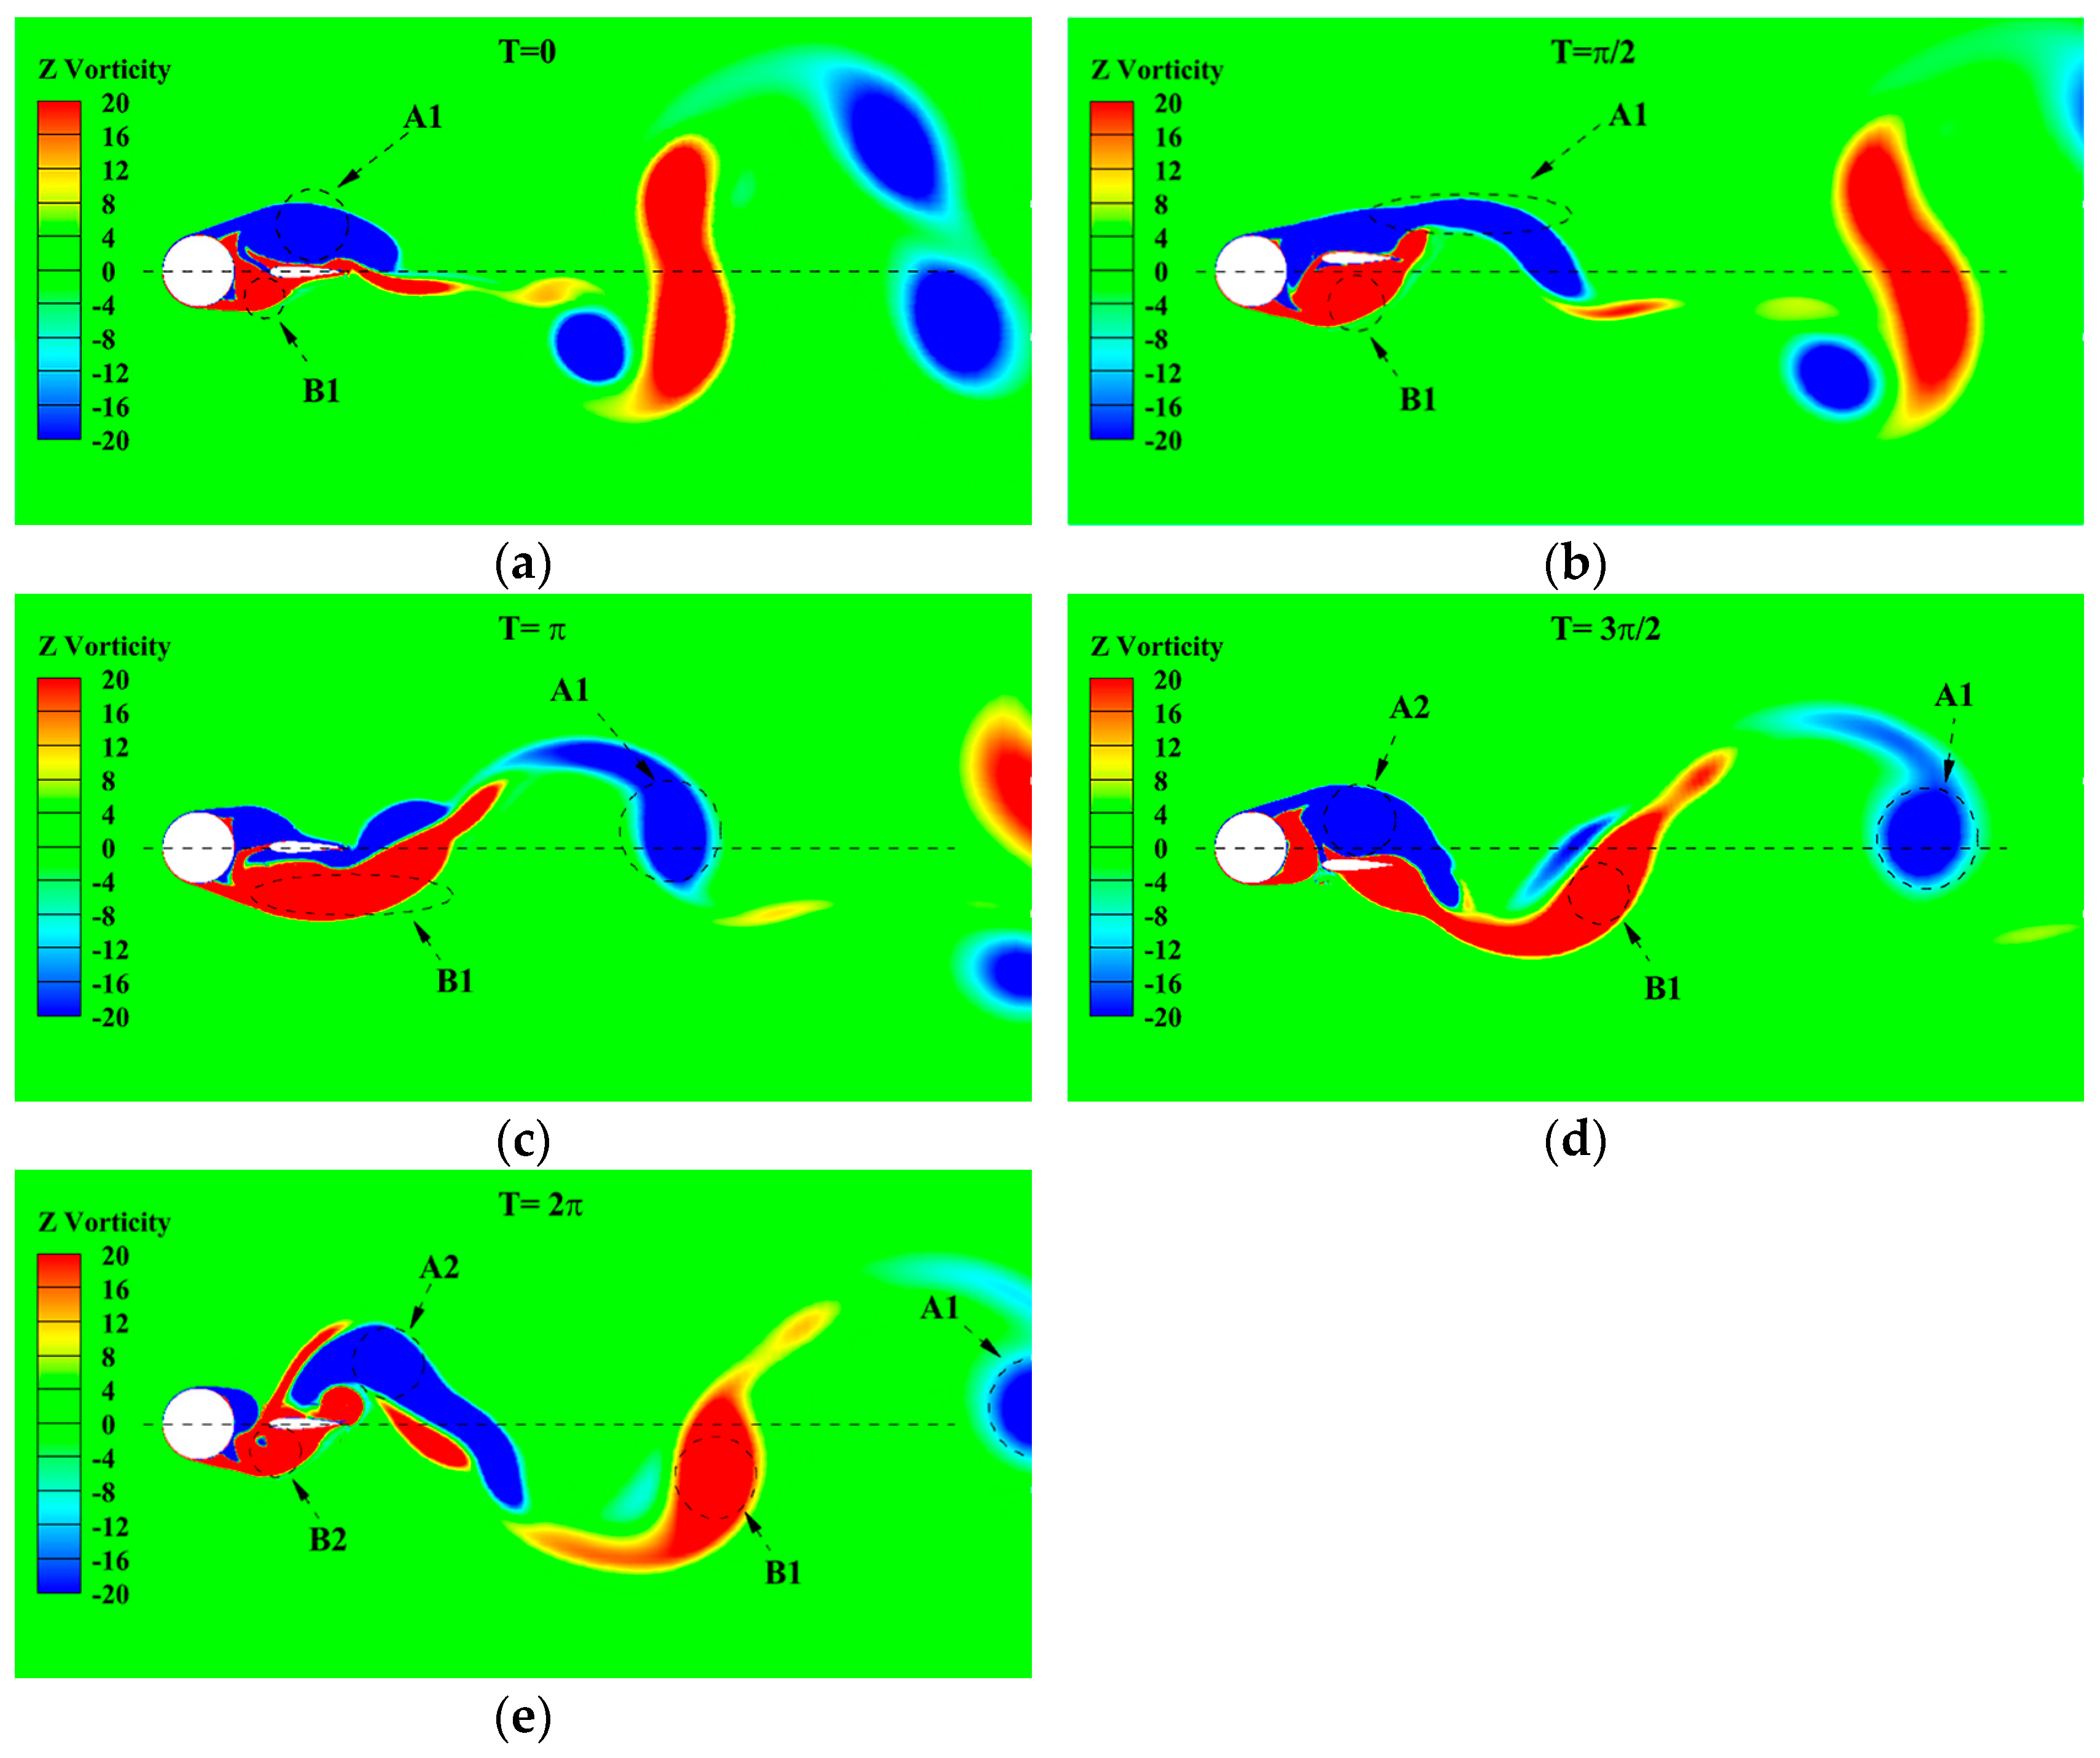
- With the changes in space ratios and reduced velocities, the maximum amplitude ratio (A* = 1.43) appears at Ur = 15.23 and S/L = 1.0. For exploring the phenomenon, the lift coefficient curves of the cylinder and the foil in 5 s at the present parameters are plotted in Figure 8 first, the phase difference is 131.77° between the two life coefficient curves. However, the phase difference is not the determinate factor of this result; the corresponding value is 140.73°, S/L = 1.5, which has a much smaller amplitude ratio (A* = 0.22).
- 4.
- The amplitude ratios A* are ≤ 0.2 at space ratios S/L > 1.0 and the reduced velocity is Ur ≥ 15.23; as the reduced velocity increases, the amplitude ratio tends to be stable. This is due to the vortex shedding frequency, which increases with the incoming flow velocity. It speeds up the flow field variation frequency around the foil but reduces the oscillating amplitude.
4.2. Frequency Responses
- (a)
- At each spacing ratio, the oscillating frequency of the foil increases with the growth in the reduced velocity. The phenomenon can be attributed to the increasing vortex shedding frequency. As described in Section 4.1, the motion of the oscillator is completely affected by the vortex shedding, so its oscillating frequency shows a gradual increase trend with the incremental oncoming flow velocity.
- (b)
- The increasing rate of oscillating frequency at S/L ≤ 3.0 is smaller than S/L ≥ 4.0 with the changes in reduced velocity, as shown in Figure 8. At the former spacing ratio (S/L ≤ 3.0), because of the influence of the position of the foil, the vortex shedding position located downstream of the foil and the shear layer is extended, which needs more time to isolate from the rigid body, so the vortex shedding frequency at the same reduced velocity is smaller than the latter space ratio (S/L ≥ 4.0). When S/L ≥ 4.0, the vortex shedding position is in the gap between the cylinder and the foil; the vortex sheds earlier and improves the vortex shedding frequency.
- (c)
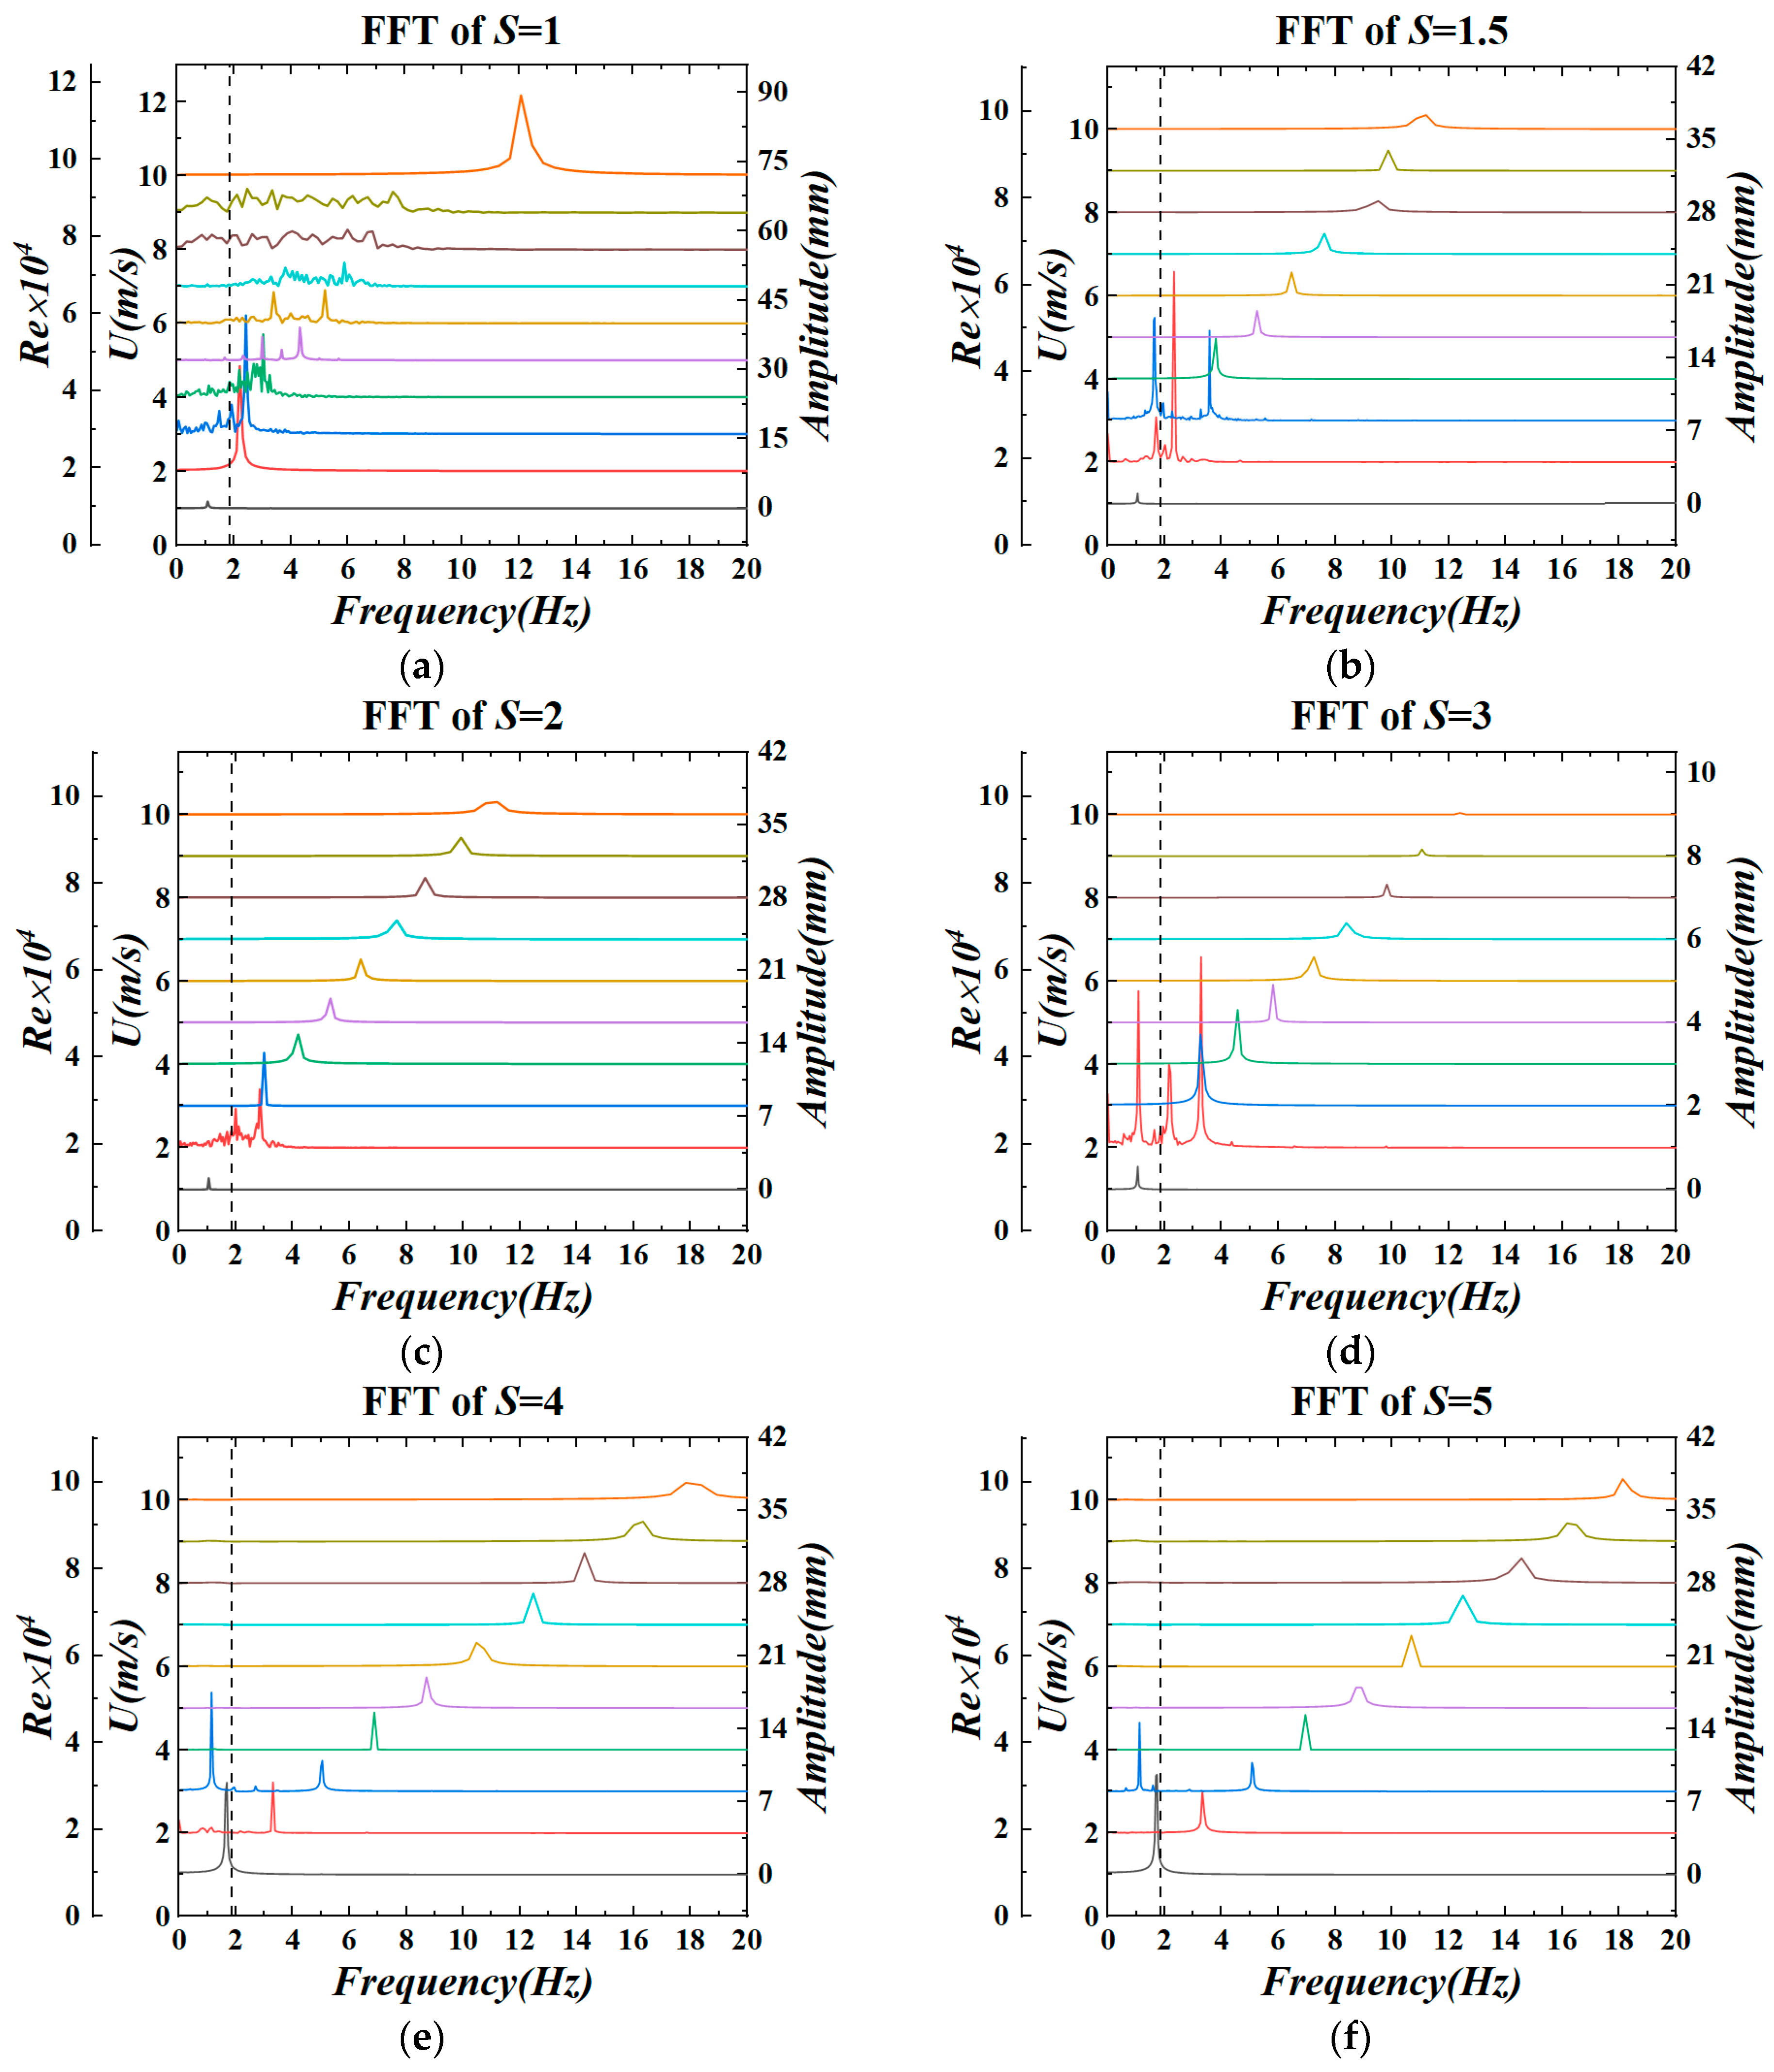
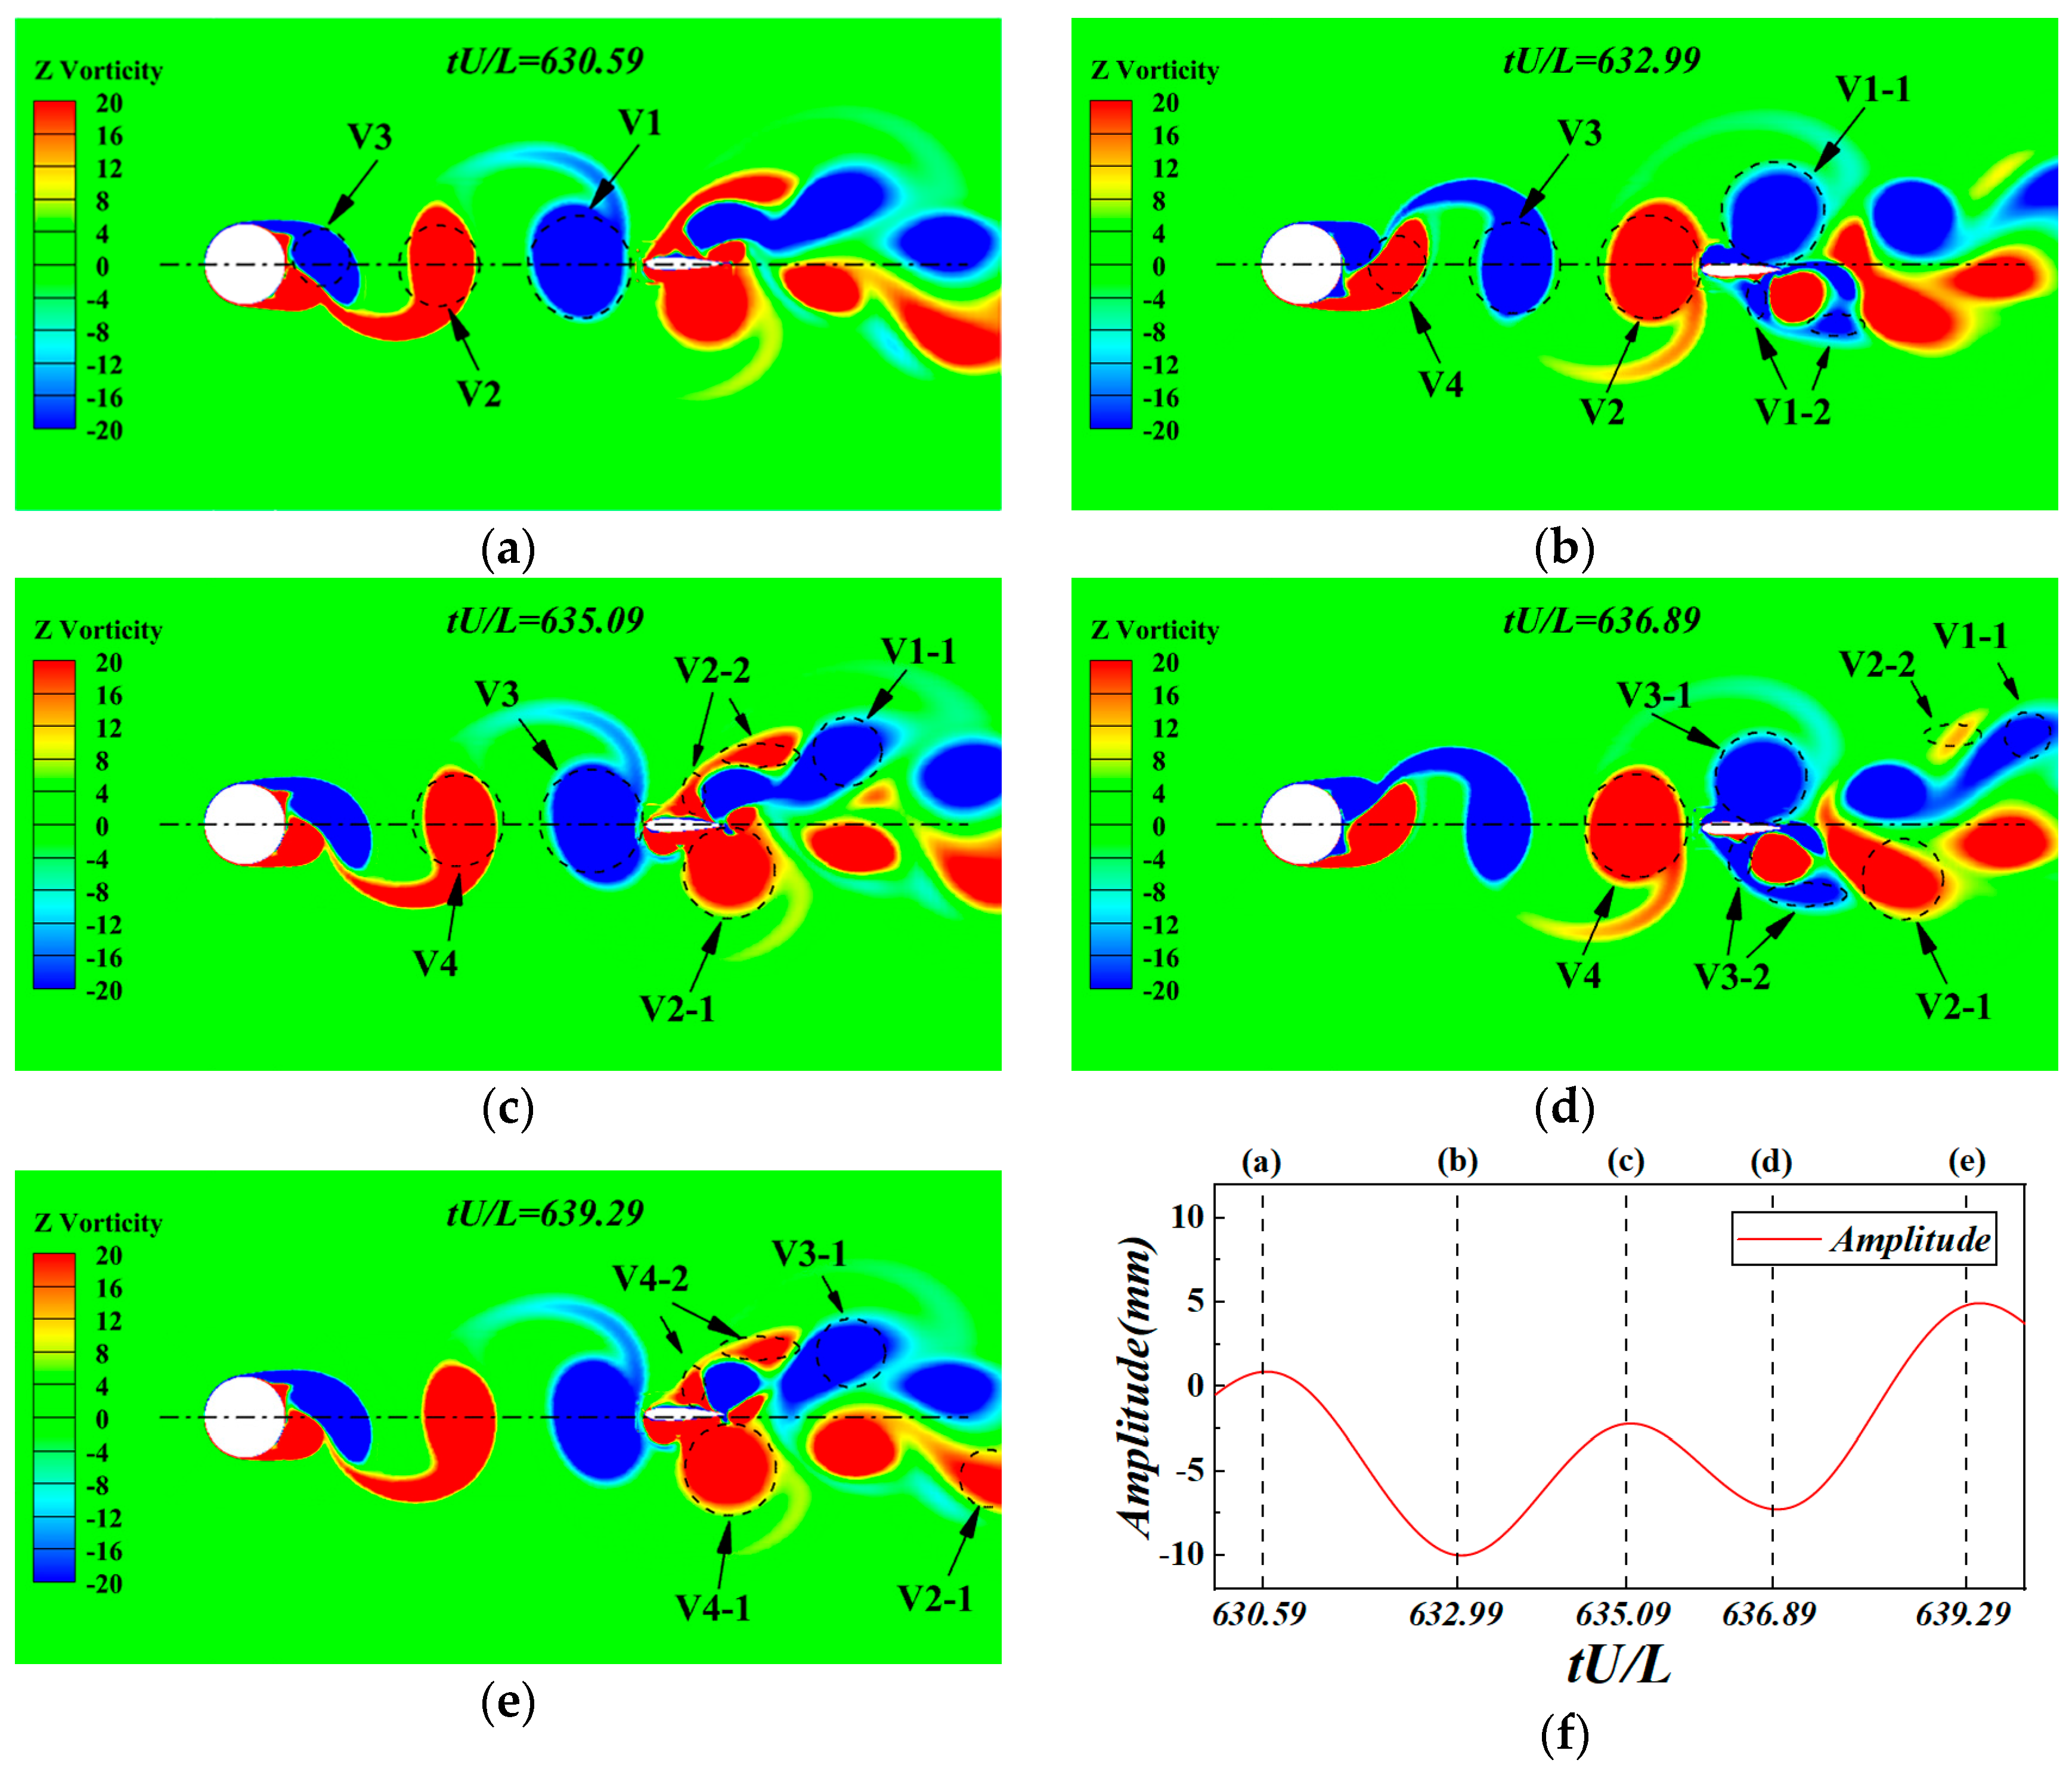
- At the corresponding time of the maximum amplitude at each spacing ratio, the amplitude response has more than two oscillating frequencies. When the spacing ratio S/L = 5.0 and Ur = 11.43, the instantaneous vorticity contours of the two vortex-shedding cycles of the upstream cylinder and the corresponding foil displacement time history curve are shown in Figure 11. At the moment shown in Figure 11a, the foil is at the extreme value of upward movement under the effect of the previous vortex. When it comes to Figure 11b, vortex V1 is cut apart into two sub-vortexes by the foil. The upper sub-vortex V1-1 plays a key role in forcing the foil to gradually move downward and reach the extreme value. The lower vortex V1-2 is dissipated under the influence of surrounding vortices. In the same way, vortexes V2, V3, and V4 similarly displace the foil. It should be noted that after the vortex is split, the sub-vortex plays a role in the foil displacement, which is on the same side as the original vortex, and the sub-vortex on the other side is gradually dissipated under the influence of the residual part of the previous vortex. On the one hand, with the alternating influence of vortices, the foil oscillator makes a reciprocating motion, so one frequency of the displacement curve is equal to the vortex shedding frequency at this time. On the other hand, when a current vortex makes the foil move to the extreme value, as shown in Figure 11b, the subsequent vortex V2 has been affected by the foil, which leads to the sub vortex V2-1 of V2 being smaller than the sub vortex of V1-1. During the upward movement of the flapping wing caused by V2-1, V3 is cut off to make the foil move downward so that the displacement time history curve of the foil shows a rising trend of fluctuation, which also makes the displacement have multiple frequencies.
- (d)
- As shown in Figure 11e,f, when the spacing ratio is equal to 4.0 and 5.0, and the reduced velocity Ur = 11.43, a larger amplitude is less than the natural frequency and a smaller amplitude is equal to the upstream cylinder vortex shedding frequency, which appears on the FFT curve. This is due to the alternating rise and fall of the oscillator under the action of the vortex at this reduced velocity. In Figure 11b, the oscillator is at the limit value of the downward motion, and then the wave rises to the extreme value of the upward motion; this process is about three to four cylindrical vortex shedding cycles. In the vortex shedding period close to the initial position of the foil, the amplitude of the vibration is small, so there is a peak on the FFT curve on the right side close to the vortex shedding frequency, but the amplitude is relatively small.
4.3. Harnessed Energy and Efficiency
4.3.1. Harnessed Energy
4.3.2. Harnessed Efficiency
5. Conclusions
- (1)
- High energy conversion occurred at a close spacing, which has a relatively higher amplitude response. At low spacing ratios, there is a dramatic disturbance in the area behind the cylinder because of the vortex shedding. Hence, the foil could utilize the effect and oscillates with a higher amplitude, which could harness more power from the fluid.
- (2)
- A critical spacing ratio for the vortex shedding position is between 3.0 and 4.0. Due to the change in the position, the oscillation of the foil is suppressed with an increasing velocity for S/L ≥ 4.0, which means less energy can be captured.
- (3)
- There are two local high values for harnessed power with an increasing velocity. One is around Ur = 11.43, which could be seen as the end of VIV. The other one occurs at Ur = 38.08 which is the upper limit of the tested velocity. According to the current trend, more power may be harnessed with the continuous increase in velocity.
- (4)
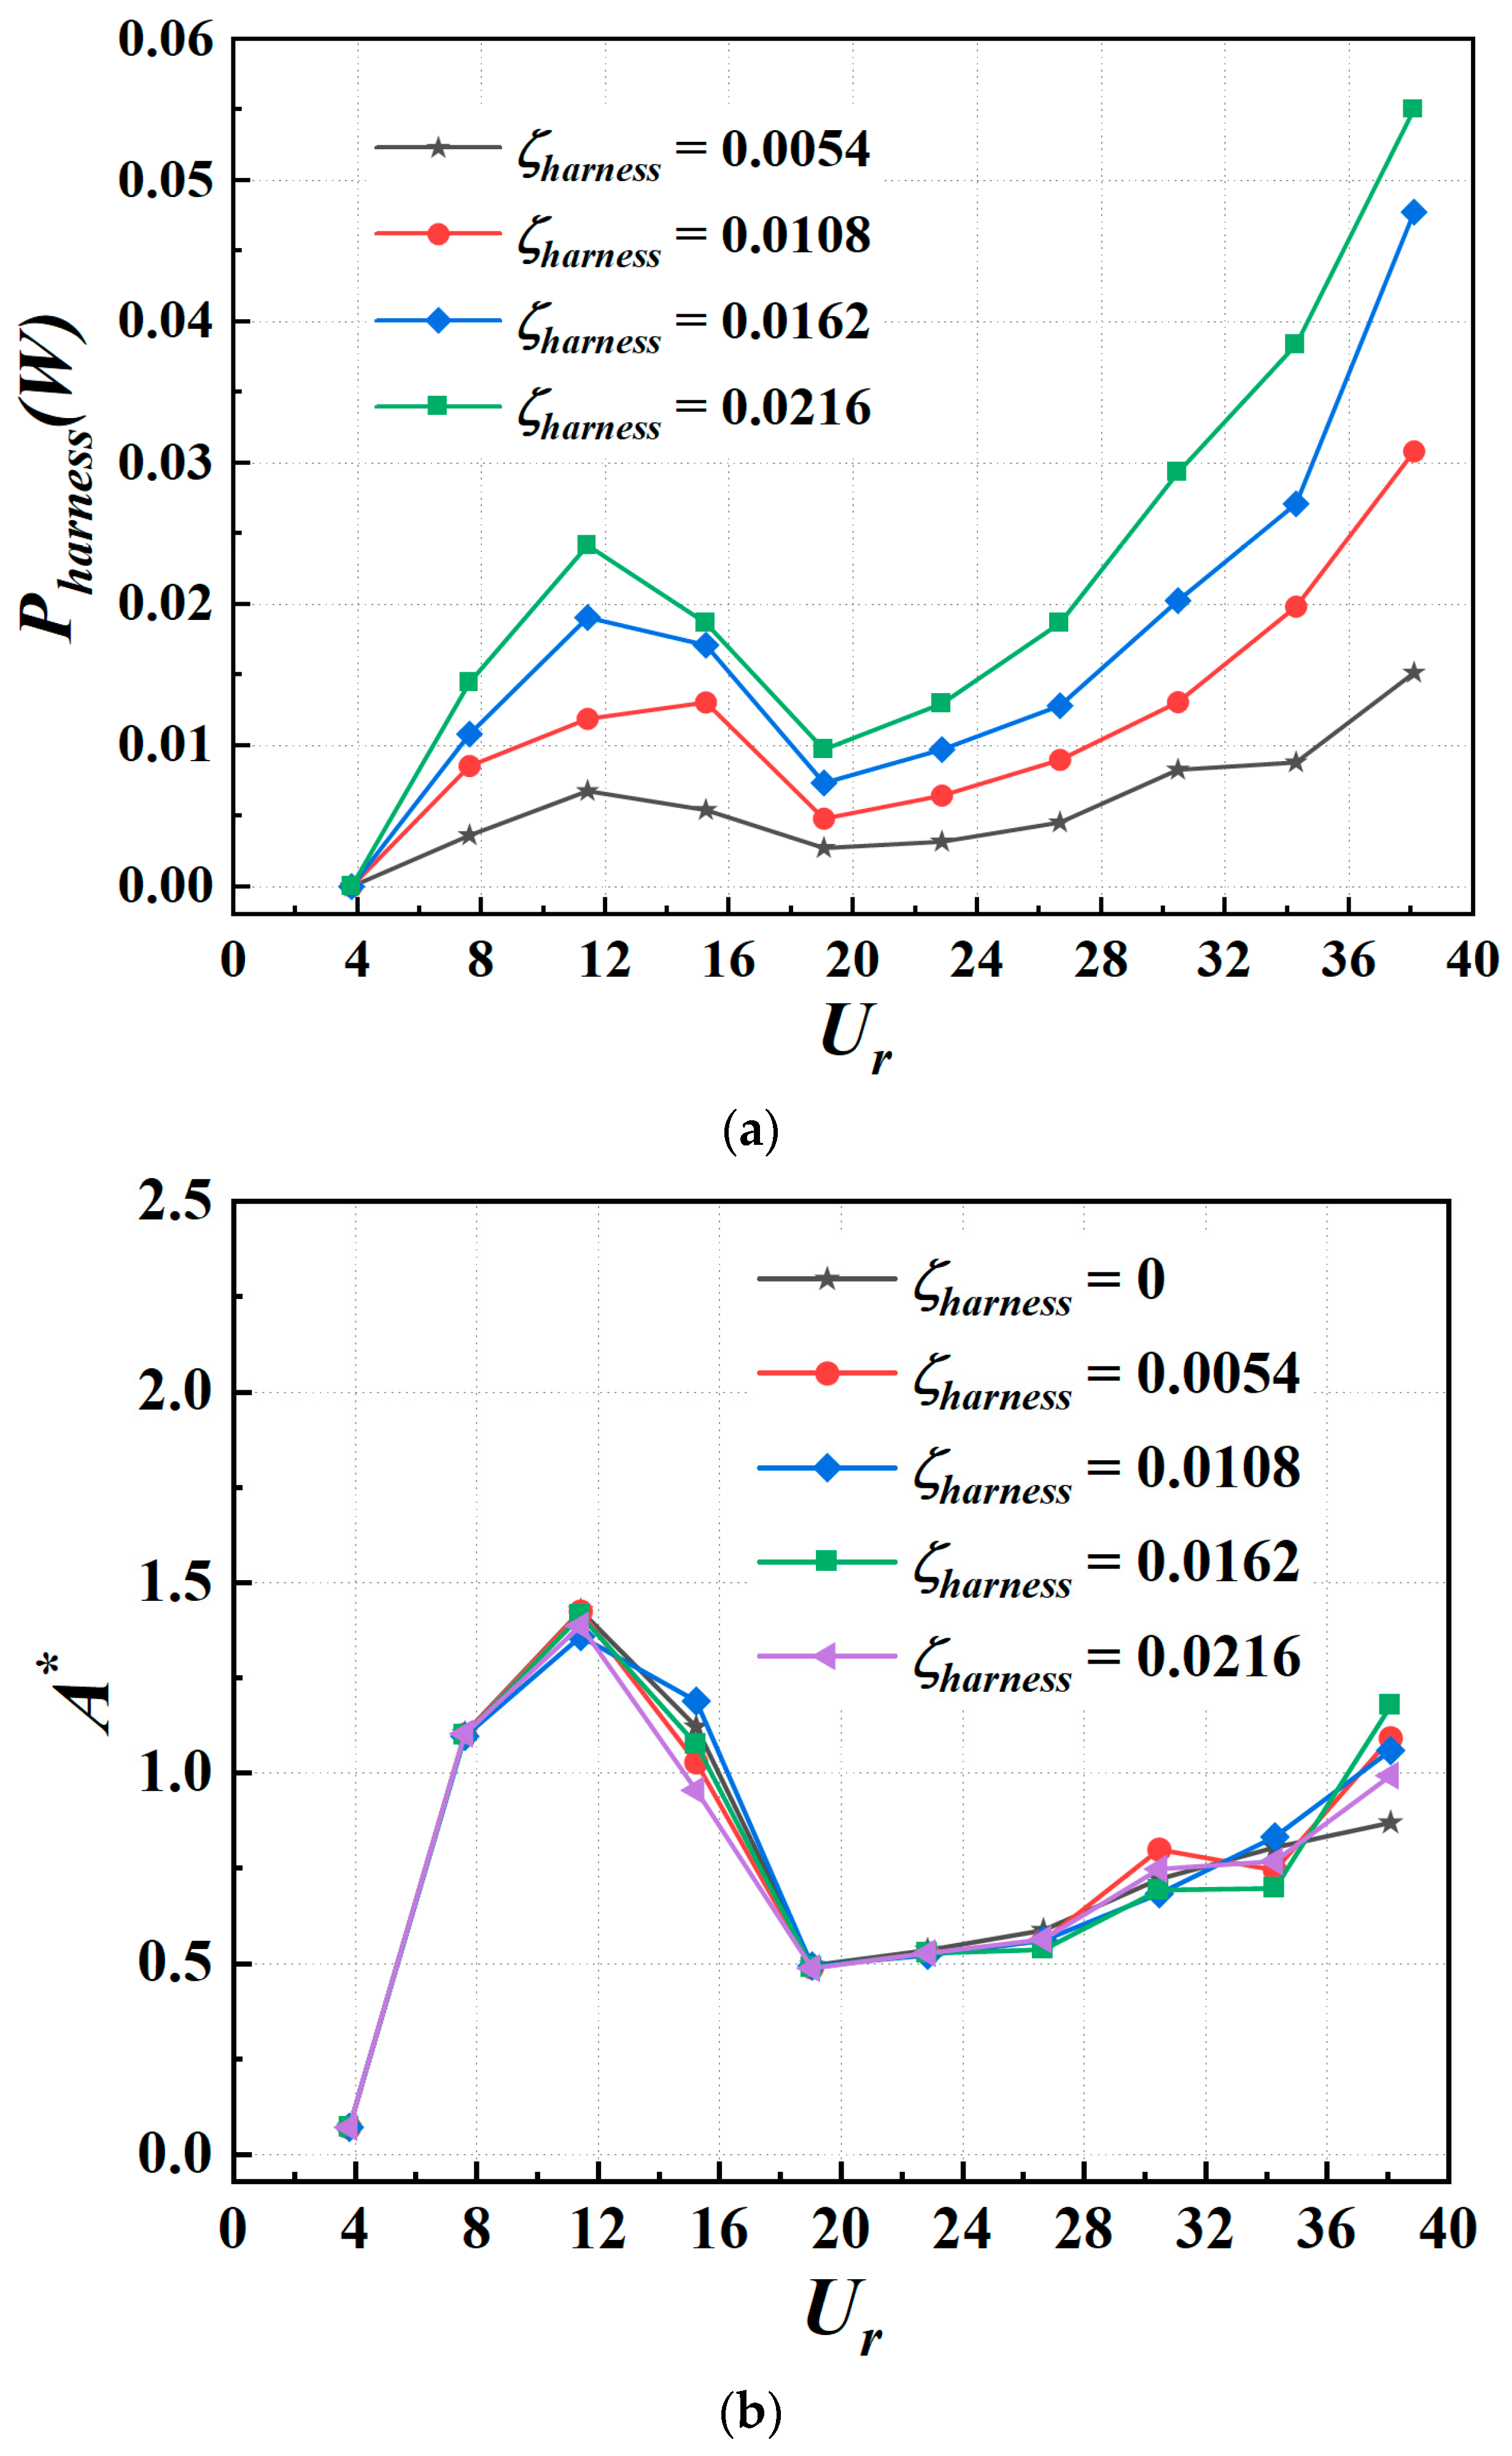
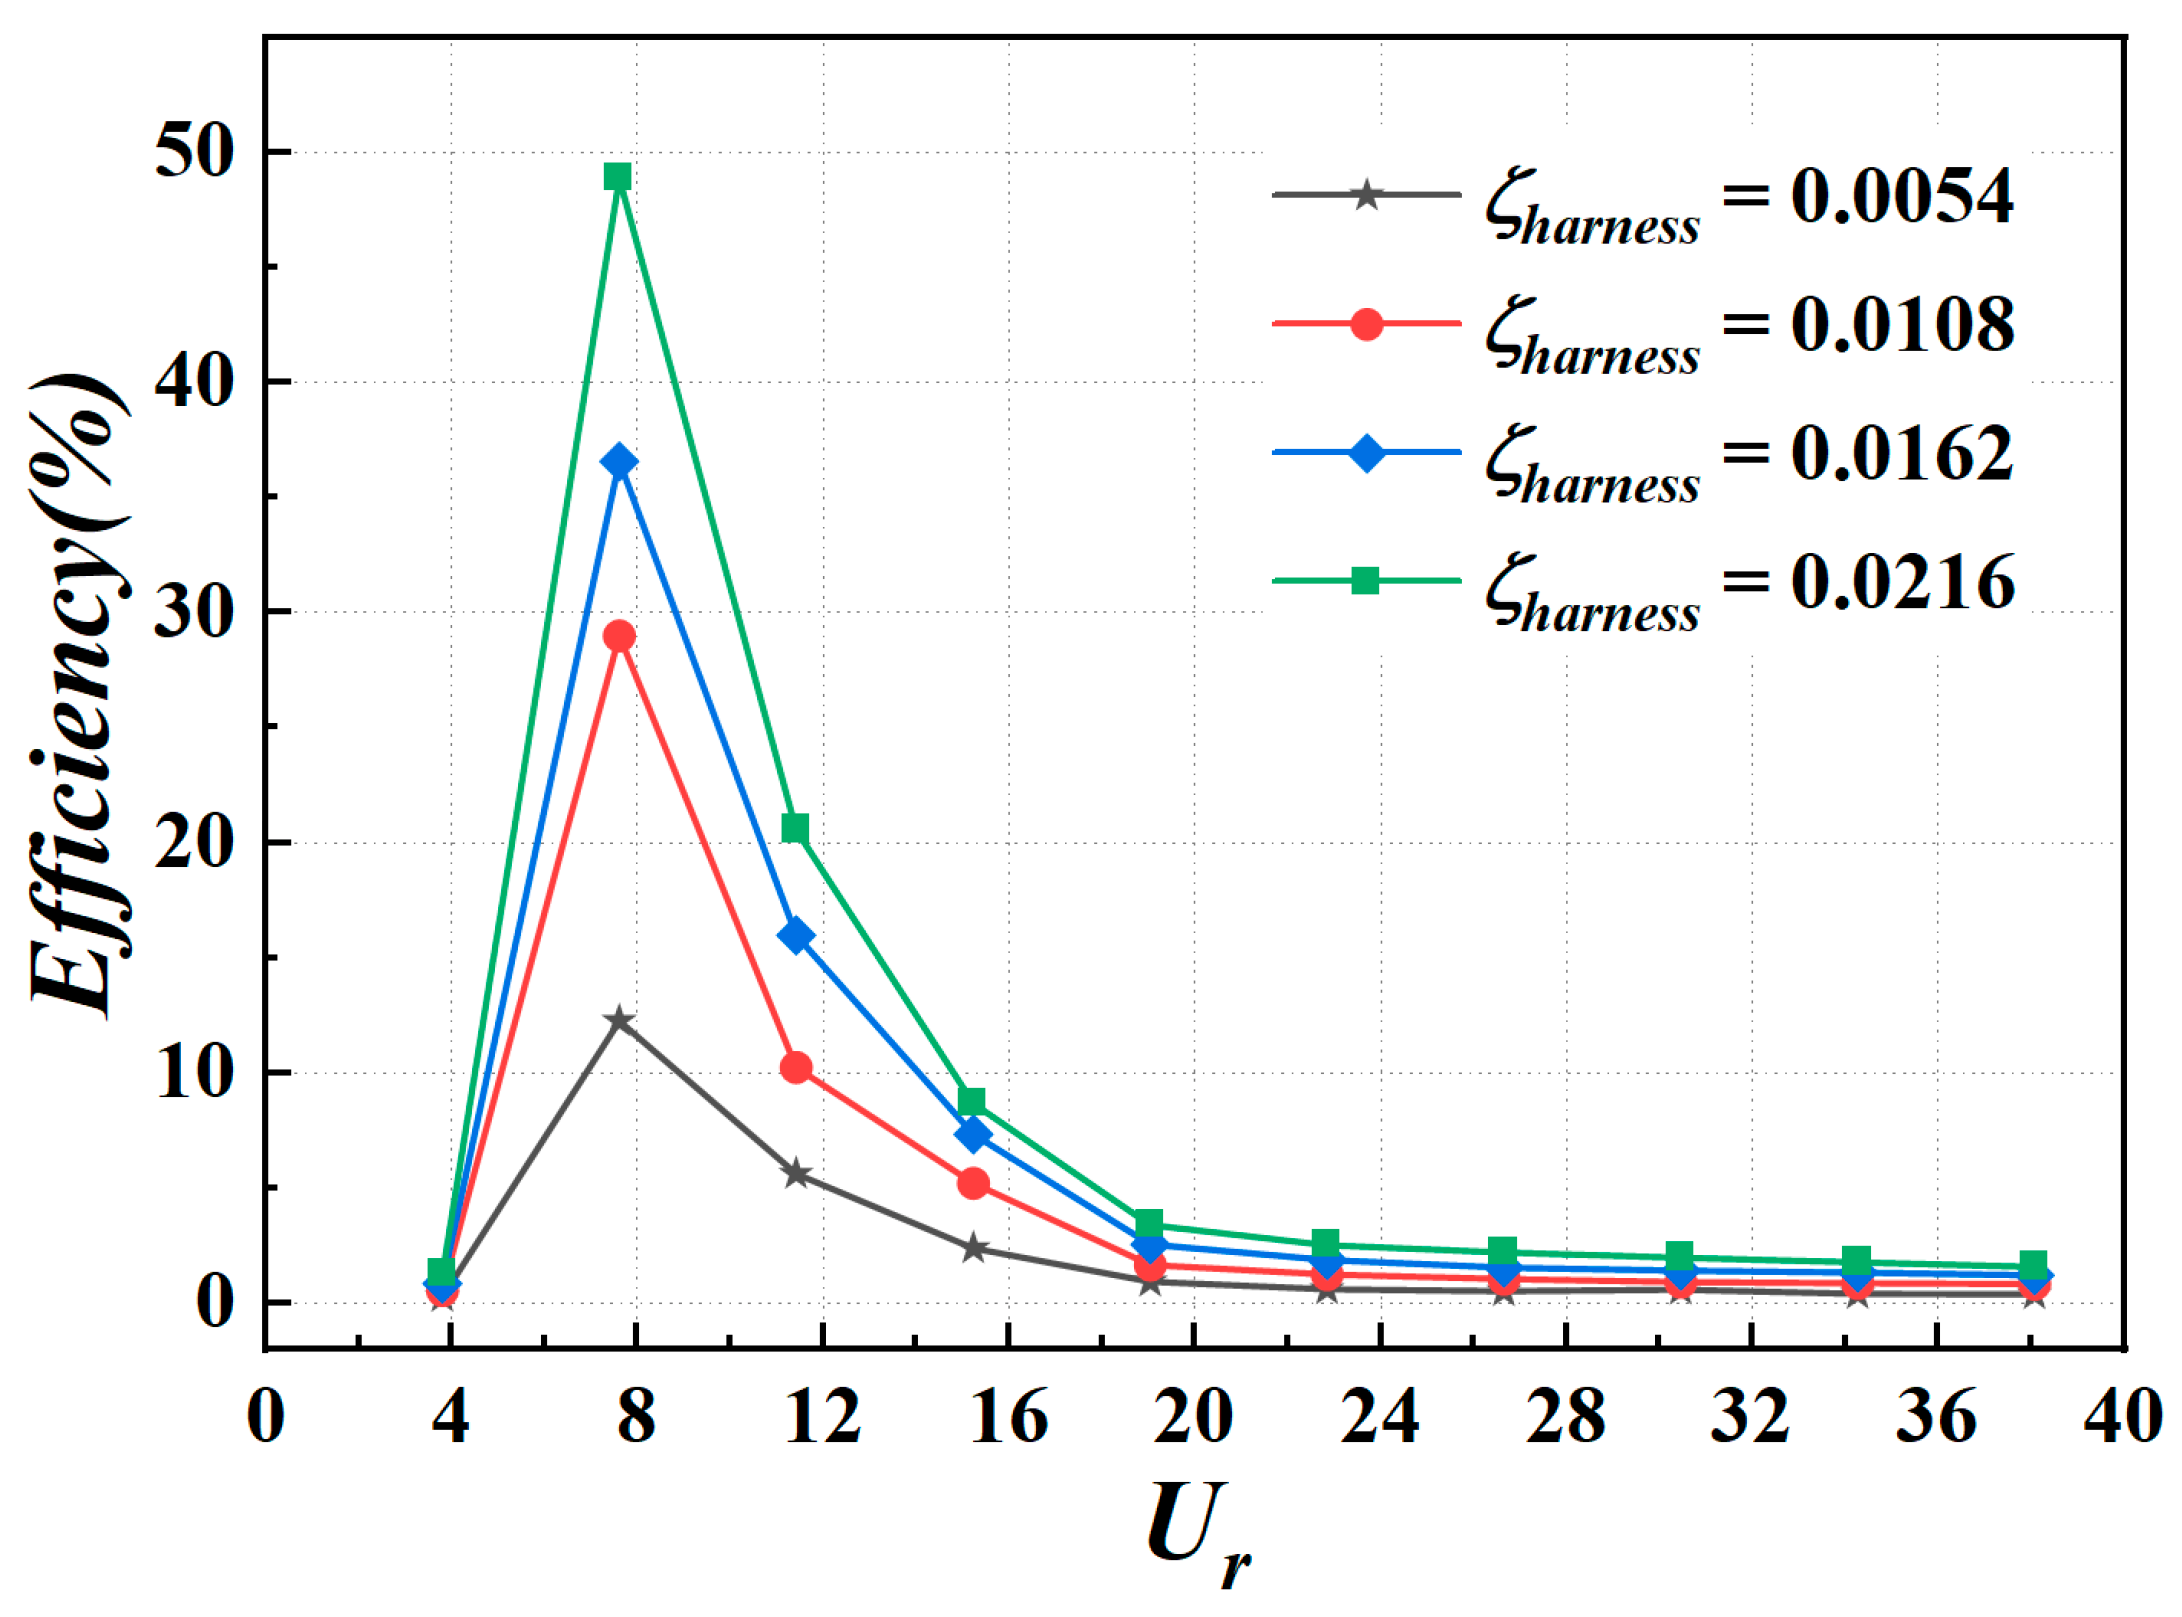
- A higher harnessing damping ratio converts more energy essentially. The highest harnessed power in the conducted simulations is 0.055 W at ζharness = 0.0216, which is about four times the value at ζharness = 0.0054.
- (5)
- The highest harnessed efficiencies reach the maximum of about 12.3–48.8% and occur at the oscillating frequency that is close to the natural frequency. The efficiency of the foil with a fixed cylinder is higher compared to that of the single isolated flapping foil, where the optimal efficiency is 34%.
Author Contributions
Funding
Data Availability Statement
Conflicts of Interest
Nomenclature
| A | The amplitude of the foil |
| Amplitude ratio | |
| Lift coefficient | |
| ζstructure | Structure damping ratio |
| ζharness | Added damping ratio to harness energy |
| Cylinder diameter | |
| fn | The natural frequency of foil |
| fosc | The oscillating frequency of foil |
| f* | Frequency ratio |
| H | The maximum thickness of foil |
| K | Spring const |
| L | Foil chord length |
| m | Foil mass |
| ma | Added mass |
| Ptotal | Total converted energy from the flow |
| Pharness | Harnessing energy |
| Re | Reynolds number |
| S | Space between the center of the cylinder and the foil |
| Sfoil | Area swept by the foil |
| S/L | Space ratio |
| St | Strouhal number |
| Fluid incoming velocity | |
| Ur | Reduced velocity |
| y+ | Nondimensional first grid spacing |
| μt | Turbulent eddy viscosity |
| ρ | Density of fluid |
| Dimensionless time step |
References
- Zdravkovich, M.M. Flow around Circular Cylinders, Vol.1: Fundamentals; Oxford University Press: New York, NY, USA, 1997. [Google Scholar]
- Rashidi, S.; Hayatdavoodi, M.; Esfahani, J.A. Vortex shedding suppression and wake control: A review. Ocean Eng. 2016, 126, 57–80. [Google Scholar] [CrossRef]
- Wang, R.; Xin, D.; Ou, J. Experimental investigation on suppressing circular cylinder VIV by a flow control method based on passive vortex generators. J. Wind Eng. Ind. Aerodyn. 2019, 187, 36–47. [Google Scholar] [CrossRef]
- Bernitsas, M.M.; Raghavan, K.; Ben-Simon, Y.; Garcia, E.M.H. VIVACE (vortex induced vibration aquatic clean energy): A new concept in generation of clean and renewable energy from fluid flow. J. Offshore Mech. Arct. Eng. 2008, 130, 041101. [Google Scholar] [CrossRef]
- Wu, T.Y. Extraction of flow energy by a wing oscillating in waves. J. Ship Res. 1972, 16, 66–78. [Google Scholar] [CrossRef]
- Mckinney, W.; Delaurier, J. The wingmill: An oscillating-wing windmill. In Proceedings of the Wind Energy Conference, Boulder, CO, USA, 9–11 April 1980; pp. 80–87. [Google Scholar]
- Young, J.; Lai, J.C.S.; Platzer, M.F. A review of progress and challenges in flapping foil power generation. Prog. Aeosp. Sci. 2014, 67, 2–28. [Google Scholar] [CrossRef]
- Jones, K.D.; Davids, S.; Platzer, M.F. Oscillating-wing power generator. In Proceedings of the 3rd ASME/JSME Joint Fluids Engineering Conference, San Francisco, CA, USA, 18–23 July 1999. [Google Scholar]
- Kinsey, T.; Dumas, G. Parametric study of an oscillating airfoil in a power-extraction regime. AIAA J. 2008, 46, 1318–1330. [Google Scholar] [CrossRef]
- Zhu, Q.; Peng, Z. Mode coupling and flow energy harvesting by a flapping foil. Phys. Fluids 2009, 21, 033601. [Google Scholar] [CrossRef]
- Young, J.; Ashraf, M.A.; Lai, J.C.; Platzer, M.F. Numerical simulation of fully passive flapping foil power generation. AIAA J. 2013, 51, 2727–2739. [Google Scholar] [CrossRef]
- Simpson, B.J.; Licht, S.; Hover, F.S.; Triantafyllou, M.S. Energy extraction through flapping foils. In Proceedings of the ASME 2008 27th International Conference on Offshore Mechanics and Arctic Engineering, Estoril, Portugal, 15–20 June 2008; pp. 389–395. [Google Scholar]
- Zhu, B.; Huang, Y.; Zhang, Y. Energy harvesting properties of a flapping wing with an adaptive gurney flap. Energy 2018, 152, 119–128. [Google Scholar] [CrossRef]
- Teng, L.; Deng, J.; Pan, D.; Shao, X. Effects of non-sinusoidal pitching motion on energy extraction performance of a semi-active flapping foil. Renew. Energy 2016, 85, 810–818. [Google Scholar] [CrossRef]
- Veilleux, J.-C.; Dumas, G. Numerical optimization of a fully-passive flapping-airfoil turbine. J. Fluids Struct. 2017, 70, 102–130. [Google Scholar] [CrossRef]
- Wang, Z.; Du, L.; Zhao, J.; Sun, X. Structural response and energy extraction of a fully passive flapping foil. J. Fluids Struct. 2017, 72, 96–113. [Google Scholar] [CrossRef]
- Assi, G.R.; Bearman, P.W. Vortex-induced vibration of a wavy elliptic cylinder. J. Fluids Struct. 2018, 80, 1–21. [Google Scholar] [CrossRef]
- Sarpkaya, T. A critical review of the intrinsic nature of vortex-induced vibrations. J. Fluids Struct. 2004, 19, 389–447. [Google Scholar] [CrossRef]
- Williamson, C.H.K.; Govardhan, R. Vortex-Induced Vibrations. Annu. Rev. Fluid Mech. 2004, 36, 413–455. [Google Scholar] [CrossRef]
- Alonso, G.; Meseguer, J.; Pérez-Grande, I. Galloping instabilities of two-dimensional triangular cross-section bodies. Exp Fluids. 2005, 38, 789–795. [Google Scholar] [CrossRef]
- Zdravkovich, M.M. Review of flow interference between two circular cylinders in various arrangements. J. Fluids Eng. 1977, 99, 618–633. [Google Scholar] [CrossRef]
- Zdravkovich, M.M. The effects of interference between circular cylinders in cross flow. J. Fluids Struct. 1987, 1, 239–261. [Google Scholar] [CrossRef]
- Qin, B.; Alam, M.M.; Zhou, Y. Free vibrations of two tandem elastically mounted cylinders in crossflow. J. Fluid Mech. 2019, 861, 349–381. [Google Scholar] [CrossRef]
- Assi, G.; Bearman, P.W.; Meneghini, J.R. On the wake-induced vibration of tandem circular cylinders: the vortex interaction excitation mechanism. J. Fluid Mech. 2010, 661, 365–401. [Google Scholar] [CrossRef]
- Sun, H.; Kim, E.S.; Nowakowski, G.; Mauer, E.; Bernitsas, M.M. Effect of mass-ratio, damping, and stiffness on optimal hydrokinetic energy conversion of a single, rough cylinder in flow induced motions. Renew. Energy 2016, 99, 936–959. [Google Scholar] [CrossRef]
- Li, N.; Park, H.; Sun, H.; Bernitsas, M.M. Hydrokinetic energy conversion using flow induced oscillations of single-cylinder with large passive turbulence control. Appl. Energy 2022, 308, 118380. [Google Scholar] [CrossRef]
- Zhang, L.; Dai, H.; Abdelkefi, A.; Wang, L. Improving the performance of aeroelastic energy harvesters by an interference cylinder. Appl. Phys. Lett. 2017, 111, 073904. [Google Scholar] [CrossRef]
- Alam, M.M. The aerodynamics of a cylinder submerged in the wake of another. J. Fluids Struct. 2014, 51, 393–400. [Google Scholar] [CrossRef]
- Chen, Z.; Alam, M.M.; Qin, B.; Zhou, Y. Energy harvesting from and vibration response of different diameter cylinders. Appl. Energy 2020, 278, 115737. [Google Scholar] [CrossRef]
- Sun, H.; Ma, C.; Kim, E.S.; Nowakowski, G.; Mauer, E.; Bernitsas, M.M. Hydrokinetic energy conversion by two rough tandem-cylinders in flow induced motions: Effect of spacing and stiffness. Renew. Energy 2017, 107, 61–80. [Google Scholar] [CrossRef]
- Kim, E.S.; Bernitsas, M.M.; Kumar, R.A. Multicylinder flow-induced motions: enhancement by passive turbulence control at 28,000 < Re < 120,000. J. Offshore Mech. Arct. Eng. 2013, 135, 21802. [Google Scholar]
- Liao, Q.; Dong, G.J.; Lu, X.Y. Vortex formation and force characteristics of a foil in the wake of a circular cylinder. J. Fluids Struct. 2004, 19, 491–510. [Google Scholar] [CrossRef]
- Ma, P.; Wang, Y.; Xie, Y.; Huo, Z. Numerical analysis of a tidal current generator with dual flapping wings. Energy 2018, 155, 1077–1089. [Google Scholar] [CrossRef]
- Li, J.; Wang, X.; An, X.; Zhang, B.; Lyu, D.; Wang, P. Performance improvement of flapping foils in von karman wake. Ocean Eng. 2022, 243, 110207. [Google Scholar] [CrossRef]
- Qiang, Z. Optimal frequency for flow energy harvesting using flapping foils and its relation with wake instability. In Proceedings of the 63rd Annual Meeting of the APS Division of Fluid Dynamics, Long Beach, CA, USA, 21–23 November 2010. [Google Scholar]
- Morris, S.E.; Williamson, C.H.K. Impingement of a counter-rotating vortex pair on a wavy wall. J. Fluid Mech. 2020, 895, A25. [Google Scholar] [CrossRef]
- Menter, F.R. Two-equation eddy-viscosity turbulence models for engineering applications. AIAA J. 1994, 32, 1598–1605. [Google Scholar] [CrossRef]
- Pan, Z.Y.; Cui, W.C.; Miao, Q.M. Numerical simulation of vortex-induced vibration of a circular cylinder at low mass-damping using RANS code. J. Fluids Struct. 2007, 23, 23–37. [Google Scholar] [CrossRef]
- Van Doormaal, J.P.; Raithby, G.D. Enhancements of the simple method for predicting incompressible fluid flows. Numer. Heat Transf. 1984, 7, 147–163. [Google Scholar] [CrossRef]
- Patankar, S.V.; Spalding, D.B. Paper 5-a calculation procedure for heat, mass and momentum transfer in three-dimensional parabolic flows. In Numerical Prediction of Flow, Heat Transfer, Turbulence and Combustion; Patankar, S.V., Pollard, A., Singhal, A.K., Vanka, S.P., Eds.; Pergamon: Oxford, UK, 1983; pp. 54–73. [Google Scholar] [CrossRef]
- Mittal, S.; Kumar, V. Flow-induced vibrations of a light circular cylinder at reynolds numbers 103 to 104. J. Sound Vib. 2001, 245, 923–946. [Google Scholar] [CrossRef]
- Parnaudeau, P.; Carlier, J.; Heitz, D.; Lamballais, E. Experimental and numerical studies of the flow over a circular cylinder at Reynolds number 3900. Phys. Fluids 2008, 20, 085101. [Google Scholar] [CrossRef]
- Franke, J.; Frank, W. Large eddy simulation of the flow past a circular cylinder at ReD = 3900. J. Wind Eng. Ind. Aerodyn. 2002, 90, 1191–1206. [Google Scholar] [CrossRef]
- Lysenko, D.A.; Ertesvåg, I.S.; Rian, K.E. Large-eddy simulation of the flow over a circular cylinder at reynolds number 3900 using the openfoam toolbox. Flow Turbul. Combust. 2012, 89, 491–518. [Google Scholar] [CrossRef]
- Zhou, G.; Liu, G.; Ma, J.; Luo, G. Numerical simulation of Vortex induced vibration of a circular cylinder. Noise Vib. Control 2010, 30, 51–55+59. [Google Scholar]
- Zeng, P.; Yuan, D.; Yang, Z.; Liu, C. Discussion on the applicability of turbulence model in numerical simulation of two-dimensional cylindrical vortex-induced vibration. Adv. Mar. Sci. 2018, 36, 55–65. [Google Scholar] [CrossRef]
- Li, H.; Bernitsas, C.C.; Congpuong, N.; Bernitsas, M.M.; Sun, H. Experimental investigation on synergistic flow-induced oscillation of three rough tandem-cylinders in hydrokinetic energy conversion. Appl. Energy 2024, 359, 122587. [Google Scholar] [CrossRef]


| Item | Symbol | Value |
|---|---|---|
| Diameter of the upstream cylinder | D [m] | 0.14 |
| Chord length of the wing | L [m] | 0.14 |
| The maximum thickness of the wing | H [m] | 0.0227 |
| Space | S [m] | 0.14–0.7 |
| Mass of the foil | mfoil [kg] | 0.462 |
| Spring constant | K [N/m] | 64.14 |
| The damping ratio of the structure | ζstructure [Ns/m] | 0.0054 |
| The damping ratio of harnessing | ζharness [Ns/m] | 0.0054–0.0216 |
| Natural frequency | fn [Hz] | 1.8756 |
| Data Source | Dimension | Turbulence Model | Cd,ave (Drag Coefficient) | St |
|---|---|---|---|---|
| Parnaudeau [42] Exp. | 3D | - | 0.99 | 0.215 |
| Franke J. and W. [43] | 3D | LES | 0.99 | 0.209 |
| Lysenko [44] | 3D | LES | 1.18 | 0.190 |
| Zhou [45] | 2D | SST | 1.5 | 0.215 |
| Present (coarse) | 2D | SST | 1.534 | 0.221 |
| Present (medium) | 2D | SST | 1.526 | 0.218 |
| Present (high) | 2D | SST | 1.522 | 0.216 |
Disclaimer/Publisher’s Note: The statements, opinions and data contained in all publications are solely those of the individual author(s) and contributor(s) and not of MDPI and/or the editor(s). MDPI and/or the editor(s) disclaim responsibility for any injury to people or property resulting from any ideas, methods, instructions or products referred to in the content. |
© 2024 by the authors. Licensee MDPI, Basel, Switzerland. This article is an open access article distributed under the terms and conditions of the Creative Commons Attribution (CC BY) license (https://creativecommons.org/licenses/by/4.0/).
Share and Cite
Luo, Y.; Wu, H.; Huang, S.; Sun, H. Energy Harnessing Performance of Oscillating Foil Submerged in the Wake of a Fixed Cylinder. Energies 2024, 17, 1793. https://doi.org/10.3390/en17081793
Luo Y, Wu H, Huang S, Sun H. Energy Harnessing Performance of Oscillating Foil Submerged in the Wake of a Fixed Cylinder. Energies. 2024; 17(8):1793. https://doi.org/10.3390/en17081793
Chicago/Turabian StyleLuo, Yongqing, Houxian Wu, Shuhan Huang, and Hai Sun. 2024. "Energy Harnessing Performance of Oscillating Foil Submerged in the Wake of a Fixed Cylinder" Energies 17, no. 8: 1793. https://doi.org/10.3390/en17081793