Article

A Model Modification for a Microturbine Set with Partial Admission Stages

by
Wojciech Włodarski
and
Marian Piwowarski
*
Faculty of Mechanical Engineering and Ship Technology, Institute of Energy, Gdansk University of Technology, Narutowicza 11/12, 80-233 Gdansk, Poland
*
Author to whom correspondence should be addressed.
Energies 2024, 17(8), 1792; https://doi.org/10.3390/en17081792
Submission received: 14 February 2024 / Revised: 28 March 2024 / Accepted: 3 April 2024 / Published: 9 April 2024
(This article belongs to the Section F1: Electrical Power System)

Abstract

:
The vapour microturbine set’s mathematical model has been updated to consider the partial admission of turbine stages. Experimental data from two distinct microturbine sets were used to verify the model. The model of the microturbine set was tested under varying operating conditions. Examples of a comparison between the experimental results and simulations are presented and analysed. It has been shown that, when simulating the off-design operation of multistage microturbines, not taking into account power losses due to partial admission may lead to significantly incorrect results. This conclusion does not apply to single-stage microturbines.

1. Introduction

Microturbine sets are power systems that comprise a microturbine and mechanical energy receiver. In general, they are used for the local production of electricity and heat energy [1]. Both gas and vapour microturbines are applied. The literature describes the applications of microturbines. Sample items [2,3] can be pointed out in the case of gas turbine plants, while articles [4,5] can be indicated in the case of vapour turbine plants. For electric power generation from low-temperature heat sources, such as geothermal [6,7], ocean [8], or waste heat recovery systems [9], vapour microturbines can be used in conjunction with installations that employ the organic rankine cycle (ORC) [10] or organic flash cycle (OFC) [11].
For small power systems, such as individual households, off-design operation should be expected [12]. Simulation tests of microturbines are of great practical importance for this reason. Methods for simulating turbine operation in non-design conditions are being developed [13]. However, it should be noted that the established methodology is most often applicable to high-power turbines. Calculation methods that are effective for high-power applications may not be appropriate for microturbines, as the loss components remain the same, but their quantitative contribution may differ. Models for gas microturbines have been developed in most of the available literature (e.g., [14,15,16,17]). Most available simulations of vapour microturbines are related to CFD analysis. (e.g., [18,19,20]) or do not describe the cooperation between the turbine and electric generator [21].
There are few simulation studies linking the operating parameters of vapour microturbine sets with the electrical load. A model of a vapour microturbine set is described in [22]. This is an empirical model. The structure of the model is determined by observed experimental relations. The model assumes a linear relationship between electrical load and speed of rotation. However, the relationship between the mentioned variables is non-linear. It can be concluded that the mentioned model provides acceptable accuracy for operations with relatively small changes in device load.
The vapour microturbine set’s mathematical model was also developed in [23]. The relationships are partially derived from the generic equations. The mentioned model was validated using experimental data from the single-stage axial microturbine set. This model offers a wider operational area.
Tests carried out by the authors, which have not yet been published, indicate that the mentioned model [23] does not provide adequate accuracy for multi-stage microturbines. To investigate the cause of this phenomenon, it was hypothesized that it resulted from neglecting the impact of partial admission of microturbine stages.
Vapour microturbines are typically designed with partial admission stages, which is due to the small volume flow rate of the working medium. This solution allows for the design of turbine blades with sufficient efficiency by enabling the determination of the appropriate height. However, this introduces additional energy losses to the turbine stage. The mentioned mathematical models of the vapour microturbine set do not take this phenomenon into account. It has not yet been proven that excluding this phenomenon from the calculations does not significantly affect the accuracy of the simulation, particularly when analyzing the operation of the microturbine set in a wide load range. Therefore, it is necessary to develop or modify a mathematical model of a vapour microturbine set that includes the partial admission effects of the turbine stages. Verification should involve comparing calculation results with experimental data, preferably using a complete set comprising a microturbine and an electric energy generator. The conclusions would be helpful for studying operational aspects or engineering applications. A literature survey shows limited research on this topic.
The aim of this study is to investigate whether the partial admission issues mentioned above should be included in the analysis of vapour microturbine sets. This study’s significant contributions and innovations are:
  • The mathematical model of the microturbine set has been modified to take into account the partial admission of turbine stages.
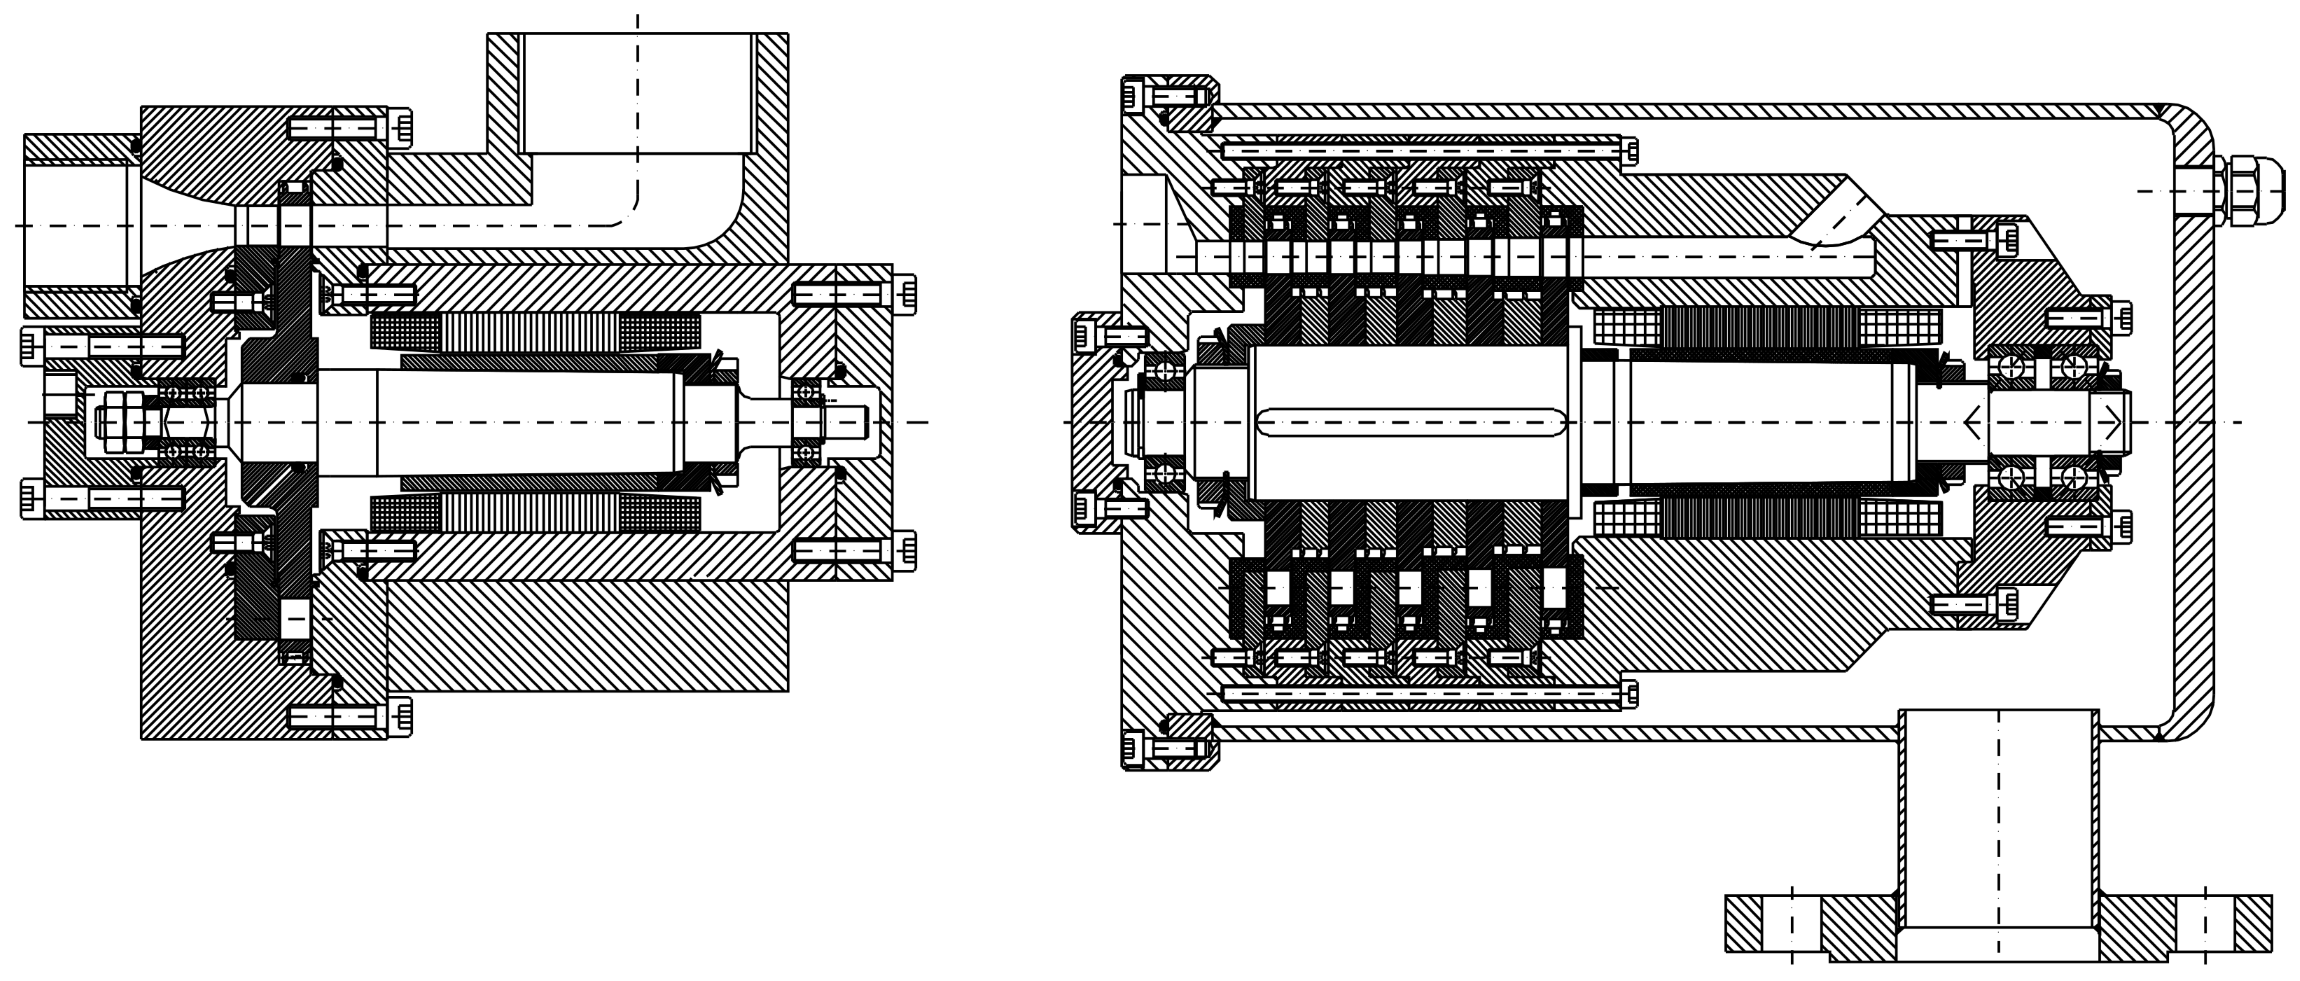
  • The model has been verified through unique experimental research. The analysis covered two structurally comparable microturbine sets that differed in the number of turbine stages with partial admission. The findings of such studies have not yet been published.
The paper is structured as follows: Section 1 provides an introduction, Section 2 describes the microturbine sets studied and analyses their mathematical model, Section 3 presents the results and discusses the model verification, and Section 4 draws conclusions.

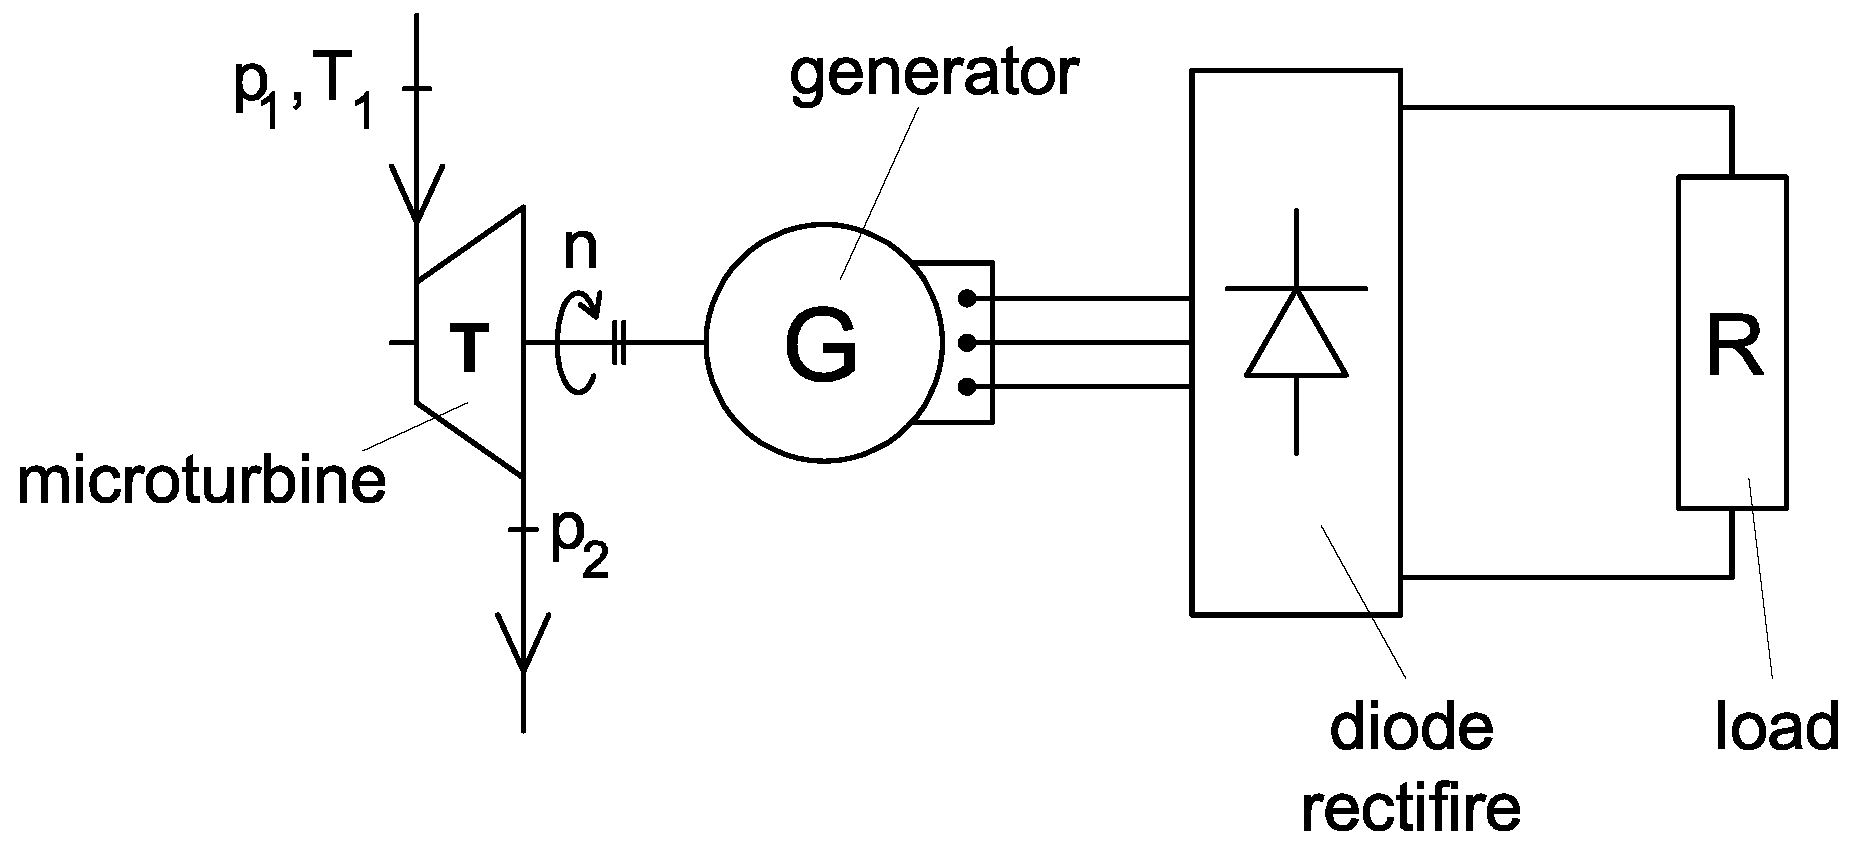
2. Mathematical Description of a Microturbine Set

Figure 1 shows the scheme of a microturbine set under consideration. A microturbine set comprises a microturbine and a three-phase permanent magnet generator that are connected to each other. A turbine is approached by a working medium at pressure p 1 and temperature T 1 . After the turbine, there is a medium pressure of p 2 . The rotor’s rotational speed is denoted by n. A diode rectifier is connected to a generator to convert alternating current into direct current. The direct current energy is converted into heat in a load resistor with a resistance R.
Two mathematical models of a microturbine set have been considered.

2.1. Model without the Effect of a Partial Admission—Base Model

The model is described in ref. [23]. The model is intended for vapour microturbine sets; however, it does not take into account the effect of partial admission energy losses. The model resulting from the generic equations presents the steady-state relation between the thermodynamic parameters of a working medium, a load resistance, and the angular speed of a vapour microturbine set.
( k 1 H s k 2 ω ) p 1 2 p 2 2 = R ω ( p k e ) 2 π 2 R + 18 R s 3 6 π 2 + p ω L 6 π 2 ,
where k 1 , k 2 are turbine coefficients, H s is the isentropic turbine enthalpy drop, ω is the rotor angular speed, p 1 , p 2 are turbine inlet and outlet pressure, R is the resistance of a system load, R s is the generator stator resistance, p is the number of the generator magnet poles, k e is the generator constant, L is the single-phase inductance of a generator stator.
Equation (1) represents the torque on a turbine shaft on the left side and the electromagnetic torque of a generator on the right side.
In this paper, the mentioned model will be called the base model.

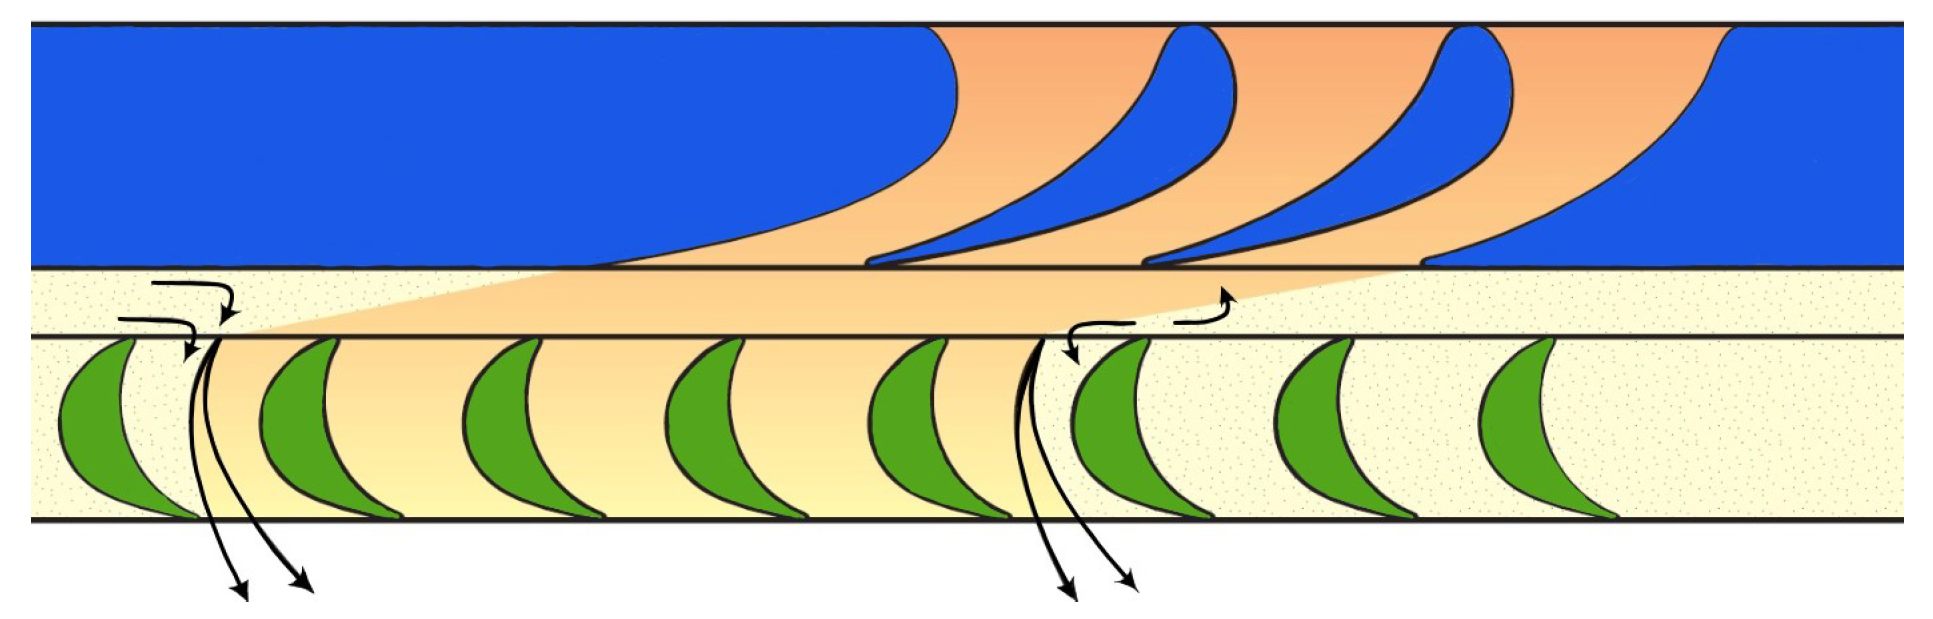
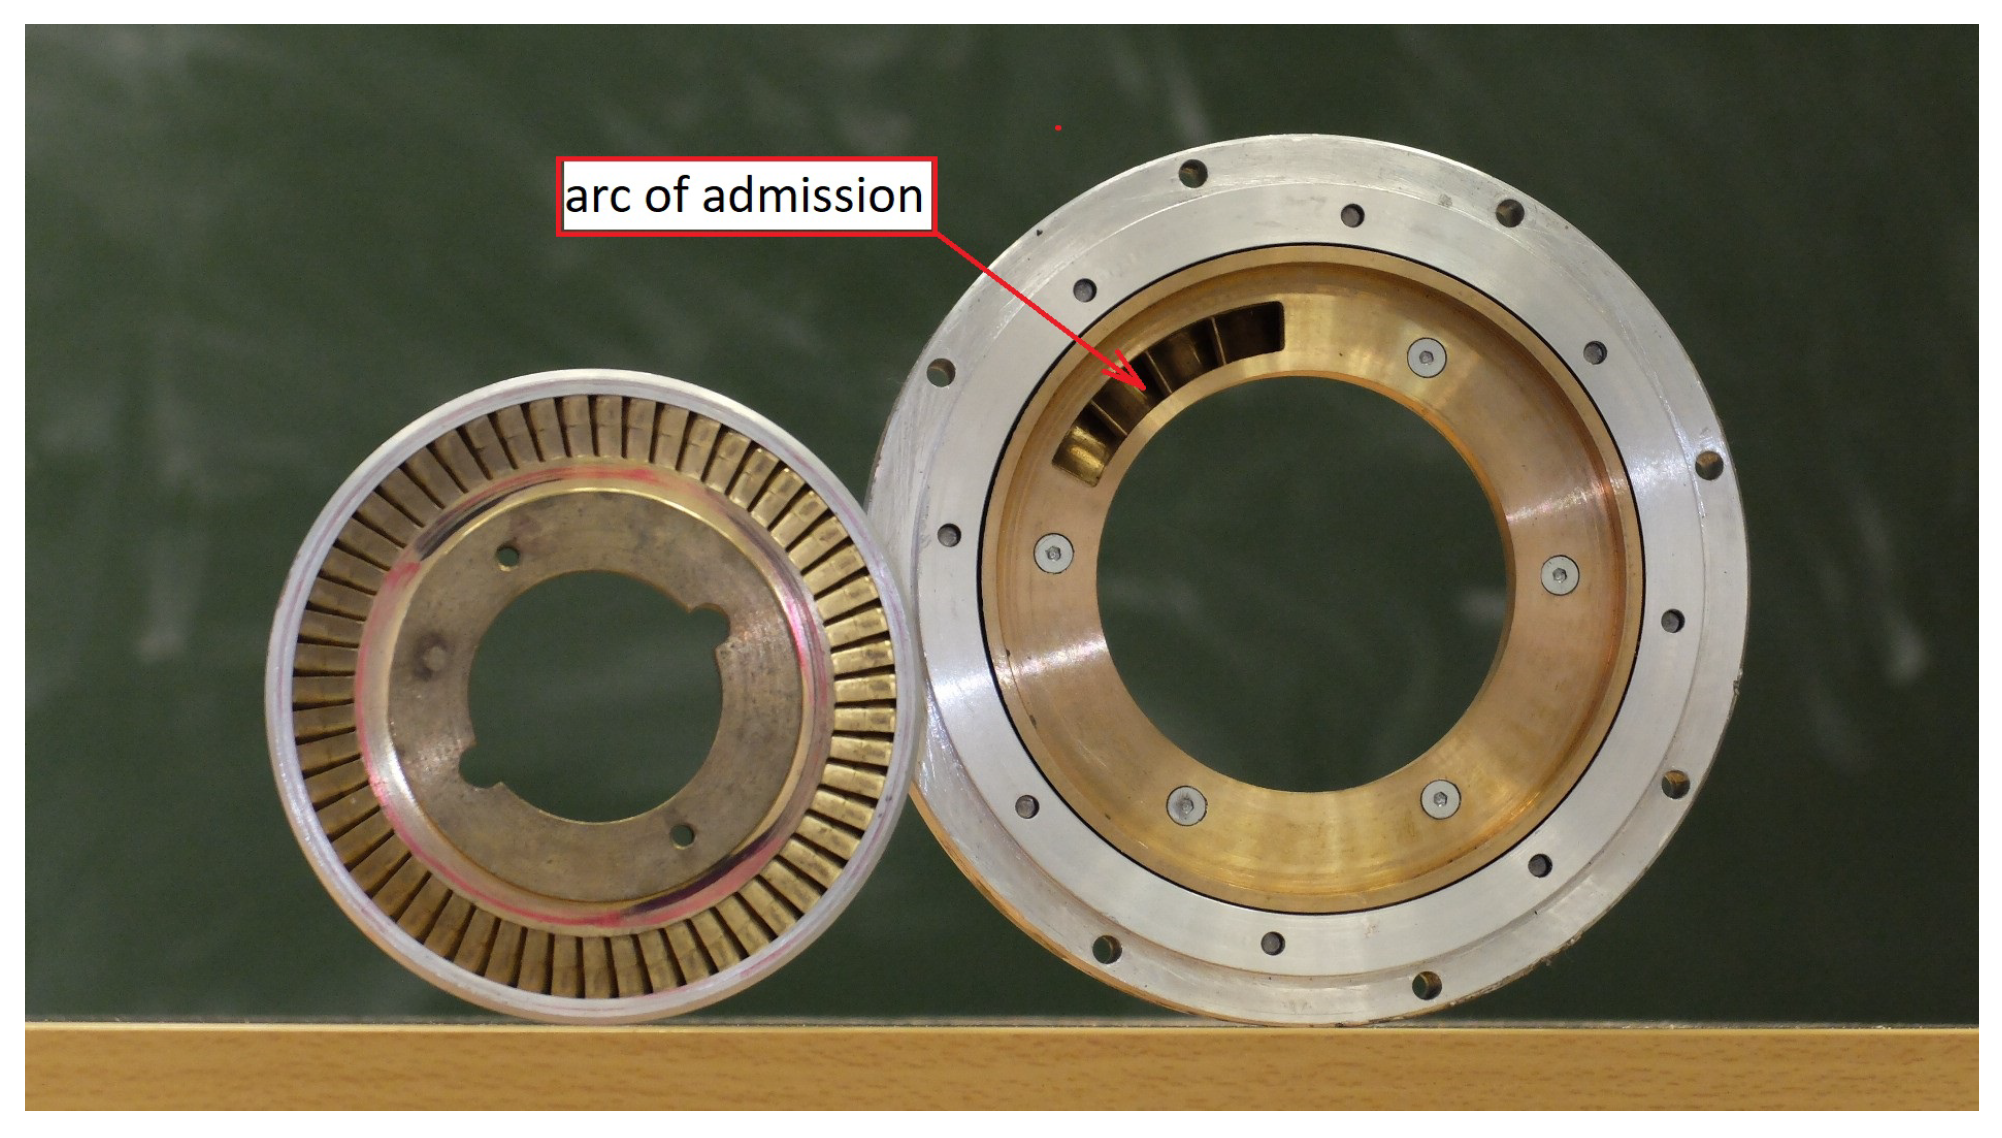
2.2. Model with the Effect of a Partial Admission—Developed Model

In some turbine stage cases, the volume flow rate of the working medium is so small that the admission along the entire nozzle circumference would necessitate a very short nozzle height and—as a result—very high energy losses. This is one of the reasons why nozzles are placed only on a fragment of the circumference. Rotor blades are placed on the whole circumference of the disc and they periodically enter and leave the area with flow from the nozzles. The mechanism of losses in this type of solution is extremely complex (Figure 2). The losses appear in different places and are of various natures. In an area with no admission, the rotor blades cause working medium circulation, acting as a fan. This is known as windage losses, which are proportional to the length of the part of the turbine stage circumference without admission. Other complicated flows appear at the ends of the arc of admission, resulting in medium expansion losses in blade channels entering and leaving the admission segment, as well as losses resulting from the mixing of fluid and stagnant gas. In cases where the medium is only admitted in one segment, the power losses due to partial admission can be calculated from the formula [24]:
N V = k V ( 1 ϵ ) d l u 3 1 v = k V ( 1 ϵ ) d 4 l ω 3 1 8 v
where d—mean turbine stage diameter; k V —coefficient (depends mainly on turbine stage construction); ϵ —ratio of admission, defined as the length of the arc of admission τ to the entire circumference; ϵ = τ π d ; l—rotor blade height; u—blade speed at diameter d; v—mean specific volume of a working medium (as the discussed turbine stages have a very low degree of reaction, it is possible to write v v 1 v 2 , where indexes 1 and 2 denote parameters before and after the rotor blade cascade).
The equation for the ventilation torque of a turbine stage can be derived as follows:
M V = k V ( 1 ϵ ) d 4 l ω 2 1 8 v .
Equation (3) describes the torque of ventilation of a single turbine stage. For a multi-stage turbine, the following relation can be used:
M V = k V 1 ( 1 ϵ 1 ) d 1 4 l 1 ω 2 1 8 v 1 + + k V i ( 1 ϵ i ) d i 4 l i ω 2 1 8 v i + + k V f ( 1 ϵ f ) d f 4 l f ω 2 1 8 v f ,
i = 1 , 2 , , f , where f is the number of turbine stages.
In a steady state, the torque of a turbine should be equal to the sum of the electromagnetic and ventilation torques.
M T = M E + M V
where M T is a turbine torque, and M E represents the electromagnetic torque of a generator.
Taking Equations (1), (4) and (5) gives the following expression:
( k 1 H s k 2 ω ) p 1 2 p 2 2 = R ω ( p k e ) 2 π 2 R + 18 R s 3 6 π 2 + p ω L 6 π 2 + + i = 1 f k V i ( 1 ϵ i ) d i 4 l i ω 2 1 8 v i .
Formula (6) shows the steady-state relationship between the thermodynamic parameters of a medium, a load resistance, and the angular speed of a microturbine set with partial admission stages. It is important to note that this model is empirical rather than theoretical and does not isolate the known components of energy losses in turbines.
In this paper, the mentioned model will be called the developed model.

3. Models Validation

The results of the experiments were used for the validation of the models of a microturbine set. Two models have been considered: the model described in the literature [23] (base model), and the modified model with the effect of a partial admission of a turbine stage (developed model). Both models have been tested on two microturbines: single-stage and five-stage turbines, each with partial admission stages. Compressed air was used as the working medium for this consideration.
The considered microturbine sets are presented in Figure 3. Both microturbine sets have been designed to operate in the ORC micropower station and have turbine stages with partial admission. The arc of admission of the third-stage nozzle cascade from the five-stage microturbine is indicated in Figure 4. The ratio of admission of the single-stage microturbine is equal to 0.079. The ratios of admission for the five-stage microturbine are given in Table 1. Comprehensive information about the microturbine set devices and laboratory test stands can be found in references [23,25] (single-stage turbine) and [22] (five-stage turbine).
Figure 5 and Figure 6 show the data used to determine the coefficients k 1 and k 2 for the models. The figures illustrate the experimentally obtained relationships between rotational speed and load resistance while maintaining constant inlet and outlet pressure values.
The generator data for the single-stage microturbine set were taken from [23] ( R s = 1.00 Ω , k e = 0.0249 V s r a d , L = 0.00201 H ).
The generator phase stator resistance for the five-stage microturbine set was measured. Its value is R s = 1.84 Ω . The generator constant k e and inductance L were obtained from the relationship [23]:
( p ω k e ) 2 = ( U L L + I s R s ) 2 + ( p ω L I s ) 2 .
Based on the experimental data shown in Figure 7, the solution was found using a minimum square error: k e = 0.102 V s r a d , L = 0.00721 H .
A series of calculations were performed to compare the mentioned relations with the experimental data. The simulation results were compared to experimental data using graphs. The relative differences between the calculated and experimental results were also determined using the following formula:
δ n = n e x p n c a l n e x p ,
where n e x p is the rotational speed obtained from the experiment, and n c a l is the calculated rotational speed.
Different sets of observations were used to validate the models than the ones used to determine their coefficients.

3.1. Base Model

Turbine coefficients k 1 , k 2 for base model calculations were obtained from Equation (1). The following values were determined: k 1 = 4.03 × 10 9 m 2 s , k 2 = 3.25 × 10 10 m 3 s rad (for the single-stage microturbine) and k 1 = 2.11 × 10 8 m 2 s , k 2 = 6.81 × 10 10 m 3 s rad (for the five-stage microturbine).
The analysis was performed to compare the model’s results with the experimental findings. The rotational speed values were obtained by solving the Equation (1). The experimental values of the working medium parameters and load resistance were used as input data for the calculations. The resulting rotational speeds were then compared with the experimental data. The diagrams present the sample results.
Figure 8 displays the relationship between rotational speed and load resistance of the single-stage turbine during compressed air operation. The data are obtained from both experiment and base model calculations, with the pressure at the turbine inlet and outlet set at 5 bar and 1 bar, respectively. The graphs also display the relative differences between the results of the simulations and experiments. The maximum relative error for the rotational speed was 18.3%, but in most of the load range, errors were only a few percent.
Figure 9 shows a similar example for an inlet pressure of 6 bar. In this case, the maximum error occurred at the edge of the load range and was equal to 16.5%. In the other parts of the load range, the errors did not exceed 5.9%.
The base model’s inaccuracy for low values of load resistance is much higher than the results presented in [23]. However, it is important to note that the tests in this article were conducted over a much wider range of loads.
Figure 10 and Figure 11 present validation results for the five-stage turbine at an inlet pressure equal to 5 and 6 bars. In these cases, the differences between the experiment and the calculation results were much larger. The base model overestimated the rotational speed over almost the entire load range. Relative errors ranged from a few to almost 30%.

3.2. Developed Model

The values of the k V coefficient were calculated from the following relation [24]:
k V = ( 0.14 + 1.8 l d ) sin ( β 2 ) ,
where l is the rotor blade height; d is the mean rotor cascade diameter; and β 2 is the relative flow angle at the rotor blade cascade exit. The following values were determined: k V = 0.0890 (for the single-stage microturbine) and k V = 0.0852 (for the five-stage microturbine).
Performing developed model calculations requires determining the mean specific volume of the working medium before and after the rotor blade cascade. In the case of single-stage turbine tests, a pressure equal to 1 bar and a temperature of 283 K were assumed for the average specific volume determination. In the case of five-stage turbine tests, the algorithm given in Appendix A was applied.
Turbine coefficients k 1 , k 2 for developed model calculations were obtained from Equation (6). The following values were determined: k 1 = 3.75 × 10 9 m 2 s , k 2 = 2.21 × 10 10 m 3 s rad (for the single-stage microturbine) and k 1 = 2.54 × 10 8 m 2 s , k 2 = 2.71 × 10 9 m 3 s rad (for the five-stage microturbine).
The experimental data were used to compare the results. The rotational speed values were calculated by solving the Equation (6). The experimental values of the working medium parameters and load resistance were used as input data for the calculations. The sample results are presented in the diagrams.
The rotational speed of the single-stage turbine is presented in Figure 12 and Figure 13 as a function of the load resistance. The data were obtained from both experimental and model calculations for compressed air operation. The pressure at the turbine inlet was set at 5 bar and 6 bar. In most parts of the load range, the differences between the experiment and the calculation results did not exceed a few percent. The maximum values of errors (up to 17.6%) were observed for the smallest values of load resistance.
The results of the developed model validation for the five-stage turbine are shown in Figure 14 and Figure 15 (for inlet pressure equal to 5 and 6 bars). The relative errors for the rotational speed exceeded 10%.

3.3. Discussion

It should be noted that the accuracy of the developed model for the single-stage turbine is practically the same as for the base model. Including partial admission of the turbine stage in the model did not increase its accuracy. The change in the turbine inlet pressure value did not significantly affect the accuracy of the results. In most of the load range, the considered model inaccuracy did not exceed a few percent. However, a visible decrease in accuracy was observed at the lowest values of the load resistance. Therefore, it should be considered whether, in this case, the accuracy of the model is not influenced to a greater degree by the simplifications related to the electric part of the set (e.g., not taking into account the energy losses in the diode rectifier) than with the turbine flow part.
The analysis of the results for the five-stage turbine leads to other conclusions. Simulating the operation of the five-stage microturbine set by the relation of the base model significantly overestimates the value of the rotational speed. The calculations had relative errors as high as 30% compared to the experiment. Such accuracy in practical applications can be unacceptable. The developed model has significantly improved the accuracy of the simulation of the five-stage microturbine. The simulation error values decreased to about 10%.
This phenomenon can be explained by analysing Equation (2). The power losses due to partial admission of a turbine stage depend on its construction, rotational speed, and the specific volume of the working medium in the rotor blade area. The construction of the considered single and five-stage microturbines was similar. Both microturbines were operated within similar rotational speed ranges and similar thermodynamic parameters of the working medium. It is important to note that the distribution of the expansion of the working medium in a single-stage turbine differs from that in a multi-stage turbine. Most of a drop in pressure in a single-stage turbine with partial admission takes place in a nozzle cascade (discussed turbine stages have a very low degree of reaction). This means that rotor blades operate at a specific volume of the working medium close to a turbine outlet pressure. In a multi-stage turbine, the working medium expansion is realised successively in the next stages. The turbine stages (except the last one) operate at smaller values of the specific volume, so power losses due to partial admission will be greater than in an equivalent single-stage turbine.
This leads to the conclusion that, when simulating the off-design operation of multistage microturbines, not taking into account power losses due to partial admission may lead to significantly incorrect results.
However, it should be mentioned that the conclusions were drawn from research on only two objects. Therefore, it cannot be ruled out that these results were accidental and should be verified in the future using another research method.

4. Conclusions

This paper describes modifications made to the mathematical model of a set comprising a vapour microturbine, a three-phase permanent magnet synchronous generator, and a diode rectifying unit. The established relationships include the energy losses of the partial admission of a turbine stage. In particular, the following tasks were carried out:
  • The experimental data were used to determine the model parameter values. The data from the two distinct microturbine sets were utilised. The microturbines were structurally comparable, however, they differed in the number of turbine stages with partial admission.
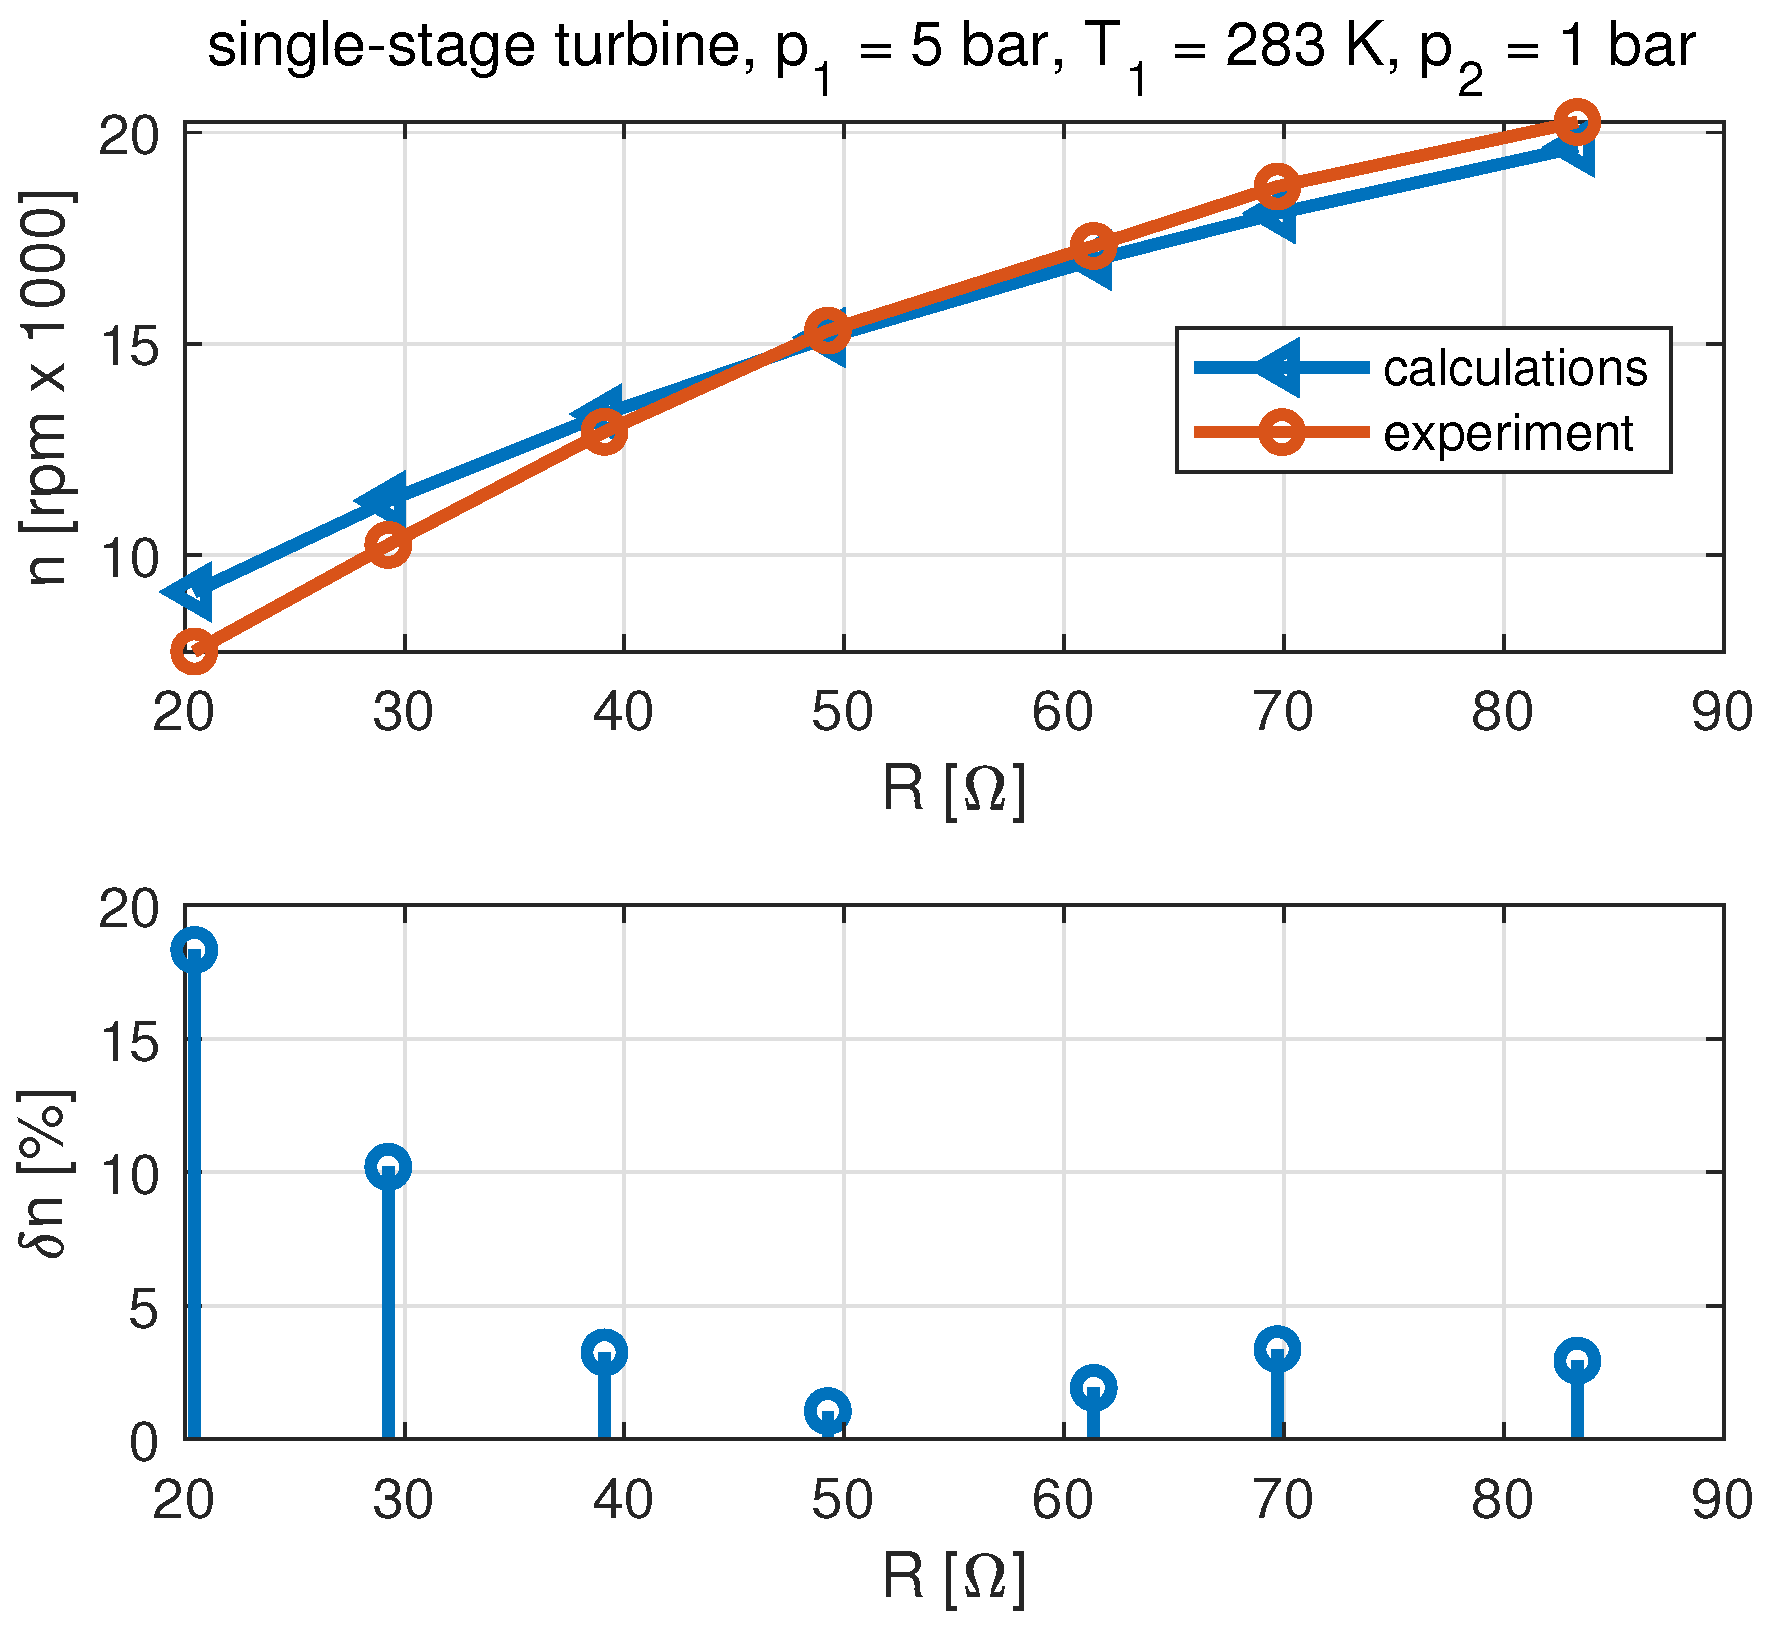
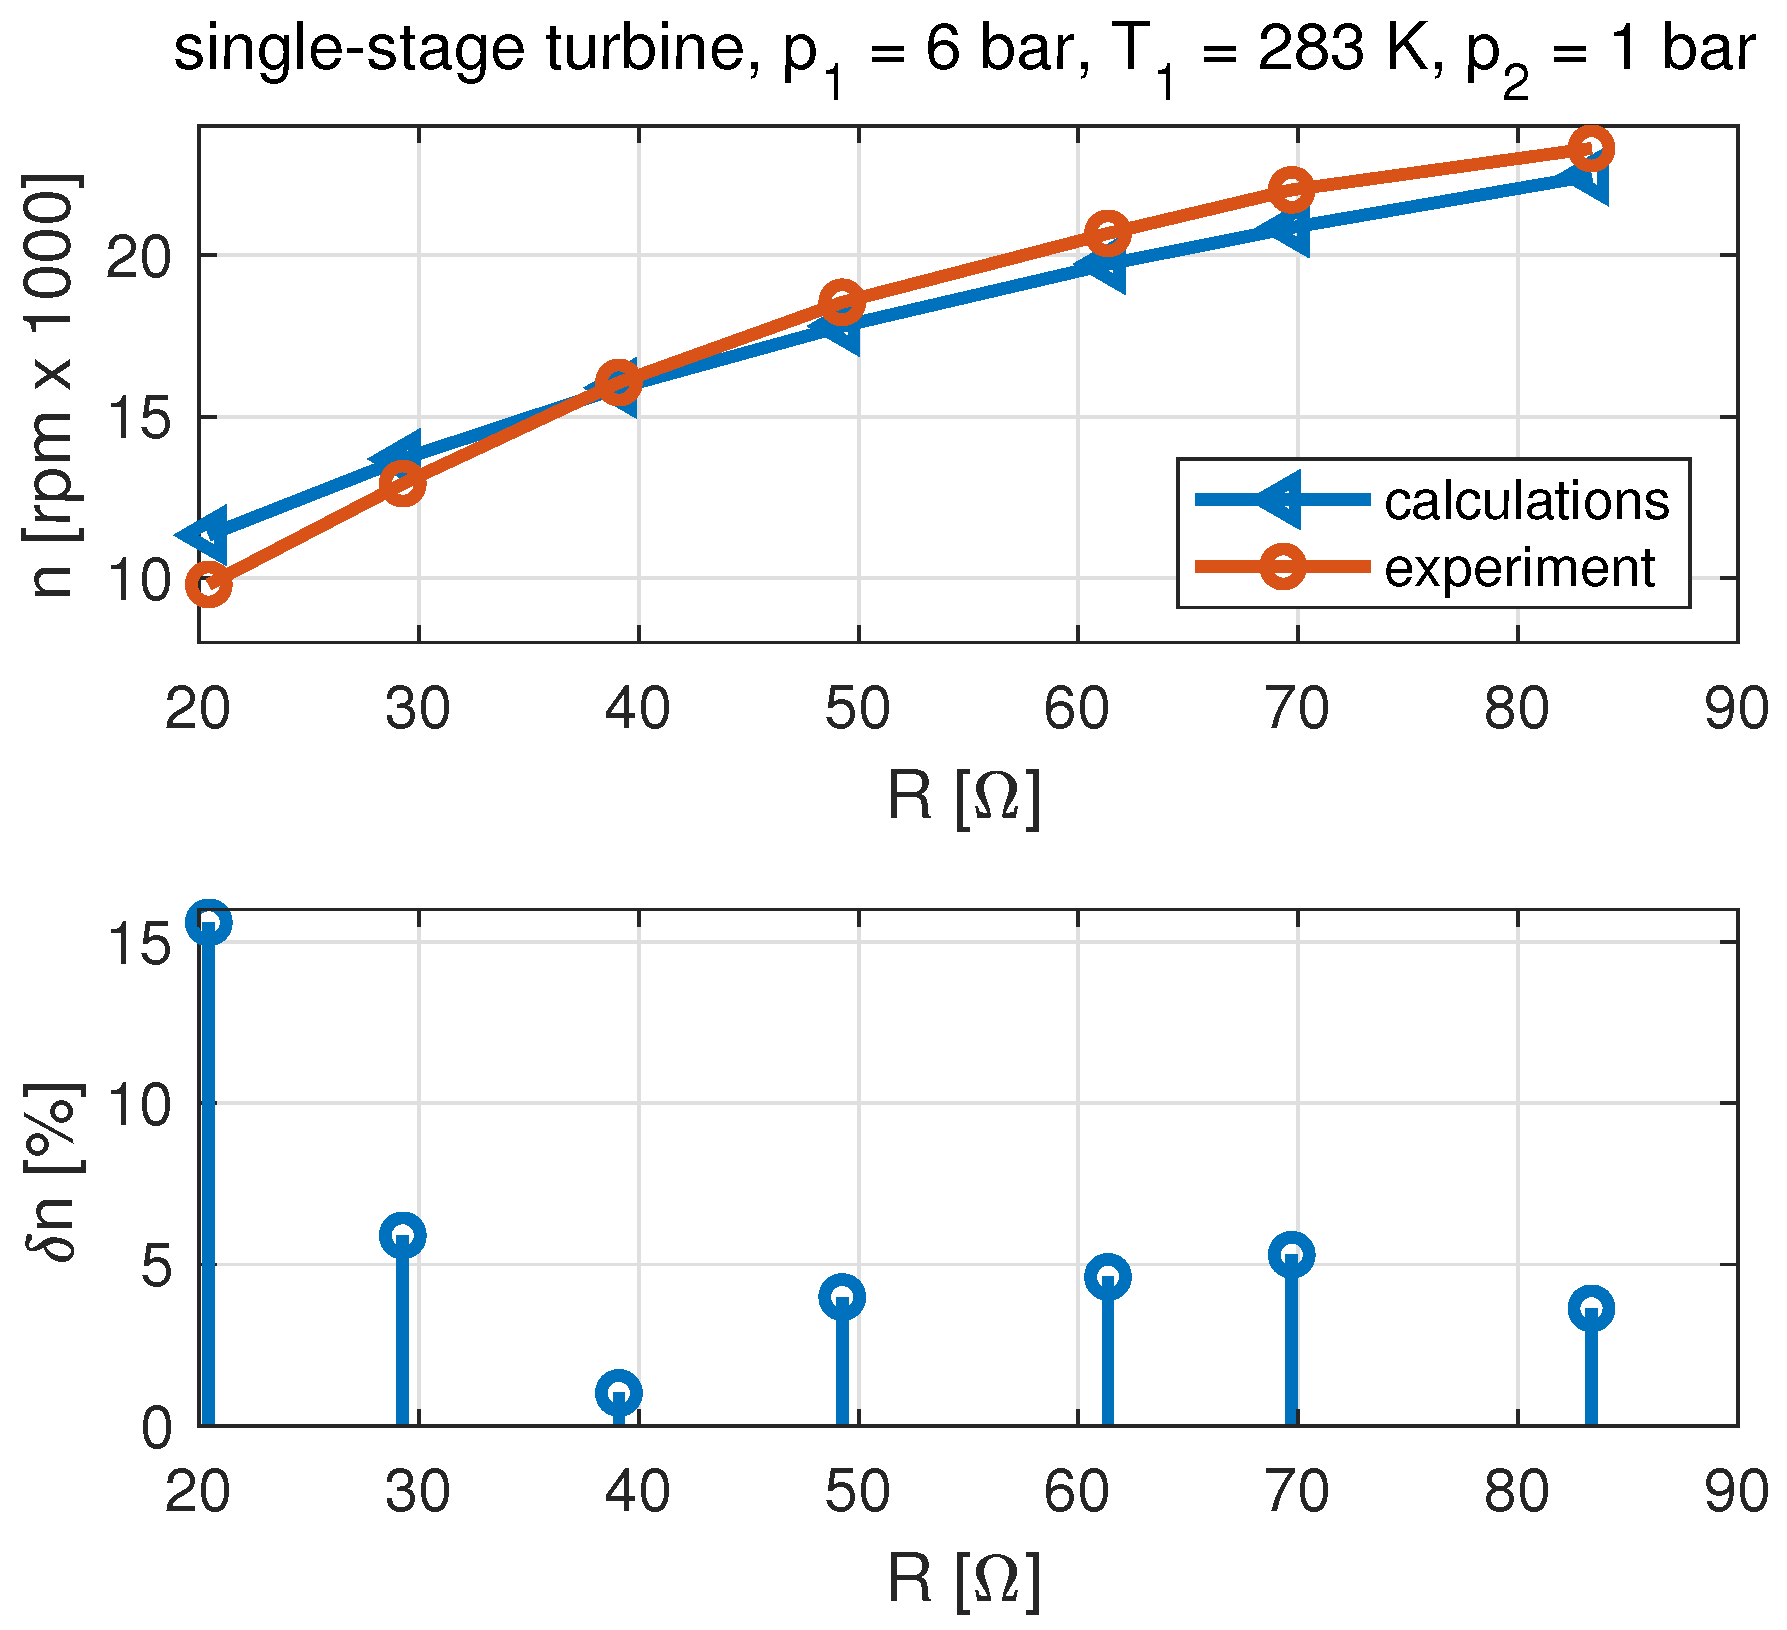
  • Calculations were performed to simulate the performance of both microturbine sets. The simulation data were compared to the results of the experimental tests. Tests were performed within a large range of operational areas.
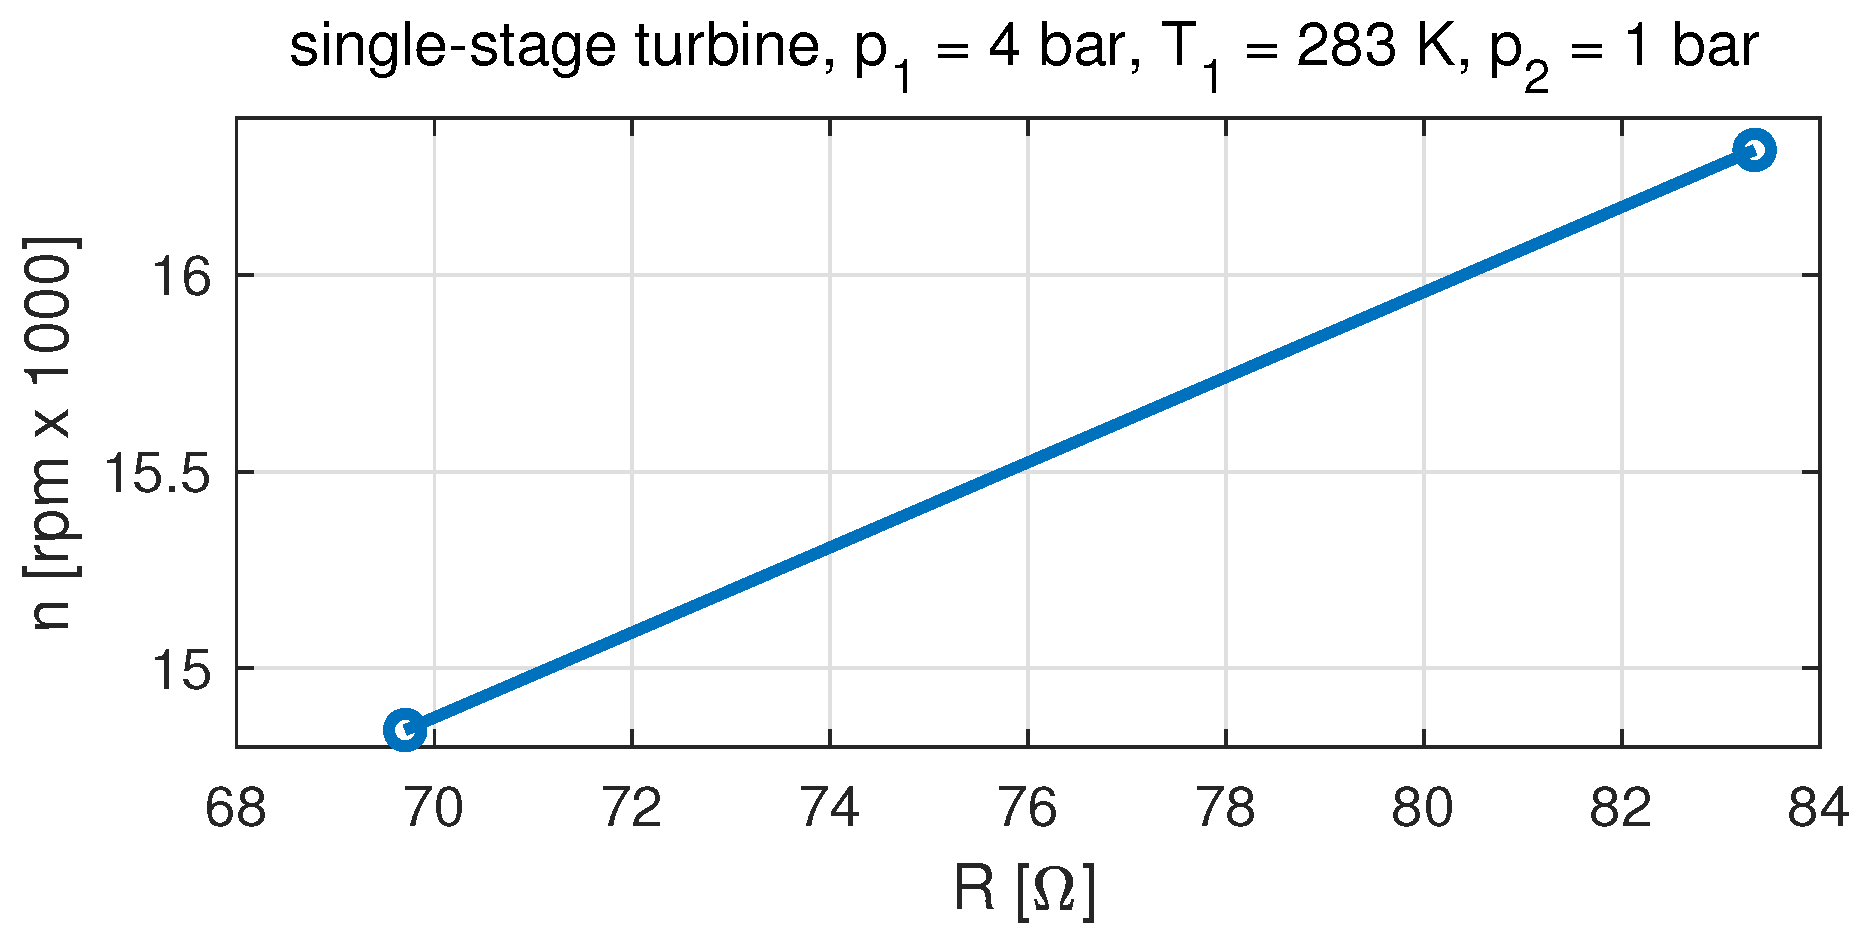
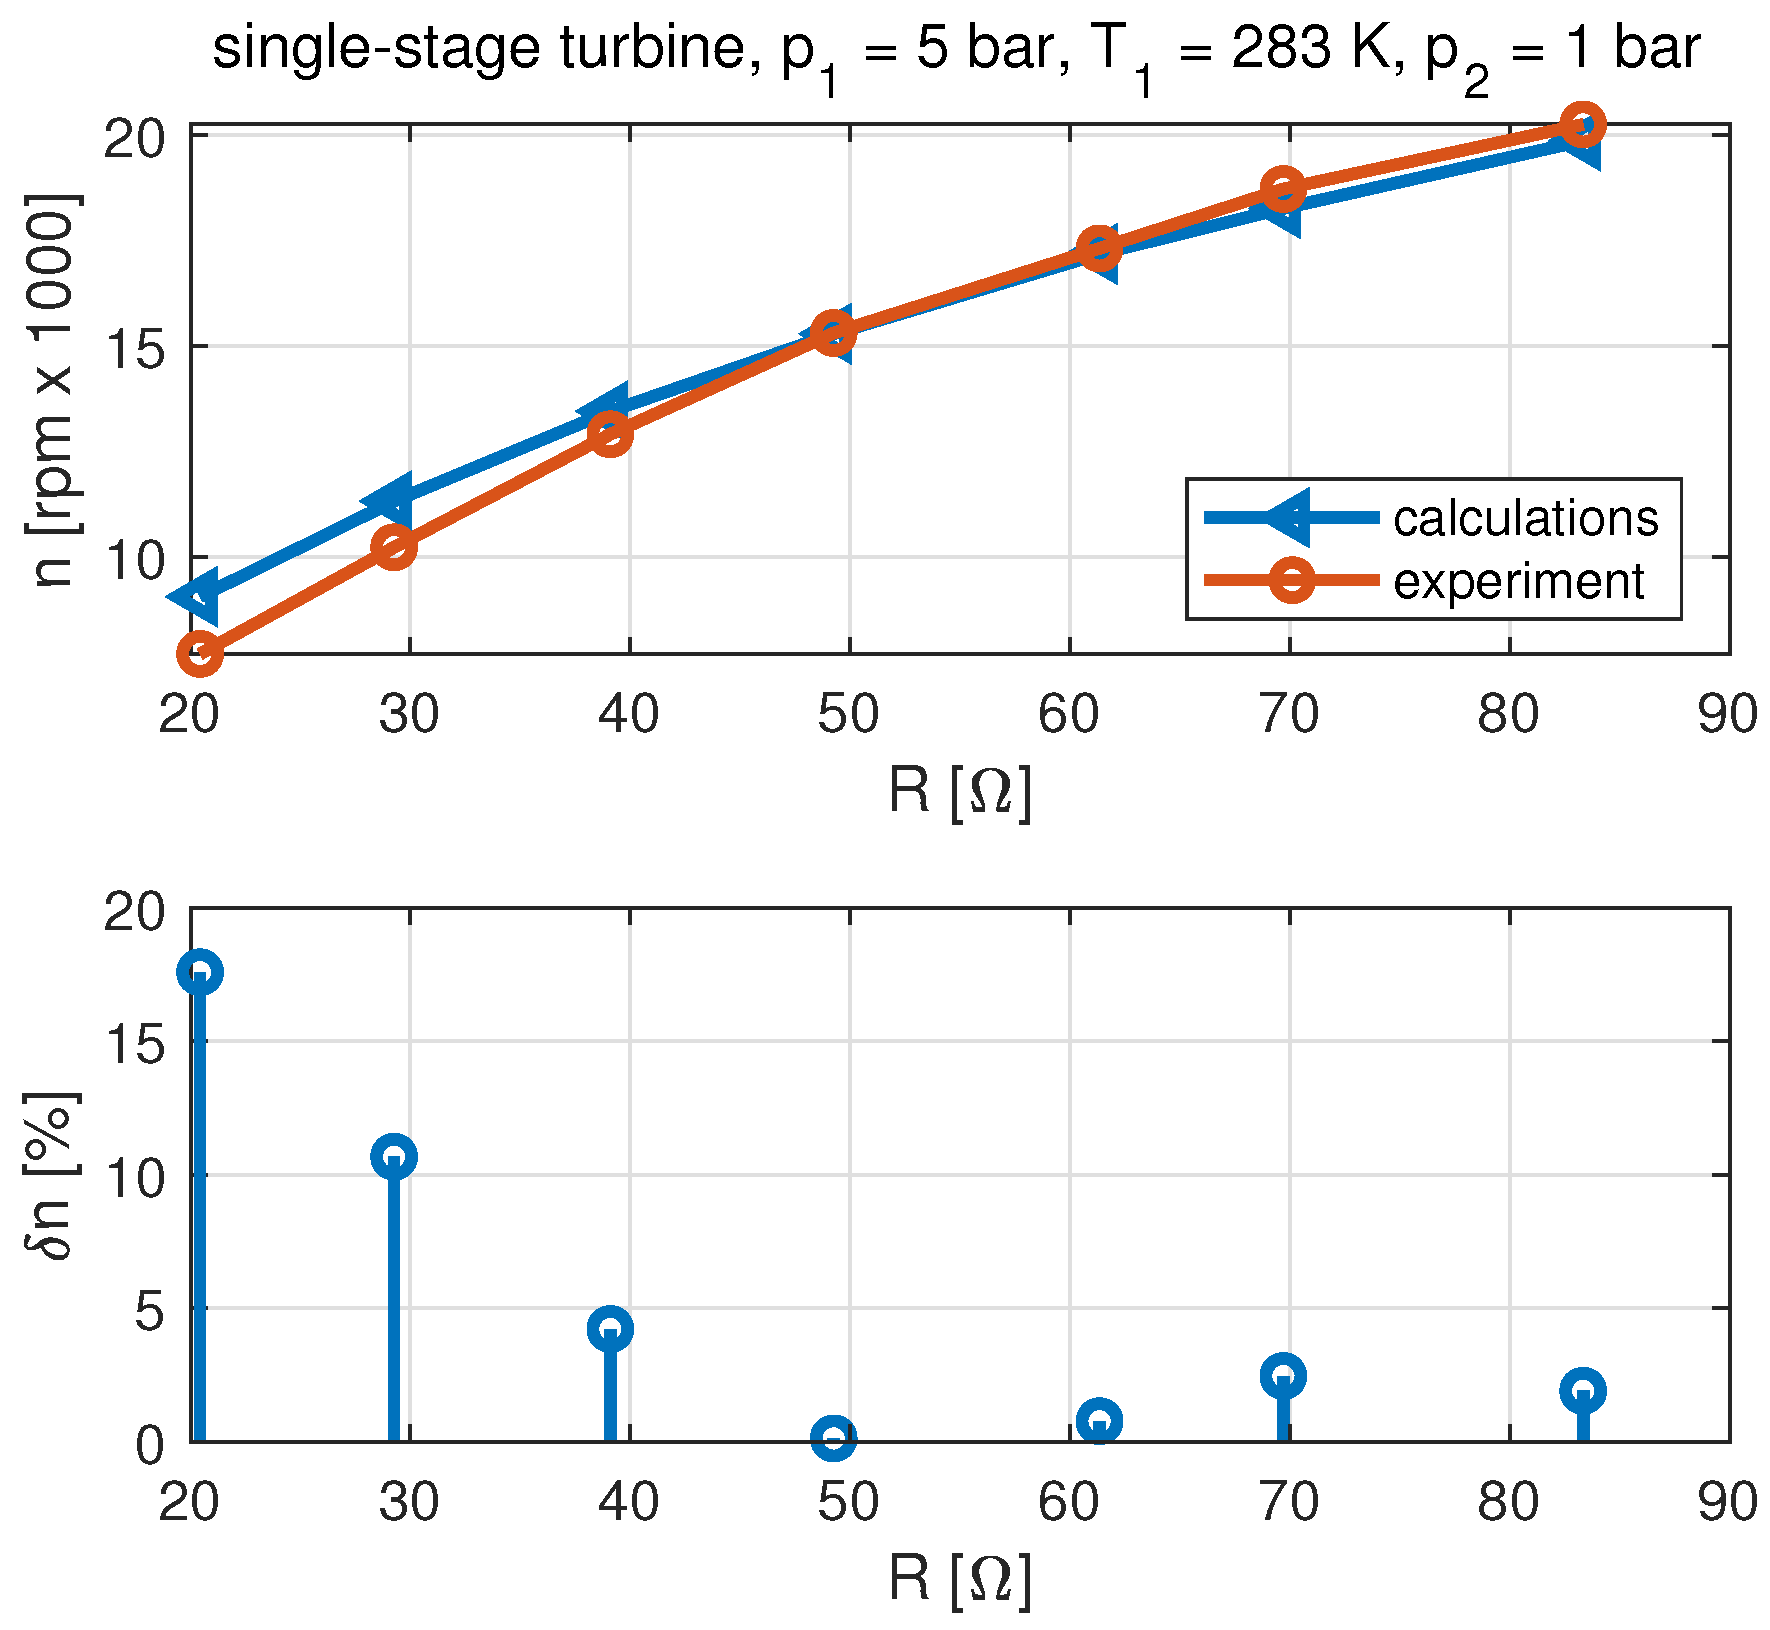
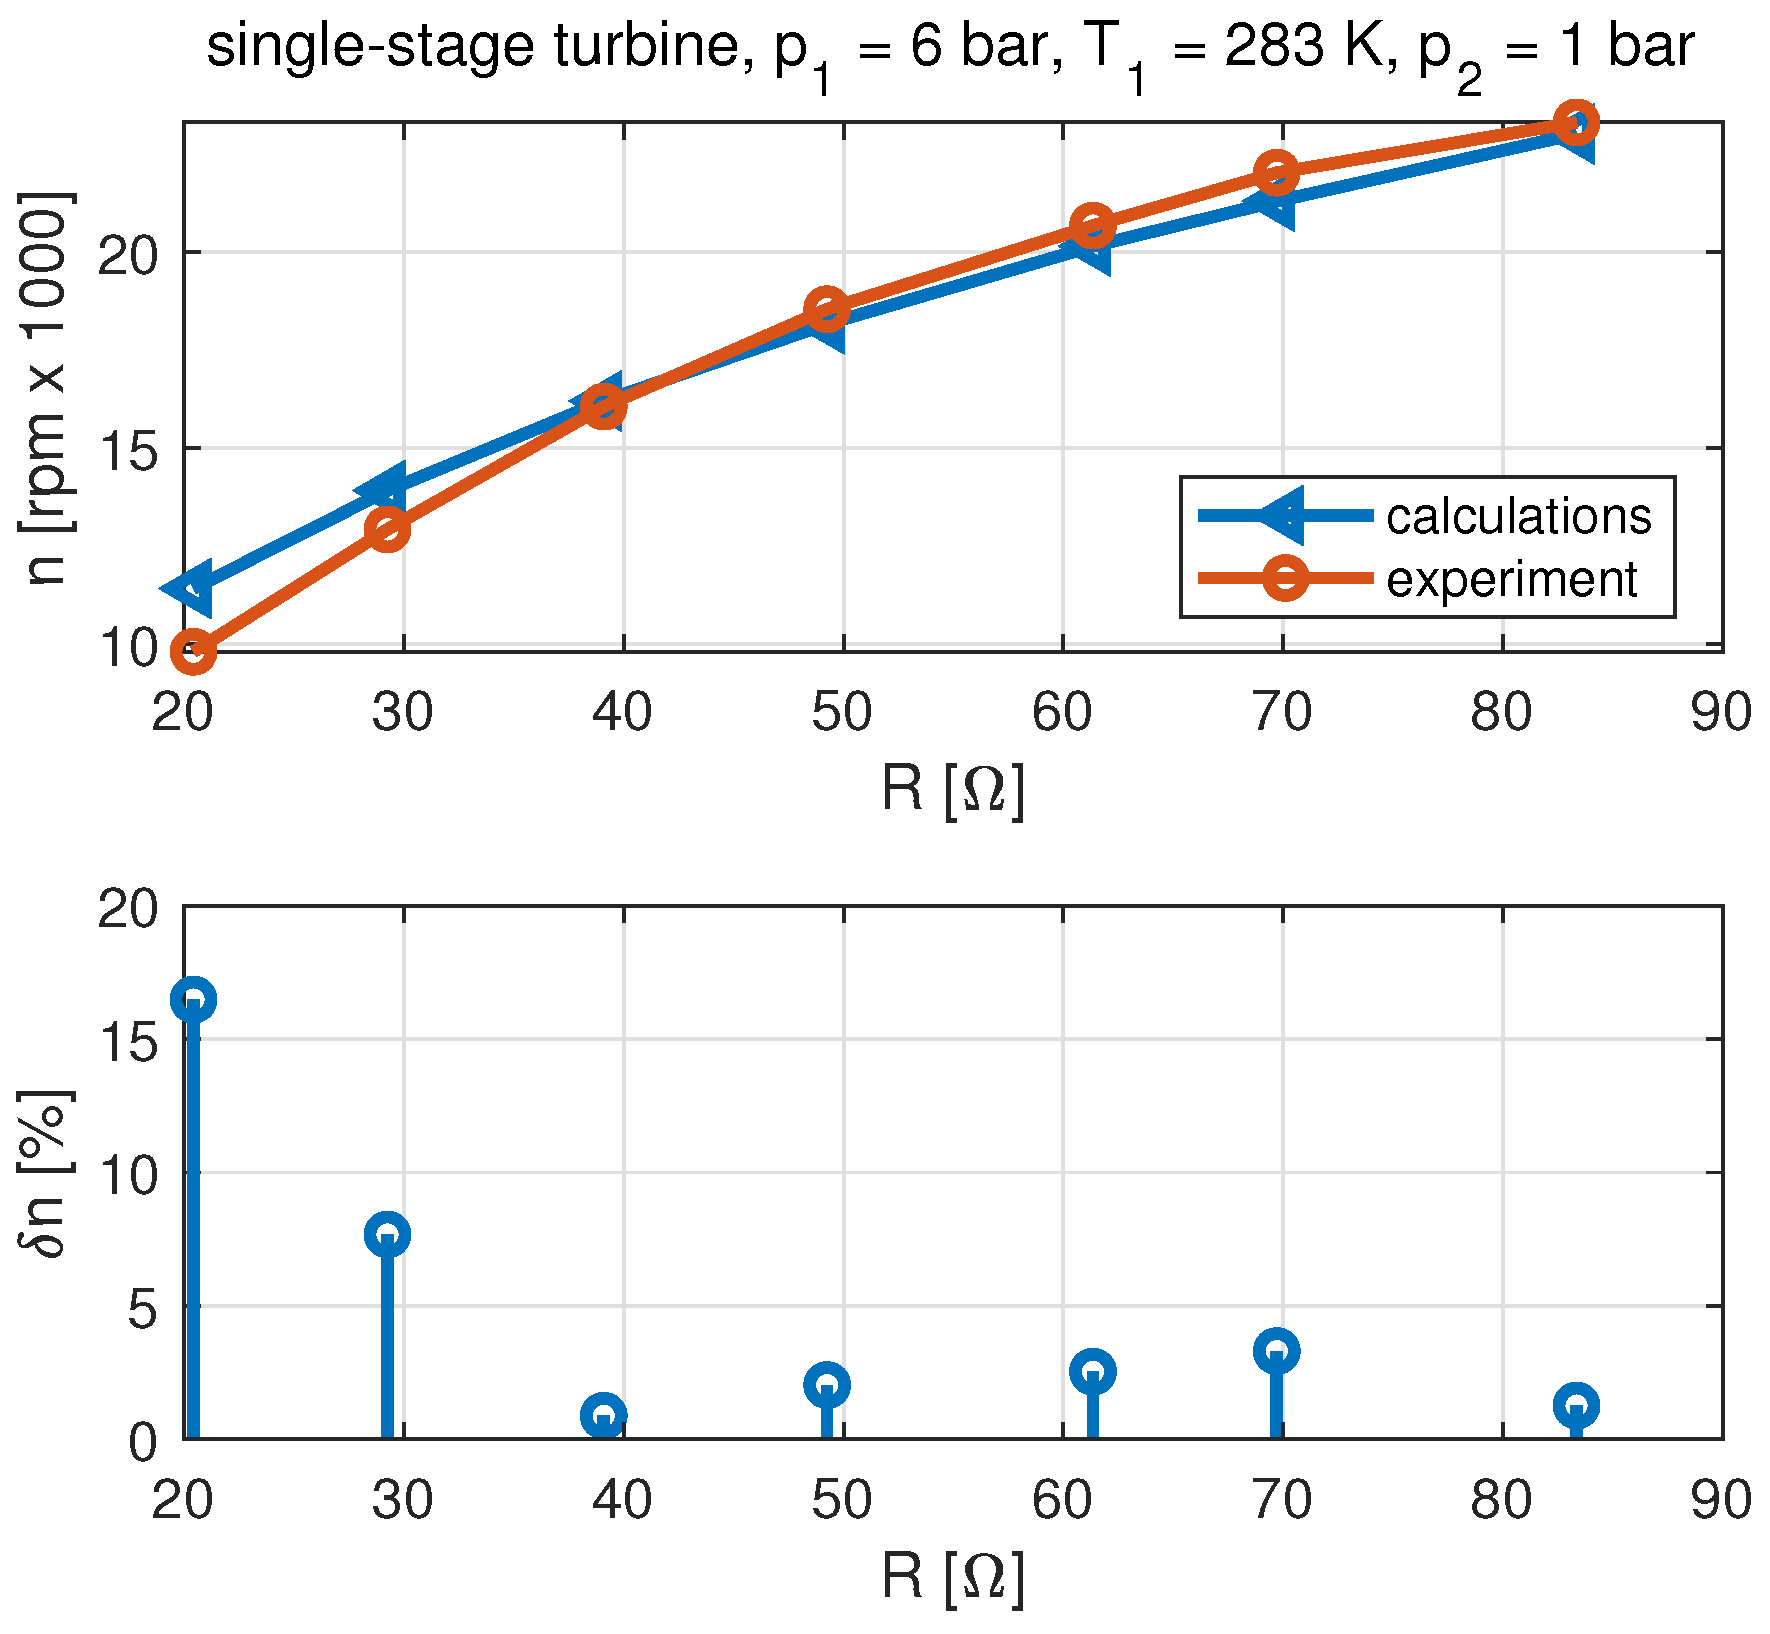
  • The results of the single-stage microturbine set have indicated that the developed modification of the model did not increase the simulation accuracy.
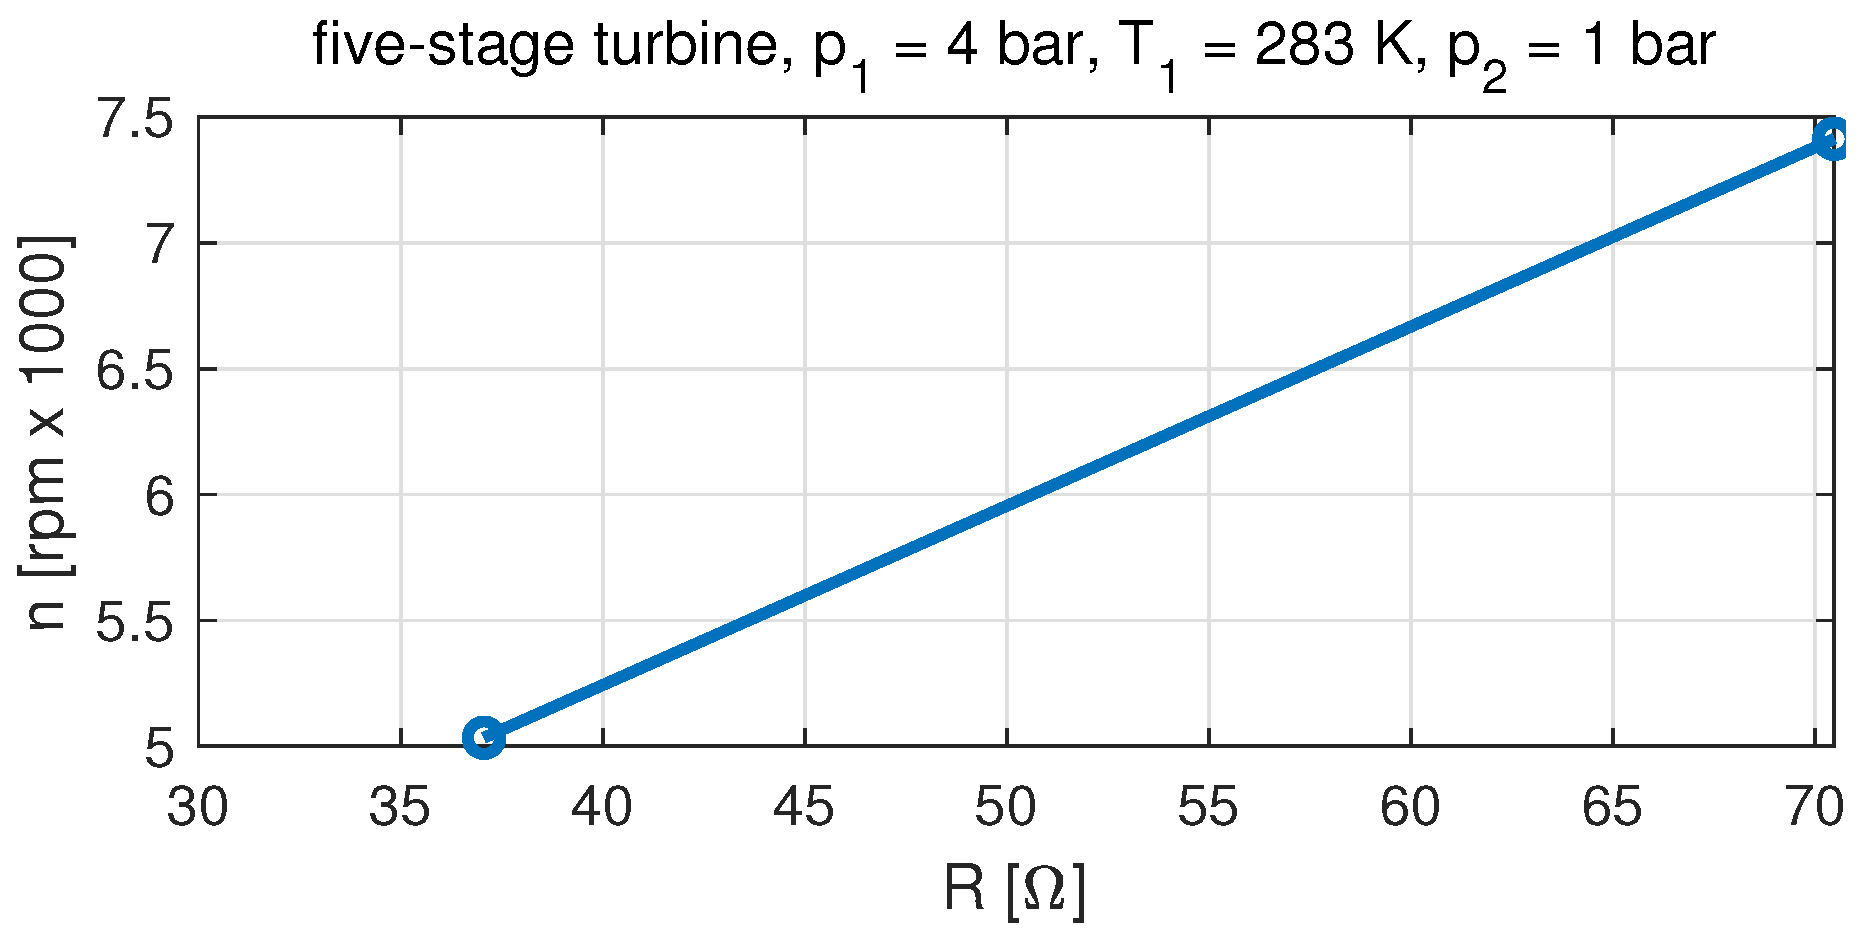
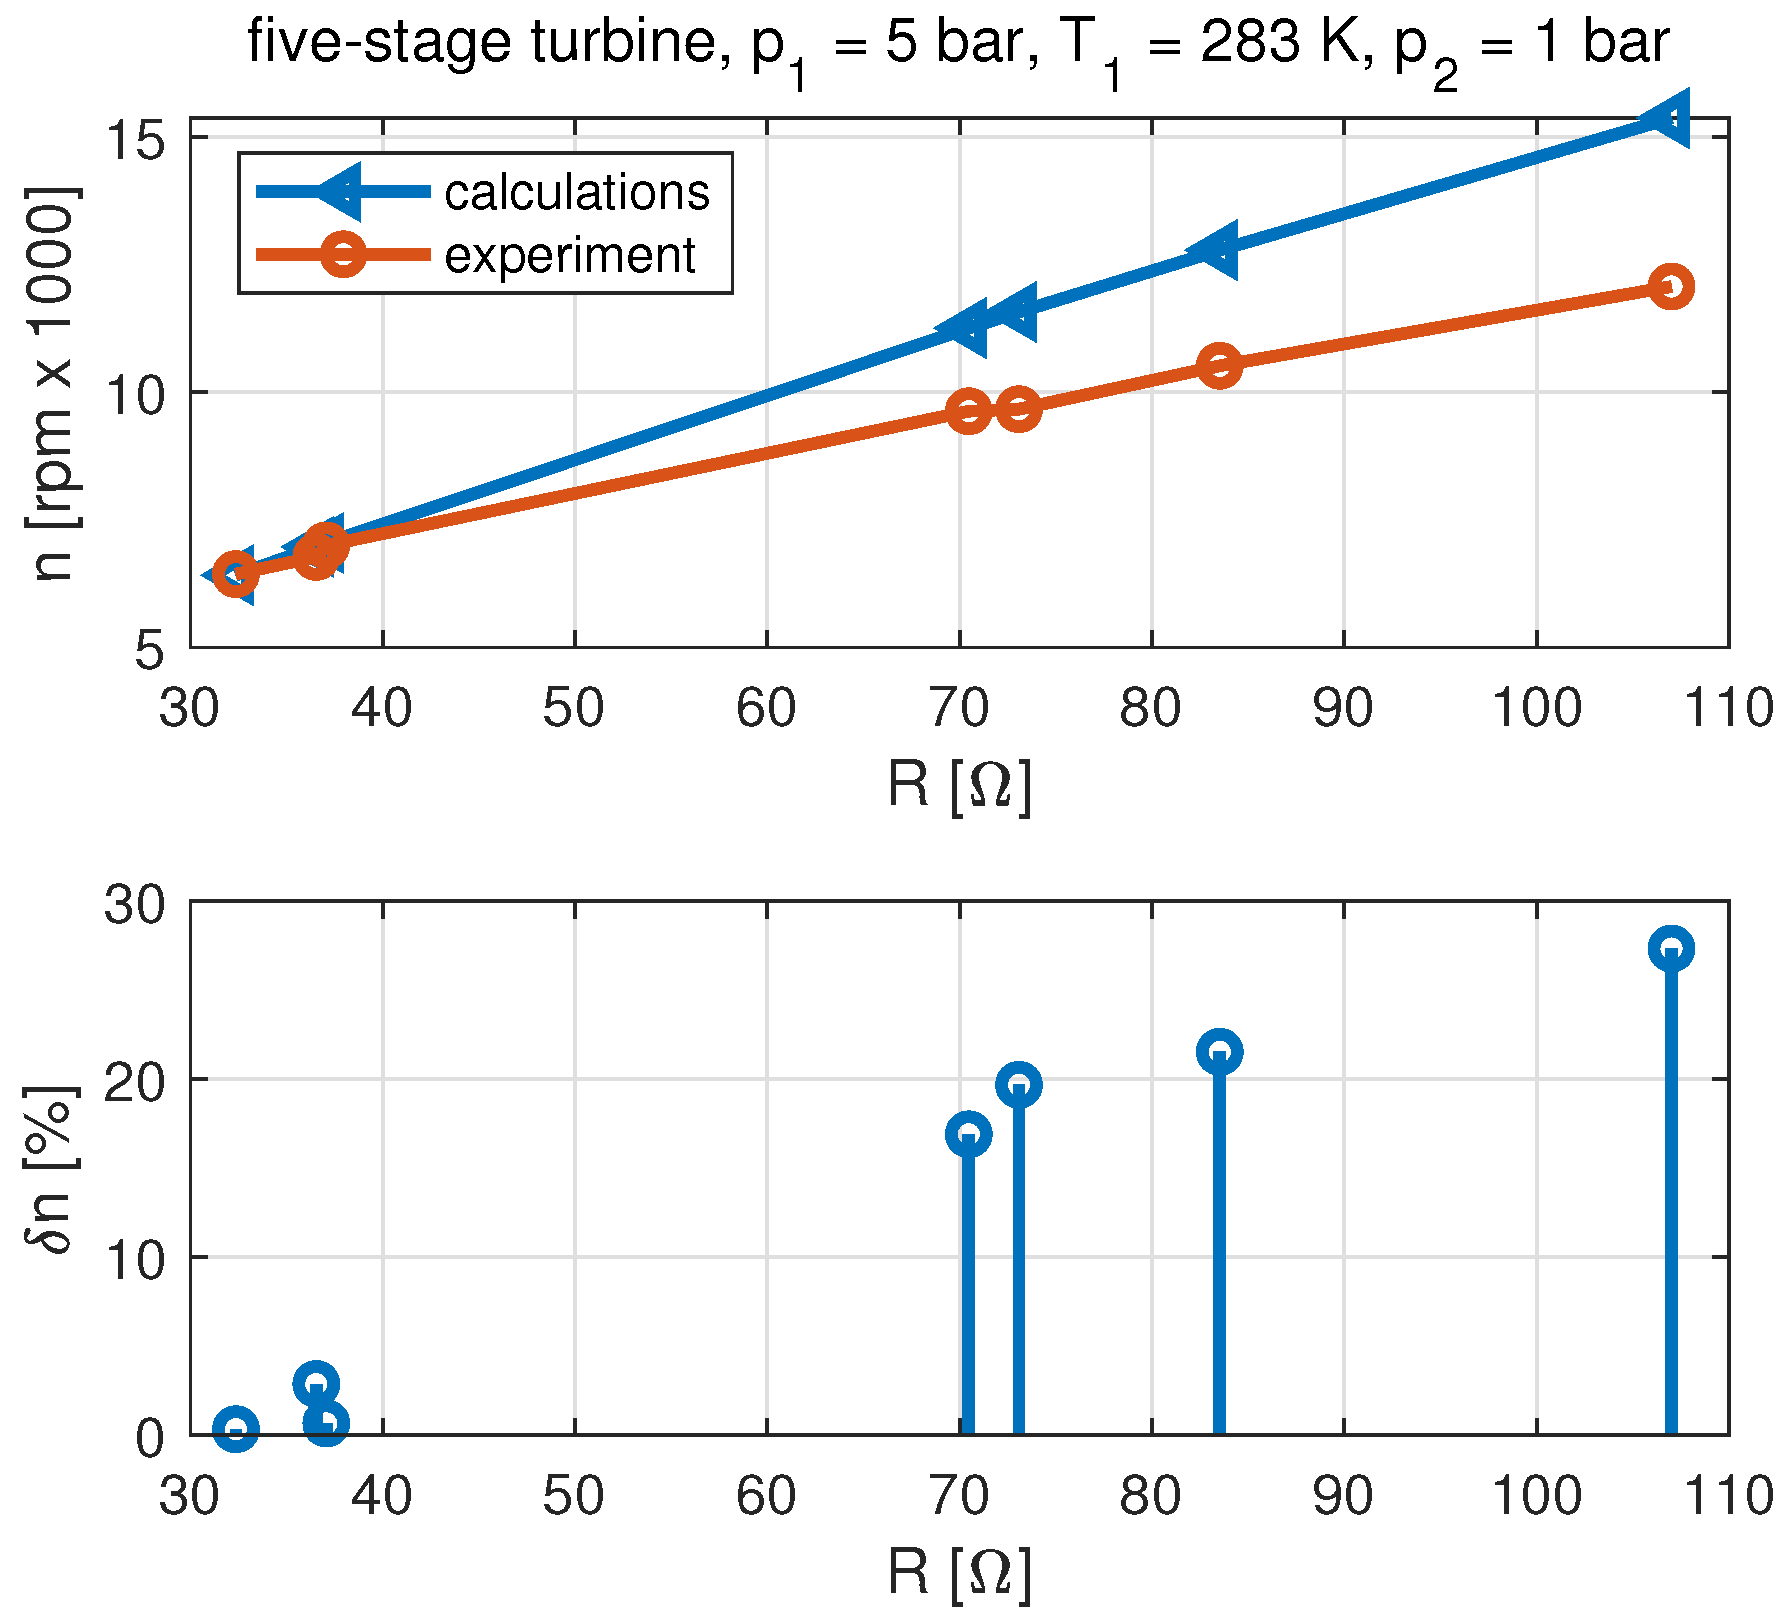
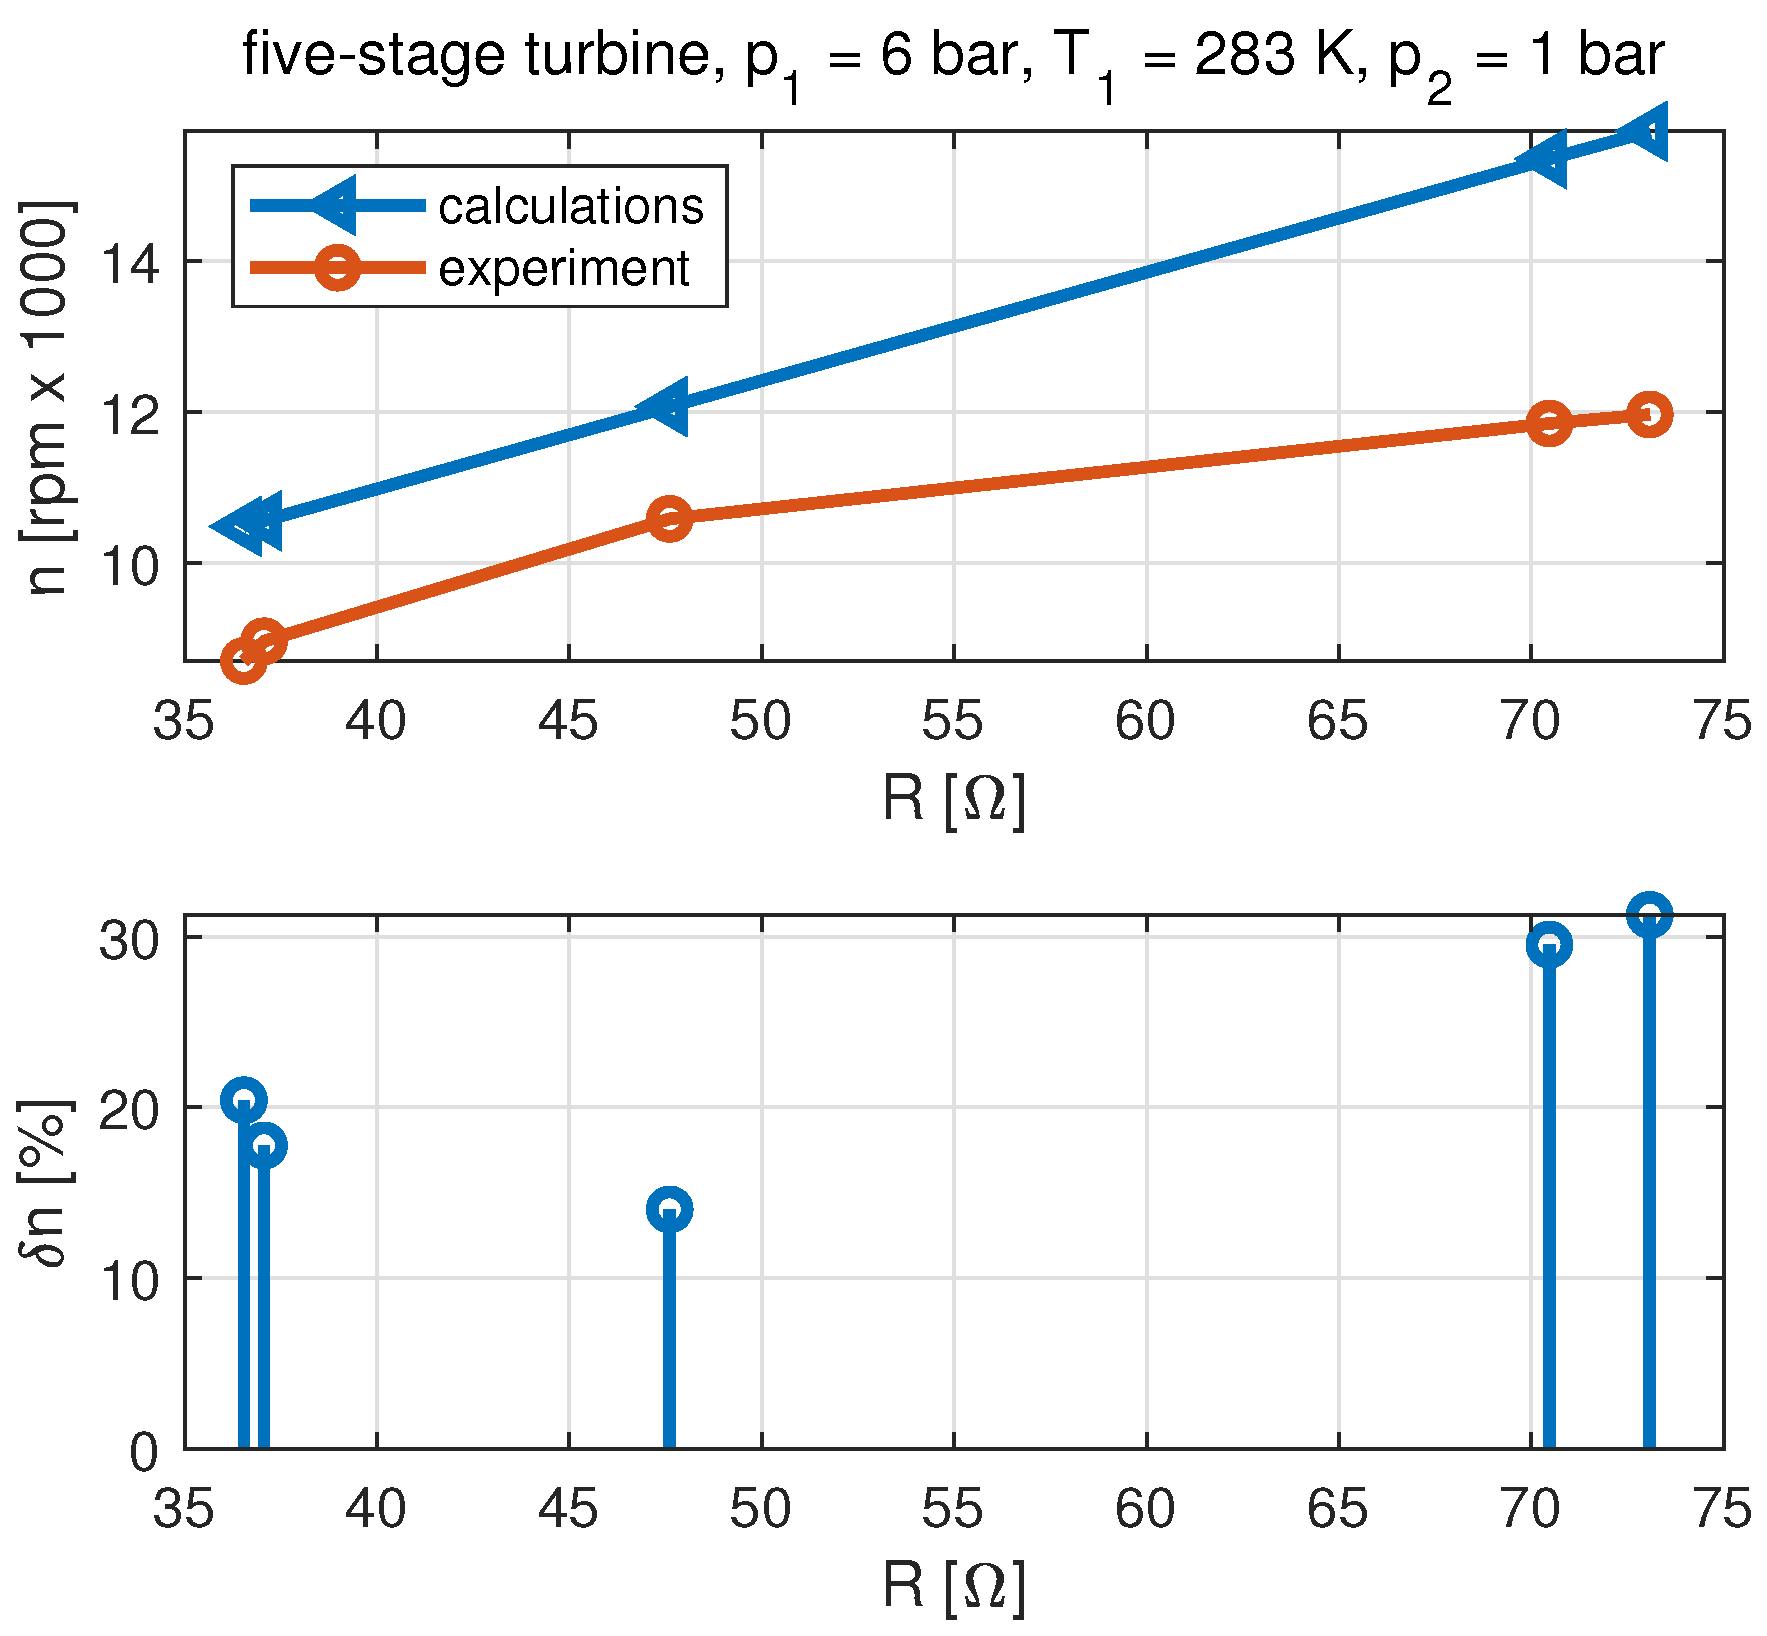
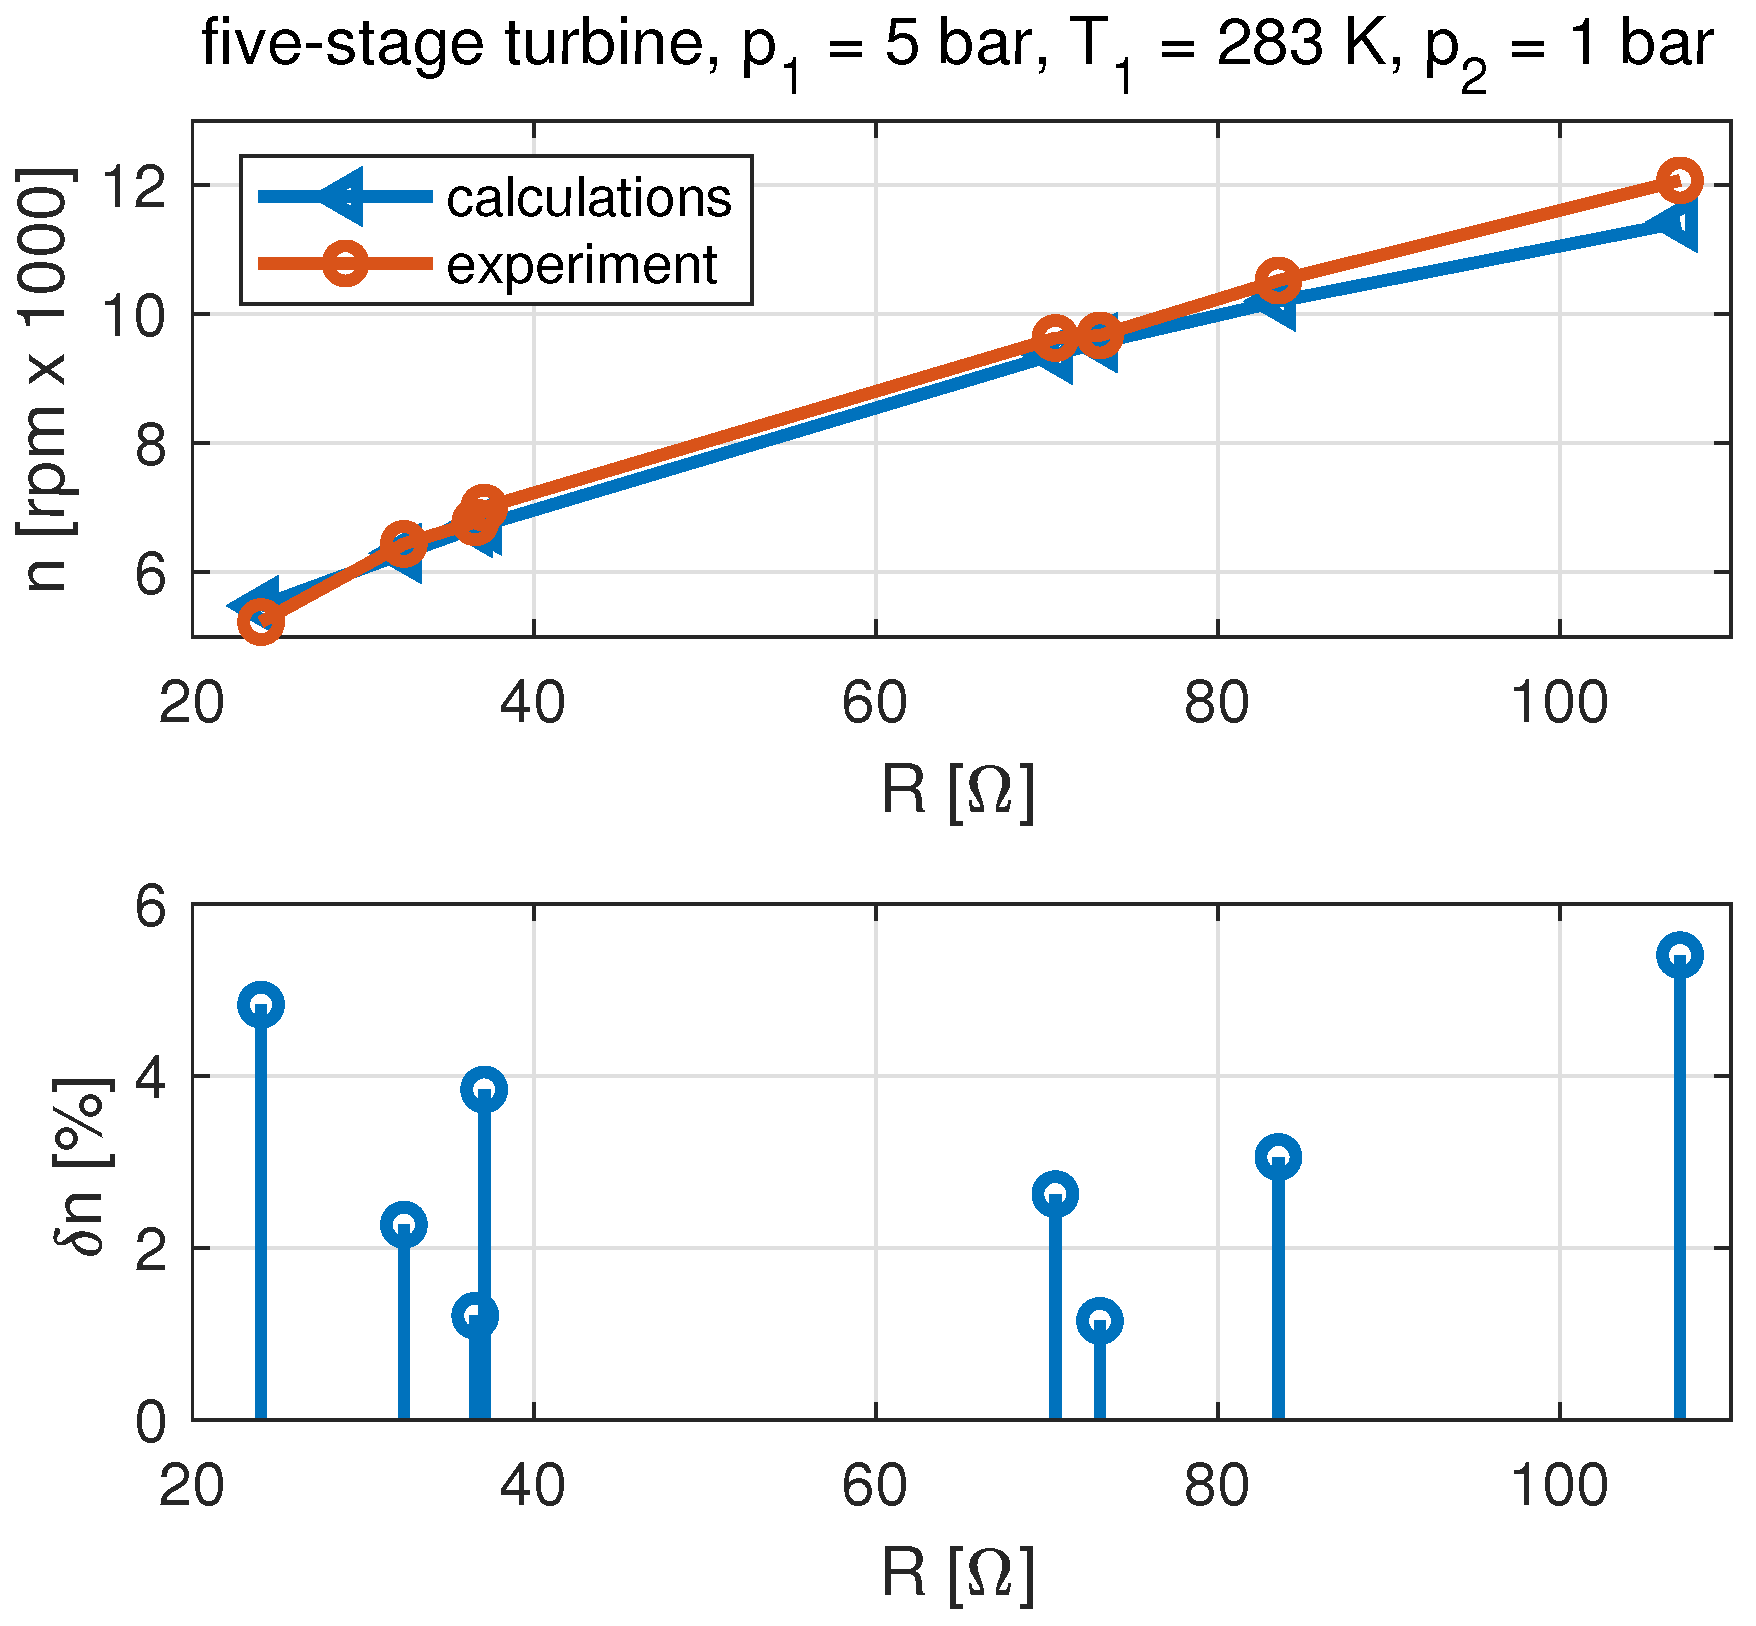
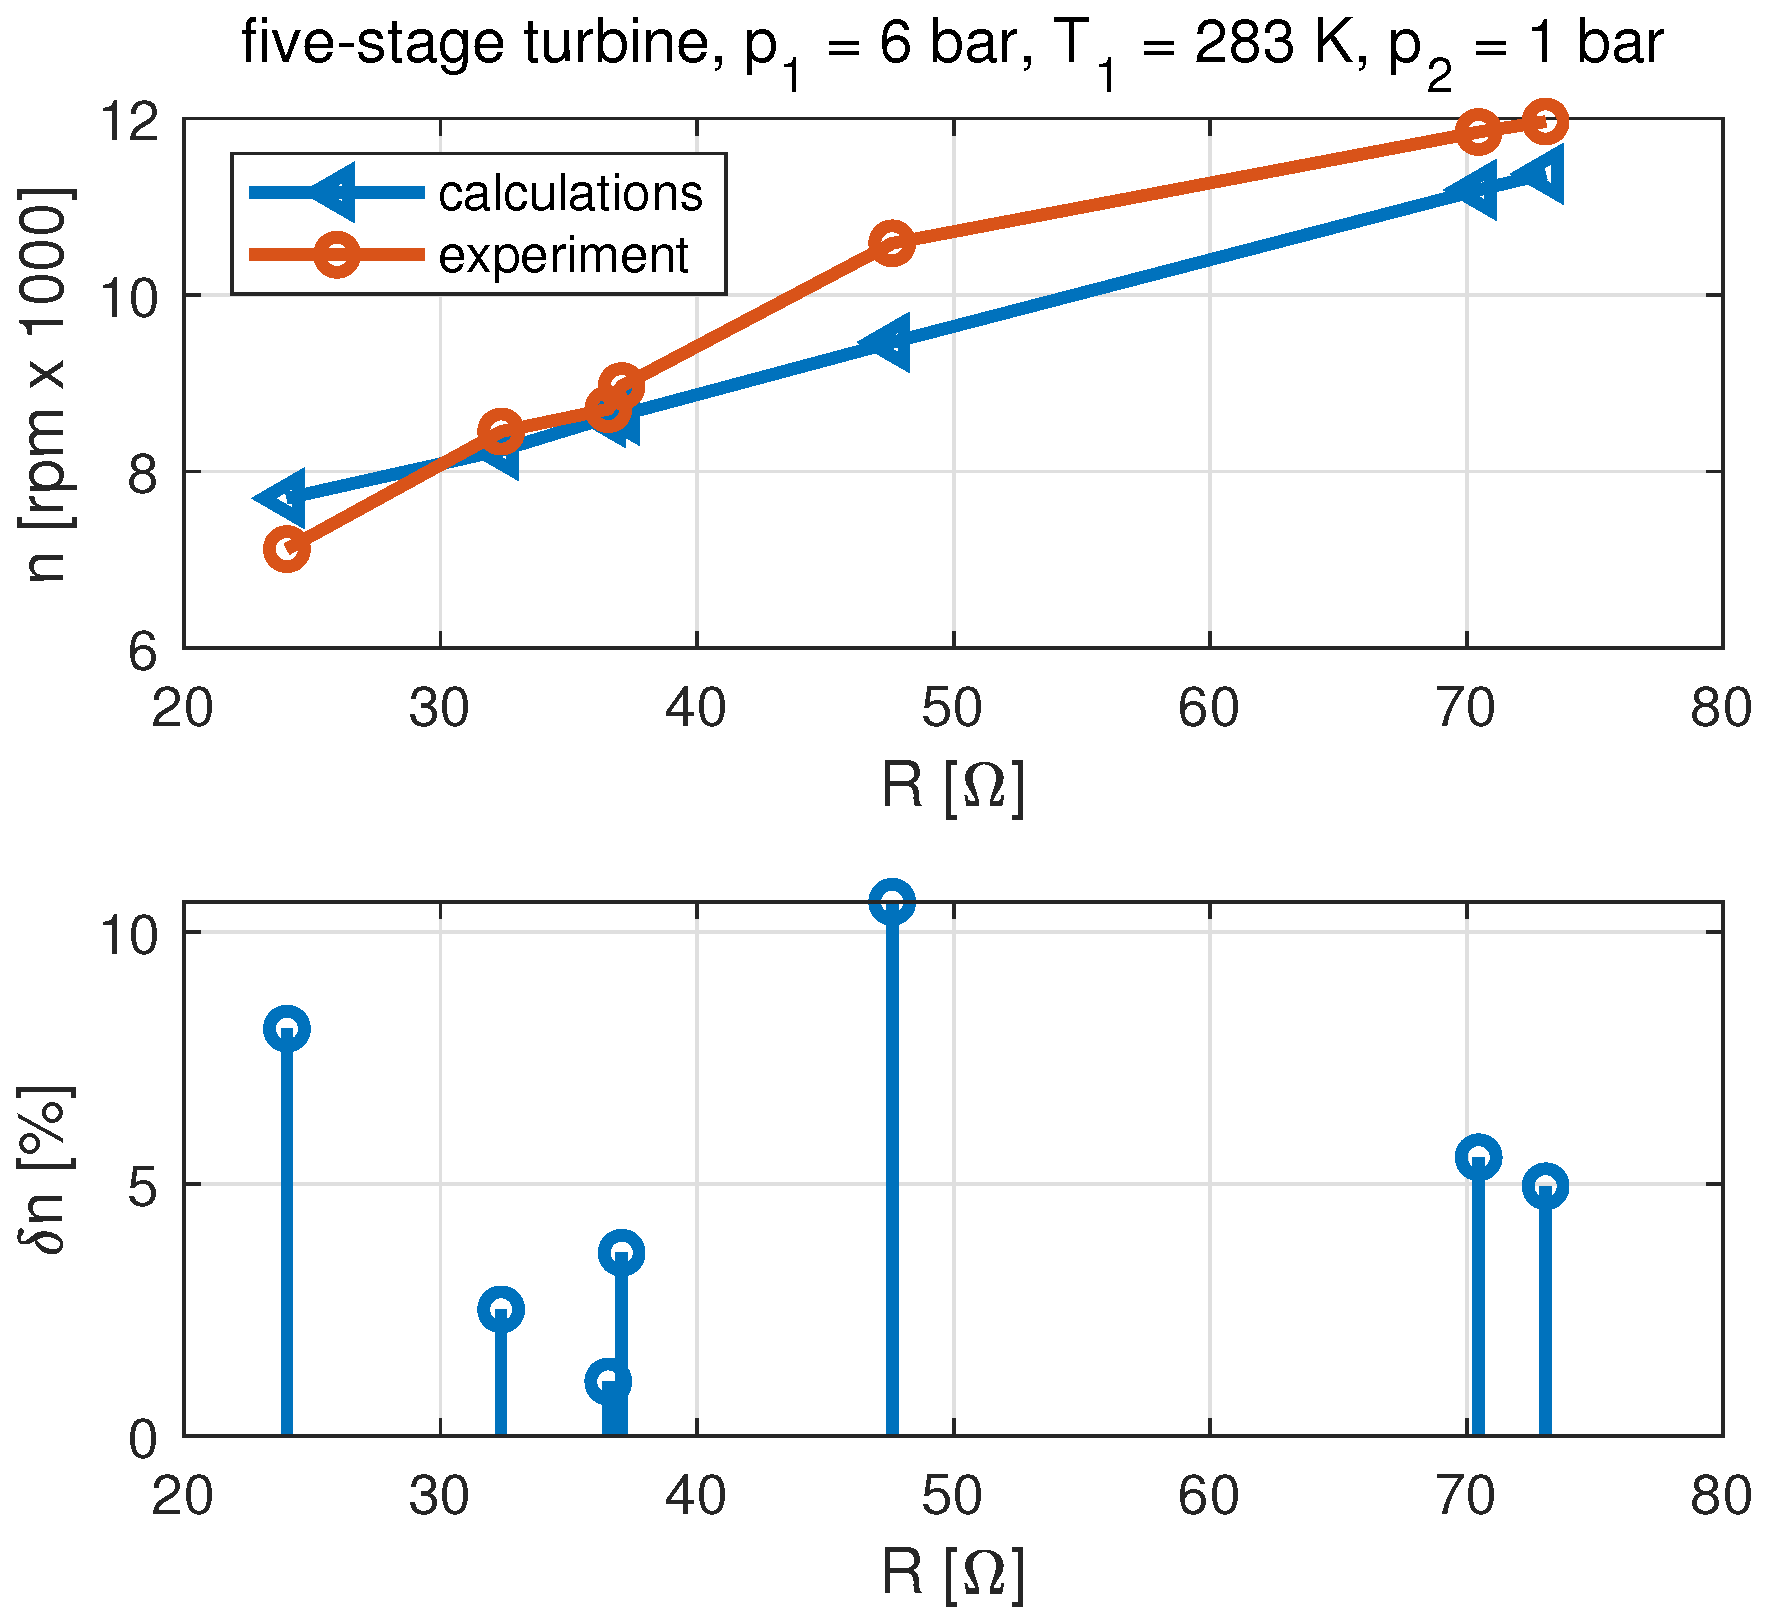
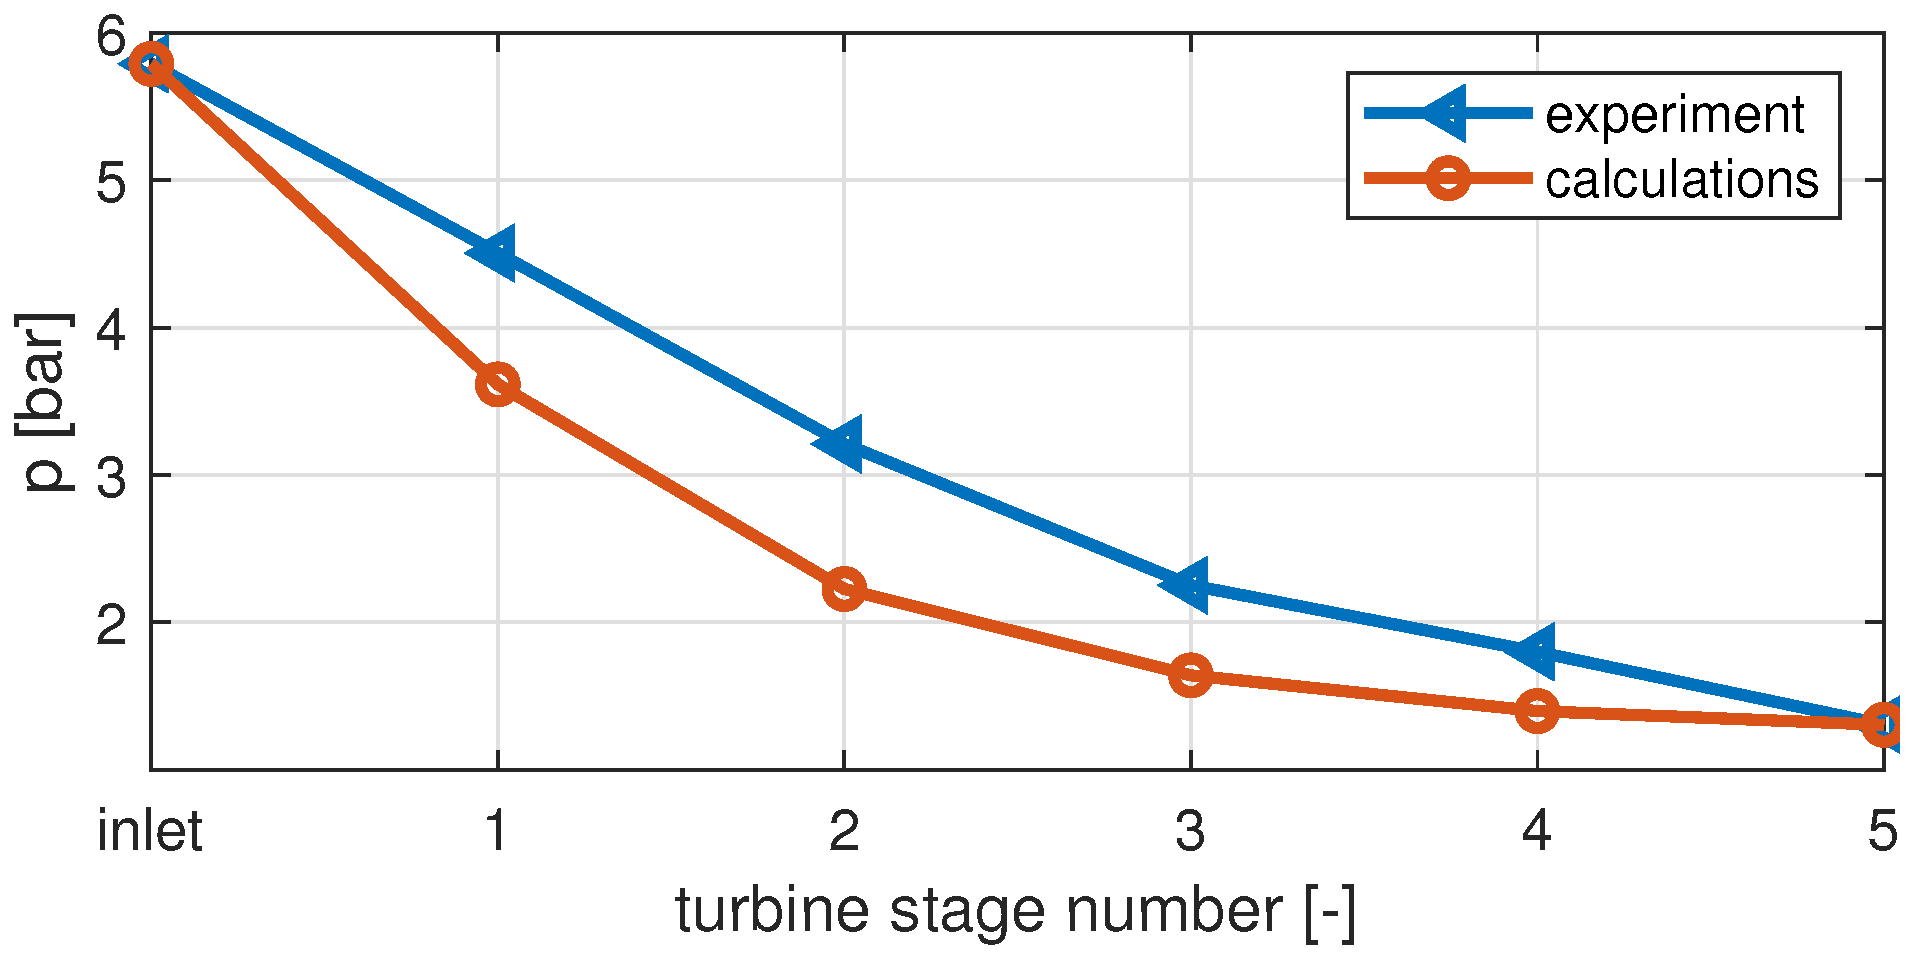
  • The analysis of the tests of the five-stage microturbine leads to different conclusions. Simulating the operation of the five-stage microturbine set by the relation that does not include partial admission results in accuracy that can be unacceptable in practical applications. The developed model has significantly improved the accuracy of the simulation of the multi-stage microturbine.
The results allow for the conclusion that, when simulating the off-design operation of multistage microturbines, not including power losses due to partial admission may lead to significantly incorrect results. This statement can be useful for studying the operational aspects of vapour microturbine sets or for power engineering applications in general. The presented model can be practically applied to simulate the operation of vapour microturbine sets, even with limited experimental data availability.

Author Contributions

Conceptualization, W.W.; methodology, W.W.; validation, W.W.; formal analysis, W.W.; data curation, W.W.; writing—original draft preparation, W.W.; writing—review and editing, M.P.; funding acquisition, M.P. All authors have read and agreed to the published version of the manuscript.

Funding

This study was carried out as a part of the statutory works of the Gdansk University of Technology. This research did not receive any specific grant from funding agencies in the public, commercial, or non-profit sectors.

Data Availability Statement

The original contributions presented in the study are included in the article, further inquiries can be directed to the corresponding author.

Acknowledgments

Special thanks to Tadeusz Blekiewicz for the technical support in preparing and operating the test rig.

Conflicts of Interest

The authors declare no conflicts of interest.

Appendix A

Performing developed model calculations requires the determination of the mean specific volume of the working medium before and after the rotor blade cascade. In the case of five-stage turbine tests, the following algorithm was applied. The relations result from the axial turbine stage theory [26]. Ideal gas flow through convergent channels was assumed. The results of the calculation were compared with the experimental data.

Appendix A.1. Calculation Algorithm

The following relations are expressed:
m 2 m m a x n i 2 + p 1 i p 0 t i β 2 1 β 2 = 1 ,
m 2 m m a x r i 2 + p 2 i p 1 t i β 2 1 β 2 = 1 ,
m m a x n i = A n i κ p 0 t i v 0 t i 2 κ + 1 κ + 1 2 ( κ 1 ) ,
A n i = ϵ i π d i l n i sin α 1 i ,
m m a x r i = A r i κ p 1 t i v 1 t i 2 κ + 1 κ + 1 2 ( κ 1 ) ,
A r i = ϵ i π d i l r i sin β 1 i ,
T 0 i = T 2 i 1 , p 0 i = p 2 i 1 , c 0 i = c 2 i 1 (for i = 2 f ),
a n i = κ R T 0 i ,
M n i = c 0 i a n i ,
T 0 t i = T 0 i 1 + κ 1 2 M n i 2 ,
p 0 t i = p 0 i T 0 t i T 0 i κ κ 1 ,
v 0 t i = R T 0 t i p 0 t ,
p 1 i = p 0 t i β + ( 1 β ) 1 m m m a x n i 2 ,
T 1 i = T 0 i p 1 i p 0 i κ 1 κ ,
c 1 i = c 0 i 2 + 2 C p ( T 0 i T 1 i ) ,
w 1 i = c 1 i 2 + u i 2 2 u i c 1 i cos α 1 i ,
a r i = κ R T 1 i ,
M r i = w 1 i a r i ,
T 1 t i = T 1 i 1 + κ 1 2 M r i 2 ,
p 1 t i = p 1 i T 1 t i T 1 i κ κ 1 ,
v 1 t i = R T 1 t i p 1 t i ,
p 2 i = p 1 t i β + ( 1 β ) 1 m m m a x r i 2 ,
T 2 i = T 1 i p 2 i p 1 i κ 1 κ ,
w 2 i = w 1 i 2 + 2 C p ( T 1 i T 2 i ) ,
c 2 i = w 2 i 2 + u i 2 2 u i w 2 i cos β 2 i ,
v 1 i = R T 1 i p 1 i ,
v 2 i = R T 2 i p 2 i .
The following list contains a collection of the symbols used in the equations presented above:
A—flow area at the cascade outlet,
a—speed of sound,
c—absolute velocity,
d—mean cascade diameter,
f—number of turbine stages,
l—blade height,
m—mass flow rate,
M—Mach number,
p—pressure,
R—gas constant,
T—absolute temperature,
v—specific volume,
w—relative velocity,
α 1 —flow angle at the nozzle cascade exit,
β 2 —relative flow angle at the rotor blade cascade exit,
β —critical pressure ratio,
ϵ —ratio of admission,
κ —exponent of isentropic process.
List of used indexes:
0—at the turbine stage inlet,
1—at the nozzle cascade exit, at the rotor blade cascade inlet,
2—at the rotor blade cascade exit, at the turbine stage exit,
n—concerning the nozzle cascade,
r—concerning the rotor blade cascade,
t—total parameters.
The scheme of flow velocity vectors at the axial turbine stage is shown in Figure A1.
Figure A1. Flow velocity vectors at the axial turbine stage.
Energies 17 01792 g0a1

Appendix A.2. Calculation Results vs. Experiment

The results of the calculations were compared with the measurement data. Data from the experimental studies described in the [27] were used. The five-stage microturbine for the cogeneration micro-power plant was examined. The microturbine was tested with compressed air as a working medium. The experimental test stand was designed to enable the measurement of pressure in points located along the microturbine circumference. One of the nozzle segments with visible pressure-measuring holes is shown in Figure A2.
Figure A2. Nozzle segment with pressure-measuring holes.
Energies 17 01792 g0a2
Figure A3 and Figure A4 display the pressure distribution in the five-stage microturbine during compressed air operation. The pressure at the turbine inlet was set to 3.9 bar and 5.8 bar, and the results were obtained from both experiments and calculations. Pressure measurements were taken behind each turbine stage. The experimental results correspond with the calculated results. It can be concluded that the results of the pressure distribution in the microturbine obtained from the considered algorithm are reliable in a qualitative sense.
Figure A3. Pressure distribution in the five-stage microturbine.
Energies 17 01792 g0a3
Figure A4. Pressure distribution in the five-stage microturbine.
Energies 17 01792 g0a4

References

  1. Dumont, O.; Dickes, R.; De Rosa, M.; Douglas, R.; Lemort, V. Technical and economic optimization of subcritical, wet expansion and transcritical Organic Rankine Cycle (ORC) systems coupled with a biogas power plant. Energy Convers. Manag. 2018, 157, 294–306. [Google Scholar] [CrossRef]
  2. Dutra, J.; Gonzalez-Carmona, M.; Lazaro-Alvarado, A.; Coronas, A. Modeling of a Cogeneration System with a Micro Gas Turbine Operating at Partial Load Conditions. J. Sustain. Dev. Energy Water Environ. Syst. 2017, 5, 139–150. [Google Scholar] [CrossRef]
  3. Massardo, A.; McDonald, C.; Korakianitis, T. Microturbine/Fuel-Cell Coupling for High-Efficiency Electrical Power Generation. J. Eng. Gas Turbines Power 2002, 124, 110–116. [Google Scholar] [CrossRef]
  4. Kaczmarczyk, T.; Żywica, G. Experimental study of a 1 kW high-speed ORC microturbogenerator under partial load. Energy Convers. Manag. 2022, 272, 116381. [Google Scholar] [CrossRef]
  5. Piwowarski, M.; Stepniak, D. Analyzing Selection of Low-Temperature Medium for Cogeneration Micro Power Plant. Pol. J. Environ. Stud. 2014, 23, 1417–1421. [Google Scholar]
  6. Bina, S.; Jalilinasrabady, H. Fujii, Energy, economic and environmental (3e) aspects of internal heat exchanger for orc geothermal power plants. Energy 2017, 140, 1096–1106. [Google Scholar] [CrossRef]
  7. Zanellato, L.; Astolfi, M.; Serafino, A.; Rizzi, D.; Macchi, E. Field Performance Evaluation of ORC Geothermal Power Plants Using Radial Outflow Turbines. Energy Procedia 2017, 129, 607–614. [Google Scholar] [CrossRef]
  8. Piwowarski, M. Design analysis of ORC micro-turbines making use of thermal energy of oceans. Pol. Marit. Res. 2013, 20, 48–60. [Google Scholar] [CrossRef]
  9. Mikielewicz, D.; Wajs, J.; Ziolkowski, J.; Mikielewicz, J. Utilisation of waste heat from the power plant by use of the orc aided with bleed steam and extra source of heat. Energy 2016, 97, 11–19. [Google Scholar] [CrossRef]
  10. Dong, D.; Wang, Y.; Xu, G.; Wen, J.; Quan, Y. Design and analysis of an axial turbine for high-temperature organic Rankine cycle. Therm. Sci. Eng. Prog. 2023, 46, 2451–9049. [Google Scholar] [CrossRef]
  11. Mikielewicz, D.; Wajs, J.; Mikielewicz, J. Alternative cogeneration thermodynamic cycles for domestic orc. Chem. Process. Eng. 2018, 39, 75–84. [Google Scholar]
  12. Wood, G.; Newborough, M. Dynamic energy-consumption indicators for domestic appliances: Environment, behaviour and design. Energy Build. 2003, 35, 821–841. [Google Scholar] [CrossRef]
  13. Chen, C.; Liu, M.; Li, M.; Wang, Y.; Wang, C.; Yan, J. Digital twin modeling and operation optimization of the steam turbine system of thermal power plants. Energy 2024, 290, 129969. [Google Scholar] [CrossRef]
  14. Fethi, O.; Dessaint, L.; Al-Haddad, H. Modeling and simulation of the electric part of a grid connected microturbine. IEEE Power Eng. Soc. Gen. Meet. 2004, 2, 2212–2219. [Google Scholar]
  15. Gaonkar, D.; Patel, R. Modeling and simulation of microturbine based distributed generation system. In Proceedings of the 2006 IEEE Power India Conference, New Delhi, India, 10–12 April 2006. [Google Scholar]
  16. Nayak, S.; Gaonkar, D. Modeling and performance analysis of microturbine generation system in grid connected/islanding operation. Int. J. Renew. Energy Res. 2012, 2, 750–757. [Google Scholar]
  17. Torres, E.; Larragueta, J.; Eguia, P.; Mazon, J.; San, M.; Zamora, I. Dynamic performance of a microturbine connected to a low voltage network. Renew. Energy Power Qual. J. 2008, 1, 468–473. [Google Scholar] [CrossRef]
  18. Sun, H.; Qin, J.; Yan, P.; Huang, H.; Hung, T. Performance evaluation of a partially admitted axial turbine using R245fa, R123 and their mixtures as working fluid for small-scale organic Rankine cycle. Energy Convers. Manag. 2018, 171, 925–935. [Google Scholar] [CrossRef]
  19. Klonowicz, P.; Witanowski, L.; Suchocki, T.; Jedrzejewski, T.; Lampart, P. Selection of optimum degree of partial admission in a laboratory organic vapour microturbine. Energy Convers. Manag. 2019, 202, 112189. [Google Scholar] [CrossRef]
  20. Pini, M.; De Servi, C.; Burigana, M.; Bahamonde, S.; Rubino, A.; Vitale, S.; Colonna, P. Fluid-dynamic design and characterization of a mini-ORC turbine for laboratory experiments. Energy Procedia 2017, 129, 1141–1148. [Google Scholar] [CrossRef]
  21. Martins, G.; Braga, S.; Ferreira, S. Design optimization of partial admission axial turbine for ORC service. Appl. Therm. Eng. 2016, 96, 18–25. [Google Scholar] [CrossRef]
  22. Włodarsk, W. Experimental investigations and simulations of the microturbine unit with permanent magnet generator. Energy 2018, 158, 59–71. [Google Scholar] [CrossRef]
  23. Włodarsk, W. A model development and experimental verification for a vapour microturbine with a permanent magnet synchronous generator. Appl. Energy 2019, 252, 113430. [Google Scholar] [CrossRef]
  24. Traupel, W. Thermische Turbomaschinen; Springer: Berlin/Heidelberg, Germany, 2001. [Google Scholar]
  25. Kosowski, K.; Piwowarski, M.; Stepien, R.; Włodarsk, W. Design and investigations of the ethanol microturbine. Arch. Thermodyn. 2018, 39, 41–54. [Google Scholar]
  26. Kosowski, K. Steam and Gas Turbines; Alstom: Saint-Ouen-sur-Seine, France, 2007. [Google Scholar]
  27. Kosowski, K.; Stepien, R.; Wlodarski, W.; Piwowarski, M.; Hirt, L. Partial Admission Stages of High Efficiency for a Microturbine. J. Vib. Eng. Technol. 2014, 2, 441–448. [Google Scholar]
Figure 1. Schematic diagram of a microturbine set with a diode rectifier.
Energies 17 01792 g001
Figure 2. Diagram showing the mechanism of energy loss formation due to partial admission.
Energies 17 01792 g002
Figure 3. Single-stage (left) and five-stage (right) microturbine set.
Energies 17 01792 g003
Figure 4. The third-stage rotor disc (left) and nozzle diaphragm (right) from the five-stage microturbine.
Energies 17 01792 g004
Figure 5. Rotational speed n versus load resistance R of the single-stage microturbine set.
Energies 17 01792 g005
Figure 6. Rotational speed n versus load resistance R of the five-stage microturbine set.
Energies 17 01792 g006
Figure 7. Rotational speed n, phase current intensity I s and phase-to-phase voltage U L L versus load resistance R of the five-stage microturbine set.
Energies 17 01792 g007
Figure 8. Rotational speed n versus load resistance R of the single-stage microturbine set and relative errors δ n between the experiment and base model calculations.
Energies 17 01792 g008
Figure 9. Rotational speed n versus load resistance R of the single-stage microturbine set and relative errors δ n between the experiment and base model calculations.
Energies 17 01792 g009
Figure 10. Rotational speed n versus load resistance R of the five-stage microturbine set and relative errors δ n between the experiment and base model calculations.
Energies 17 01792 g010
Figure 11. Rotational speed n versus load resistance R of the five-stage microturbine set and relative errors δ n between the experiment and base model calculations.
Energies 17 01792 g011
Figure 12. Rotational speed n versus load resistance R of the single-stage microturbine set and relative errors δ n between the experiment and calculations with the developed model.
Energies 17 01792 g012
Figure 13. Rotational speed n versus load resistance R of the single-stage microturbine set and relative errors δ n between the experiment and calculations with the developed model.
Energies 17 01792 g013
Figure 14. Rotational speed n versus load resistance R of the five-stage microturbine set and relative errors δ n between the experiment and calculations with the developed model.
Energies 17 01792 g014
Figure 15. Rotational speed versus load resistance R of the five-stage microturbine set and relative errors δ n between the experiment and calculations with the developed model.
Energies 17 01792 g015
Table 1. Ratios of admission for the five-stage microturbine.
Stage NumberRatio of Admission
10.067
20.109
30.171
40.236
50.323
Disclaimer/Publisher’s Note: The statements, opinions and data contained in all publications are solely those of the individual author(s) and contributor(s) and not of MDPI and/or the editor(s). MDPI and/or the editor(s) disclaim responsibility for any injury to people or property resulting from any ideas, methods, instructions or products referred to in the content.

