Article

Improved YOLOv5 Based on Multi-Strategy Integration for Multi-Category Wind Turbine Surface Defect Detection

1
School of Computer, Beijing Information Science and Technology University, Beijing 102206, China
2
Institute of Business Intelligence, Beijing Information Science and Technology University, Beijing 102206, China
*
Author to whom correspondence should be addressed.
These authors contributed equally to this work.
Energies 2024, 17(8), 1796; https://doi.org/10.3390/en17081796
Submission received: 17 January 2024 / Revised: 2 April 2024 / Accepted: 5 April 2024 / Published: 9 April 2024
(This article belongs to the Section A3: Wind, Wave and Tidal Energy)

Abstract

:
Wind energy is a renewable resource with abundant reserves, and its sustainable development and utilization are crucial. The components of wind turbines, particularly the blades and various surfaces, require meticulous defect detection and maintenance due to their significance. The operational status of wind turbine generators directly impacts the efficiency and safe operation of wind farms. Traditional surface defect detection methods for wind turbines often involve manual operations, which suffer from issues such as high subjectivity, elevated risks, low accuracy, and inefficiency. The emergence of computer vision technologies based on deep learning has provided a novel approach to surface defect detection in wind turbines. However, existing datasets designed for wind turbine surface defects exhibit overall category scarcity and an imbalance in samples between categories. The algorithms designed face challenges, with low detection rates for small samples. Hence, this study first constructs a benchmark dataset for wind turbine surface defects comprising seven categories that encompass all common surface defects. Simultaneously, a wind turbine surface defect detection algorithm based on improved YOLOv5 is designed. Initially, a multi-scale copy-paste data augmentation method is proposed, introducing scale factors to randomly resize the bounding boxes before copy-pasting. This alleviates sample imbalances and significantly enhances the algorithm’s detection capabilities for targets of different sizes. Subsequently, a dynamic label assignment strategy based on the Hungarian algorithm is introduced that calculates the matching costs by weighing different losses, enhancing the network’s ability to learn positive and negative samples. To address overfitting and misrecognition resulting from strong data augmentation, a two-stage progressive training method is proposed, aiding the model’s natural convergence and improving generalization performance. Furthermore, a multi-scenario negative-sample-guided learning method is introduced that involves incorporating unlabeled background images from various scenarios into training, guiding the model to learn negative samples and reducing misrecognition. Finally, slicing-aided hyper inference is introduced, facilitating large-scale inference for wind turbine surface defects in actual industrial scenarios. The improved algorithm demonstrates a 3.1% increase in the mean average precision (mAP) on the custom dataset, achieving 95.7% accuracy in mAP_50 (the IoU threshold is half of the mAP). Notably, the mAPs for small, medium, and large targets increase by 18.6%, 16.4%, and 6.8%, respectively. The experimental results indicate that the enhanced algorithm exhibits high detection accuracy, providing a new and more efficient solution for the field of wind turbine surface defect detection.

1. Introduction

Wind energy, as a clean and renewable energy source characterized by abundant reserves and zero emissions, is considered a crucial avenue for addressing energy shortages. To achieve sustainable development, its effective utilization becomes paramount. Wind turbine generators, as core equipment for harnessing wind energy, play a direct role in the efficiency and safe operation of wind farms. Therefore, comprehensive and precise defect detection and maintenance of wind turbine generators are of urgent importance.
Traditional methods for detecting surface defects in wind turbines rely on signals obtained from various sensors to determine whether there are faults in the turbine blades. Common detection techniques include infrared thermal imaging [1], ultrasonic detection [2], fault detection based on vibration signals [3,4], acoustic emission detection [5,6,7], and grating fiber detection [8].
These traditional approaches typically rely on discrete sensor data, making it challenging to comprehensively and efficiently capture subtle changes on the surface of wind turbine blades. Due to the complex working environment of wind turbines, sensor signals are susceptible to noise interference, resulting in inadequate detection accuracy and stability that fall short of industrial-level detection requirements. With the rise of deep learning, leveraging its powerful feature learning and pattern recognition capabilities can avoid the tedious feature engineering involved in traditional methods. Simultaneously, deep learning models can be trained on large amounts of data to enhance their generalization ability for different defect types. Object detection technology based on deep learning brings a new and efficient solution to wind turbine surface defect detection, significantly improving detection accuracy and reducing false positives, making real-time monitoring and maintenance in large-scale wind farms more feasible. The introduction of deep learning technology propels surface defect detection in wind turbines into a more intelligent and efficient era, providing robust support for sustainable development of the wind energy industry.
Deep learning object detection models mainly fall into two technical branches: two-stage and single-stage. Two-stage object detection models typically include two stages. First, the model generates a series of candidate regions that may contain objects. Then, the model classifies these candidate regions and performs precise bounding box regression. The origin of two-stage models is R-CNN [9], which uses the selective search algorithm to generate candidate regions and employs convolutional neural networks (CNNs) for classification. To address the inefficiency of R-CNN, Fast R-CNN [10] conducts convolution operations over the entire image and introduces region of interest (RoI) [11] pooling layers for improved computational efficiency. Faster R-CNN [12] further improves Fast R-CNN by introducing the region proposal network (RPN) to generate candidate regions through deep learning, thereby enhancing detection speed. Subsequent models such as R-FCN [13], NAS-FPN [14], and Mask R-CNN [15] build on Faster R-CNN by improving features such as feature extraction, complex classification and regression heads, and multi-scale object handling. Some research studies, including CornerNet [16], CenterNet [17], and RepPoints [18], introduced new ideas and technologies. Despite differences from traditional models, they maintain the basic framework of generating candidate regions and classifying regression.
While two-stage object detection models excel in detection accuracy, they are slower and require significant computational resources, making them less efficient. To address these issues, researchers have proposed single-stage object detection models, which do not require a candidate region generation stage and can directly produce object category probabilities and position coordinates. They achieve faster detection speeds as final detection results can be obtained in a single pass. You Only Look Once (YOLO) is a representative single-stage object detection model. Qiu et al. [19] proposed a small defect detection model, the YOLO-based small object detection approach (YSODA), based on the YOLO algorithm, which can detect small surface defects in wind turbines and achieve real-time detection speeds. Yao et al. [20] designed an efficient detection algorithm based on YOLOX [21], focusing on identifying damage to wind turbine blades. By strengthening the lightweight backbone feature extraction network based on the RepVGG [22] architecture, improving the inference speed, and designing a cascaded feature fusion module, the model enhances the perception of small target area features, and its ability to detect multi-scale target damage is improved. Zhang et al. [23] proposed a high-precision detection model named SOD-YOLO, which processes wind turbine blades through foreground segmentation and a Hough transform, which reduces feature information loss for small target defects and other defects using CBAM [24] attention mechanisms and reduces the model size and improves detection efficiency through channel pruning algorithms, achieving efficient and fast wind turbine defect detection. Expanding the scope of defect detection methodologies, the study by Wang et al. [25] presents a data-driven framework for automatically detecting surface cracks on wind turbine blades using images captured by UAVs. Their approach utilizes Haar-like features and cascading classifiers, demonstrating effectiveness through both real-world UAV-taken images and artificially generated datasets. Following this, Wang et al. [26] also proposed a two-stage data-driven approach for precise detection of surface cracks on wind turbine blades from UAV-captured images that involves crack location and crack contour detection stages, leveraging extended Haar-like features and a novel clustering algorithm for crack segmentation. Zhang et al. [27] explored the use of the YOLOv5 algorithm for wind turbine blade damage detection. Their experimental results showcase the model’s capability to predict the location and class of blade damage with near-human-level accuracy, highlighting the importance of image enhancement techniques for smaller training sets. To address the challenges associated with visual quality degradation in UAV-taken images due to atmospheric particles, Ye et al. [28] proposed a double-patch lightweight neural network (DPLDN) for image dehazing and enhancement. Their approach demonstrates superior performance compared with existing techniques, with potential applicability in wind turbine blade image segmentation tasks.
Despite significant progress in general defect detection by current surface defect detection algorithms, most existing datasets suffer from limited defect categories, imbalanced samples between categories, insufficient accuracy in small- and medium-sized target detection, low generalization ability in complex scenes, and frequent false detections. Additionally, current algorithms often limit detection and inference to small images and cannot efficiently handle the requirements of high-speed detection in large images, especially those captured in actual industrial scenarios using drones. These challenges make current wind turbine surface defect detection algorithms limited in addressing the complexity and diversity of real industrial scenarios, calling for more innovative and meticulous solutions.
In order to address the aforementioned issues, we constructed a wind turbine surface defect dataset that encompasses all common defects. Building upon this foundation, we propose a high-precision wind turbine surface defect detection algorithm based on enhanced YOLOv5. Our primary contributions are outlined as follows:
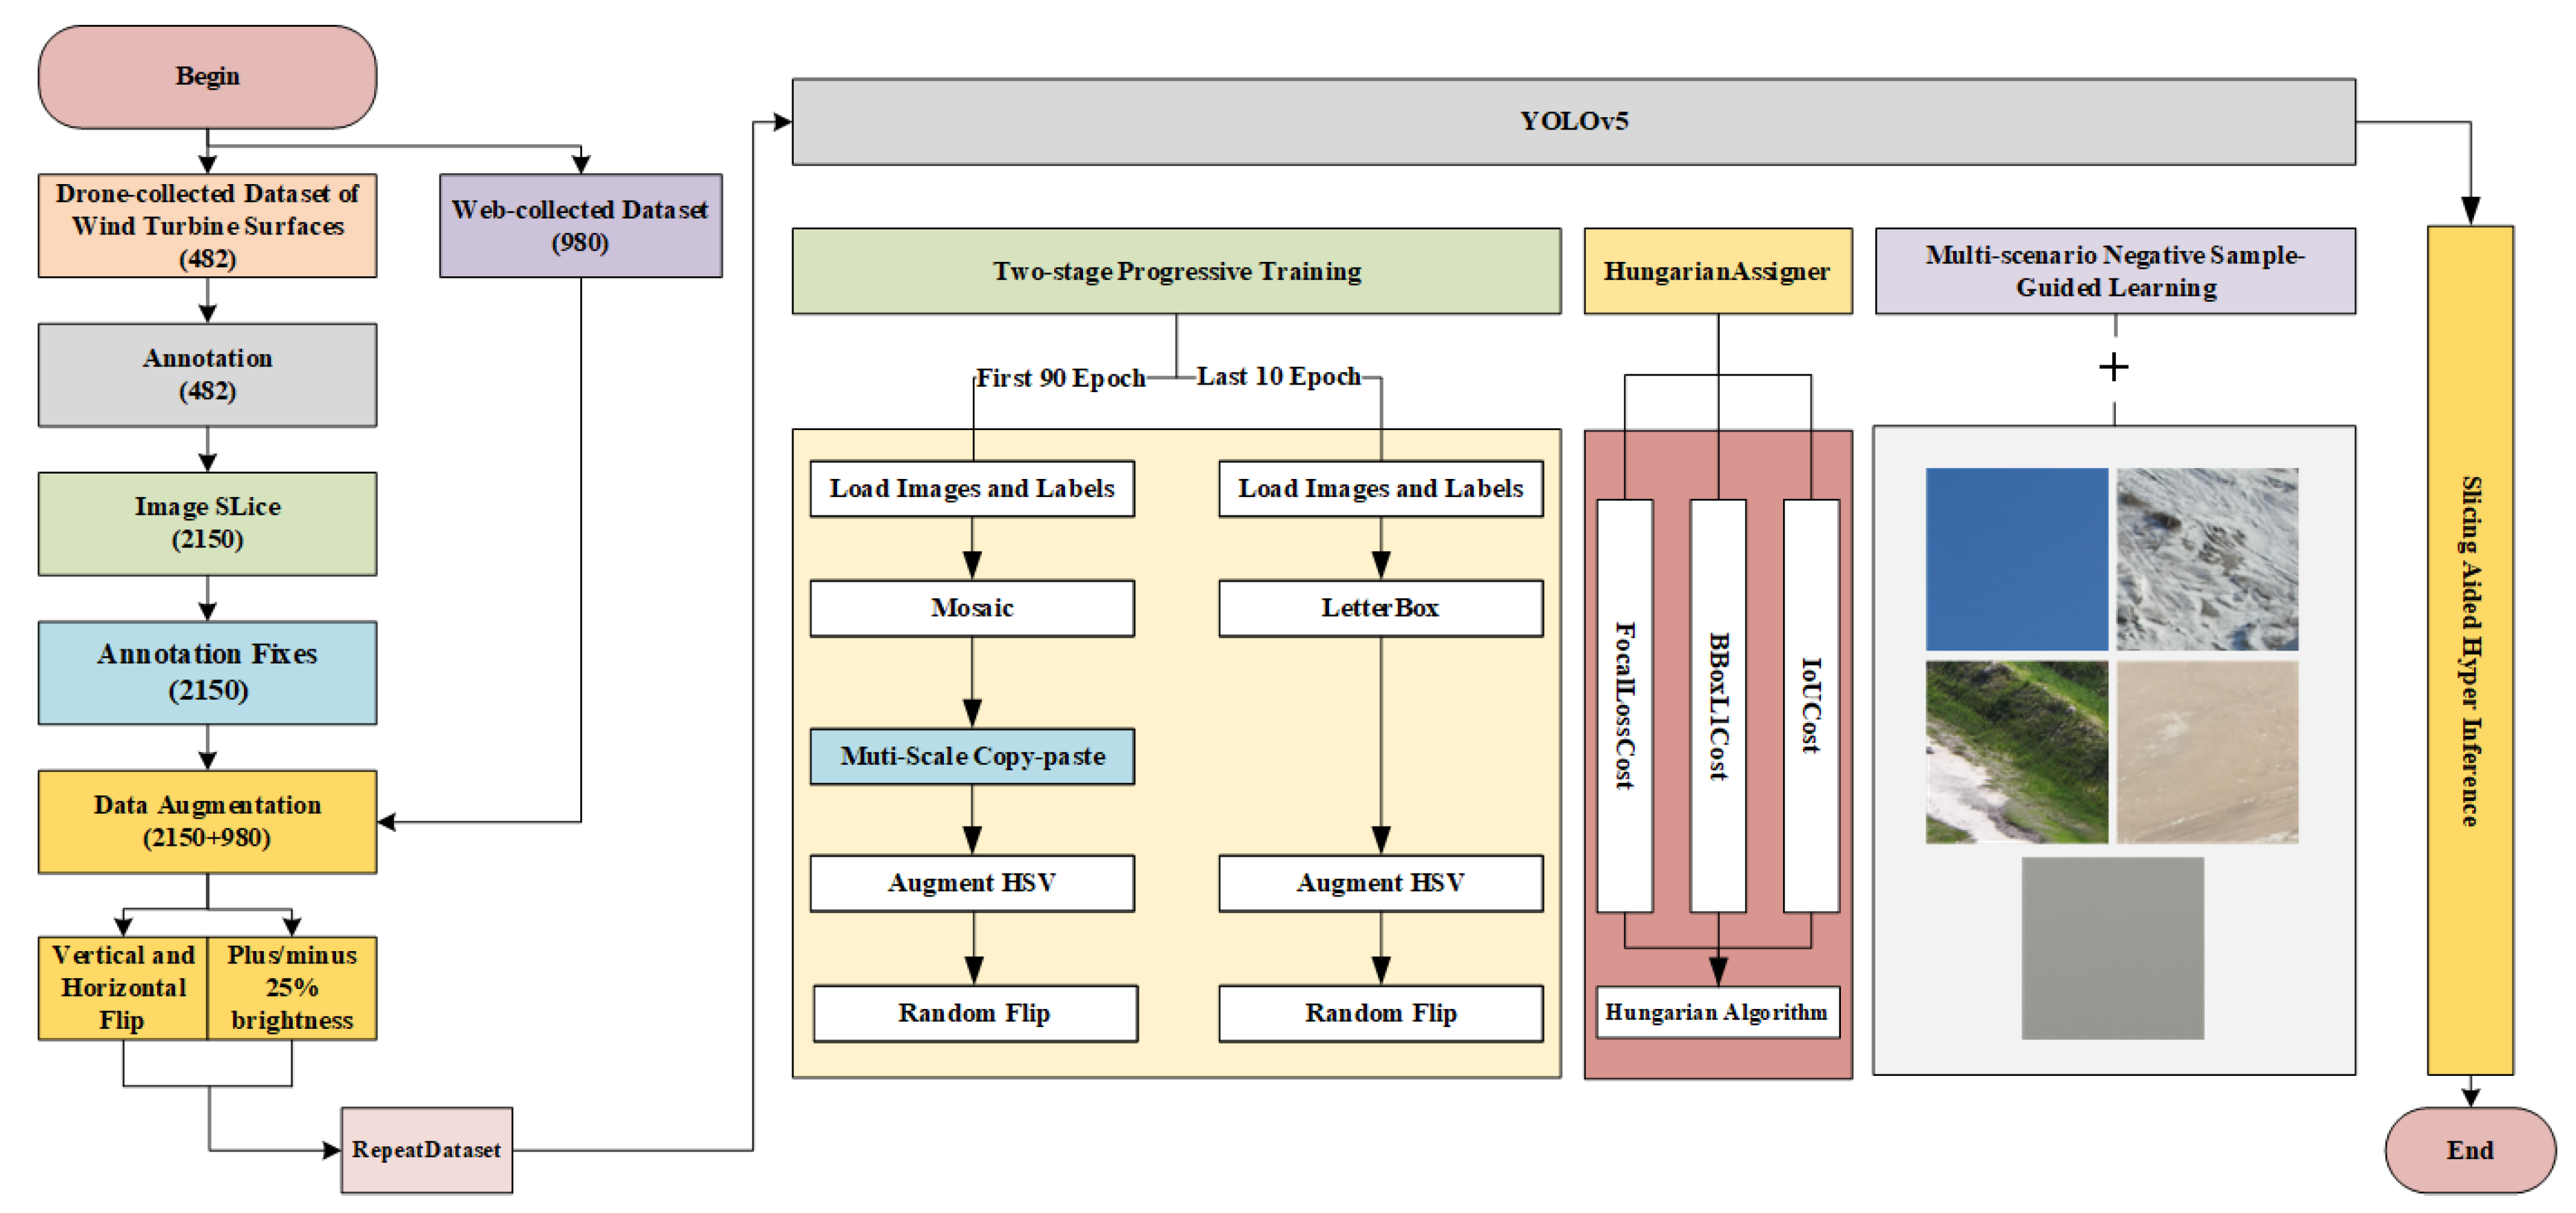
  • In accordance with existing industry standards, we establish a benchmark dataset for wind turbine surface defects that comprises seven categories. This dataset is designed to cover all common surface defects, addressing the deficiency in categories within the field of wind turbine surface defect detection.
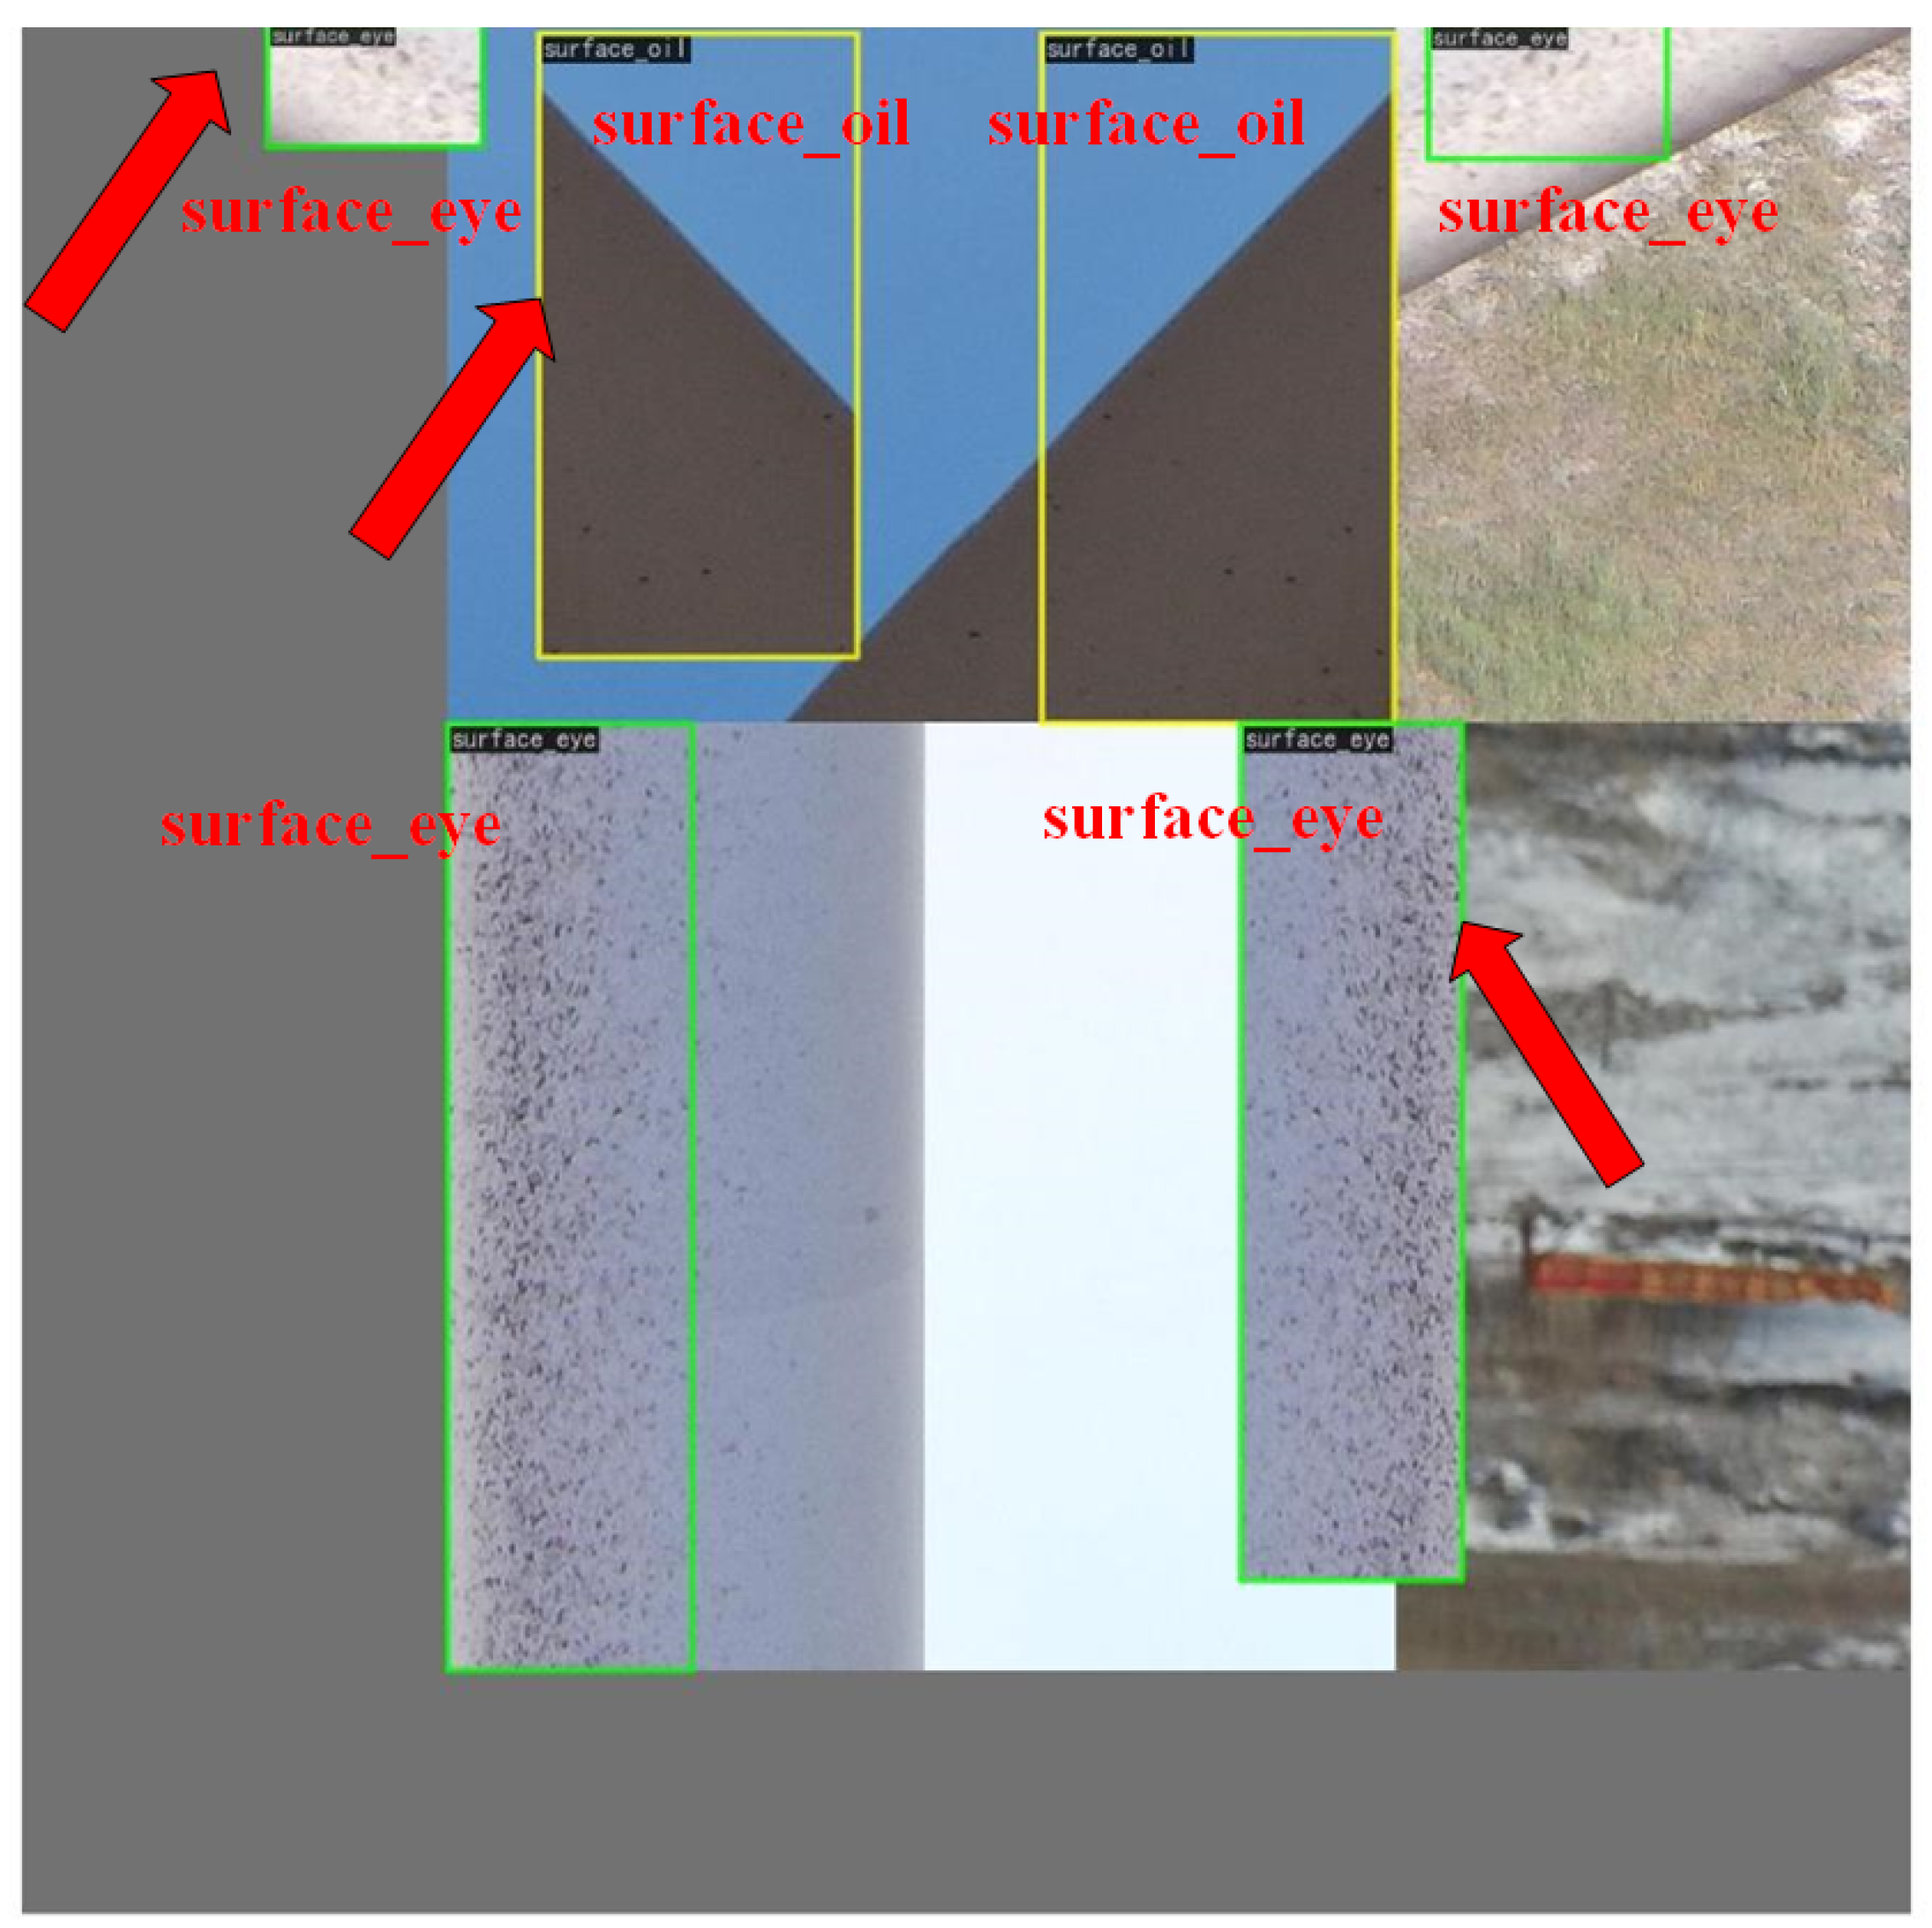
  • To mitigate the issues of class imbalance among the samples and insufficient precision in detecting small-to-medium-sized targets, we devise a multi-scale copy-paste [29] data augmentation method. This approach increases the exposure of samples at different scales, significantly enhancing detection accuracy.
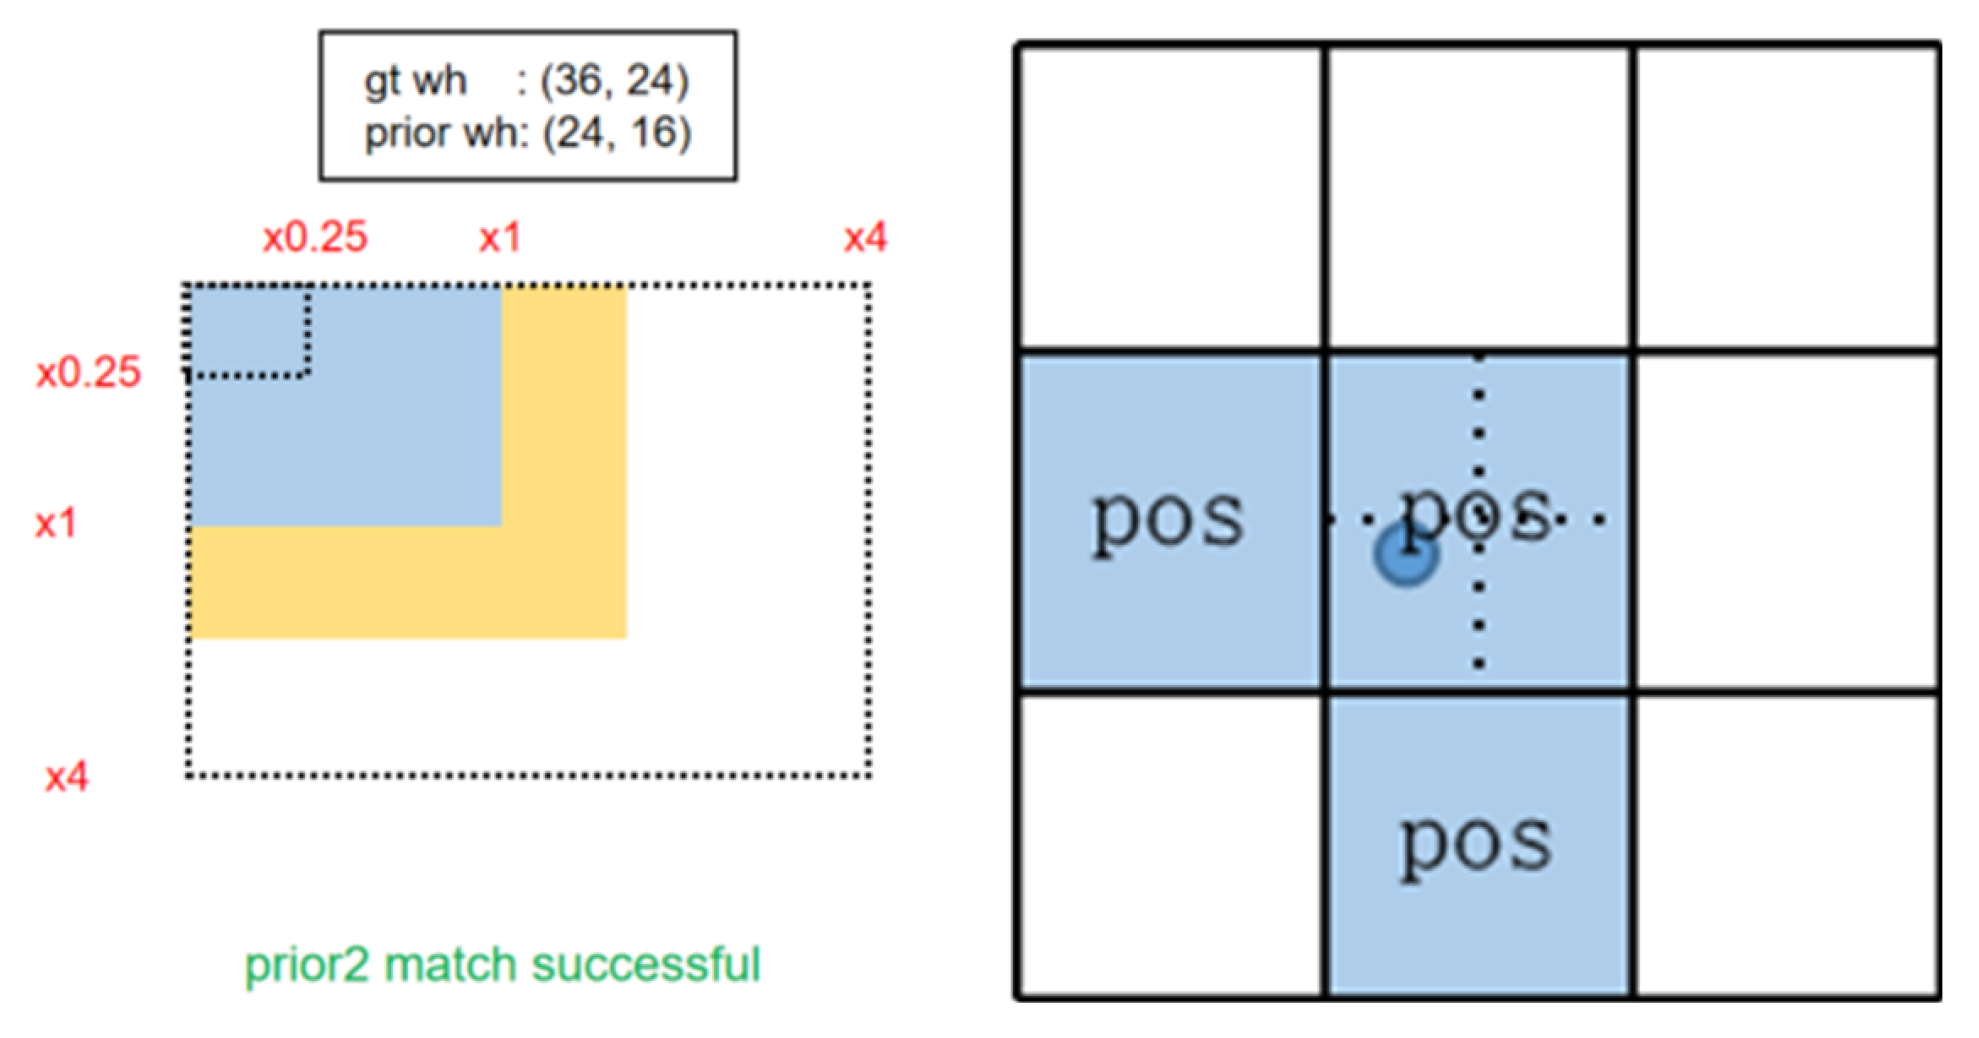
  • We introduce a dynamic label assignment strategy based on the Hungarian algorithm [30] that involves weighing different losses, replacing the original static label assignment strategy, and enhancing the model’s ability to distinguish between positive and negative samples.
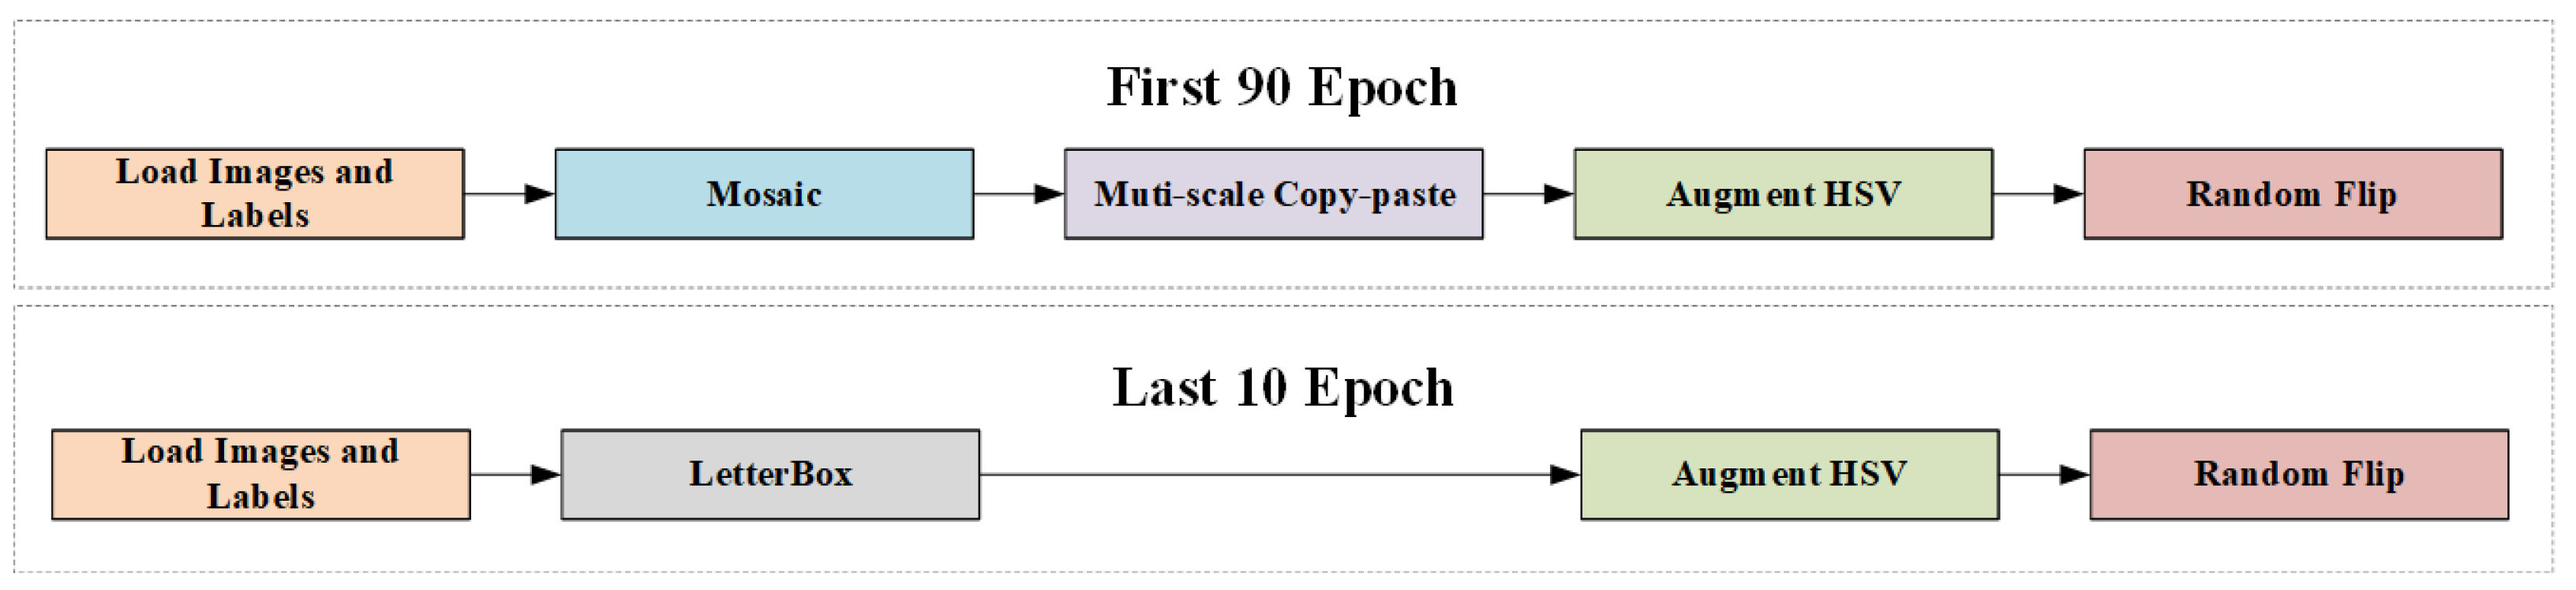
  • To alleviate overfitting resulting from strong data augmentation, we propose a two-stage progressive training strategy. By designing two distinct training pipelines, the model naturally converges during the training process, thereby improving its generalization ability.
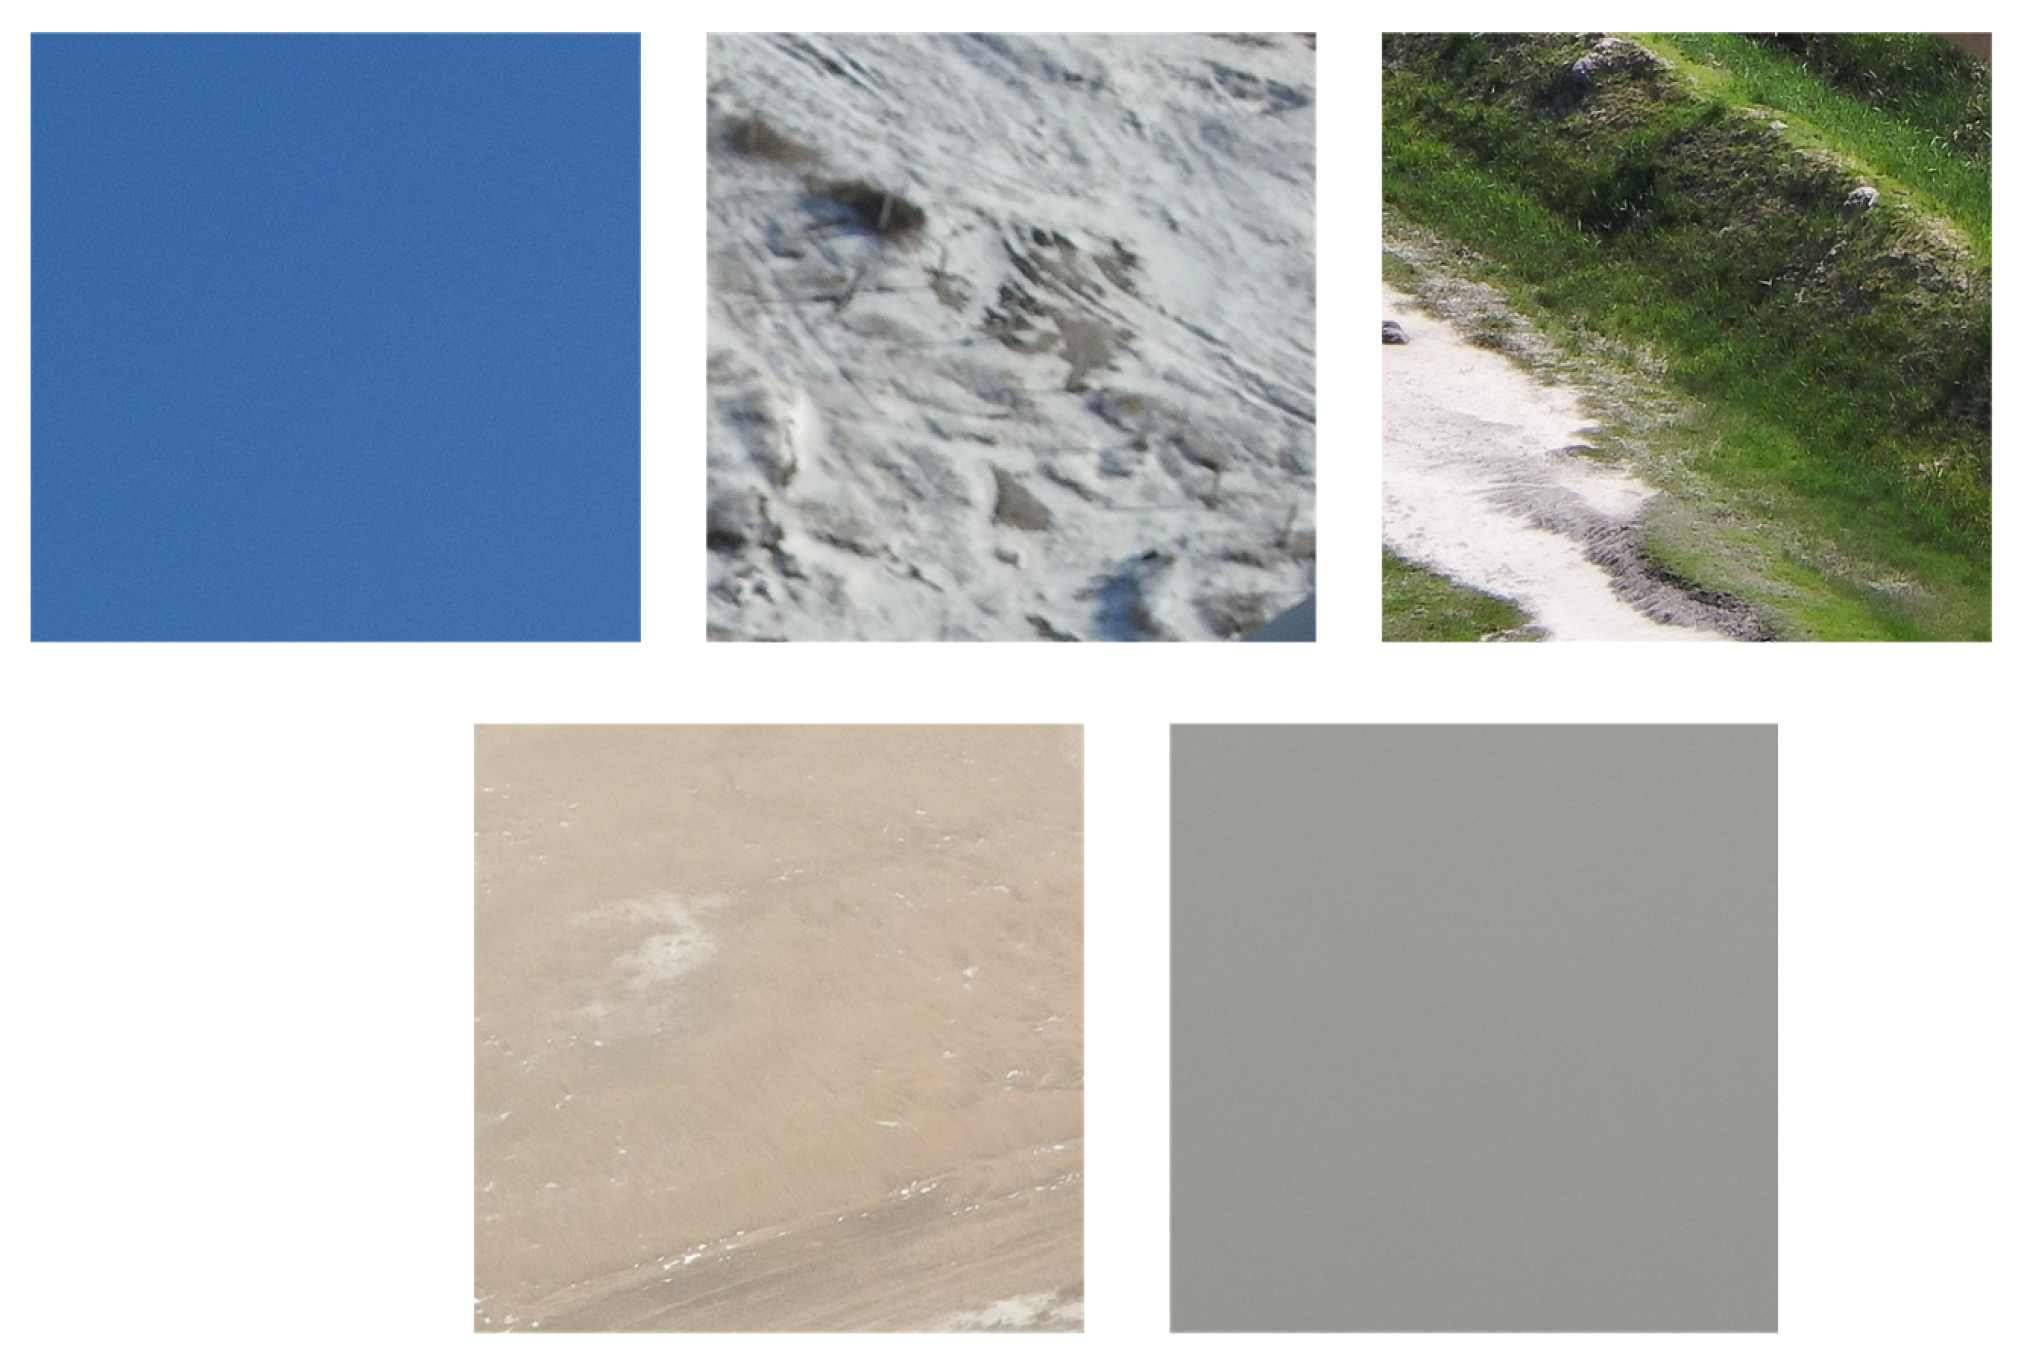
  • We propose a multi-scenario negative sample-guided learning method to improve the model’s ability to learn the features under different background conditions by adding unlabeled background images covering the five scenarios of the wind turbine during the training process, contributing to increased generalization across various backgrounds and reducing misrecognition in backgrounds.
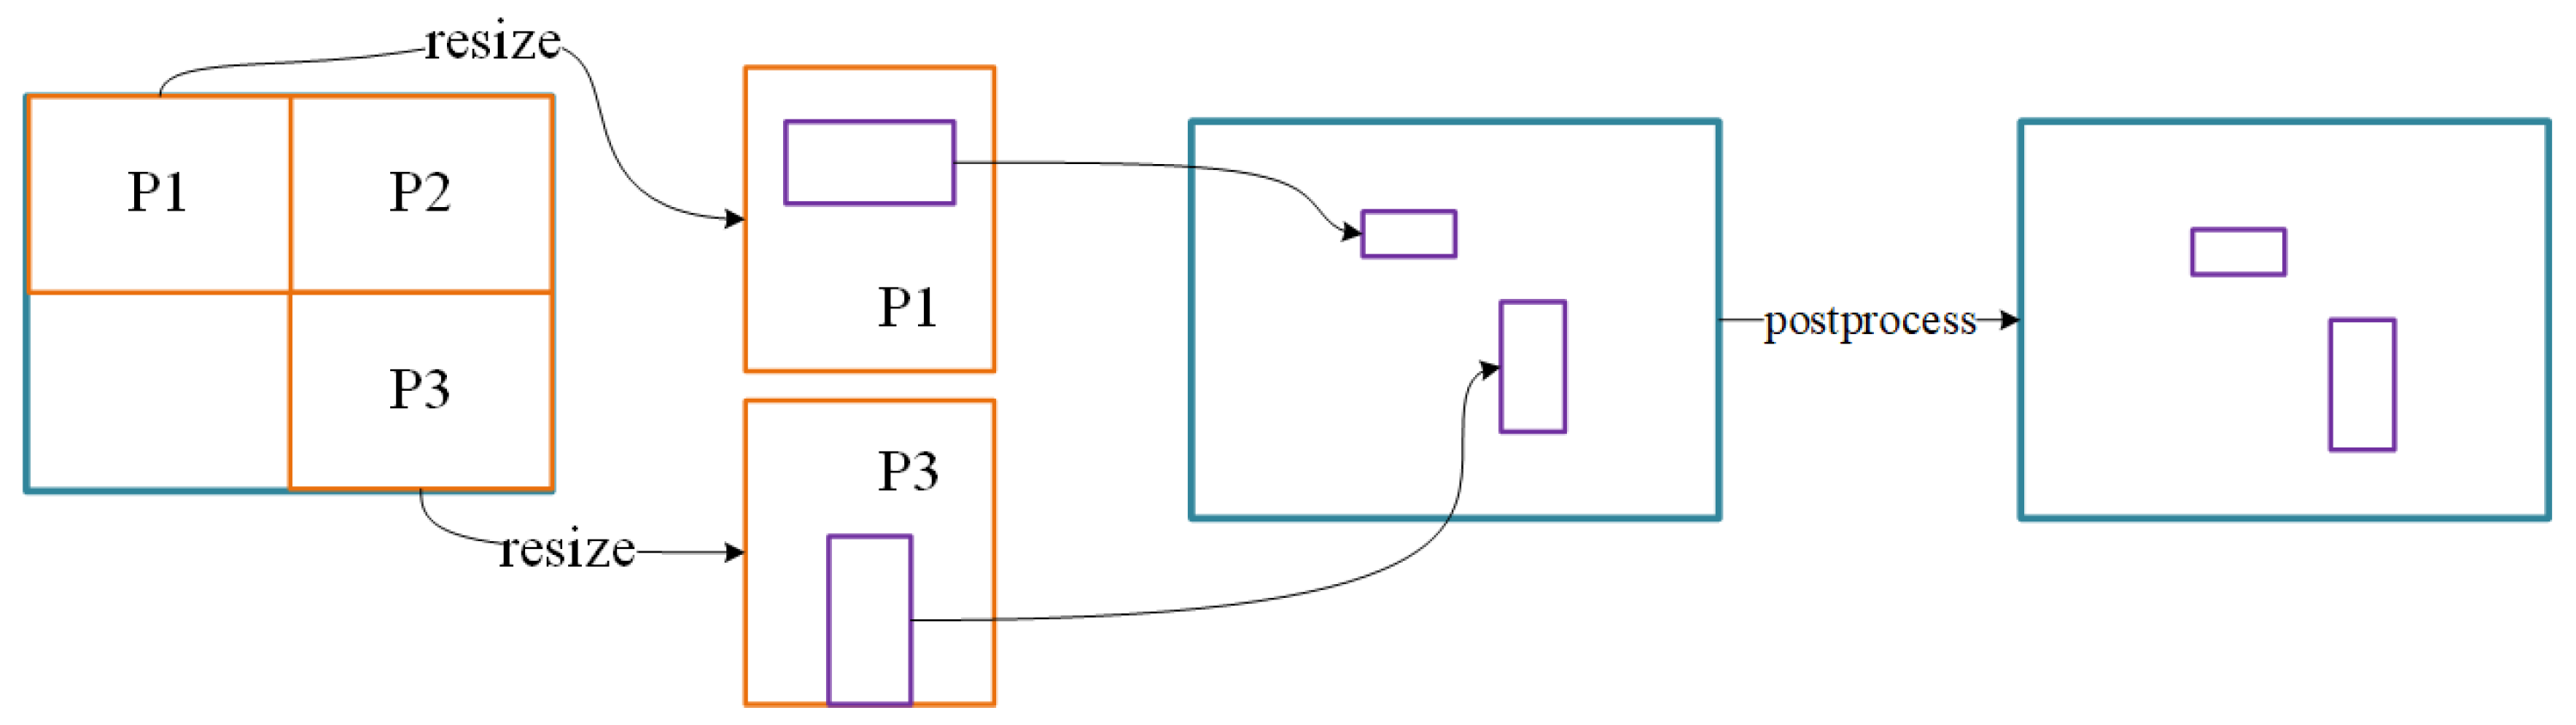
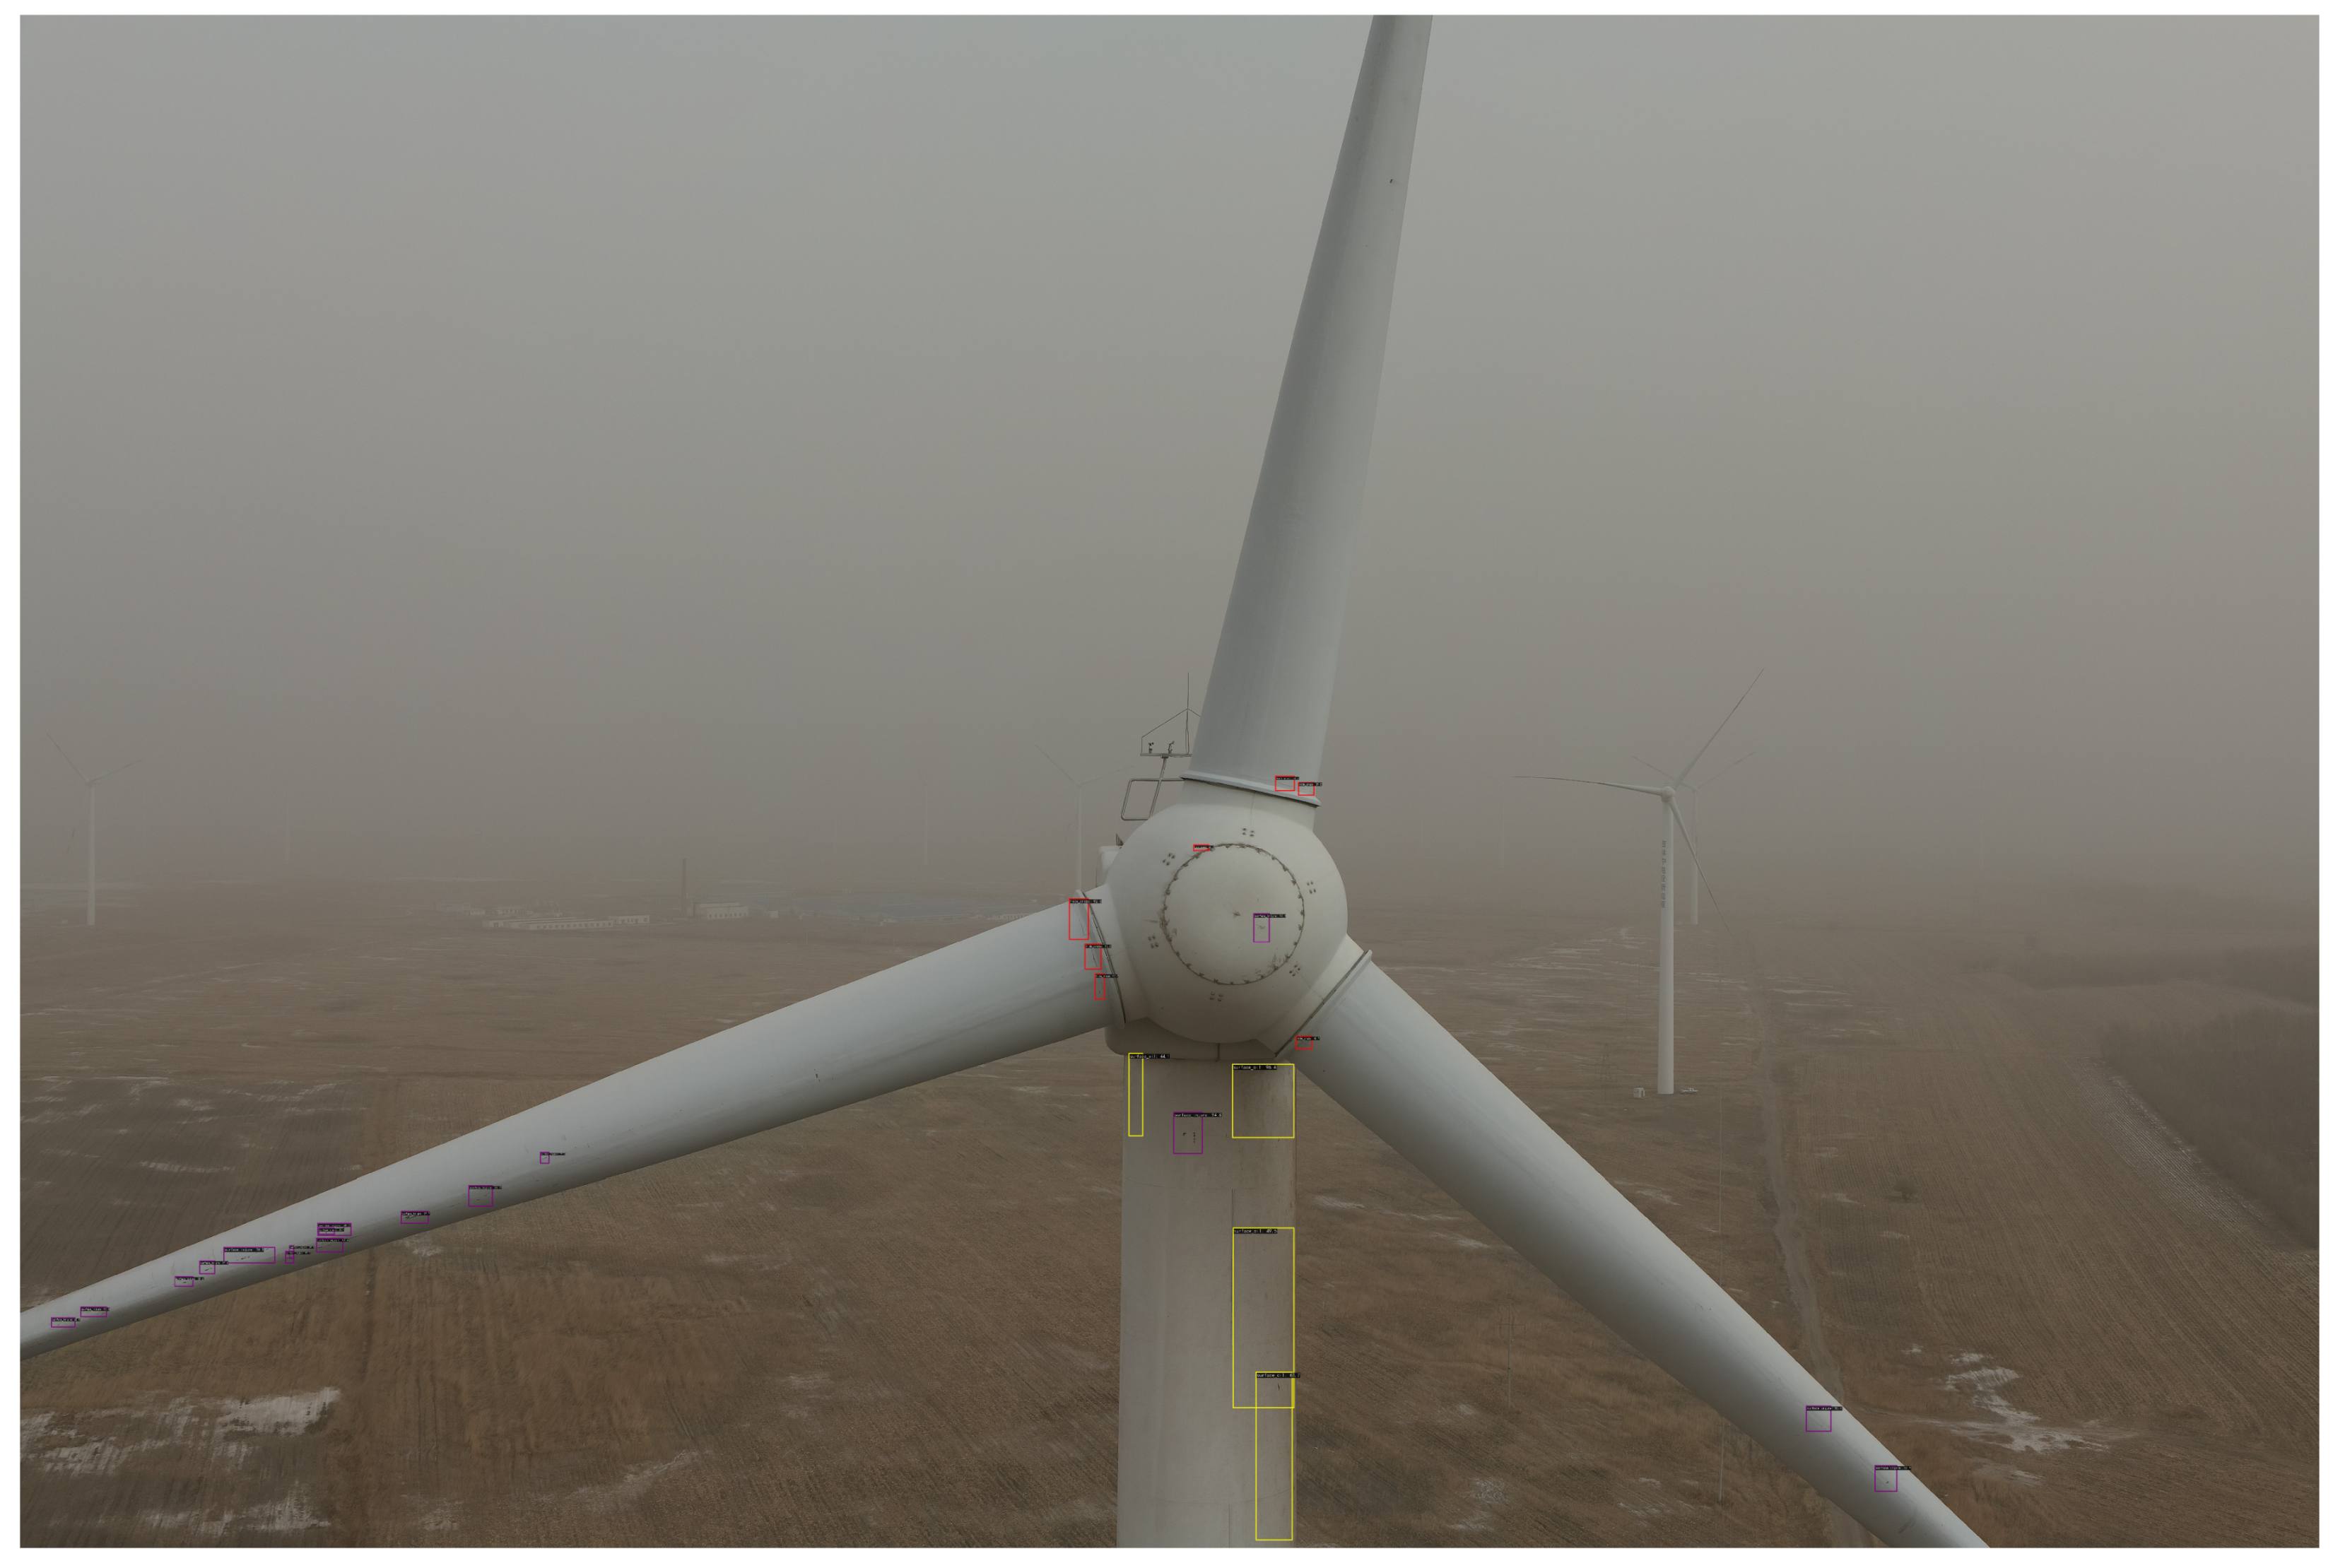
  • We introduce slicing-aided hyper inference [31] to enable prediction inference in large images captured by actual unmanned aerial vehicles, facilitating wind turbine surface defect detection in real industrial scenarios.

2. Data Collection and Dataset Construction

Wind turbine generators work in a variety of complex and even extreme environments for long periods of time, resulting in diverse surface defects whose root causes are similarly intricate and varied. The dataset used in this study covers all common types of defects, which are separated into seven categories: surface dust and oil, uneven surface sand, peeling surface paint, leading edge corrosion, non-open cracking, lightning burns, and open tip cracking. These will be described as follows in order to illustrate their characteristics and the causes of their formation:
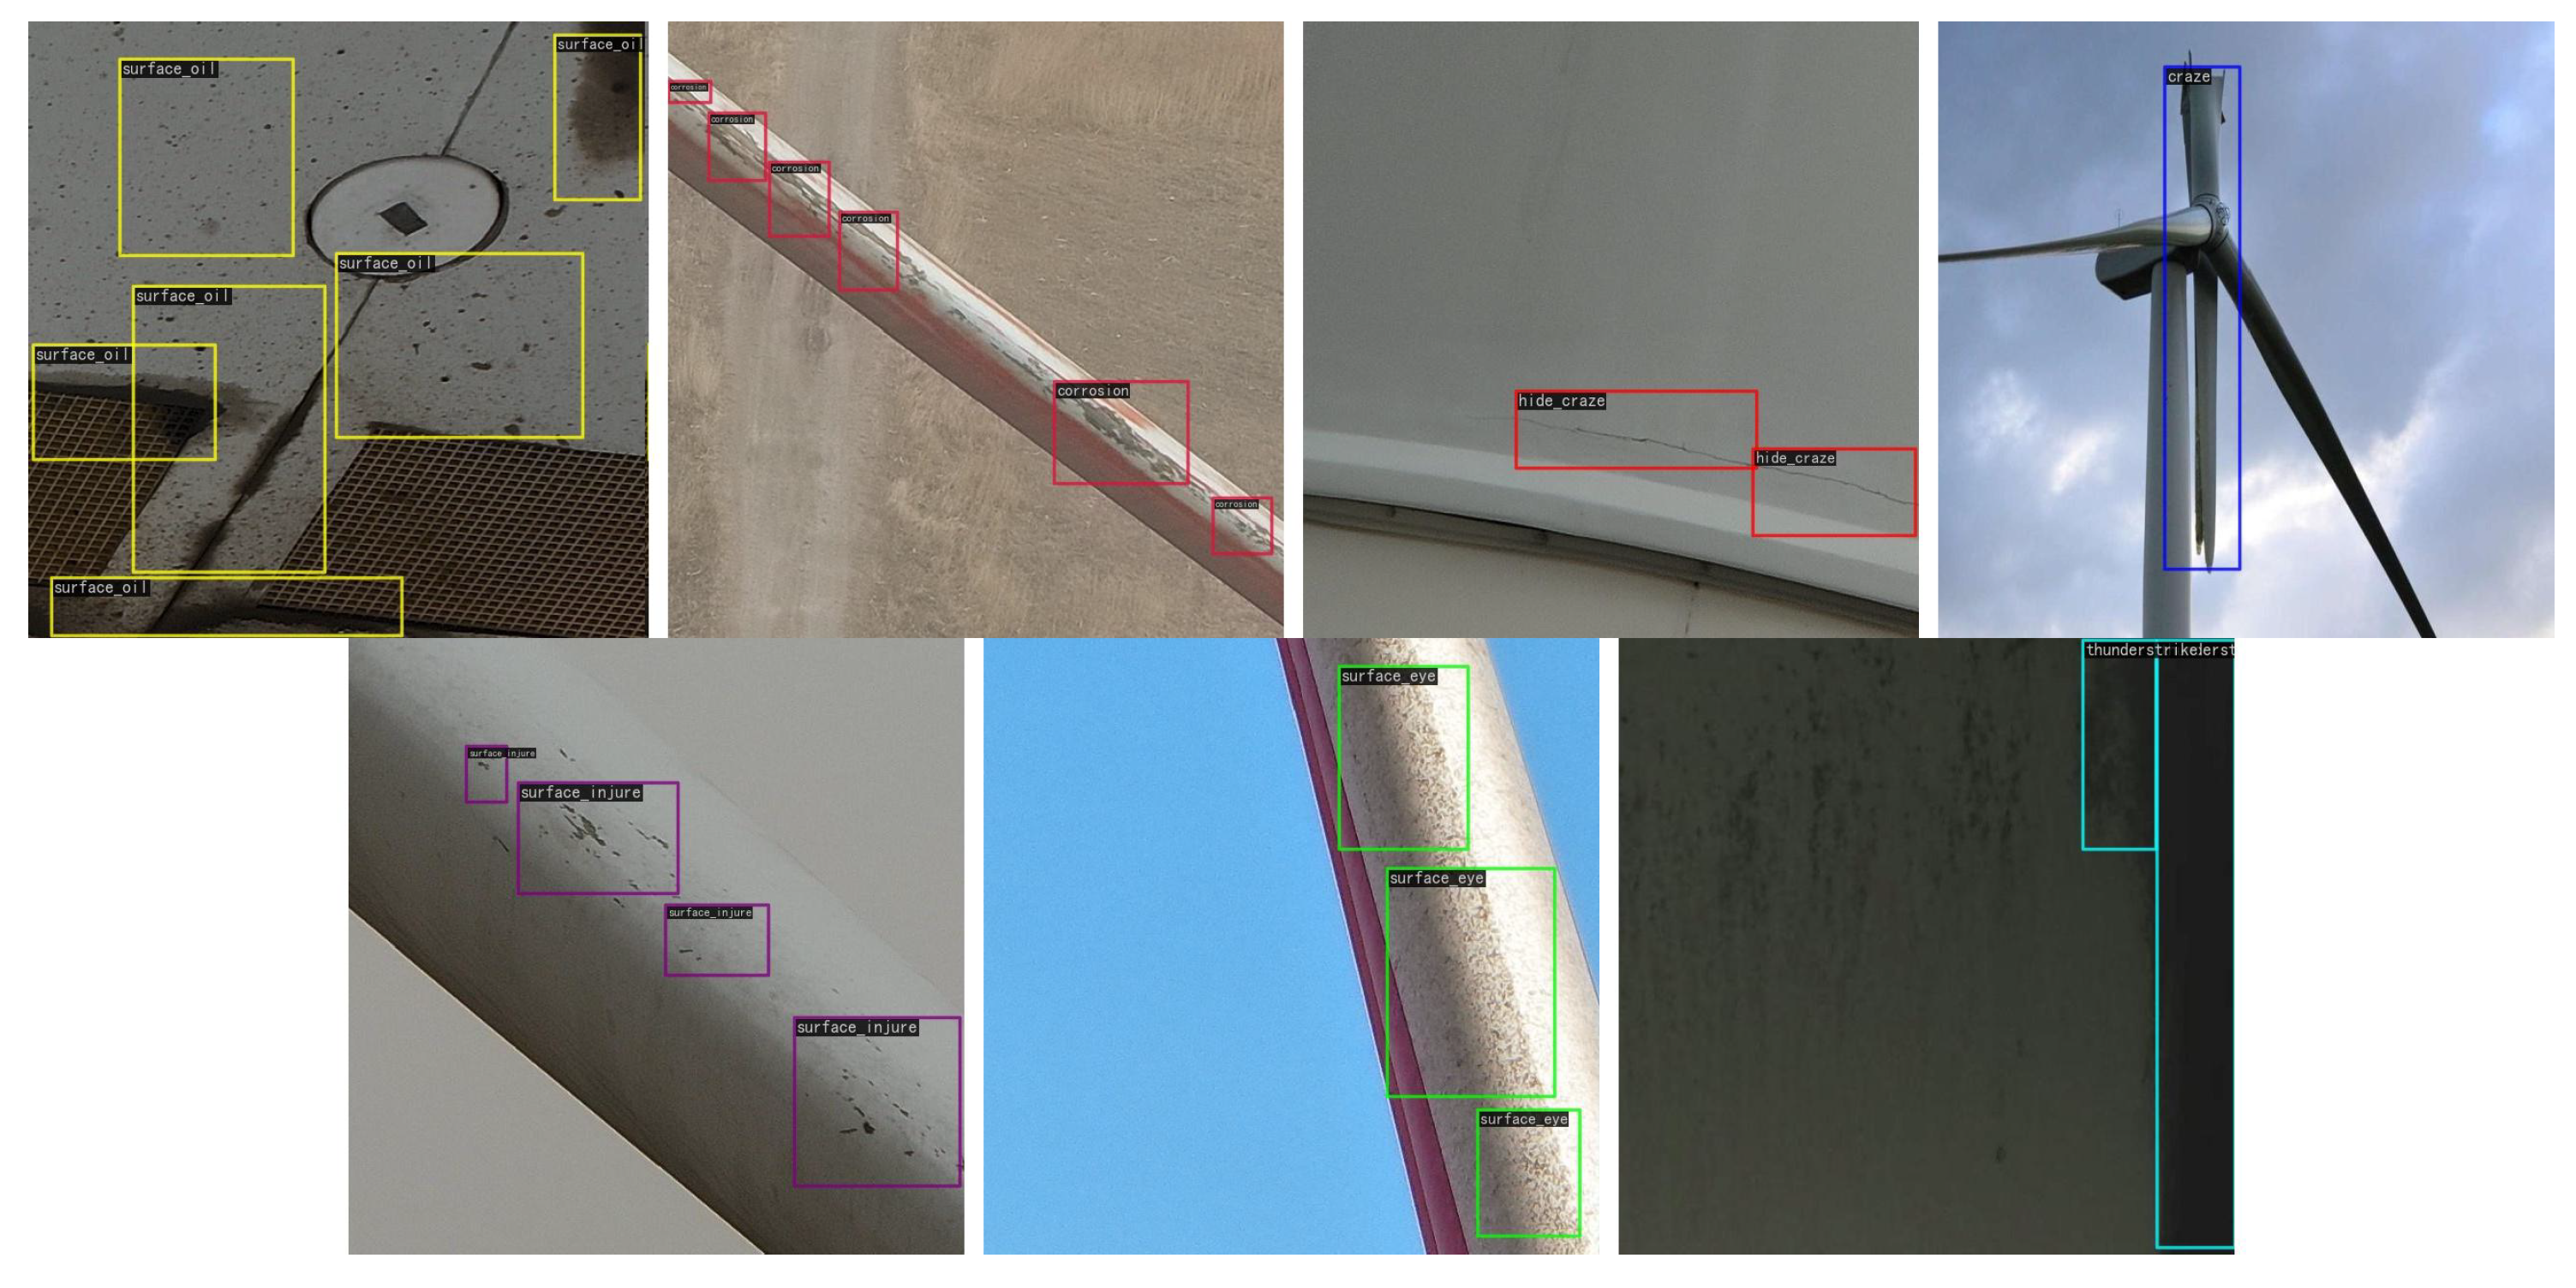
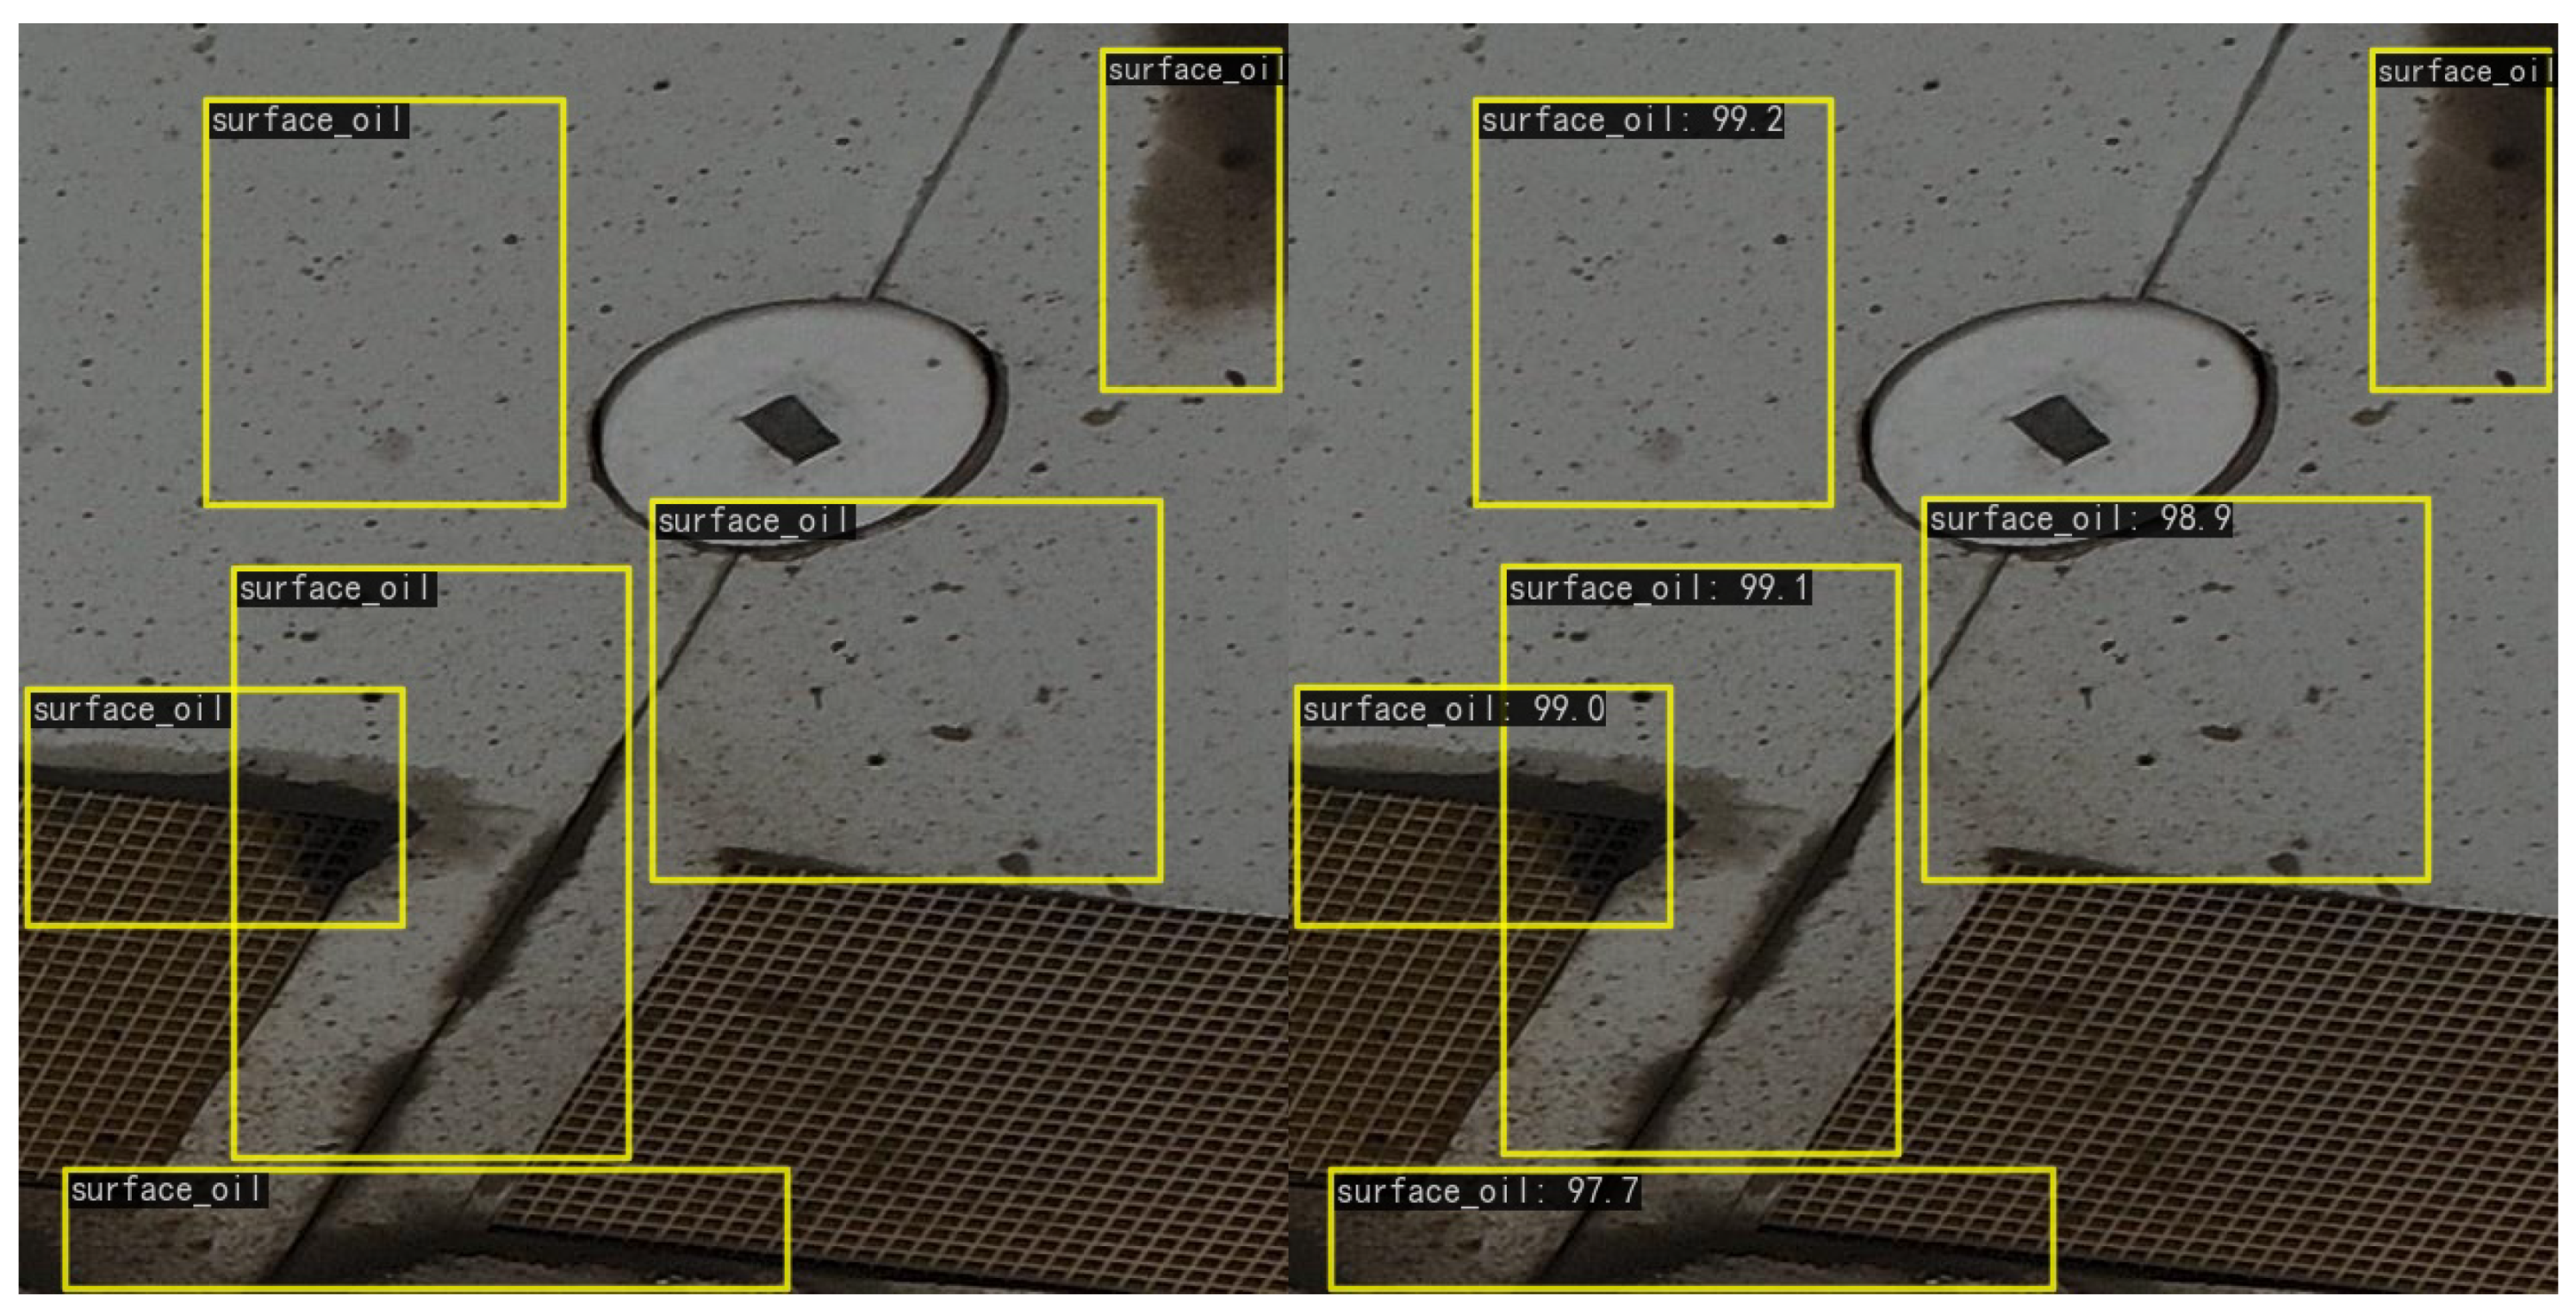
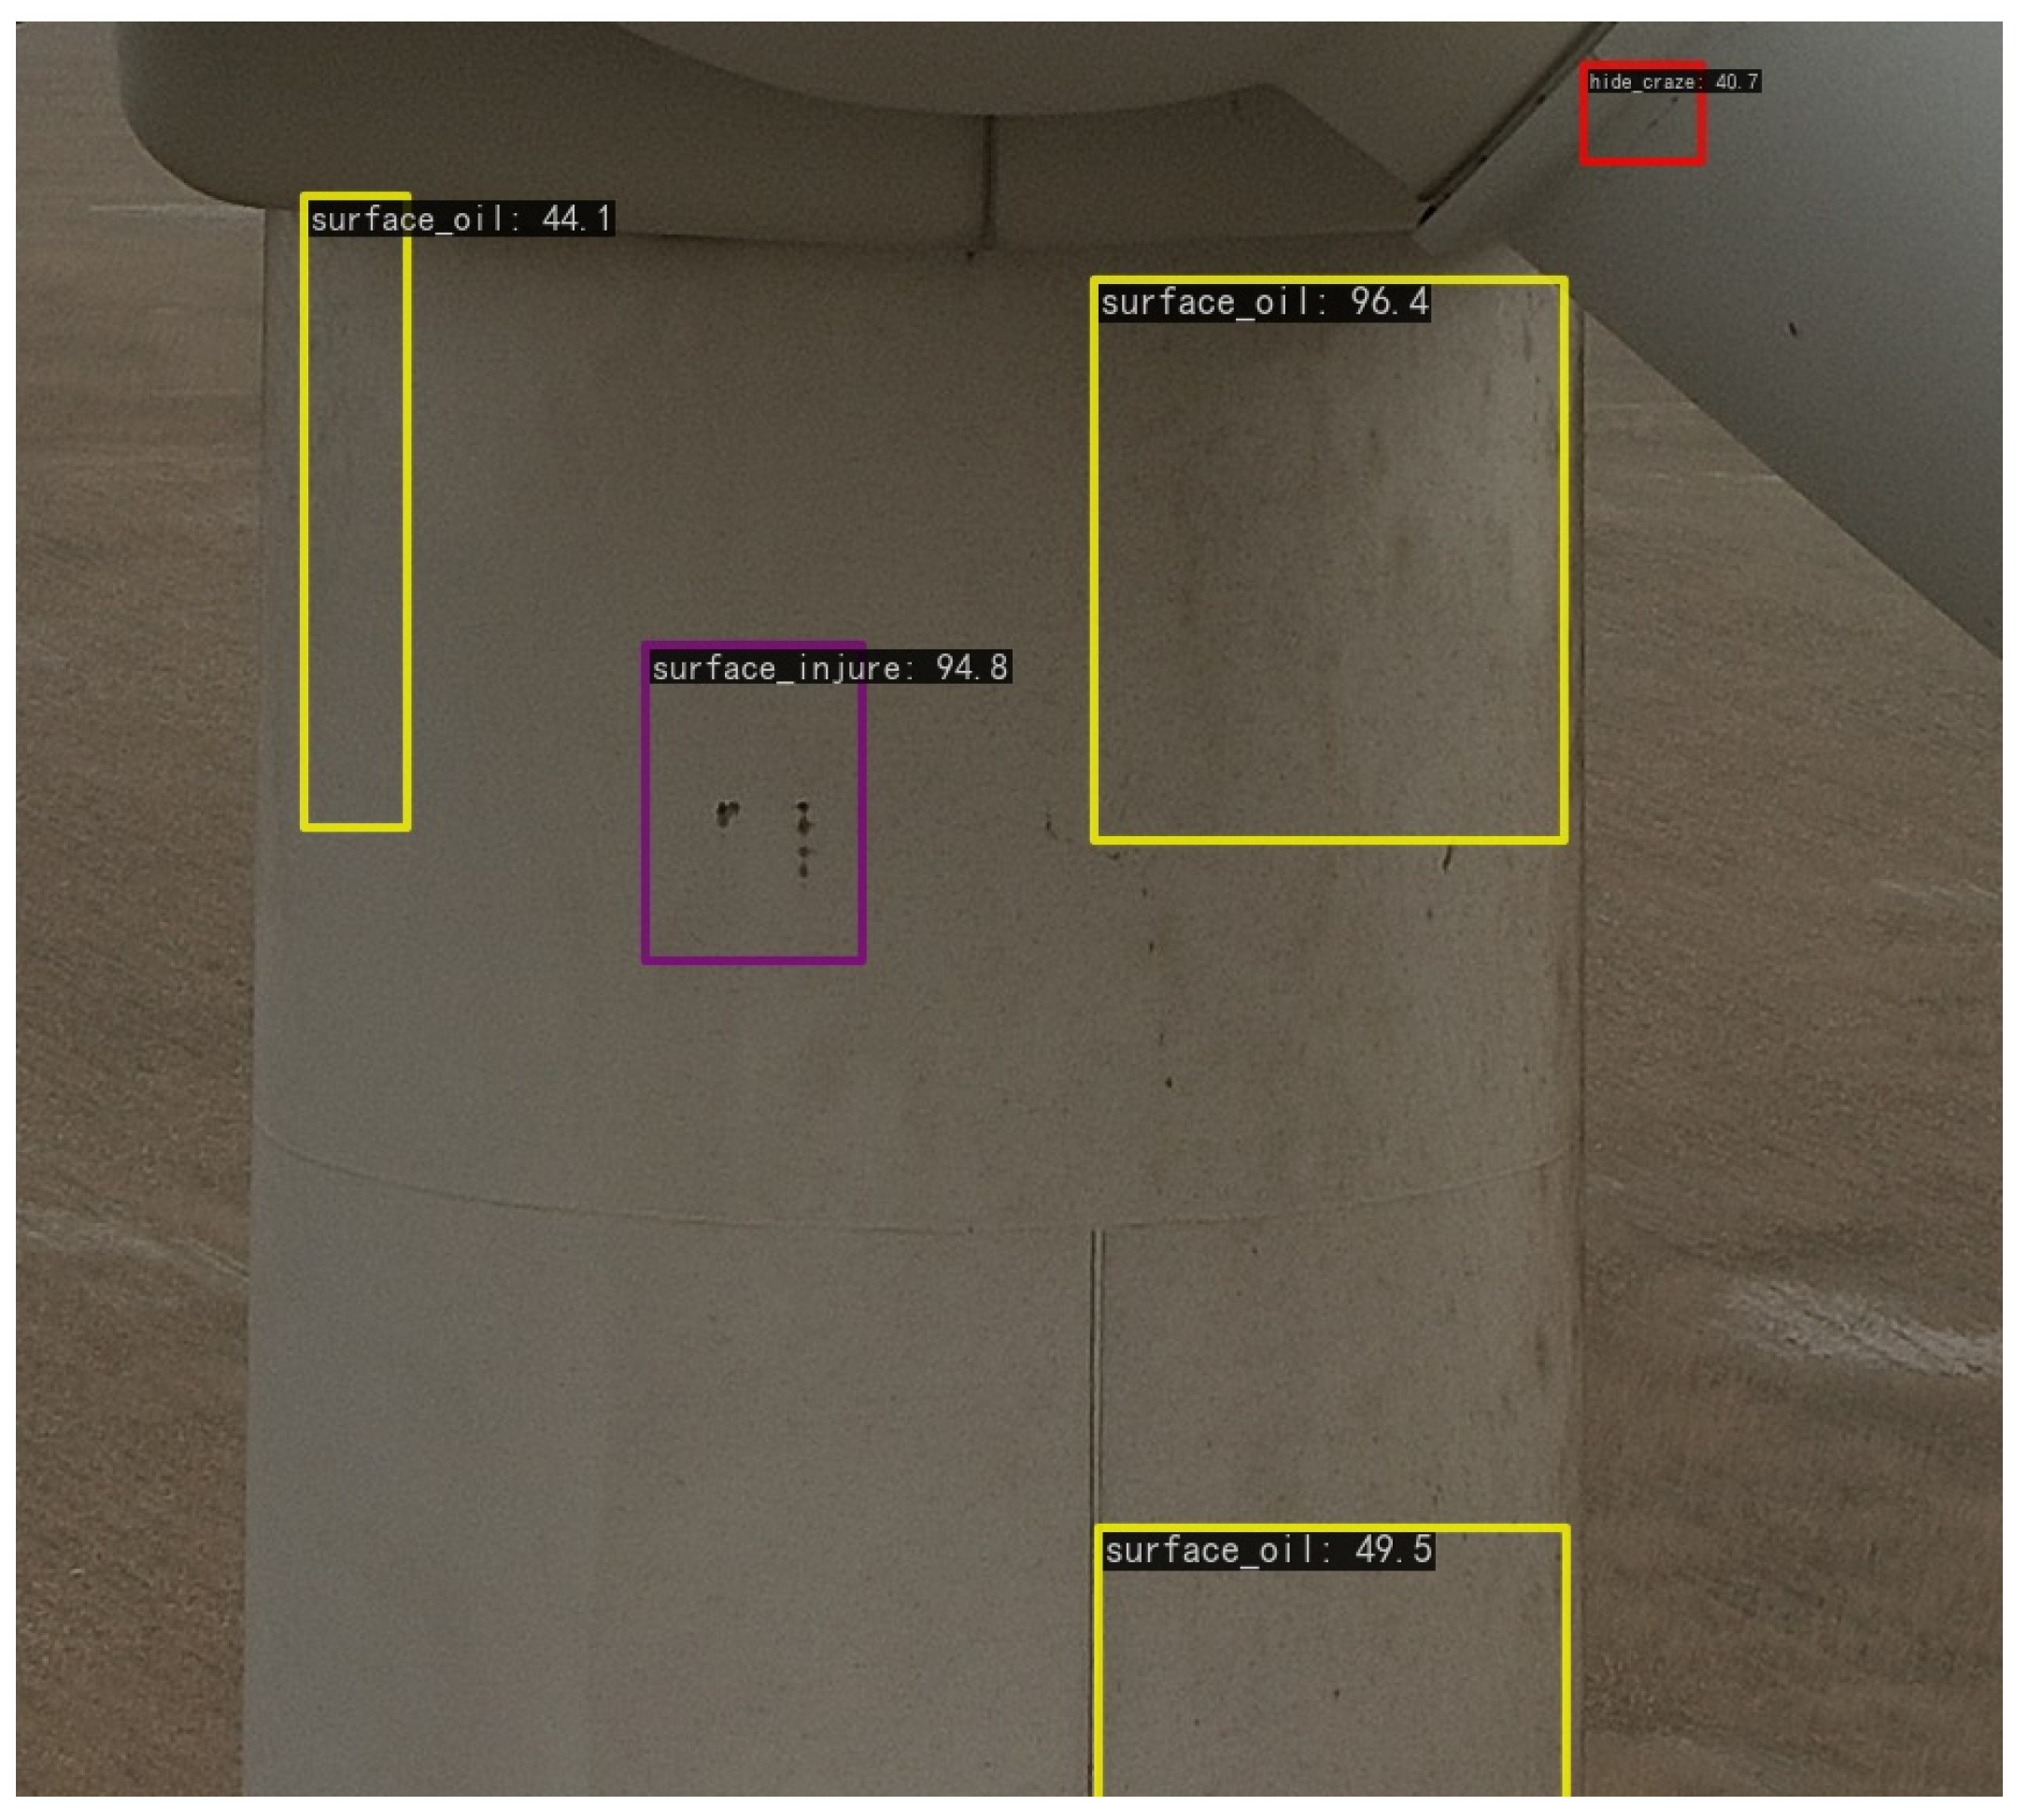
  • Surface oil: Dust, particulate matter, and oil from the environment adhere to the generator’s surface and may result from atmospheric particulate matter, oil vapors, etc. Accumulated dust and oil will reduce the surface finish, leading to increased friction on the generator’s surface and affecting the efficiency of turbine operation.
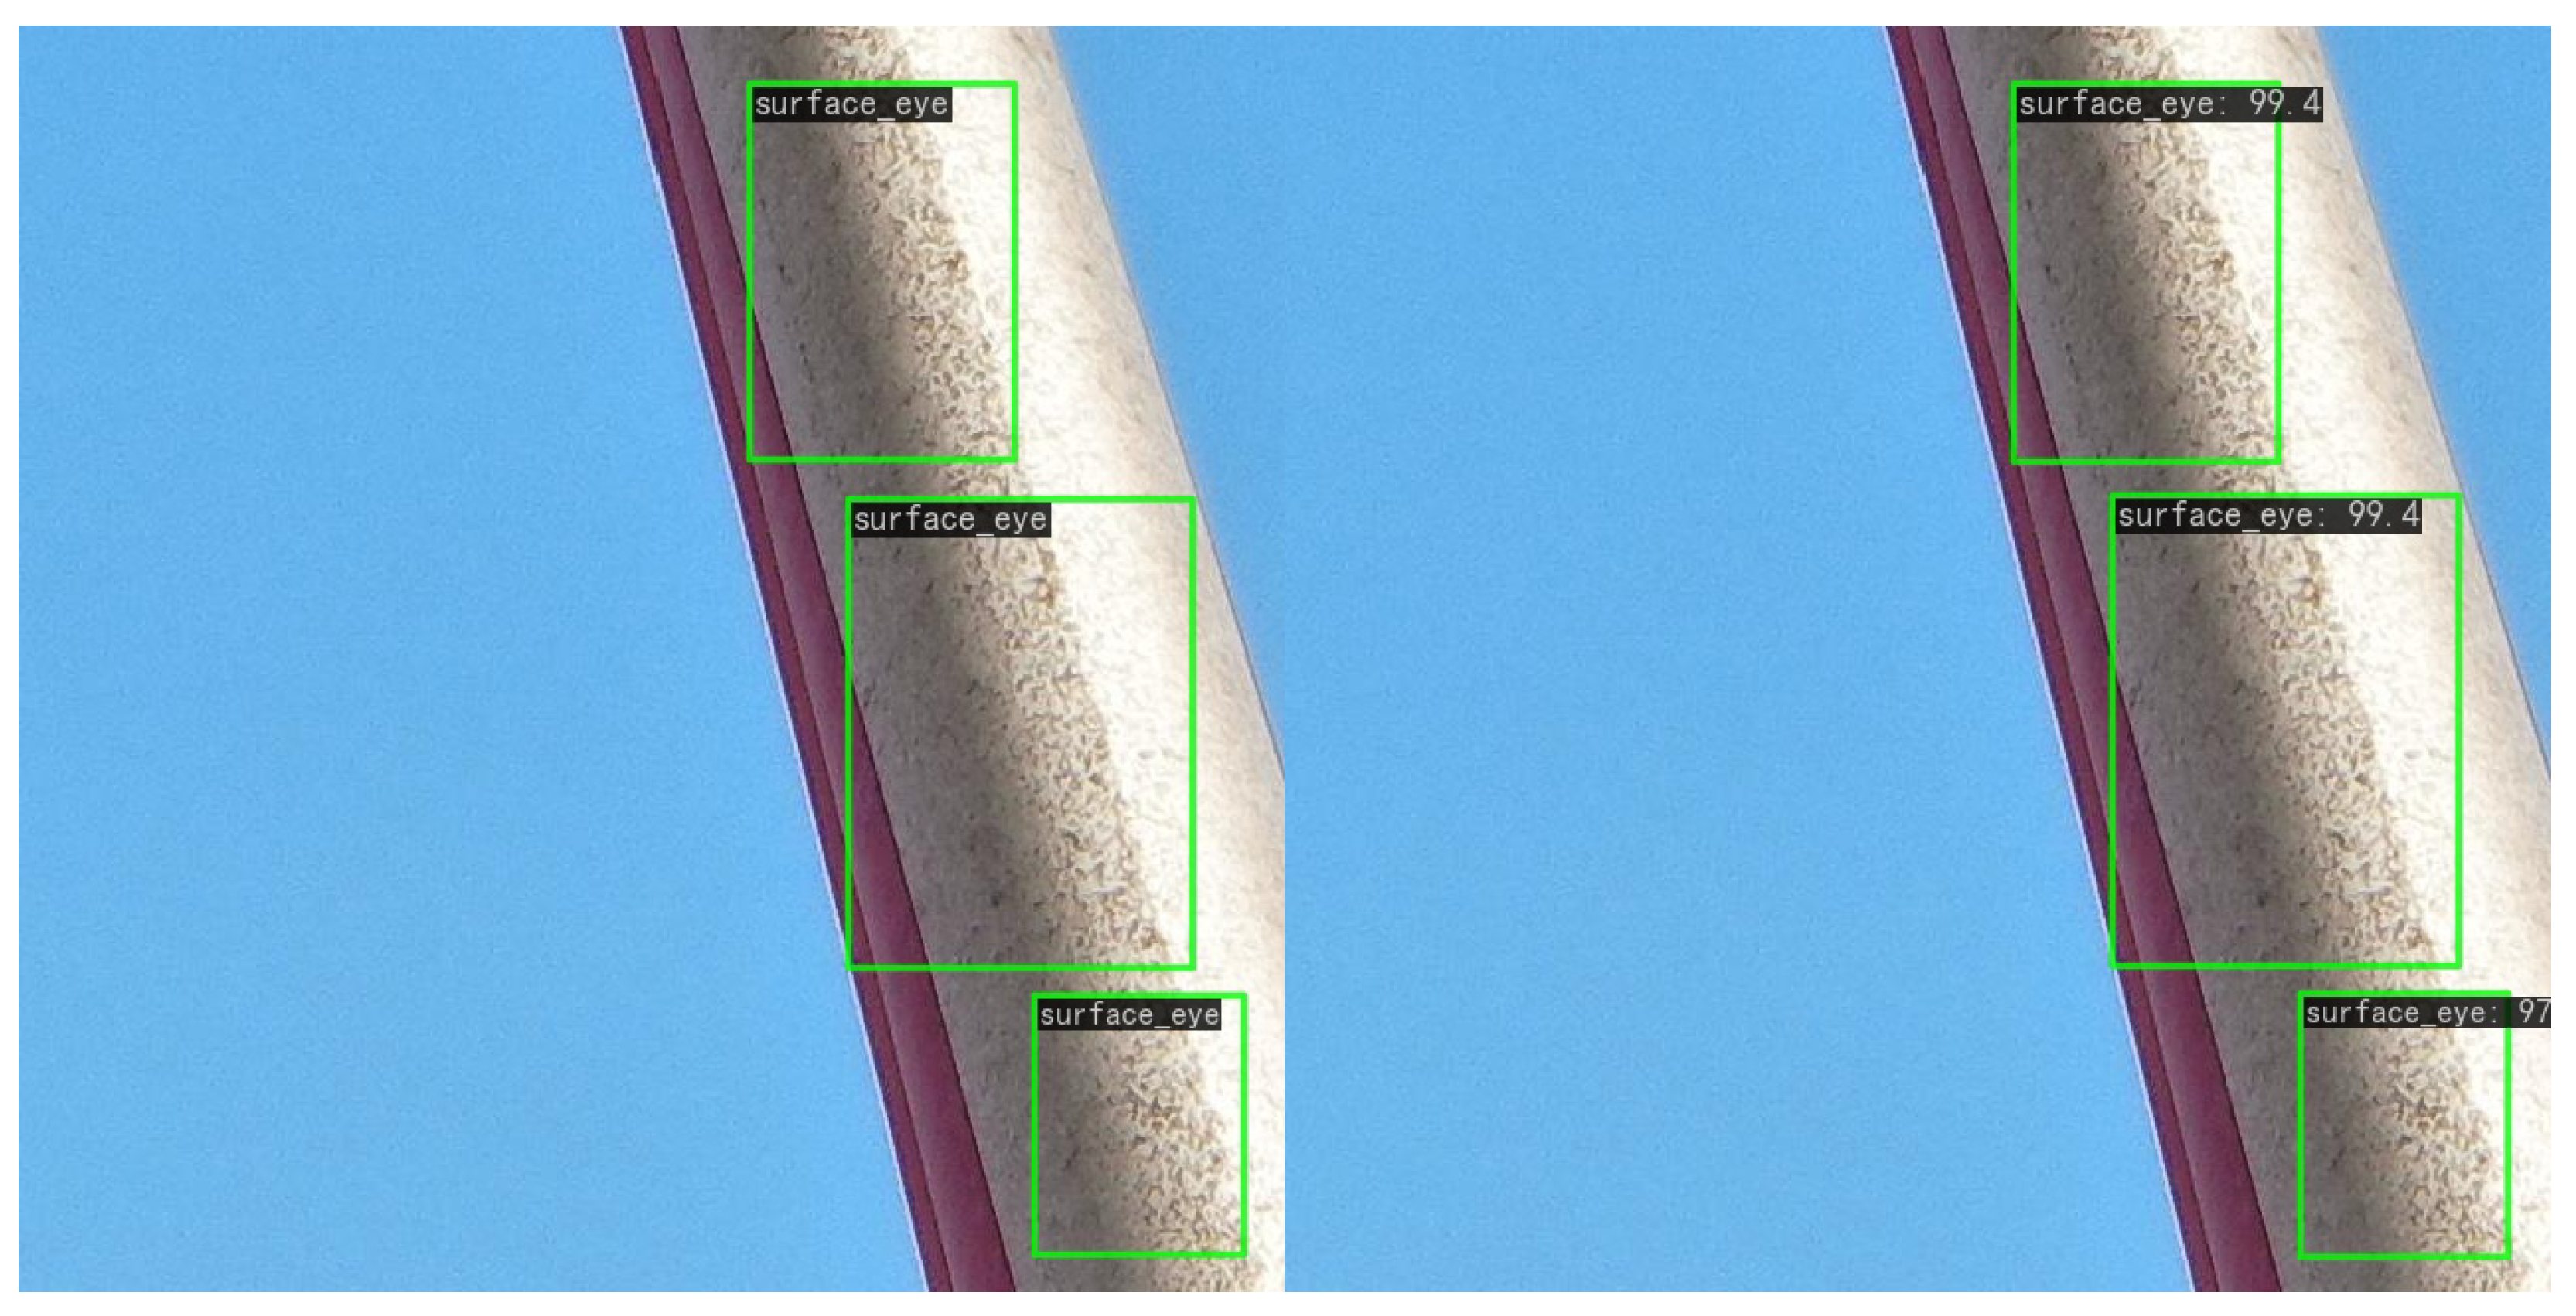
  • Surface eye: Abrasion, wind-blown sand, and other natural factors result in the formation of uneven surface eyes. The irregular surface may cause abnormal airflow, increase aerodynamic resistance, and impact the aerodynamic performance of the wind turbine.
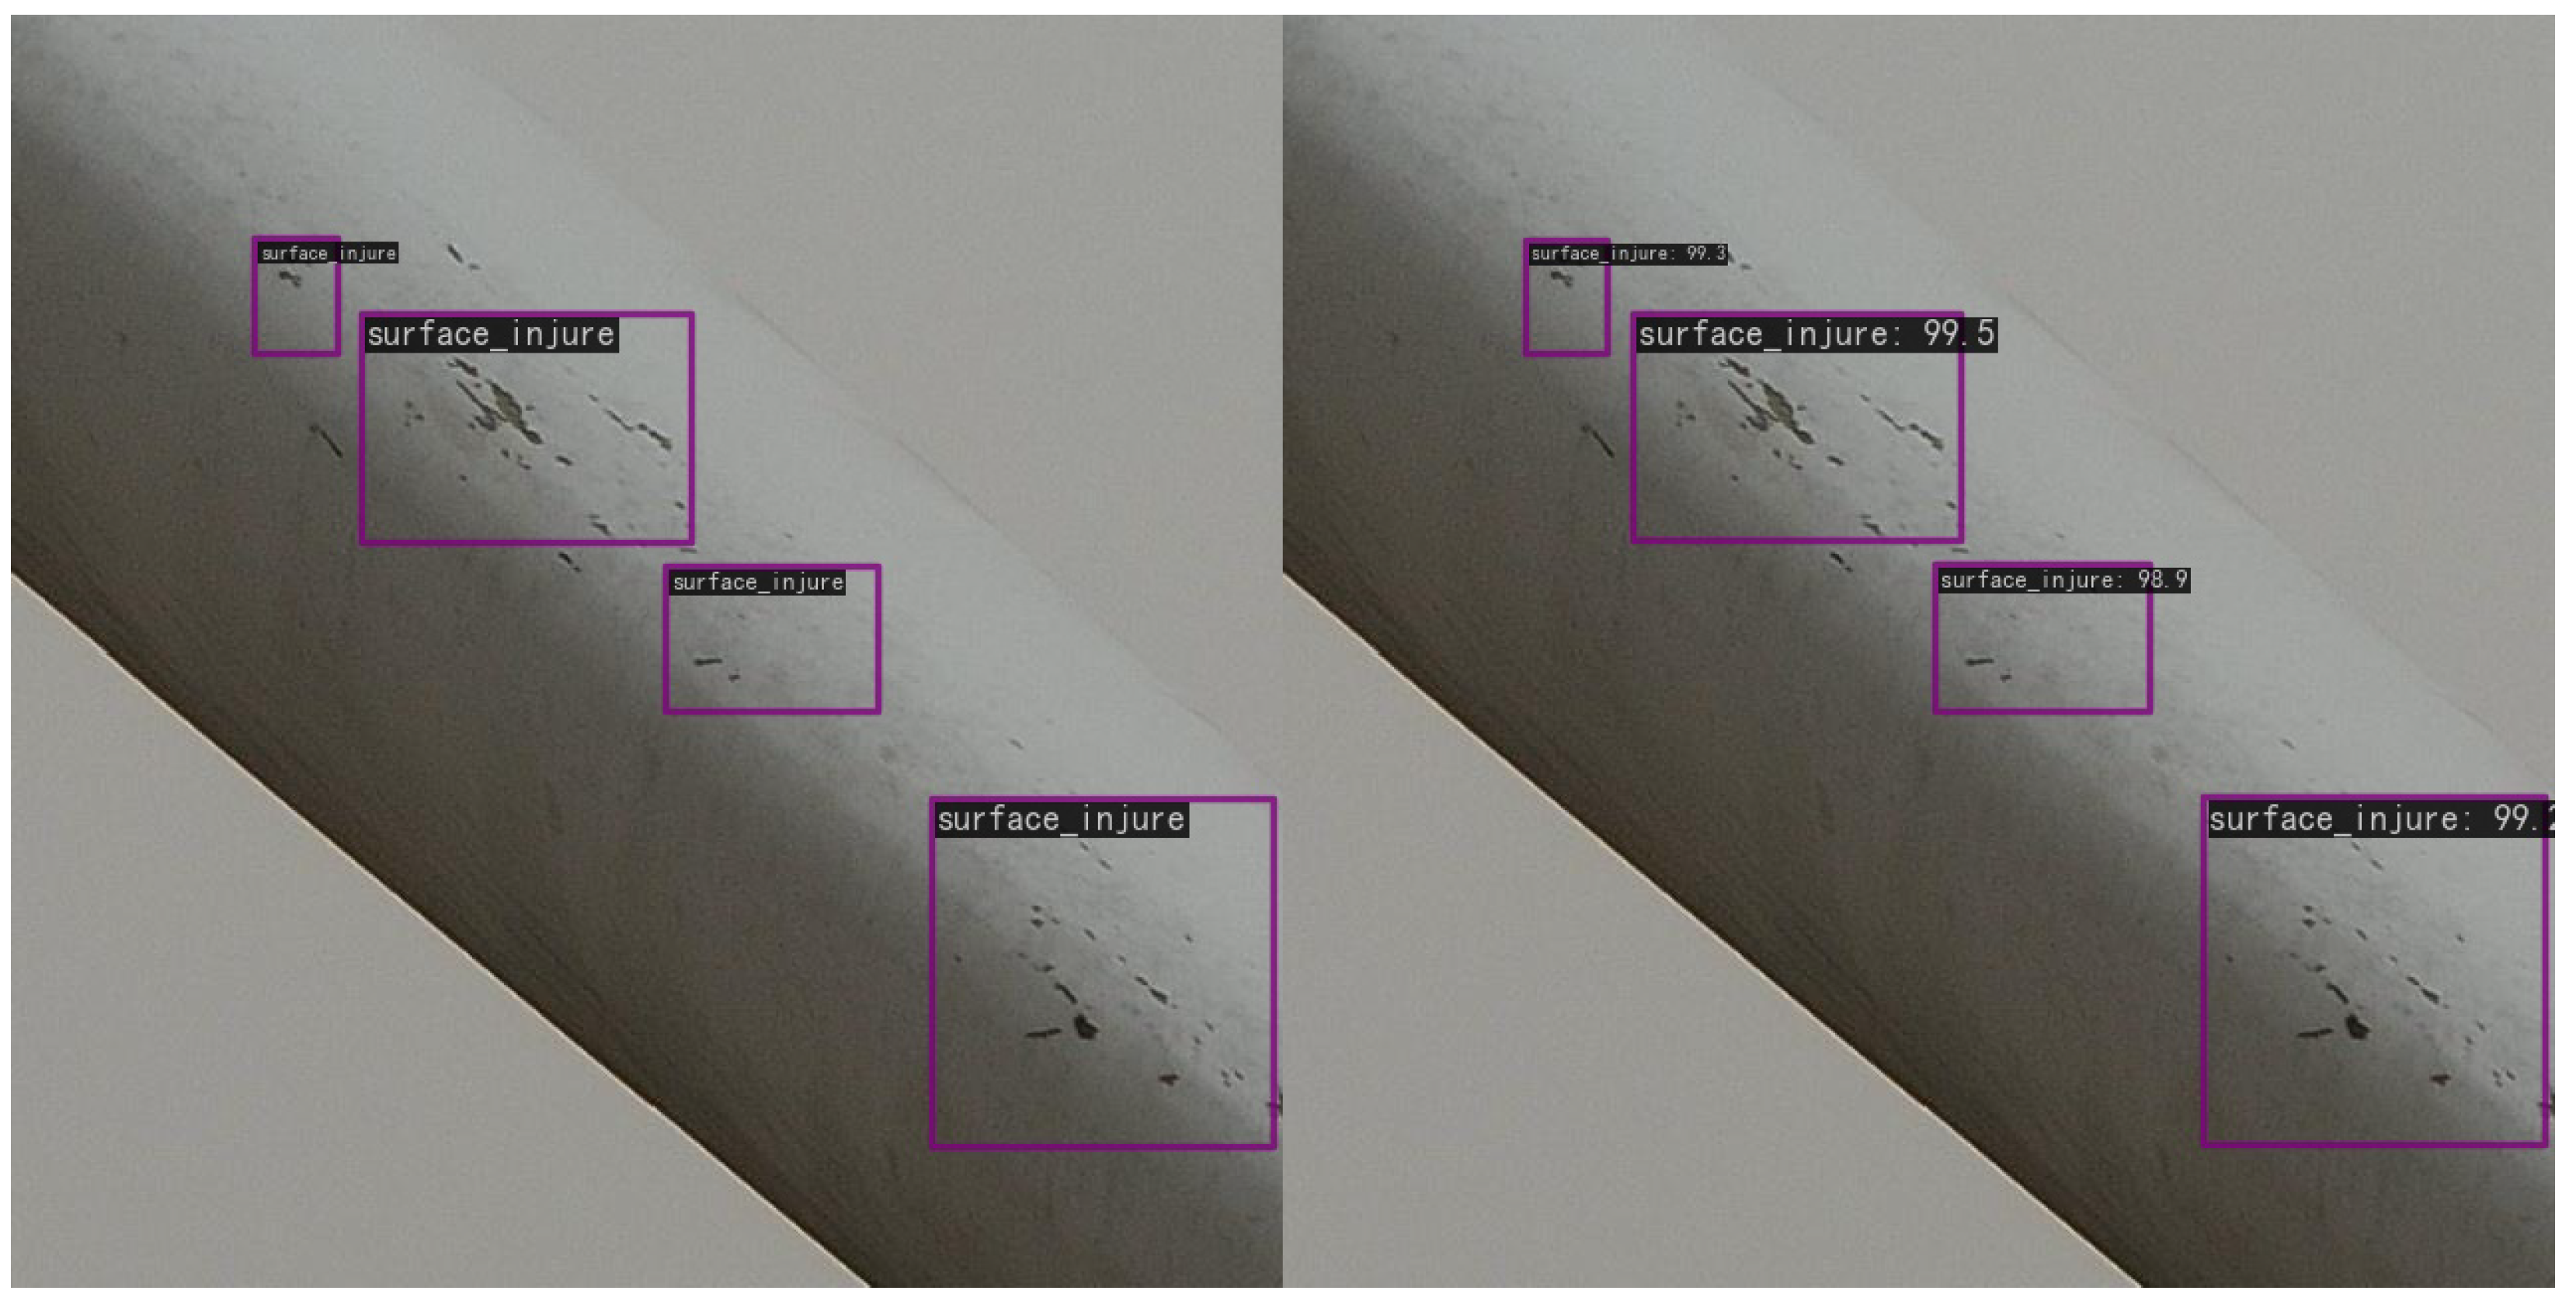
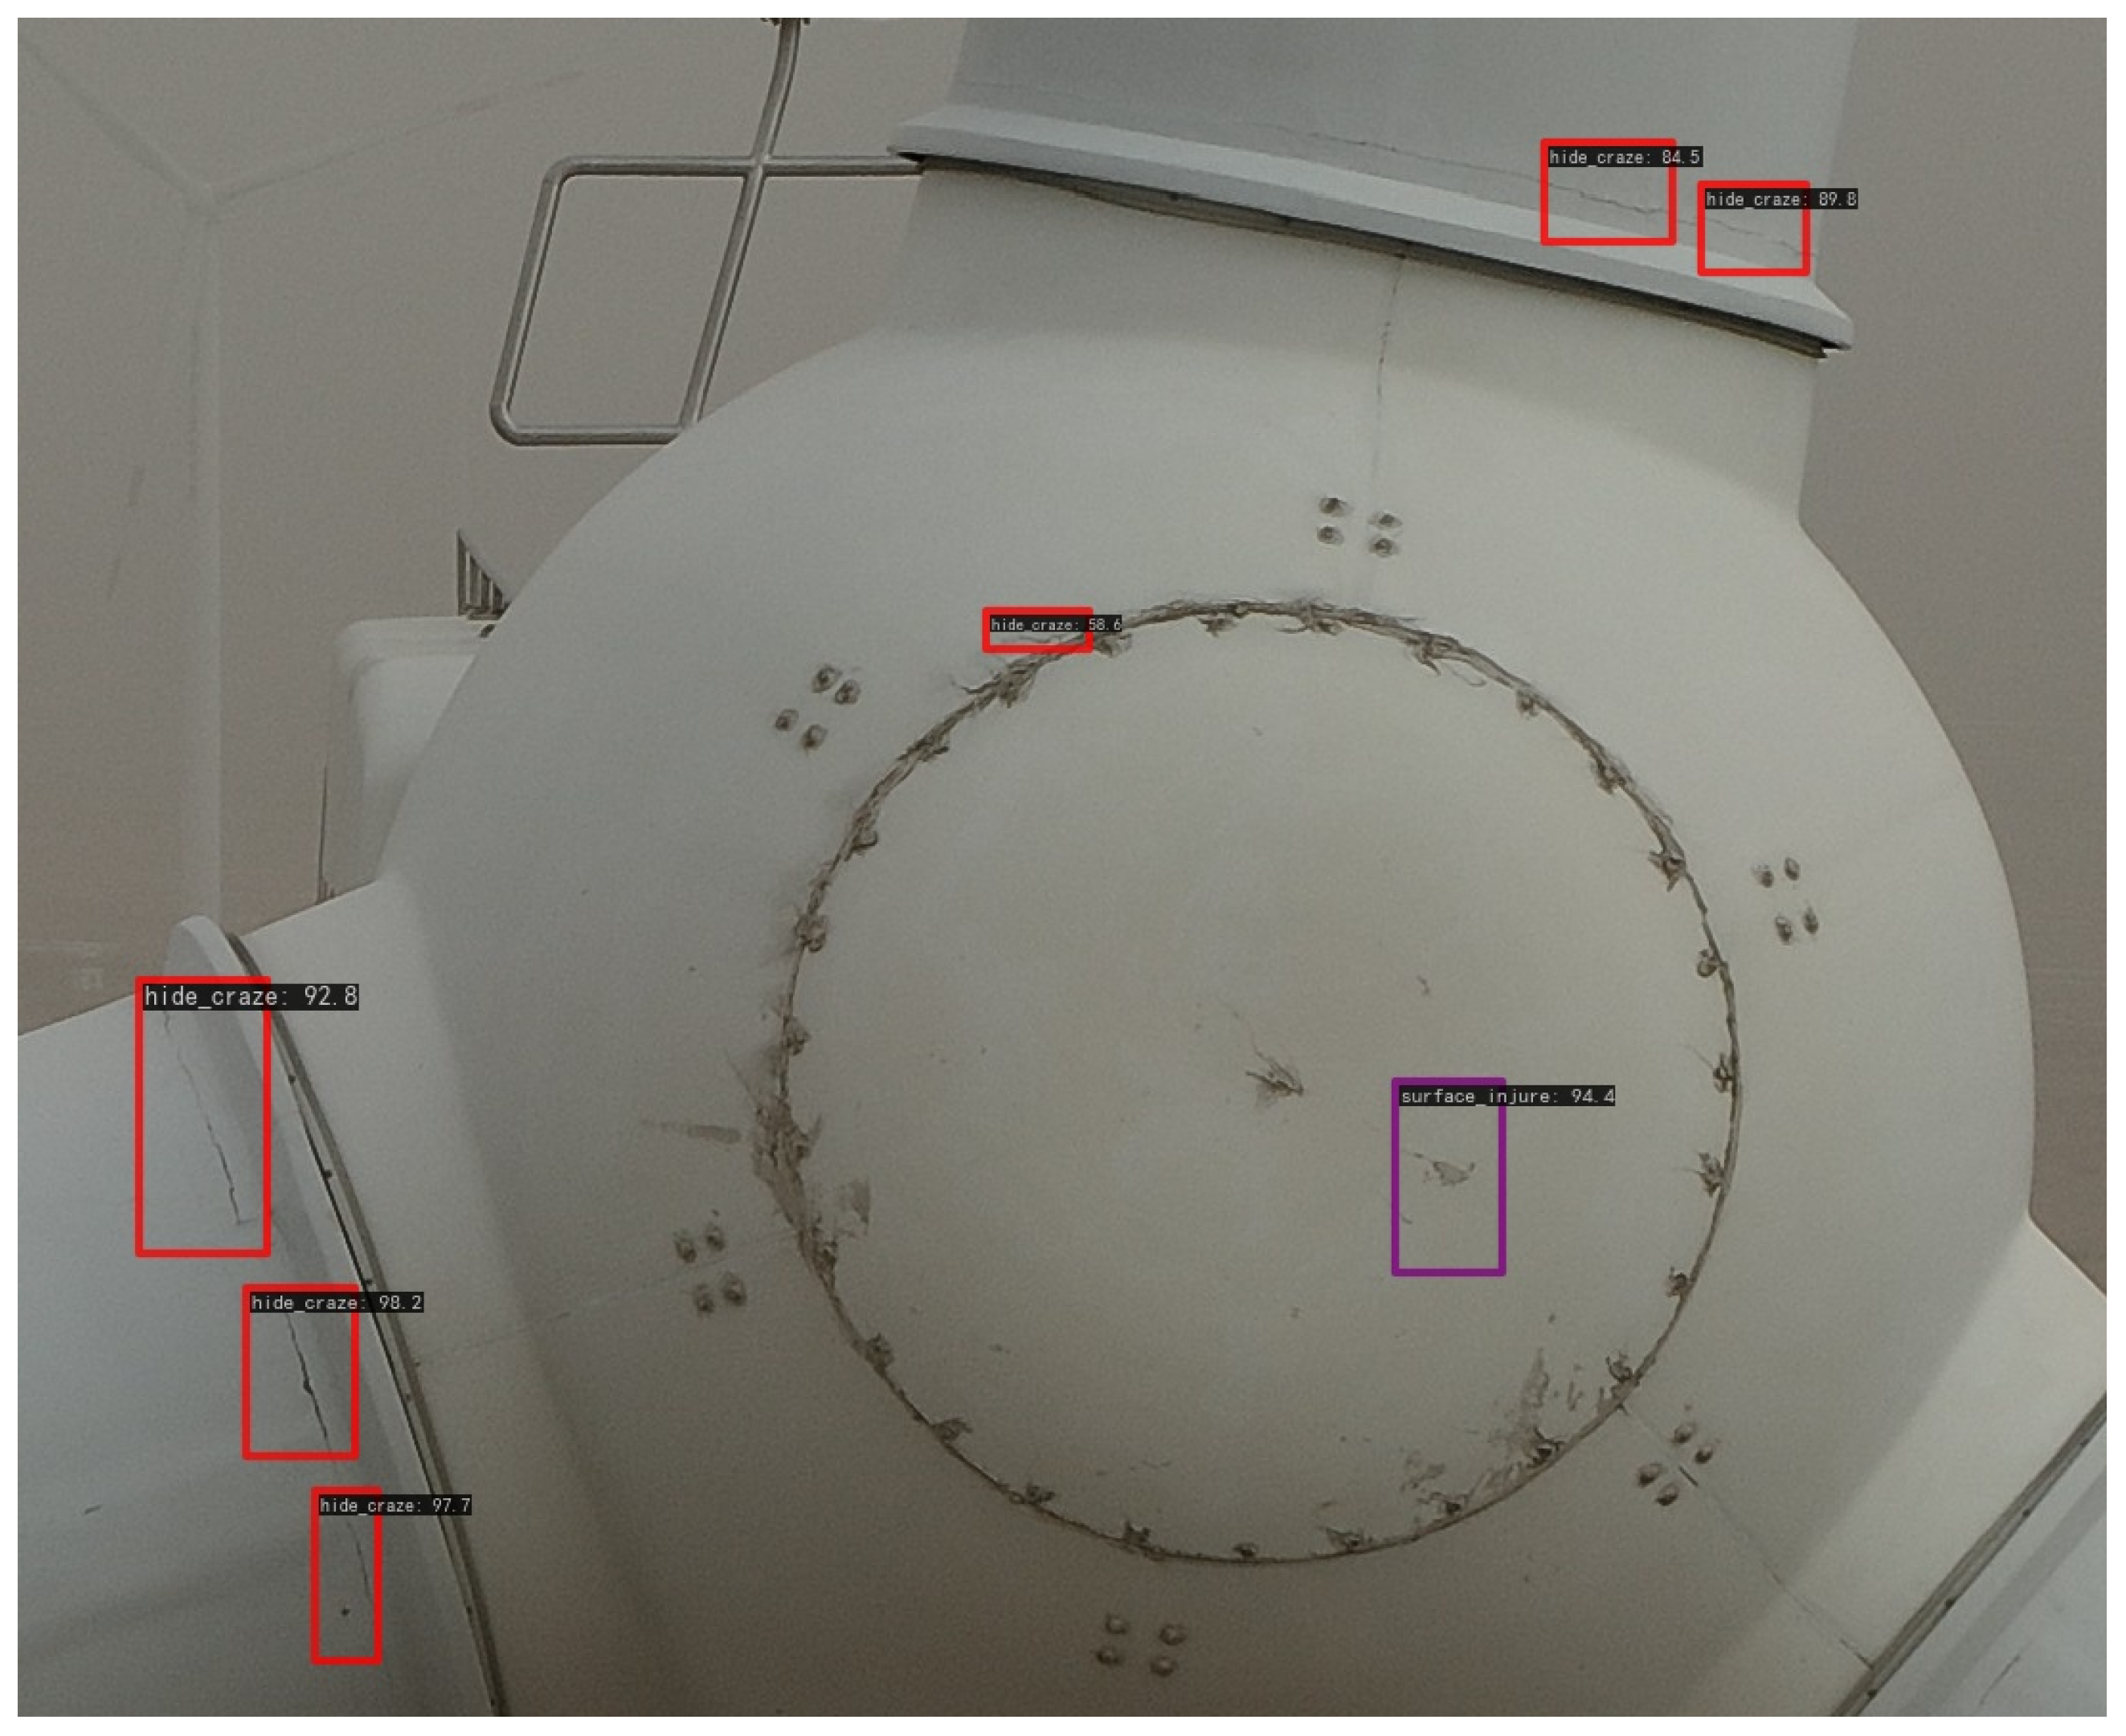
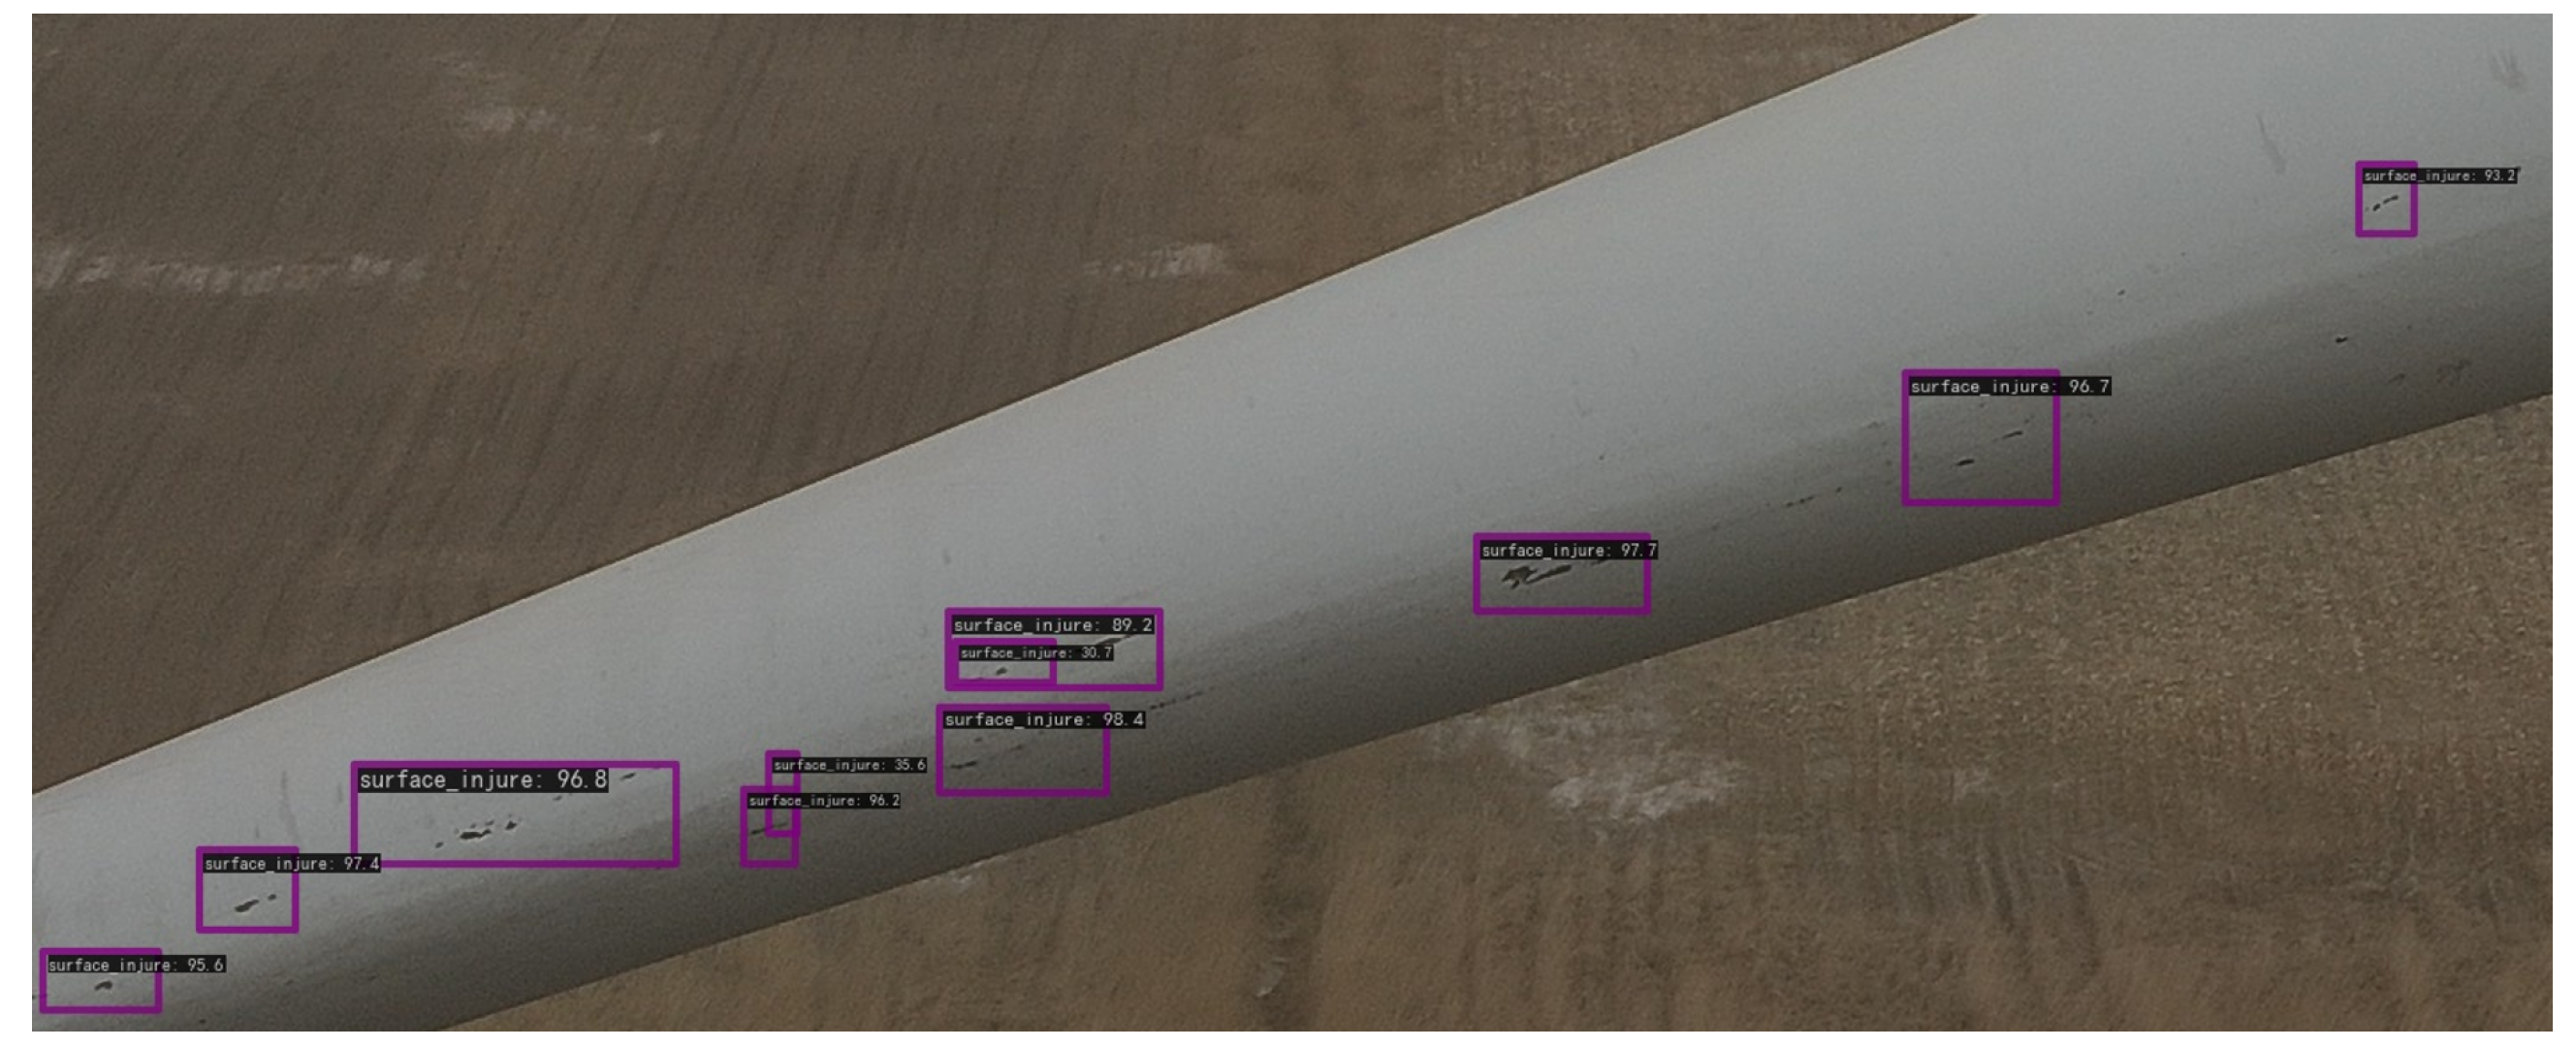
  • Surface injury: Prolonged exposure to ultraviolet radiation, temperature fluctuations, and other factors result in aging and peeling of the coating, which may lead to corrosion, diminish protective capabilities, and reduce the overall weather resistance of the generator.
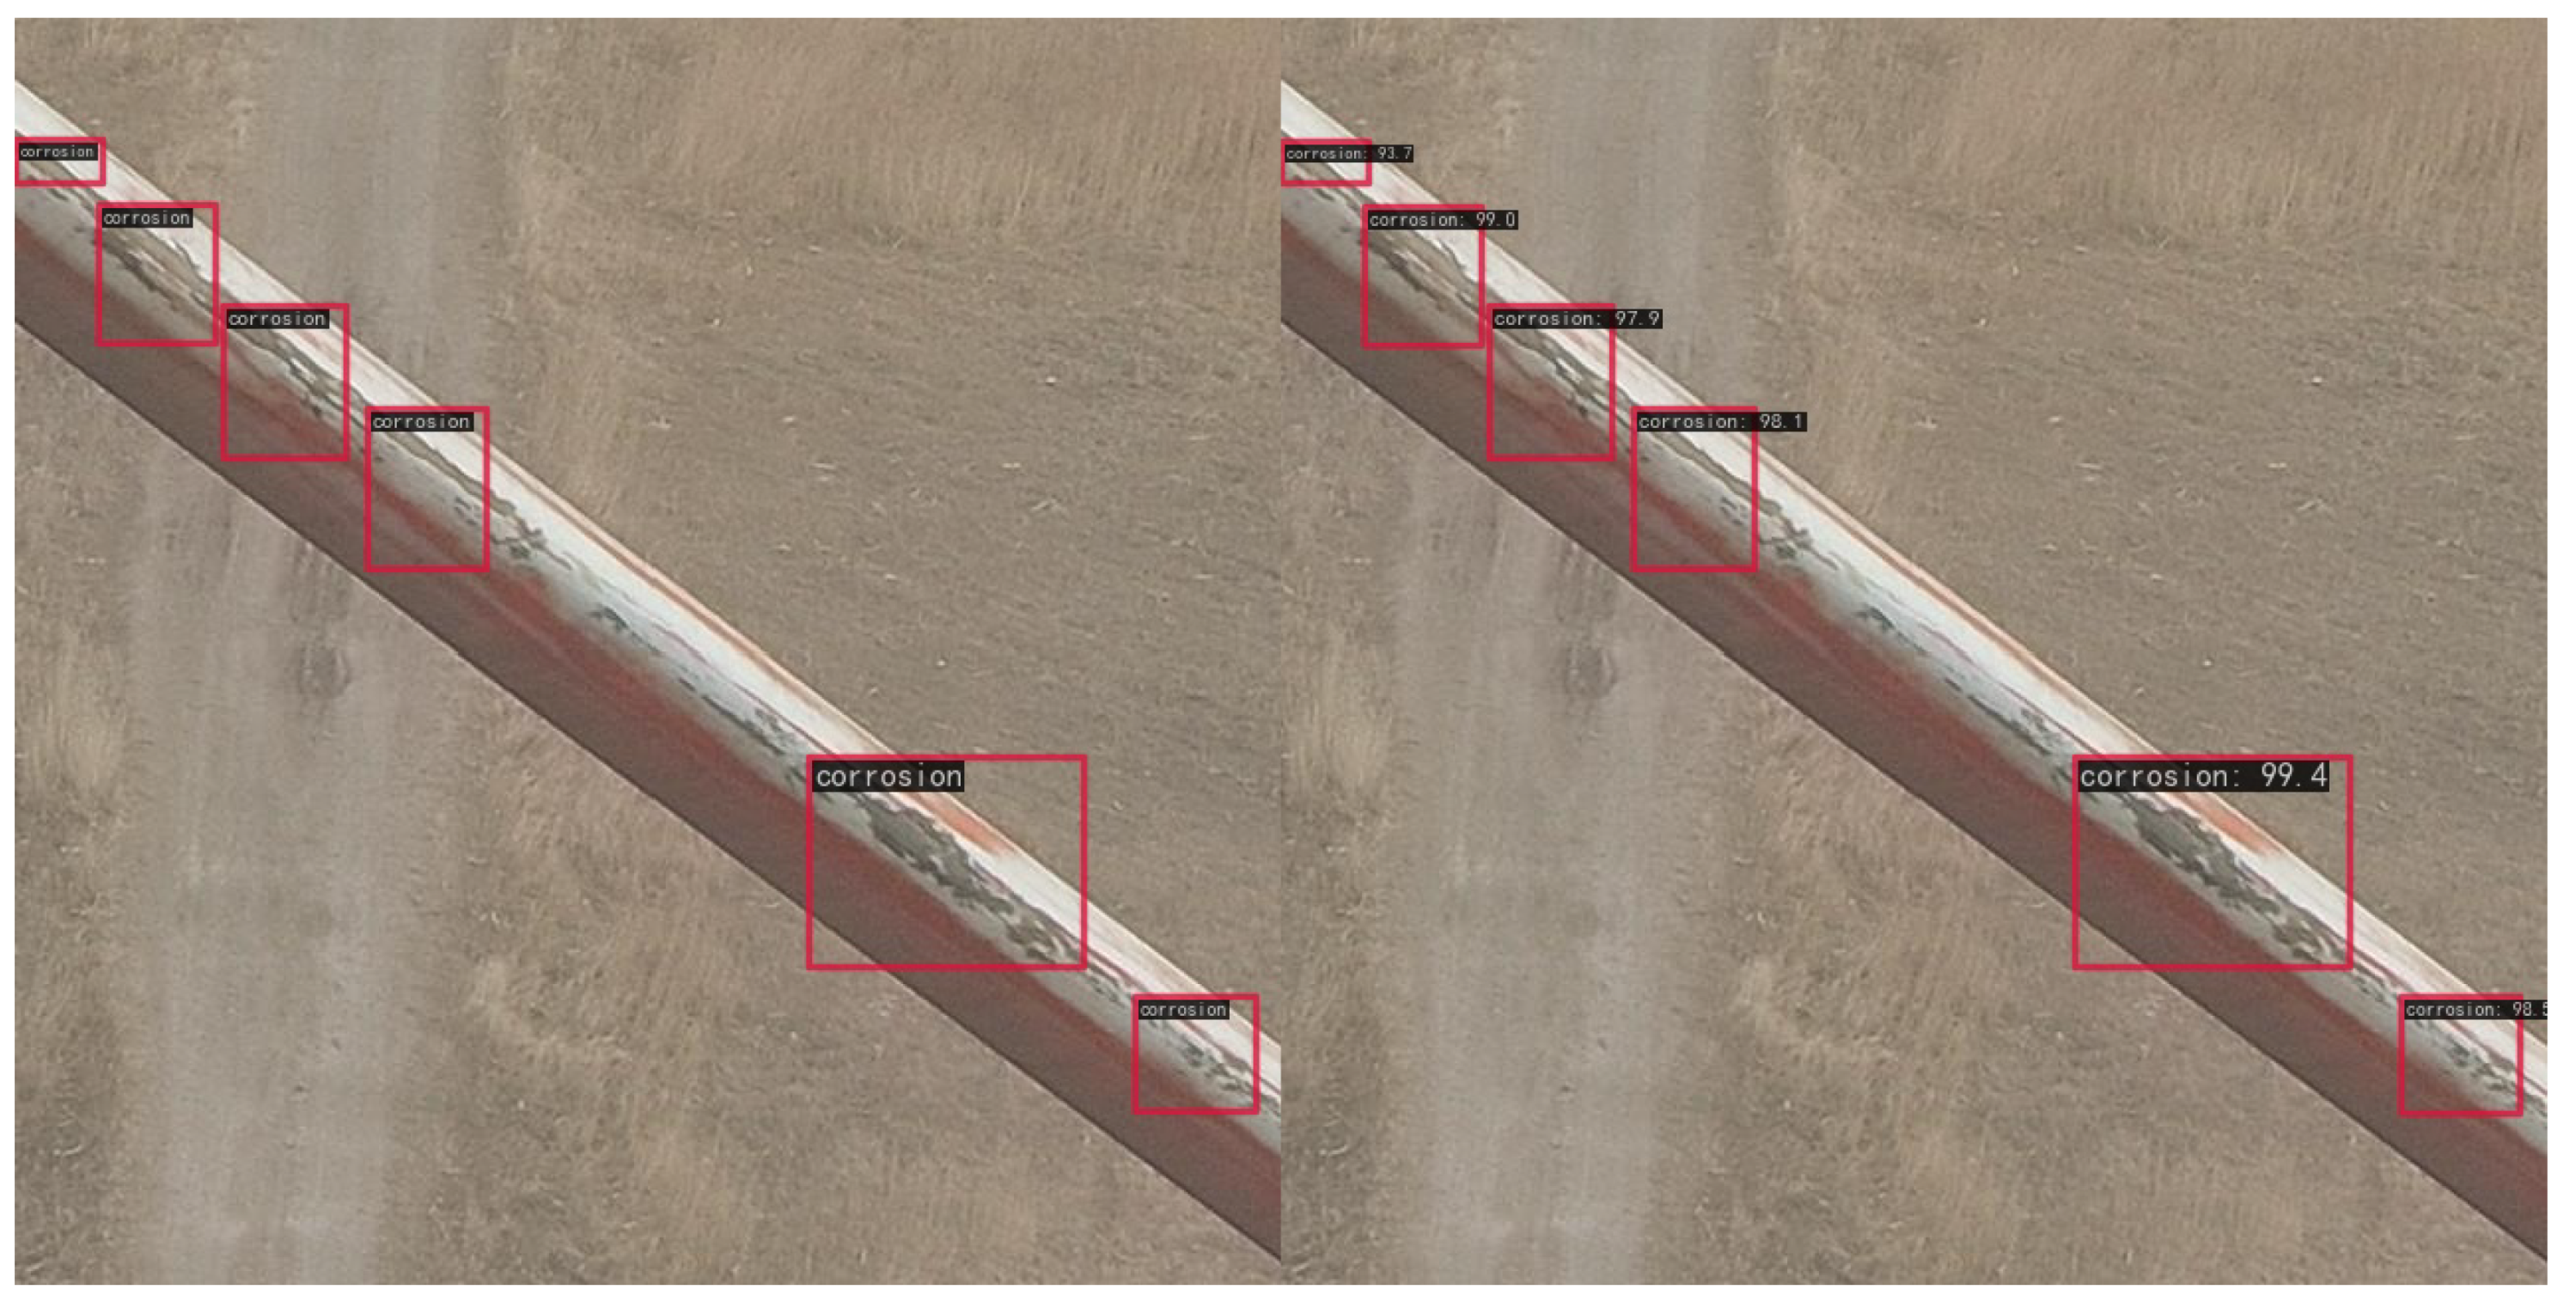
  • Corrosion: Corrosion of the metal surface is induced by factors such as salt spray and chemical pollution in humid environments, and it can diminish the strength and rigidity of the leading edge of the blades, reducing the overall structural integrity of the blades and potentially leading to fatigue failure.
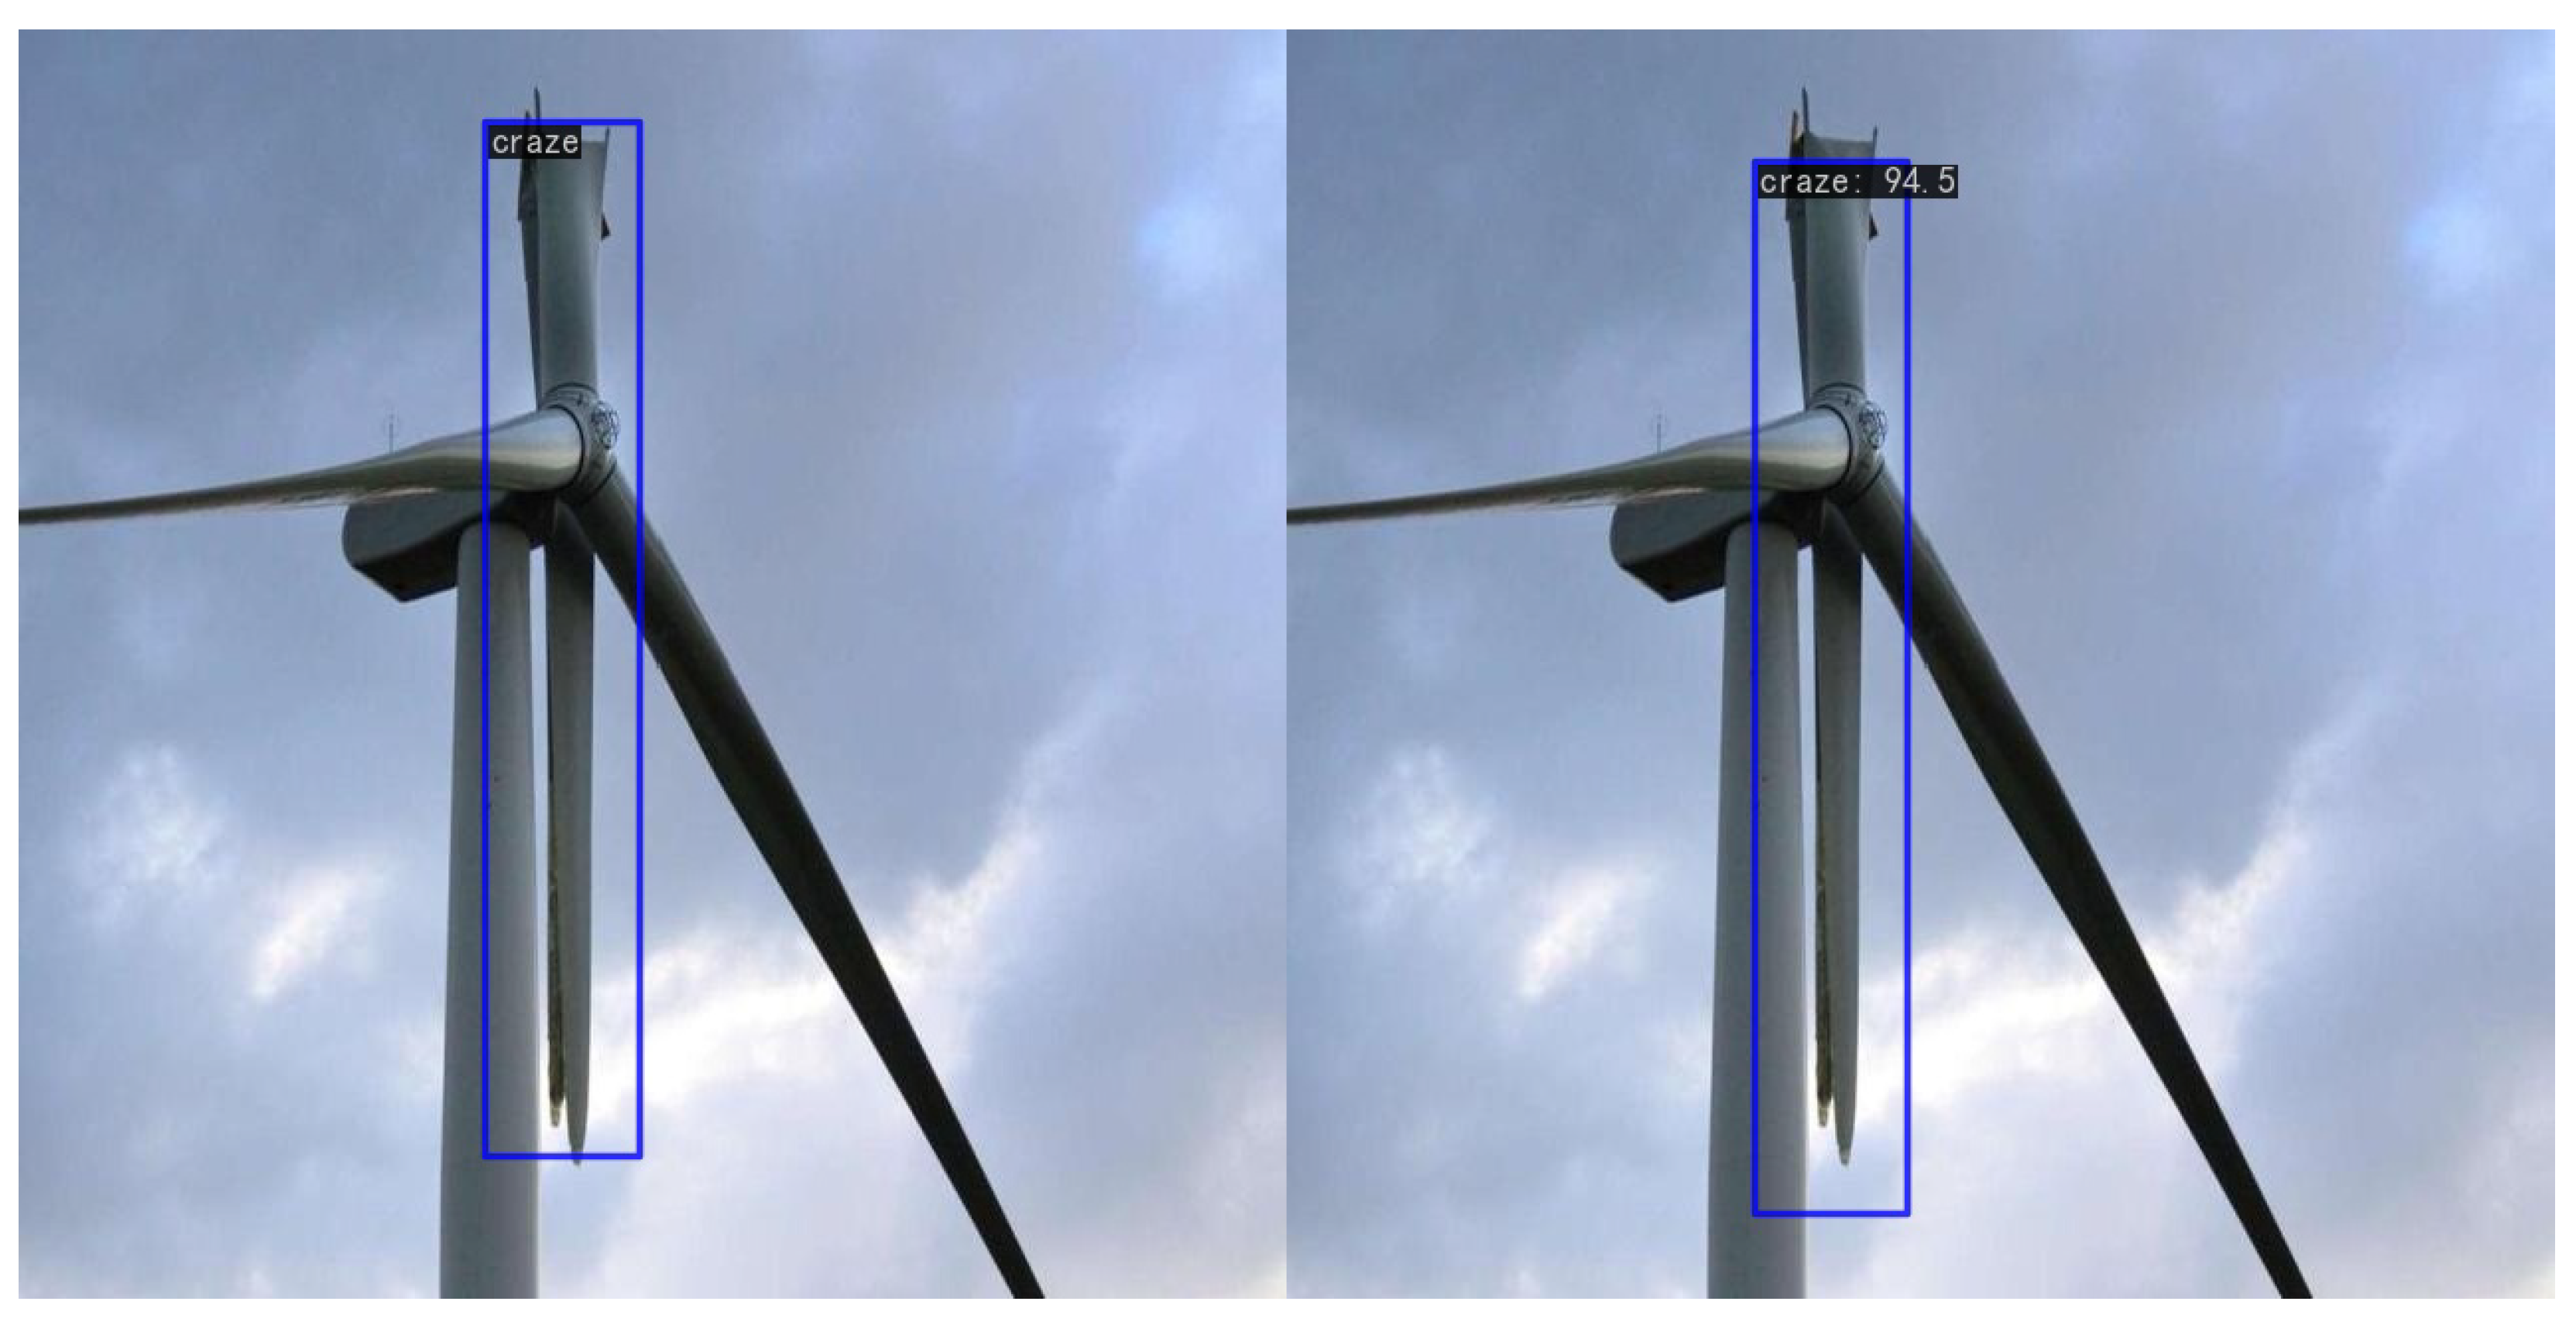
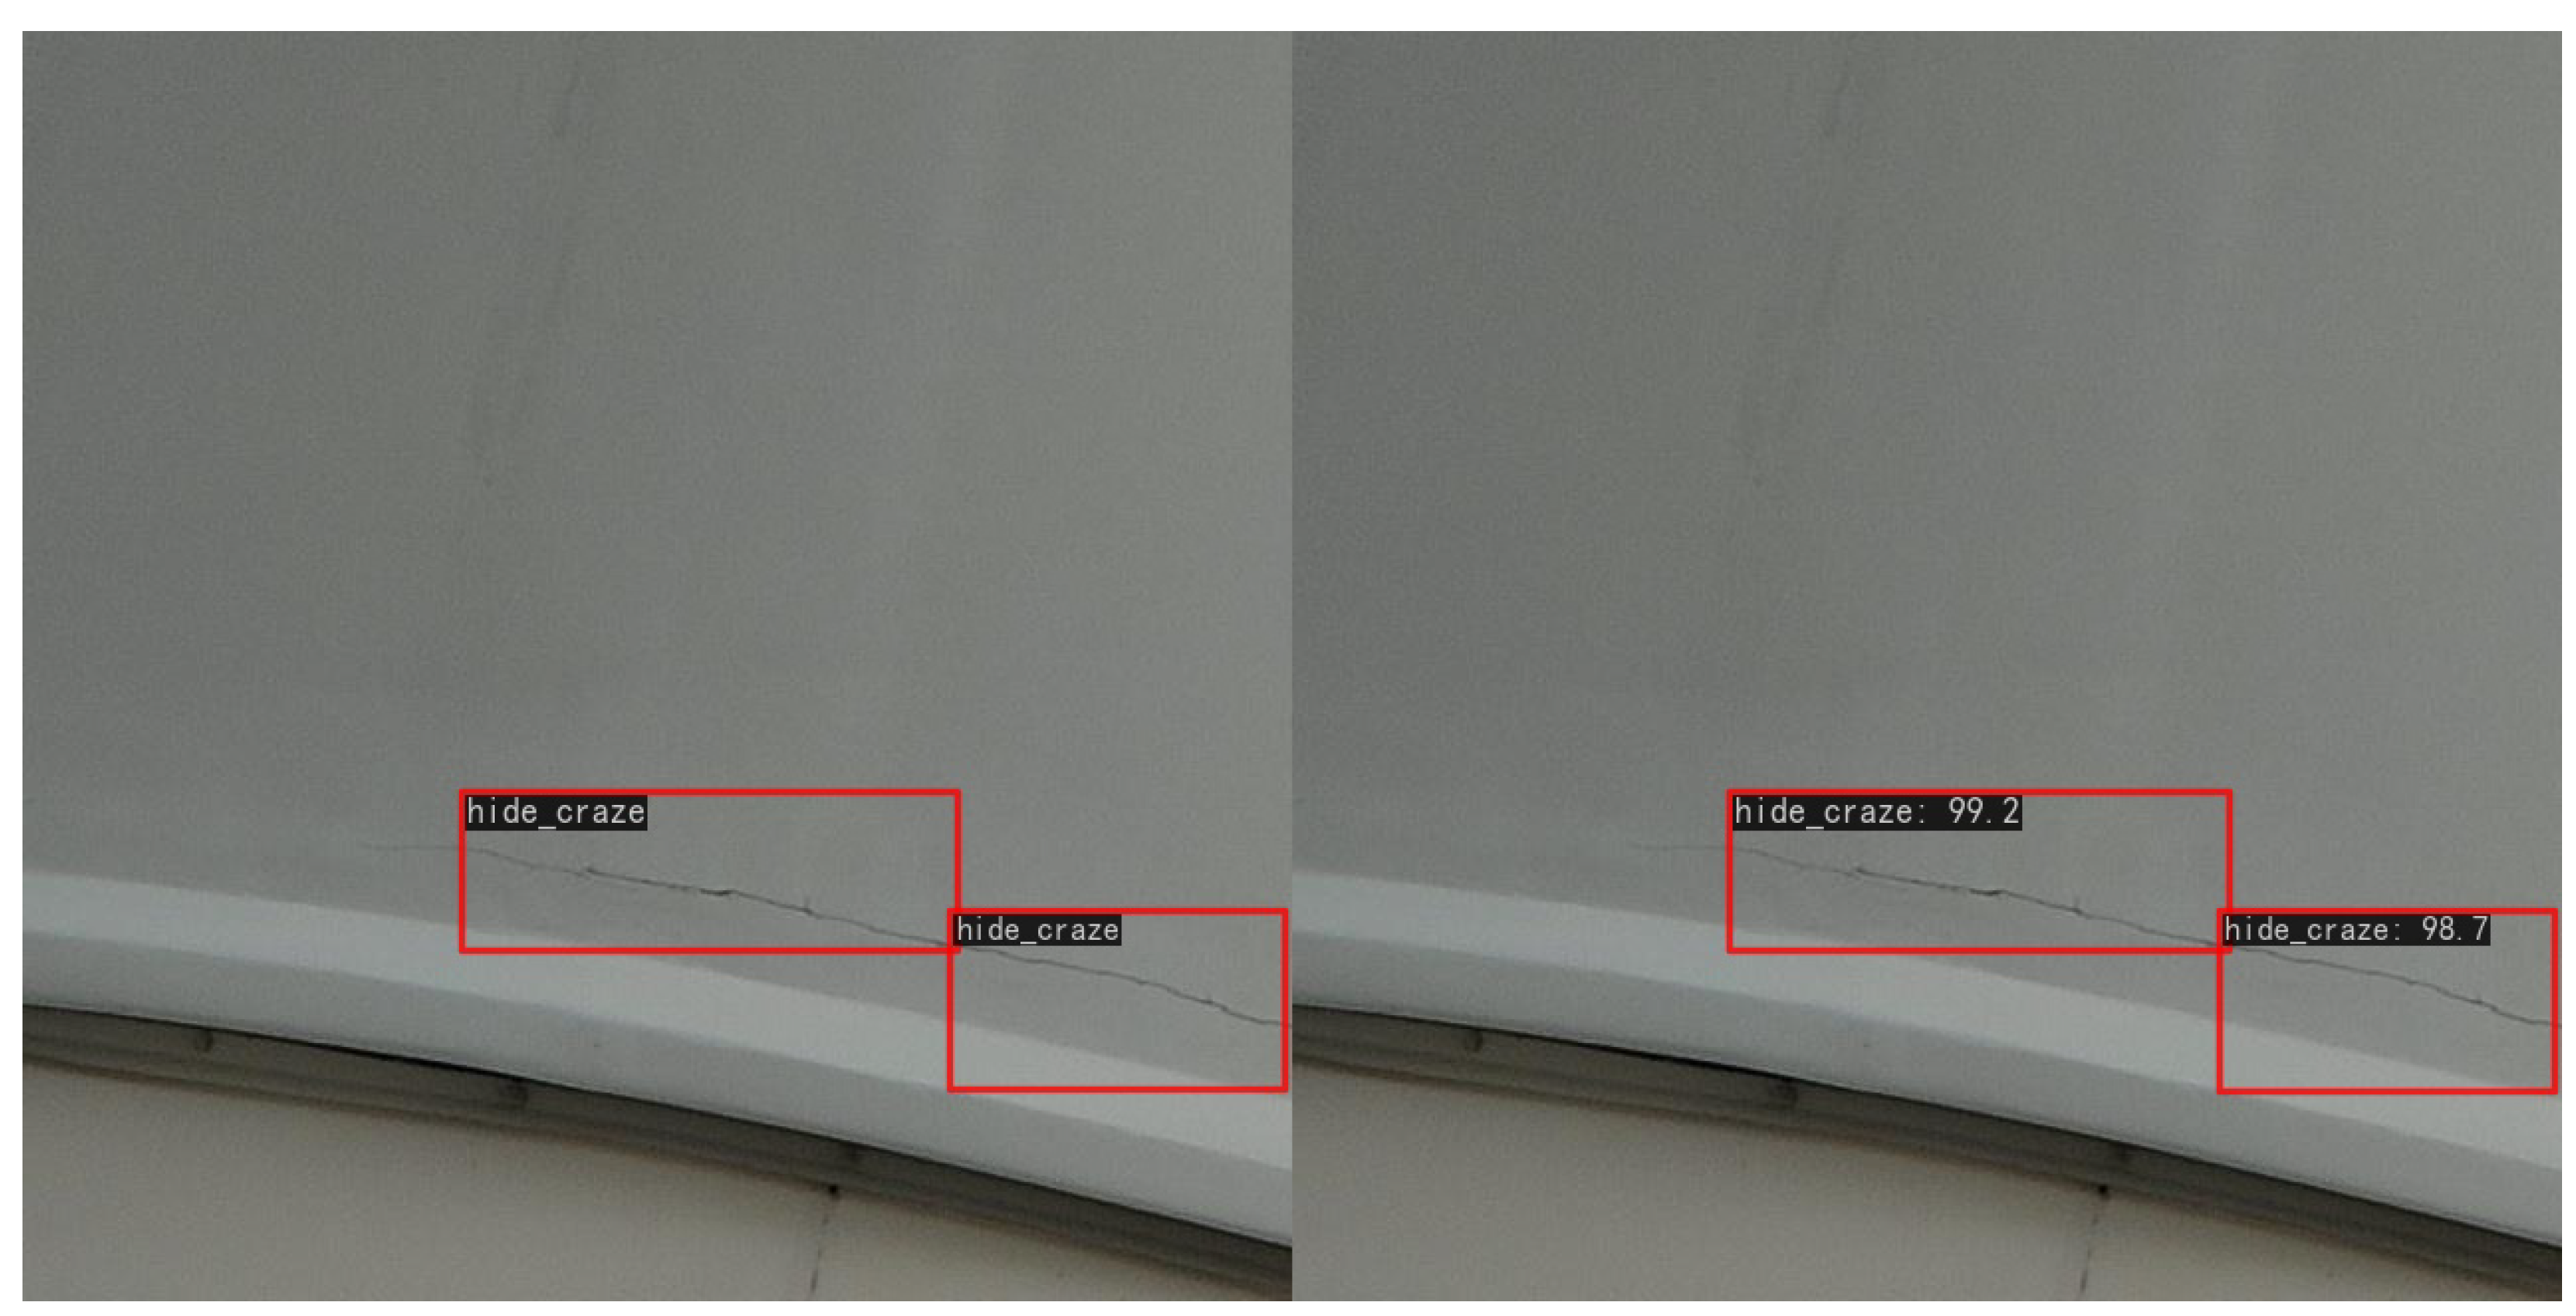
  • Hide crack: This results from thermal and mechanical stress caused by external temperature and humidity variations. These cracks may gradually propagate internally, causing damage to the blade structure and consequently impacting the safe operation of the wind turbine.
  • Lightning strike: When a wind turbine generator is struck by lightning, it generates high-temperature, high-energy arc discharges. Lightning strike marks may result in localized material damage and ablation, potentially affecting the strength and conductivity of the blades, particularly in severe cases.
  • Crack: The high-speed rotation of blades subjects them to significant forces and torques during prolonged operation, potentially leading to open cracks at the blade tips and even outright breakage.
The experimental dataset was derived from the wind turbine images collected by drones at the Jilin wind farm in China, with a total of 482 unlabeled 5184 × 3888 resolution images and 980 labeled 640 × 640 resolution images collected from the website. The 482 unlabeled images were first labeled using the Labelme tool because the model needs to be inputted with smaller images in order to be efficiently trained, and for large-resolution images, direct input will lead to insufficient memory or computational resources. At the same time, in order to maintain consistency with the resolution of the network acquisition data, the 482 labeled 5184 × 3888 resolution images were labeled at the same time slices, and after slicing, 2150 images with a resolution of 640 × 640 were generated. Because some loss and deviation were present in the sliced image labels, they were manually corrected and merged with the 980 labeled images collected from the network to obtain a total of 3130 labeled 640 × 640 resolution images for the wind turbine surface defect dataset.
For this dataset, a series of data augmentation techniques were applied to enhance the subsequent model training, allowing it to better comprehend and adapt to various changes in wind turbine surface defects, thereby improving detection accuracy. The augmentation processes included the following:
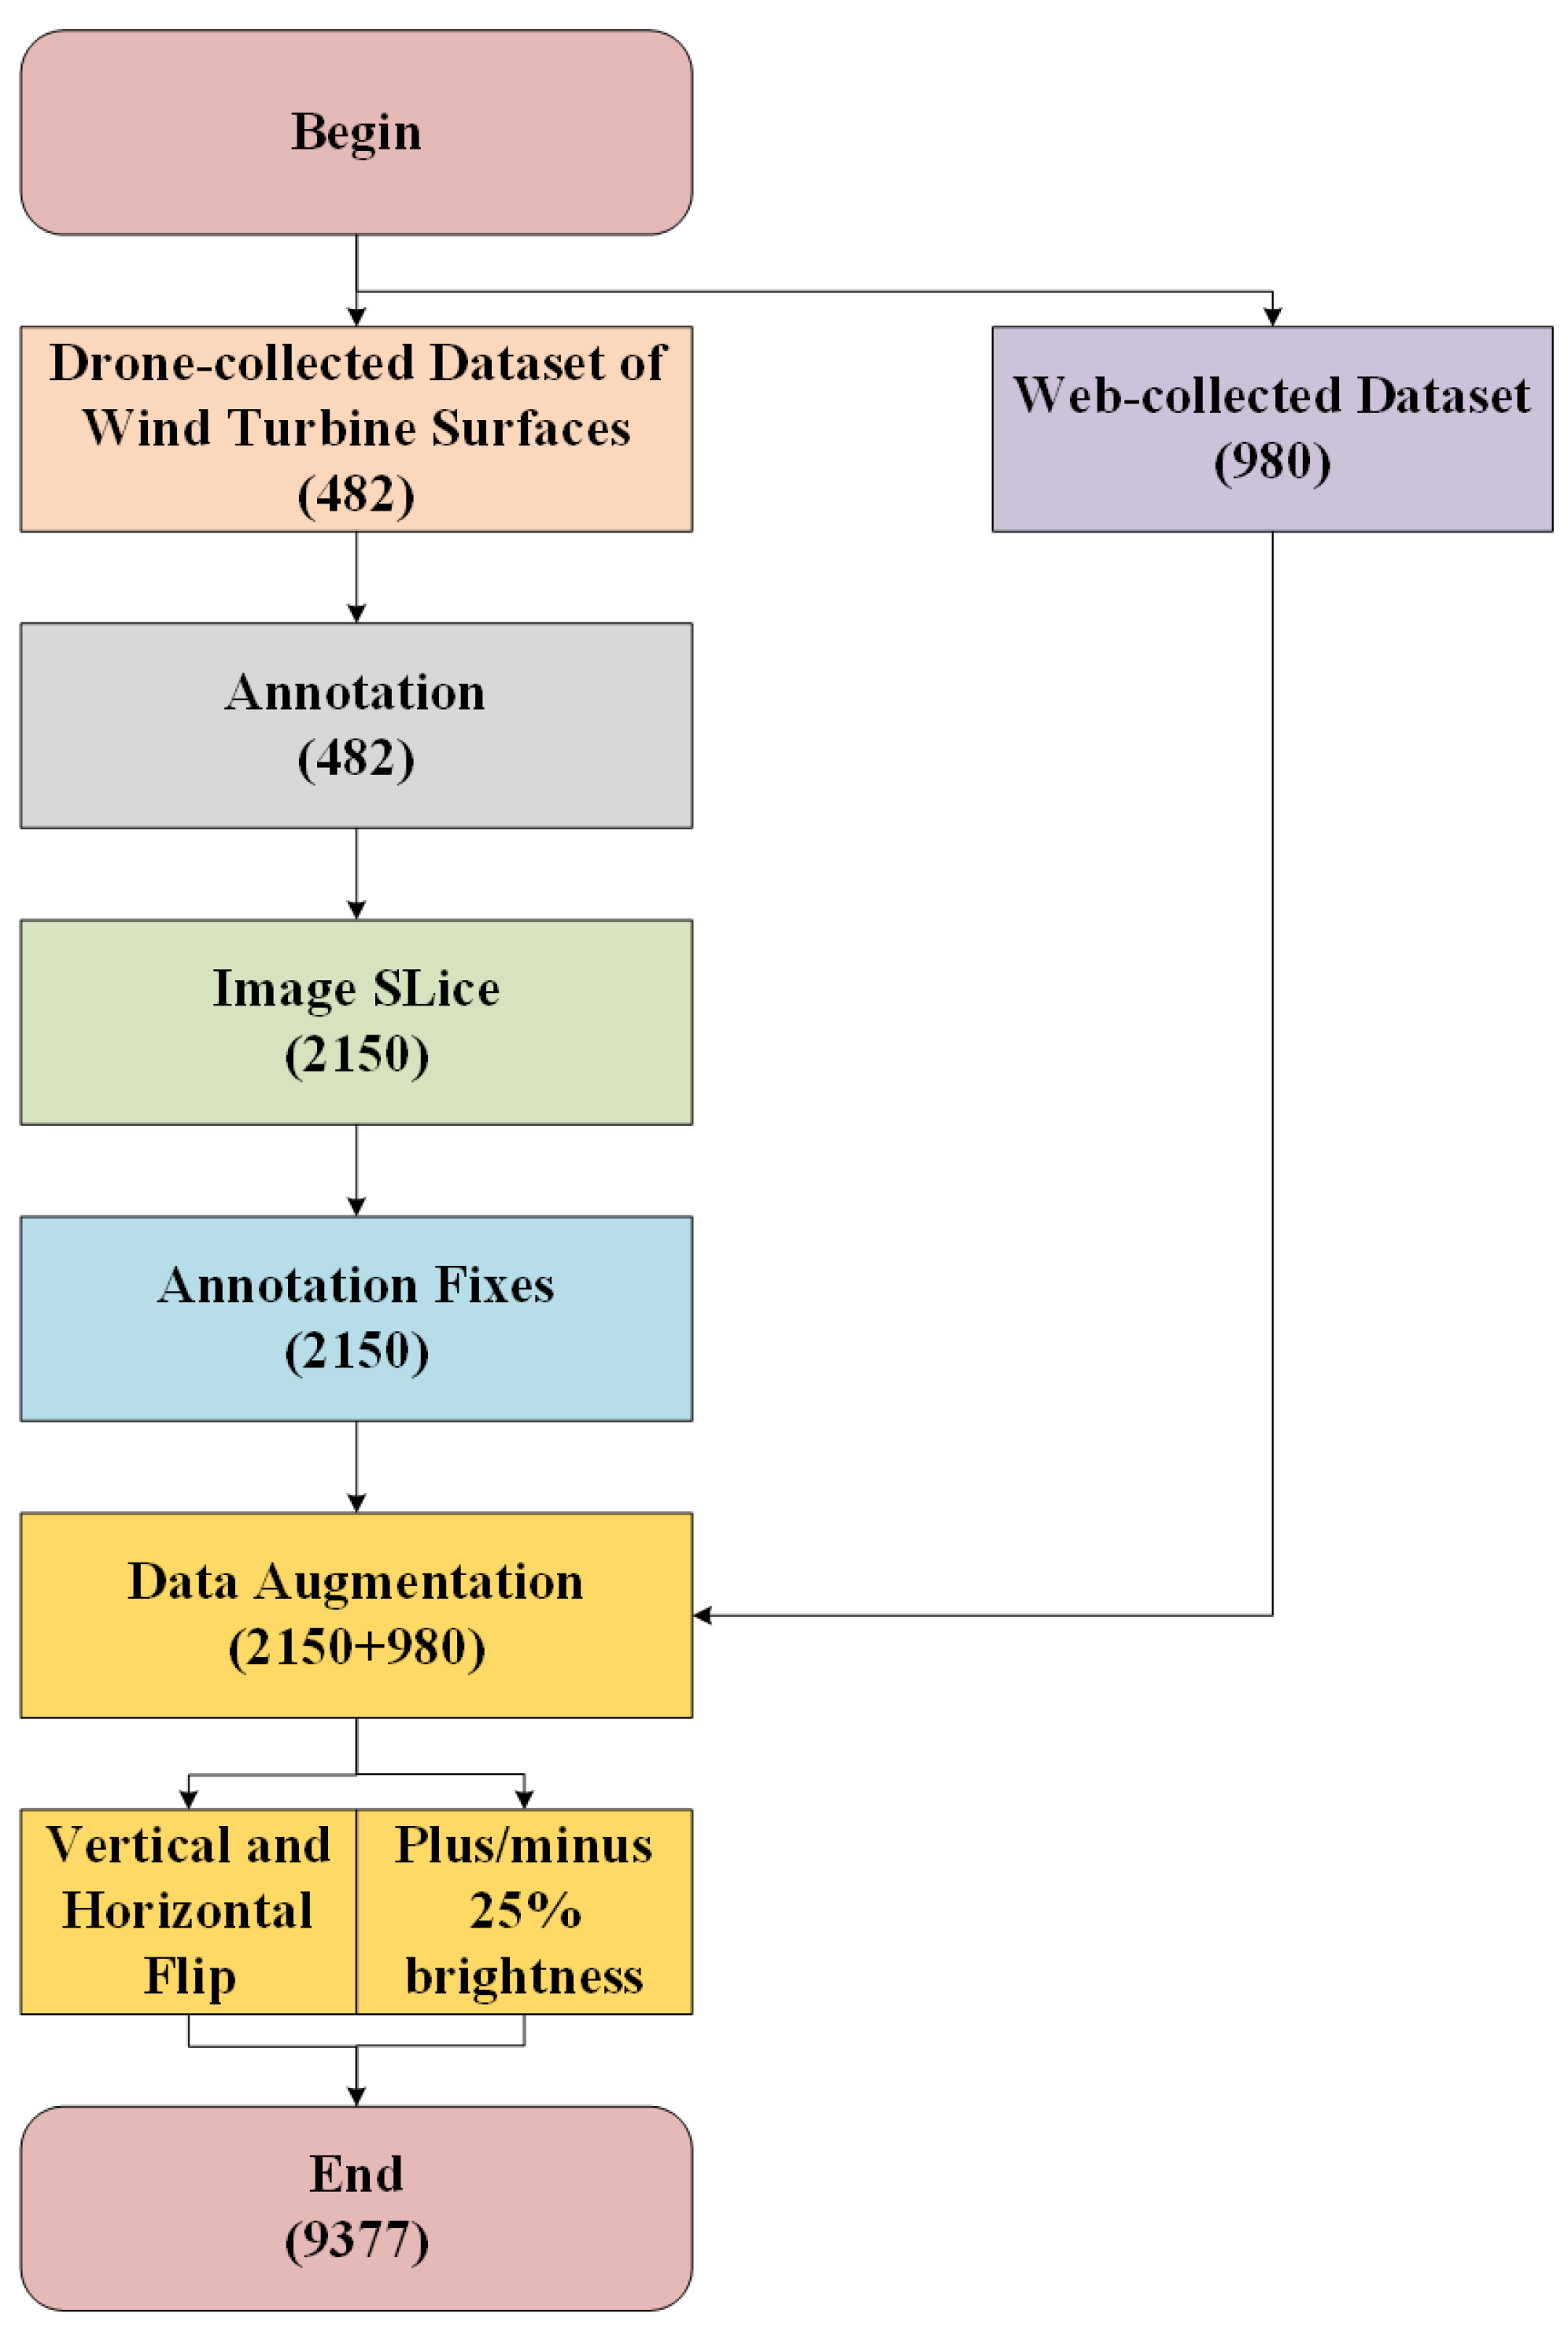
  • Vertical and horizontal flipping: Flipping operations were employed to introduce mirror symmetry transformations, simulating different perspectives and angles that may occur during the actual operation of wind turbines. This aids the model in learning the shape features of defects in both the horizontal and vertical directions, enhancing its ability to recognize symmetric defects.
  • Adding or reducing brightness by 25%: Brightness adjustments were applied, considering the significant impact of lighting conditions on wind turbine surfaces in real industrial scenarios. This expanded the dataset’s distribution in terms of illumination changes, facilitating the model’s adaptation to various lighting conditions in the images.
Thus far, we have constructed a wind turbine surface defect detection dataset containing 9377 images separated into seven categories. The complete construction process of the dataset is shown in Figure 1, and Figure 2 shows a sample image of each category of the dataset.
Figure 3 shows the number of different target sizes for each category of wind turbine surface defect, where the defects in each category show differentiated distributions for each size of the target. Surface oil was mainly concentrated on large targets, corrosion showed a relatively balanced distribution of medium and large targets, cracks and hide cracks had a more balanced distribution of targets of all sizes, surface eye was mainly concentrated on large targets, and surface injury and lightning strikes showed higher numbers for medium targets.

3. Improved Surface Defect Detection Algorithm for Wind Turbines Based on YOLOv5

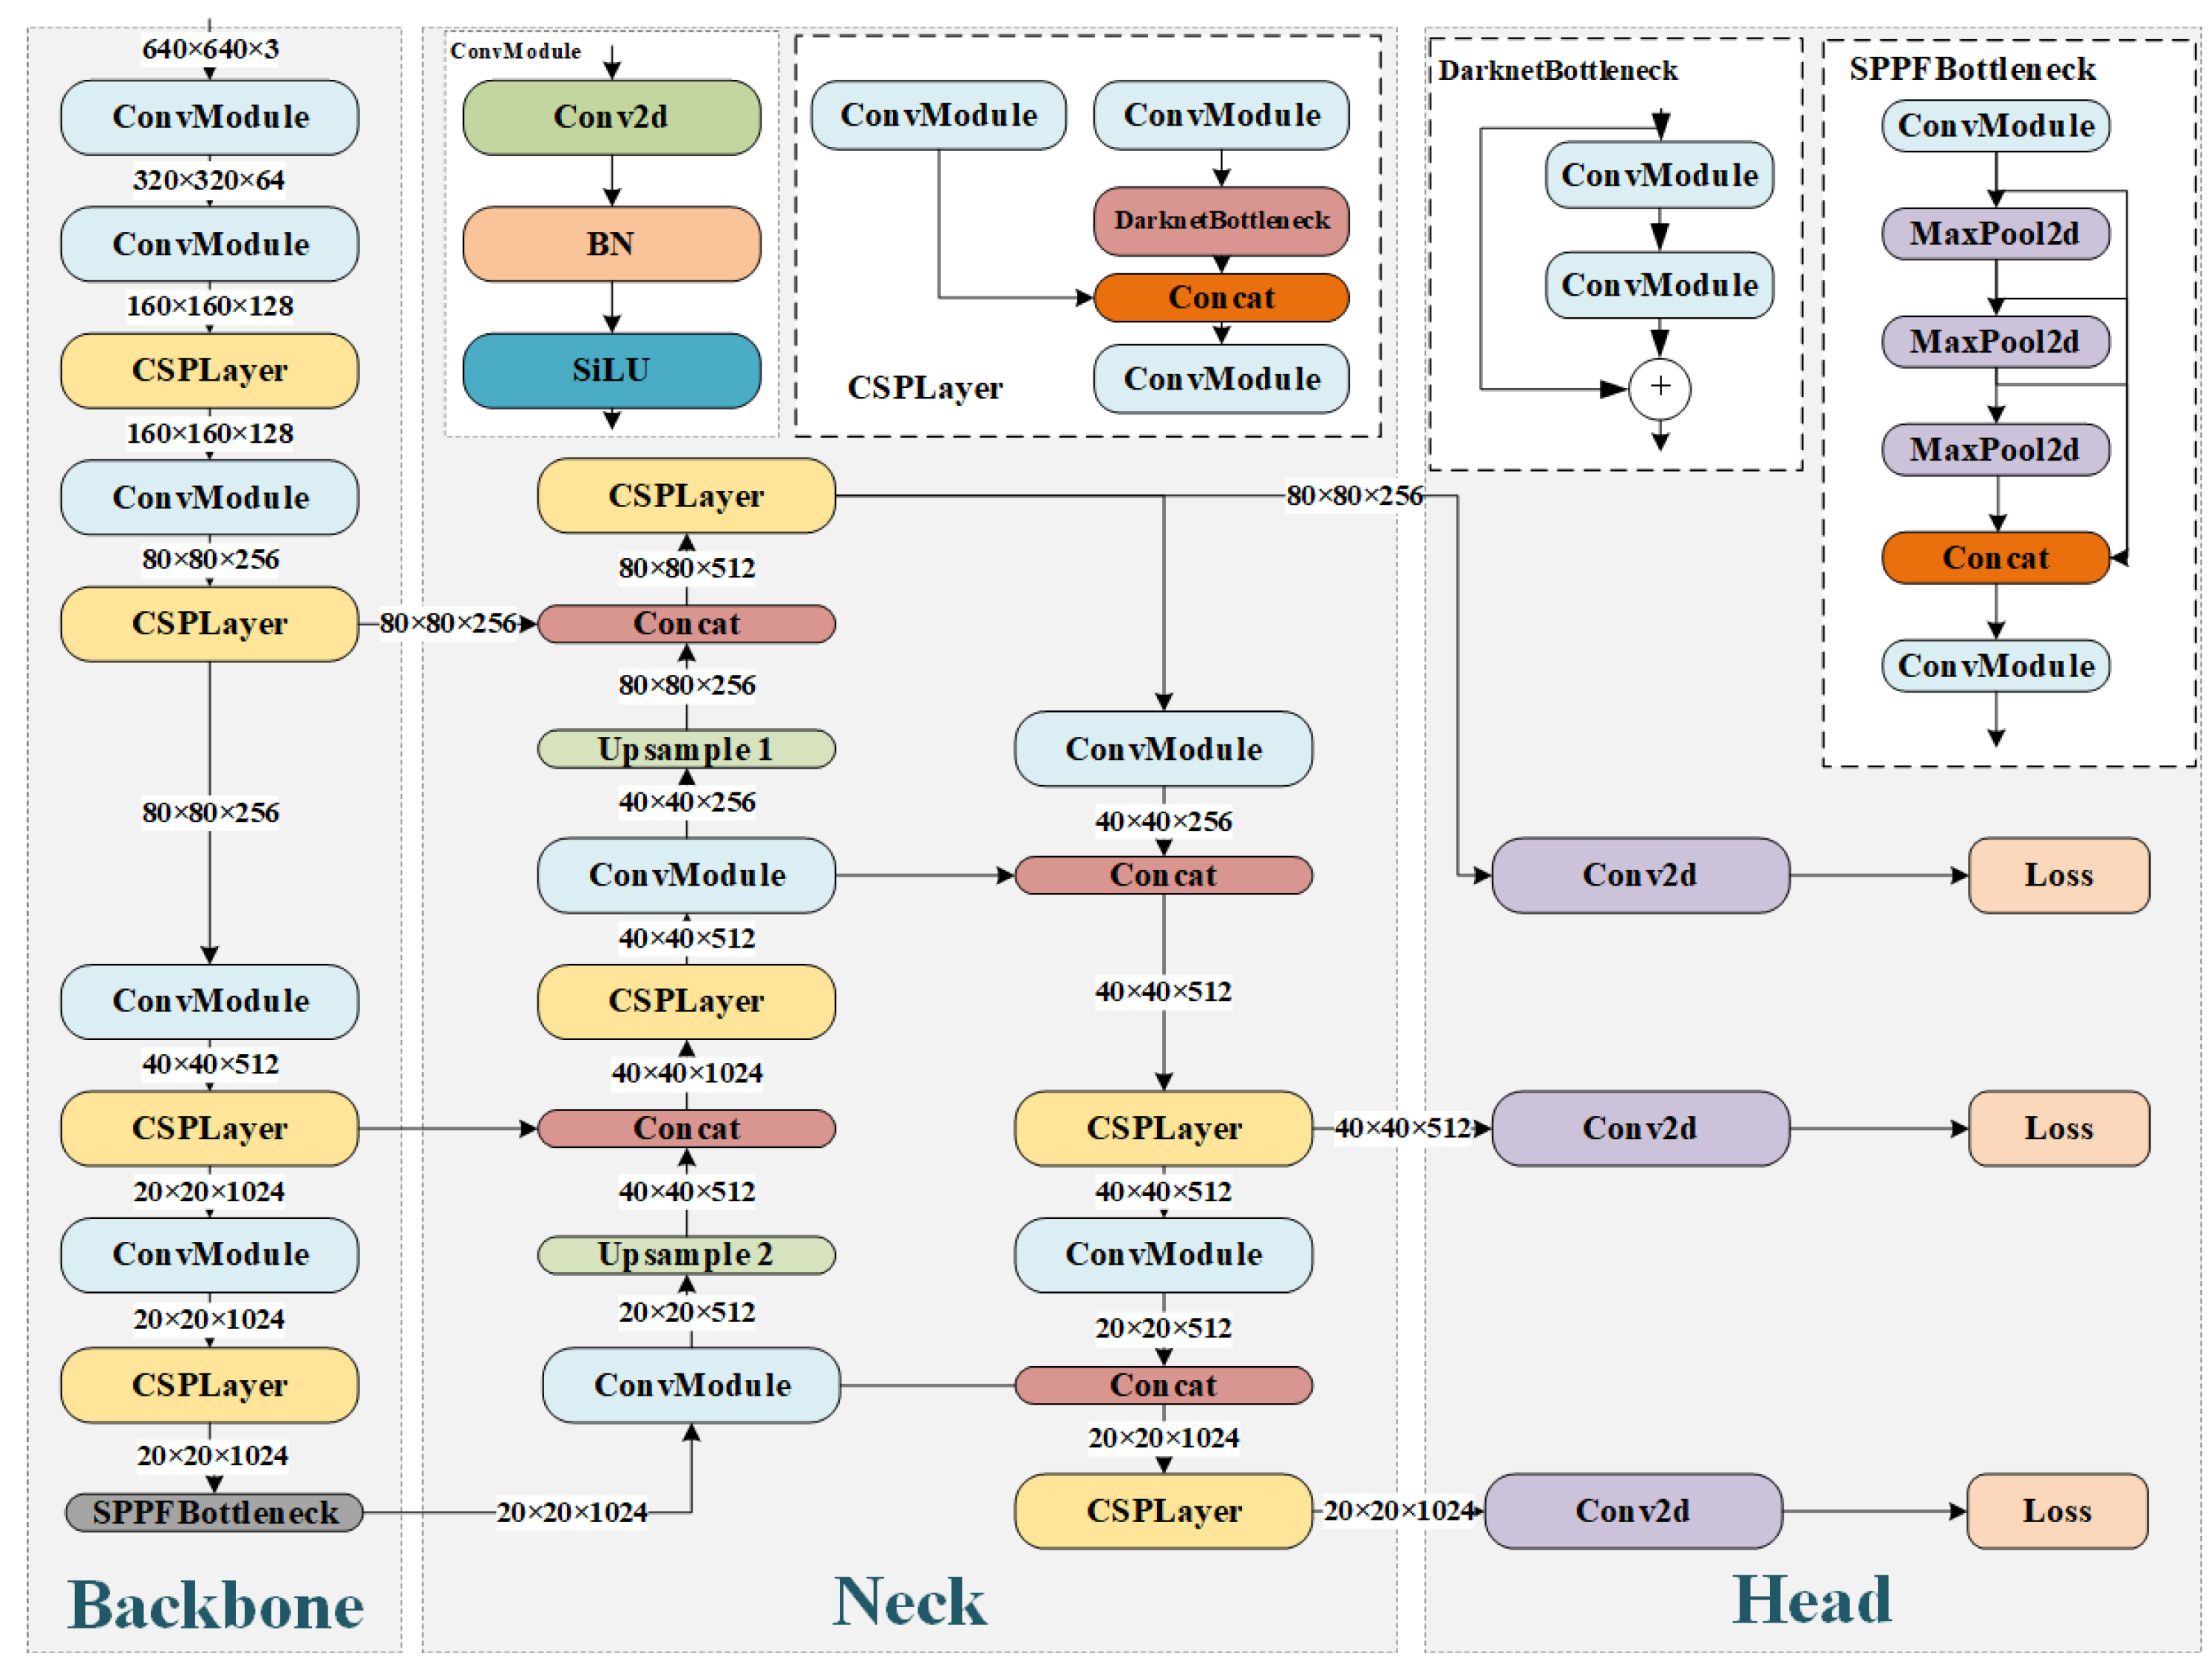
3.1. YOLOv5 Network Model

In YOLOv5, a powerful backbone plays a crucial role in the improvement of target detection performance. The backbone for YOLOv5 was chosen to be CSP-Darknet53 [32], an improved version of the deep convolutional network Darknet53 [33] that introduces a cross-stage partial (CSP) network strategy. This strategy improves the efficiency of feature information flow by partitioning the feature map into two parts and then introducing cross-stage partial connections between them. The use of CSP-Darknet53 makes YOLOv5’s backbone more powerful and capable of capturing the complex features in an image more efficiently, providing strong support for subsequent target detection tasks. The neck plays a key role in connecting the backbone and head in the target detection network, and its main task is to extract the feature pyramid so that the model can better adapt to targets of different sizes and scales. The neck part of YOLOv5 combines spatial pyramid pooling (SPP) [34] and a path aggregation network (PANet) [35]. SPP improves adaptation to scale changes by introducing a spatial pyramid pooling layer that enables the network to perceive features at different scales. PANet, on the other hand, effectively prompts information to propagate along the network path by introducing a path aggregation mechanism, enhancing the correlation of features at different layers and further improving the detection performance. Such a neck design enables YOLOv5 to have stronger feature extraction and integration capabilities when dealing with the target detection task. YOLOv5 adopts a non-decoupled head structure that fuses the classification and bbox detection tasks in the same convolution for processing, reducing the number of model parameters and improving the convergence speed of the network. In real-world industrial applications, this means higher training efficiency and a faster inference speed, which enable wind turbine surface defect detection to be applied to production practice more quickly. YOLOv5 adopts strategies such as mosaic and mixup in data augmentation, effectively improving the robustness and generalization ability of the model by comprehensively utilizing diverse data. This is of great significance when dealing with targets in complex real-world scenarios, such as in wind turbine surface defect detection. The overall network structure diagram of YOLOv5 is shown in Figure 4.

3.2. Improved Strategies of YOLOv5 for Surface Defect Detection

In this paper, YOLOv5 is applied to self-constructed multi-category wind turbine surface defect detection. In order to overcome the existing problems, we carried out a series of improvements for the whole algorithmic process of YOLOv5. The overall process is shown in Figure 5.
After the dataset was constructed, it was fed into the network for training. In the dataset of wind turbine surface defect detection, the diversity and complexity of the defects lead to large differences between different samples in the dataset. Training the model requires more data to improve the generalization performance. However, directly increasing the size of the original dataset will lead to a long data loading time and affect the training efficiency. Therefore, the RepeatDataset strategy was used to enlarge the dataset, where the original dataset was repeated many times. In this way, each epoch of the network during training would traverse the entire repetitive dataset, solving the problem of a small dataset size to a certain extent and improving the training efficiency.
For the YOLOv5 algorithm, a two-stage progressive training strategy was first designed to divide the training process into two independent processes to better guide the model to learn the features of the surface defects of complex wind turbines, and a multi-scale copy-paste data enhancement algorithm which was also designed by us was introduced in the first training stage to expand the targets at different scales. The original static label assignment strategy was replaced with the designed dynamic label assignment strategy based on the Hungarian algorithm, achieving more intelligent and precise label assignment by optimizing the target assignment problem, thus enabling the model to better focus on the key targets during the training process and improving the detection accuracy and generalization performance. In addition, the multi-scene negative sample learning strategy was introduced in the training, which guided the model to learn negative samples by adding unlabeled multi-scene background images, and finally, the slicing-aided hyper inference algorithm was selected for the original unsliced image for inference prediction, playing a key role in the whole process and ensuring the ability to efficiently detect large images in real industrial scenarios.

3.2.1. Multi-Scale Copy-Paste Algorithm

The traditional copy-paste method has been widely used in the field of object segmentation. Its main steps involve randomly selecting two images, performing random horizontal flipping, and then selecting a portion of the target from one image to copy and paste it onto another image. However, this method has several limitations.
Firstly, traditional copy-paste relies on pre-annotated mask labels, limiting its applicability due to the constraints of annotation quality and accuracy. The occurrence of occlusion after copying and pasting may lead to confusion between the pasted target and the original target, making it difficult for the model to distinguish them accurately and reducing the quality of generated data. Secondly, the traditional method does not consider the scale changes of the pasted targets, resulting in a uniform scale for pasted targets that may not meet the scale requirements of diverse targets in real-world scenarios. Particularly in our constructed multi-type wind turbine surface defect dataset, different categories of targets exhibit significant scale differences which traditional copy-paste fails to address effectively, limiting the model’s generalization ability.
We propose an improved multi-scale copy-paste method for wind turbine surface defect detection that eliminates the need for mask labels and directly pastes targets into the corresponding images. Simultaneously, it considers the scale changes of the pasted targets by introducing a new parameter, scale_range, to define the scale factor. This random scaling of the target boxes allows the model to adapt to targets of different scales, thereby enhancing its robustness.
Let the size of image I be H × W and the original set of bounding boxes be B = b i i = 1 N , where each bounding box b i is represented by the upper-left coordinate ( x 1 i , y 1 i ) and the lower-right coordinate ( x 2 i , y 2 i ) (i.e., b i = ( x 1 i , y 1 i , x 2 i , y 2 i ) ). The multi-scale copy-paste algorithm proceeds as follows.
First, we introduce the scale factor s as shown in Equation (1):
s ( s c a l e _ r a n g e [ 0 ] , s c a l e _ r a n g e [ 1 ] )
The original target box is scaled using the scale factor, and the resulting scaled bounding box is given by Equation (2):
b s c a l e , i = ( x 1 i , y 1 i , x 2 i , y 2 i )
where the scaled coordinates are given by Equation (3):
x 1 i = x 1 i y 1 i = y 1 i x 2 i = x 1 i + x 2 i x 1 i · s y 2 i = y 1 i + y 2 i y 1 i · s
After flipping, the coordinates of the bounding box are given by Equation (4):
b s c a l e , f l i p , i = W x 2 i , y 1 i , W x 1 i , y 2 i
The equation for calculating the intersection over area (IoA) matrix is given by Equation (5), where area represents the area calculation and b j denotes the bounding box of the region where the pasted object is located:
IoA = area b s c a l e , f l i p , i b j area b j i , j = 1 N
Subsequently, based on the IoA matrix and the IoA threshold (ioa_thresh), the set of valid target indices is filtered out as shown in Equation (6):
I valid = { i all ( IoA [ i , : ] < ioa _ thresh ) }
Next, n indexes from a are randomly selected, where n is given by Equation (7):
n = min round prob · I valid , I valid
For each selected index i, the flipped target box is copied to the target image J, and the target box set B is updated. Subsequently, boundary processing is performed on all target box coordinates to ensure that the target box is completely within the image (i.e., ensuring that the coordinates satisfy 0 x 1 i , x 2 i W and 0 y 1 i , y 2 i H ). Additionally, unreasonable target boxes are removed (i.e., x 2 i x 1 i or y 2 i y 1 i ). Finally, the image with augmented target boxes is returned, concluding the multi-scale copy-paste algorithm.
The application results of the multi-scale copy-paste data augmentation algorithm are shown in Figure 6, where the red arrow points to the pasted multi-scale target. This method allows for the direct replication and pasting of targets between images without the need for pre-annotated masks. When observing the results in the figure, it is evident that the target was successfully copied and pasted into another image after multi-scale copy-paste processing, displaying diversity in scale.
This algorithm not only achieved effective transfer of targets but also precise adjustments in scale. Consequently, it enlarged the exposure rate of the targets and increased the quantity of multi-scale targets. By introducing diverse scale variations, this method injected more realistically rich scenes into the training set, enhancing the model’s perception and recognition capabilities for targets of different sizes. This feature proves particularly prominent when dealing with scenarios where scale differences exist, such as the wind turbine surface defect dataset.
The algorithm that we proposed was designed based on the mmdection framework, aiming to provide an efficient and flexible data augmentation solution that can be easily integrated into the training pipeline of various object detection algorithms. It achieved a plug-and-play design for practical use.

3.2.2. Dynamic Label Assignment Strategy Based on the Hungarian Algorithm

One of the most critical issues in the training process of object detection models is the positive and negative sample matching strategy, also known as the label matching strategy. A better label matching strategy often enables the network to better learn object features, thereby improving detection capabilities.
Early sample label matching strategies were usually based on prior rules of spatial and scale information to determine sample selection. YOLOv5 employs a static label matching strategy as shown in Figure 7. The matching process for positive and negative samples initially filters the samples based on their aspect ratios. Subsequently, positive samples are selected based on the position information, choosing the grid where the center of the ground truth (GT) is located with its two adjacent grids as positive samples. Here, a grid refers to the division of the image into small squares that form a grid structure. Specifically, if the aspect ratio of the anchor and GT box falls within the specified threshold (set to 4.0), then it is considered a successful match. This means that as long as the width and height of the GT box are between 0.25 times and 4.0 times the width and height of a certain anchor, it is considered a positive sample. In the case of a successful match, the grid containing the center of the GT box is divided into four quadrants. Even if the center of the GT box falls into the lower-left quadrant, the left and bottom two grids are still considered positive samples.
The above method belongs to a static matching strategy based on empirical rules, meaning that the sample selection is constrained by manually defined rules. This static matching approach may lack flexibility when dealing with complex and dynamic real-world scenarios, making it ineffective in addressing the diversity and scale variations of targets. Therefore, a dynamic label assignment strategy based on the Hungarian algorithm is proposed, as shown in Algorithm 1.
Algorithm 1: Hungarian Dynamic Label Assignment Algorithm.
Input:
  • The cost matrix C, where C i j denotes the cost of matching the ith predicted bounding box with the jth true target bounding box;
Output:
  • The optimal matching matrix M, where M i j = 1 indicates a successful match between the ith predicted bounding box and the jth ground truth bounding box, and M i j = 0 indicates no match;
1:
Normalize rows and columns of C to ensure that there is at least one zero element in each row and column;
2:
Find zero elements in C and mark them as unmatched;
3:
If an unmatched zero element is found, then mark it as matched, and mark the other zero elements in its row and column as matched;
4:
Repeat step 3 until no more unmatched zeros can be found;
5:
If the number of unmatched rows or columns is less than the total number of rows or columns, then proceed to step 6; otherwise, go to step 7;
6:
Find the smallest value in unmatched rows and matched columns, then subtract it from all unmatched elements and go to step 4;
7:
Restore all the matched rows and columns, and keep the matched rows and columns;
8:
return optimal matching matrix M;
The calculation of the cost matrix C is based on different loss functions, where three have been defined: classification loss, regression loss, and IoU loss. The final matching cost is obtained by weighting these three losses, as shown in Equation (8):
C = FocalLoss × weight FocalLoss + BBoxL 1 Loss × weight BBoxL 1 Loss + IoULoss × weight IoULoss
The classification loss is computed using the focal loss [36] as shown in Equation (9), where c l s _ p r e d represents the target class scores predicted by the model, g t _ l a b e l s is the true class labels of the targets, N is the number of predictions, α is a scaling factor, γ controls the shape of the loss curve, and δ g t _ l a b e l s i is the Kronecker delta function, which is one if g t _ l a b e l s i is equal to the predicted class and zero otherwise:
FocalLoss c l s _ p r e d , g t _ l a b e l s = i = 1 N α 1 c l s _ p r e d i γ log c l s _ p r e d i · ( δ g t _ l a b e l s i c l s _ p r e d i )
The regression L1 loss, which measures the average absolute error between the predicted bounding box and the true bounding box, is computed using BBoxL1Cost. This is shown in Equation (10), where p r e d _ b b o x e s represents the bounding box coordinates predicted by the model and g t _ b b o x e s represents the coordinates of the true target bounding box:
BBoxL 1 Loss ( p r e d _ b b o x e s , g t _ b b o x e s ) = 1 N i = 1 N p r e d _ b b o x e s i g t _ b b o x e s i
The regression IoU loss is calculated using the generalized IoU (GIoU) [37], which considers the calculation of the IoU and the concept of the minimum enclosing rectangle. By manipulating the relationship between the IoU and the minimum enclosing rectangle, the GIoU loss provides a more comprehensive bounding box matching loss, as shown in Equation (11):
GIoULoss = 1 GIoU
The calculation of the GIoU utilizes the generalized IoU function, as shown in Equations (12)–(14). In these equations, the IoU represents the overlap (intersection over union) between the predicted bounding box and the ground truth bounding box, while enclosure measures the difference between the area of the minimum enclosing rectangle and the union area, quantifying the proportion of the minimum enclosing rectangles of two bounding boxes to their union:
GIoU = IoU e n c l o s u r e IoU
IoU = Intersection Area Union Area
enclosure = Smallest Enclosing Box Area Union Area Smallest Enclosing Box Area
The obtained matching matrix M is used to associate each predicted bounding box with its corresponding ground truth target, determining its associated ground truth category. Then, the loss is calculated. The dynamic label matching strategy based on the Hungarian algorithm design allows for personalized loss calculation for each predicted target, and it is able to adaptively adjust the target associations during the training process. Compared with traditional fixed matching methods, this dynamic loss calculation aligns better with the diversity of targets in real-world scenarios, contributing to improved modeling capabilities for complex target structures.

3.2.3. Two-Stage Progressive Training

The use of strong data augmentation strategies such as mosaic and copy-paste can enhance the model’s ability to learn from diverse data to some extent. However, they also pose potential issues that may result in the generated training images deviating from the natural distribution of real-world images in the feature space. This deviation may introduce samples that do not adhere to the statistical characteristics of real-world scenarios, thereby challenging the model’s generalization performance. In practical applications, such deviation may lead to unpredictable behavior in real-world scenarios due to significant differences between the training samples and the actual application environment.
To address this concern, we designed a two-stage progressive training strategy where the model training is divided into two stages, with each employing different data augmentation strategies, as illustrated in Figure 8. Taking the example of training the model for 100 epochs, we designed two training pipelines with the following data augmentation methods:
  • Mosaic: This augmentation strategy involves randomly selecting four different images and merging them into a new image at a certain ratio, creating a mosaic effect for enhanced training.
  • Letterbox: This technique fills the image edges with a gray background and scales the image to a specified size, preventing deformation caused by scaling.
  • Augment HSV: This technique generates new training samples by adjusting the image’s hue, saturation, and value, enhancing the model’s robustness to changes in lighting and color.
  • Random flip: This techniques randomly flips the image horizontally or vertically to increase data diversity.
For the first 90 epochs, the adopted strategies included mosaic, the proposed multi-scale copy-paste, augment HSV, and random flip. The goal was to enhance the model’s expressive power by introducing rich spatial, scale, and color variations, thereby improving its accuracy in complex scenarios. In the subsequent 10 epochs, the training entered a new phase, transitioning to weaker data augmentation strategies. In this stage, letterbox, augment HSV, and random flip, which are relatively gentle augmentation techniques, were retained. However, mosaic and multi-scale copy-paste, two strong data augmentation methods, were discarded. This progressive training strategy helps the model converge more naturally by gradually reducing the augmentation intensity, enabling the model to focus progressively on real-world features. This prevents both overfitting to noise and the complexity introduced by strong data augmentation strategies, ultimately enhancing the model’s generalization performance.

3.2.4. Multi-Scenario Negative Sample-Guided Learning

In real-world scenarios for wind turbine surface defect detection, a challenge arises in the detection task when high-resolution, unsliced images are collected by unmanned aerial vehicles (UAVs). During the training phase, small sliced images are used to accelerate the model training speed and improve efficiency. The difference in training data often results in the training set lacking background images, while actual application scenarios with large images may cover diverse scenes and complex background information.
Trained models may encounter difficulties when facing large images in real-world scenarios as they have not been trained on background information, which can lead to misidentifications in situations with significant background variations, thereby affecting the accurate detection of wind turbine surface defects.
To address these issues, we propose a strategy called multi-scenario negative sample-guided learning. Negative samples refer to unlabeled background images from various scenes that do not contain specific wind turbine defect targets, and their introduction aims to train the model to better understand and adapt to various background scenarios, thereby improving its generalization performance in real-world applications. We selected 211 unlabeled background images containing scenes such as clear sky, snow, grass, sand, and haze, as shown in Figure 9. By applying augmentation operations, including vertical and horizontal flips, as well as brightness adjustments (adding or subtracting 25%), we expanded this set to 628 training samples. These samples were added to the training set to guide the model in learning richer contextual information, thereby enhancing the model’s detection accuracy in real-world scenarios and robustness in detecting across multiple scenes.

3.2.5. Slicing-Aided Hyper Inference

Due to the requirement of performing inference and predictions on high-resolution, unsliced images collected by unmanned aerial vehicles (UAVs) for wind turbine surface defect detection, which aligns with the real industrial scenario of defect detection, we introduce the slicing-aided hyper inference (SAHI) algorithm, as illustrated in Figure 10. SAHI is a universal framework designed to address the challenges of small object detection. Its innovation lies in the thorough utilization of slicing techniques by finely dividing the input image during the inference phase.
The core idea involves partitioning the input image into mutually overlapping blocks and adjusting each block appropriately to ensure that its original aspect ratio is maintained during resizing. Subsequently, for each independent overlapping block, forward propagation of the target detection is applied, allowing for more effective capture of feature information related to small targets.
In the algorithmic flow of SAHI, the application of non-maximum suppression (NMS) is crucial for handling overlapping regions. During NMS, the intersection over union (IoU) is calculated between predicted bounding boxes to match highly overlapping and similar boxes. The purpose of this step is to optimize detection results, preventing redundant boxes and thereby improving the accuracy and stability of detection. Within the matched boxes, SAHI further introduces a threshold for detection probability (Td). By removing boxes with detection probabilities below the predefined threshold, SAHI can filter out results with high uncertainty or potential noise, ensuring that the final output consists of high-confidence target detection boxes.
Following the post-processing steps of NMS and probability threshold filtering, SAHI combines all processed image blocks mapped back to the original image size. This step aims to produce consistent and complete target detection results, enabling the SAHI algorithm to perform wind turbine surface defect detection in real-world scenarios effectively.

3.3. Experiments

3.3.1. Evaluation Metrics

The performance of our model was evaluated using mAP, defined as a range of IoUs from 0.5 to 0.95, and the average precision (AP) was computed at intervals of 0.05 of an IoU and then averaged across all APs, with the formula shown in Equation (15):
mAP = 1 N i N AP i
Here, mAP_50 and mAP_75 calculate the average precision using a fixed IoU threshold of 0.5 and 0.75, respectively, with the latter being used for the average precision calculation, and mAP_s/m/l distinguishes between small, medium, and large objects based on their respective average precisions. Here, small, medium, and large refer to targets with dimensions smaller than 32 × 32, between 32 × 32 and 96 × 96, and larger than 96 × 96, respectively.

3.3.2. Experimental Set-Ups

All experiments were conducted under the same experimental conditions. The hardware configuration for the experiments is presented in Table 1, and we maintained consistent control over the model training parameters, as outlined in Table 2.
In the case of adopting the multi-scale copy-paste algorithm with the scale_range set to (0.8, 1.2) and introducing the dynamic label assignment strategy based on the Hungarian algorithm, this study set the weights for classification loss, regression loss, and IoU loss to 2.0, 5.0, and 2.0, respectively. The dataset in the experiment was divided at an 8:2 ratio, with the training and test sets containing 7502 and 1875 images, respectively. A series of YOLO algorithm-based variants was selected for comparison, including YOLOv6-s, YOLOv7-e, YOLOv8-s, and YOLOX-s, to validate the performance of the model in this study.

3.3.3. Analysis

The experimental results are shown in Table 3. On the wind turbine surface defect test set, our model achieved significant advantages in multiple key indicators. In terms of mAP, our method reached 0.893, which was approximately 3.1%, 13.2%, 27.0%, 37.4%, and 50.4% higher than YOLOv5-s, YOLOv6-s, YOLOv8-s, YOLOv7-e, YOLOX-s, MobileNetV2 [38], and Mask R-CNN, respectively. Under different IoU thresholds and scale conditions of mAP_50, mAP_75, mAP_s, mAP_m, and mAP_l, our method performed excellently, surpassing other algorithms with outstanding results of 0.957, 0.927, 0.807, 0.906, and 0.928, respectively. While improving the detection accuracy, our method achieved the best balance between model light-weighting and high performance in terms of parameter quantity and FLOPs.
Table 4 presents comparative experimental results with the addition of different modules, where various configurations are compared in terms of different performance indicators by introducing the multi-scale copy-paste, Hungarian assigner, multi-scenario negative sample-guided learning, and two-stage progressive training strategies.
The introduction of our designed multi-scale copy-paste method resulted in a significant performance improvement in mAP, mAP_50, and mAP_75, reaching 0.866, 0.936, and 0.885, respectively. Compared with the baseline model without improvement, our method demonstrated noticeable advantages in the detection performance of small-, medium-, and large-scale objects, with corresponding improvement rates of 0.709, 0.868, and 0.904, representing increases of 8.8%, 10.4%, and 6.6%, respectively. This fully demonstrates the effectiveness of our method in multi-scale object detection scenarios.
With the introduction of the Hungarian assigner strategy, we observed a 5% improvement in mAP and target detection performance, and in the detection of small-, medium-, and large-scale objects, increases of 7%, 0.9%, and 0.5% in performance were observed, respectively. Introducing the multi-scenario negative sample-guided learning and two-stage progressive training strategies led to further improvements in model performance.
In the model that integrated all improvement strategies, mAP, mAP_50, and mAP_75 increased by 11%, 0.5%, and 5.1%, respectively, compared with the baseline model without improvement. In multi-scale detection, the performance of small, medium, and large targets increased by 18.6%, 16.4%, and 6.8%, respectively. These series of experimental results fully demonstrate the effectiveness of our method and its generality in different scenarios. Additionally, when applying the slicing-aided hyper inference algorithm for inference detection on large images, our inference speed was maintained at 7.25 s per image (with an average of 20 targets per large image), showing high inference efficiency in real industrial scenarios.
Table 5 and Table 6 present the performance comparison results between the baseline model and our model in various category defects. In terms of leading edge erosion, the mAP improved from 0.793 to 0.96, demonstrating a significant enhancement. Specifically, mAP_50 and mAP_75 increased from 0.955 and 0.91 to 0.98 and 0.968, respectively. For the category of blade tip opening damage, both mAP_50 and mAP_75 maintained a high level at 1.0, indicating the robustness of our model in this category.
Concerning hide cracks, the mAP increased from 0.716 to 0.885. Notably, mAP_s and mAP_m increased from 0.476 and 0.701 to 0.732 and 0.879, respectively, indicating significant improvements in small-scale and medium-scale targets. In the categories of surface eye, surface injury, and surface oil, our model showed comprehensive improvements in all metrics compared with the baseline model.
In the category of lightning strikes, all metrics showed improvements except for slight decreases in mAP_50 and mAP_l. Overall, the improved model demonstrates significant advantages in wind turbine surface defect detection.
The actual detection results for our model on the test set are shown in Figure 11, Figure 12, Figure 13, Figure 14, Figure 15, Figure 16 and Figure 17. It can be observed that the model’s detections were highly accurate across all categories, effectively distinguishing and detecting targets of various scales.
The application of the slicing-aided hyper inference algorithm demonstrated outstanding inference and prediction capabilities in our model for the original large images, as shown in Figure 18, Figure 19, Figure 20 and Figure 21. Figure 18 displays the detection results for the entire large image, while Figure 19, Figure 20 and Figure 21 provide enlarged views of the detection regions from Figure 18. Upon observing the results, it is evident that the model excelled in detecting small objects and accurately identified various defect categories at the overall scale. Even in densely populated areas of different categories, the model exhibited precise detection of defects.
Figure 22 presents a comparison of the detection performance between the original model and the improved model. It is noticeable that the original images exhibited significant instances of misidentification during actual large-scale image detection. In contrast, the improved model substantially reduced instances of misidentification, showcasing excellent performance and providing a high-precision and efficient solution for wind turbine surface defect detection.

4. Conclusions

This study addressed the challenges of wind turbine surface defect detection technology, constructing a comprehensive dataset based on industry standards. Our proposed approach enhances the YOLOv5 object detection algorithm for the accurate and rapid detection and identification of wind turbine surface defects.
Compared with the baseline YOLOv5 network, our model introduces a multi-scale copy-paste strategy to increase exposure to samples of different scales, improving the model’s perception and accuracy for multi-scale targets. Additionally, we incorporated a dynamic label assignment strategy based on the Hungarian algorithm to optimize the label assignment process, enhancing the model’s localization and classification performance. We introduced a two-stage progressive training strategy to overcome the overfitting issues associated with strong data augmentation, improving the model’s generalization performance across different scales of targets while maintaining a stable parameter count. Simultaneously, we introduced multi-scenario negative sample-guided learning to reduce false negatives, resulting in better adaptation to complex backgrounds in real industrial scenarios.
On our self-constructed wind turbine surface defect detection dataset, our algorithm demonstrated outstanding detection accuracy for seven defect categories. Specifically, the detection accuracies for corrosion, cracks, hide cracks, surface eye, surface injury, surface oil, and lightning strikes were 96%, 89.3%, 88.5%, 88.9%, 93.8%, 93.4%, and 75.1%, respectively. Our algorithm achieved improvements of 16.7%, 1.7%, 16.9%, 12.4%, 12.6%, 9.6%, and 7% compared with the baseline model, demonstrating the algorithm’s high industrial value in practical applications.
Our algorithm not only addresses the issue of incomplete samples in the wind turbine surface defect domain but also provides an efficient and rapid solution for wind turbine surface defect detection. The multi-scale copy-paste strategy that it involves overcomes the challenge of significant object scale differences in wind turbine surface defect datasets. The introduction of this strategy is not only meaningful for wind turbine surface defect detection but can also be applied in other fields for handling targets of different scales, improving model generalization and adaptability. Similarly, the designed label assignment strategy not only provides more accurate label assignments for wind turbine surface defect detection but is also valuable for other target detection tasks in different domains. The introduction of two-stage progressive training and multi-scenario negative sample-guided learning successfully mitigates overfitting caused by strong data augmentation. This not only helps to improve the model’s generalization performance but also provides an effective method to reduce misidentification and alleviate overfitting in the training of deep learning models in other domains. Therefore, our research offers an advanced technical solution for the industrial sector, laying a solid foundation for further developments in wind turbine surface defect detection.

Author Contributions

Conceptualization, X.W. and M.L.; software, M.L.; investigation, M.W. and Y.C.; formal analysis, X.W. and M.L.; writing—original draft preparation, M.L.; writing—review and editing, X.W.; supervision, X.W.; funding acquisition, X.W. All authors have read and agreed to the published version of the manuscript.

Funding

This research received no external funding.

Data Availability Statement

The data presented in this study are available on request from the corresponding author due to legal.

Acknowledgments

We would like to thank the anonymous reviewers for their supportive comments which improved our manuscript.

Conflicts of Interest

The authors declare no conflicts of interest.

References

  1. Hwang, S.; An, Y.K.; Sohn, H. Continuous-wave line laser thermography for monitoring of rotating wind turbine blades. Struct. Health Monit. 2019, 18, 1010–1021. [Google Scholar] [CrossRef]
  2. Schubert, L.; Schulze, E.; Frankenstein, B.; Fischer, D.; Weihnacht, B.; Rieske, R. Monitoring system for windmill rotorblades based on optical connections. In Smart Sensor Phenomena, Technology, Networks, and Systems; SPIE: Bellingham, WA, USA, 2011; Volume 7982, pp. 310–317. [Google Scholar]
  3. Tarfaoui, M.; Khadimallah, H.; Shah, O.; Pradillon, J. Effect of spars cross-section design on dynamic behavior of composite wind turbine blade: Modal analysis. In Proceedings of the 4th International Conference on Power Engineering, Energy and Electrical Drives, Istanbul, Turkey, 13–17 May 2013; pp. 1006–1011. [Google Scholar]
  4. Abouhnik, A.; Albarbar, A. Wind turbine blades condition assessment based on vibration measurements and the level of an empirically decomposed feature. Energy Convers. Manag. 2012, 64, 606–613. [Google Scholar] [CrossRef]
  5. Bo, Z.; Yanan, Z.; Changzheng, C. Acoustic emission detection of fatigue cracks in wind turbine blades based on blind deconvolution separation. Fatigue Fract. Eng. Mater. Struct. 2017, 40, 959–970. [Google Scholar] [CrossRef]
  6. Junior, V.J.; Zhou, J.; Roshanmanesh, S.; Hayati, F.; Hajiabady, S.; Li, X.; Dong, H.; Papaelias, M. Evaluation of damage mechanics of industrial wind turbine gearboxes. Insight-Non-Destr. Test. Cond. Monit. 2017, 59, 410–414. [Google Scholar] [CrossRef]
  7. Tang, J.; Soua, S.; Mares, C.; Gan, T.H. An experimental study of acoustic emission methodology for in service condition monitoring of wind turbine blades. Renew. Energy 2016, 99, 170–179. [Google Scholar] [CrossRef]
  8. Choi, K.S.; Huh, Y.H.; Kwon, I.B.; Yoon, D.J. A tip deflection calculation method for a wind turbine blade using temperature compensated FBG sensors. Smart Mater. Struct. 2012, 21, 025008. [Google Scholar] [CrossRef]
  9. Girshick, R.; Donahue, J.; Darrell, T.; Malik, J. Rich feature hierarchies for accurate object detection and semantic segmentation. In Proceedings of the IEEE Conference on Computer Vision and Pattern Recognition, Columbus, OH, USA, 23–28 June 2014; pp. 580–587. [Google Scholar]
  10. Girshick, R. Fast r-cnn. In Proceedings of the IEEE International Conference on Computer Vision, Santiago, Chile, 7–13 December 2015; pp. 1440–1448. [Google Scholar]
  11. Phillips, J.J. ROI: The search for best practices. Train. Dev. 1996, 50, 42–48. [Google Scholar]
  12. Ren, S.; He, K.; Girshick, R.; Sun, J. Faster r-cnn: Towards real-time object detection with region proposal networks. Adv. Neural Inf. Process. Syst. 2015, 28, 1–9. [Google Scholar] [CrossRef] [PubMed]
  13. Dai, J.; Li, Y.; He, K.; Sun, J. R-fcn: Object detection via region-based fully convolutional networks. Adv. Neural Inf. Process. Syst. 2016, 29, 379–387. [Google Scholar]
  14. Ghiasi, G.; Lin, T.Y.; Le, Q.V. Nas-fpn: Learning scalable feature pyramid architecture for object detection. In Proceedings of the IEEE/CVF Conference on Computer Vision and Pattern Recognition, Long Beach, CA, USA, 15–20 June 2019; pp. 7036–7045. [Google Scholar]
  15. He, K.; Gkioxari, G.; Dollár, P.; Girshick, R. Mask r-cnn. In Proceedings of the IEEE International Conference on Computer Vision, Venice, Italy, 22–29 October 2017; pp. 2961–2969. [Google Scholar]
  16. Law, H.; Deng, J. Cornernet: Detecting objects as paired keypoints. In Proceedings of the European Conference on Computer Vision (ECCV), Munich, Germany, 8–14 September 2018; pp. 734–750. [Google Scholar]
  17. Duan, K.; Bai, S.; Xie, L.; Qi, H.; Huang, Q.; Tian, Q. Centernet: Keypoint triplets for object detection. In Proceedings of the IEEE/CVF International Conference on Computer Vision, Seoul, Republic of Korea, 27 October–2 November 2019; pp. 6569–6578. [Google Scholar]
  18. Yang, Z.; Liu, S.; Hu, H.; Wang, L.; Lin, S. Reppoints: Point set representation for object detection. In Proceedings of the IEEE/CVF International Conference on Computer Vision, Seoul, Republic of Korea, 27 October–2 November 2019; pp. 9657–9666. [Google Scholar]
  19. Qiu, Z.; Wang, S.; Zeng, Z.; Yu, D. Automatic visual defects inspection of wind turbine blades via YOLO-based small object detection approach. J. Electron. Imaging 2019, 28, 043023. [Google Scholar] [CrossRef]
  20. Yao, Y.; Wang, G.; Fan, J. WT-YOLOX: An Efficient Detection Algorithm for Wind Turbine Blade Damage Based on YOLOX. Energies 2023, 16, 3776. [Google Scholar] [CrossRef]
  21. Ge, Z.; Liu, S.; Wang, F.; Li, Z.; Sun, J. Yolox: Exceeding yolo series in 2021. arXiv 2021, arXiv:2107.08430. [Google Scholar]
  22. Ding, X.; Zhang, X.; Ma, N.; Han, J.; Ding, G.; Sun, J. Repvgg: Making vgg-style convnets great again. In Proceedings of the IEEE/CVF Conference on Computer Vision and Pattern Recognition, Nashville, TN, USA, 20–25 June 2021; pp. 13733–13742. [Google Scholar]
  23. Zhang, R.; Wen, C. SOD-YOLO: A Small Target Defect Detection Algorithm for Wind Turbine Blades Based on Improved YOLOv5. Adv. Theory Simul. 2022, 5, 2100631. [Google Scholar] [CrossRef]
  24. Sanghyun, W.; Jongchan, P.; Joon-Young, L.; In, S. CBAM: Convolutional Block Attention Module. In Proceedings of the European Conference on Computer Vision (ECCV), Munich, Germany, 8–14 September 2018. [Google Scholar]
  25. Wang, L.; Zhang, Z. Automatic detection of wind turbine blade surface cracks based on UAV-taken images. IEEE Trans. Ind. Electron. 2017, 64, 7293–7303. [Google Scholar] [CrossRef]
  26. Wang, L.; Zhang, Z.; Luo, X. A two-stage data-driven approach for image-based wind turbine blade crack inspections. IEEE/ASME Trans. Mechatron. 2019, 24, 1271–1281. [Google Scholar] [CrossRef]
  27. Zhang, Y.; Wang, L.; Huang, C.; Luo, X. Wind Turbine Blade Damage Detection Based on the Improved YOLOv5 Algorithm. In Proceedings of the 2023 IEEE/IAS Industrial and Commercial Power System Asia (I & CPS Asia), Chongqing, China, 7–9 July 2023; pp. 1353–1357. [Google Scholar]
  28. Ye, X.; Wang, L.; Huang, C.; Luo, X. UAV-taken Wind Turbine Image Dehazing with a Double-patch Lightweight Neural Network. IEEE Internet Things J. 2023; early access. [Google Scholar]
  29. Ghiasi, G.; Cui, Y.; Srinivas, A.; Qian, R.; Lin, T.Y.; Cubuk, E.D.; Le, Q.V.; Zoph, B. Simple copy-paste is a strong data augmentation method for instance segmentation. In Proceedings of the IEEE/CVF Conference on Computer Vision and Pattern Recognition, Nashville, TN, USA, 20–25 June 2021; pp. 2918–2928. [Google Scholar]
  30. Kuhn, H.W. The Hungarian method for the assignment problem. Nav. Res. Logist. Q. 1955, 2, 83–97. [Google Scholar] [CrossRef]
  31. Akyon, F.C.; Altinuc, S.O.; Temizel, A. Slicing aided hyper inference and fine-tuning for small object detection. In Proceedings of the 2022 IEEE International Conference on Image Processing (ICIP), Bordeaux, France, 16–19 October 2022; pp. 966–970. [Google Scholar]
  32. Bochkovskiy, A.; Wang, C.Y.; Liao, H.Y.M. Yolov4: Optimal speed and accuracy of object detection. arXiv 2020, arXiv:2004.10934. [Google Scholar]
  33. Redmon, J.; Farhadi, A. Yolov3: An incremental improvement. arXiv 2018, arXiv:1804.02767. [Google Scholar]
  34. He, K.; Zhang, X.; Ren, S.; Sun, J. Spatial pyramid pooling in deep convolutional networks for visual recognition. IEEE Trans. Pattern Anal. Mach. Intell. 2015, 37, 1904–1916. [Google Scholar] [CrossRef] [PubMed]
  35. Liu, S.; Qi, L.; Qin, H.; Shi, J.; Jia, J. Path aggregation network for instance segmentation. In Proceedings of the IEEE Conference on Computer Vision and Pattern Recognition, Salt Lake City, UT, USA, 18–23 June 2018; pp. 8759–8768. [Google Scholar]
  36. Lin, T.Y.; Goyal, P.; Girshick, R.; He, K.; Dollár, P. Focal loss for dense object detection. In Proceedings of the IEEE International Conference on Computer Vision, Venice, Italy, 22–29 October 2017; pp. 2980–2988. [Google Scholar]
  37. Rezatofighi, H.; Tsoi, N.; Gwak, J.; Sadeghian, A.; Reid, I.; Savarese, S. Generalized Intersection Over Union: A Metric and a Loss for Bounding Box Regression. In Proceedings of the 2019 IEEE/CVF Conference on Computer Vision and Pattern Recognition (CVPR), Long Beach, CA, USA, 15–20 June 2019; pp. 658–666. [Google Scholar]
  38. Sandler, M.; Howard, A.; Zhu, M.; Zhmoginov, A.; Chen, L.C. Mobilenetv2: Inverted residuals and linear bottlenecks. In Proceedings of the IEEE Conference on Computer Vision and Pattern Recognition, Salt Lake City, UT, USA, 18–23 June 2018; pp. 4510–4520. [Google Scholar]
Figure 1. The process of constructing the wind turbine surface defect dataset.
Energies 17 01796 g001
Figure 2. Plot of each sample of the wind turbine surface defect dataset. From top to bottom and left to right are surface oil, corrosion, hide crack, crack, surface injury, surface eye, and lightning strike.
Energies 17 01796 g002
Figure 3. Plot of the quantity of different target sizes for each category of wind turbine surface defect.
Energies 17 01796 g003
Figure 4. Overall network structure diagram of YOLOv5.
Energies 17 01796 g004
Figure 5. Overall process of improved strategies of YOLOv5.
Energies 17 01796 g005
Figure 6. Application diagram of the multi-scale copy-paste data enhancement algorithm. The image is after mosaic-enhanced image stitching.
Energies 17 01796 g006
Figure 7. Label matching strategies of YOLOv5.
Energies 17 01796 g007
Figure 8. Two-stage progressive training strategy.
Energies 17 01796 g008
Figure 9. Unlabeled multi-scenario negative samples.
Energies 17 01796 g009
Figure 10. Slicing-aided hyper inference algorithm. P1–P3 are overlapping patches sliced from the original image, and each patch is subsequently resized and predicted separately for each patch while preserving the aspect ratio.
Energies 17 01796 g010
Figure 11. Comparison of corrosion original labeling and test results.
Energies 17 01796 g011
Figure 12. Comparison of crack original labeling and test results.
Energies 17 01796 g012
Figure 13. Comparison of hide crack original labeling and test results.
Energies 17 01796 g013
Figure 14. Comparison of surface eye original labeling and test results.
Energies 17 01796 g014
Figure 15. Comparison of surface injury original labeling and test results.
Energies 17 01796 g015
Figure 16. Comparison of surface oil original labeling and test results.
Energies 17 01796 g016
Figure 17. Comparison of lightning strike original labeling and test results.
Energies 17 01796 g017
Figure 18. Application of slicing-aided hyper inference to reasoning results in real large image.
Energies 17 01796 g018
Figure 19. Application of slicing-aided hyper inference to reasoning results in real large image (part).
Energies 17 01796 g019
Figure 20. Application of slicing-aided hyper inference to reasoning results in real large image (part).
Energies 17 01796 g020
Figure 21. Application of slicing-aided hyper inference to reasoning results in real large image (part).
Energies 17 01796 g021
Figure 22. Comparison of detection results between the baseline model and our model in a real large image (red labeled areas are misidentified targets).
Energies 17 01796 g022
Table 1. Experimental environment parameter configuration.
ParametersConfiguration
OSUbuntu 18.04.5 LTS
Python version3.9.16
Pytorch version and CUDA version2.0.0+cu117
GPUTesla V100S × 2 *
Video memory size32510MiB × 2
* Sourced from NVIDIA Corporation in Santa Clara, CA, USA.
Table 2. Training parameter configuration.
ParametersConfiguration
Epoch100
RepeatDataset5
EMAHook0.0001
Base_lr0.01
Img_scale640 × 640
OptimizerSGD
Loss_objCrossEntropyLoss
IoULossCIoU
Table 3. Experimental results of different models on the testing sets.
MethodmAPmAP_50mAP_75mAP_smAP_mmAP_lParams (M)FLOPs (G)Time (s/img) *
Ours0.8930.9570.9270.8070.9280.9067.0397.597.25
yolov5-s0.8620.940.8840.6210.7640.8387.0397.596.75
yolov6-s0.7610.9350.8280.5840.7370.81617.1921.88610.5
yolov8-s0.6230.850.6760.4370.5520.69911.13814.2787.5
yolov7-e0.5190.8450.550.3950.5080.56336.53551.7928
yolox-s0.3890.7430.3560.3040.3620.4358.9413.5257.25
MobileNetV20.8650.9330.8910.7430.8960.8726.7966.6376.5
Mask R-CNN0.7150.8120.6330.4270.6710.70525.5643.3748.6
* Inference detection on large images.
Table 4. Added experimental comparison results for different methods.
MethodmAPmAP_50mAP_75mAP_smAP_mmAP_lTime (s/img) *
Multi-Scale
Copy-Paste
Hungarian
Assigner
Negative
Sample
Two-Stage
Training
0.7830.9520.8760.6210.7640.8386.75
0.8660.9360.8850.7090.8680.9047.25
0.8330.9450.8630.6910.7730.8437
0.8730.9410.890.7120.8750.9077
0.8540.9470.8990.7220.8990.8777
0.8750.9420.8910.70.8640.9087.25
0.8930.9570.9270.8070.9280.9067.25
* Inference detection on large images.
Table 5. Results of the baseline model for each category on the testing sets.
CategorymAPmAP_50mAP_75mAP_smAP_mmAP_l
Corrosion0.7930.9550.910.8760.7670.845
Crack0.8761.01.0NANNAN0.88
Hide Crack0.7160.9410.790.4760.7010.889
Surface Eye0.7650.9360.839NAN0.7480.767
Surface Injury0.8120.9640.9040.6380.8010.843
Surface Oil0.8380.9530.91NAN0.7230.85
Lightning Strike0.6810.9180.7760.4920.7410.793
Table 6. Results of our model for each category on the testing sets.
CategorymAPmAP_50mAP_75mAP_smAP_mmAP_l
Corrosion0.960.980.9680.9410.9640.956
Crack0.8931.01.0NANNAN0.893
Hide Crack0.8850.9790.9180.7320.8790.979
Surface Eye0.8890.9380.906NAN0.9640.882
Surface Injury0.9380.9650.9440.9380.9510.923
Surface Oil0.9340.9560.947NAN0.920.935
Lightning Strike0.7510.8830.8060.6170.8890.775
Disclaimer/Publisher’s Note: The statements, opinions and data contained in all publications are solely those of the individual author(s) and contributor(s) and not of MDPI and/or the editor(s). MDPI and/or the editor(s) disclaim responsibility for any injury to people or property resulting from any ideas, methods, instructions or products referred to in the content.

