Article

Co-Gasification of Polyethylene and Biomass in Catalytic Bed Material

by
Warnakulasooriya Dinoja Sammani Fernando
* and
Jamal Naser
Department of Mechanical Engineering and Product Design Engineering, Swinburne University of Technology, John St, Hawthorn, VIC 3122, Australia
*
Author to whom correspondence should be addressed.
Energies 2024, 17(8), 1804; https://doi.org/10.3390/en17081804
Submission received: 26 February 2024 / Revised: 4 April 2024 / Accepted: 5 April 2024 / Published: 9 April 2024

Abstract

:
In this work, a simplified comprehensive three-dimensional numerical model is developed to study the effect of hydrogen production on co-gasification of biomass and low-density polyethylene (LDPE). CFD software AVL Fire 2020 inbuilt algorithms were employed to develop the gas phase while the solid phase was developed by user-defined FORTRAN subroutines. Solid hydrodynamics, fuel conversion, homogenous and non-homogenous chemical reactions, and heat transfer, including radiation, subroutines were defined and incorporated into AVL FIRE explicitly. Species concentrations of the syngas were analyzed for co-gasification of Beechwood and LDPE for three distinct types of bed materials (silica sand, Na-Y zeolite, and ZSM-5 zeolite). Then, the model is validated with experiment results available in the literature for a lab-scale fluidized bed reactor. The highest hydrogen production was observed in Na-Y zeolite followed by ZSM-5 zeolite and silica in both numerical and experimental analysis for the co-gasification of Beechwood and LDPE, providing a reasonable agreement between the numerical and the experimental results. Therefore, the current model predicts the enhancement of the quality of hydrogen-rich syngas through the application of co-pyrolysis within a fluidized bed reactor, incorporating a catalytic bed material.

1. Introduction

Co-gasification of biomass and plastic has become popular in recent years due to its hydrogen-rich syngas concentration compared to biomass sole combustion and gasification. Moreover, population growth and rapid urbanization have caused huge plastic utilization and massive plastic production in the world [1] crossing 2.5 million tons in Australia only in 2021 [2]. Plastic consumption in the world is forecasted to double within the next 15 years and the main plastic consumers are the sectors of packaging, electrical, agricultural, building, and automotive. The significant rise in plastic usage has led to a substantial increase in the amount of plastic waste, with around 60% of the total plastic waste being either disposed of in landfills or released into the environment [3]. Therefore, using waste plastic for co-gasification to produce energy can cause a solution to this serious environmental threat [4]. Furthermore, high oxygen content in biomass can be compensated by the high hydrogen-to-carbon ratio in plastic resulting in hydrogen-rich syngas and lower tar yields [5,6].
Co-gasification of biomass and plastic offers a promising technology for reducing greenhouse gas emissions. By utilizing carbon-neutral biomass alongside plastic waste, this process diverts waste from landfills and incinerators while producing syngas for energy generation. Co-gasification can lead to more complete combustion, lower greenhouse gas emissions, and the potential for carbon capture and utilization. Overall, co-gasification presents an innovative solution to both waste management and global warming issues. Further, co-gasification of biomass and plastic presents a promising pathway towards cost-effective waste management and renewable energy production by leveraging synergies between different feedstocks and optimizing the gasification process for maximum efficiency and value recovery. The cost-effectiveness of co-gasification of biomass and plastic to produce hydrogen hinges on factors like feedstock availability, technology efficiency, scale of operation, and market demand [7,8].
The main compositions of waste plastic are high-density polyethylene (HDPE) and low-density polyethylene (LDPE), which are the types of polyethylene burnt and gasified mostly in fluidized bed reactors with biomass [9] due to polyethylene sole combustion result in agglomeration and defluidization. It is a more effective strategy that also helps to alleviate difficulties that arise at the time of gasification of a single feedstock, like tar formation in biomass gasification and inadequate gasification of plastics caused by lowering fine particles [9,10,11,12,13]. Lopez et al. [9,14] demonstrated that co-gasifying HDPE with forest pine wood in a conical spouted bed reactor lowers tar and char generation while enhancing carbon conversion efficacy. Mastellone et al. [15] examined the co-gasification of plastics, wood, and coal in a bubbling fluidized bed reactor. They summarized that the use of coal and wood in plastic gasification lowers the production of tar. Aznar et al. [16] examined the best conditions for the co-gasification of waste plastics, biomass, and coal. The ideal temperature was found to be 850 °C, with an equivalent ratio of 0.36. The use of waste plastics in coal and biomass gasification may help to mitigate the problems caused by seasonal biomass.
Moreover, Syngas yield can be increased in the fluidized bed combustion by using a catalytic bed material which improves the tar cracking in pyrolysis [17,18,19]. Some zeolite catalysts have been tested to decrease the high molecular weight of wax. Among the zeolite catalysts, NKC-5 (ZSM-5) proved to be the most successful catalyst. The fraction of the non-condensable gases was raised from 17% w/w to 58% w/w by adding 10% w/w NKC-5 into the Polyethylene feedstock [20]. A review has been conducted by Lappas et al. [21] to study the catalytic effect on biomass pyrolysis and identified that the ZSM zeolites are most promising in increasing the bio yield from biomass combustion. Jerzak et al., have conducted an experimental analysis of the effect of zeolite catalyst vs. silica sand on biomass pyrolysis char, tar, and gaseous yields [22] and found out the char generation percentage is increased and the gas percentage is decreased in zeolite compared to silica sand. Gao Feng conducted a study on the catalytic impact of ZSM-5 zeolite and Na-Y zeolite on plastic pyrolysis. He observed that the use of both zeolites resulted in an increased generation of condensable gas during the pyrolysis of LDPE [20]. Fernandez et al., have conducted an experimental study to analyze the catalytic bed material effect of olivine on the pyrolysis yield of biomass and found out that using olivine as the bed material has a minimal effect on pyrolysis yield as the pyrolysis percentages are very similar to non-catalytic silica sand [23].
The solid bed hydrodynamics model for fluidized beds developed by Naser et al. [24] is employed in the present study to model the bed hydrodynamics. This hydrodynamics model is validated with the set of experiments carried out by Bell [25] who found out the results are reasonably similar to the experimental results. Fuel conversion for both beech wood and LDPE followed by heat transfer and energy conversion are developed using the existing literature mentioned in the model description section [26,27,28,29]. This simplified but comprehensive model used in this study was applied to three different bed materials including catalytic bed materials with a constant air flow rate. The numerical results of species concentrations at the outlet of the fluidized bed reactor were compared with the experimental results from the analysis conducted by Zhu et al. [30] for a lab-scale fluidized bed reactor.
AVL Fire 2020 advance simulation software is used for this model and coupled with the user-defined solid phase subroutines explicitly [31]. The Eularian–Eularian two-fluid approach is used in the model with mass, momentum, and energy equations that are solved for both the solid phase and gas phase.
The significance of the present work lies in its innovative approach to enhancing the yield and quality of hydrogen-rich syngas. Through the application of co-gasification within a fluidized bed reactor, coupled with the strategic incorporation of a catalytic bed material, this study not only contributes to advancing the understanding of gasification processes but also holds promise for optimizing the production of clean and efficient energy resources, particularly in the form of high-quality H2-rich syngas. The synergy of these techniques represents a crucial step forward in the pursuit of sustainable and environmentally friendly energy solutions. Subsequent research utilizing this established model can be conducted to determine the most favorable parameters of feedstock composition, particle size, etc. for co-gasification of biomass and LDPE to enhance the cost-effectiveness and reduce greenhouse gas emissions.

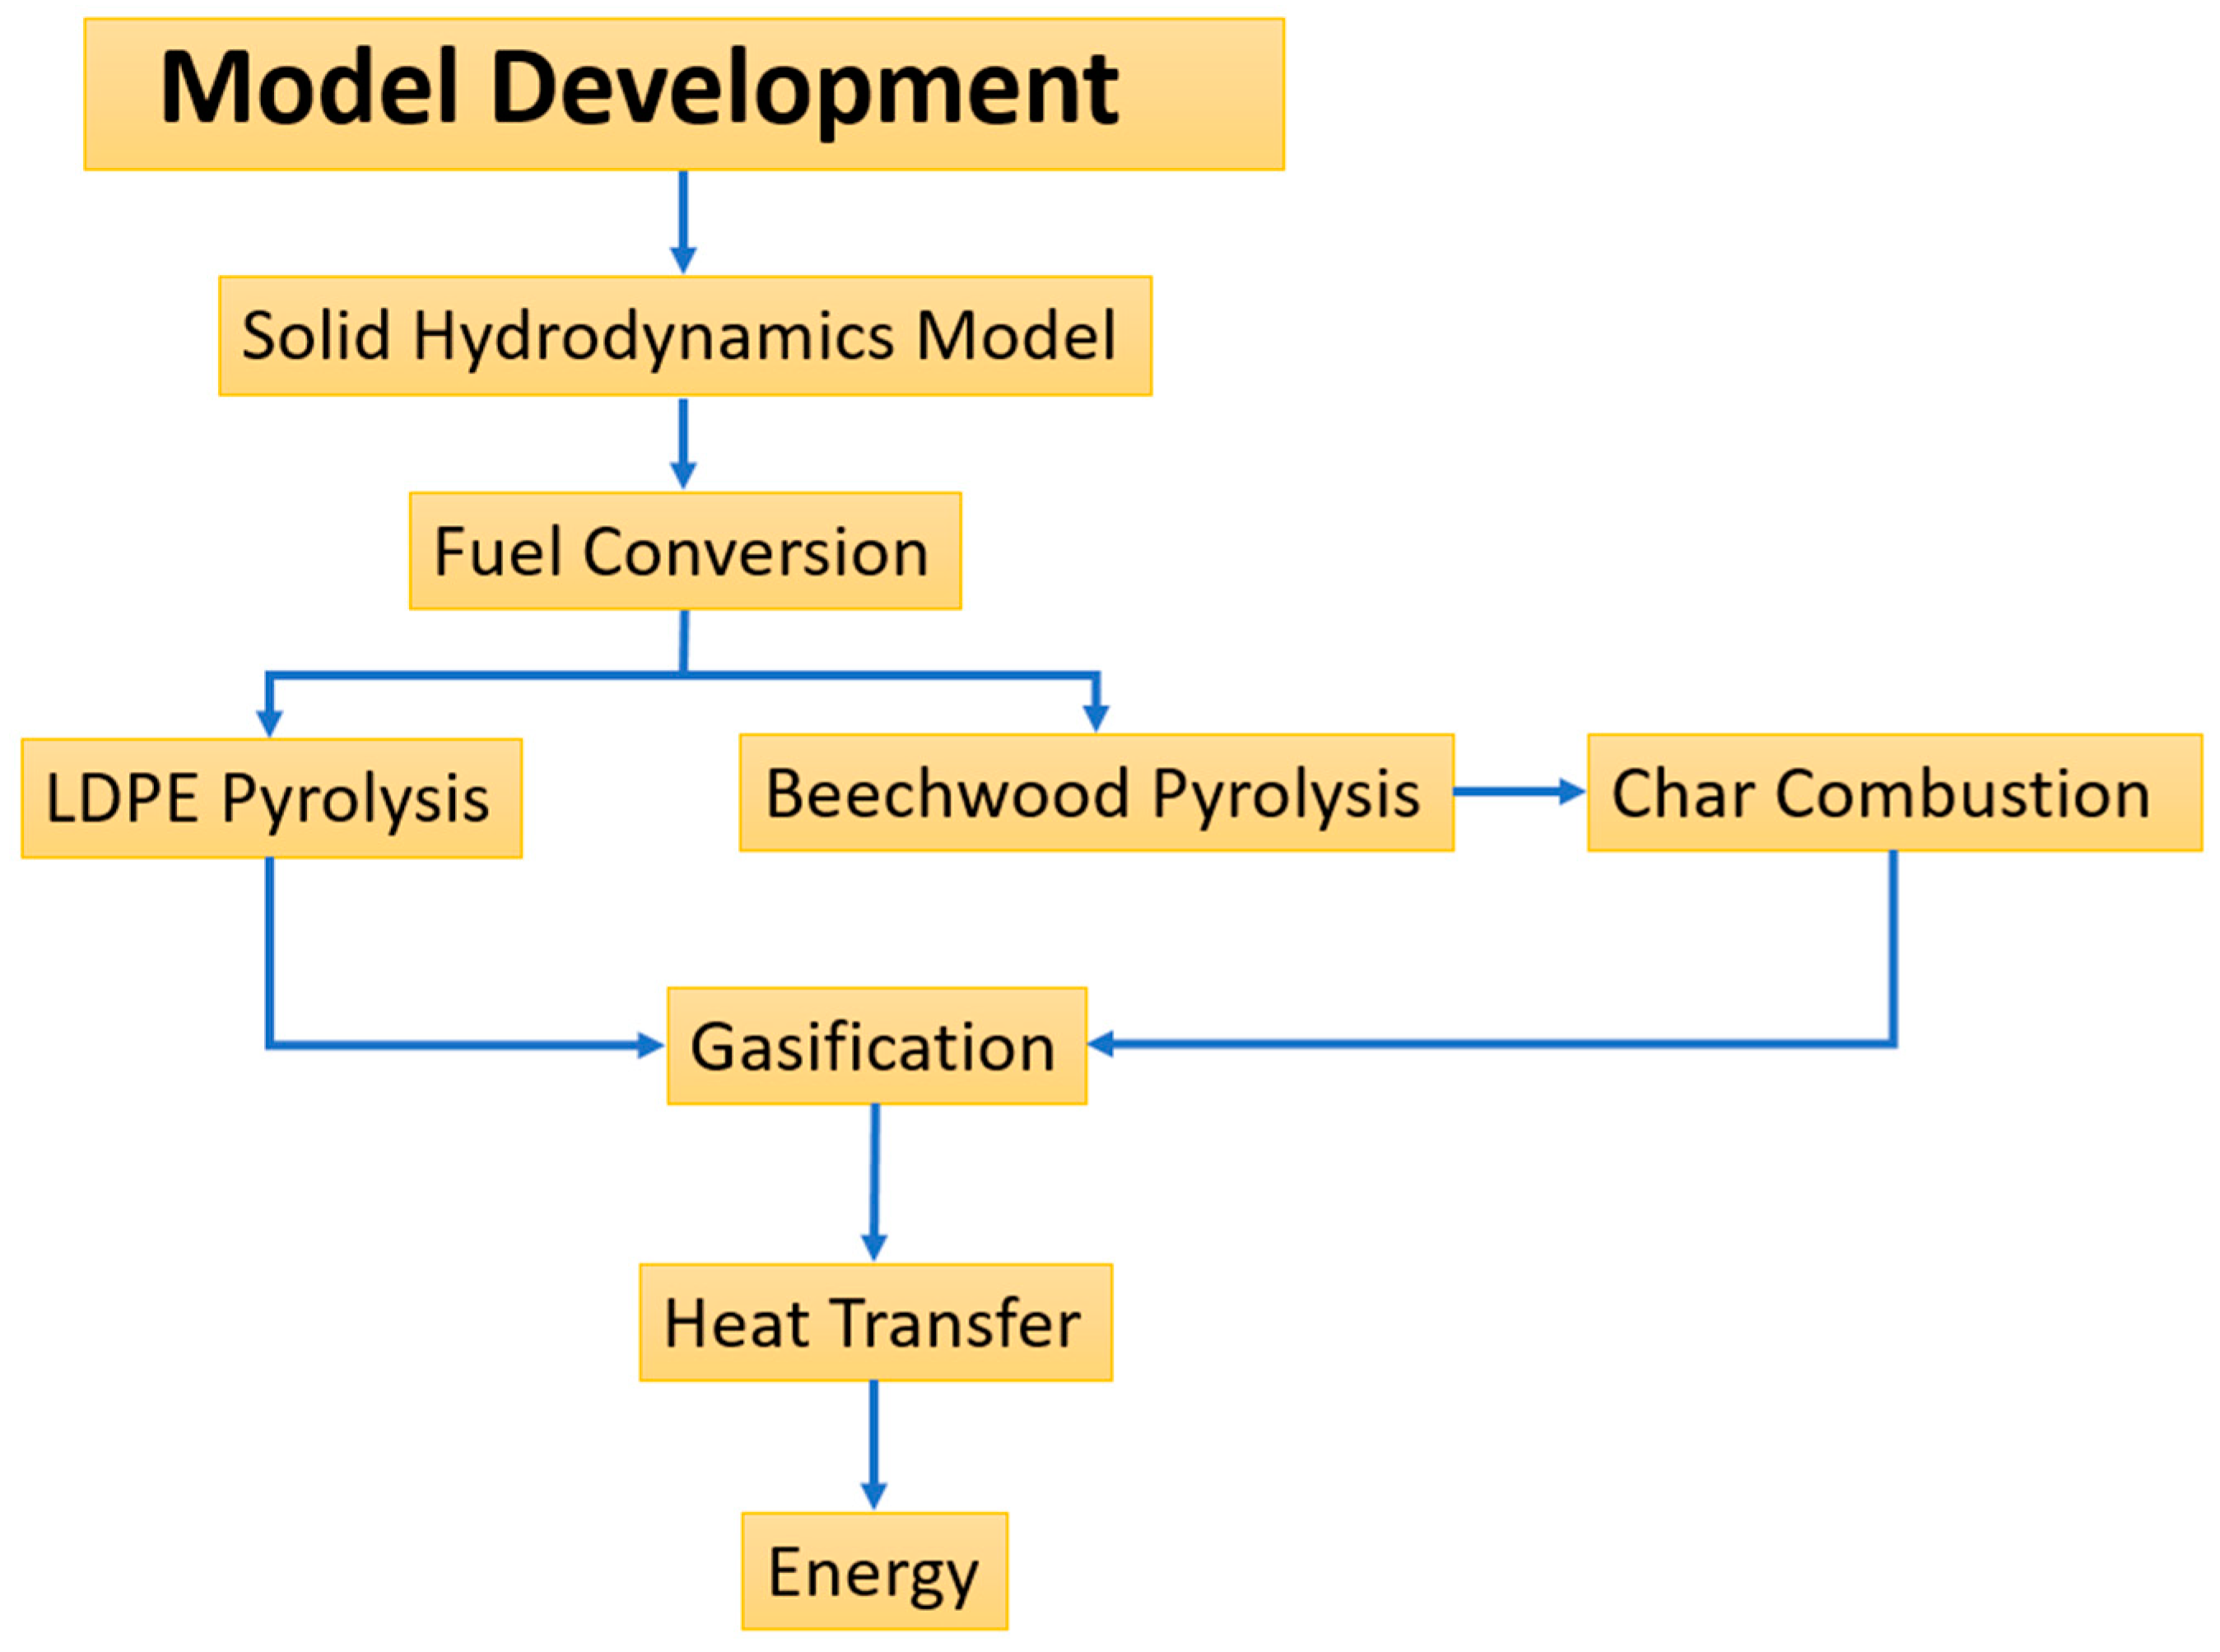
2. Model Description

In this model, the solid phase is modelled explicitly by user-defined subroutines and coupled with the AVL fire gas phase separately. Solid phase modelling consists of several sub-models developed by several authors and validated with experimental data [24,32]. The model is further developed to predict the co-gasification of biomass and LDPE for three different bed materials in the fluidized bed reactor. Figure 1 illustrates the sequential procedures employed in the model development of the co-gasification process using biomass and LDPE.

2.1. Modelling of Bed Hydrodynamics

Governing equations of continuity and momentum are solved for both gas and solid phases in the Eularian–Eularian modelling approach [24]. The solid hydrodynamics model development considered factors such as solid fraction, particle size, bubble growth in the bed, and solid phase mass transfer. Equations (1) and (2) represent the continuity equations for gas and solid, respectively. They represent the mass transfer from the controlled volume and mass transfer into the controlled volume and net mass transfer in and out of the control volume. Momentum transfer for gas and solid phases are shown in Equations (3) and (4) including all the parameters related to the momentum transfer in and out of a controlled volume.
ε g ρ g t + ε g ρ g u g = S g s ,
ε s ρ s t + ε s ρ s u s = S s g ,
ε g ρ g u g t + ε g ρ g u g u g = ε g P + τ g ¯ + S m o m u g u s + ε g ρ g g + S g s ,
ε s ρ s u s t + ε s ρ s u s u s = ε s P + τ s ¯ ¯ S m o m u g u s + ε s ρ s g + S s g .

Drag Model

The forces acting on solid particles and the gas phase within the control volume are commonly used to assess interphase momentum transfer. This estimation utilizes Equations (5) and (8), which are based on the solid volume fraction in each domain cell. In regions where the solid volume fraction exceeds 0.2 (ε > 0.2, representing dense regions), an empirical pressure drop correlation developed by Ergun [33] is utilized to compute flow resistance. Conversely, for regions with a solid volume fraction below 0.2 (ε < 0.2, representing dilute regions), the Gidaspow model [34] is used for pressure drop calculations. Coefficients of permeability and inertia, denoted as η and γ, respectively, are determined using Equations (6) and (7) to estimate S m o m for the dense phase in Equation (5). Then the gas phase flow resistance term is introduced into the solid phase momentum equation with an opposite sign. Equations (9) and (10) are used to calculate the drag coefficient of the gas phase and the Reynolds number of the gas flow, respectively.
S m o m = μ g η v + γ 1 2 ρ g v 2 ( f o r ε s > 0.2 ,
η = ψ 2 d e q 2 150 1 ε s 3 ε s 2 ,
γ = 3.5 ψ d e q ε s 1 ε s 3 ,
S m o m = 3 4 C d ε g ρ g u g u s ε s d s ε g 2.65 ( f o r ε s 0.2 ) ,
C d = 24 1 + 0.15 R e 0.687 R e , R e 1000 0.44 , R e 1000 ,
R e = ρ g u g u s ε g d s μ g ,

2.2. Fuel Conversion

Fuel conversion with temperature rising for LDPE and biomass was taken into account in this study. All three steps for biomass solid fuel conversion, drying, devolatilization, and char combustion were modelled [35] for silica bed material. For catalytic bed material, pyrolysis is modelled according to the existing literature [36,37]. Moreover, Primary pyrolysis and secondary pyrolysis were taken into consideration for the pyrolysis of LDPE fuel conversion. Gas, char, tar, and wax percentages vary according to the bed material for both the Beechwood and LDPE pyrolysis process and this variation is accounted for in the present study to model the catalytic effect of bed materials [20,22,23]. Various scalars from existing literature were used in this study to model the solid fuel conversion process [29,35].

2.2.1. Biomass Drying

Biomass contains some amount of moisture and when the solid fuel is heated that moisture content evaporates from the solid fuel. Evaporation initiates with the solid fuel temperature reaches 373 K and then devolatilization and char consumption occur [27]. As the fuel heats up, at some stage heating exceeds drying and starts to release volatile matters. Therefore, part of the heat supplied is consumed for the latent heat of evaporation while other part contributes as sensible heat and heats up the fuel. Drying rate is modelled considering this scenario and taking into account in Equation (11). Value for α is taken as 0.5 which reflects the amount of heat absorbed for evaporation [35].
D r y i n g r a t e R ˙ m o i s t = α ρ p . C p L H m o i s t T s t w h e n T s T e v a p .

2.2.2. Biomass Devolatilization

Devoatilization is one of the most important and complex process in biomass combustion in fluidized bed reactor [38,39]. In reality, it includes many number of complex reactions for biomass degradation and volatile matter release [40] which becomes pyrolysis difficult to model. Although delvolatilization includes complex and indefinable intermediate reactions, it is not necessary to model every reaction when modelling bio mass pyrolysis. In the present study, a simplified reaction scheme is used to model the pyrolysis of biomass representing non condensable gases, condensable gases (tar) and char. Equation (12) indicates the three parallel reactions for condensable gas, tar, and char used to model the pyrolysis process in the present study.
D e v o l a t i l i z a t i o n r a t e R ˙ w o o d = ρ w i = 1 3 A i e x p ( E i R . T s )
In Equation (12) i = 1, 2 & 3 represents the rate of gas release, tar release and char generation, respectively due to biomass pyrolysis process. Table 1 includes the kinetic reaction parameters for the devolatilization model for gas, tar and char [26,27,28].

2.2.3. LDPE Pyrolysis

Pyrolysis of LDPE is a complex process that involves chains of reactions. Additionally, LDPE pyrolysis is affected by catalysts, reactor type, and the secondary cracking process. A single reaction model to represent the plastic decompositions available in the literature can be used for LDPE, HDPE, PS, and PP. However, it does not accurately predict results for simulation studies of LDPE. Thus a two-stage kinetic model for LDPE which includes primary and secondary cracking proposed by McNeill [41,42] is implemented in the LDPE pyrolysis model as indicated in Table 2.
L D P E P y r o l y s i s r a t e R ˙ l d p e = ρ l d p e i = 1 2 A i exp E i R . T s [ L D P E i ] n i .

2.3. Char Combustion

This work considers four distinct heterogeneous processes in the context of char combustion, and their respective kinetic rates are presented below. The process of char combustion is subsequently modified by employing the equations derived from the extant literature [35].
C + φ O 2 2 ( 1 φ ) C O + ( 2 φ 1 ) C O 2
K o x = 1.715 T s e x p 9000 T s
C + C O 2 2 C O
K g . 1 = 3.42 T s e x p 1.56 × 10 4 T s
C + H 2 O C O + H 2
K g . 2 = 5.7114 . T s e x p 1.56 × 10 4 T s
C + 2 H 2 C H 4
K g . 3 = 3.42 × 10 3 T s e x p 1.56 × 10 4 T s
Equation (23) represents the char consumption rate and it included all four heterogeneous reactions [27,29,43]. The rate of char consumption is driven by both thermal process and diffusional process with oxygen. Combustion process has a strong influence on primary available CO/CO2 ratio. Roughly two-third of total heat account for heat release by CO combustion during the whole char oxidation [44]. Therefore, it is very crucial to model it accurately and has become very difficult to model. However, in this model, Equation (25) estimates the amounts of CO and CO2 production and ϕ is the char oxidation parameter. K is defined as the constant for each char reaction. It is derived using Equation (45) due to diffusion (Km). Kinetics rates and diffusion of O2, H2O, CO2 and H2 are used to calculate global char constants for each heterogeneous reaction. Particle density can change significantly during char consumption due to the internal chemical and physical structure variation in fuel particles and it has been taken into account in this present study.
Char generation rate
R ˙ g . c h a r = ρ w . A 3 . e x p ( E i R . T s ) .
Char consumption rate
R ˙ c . c h a r = K glob   o x A v O 2 M c + K glob   g . 1 A v C O 2 M c + K g l o b g . 2 A v H 2 O M c + K g l o b g . 3 A v H 2 M c .
Global char constant
K glob   o x = 1 1 K o x + 1 K m o x , K glob   g . 1 = 1 1 K g 1 + 1 K m g . 1 , K glob   g . 2 = 1 1 K g 2 + 1 K m g . 2 , K glob   g . 3 = 1 1 K g 3 + 1 K m g . 3 .
Char oxidation parameter
φ = 2 + 4.3 e x p 3390 T s 2 1 + 4.3 e x p 3390 T s .

2.4. Homogeneous Gasification Model

Gasification is highly dependent on the composition of the volatile release from devolatilization and char combustion. CO, CO2, H2, H2O, CH4, C2H6, C3H8, C4H10, and C6H6 (tar) are volatiles associated with biomass and LDPE pyrolysis [20,45,46,47]. The gasification model is modified and developed with an iterative approach, as the model predicts volatiles accurately [29]. This model is then used in some literature for the modelling of simplified multistep homogeneous chemical reactions [35]. This is because advantageous of the multistep homogeneous chemical reaction model over single-step chemical reaction model [47,48]. The dominant homogeneous chemical reactions at higher gasification temperatures were taken into account considering air as the gasification agent [6]. The general format for the light hydrocarbon homogeneous chemical reactions is as below represented in Equations (26)–(28) [49]. These reactions were considered for all the volatiles released from LDPE pyrolysis. Additionally, Equation (29), water gas shift reaction and 30 hydrogen reaction with oxygen are also considered for the homogeneous gasification reaction model.
C n H m + n H 2 O n C O + ( n + m / 2 ) H 2 ,
C n H m + n C O 2 2 n C O + m / 2 H 2 ,
C n H m + ( n + m / 2 ) 2 O 2 n C O + m / 2 H 2 O ,
C O + H 2 O C O 2 + H 2 ,
O 2 + 2 H 2 2 H 2 O ,
Eddy break-up model (EBU) is used to simulate the homogeneous gasification model in this study. EBU approach estimates the species mass fractions based on the availability of gasification agents and fuel. It is an important method of predicting chemical reaction probabilities in turbulence kinetic modelling [50]. The EBU approach by Spalding [51] is further developed by Magnussen and Hjertager [52] in which the local parameters are used to determine the primary reaction rate in Equation (38).
ρ r ¯ f ˙ u = C f u τ R ρ ¯ m i n y ¯ f u , y ¯ o x S , C p r . y ¯ p r 1 + S .

2.5. Energy Model

Energy equations, Equation (41) encompass numerous source terms originating from different steps of the combustion process. S s r e a c represents the source term obtained during the processes of drying, devolatilization, and char consumption of biomass [29] and pyrolysis of LDPE. Equation (33) is altered by including a term derived from LDPE pyrolysis. S s c o n v and S s r a d source terms in the energy equation arise from convective and radiative heat transfer, respectively. Energy conversion occurs as a result of solid mass reduction due to mass conversion and other associated processes, which is denoted as S s loss   .
S s reac   = R ˙ moist   ε L H moist   R ˙ volatile   f gas   ε L H bio   dev   R ˙ LDPE   f gas   ε L H LDPE   dev   + S char   reac   ε ,
S char   reac   = K glob   o x A v O 2 M c 2 φ 1 Δ H c o 2 + 2 1 φ Δ H c o + K glob   g 1 A v C O 2 M c Δ H g 1 + K glob   g 2 A v H 2 O M c , Δ H g 2 + K glob   g 3 A v H 2 M c Δ H g . 3 k s / g ,
S s loss   = R ˙ moist   + R ˙ volatile   f gas   + R ˙ ldpe   f gas   + R ˙ char   ε C p T s Δ t ,
Rate of change solid volume fraction due to char
ε t = R ˙ c . c h a r ρ p ε
Solid temperature
ε ρ p c p T s t = k s , e f f T s S s loss  
Third power of particle diameter
d p 3 t = R ˙ c c   char   ρ p d p 3
Moisture density
ε ρ moist   t = R ˙ moist   ε
Dry wood density
ε ρ wood   t = R ˙ wood  
Char density
ε ρ char   t = R ˙ g . c h a r R ˙ c . c h a r ε
Energy equation source
S s = S s r e a c + S s c o n v + S s r a d + S s loss  
LDPE density
ε ρ LDPE   t = R ˙ LDPE   ε

2.6. Mass and Heat Transfer Model

Mass and heat transfer process is very important when modelling fuel combustion. In the present study, convection and radiation have been considered as main heat transfer modes between solid and gaseous phases. Correlations developed by Wakao and Kaguei [53,54] have been used for the heat and mass transfer design of this study. Equation (43) calculates the source term of solid convection term and that value with the opposite sign is added to the gas phase energy equation as the source term. Nusselt number is calculated in Equation (46) and the Sherwood number is calculated in Equation (47). Equation (45) is used to estimate mass transfer coefficients which are used in modelling char consumption rate mentioned above for each heterogeneous reaction.
S s conv   = S g conv   = h A v v T g T s ,
h = N u k d e q ,
K m =   Sh . D   d e q ,
N u = 2 + 1.1 R 0.6 P r 1 / 3 ,
S h = 2 + 1.1 R e 0.6 S c 1 / 3 .

Radiation Model

Fluidized bed mixes solid particles well and the bed is controlled to high temperature, hence the solid particles tend to increase their emissivity and absorptivity. Therefore, modelling the radiation heat transfer is important for fluidized bed which operates at high bed temperature. Discrete transfer radiation model (DTRM) is used in radiation modelling [55] in the present study. This method can be found in many numerical studies available in literature for radiation modelling [35,48,50,56]. In DTRM technique, a space is divided to defined number of angles to transport radiation intensity. Total area of the radiation is coved by the number of rays sent in many directions from a physical surface.
i n + 1 = i n 1 ϵ T , x i + i b ( T ) ϵ T , x i ,
i b = σ . T g 4 ,
Radiation intensity is defined in Equation (48) and the number of rays released in many directions carries the radiation intensity ( i n ). Gas composition and the temperature in the environment are the factor affect to the emissivity. Black body emissivity, i b is defined in Equation (49). In this radiation modelling, emissivity in solid phase is taken as a constant and multiplied it with the solid fraction of the cell to get the effective emissivity. Emissivity of the gas phase is modelled by weighted sum of grey gas (WSGGM). Gas, reacting particles and non-reacting particles have been considered in this radiation model. Then the radiation source term of the energy equation is calculated by taking the sum of all the intensities of all the rays pass through a controlled volume.

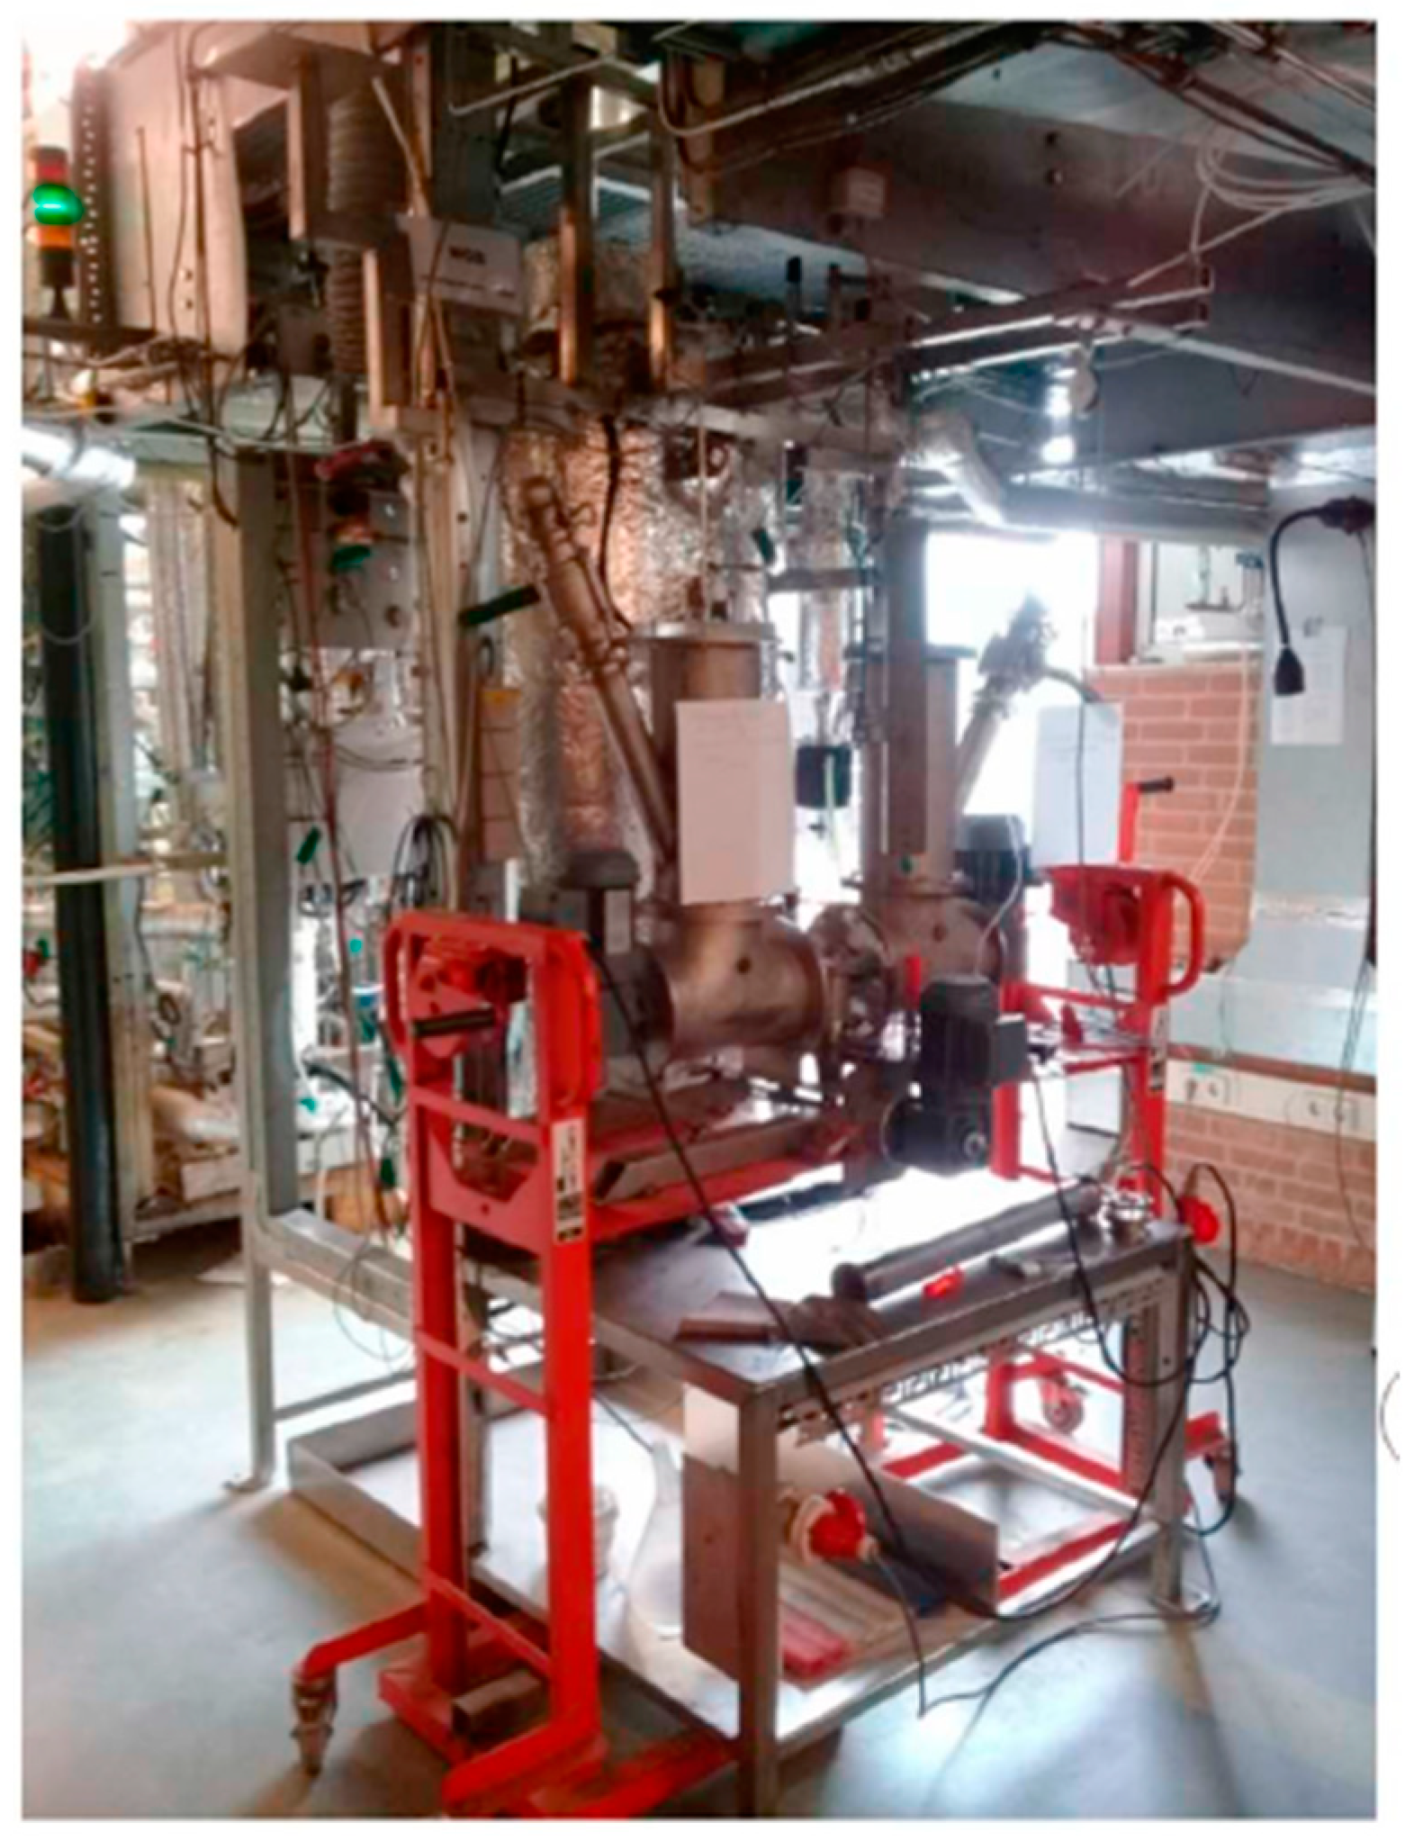
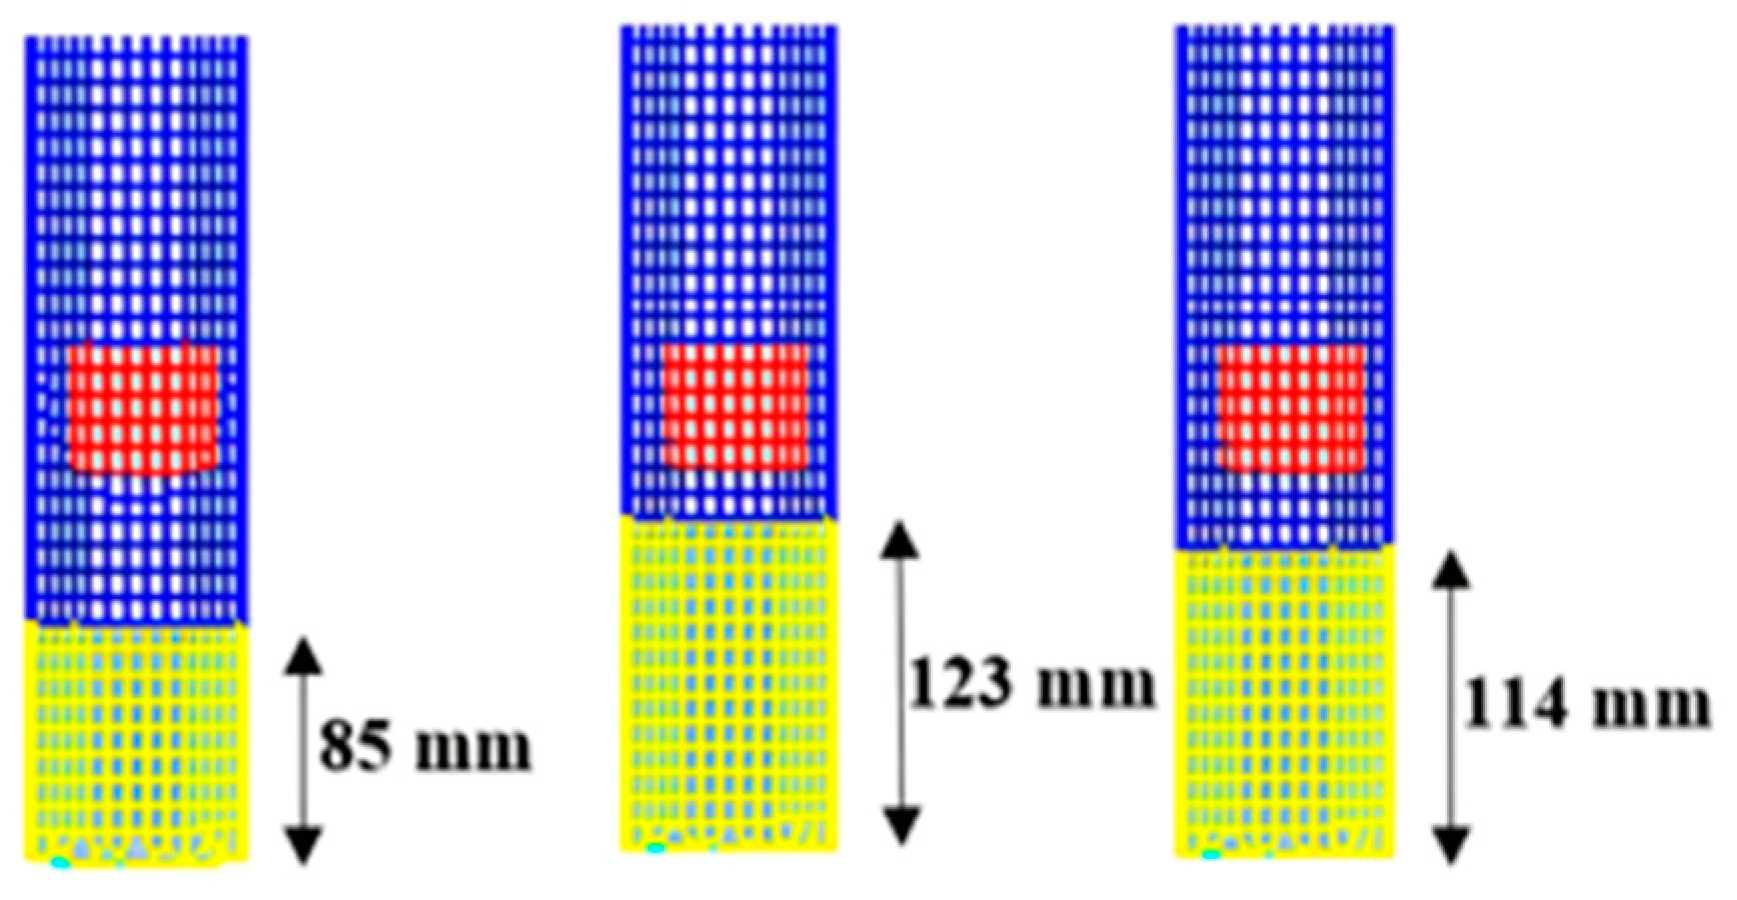
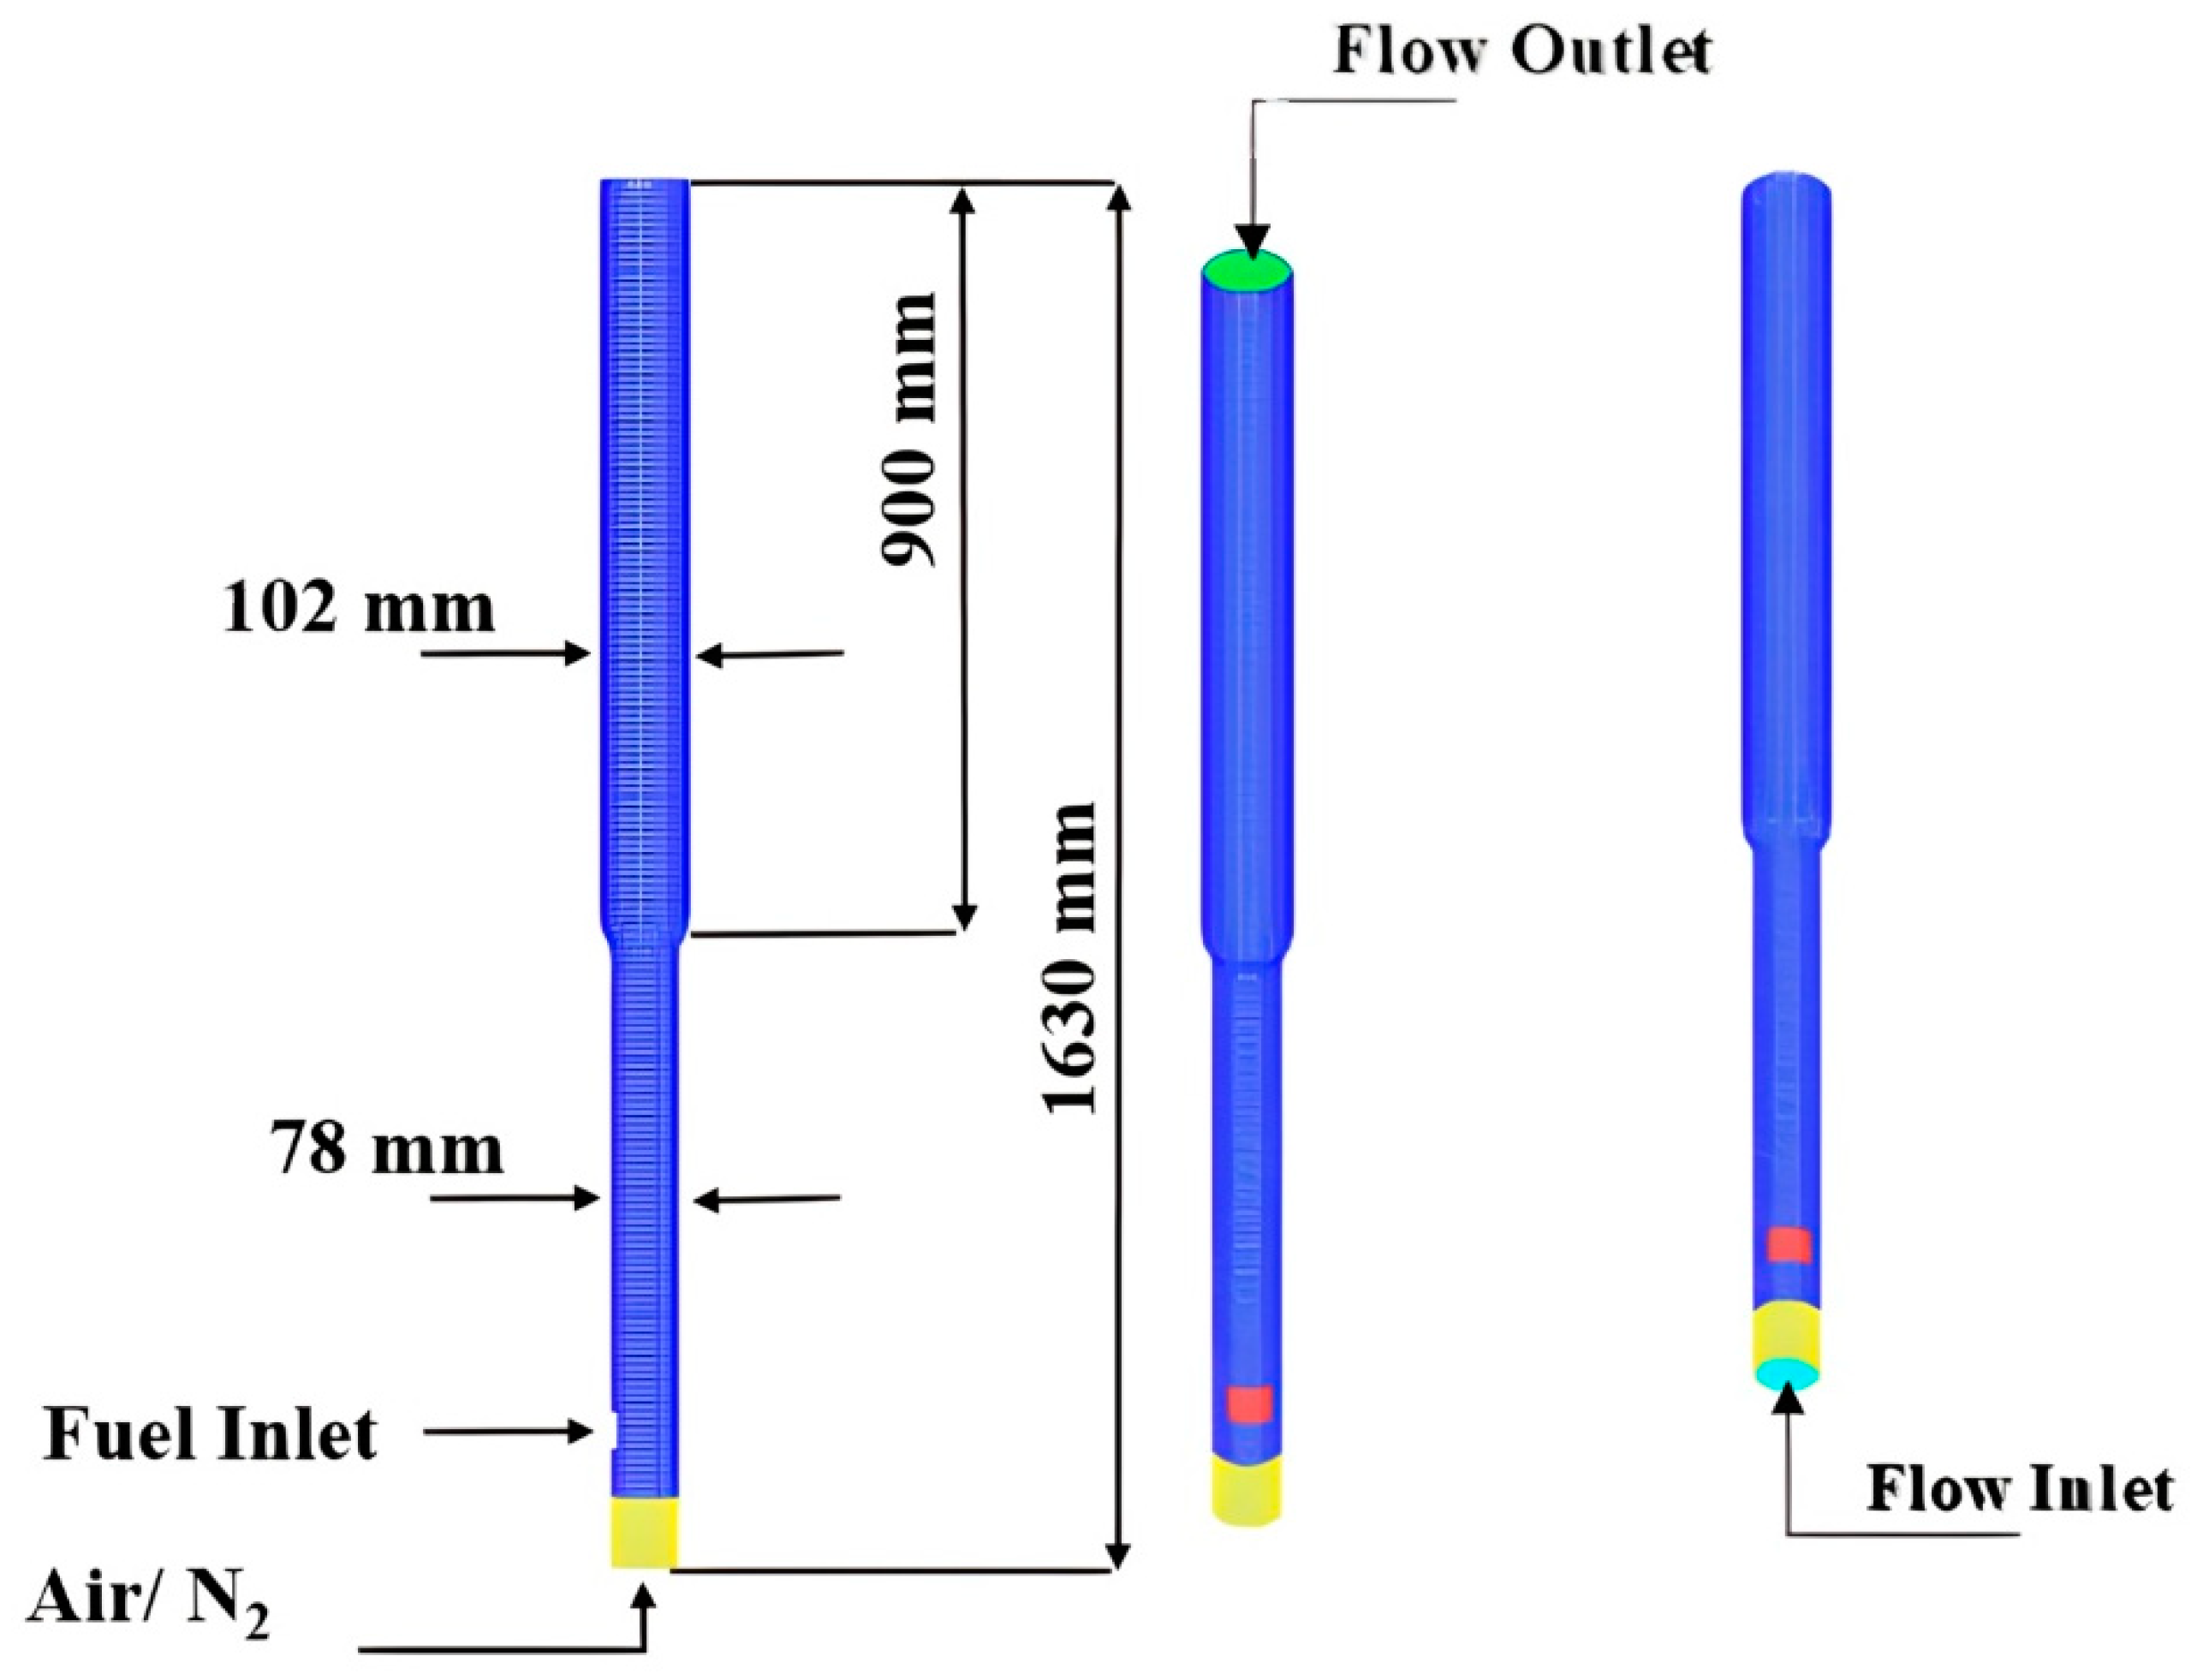
3. Experimental Setup and Grid

The simulation grid is generated by aligning with the fluidized bed reactor used in the experimental analysis conducted by Zhu et al. [30]. Identical dimensions and initial conditions of the empirical study are adopted in the simulation setup to keep the analogy. The model’s validation is carried out by comparing its predictions with the experimental results of species release at the top of the reactor for the co-gasification of Beechwood and LDPE.
A conically spouted lab scale cylindrical grid is generated based on the experiment setup shown in Figure 2. Bed height is adjusted for three distinct bed materials according to their specified densities mentioned in Table 3 keeping 1 kg of a constant amount of bed material for every run. The selected particle size for each bed material examined in the numerical analysis is 0.5 mm, which is consistent with the experimental conditions. Figure 3 depicts the varying heights of the beds based on the density of the bed material.
A mixture of Beechwood and LDPE is fed into the reactor through the fuel inlet for all runs with a 1:1 ratio, maintaining a total fuel feeding rate of 400 g/h. Solid particle density is modelled by considering bed material density, moisture density, dry wood density, and char density. Thermochemical properties of Beechwood and LDPE are factored in the calculation of the airflow rate according to the equivalence ratio of 0.27 provided by Zhu et al. [20,30]. Air and N2 are supplied from the bottom of the reactor throughout the simulation.
Air is fed at a constant velocity of 0.03 m/s for every run and N2 was also fed at a rate of 10 mL/min from the bottom of the reactor. The mesh was generated by AVL Fire workflow manager hybrid assistance as illustrated in Figure 4 and this identical mesh was used for all 3 simulations. To assess the accuracy of the model, species concentrations at equilibrium are compared with the experimental findings by taking a cross-sectional cut located 50 mm below the top of the reactor.
Conventional CFD practice of the SIMPLE algorithm is used for pressure velocity correction [60]. Non-slip boundary conditions are applied for the solid phase and standard log law is used for the gas phase. A time step of 0.01 s is used for all the simulations for a run time of 1800 s.

4. Results and Discussion

The primary objective of this study is to compare the numerical results of synthesis gas concentrations resulting from the Beechwood and LDPE gasification in the fluidized bed reactor for three distinct bed materials with experimental results. Additionally, fluidized bed hydrodynamics, flow, and solid temperatures, fuel conversion parameters are also analyzed in this work. Beechwood and LDPE are supplied to the reactor through the fuel inlet and were modelled in user-defined sub-routines for the solid phase and coupled with the software explicitly. For all three runs, the process reached equilibrium and during the whole process, 100 g each of Beechwood and LDPE were fluidized.
The model results of species concentrations were subjected to quantitative validation against the experimental analysis conducted by Zhu et al. [30]. Validation was conducted specifically for H2, CO2, CO, and CH4 concentrations, comparing the corresponding values obtained from the experiment.
Furthermore, the species concentrations attaining equilibrium are also analyzed in this paper. The bubble growth and solid bed hydrodynamics are qualitatively compared with the 3D numerical model for the fluidized bed developed.

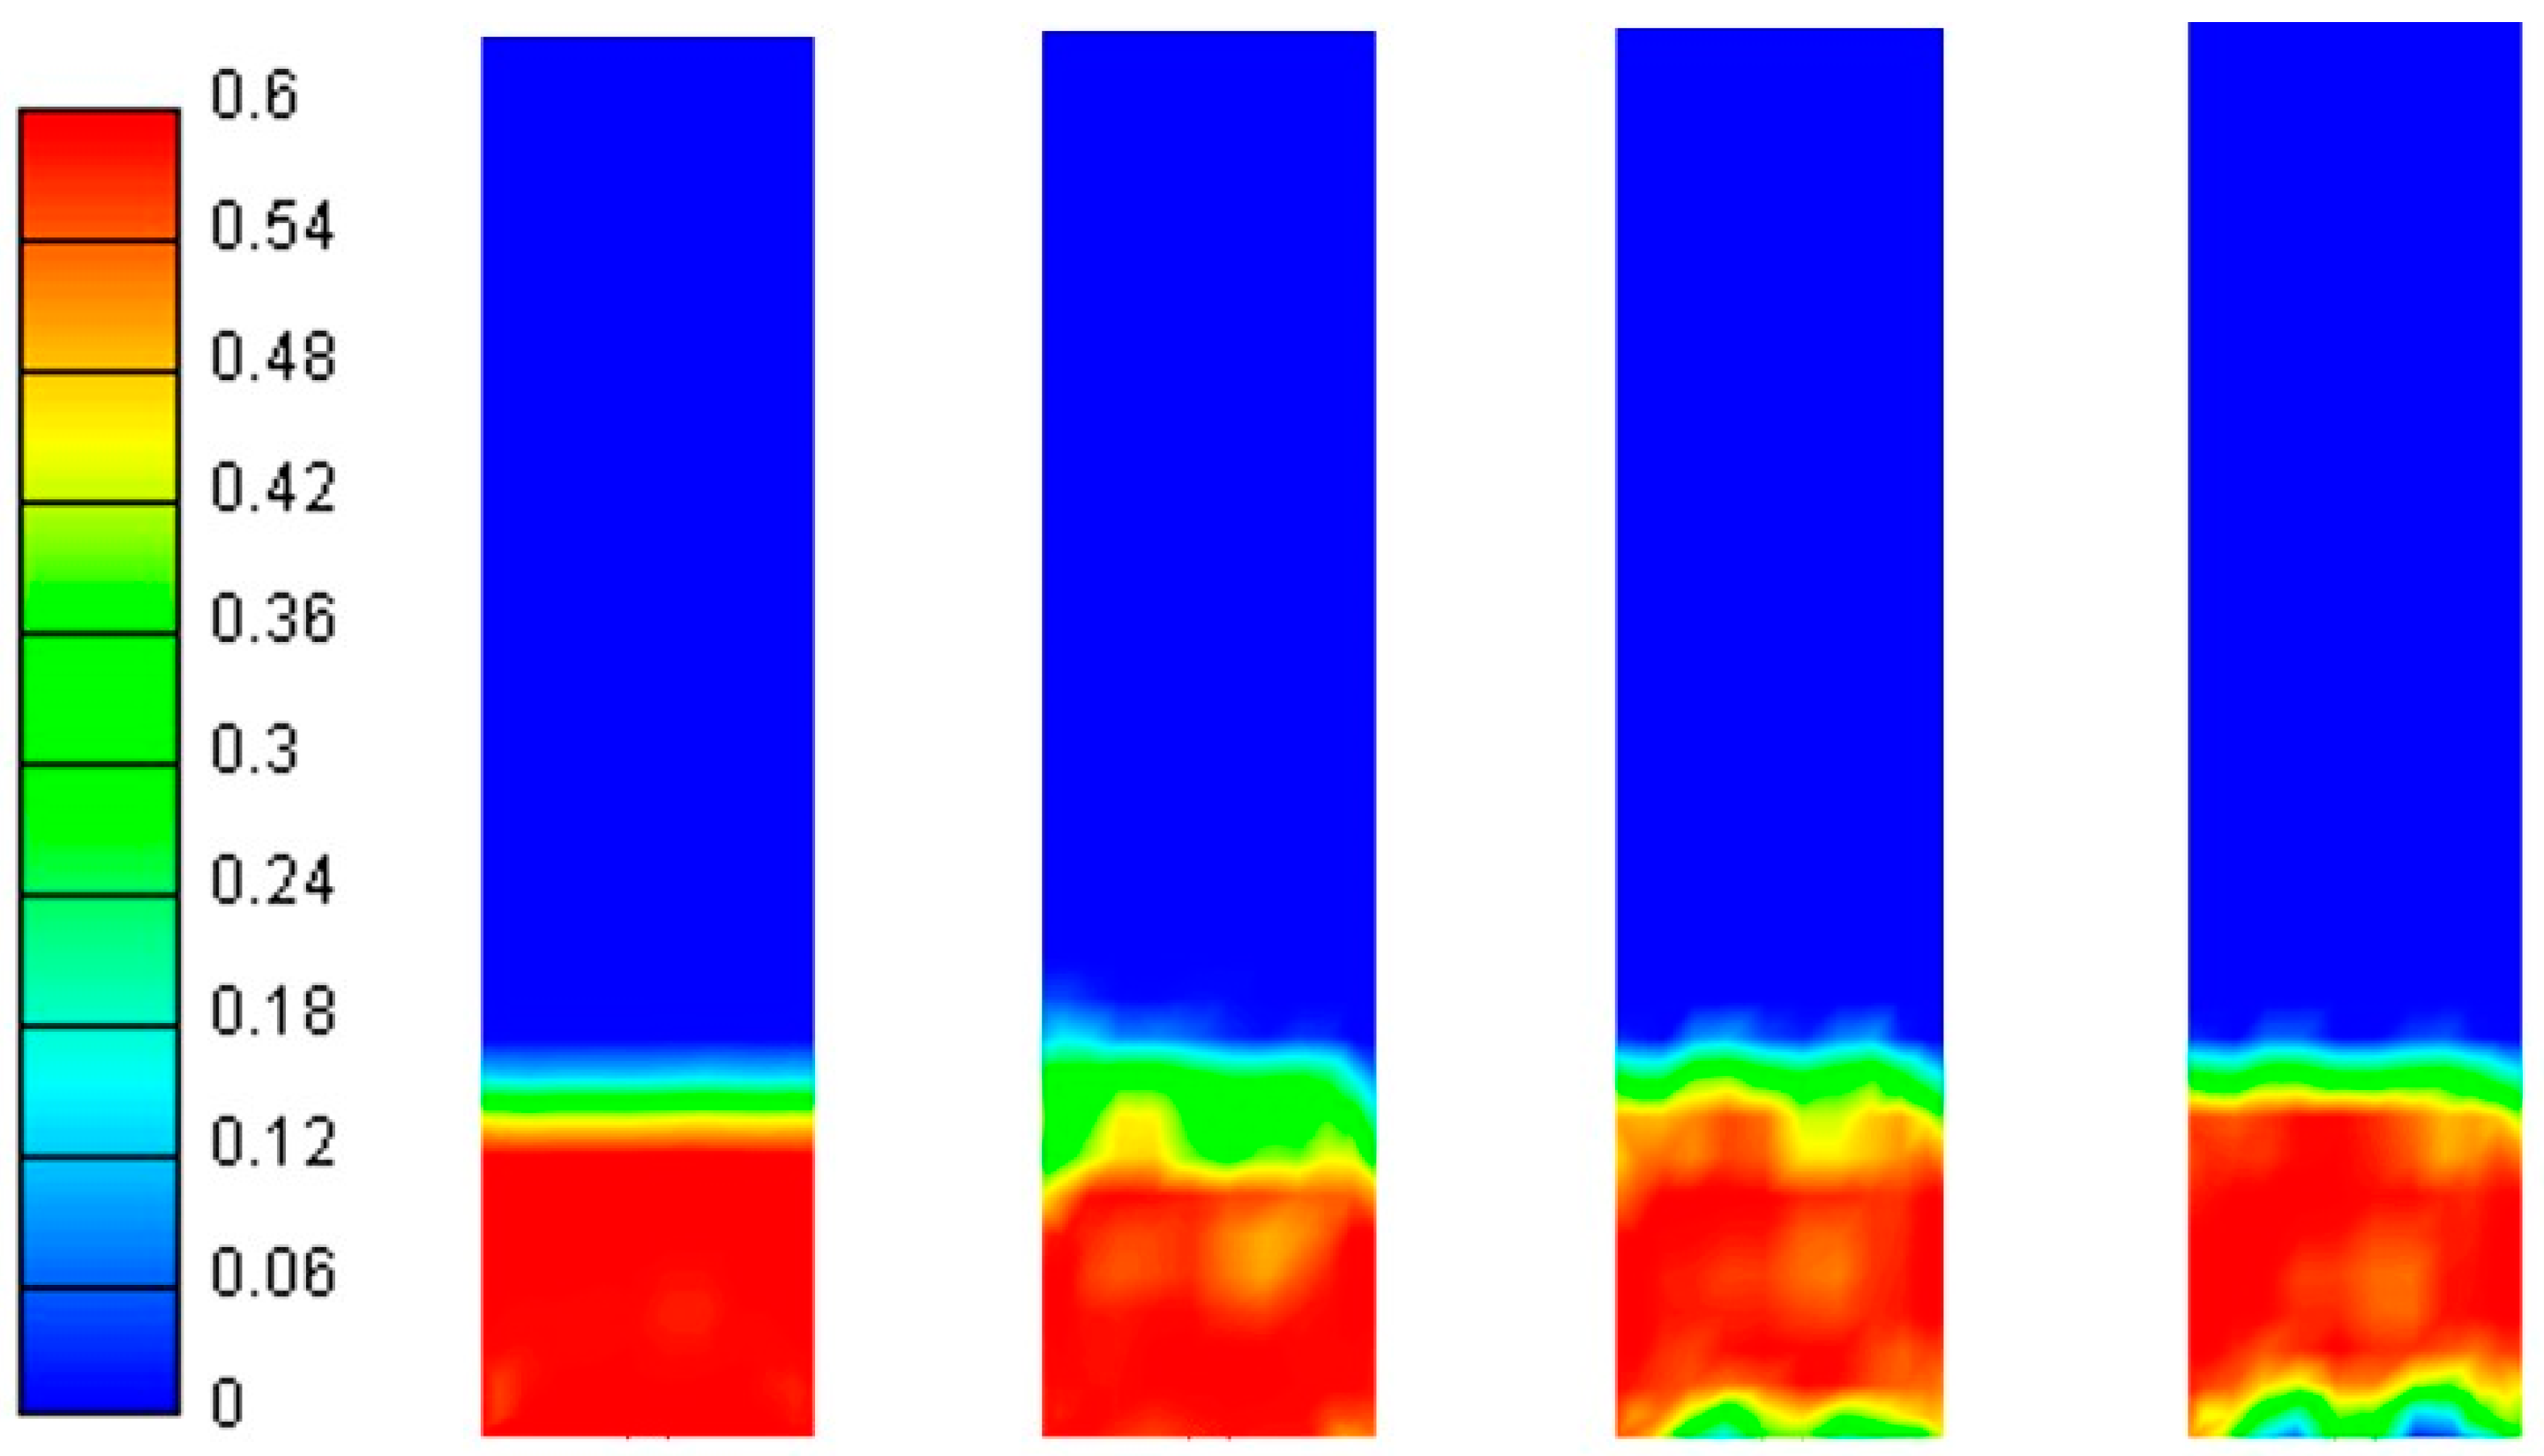
4.1. Solid Bed Hydrodynamics

Figure 5 represents the bubble growth of silica bed material simulations. The only variable affecting the bubble growth of these three runs is particle density as all the other factors such as flow velocity, and particle diameter are constant.
Bubbles form from the bottom of the solid bed and come toward the top of the bed while growing in size until the bubbles’ buoyancy force is higher than the solid drag force. Buoyancy force increases with increasing the bubble diameter and bubbles come to the surface of the solid bed and explode. This scenario keeps repeating in the fluidized bed reactor to ensure a good fuel mixing capability for better combustion. Solid particles tend to move as the bubble rises and therefore, lesser solid fraction regions are created. This hydrodynamics behavior is similar to the bubbling fluidized bed bubble formation according to studies conducted by many researchers [61,62].

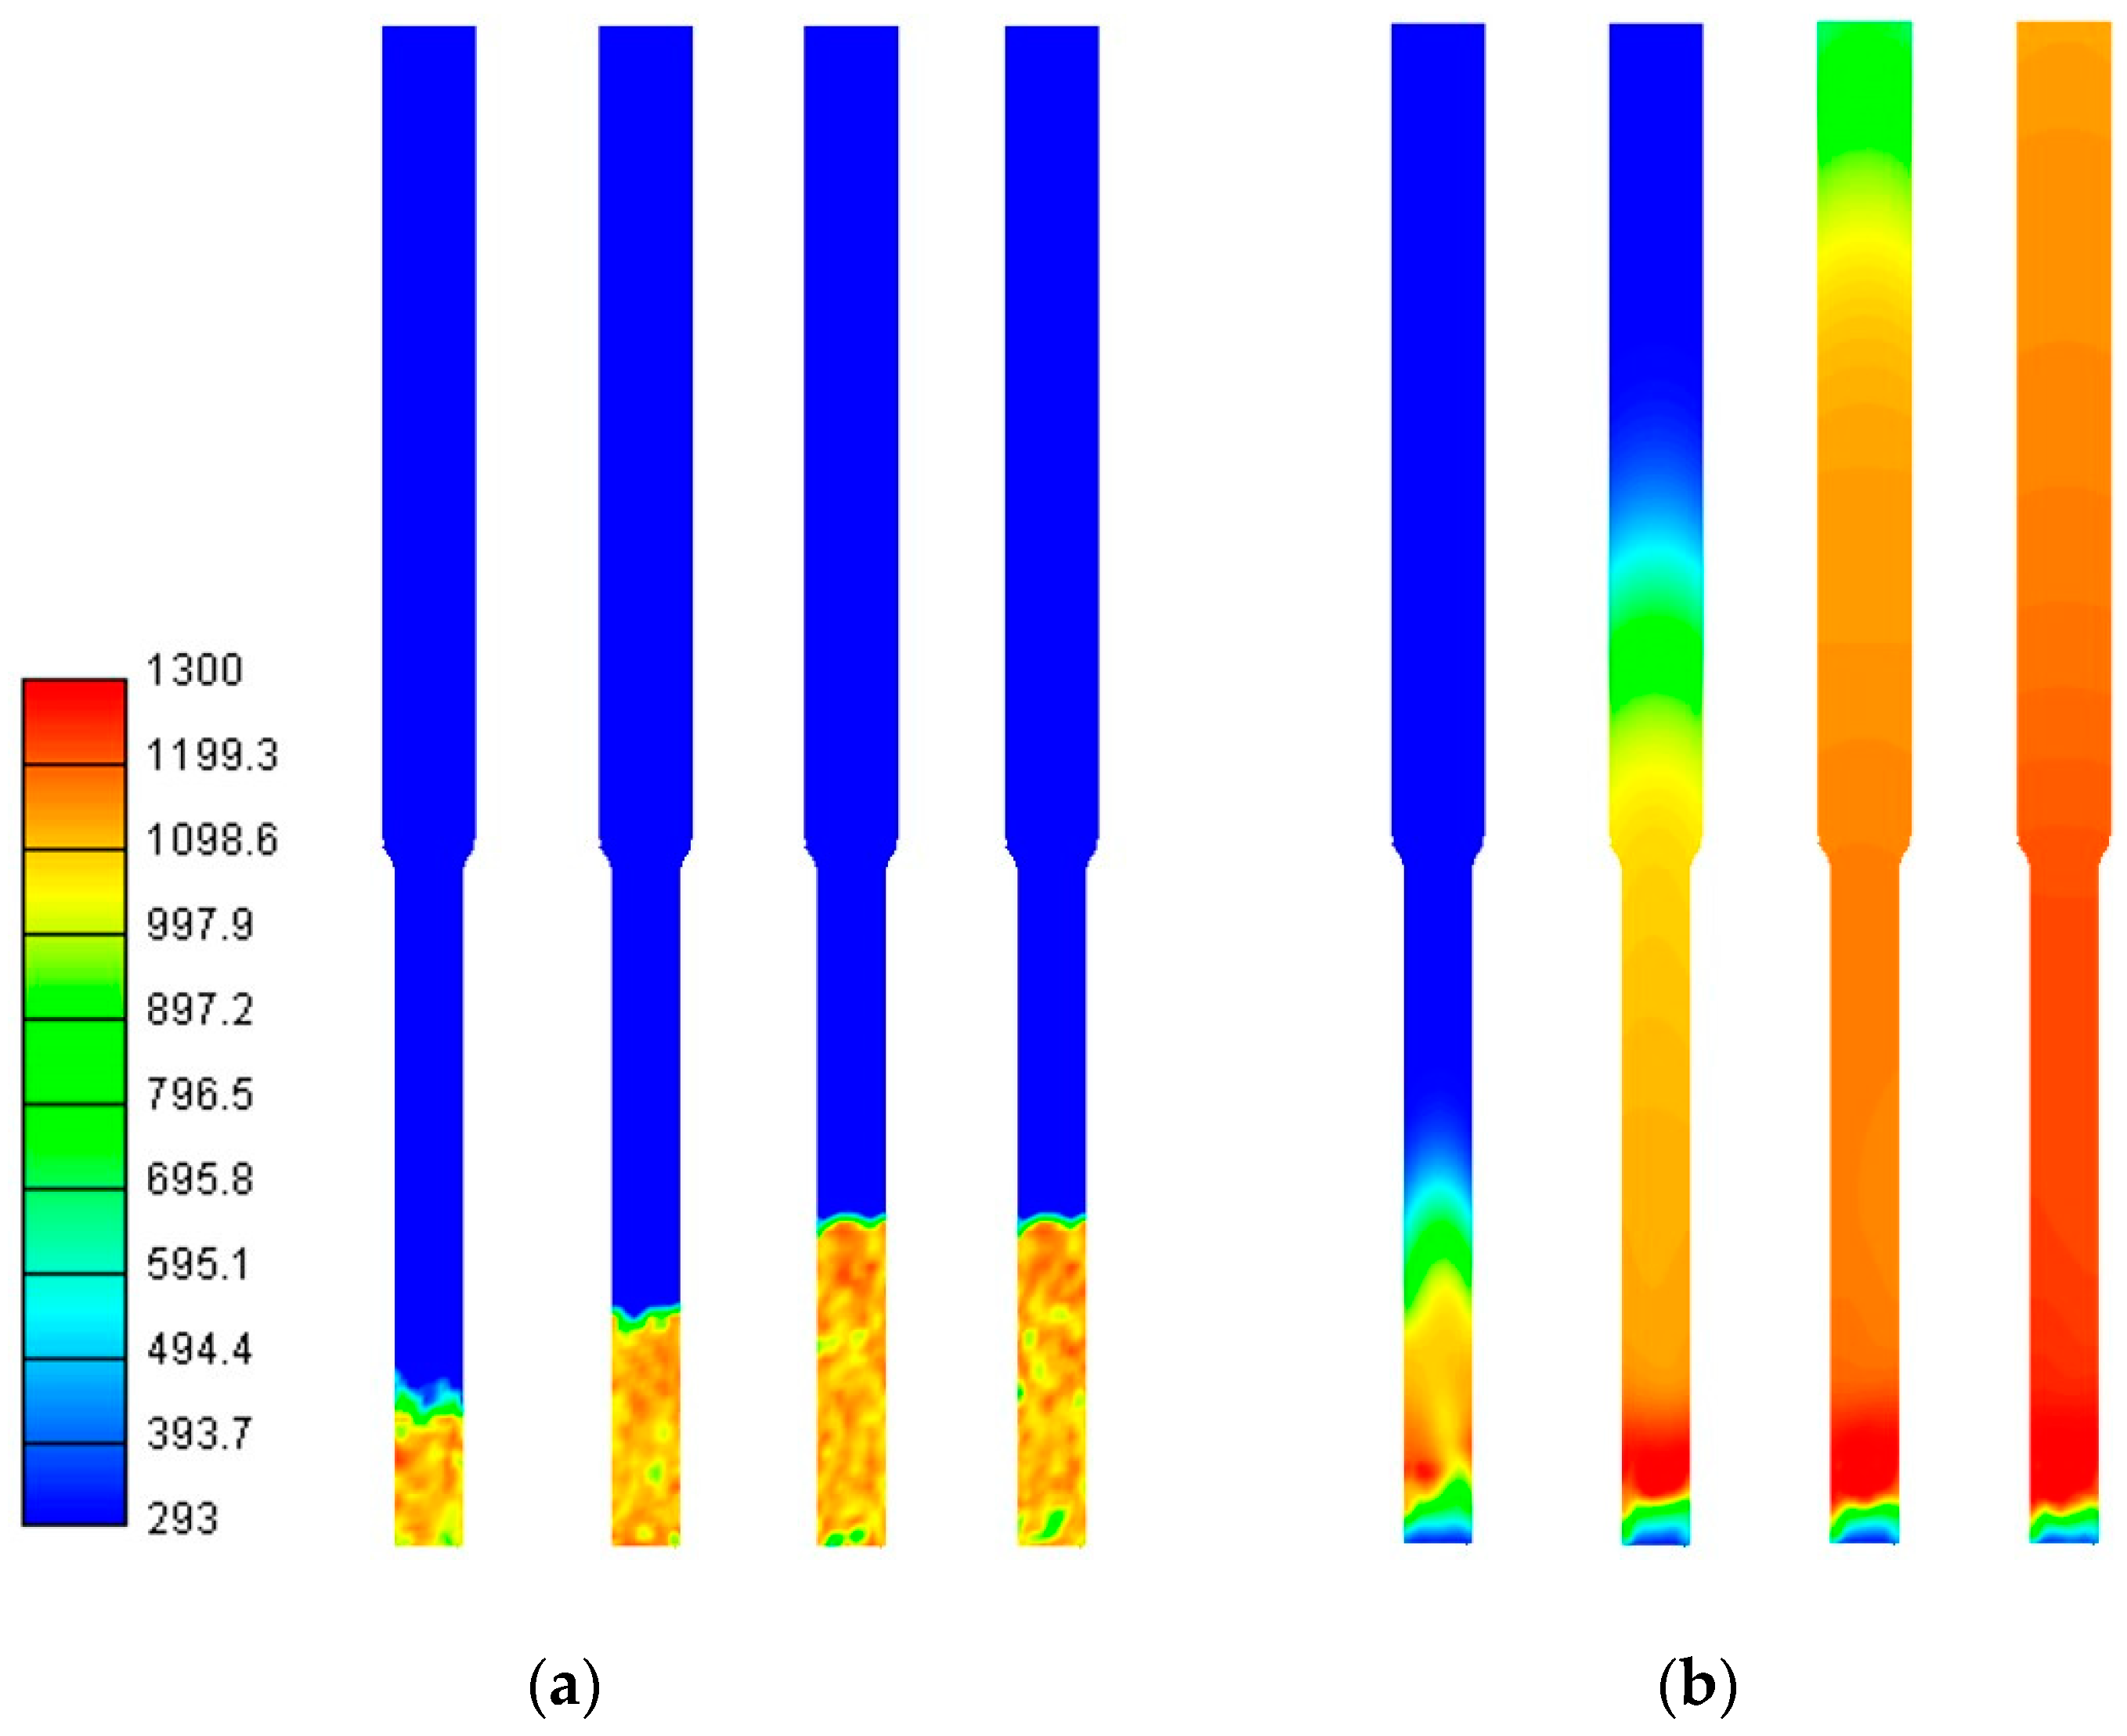
4.2. Solid and Gas Temperature Distribution

Initially, solid temperature can only be observed in the bed region, but as time progresses, solid temperature expands to the emulsion phase. Figure 6a illustrates the upward expansion of solid temperature in the fluidized bed reactor. Despite the solid temperature spreading to the emulsion phase, the solid fraction in the emulsion phase remains below 0.0001. Therefore, the solid temperature in those areas can be negated.
The solid temperature around the fuel inlet is higher with a maximum temperature of 1373 K due to the char combustion reactions of Beechwood taking place. The fuel inlet region is closer to the solid bed region which has a considerable solid volume fraction (>0.2), therefore conduction and radiation heat transfer are elevated in this region. Consequently, heat from the fuel inlet is effectively transferred to the solid bed region and the temperature of the solid bed rises. A similar pattern of solid temperature distribution is observed consistently for all three-bed materials.
Gas temperature exhibits a rise towards the freeboard region over time as depicted in Figure 6b. This temperature elevation is primarily a consequence of convection and radiation. Moreover, gasification reactions occur in the freeboard region and also contribute to the gas temperature behavior in the freeboard. The gas temperature continues to increase until the system reaches a steady state and then fluctuates around 1130 K in the freeboard providing preferred higher gasification temperatures for better syn gas production. These observations are closely aligned with the gas temperature observations for gasification in fluidized beds in some numerical analyses conducted for fluidized beds [63].

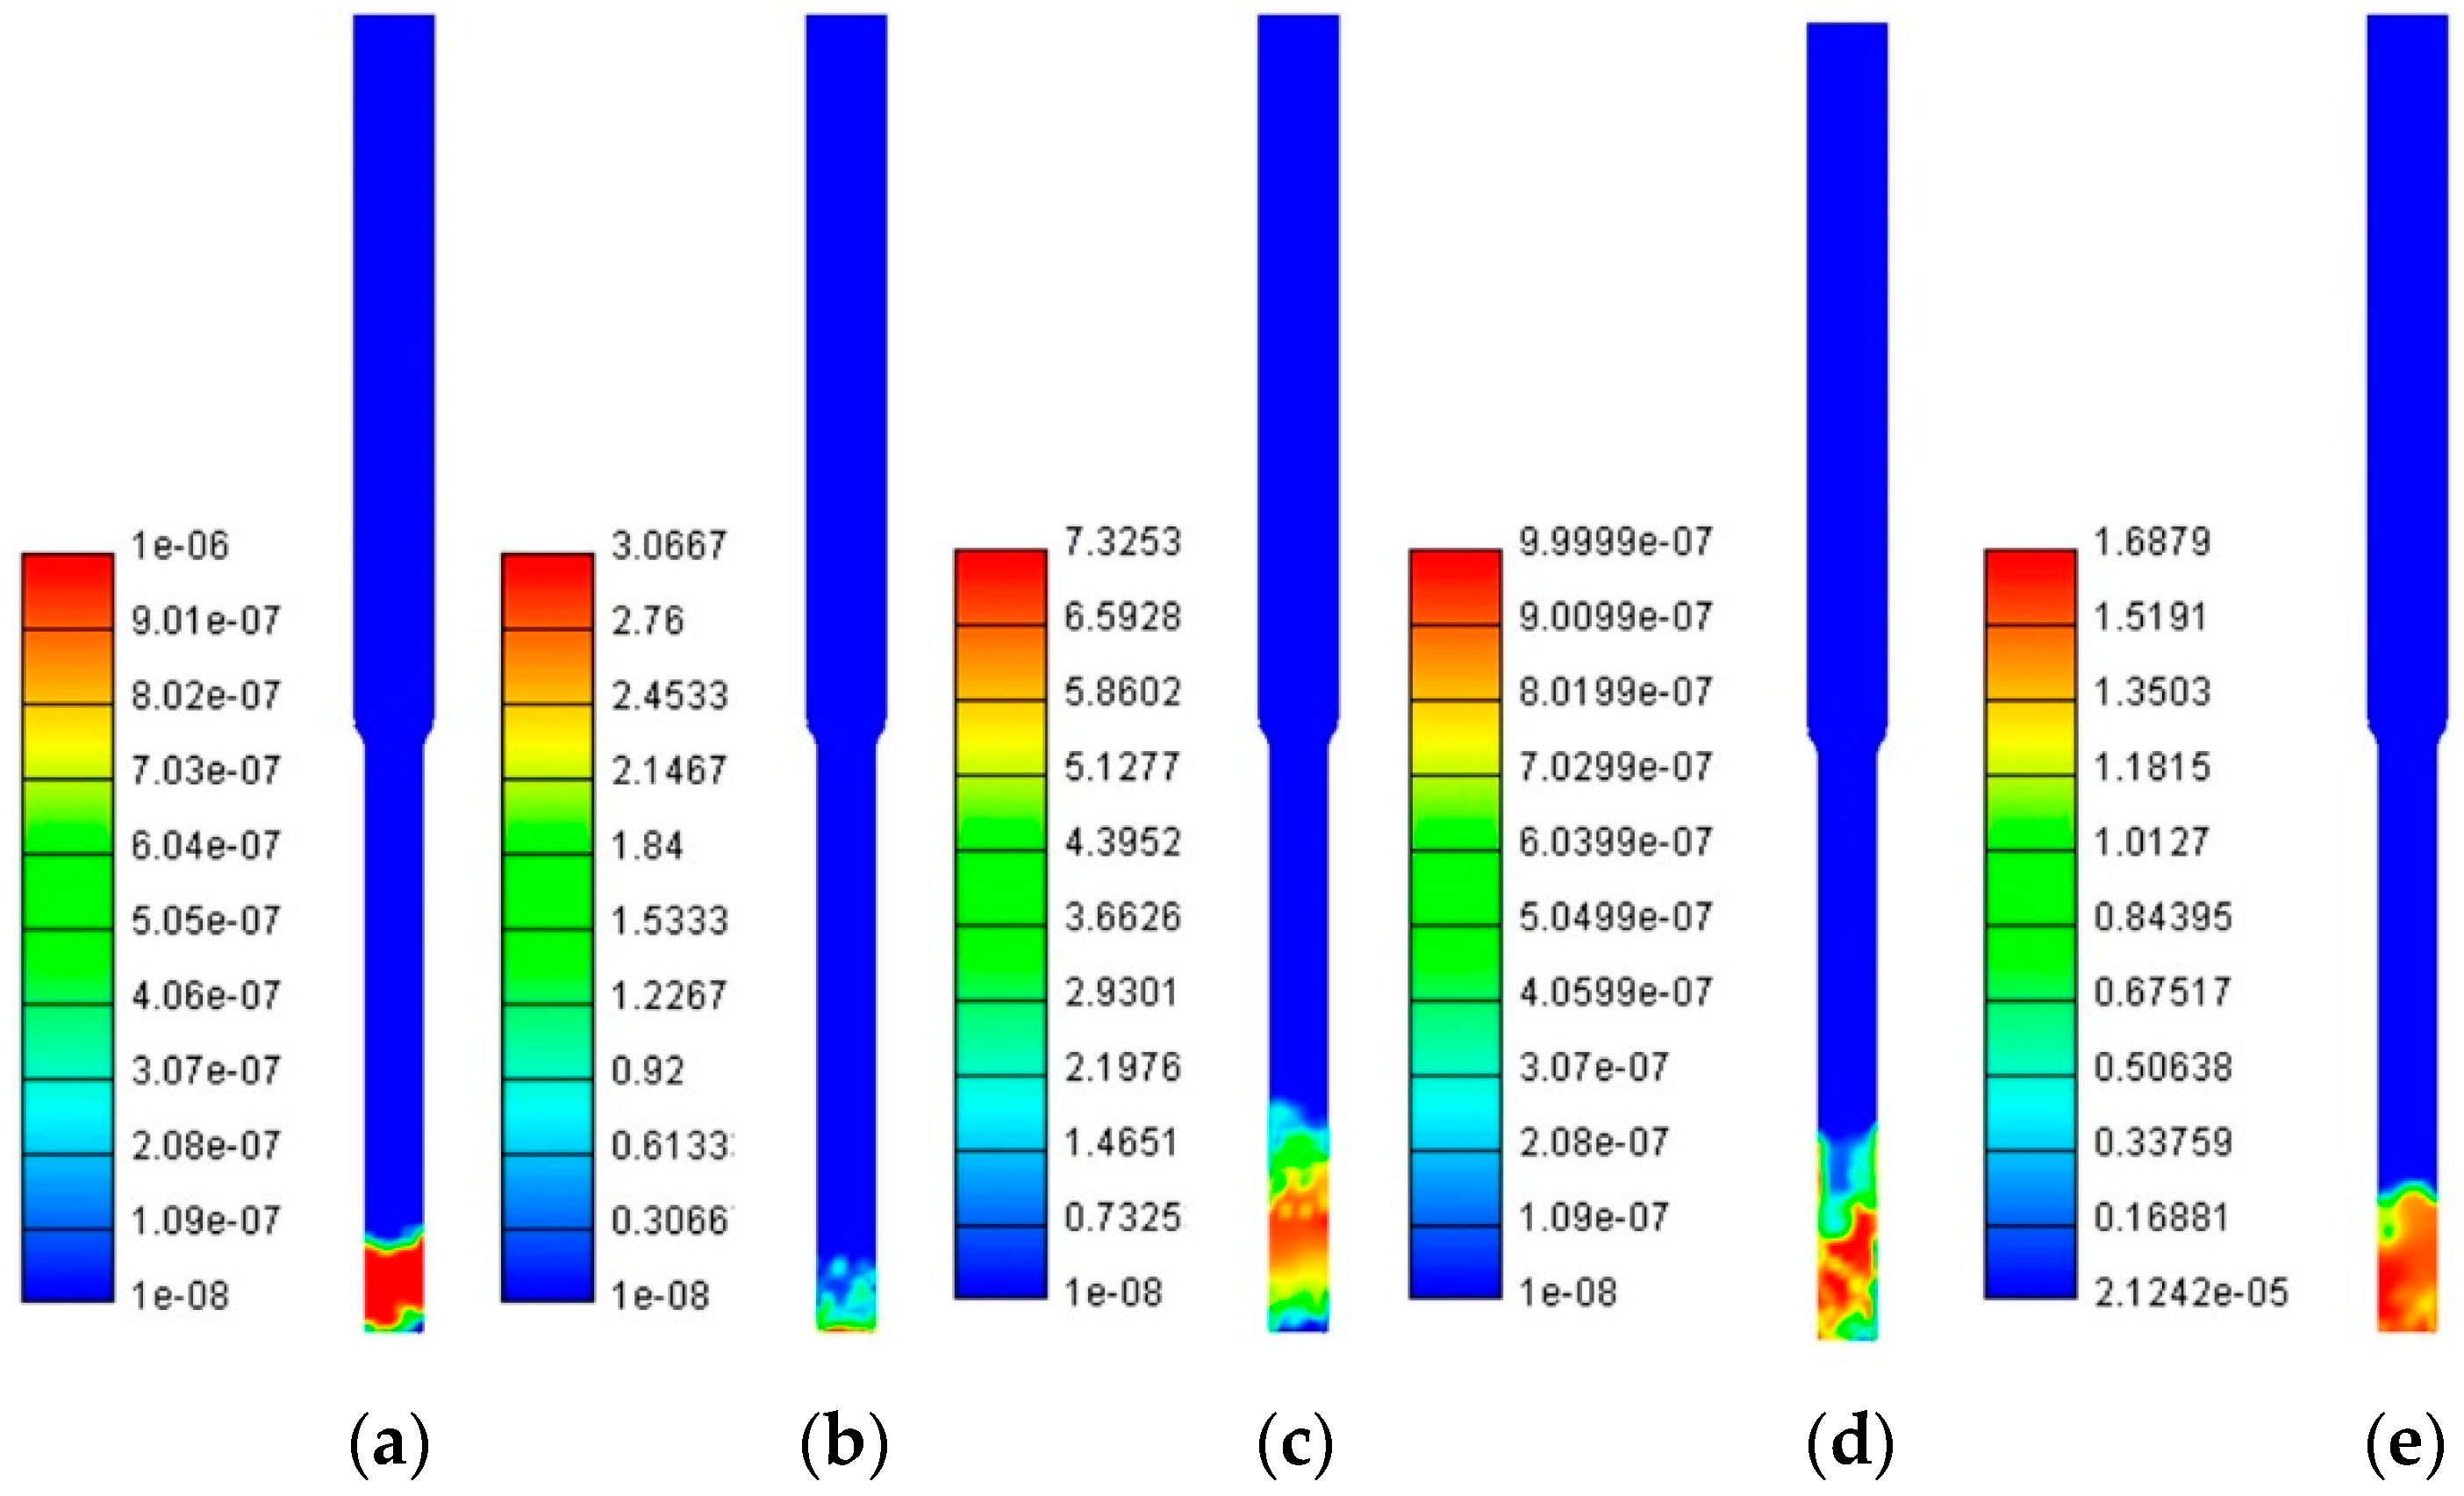
4.3. Fuel Conversion

Fuel conversion is illustrated in Figure 7 displaying the densities of moisture, drywood, char, LDPE, and wax. Moisture content (Figure 7a) from Beechwood evaporates rapidly due to the high bed temperature and low percentage of moisture in the Beechwood fuel ultimate analysis provided in the literature [30]. Further, LDPE does not have moisture in it according to the proximate analysis of the LDPE [30] which can also be attributed to negligible moisture density in the reactor.
Dry wood and the LDPE introduced from the fuel inlet also dry out due to the high solid temperature in the vicinity of the fuel inlet and the low fuel flow rate as illustrated in Figure 7b,d. Another reason for low drywood and LDPE densities can be caused by only 200 g of fuel being co-gasified within the whole run time.
Wax density, a product from LDPE pyrolysis accumulates in the bed over time. Subsequently, the devolatilization of Beechwood and LDPE occurs releasing volatile compounds. The considered volatiles from Beechwood pyrolysis include H2, CO2, CO, and H2O, and volatiles from LDPE pyrolysis include CH4, C2H6, C3H8, and C4H10. The light hydrocarbons produced from LDPE pyrolysis react with O2, H2O, and CO2 in the gasification process. Char density fluctuates in Figure 7c around the fuel inlet as the Beechwood enters from it. This is because the fuel is coming into the reactor continuously generating char according to Equation (22) and consuming the generated char in Equations (14), (16), (18) and (20) R1–R4 char combustion reactions.

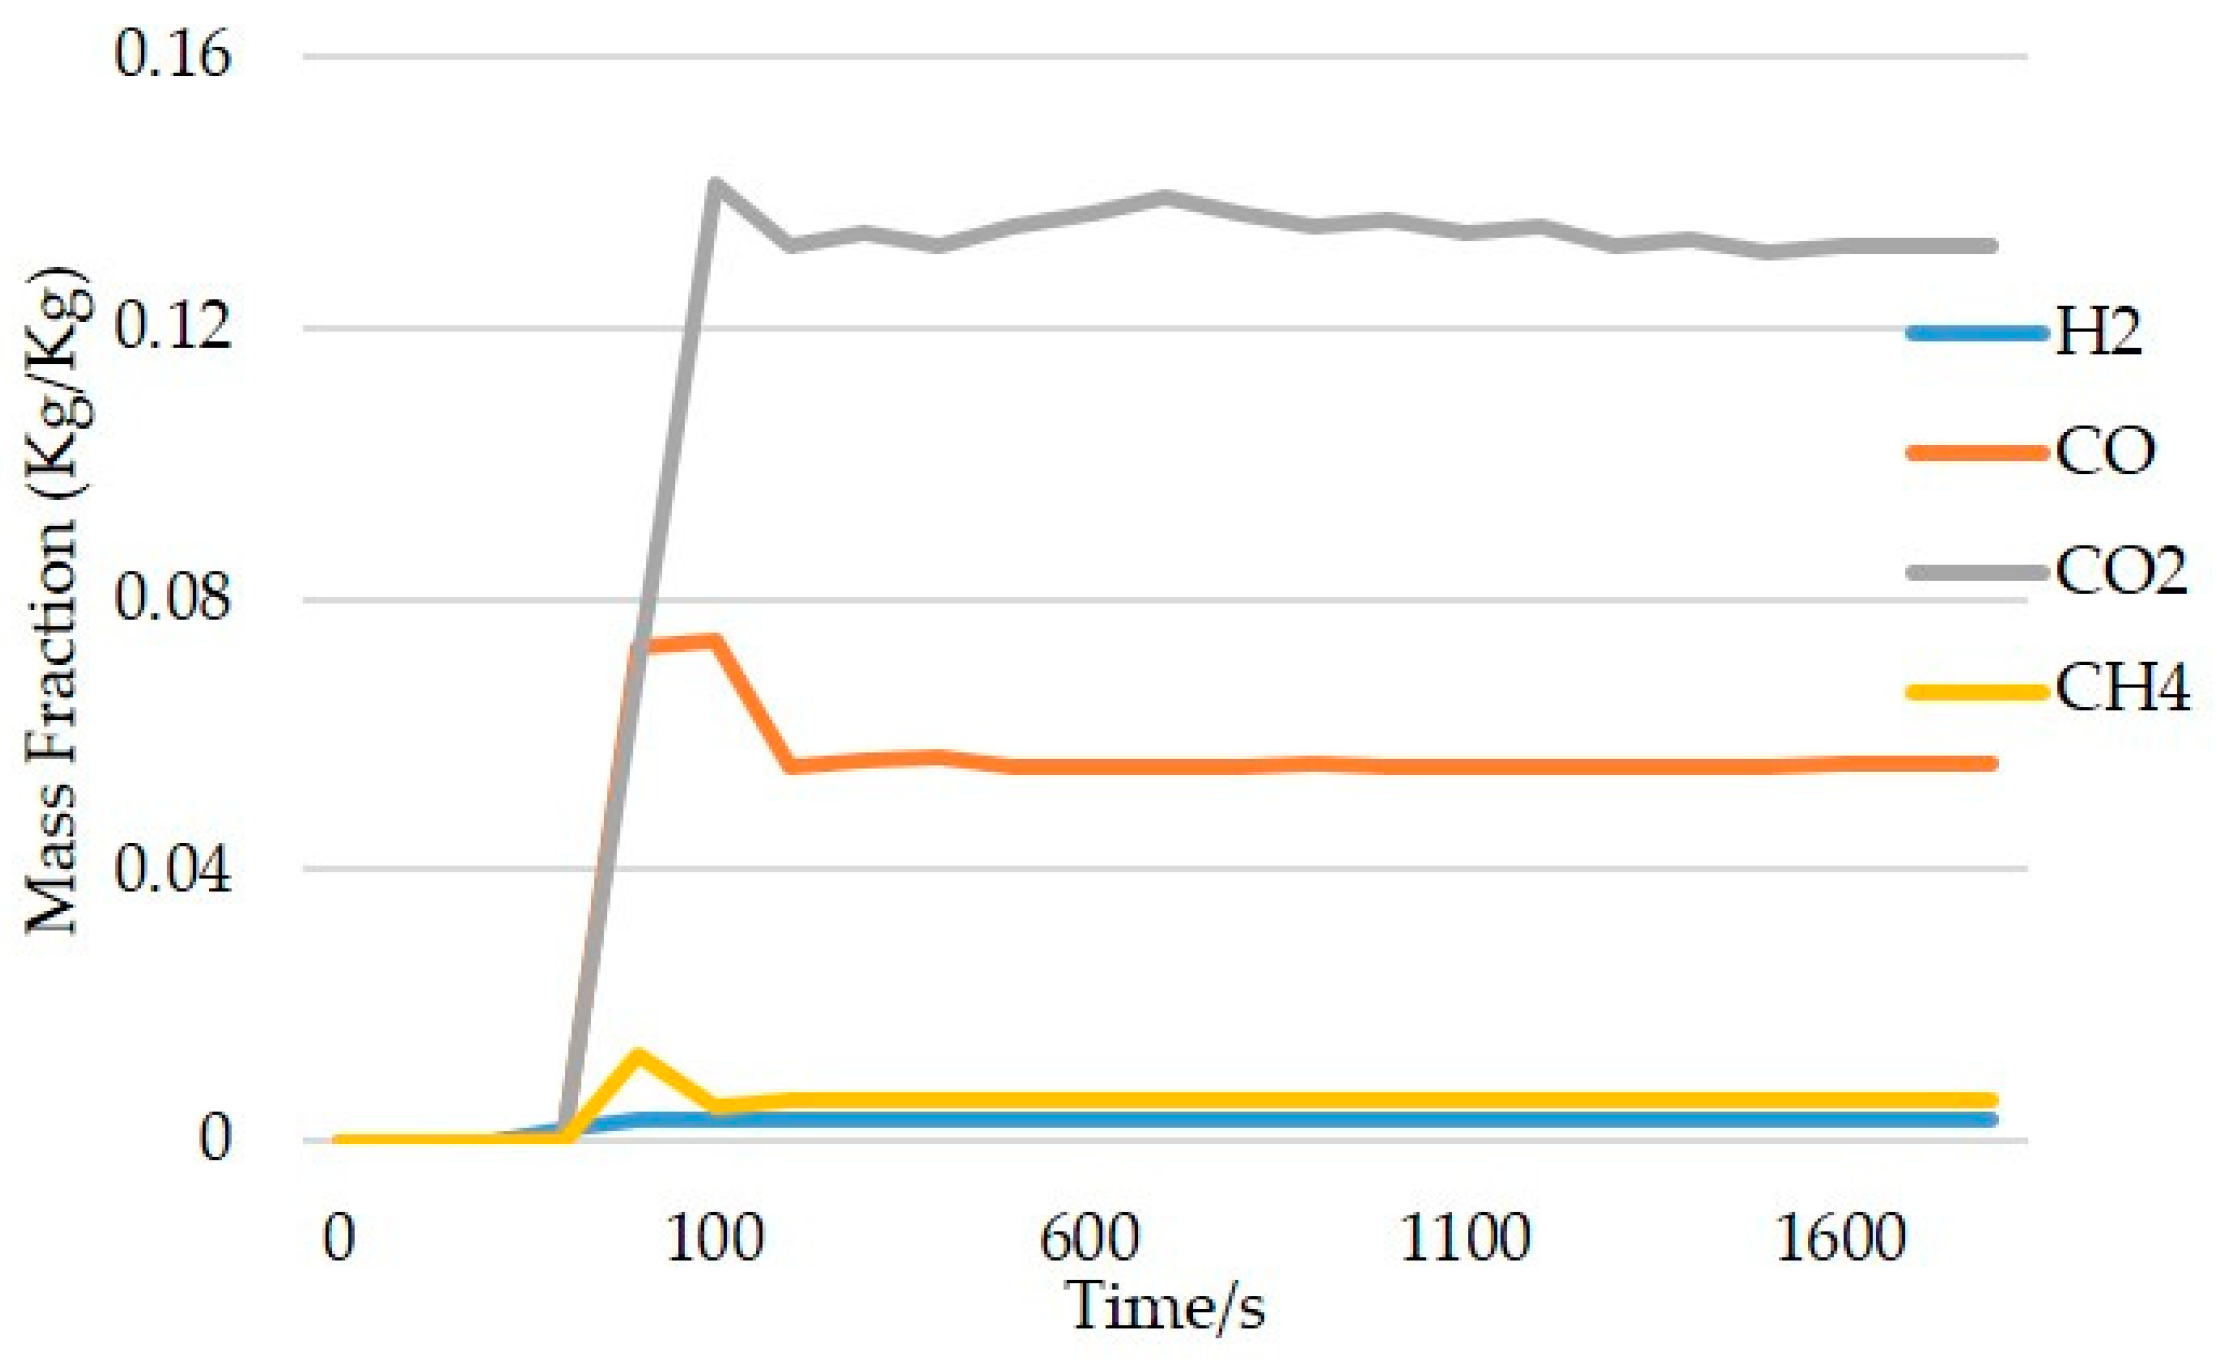
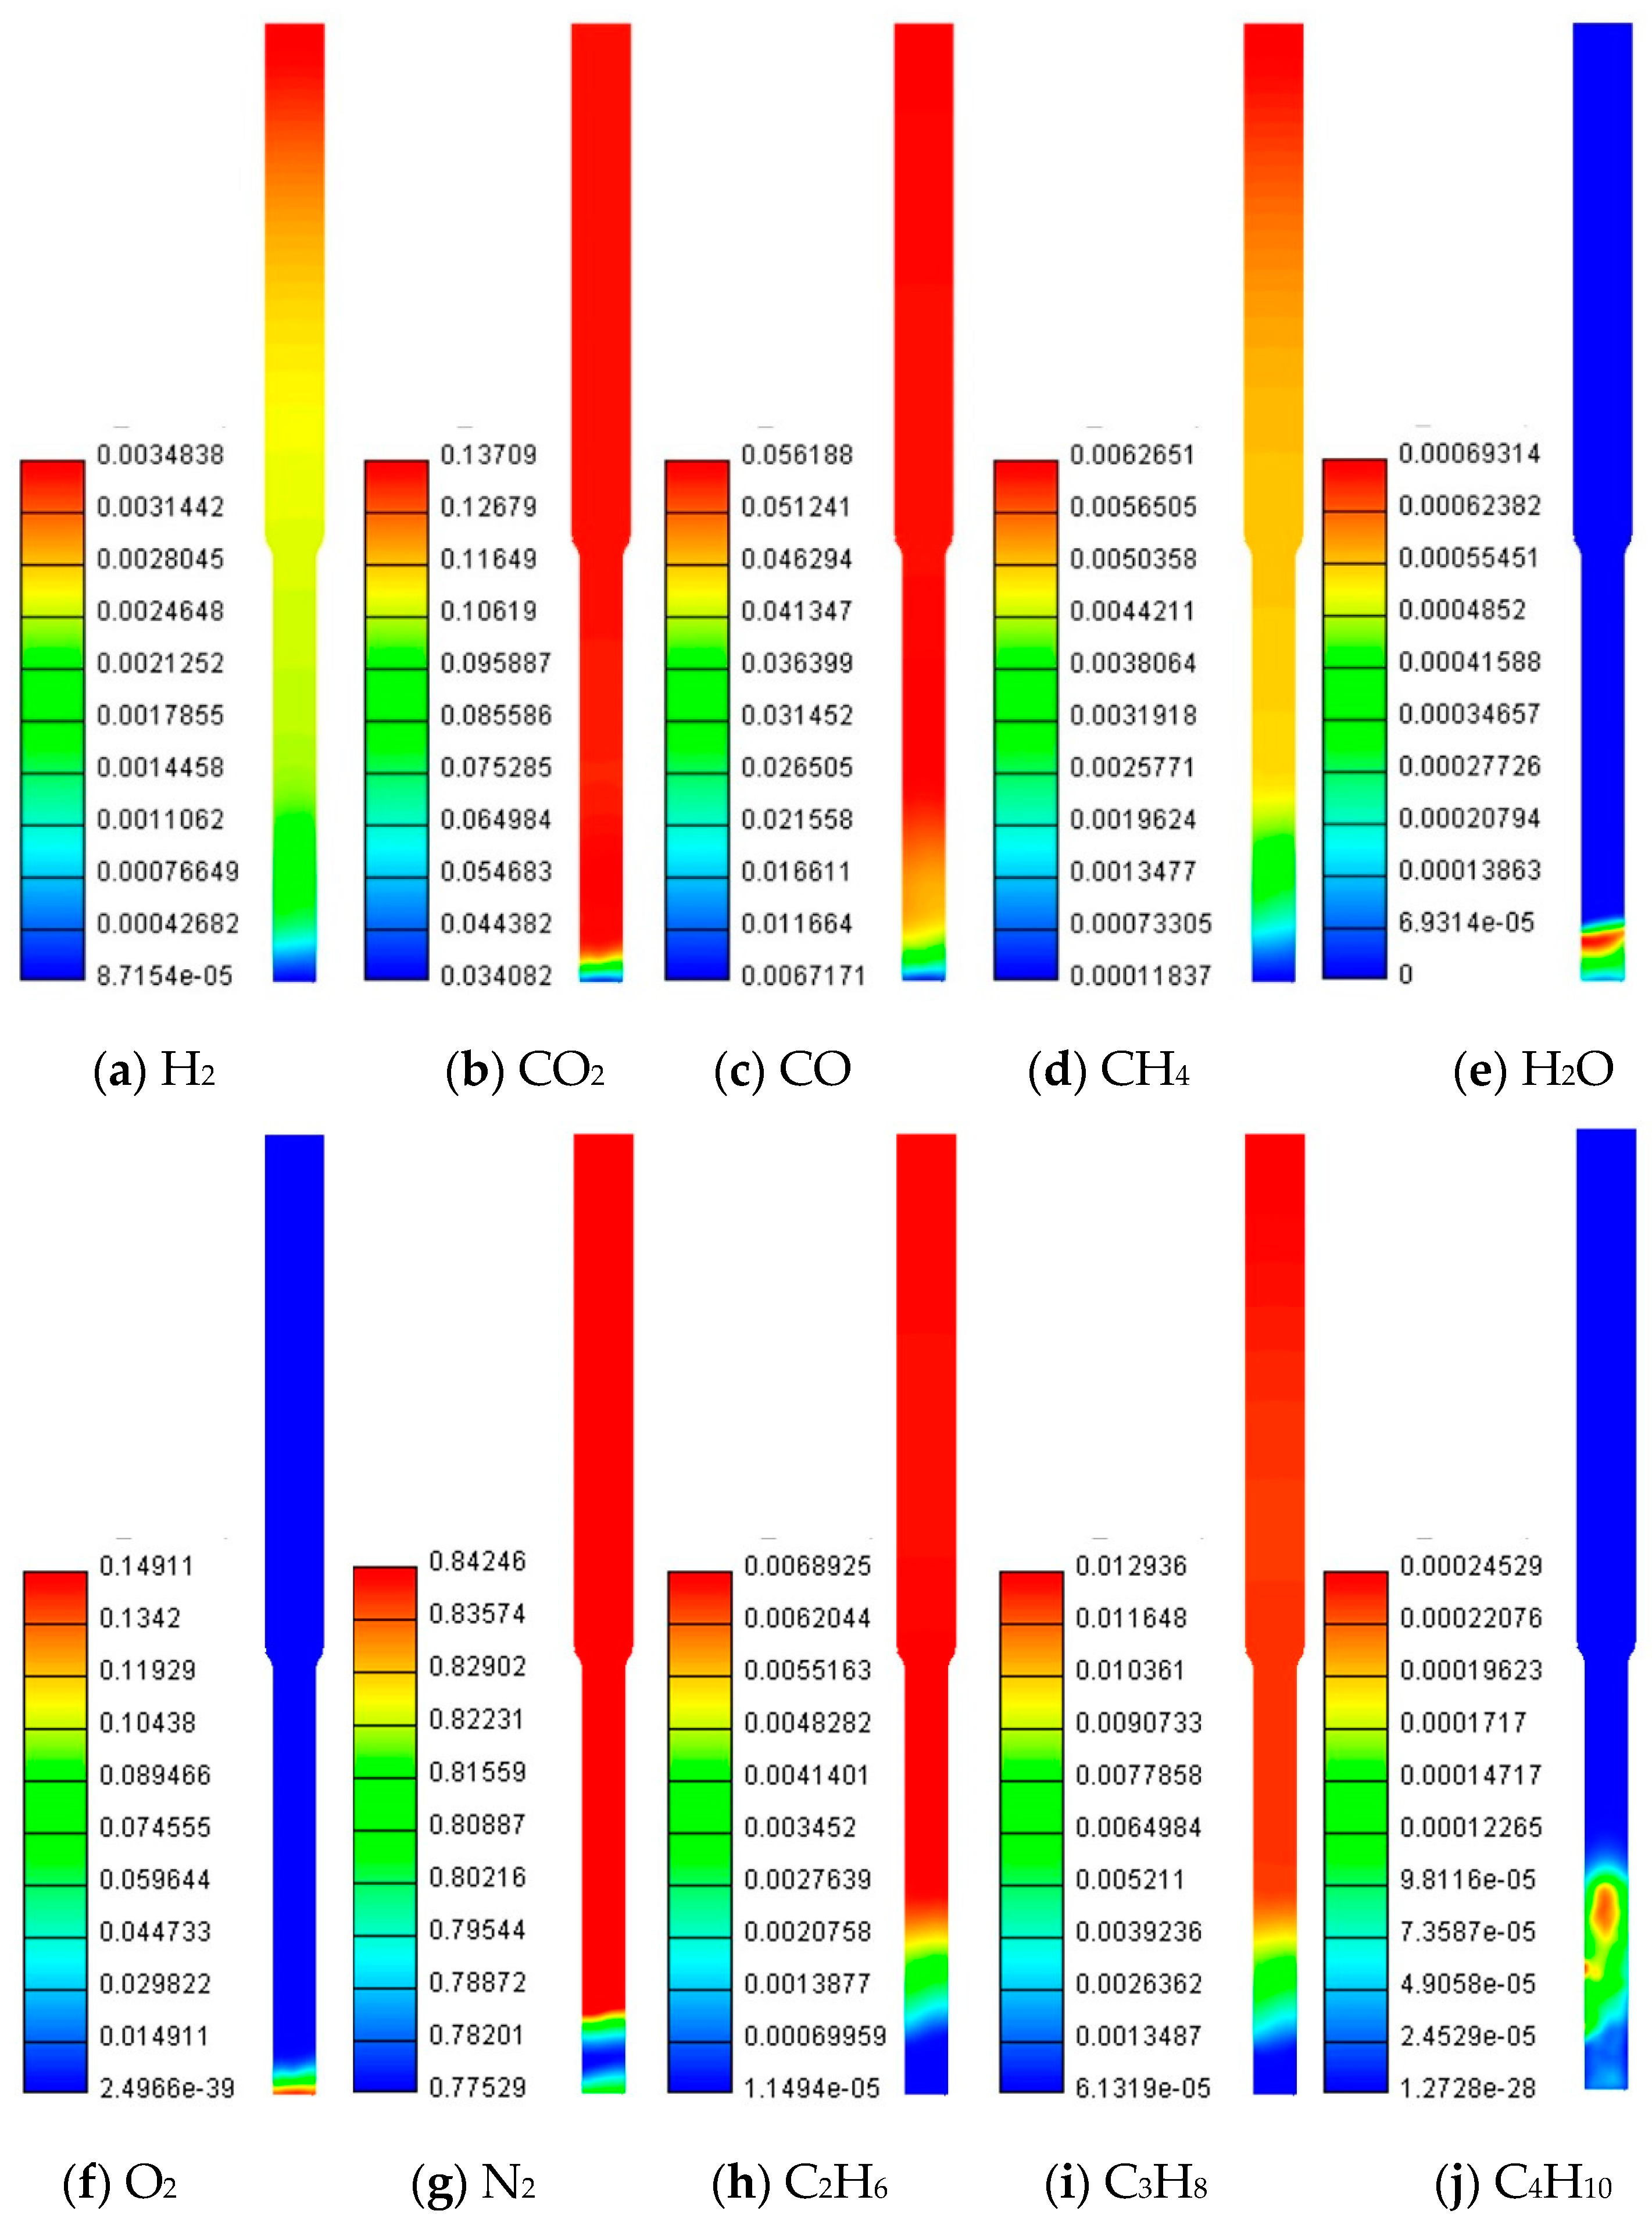
4.4. Equilibrium and Species Concentrations

Volatile release through the outlet of the reactor is stabilized towards the 1800 s for all simulations as observed in the experiments by Zhu et al. [30]. Figure 8 illustrates the mass fraction variation at the outlet of the reactor. Species distribution throughout the reactor at the equilibrium is depicted in Figure 9. In this work, the concentration of light hydrocarbons (C2H6, C3H8, and C4H10) from LDPE pyrolysis was deemed low due to gasification reactions. Despite having considerable mass fraction in Figure 8c,d for C2H6 and C3H8, respectively, the number of moles is low due to high molar mass. Therefore, mole concentrations of H2, CO2, CO, and CH4 are high resulting in similar observations with the experiment.
Initially, 2% of fuel from the total weight of the bed is assumed to start the combustion process. Therefore, the initial rise of the species concentrations at the top outlet of the reactor can be observed. Then after the initial fuel is burned, only the fuel supply from the fuel inlet contributes to the fuel conversion process. Therefore, the concentrations become almost constant while the system achieves equilibrium. These species from LDPE pyrolysis react with H2O, O2 and CO2 and form CO, CO2, and H2 in the gasification process (Equations (26)–(30)).
H2, CO2, CO, and CH4 mass fractions are higher in the freeboard compared to fluidized bed and emulsion phases. It is due to the gasification reactions with light hydrocarbons from LDPE pyrolysis. Even though CO2 reacts with light hydrocarbons and produces H2 and CO, Equation (29), water gas shift reaction also takes place with the H2O molecules produced from light hydrocarbon reactions with oxygen and produce CO2.
CH4 mass fraction is high relative to other light hydrocarbons due to the gasification reaction with char reaction (Equation (20)). However, the concentration of CH4 is lower than H2, CO2, and CO because the heterogeneous kinetic reaction rate (Equation (20)) of the methanation reaction is low compared to Equation (14), Equation (16), and Equation (18).
Syn gas at the outlet of the reactor compared to the bed region is rich in hydrogen at the equilibrium as gasification reactions of water–gas shift reaction (Equation (26)) and steam methane reforming reaction (Equation (27)) take place in the freeboard. Further, H2 is consumed by char around the fuel inlet and reduces H2 concentration. Due to Equations (26) and (29) H2O concentration at the equilibrium is only considerable in the bed region and decreases when it reaches to freeboard.
O2 concentration in the other regions except the bottom of the reactor is negligible. This can be attributed to a low reduced environment by lowering the equivalence ratio. N2 does not participate in any reactions total amount of N2 fed from the bottom of the reactor flows out from the top outlet of the reactor.

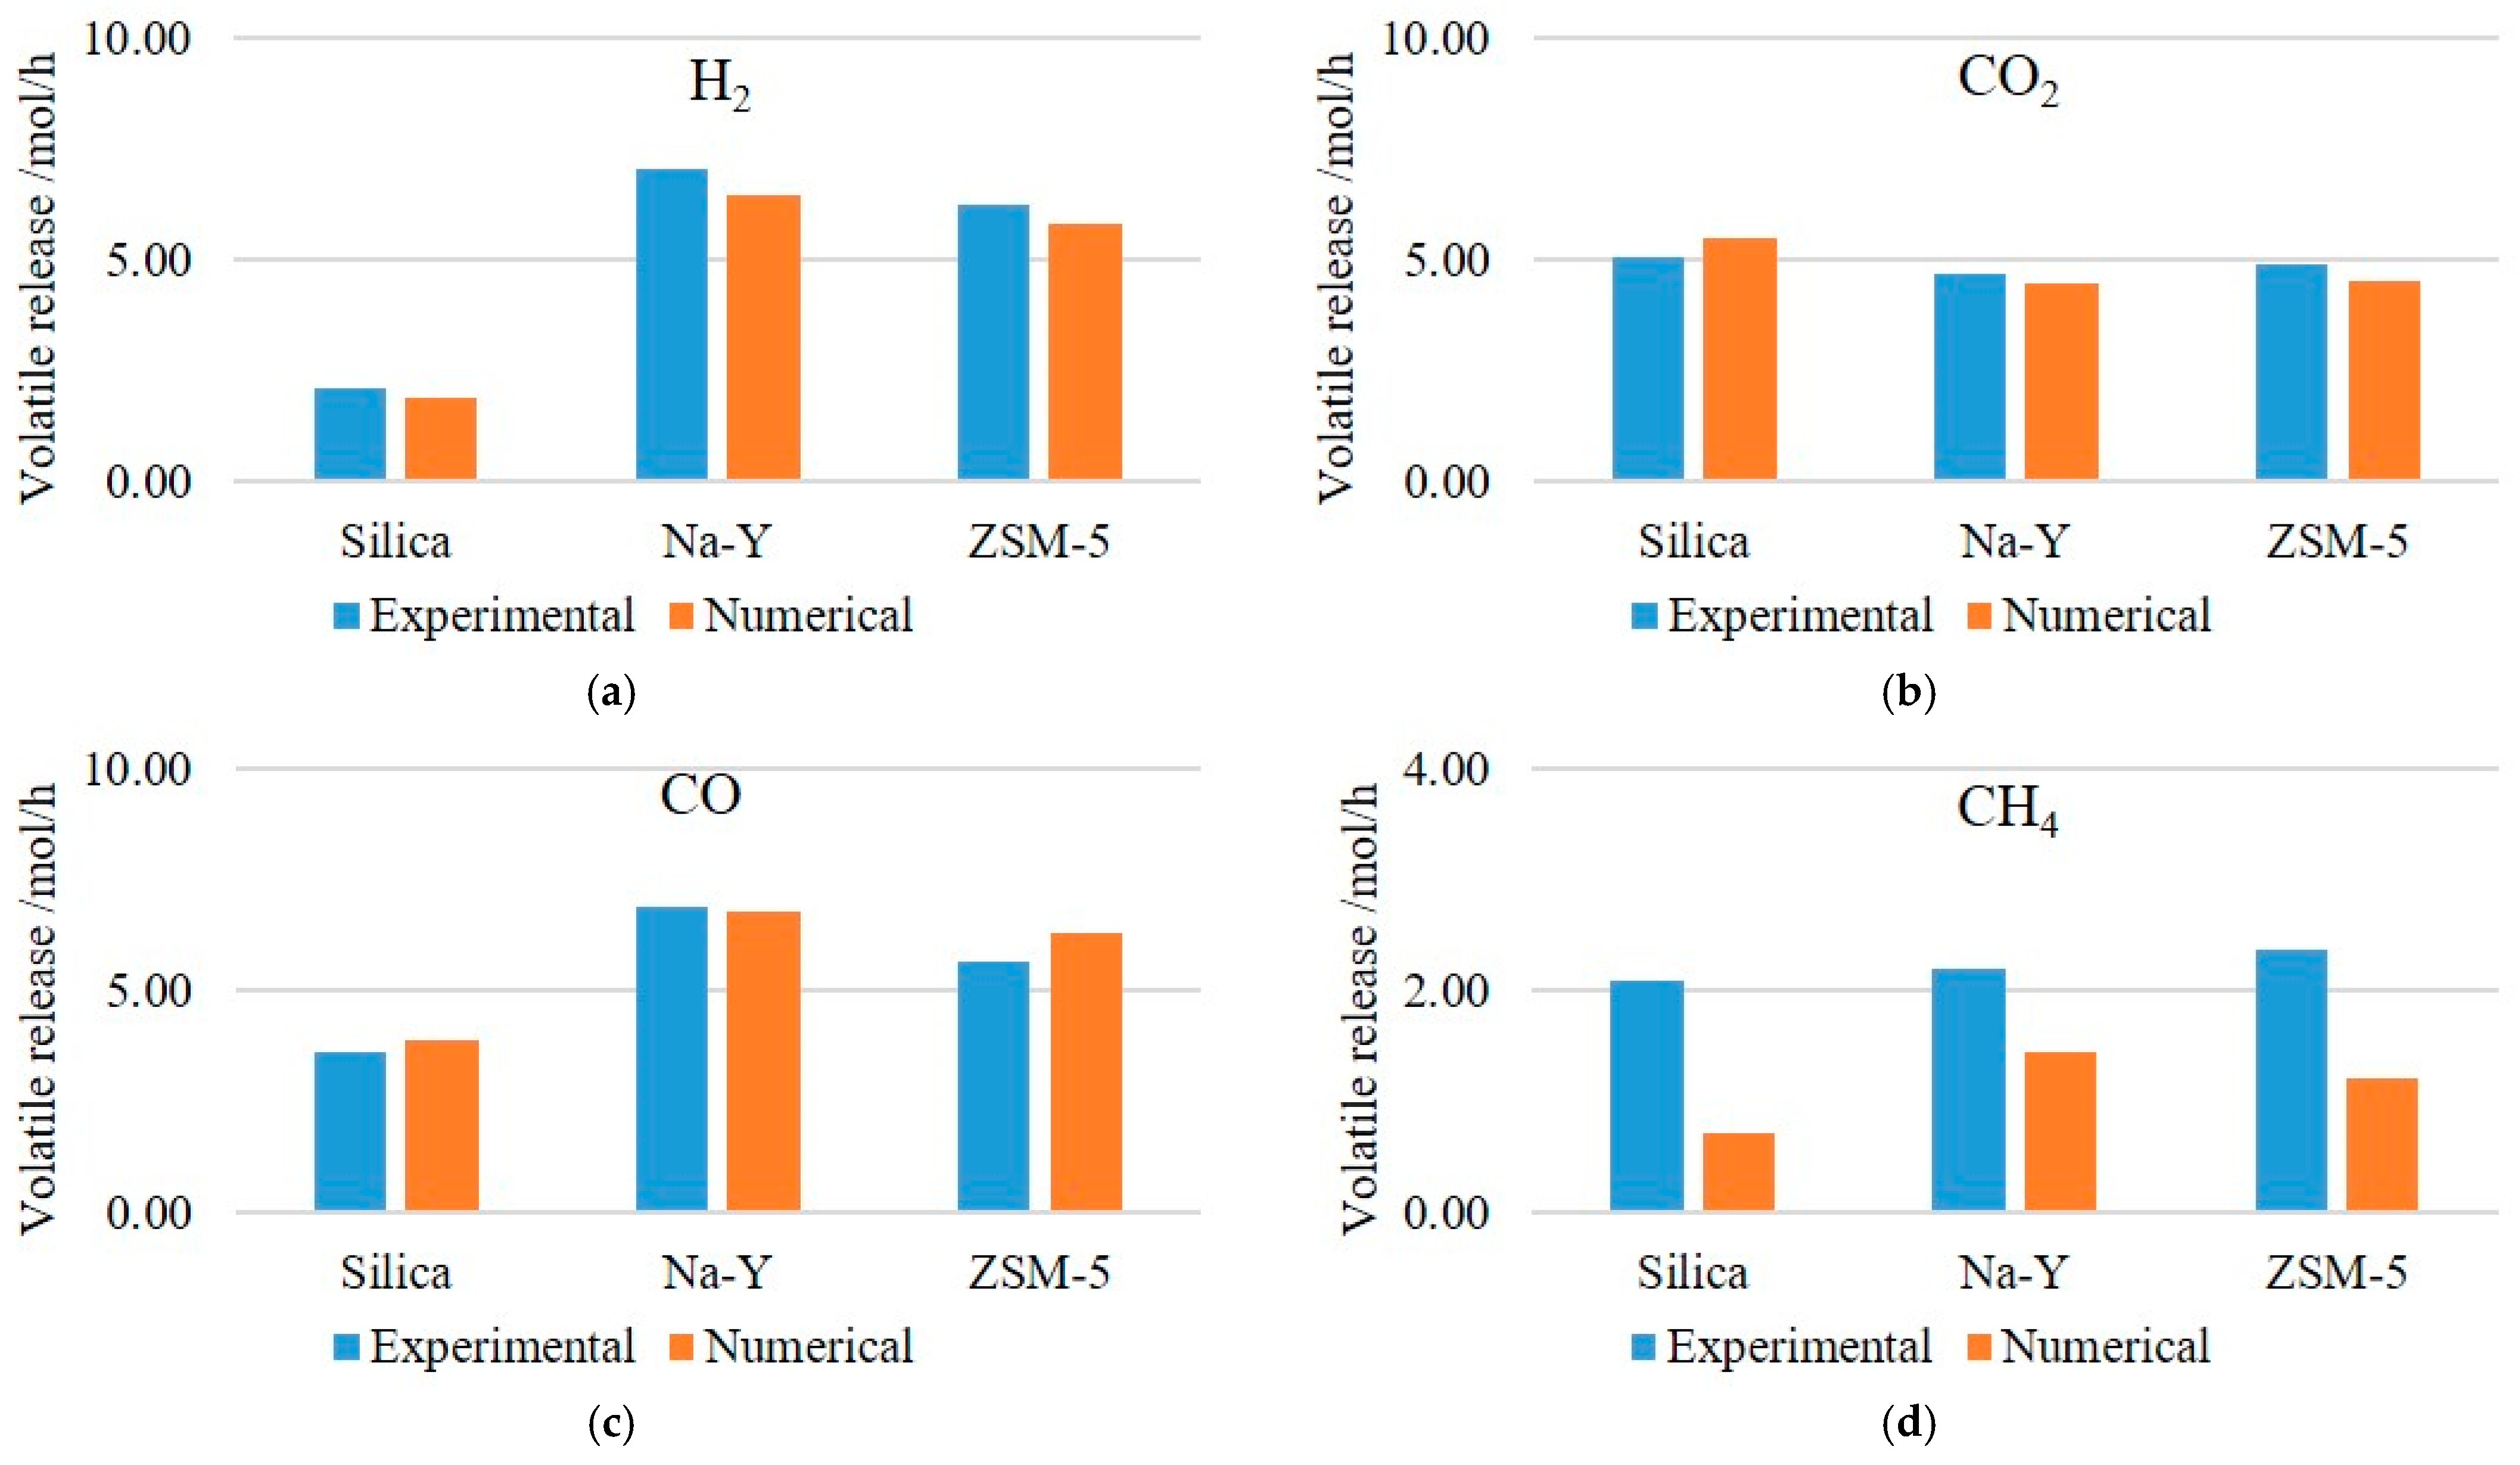
4.5. Numerical and Experimental Results Comparison

A comparison of present numerical and experimental species concentration values is represented in Table 4 for H2, CO2, CO, and CH4 at the outlet of the reactor in steady-state conditions. Graphical representation of the same results are given in Figure 10. Na-Y Zeolite has the highest H2 production similar to experiments which is 6.48 mol/h with an error of 0.6 mol/h compared to the experimental result. H2 production varied from high to low when bed materials varied from Na-Y Zeolite to ZSM-5 Zeolite and then to Silica, respectively, in both numerical and experimental results. The lowest error in H2 production is observed for Silica bed material as the H2 production was lowest. H2 production in syn gas has enhanced with the catalytic bed zeolite bed material compared to non-catalytic silica bed material.
The reason for this is that plastic pyrolysis with catalytic bed material results in enhanced cracking of the LDPE which leads to a higher percentage of condensable gases while reducing the tar formation. Those condensable gases include light hydrocarbons of C2H6, C3H8, and C4H10 in the model which will further react with H2O, O2, and CO2 (Equation (26) to Equation (30) in the gasification model) and enhance the H2 production. Even though H2 is consumed by the char combustion reaction in Equation (20), due to its low kinetic reaction rate, the total produced H2 is not consumed by Equation (20). Further, due to the reduced oxygen environment, Equation (30) is not accelerated to consume H2.
The lowest CO production can be seen in Silica bed material. CO production increases when using catalytic ZSM-5 zeolite and Na-Y zeolite as bed materials similar to that observed in the experiments. The reason for this is that the major light hydrocarbon reactions of Equations (26)–(28) release CO as a product. Further, high CO concentration can be attributed to the heterogeneous reaction Equation (16) also consumes CO2 and produces CO.
The lowest CO2 production of 4.54 mol/h can be seen in ZSM-5 Zeolite in the simulated results. CO2 production increases in Na-Y Zeolite and Silica progressively. CO2 is lower in both ZSM-5 Zeolite and Na-Y Zeolite compared to Silica bed material as observed in the experiments. The highest CO2 production can be seen in Silica bed material simulation followed by Na-Y zeolite and ZSM-5 zeolite in the numerical results. In the experiment also the highest CO2 is achieved by the Silica bed material run. In Zeolite bed materials CO production is enhanced and CO2 production is reduced as mentioned in the above paragraph. The factors contributing to increased CO production may also account for the decrease in CO2 levels observed in zeolite bed materials.
The numerical findings exhibit a significant association with the experimental outcomes on species concentrations. Nevertheless, disparities persist between the numerical and experimental figures related to species concentrations. This can be due to biomass pyrolysis and LDPE pyrolysis are complex processes that involve many complex chemical reactions that are challenging to model. Similarly, only dominant gasification reactions are employed in this study. Hence the errors mentioned in Table 4 can be attributed to this.

5. Conclusions

A CFD numerical model is developed using the Eularian–Eularian method and with user-defined subroutines to predict the species concentrations at the equilibrium for co-gasification of Beechwood and LDPE with two catalytic bed materials and silica. The model can predict solid hydrodynamics, fuel conversion, and gasified species concentrations. It is quantitatively and qualitatively validated against available experimental analysis and numerical models and was able to come to a reasonable agreement with them. Solid conversion happens rapidly for both Beechwood and LDPE due to the high bed temperature. Char is generated near the fuel inlet and contributes to the char combustion reactions. Light hydrocarbons produced from LDPE pyrolysis react with available O2, H2O, and CO2. Hence, light hydrocarbons vanish rapidly and the mole concentrations become negligible similar to the experiment. H2 production is promoted by the two catalytic bed materials compared to non-catalytic silica bed material run predicting the highest H2 production in Na-Y zeolite. Therefore, this innovative synergy not only contributes to the advancement of sustainable energy solutions but also underscores the potential for cleaner and more efficient energy production methodology.

Author Contributions

Conceptualization, W.D.S.F. and J.N.; methodology, W.D.S.F. and J.N.; software, W.D.S.F. and J.N.; validation, W.D.S.F.; formal analysis, W.D.S.F.; resources, W.D.S.F. and J.N.; data curation, W.D.S.F.; writing—original draft preparation, W.D.S.F.; writing—review and editing, W.D.S.F. and J.N.; visualization, W.D.S.F. and J.N.; supervision, J.N.; project administration, W.D.S.F. All authors have read and agreed to the published version of the manuscript.

Funding

There are no funding sources available for this work.

Data Availability Statement

The datasets presented in this article are not readily available because the data are part of an ongoing study. Requests to access the datasets should be directed to [email protected].

Conflicts of Interest

The authors declare no conflict of interest.

Nomenclature

CFDComputational Fluid DynamicsLDPELow-Density Polyethylene
A i Pre-exponential factor (s−1) A v Area-volume ratio (m−1)
C p Specific heat (J.kg−1.K−1) C d Drag Coefficient (−)
C f u Combustion model constant (−) C p r Combustion model constant (−)
d p   Particle diameter (m) d eq   Equivalent diameter (m)
HEnthalpy (J kg−1) E i Activation energy (j mol−1)
i Radiation intensity (W m−2)kThermal conductivity (W m−1 K−1)
KChar reaction constants (m s−1)MMolecular weight (kg mol−1)
LHLatent Heat (J/kg) S Source term (Wm−3)
PPressure (Pa) r ¯ f ˙ u Fuel consumption rate (kg m−3 s−1)
R Ideal gas constant (j mol−1 K−1) R ˙ i Generation or consumption rates of various components (kg m−3 s−1)
sCell face area (m2) T s Solid temperature (K)
T g Gas temperature (K) y ¯ f u Fuel mass fraction (kg/kg)
tTime (s) u Instantaneous velocity (ms−1)
v Velocity (ms−1) V Volume (m3)
y ¯ p r Product mass fraction (kg/kg) y ¯ o x Oxidizer mass fraction (kg/kg)
Greek Symbols
ϵ Emissivity ε Solid fraction (−)
ψ Sphericity (−) ρ Density (kg m−3 s−1)
𝜎Stefan-Boltzmann constant (W m−1 K−4) τ Stress tensor (N m−2)
τ R Turbulent time scale (s−1) γ Inertial loss (m−1)
φ Char oxidation parameter (−)
Subscripts
cConsumptiongGas phase
sSolid phasepParticle
effEffectivemoistMoisture
woodDry woodcharChar

References

  1. Kedzierski, M.; Frère, D.; Le Maguer, G.; Bruzaud, S. Why is there plastic packaging in the natural environment? Understanding the roots of our individual plastic waste management behaviours. Sci. Total Environ. 2020, 740, 139985. [Google Scholar] [CrossRef] [PubMed]
  2. DAWE. National Plastics Plan 2021; December. CC BY 4.0; Department of Agriculture, Water and the Environment: Parkes, Canberra, Australia, 2021. [Google Scholar]
  3. Fazil, A.; Kumar, S.; Mahajani, S.M. Downdraft co-gasification of high ash biomass and plastics. Energy 2022, 243, 123055. [Google Scholar] [CrossRef]
  4. Nardella, F.; Bellavia, S.; Mattonai, M.; Ribechini, E. Co-pyrolysis of wood and plastic: Evaluation of synergistic effects and kinetic data by evolved gas analysis-mass spectrometry (EGA-MS). J. Anal. Appl. Pyrolysis 2021, 159, 105308. [Google Scholar] [CrossRef]
  5. Lopez, G.; Erkiaga, A.; Amutio, M.; Bilbao, J.; Olazar, M. Effect of polyethylene co-feeding in the steam gasification of biomass in a conical spouted bed reactor. Fuel 2015, 153, 393–401. [Google Scholar] [CrossRef]
  6. Moghadam, R.A.; Yusup, S.; Uemura, Y.; Chin, B.L.F.; Lam, H.L.; Al Shoaibi, A. Syngas production from palm kernel shell and polyethylene waste blend in fluidized bed catalytic steam co-gasification process. Energy 2014, 75, 40–44. [Google Scholar] [CrossRef]
  7. Raj, R.; Singh, D.K.; Tirkey, J.V. Co-gasification of plastic waste blended with coal and biomass: A comprehensive review. Environ. Technol. Rev. 2023, 12, 614–642. [Google Scholar] [CrossRef]
  8. Buentello-Montoya, D.A.; Duarte-Ruiz, C.A.; Maldonado-Escalante, J.F. Co-gasification of waste PET, PP and biomass for energy recovery: A thermodynamic model to assess the produced syngas quality. Energy 2023, 266, 126510. [Google Scholar] [CrossRef]
  9. Wu, C.; Williams, P.T. Pyrolysis–gasification of plastics, mixed plastics and real-world plastic waste with and without Ni–Mg–Al catalyst. Fuel 2010, 89, 3022–3032. [Google Scholar] [CrossRef]
  10. Scala, F. Particle agglomeration during fluidized bed combustion: Mechanisms, early detection and possible countermeasures. Fuel Process. Technol. 2018, 171, 31–38. [Google Scholar] [CrossRef]
  11. Plastics Europe. Plastics—The Facts 2017 An Analysis of European Plastics Production, Demand and Waste Data. 2017. Available online: https://plasticseurope.org/wp-content/uploads/2021/10/2017-Plastics-the-facts.pdf (accessed on 25 November 2022).
  12. Wang, C.-q.; Wang, H.; Fu, J.-g.; Liu, Y.-n. Flotation separation of waste plastics for recycling—A review. Waste Manag. 2015, 41, 28–38. [Google Scholar] [CrossRef]
  13. Wu, C.; Williams, P.T. Hydrogen production by steam gasification of polypropylene with various nickel catalysts. Appl. Catal. B Environ. 2009, 87, 152–161. [Google Scholar] [CrossRef]
  14. Elordi, G.; Olazar, M.; Lopez, G.; Artetxe, M.; Bilbao, J. Product Yields and Compositions in the Continuous Pyrolysis of High-Density Polyethylene in a Conical Spouted Bed Reactor. Ind. Eng. Chem. Res. 2011, 50, 6650–6659. [Google Scholar] [CrossRef]
  15. Mastellone, M.L.; Zaccariello, L.; Arena, U. Co-gasification of coal, plastic waste and wood in a bubbling fluidized bed reactor. Fuel 2010, 89, 2991–3000. [Google Scholar] [CrossRef]
  16. Aznar, M.P.; Caballero, M.A.; Sancho, J.A.; Francés, E. Plastic waste elimination by co-gasification with coal and biomass in fluidized bed with air in pilot plant. Fuel Process. Technol. 2006, 87, 409–420. [Google Scholar] [CrossRef]
  17. Acomb, J.C.; Nahil, M.A.; Williams, P.T. Thermal processing of plastics from waste electrical and electronic equipment for hydrogen production. J. Anal. Appl. Pyrolysis 2013, 103, 320–327. [Google Scholar] [CrossRef]
  18. Kumagai, S.; Alvarez, J.; Blanco, P.H.; Wu, C.; Yoshioka, T.; Olazar, M.; Williams, P.T. Novel Ni–Mg–Al–Ca catalyst for enhanced hydrogen production for the pyrolysis–gasification of a biomass/plastic mixture. J. Anal. Appl. Pyrolysis 2015, 113, 15–21. [Google Scholar] [CrossRef]
  19. Kumagai, S.; Hosaka, T.; Kameda, T.; Yoshioka, T. Removal of toxic HCN and recovery of H2-rich syngas via catalytic reforming of product gas from gasification of polyimide over Ni/Mg/Al catalysts. J. Anal. Appl. Pyrolysis 2017, 123, 330–339. [Google Scholar] [CrossRef]
  20. Feng, G. Pyrolysis of Waste Plastics into Fuels; University of Canterbury: Christchurch, New Zealand, 2010. [Google Scholar]
  21. Lappas, A.A.; Kalogiannis, K.G.; Iliopoulou, E.F.; Triantafyllidis, K.S.; Stefanidis, S.D. Catalytic pyrolysis of biomass for transportation fuels. Wiley interdisciplinary reviews: Energy and Environment 2012, 1, 285–297. [Google Scholar] [CrossRef]
  22. Jerzak, W.; Gao, N.; Kalemba-Rec, I.; Magdziarz, A. Catalytic intermediate pyrolysis of post-extraction rapeseed meal by reusing ZSM-5 and Zeolite Y catalysts. Catal. Today 2022, 404, 63–77. [Google Scholar] [CrossRef]
  23. Fernandez, E.; Santamaria, L.; Artetxe, M.; Amutio, M.; Arregi, A.; Lopez, G.; Bilbao, J.; Olazar, M. Conditioning the volatile stream from biomass fast pyrolysis for the attenuation of steam reforming catalyst deactivation. Fuel 2022, 312, 122910. [Google Scholar] [CrossRef]
  24. Diba, M.F.; Karim, M.R.; Naser, J. Fluidized bed CFD using simplified solid-phase coupling. Powder Technol. 2020, 375, 161–173. [Google Scholar] [CrossRef]
  25. Bell, R.A. Numerical Modelling of Multi-Particle Flows in Bubbling Gas-Solid Fluidised Beds. Ph.D. Thesis, Swinburne University of Technology, Hawthorn, Australia, 2000. [Google Scholar]
  26. Porteiro, J.; Collazo, J.; Patino, D.; Granada, E.; Moran Gonzalez, J.C.; Míguez, J.L. Numerical modeling of a biomass pellet domestic boiler. Energy Fuels 2009, 23, 1067–1075. [Google Scholar] [CrossRef]
  27. Porteiro, J.; Míguez, J.; Granada, E.; Moran, J. Mathematical modelling of the combustion of a single wood particle. Fuel Process. Technol. 2006, 87, 169–175. [Google Scholar] [CrossRef]
  28. Xiong, Q.; Xu, F.; Pan, Y.; Yang, Y.; Gao, Z.; Shu, S.; Hong, K.; Bertrand, F.; Chaouki, J. Major trends and roadblocks in CFD-aided process intensification of biomass pyrolysis. Chem. Eng. Process. Process Intensif. 2018, 127, 206–212. [Google Scholar] [CrossRef]
  29. Gómez, M.; Porteiro, J.; Patiño, D.; Míguez, J. CFD modelling of thermal conversion and packed bed compaction in biomass combustion. Fuel 2014, 117, 716–732. [Google Scholar] [CrossRef]
  30. Zhu, H.L.; Zhang, Y.S.; Materazzi, M.; Aranda, G.; Brett, D.J.L.; Shearing, P.R.; Manos, G. Co-gasification of beech-wood and polyethylene in a fluidized-bed reactor. Fuel Process. Technol. 2019, 190, 29–37. [Google Scholar] [CrossRef]
  31. AVL FIRE User Guide (2020) CFD-Solver_v2020_01_CFD—Solver. Available online: https://www.avl.com/en-au/simulation-solutions/software-offering/simulation-tools-a-z/avl-fire-m (accessed on 20 of April 2020).
  32. Karim, M.R.; Naser, J. Progress in Numerical Modelling of Packed Bed Biomass Combustion. In Proceedings of the 19th Australasian Fluid Mechanics Conference, Melbourne, Australia, 8–11 December 2014. [Google Scholar]
  33. Ergun, S.; Orning, A.A. Fluid Flow through Randomly Packed Columns and Fluidized Beds. Ind. Eng. Chem. 1949, 41, 1179–1184. [Google Scholar] [CrossRef]
  34. Gidaspow, D. 9—Kinetic theory approach. In Multiphase Flow and Fluidization; Gidaspow, D., Ed.; Academic Press: San Diego, CA, USA, 1994; pp. 239–296. [Google Scholar] [CrossRef]
  35. Karim, M.R.; Naser, J. Numerical study of the ignition front propagation of different pelletised biomass in a packed bed furnace. Appl. Therm. Eng. 2018, 128, 772–784. [Google Scholar] [CrossRef]
  36. Lv, P.; Chang, J.; Wang, T.; Wu, C.; Tsubaki, N. A Kinetic Study on Biomass Fast Catalytic Pyrolysis. Energy Fuels 2004, 18, 1865–1869. [Google Scholar] [CrossRef]
  37. Lu, C.; Song, W.; Lin, W. Kinetics of biomass catalytic pyrolysis. Biotechnol. Adv. 2009, 27, 583–587. [Google Scholar] [CrossRef]
  38. Xiong, Q.; Yang, Y.; Xu, F.; Pan, Y.; Zhang, J.; Hong, K.; Lorenzini, G.; Wang, S. Overview of Computational Fluid Dynamics Simulation of Reactor-Scale Biomass Pyrolysis. ACS Sustain. Chem. Eng. 2017, 5, 2783–2798. [Google Scholar] [CrossRef]
  39. Xiong, Q.; Kong, S.-C. High-Resolution Particle-Scale Simulation of Biomass Pyrolysis. ACS Sustain. Chem. Eng. 2016, 4, 5456–5461. [Google Scholar] [CrossRef]
  40. Ismail, T.M.; Abd El-Salam, M.; Monteiro, E.; Rouboa, A. Fluid dynamics model on fluidized bed gasifier using agro-industrial biomass as fuel. Waste Manag. 2018, 73, 476–486. [Google Scholar] [CrossRef] [PubMed]
  41. McNeill, I.C.; Memetea, L.; Cole, W.J. A study of the products of PVC thermal degradation. Polym. Degrad. Stab. 1995, 49, 181–191. [Google Scholar] [CrossRef]
  42. Mcneill, I.C. 15—Thermal Degradation. In Comprehensive Polymer Science and Supplements; Elsevier: Amsterdam, The Netherlands, 1989; Volume 15, pp. 451–500. [Google Scholar]
  43. Collazo, J.; Porteiro, J.; Patino, D.; Granada, E. Numerical modeling of the combustion of densified wood under fixed-bed conditions. Fuel 2012, 93, 149–159. [Google Scholar] [CrossRef]
  44. Ravelli, S.; Perdichizzi, A.; Barigozzi, G. Description, applications and numerical modelling of bubbling fluidized bed combustion in waste-to-energy plants. Prog. Energy Combust. Sci. 2008, 34, 224–253. [Google Scholar] [CrossRef]
  45. Al-Abbas, A.H.; Naser, J.; Dodds, D. CFD modelling of air-fired and oxy-fuel combustion of lignite in a 100 KW furnace. Fuel 2011, 90, 1778–1795. [Google Scholar] [CrossRef]
  46. Al-Abbas, A.H.; Naser, J. Effect of chemical reaction mechanisms and NO x modeling on air-fired and oxy-fuel combustion of lignite in a 100-kW furnace. Energy Fuels 2012, 26, 3329–3348. [Google Scholar] [CrossRef]
  47. Al-Abbas, A.H.; Naser, J. Numerical study of one air-fired and two oxy-fuel combustion cases of propane in a 100 kW furnace. Energy Fuels 2012, 26, 952–967. [Google Scholar] [CrossRef]
  48. Bhuiyan, A.A.; Naser, J. Computational modelling of co-firing of biomass with coal under oxy-fuel condition in a small scale furnace. Fuel 2015, 143, 455–466. [Google Scholar] [CrossRef]
  49. Zhang, Y.; Wu, C.; Nahil, M.A.; Williams, P. Pyrolysis–Catalytic Reforming/Gasification of Waste Tires for Production of Carbon Nanotubes and Hydrogen. Energy Fuels 2015, 29, 3328–3334. [Google Scholar] [CrossRef]
  50. Bhuiyan, A.A.; Naser, J. Numerical modelling of oxy fuel combustion, the effect of radiative and convective heat transfer and burnout. Fuel 2015, 139, 268–284. [Google Scholar] [CrossRef]
  51. Spalding, D.B. Mixing and chemical reaction in steady confined turbulent flames. Symp. (Int.) Combust. 1971, 13, 649–657. [Google Scholar] [CrossRef]
  52. Magnussen, B.F.; Hjertager, B.H. On mathematical modeling of turbulent combustion with special emphasis on soot formation and combustion. In Proceedings of the Symposium (International) on Combustion, Cambridge, MA, USA, 15–20 August 1976; Elsevier: Amsterdam, The Netherlands, 1976; pp. 719–729. [Google Scholar]
  53. Wakao, N.; Funazkri, T. Effect of fluid dispersion coefficients on particle-to-fluid mass transfer coefficients in packed beds: Correlation of Sherwood numbers. Chem. Eng. Sci. 1978, 33, 1375–1384. [Google Scholar] [CrossRef]
  54. Wakao, N.; Kaguei, S.; Funazkri, T. Effect of fluid dispersion coefficients on particle-to-fluid heat transfer coefficients in packed beds: Correlation of Nusselt numbers. Chem. Eng. Sci. 1979, 34, 325–336. [Google Scholar] [CrossRef]
  55. Lockwood, F.; Shah, N. A new radiation solution method for incorporation in general combustion prediction procedures. In Proceedings of the Symposium (International) on Combustion, Waterloo, ON, Canada, 7–22 August 1980; Elsevier: Amsterdam, The Netherlands, 1981; pp. 1405–1414. [Google Scholar]
  56. Karim, M.R.; Naser, J. CFD modelling of combustion and associated emission of wet woody biomass in a 4 MW moving grate boiler. Fuel 2018, 222, 656–674. [Google Scholar] [CrossRef]
  57. Rapagnà, S.; Jand, N.; Kiennemann, A.; Foscolo, P. Steam-Gasification of Biomass in a Fluidized-Bed of Olivine Particles. Biomass Bioenergy 2000, 19, 187–197. [Google Scholar] [CrossRef]
  58. Olson, D.H.; Haag, W.O.; Lago, R.M. Chemical and physical properties of the ZSM-5 substitutional series. J. Catal. 1980, 61, 390–396. [Google Scholar] [CrossRef]
  59. Rajagopalan, K.; Peters, A.W.; Edwards, G.C. Influence of zeolite particle size on selectivity during fluid catalytic cracking. Appl. Catal. 1986, 23, 69–80. [Google Scholar] [CrossRef]
  60. Karim, M.R.; Ovi, I.; Naser, J. A CFD model for biomass combustion in a packed bed furnace. AIP Conf. Proc. 2016, 1754, 50026. [Google Scholar]
  61. Shrestha, S.; Gan, J.Q.; Zhou, Z.Y. Micromechanical analysis of bubbles formed in fluidized beds operated with a continuous single jet. Powder Technol. 2019, 357, 398–407. [Google Scholar] [CrossRef]
  62. Wu, K.; de Martín, L.; Mazzei, L.; Coppens, M.-O. Pattern formation in fluidized beds as a tool for model validation: A two-fluid model based study. Powder Technol. 2016, 295, 35–42. [Google Scholar] [CrossRef]
  63. Diba, M.F.; Karim, M.R.; Naser, J. Numerical modelling of a bubbling fluidized bed combustion: A simplified approach. Fuel 2020, 277, 118170. [Google Scholar] [CrossRef]
Figure 1. Steps of model development.
Energies 17 01804 g001
Figure 2. Experimental set up [30].
Energies 17 01804 g002
Figure 3. Bed heights (yellow color) of silica sand, ZSM-5 zeolite, and Na-Y zeolite from left to right, respectively.
Energies 17 01804 g003
Figure 4. The geometry of the reactor, gas inlet, and flow outlet.
Energies 17 01804 g004
Figure 5. Solid bed region bubble growth Silica 0.05 s 0.1 s 1 s 3 s (m3/m3).
Energies 17 01804 g005
Figure 6. Solid temperature (a) and Flow temperature (b), distribution at 10 s, 40 s, 200 s, and 1400 s from left to right in K.
Energies 17 01804 g006
Figure 7. (a) Moisture density, (b) dry−wood density, (c) char density, (d) LDPE density, and (e) Wax density distributions in kg/m3
Energies 17 01804 g007
Figure 8. Mass fractions variation Na-Y Zeolite bed material run at the outlet of the reactor over time (s).
Energies 17 01804 g008
Figure 9. Species mass fraction (kg/kg) at equilibrium (a) H2, (b) CO2, (c) CO, (d) CH4, (e) H2O, (f) O2, (g) N2, (h) C2H6, (i) C3H8, (j) C4H10.
Energies 17 01804 g009
Figure 10. Graphical representation of volatile release at equilibrium (a) H2, (b) CO2, (c) CO, (d) CH4.
Energies 17 01804 g010
Table 1. Kinetics of beechwood pallet devolatilization.
Kinetics of beechwood pellet devolatilization i = 1 ( g a s ) A 1 = 1.44 × 10 4 s 1 , E 1 = 88.6 × 10 3 J m o l 1
i = 2 ( t a r ) A 2 = 4.13 × 10 6 s 1 , E 2 = 112.7 × 10 3 J m o l 1
i = 3 ( c h a r ) A 3 = 7.38 × 10 5 s 1 , E 3 = 106.5 × 10 3 J m o l 1
Table 2. LDPE pyrolysis kinetics [20].
Kinetics of LDPE i = 1 ( p r i m a r y ) A 1 = 2.23 × 10 7 s 1 , n 1 = 1.4 , E 1 = 120 × 10 3 J m o l 1
i = 2 ( s e c o n d a r y ) A 2 = 2.45 × 10 13 s 1 , n 2 = 0.6 ,   E 2 = 220 × 10 3 J m o l 1
Table 3. Densities and the bed heights for each bed material [57,58,59].
Bed MaterialDensity/kg/m3Bed Height/mm
Silica sand264085
ZSM-5 Zeolite1790123
Na-Y Zeolite1920114
Table 4. Experimental and numerical volatile release for four-bed materials at equilibrium (mol/h).
SilicaErrorsilicaNa-YErrorNa-YZSM-5Errorzsm-5
H2Experimental2.140.267.080.606.260.46
Numerical1.886.485.80
CO2Experimental5.09−0.414.680.184.900.36
Numerical5.504.504.54
COExperimental3.63−0.256.900.105.67−0.63
Numerical3.886.806.30
CH4Experimental2.101.382.200.752.381.18
Numerical0.721.451.20
Disclaimer/Publisher’s Note: The statements, opinions and data contained in all publications are solely those of the individual author(s) and contributor(s) and not of MDPI and/or the editor(s). MDPI and/or the editor(s) disclaim responsibility for any injury to people or property resulting from any ideas, methods, instructions or products referred to in the content.

