
Implementing Industry 4.0: An In-Depth Case Study Integrating Digitalisation and Modelling for Decision Support System Applications
 , , ,
, , ,  ,
,  , , and
Abstract
:1. Introduction
2. Background
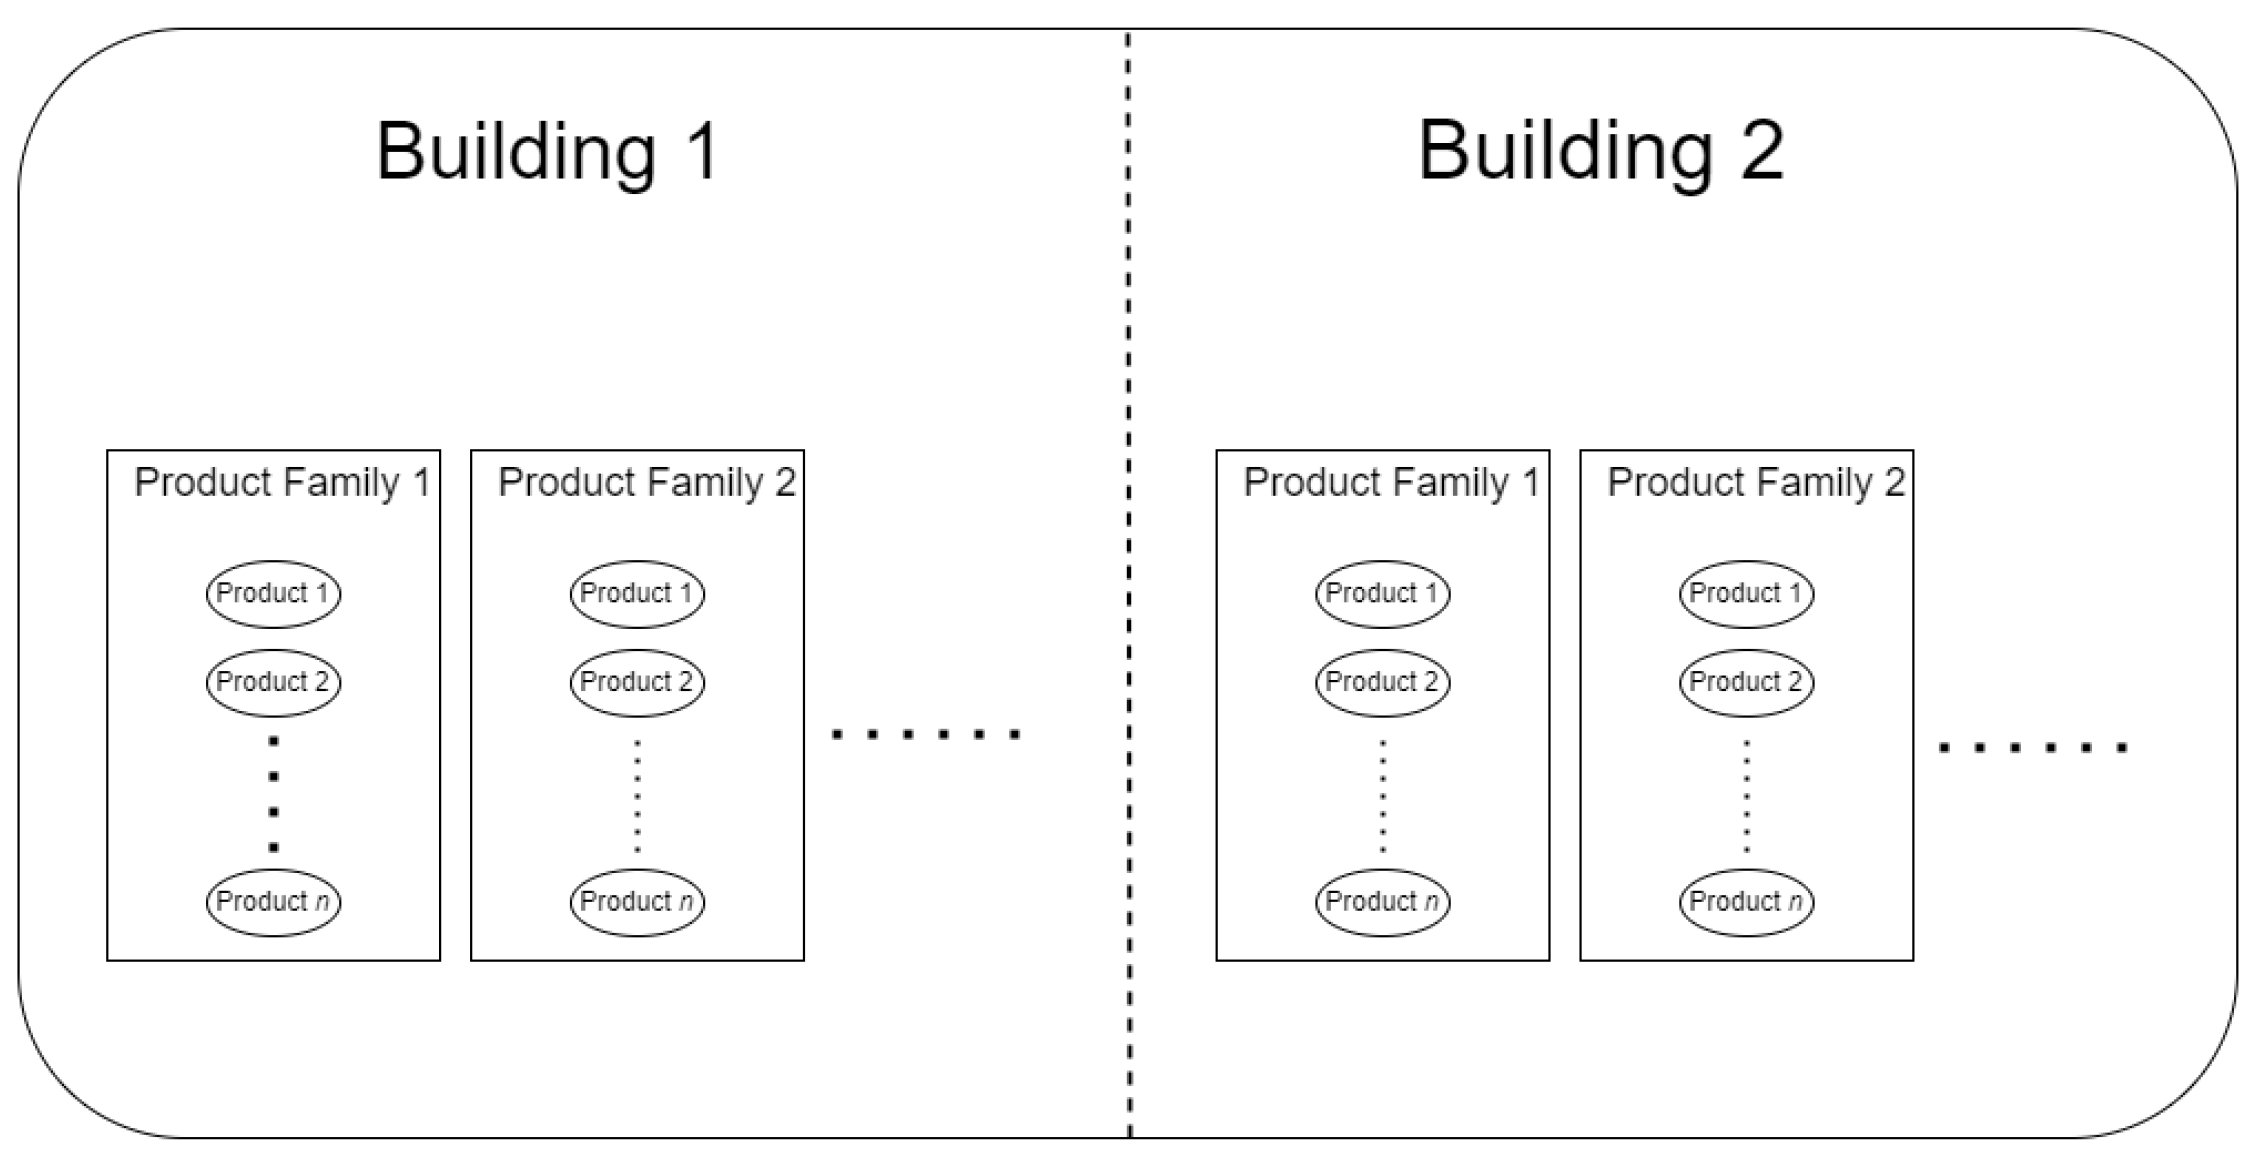
2.1. Production Process
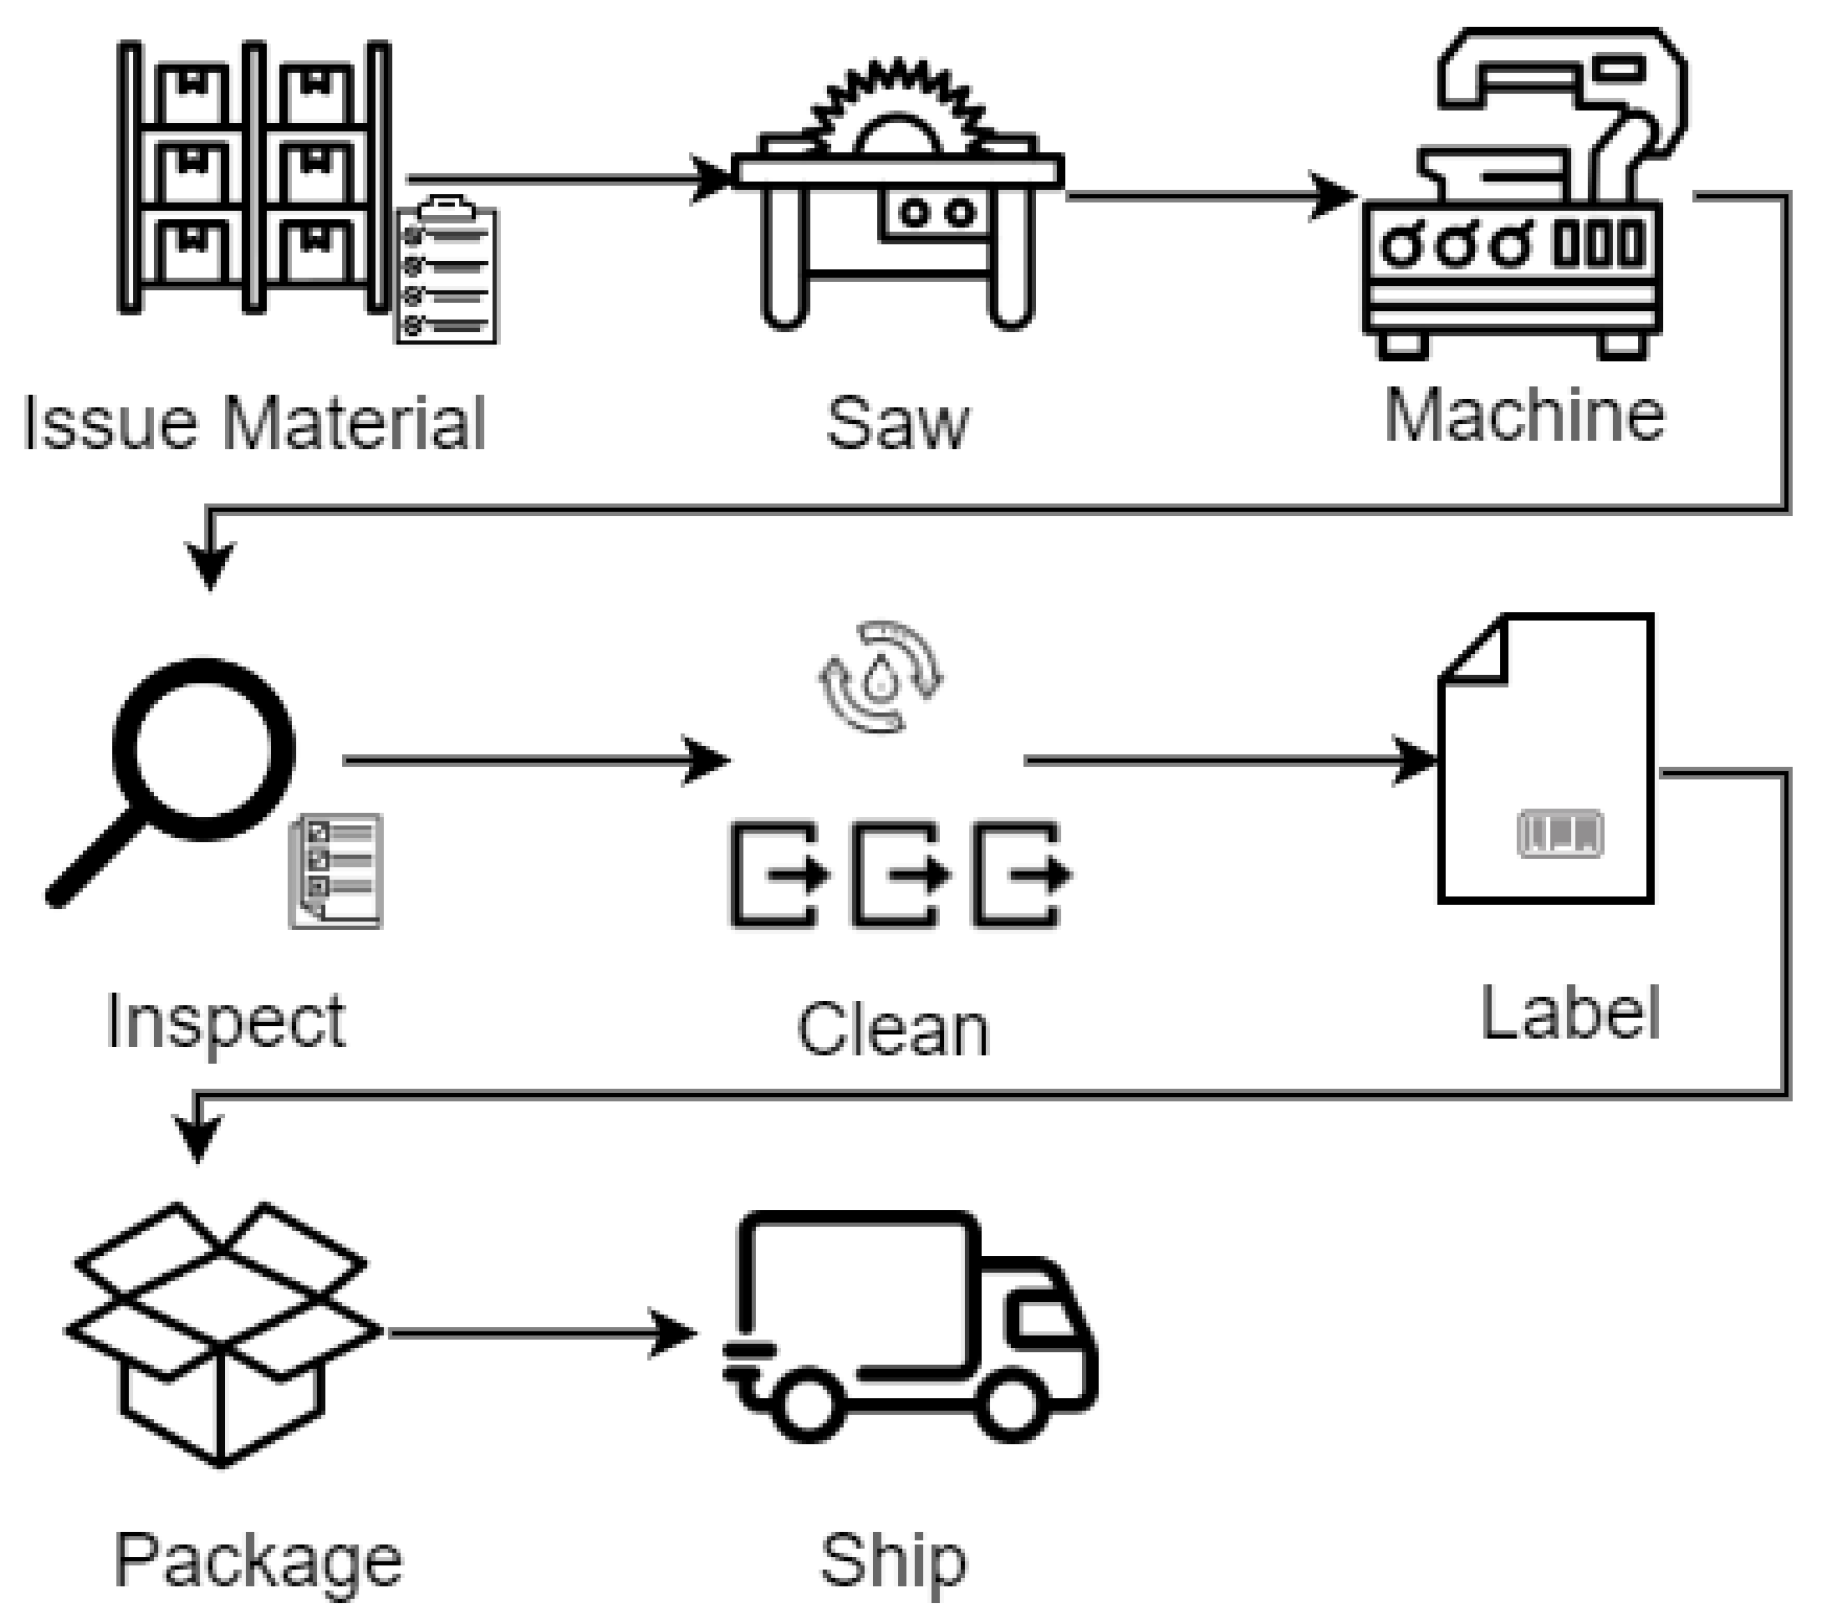
- Issue Material: the raw material is allocated to each of the product families. Operators use printers and barcode scanners to enable tracking.
- Saw: The material undergoes processing in machine saws to obtain blocks of the required size for each product family.
- Machine: The individual blocks are processed using Computer Numerical Control (CNC) machines to obtain the finished product.
- Inspect: The products are inspected for compliance and defective ones are scrapped. Various machines are used during this stage.
- Clean: The products are cleaned and sterilised in a multi-stage cleanline. The stages include water-baths as well as air-dryers. The parameters such as temperature, flow-rate, pH, etc., are tightly controlled.
- Label: Each product is assigned labels.
- Package: The products are sealed and packaged.
- Ship: The products are shipped from the facility.
- Production Specific Assets: this category includes all the machine tools and devices that are directly involved in the production process such as electric saws, CNC machines, cleanlines, and sealing and packaging equipment.
- Production Support Assets: this includes the auxiliary assets that are not directly involved in the production process but nevertheless serve other critical aplications. Examples include Air Handling Units (AHUs), chilled water system, and air compressors.
- Renewable Energy Assets: this category includes the wind turbines, photovoltaic panels and other assets that provide the facility with alternate sources of electricity.
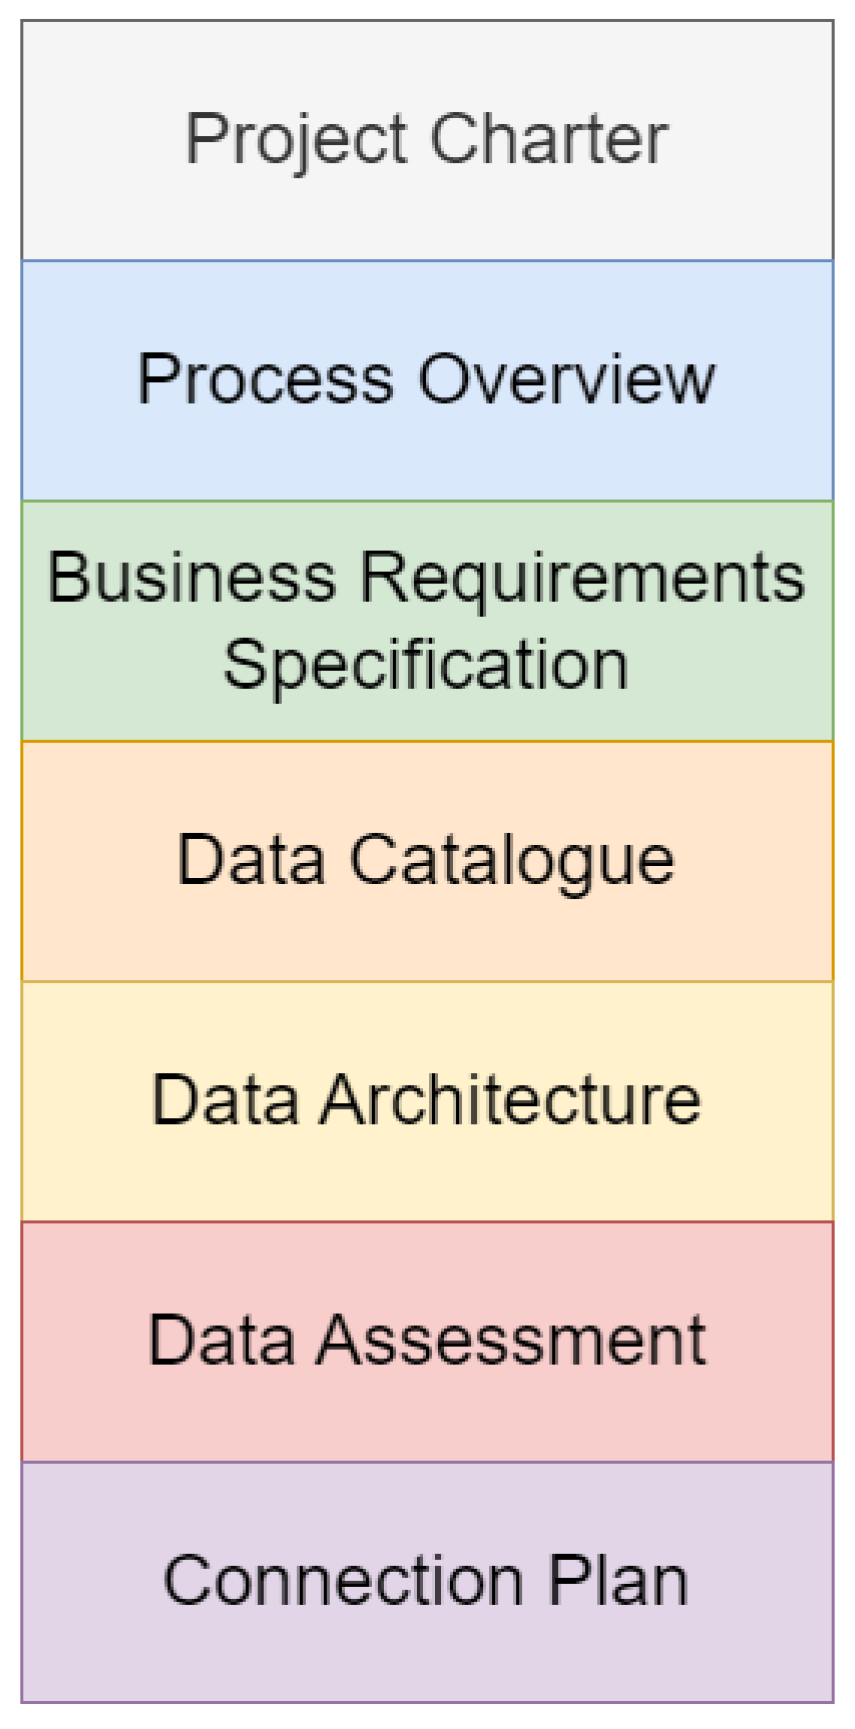
2.2. Project Plan
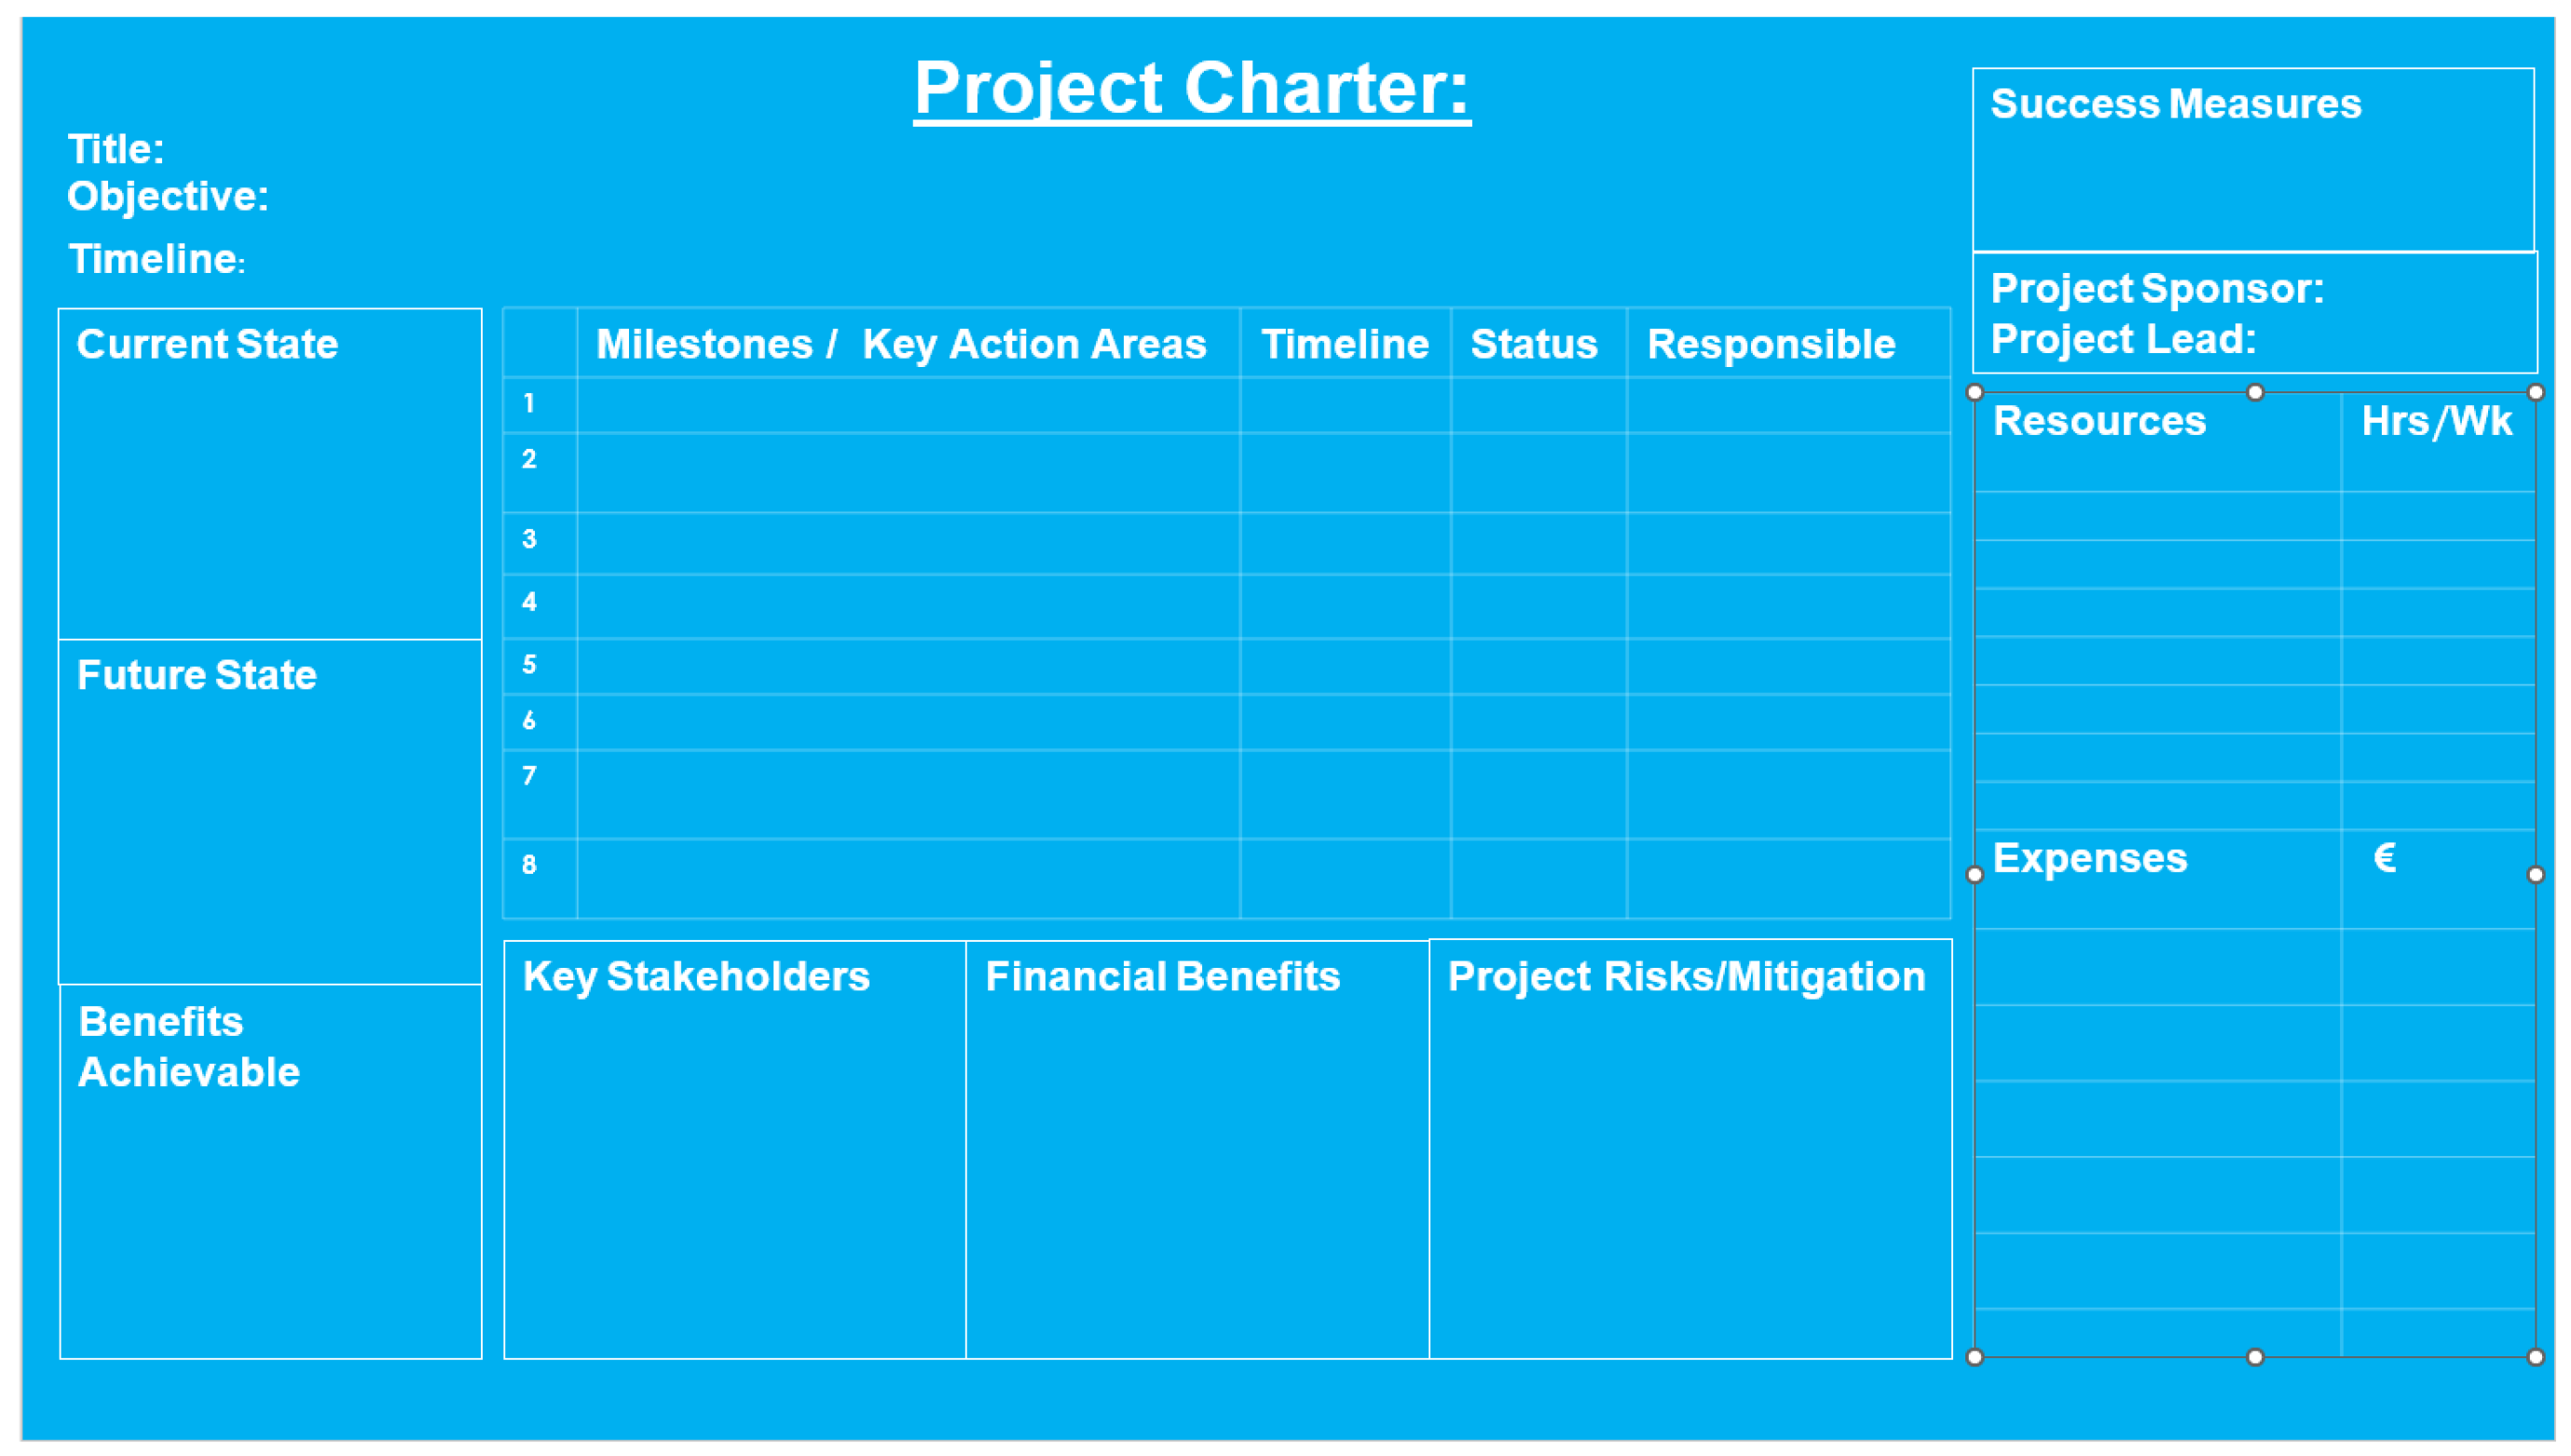
- Project Charter: a project charter was created using the template shown in Figure 4. This identified all the stakeholders, including, business management, production engineers, utilities technicians, research partners, and representatives within the funding agency. The key tasks were identified and assigned. Additionally, the project management aspects were also included.
- Process Overview: the high-level view of the production process is shown in Figure 2. The intricate details of the process were discussed through several meetings, some of which were held at the facility. The research partners were also given the opportunity to shadow production engineers to better understand the process.
- Business Requirements Specification: High-level meetings with the management were held to formulate the business requirements. Three broad areas were identified, which are described below, and the associated metrics are shown in Table 2.
- Digitalisation: Monitoring assets in real-time as well as equipping them with data-driven decision support systems.
- Energy Efficiency: improving energy efficiency by optimising operation or detecting and addressing faults. This aspect also includes the optimisation of renewable energy sources available at the facility.
- Cost/Energy Savings: The above two will lead to savings in terms of electricity consumption as well as cost.
These requirements were then translated into functional blocks, which are defined as the individual modules of the Industry 4.0 solution, whose coordinated operation will fulfil the business requirements. The different functional blocks are described later in this section. - Data Catalogue: A data catalogue with a high-level overview of all the data sources was developed as shown in Table 3. This also identifies the personnel responsible for maintaining the datasets.
- Data Architecture: This step delves into the details of each data source. While some data points correspond to physical assets, others reflect overall aggregates coming from a higher level of abstraction.
- Data Assessment: A detailed data assessment was carried out for each of the asset types identified in the data catalogue. The minimum data requirements for each of the functional blocks were listed. For instance, for the production assets, energy sensors are the minimum requirement. The details of each will be given in the respective sections.
- Connection Plan: from the above six steps, it emerged that the minimum data requirements were not fulfilled for most of the functional blocks. In some cases, the assets were not equipped with sensors, whereas in others, the data were being collected but not stored on the site’s data historian. One of the key steps taken was the installation of energy meters on most of the production assets. As can be seen in Table 2, having 85% of the production assets equipped with real-time energy monitoring capabilities was one of the concrete targets of this project.
- Stakeholder Engagement: for the success of an Industry 4.0 project, it is important to engage business managers, operators, and research partners from inception to conclusion.
- Business Understanding: Industry 4.0 is not just about upgrading technology; it is crucial to quantify the impact of these advancements on business operations.
- Tasks and Interdependencies: the overall objectives need to be broken down into individual tasks for any project. However, due to the interconnected nature of Industry 4.0 functional blocks, the interdependencies must also be identified.
- Data Assessment: data play a central role in Industry 4.0. However, the initial data seldom meets the requirements to be able to support the project objectives. A connection plan is devised to obtain the necessary additional data as well as establish an appropriate digital architecture.
- Energy modelling and analytics
- Fault detection and diagnosis
- Renewable integration
- Advanced Visualisation Tools
3. Energy Efficiency
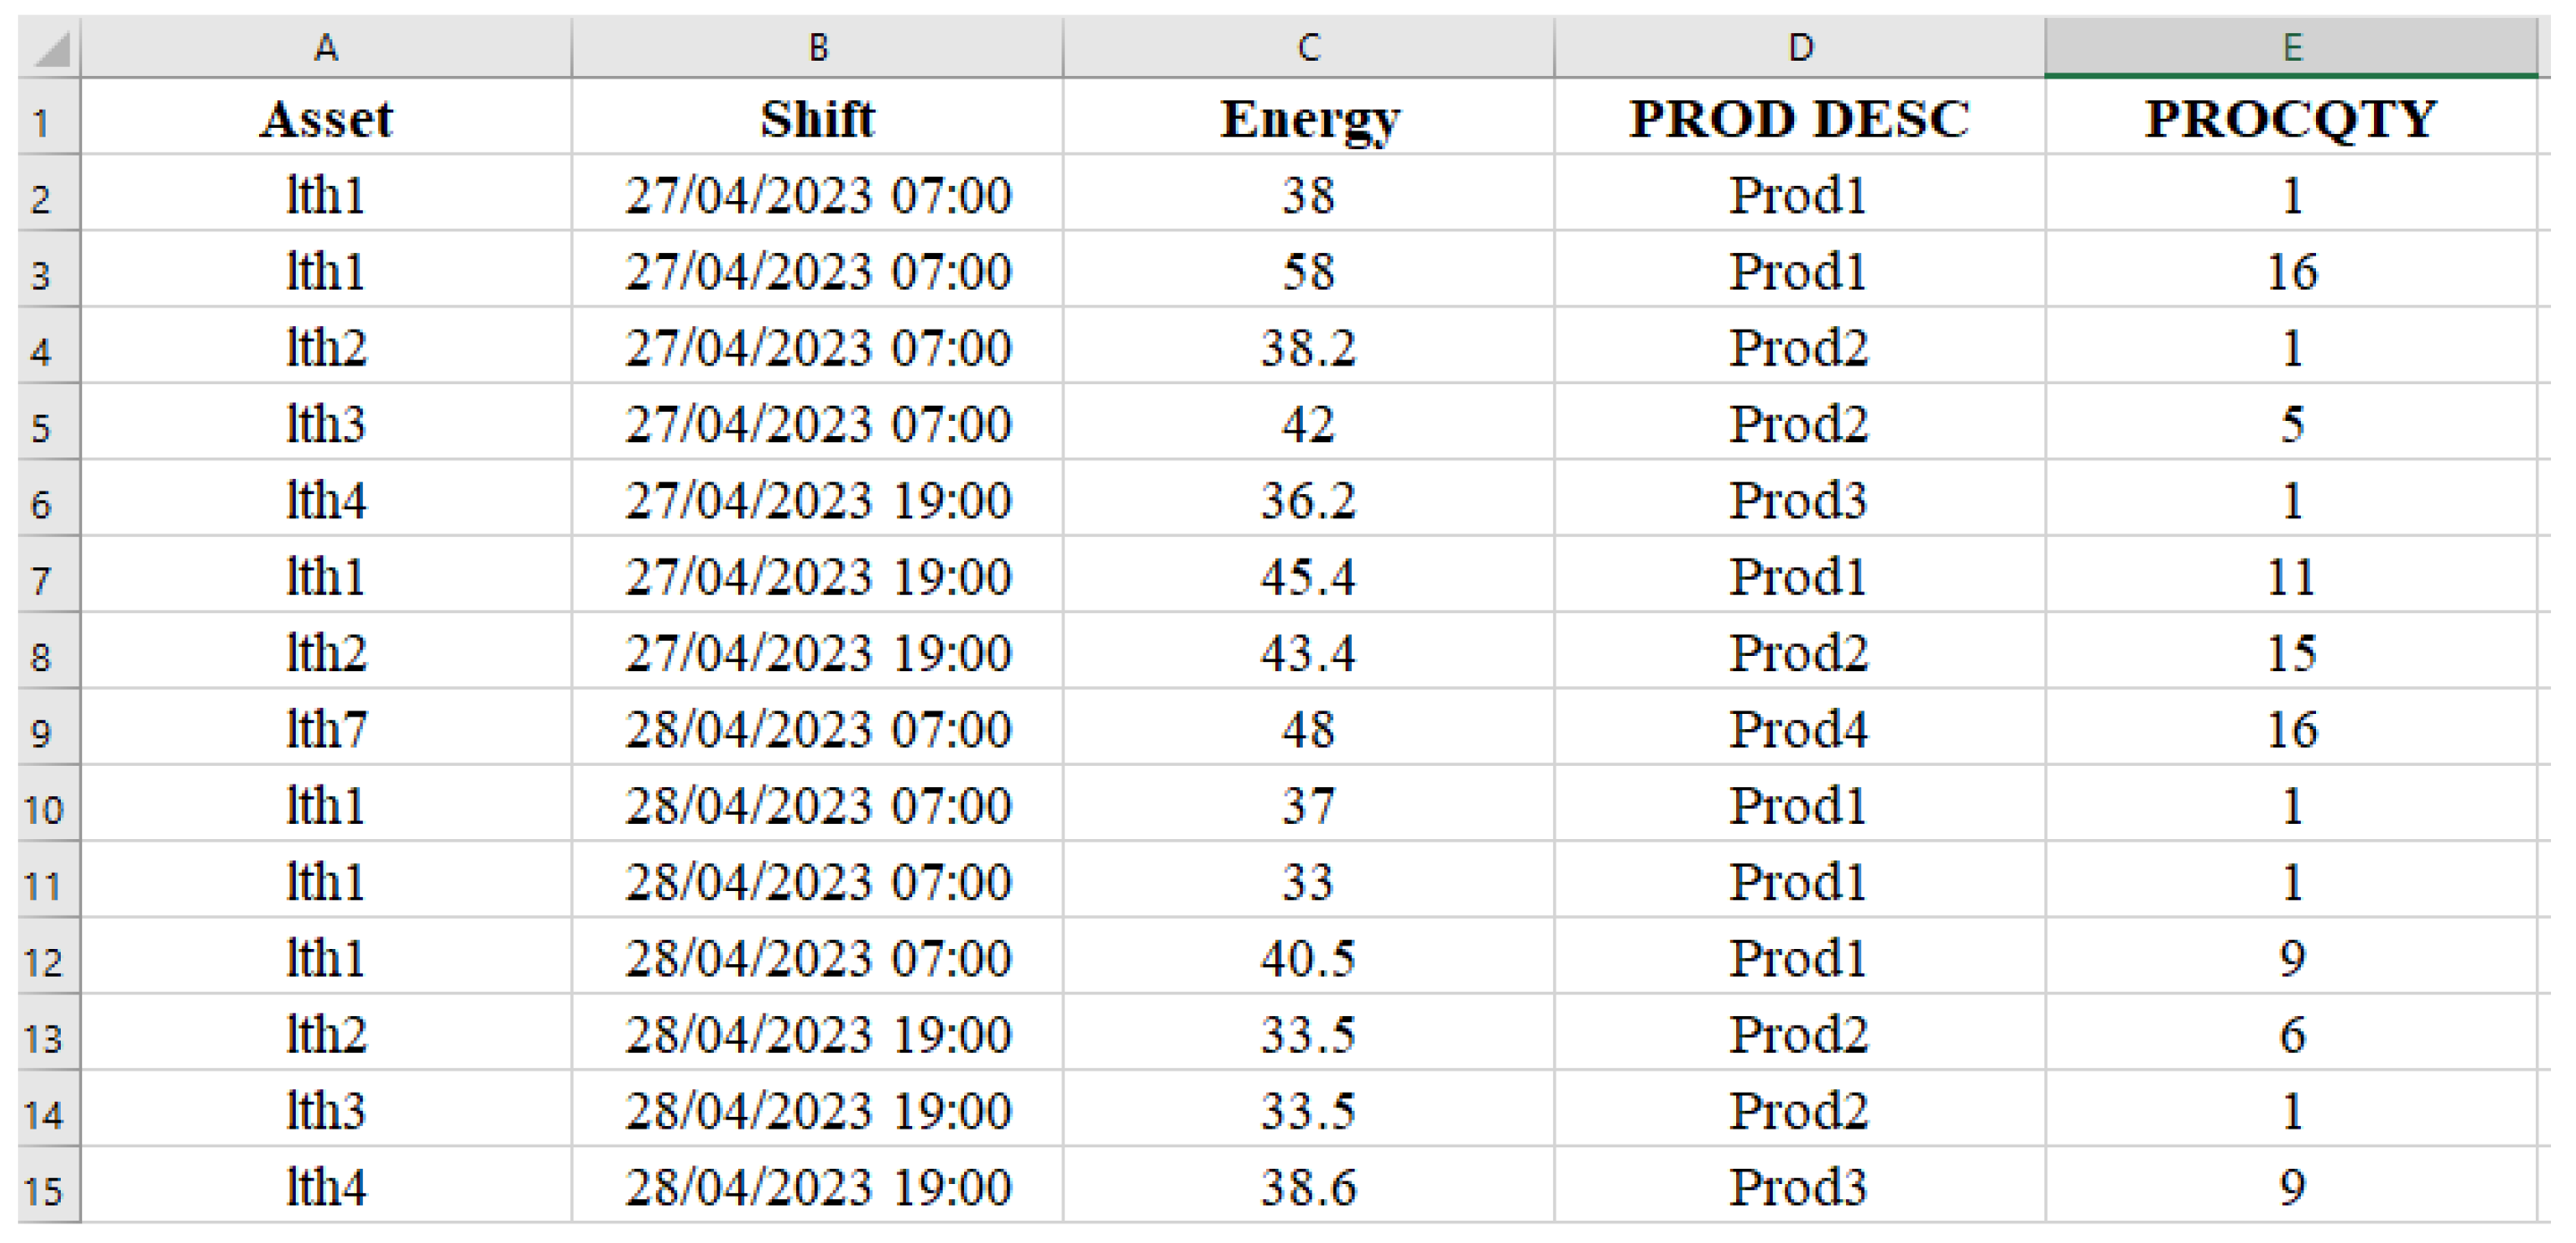
3.1. Data
- Product code
- Machine code
- Number of units produced/processed
- Number of parts scrapped
3.2. Data Analysis
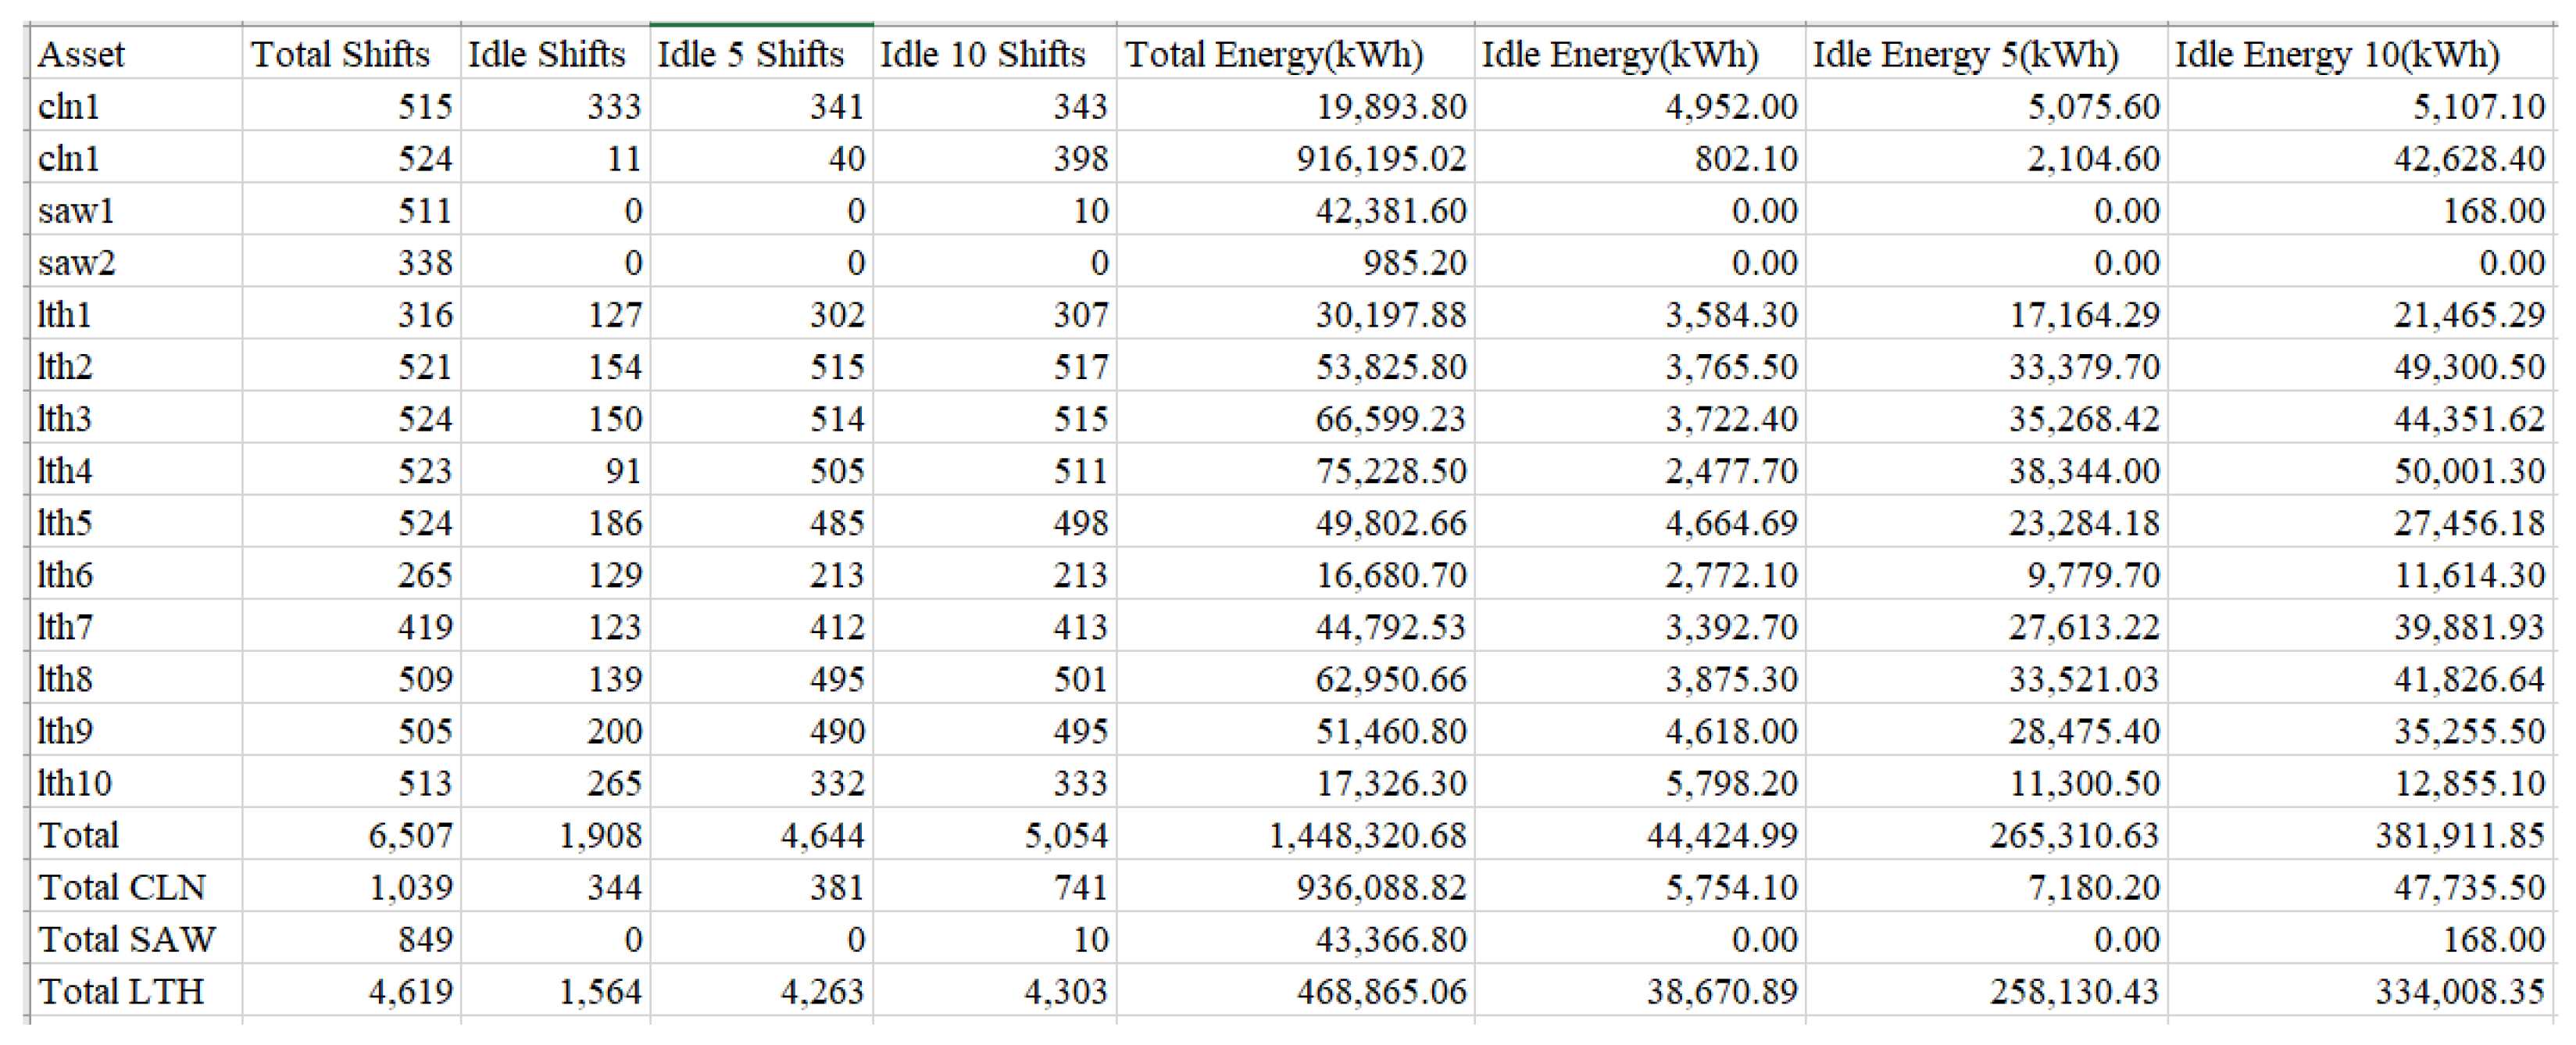
3.3. Idling Energy
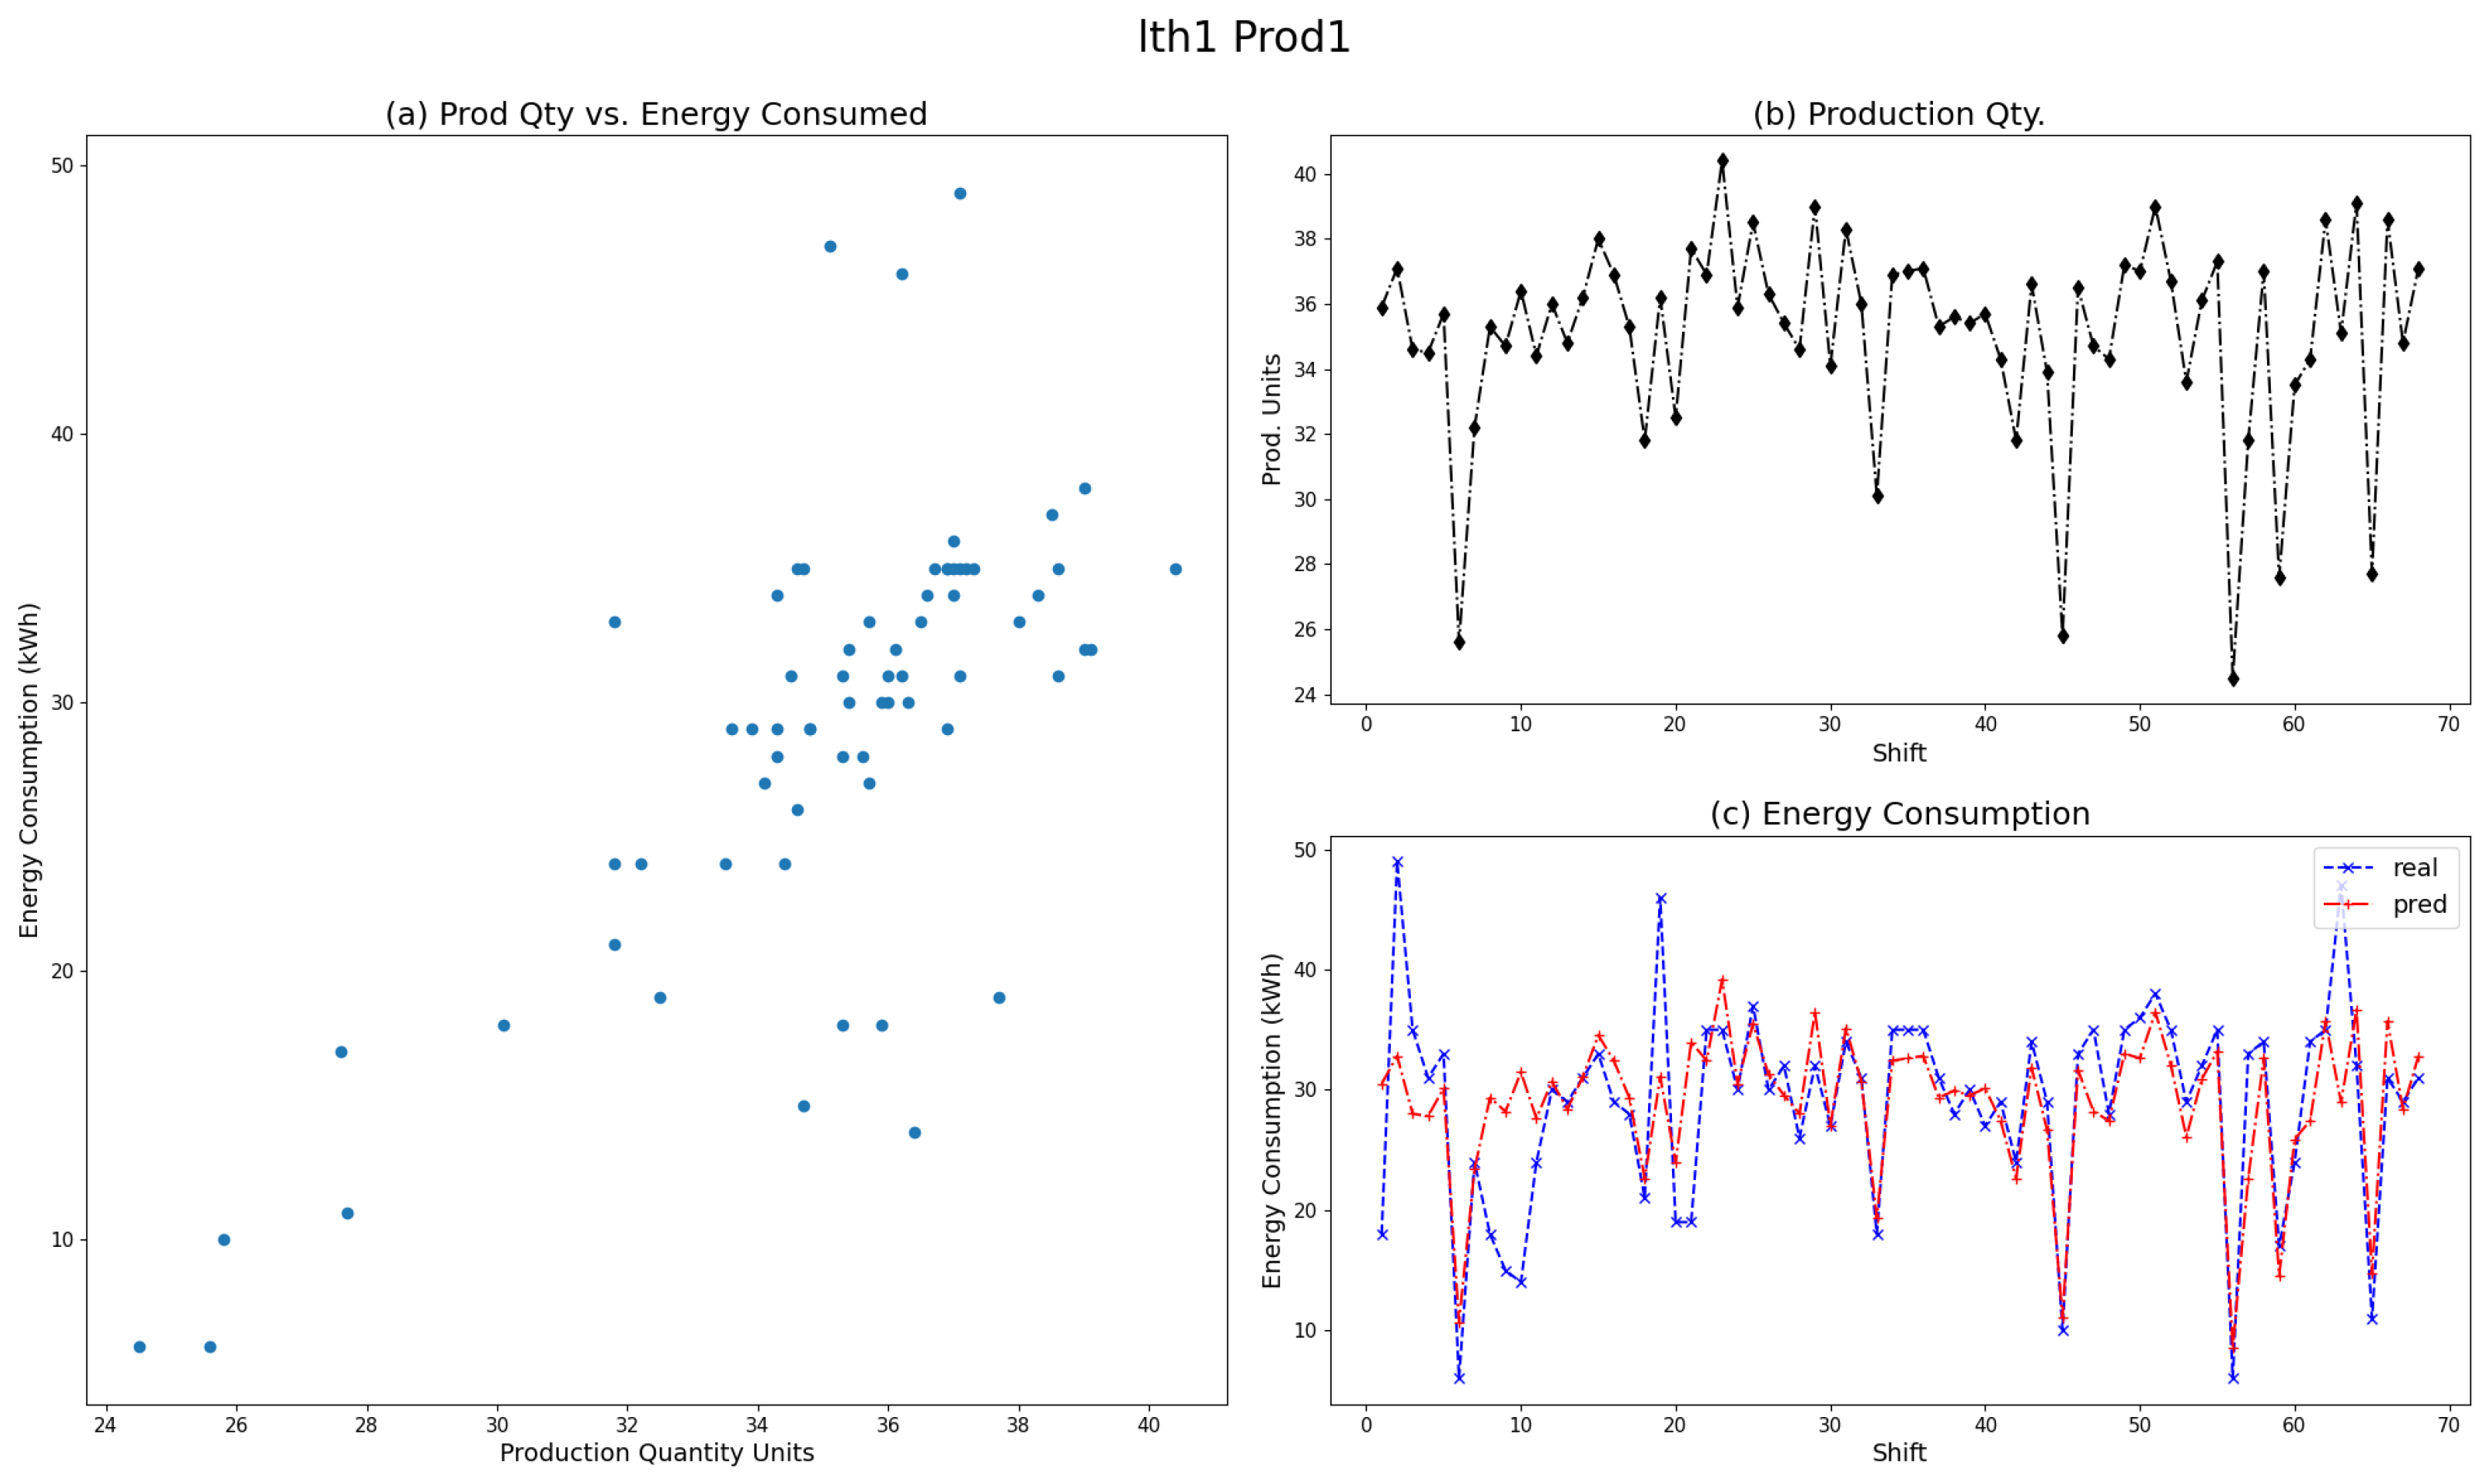
3.4. Energy Models
- Production Planning: the model aids production planning by providing an estimate of the energy required to produce a given number of units of a certain type of product within a shift
- Anomaly Detection: as can be seen in Figure 7, the model also flags some anomalous energy consumption patterns that might be caused due to tool wear or faults in the auxiliary machine systems. Thus, the model can also serve as a fault detection tool.
4. Fault Detection And Diagnosis
AHU FDD
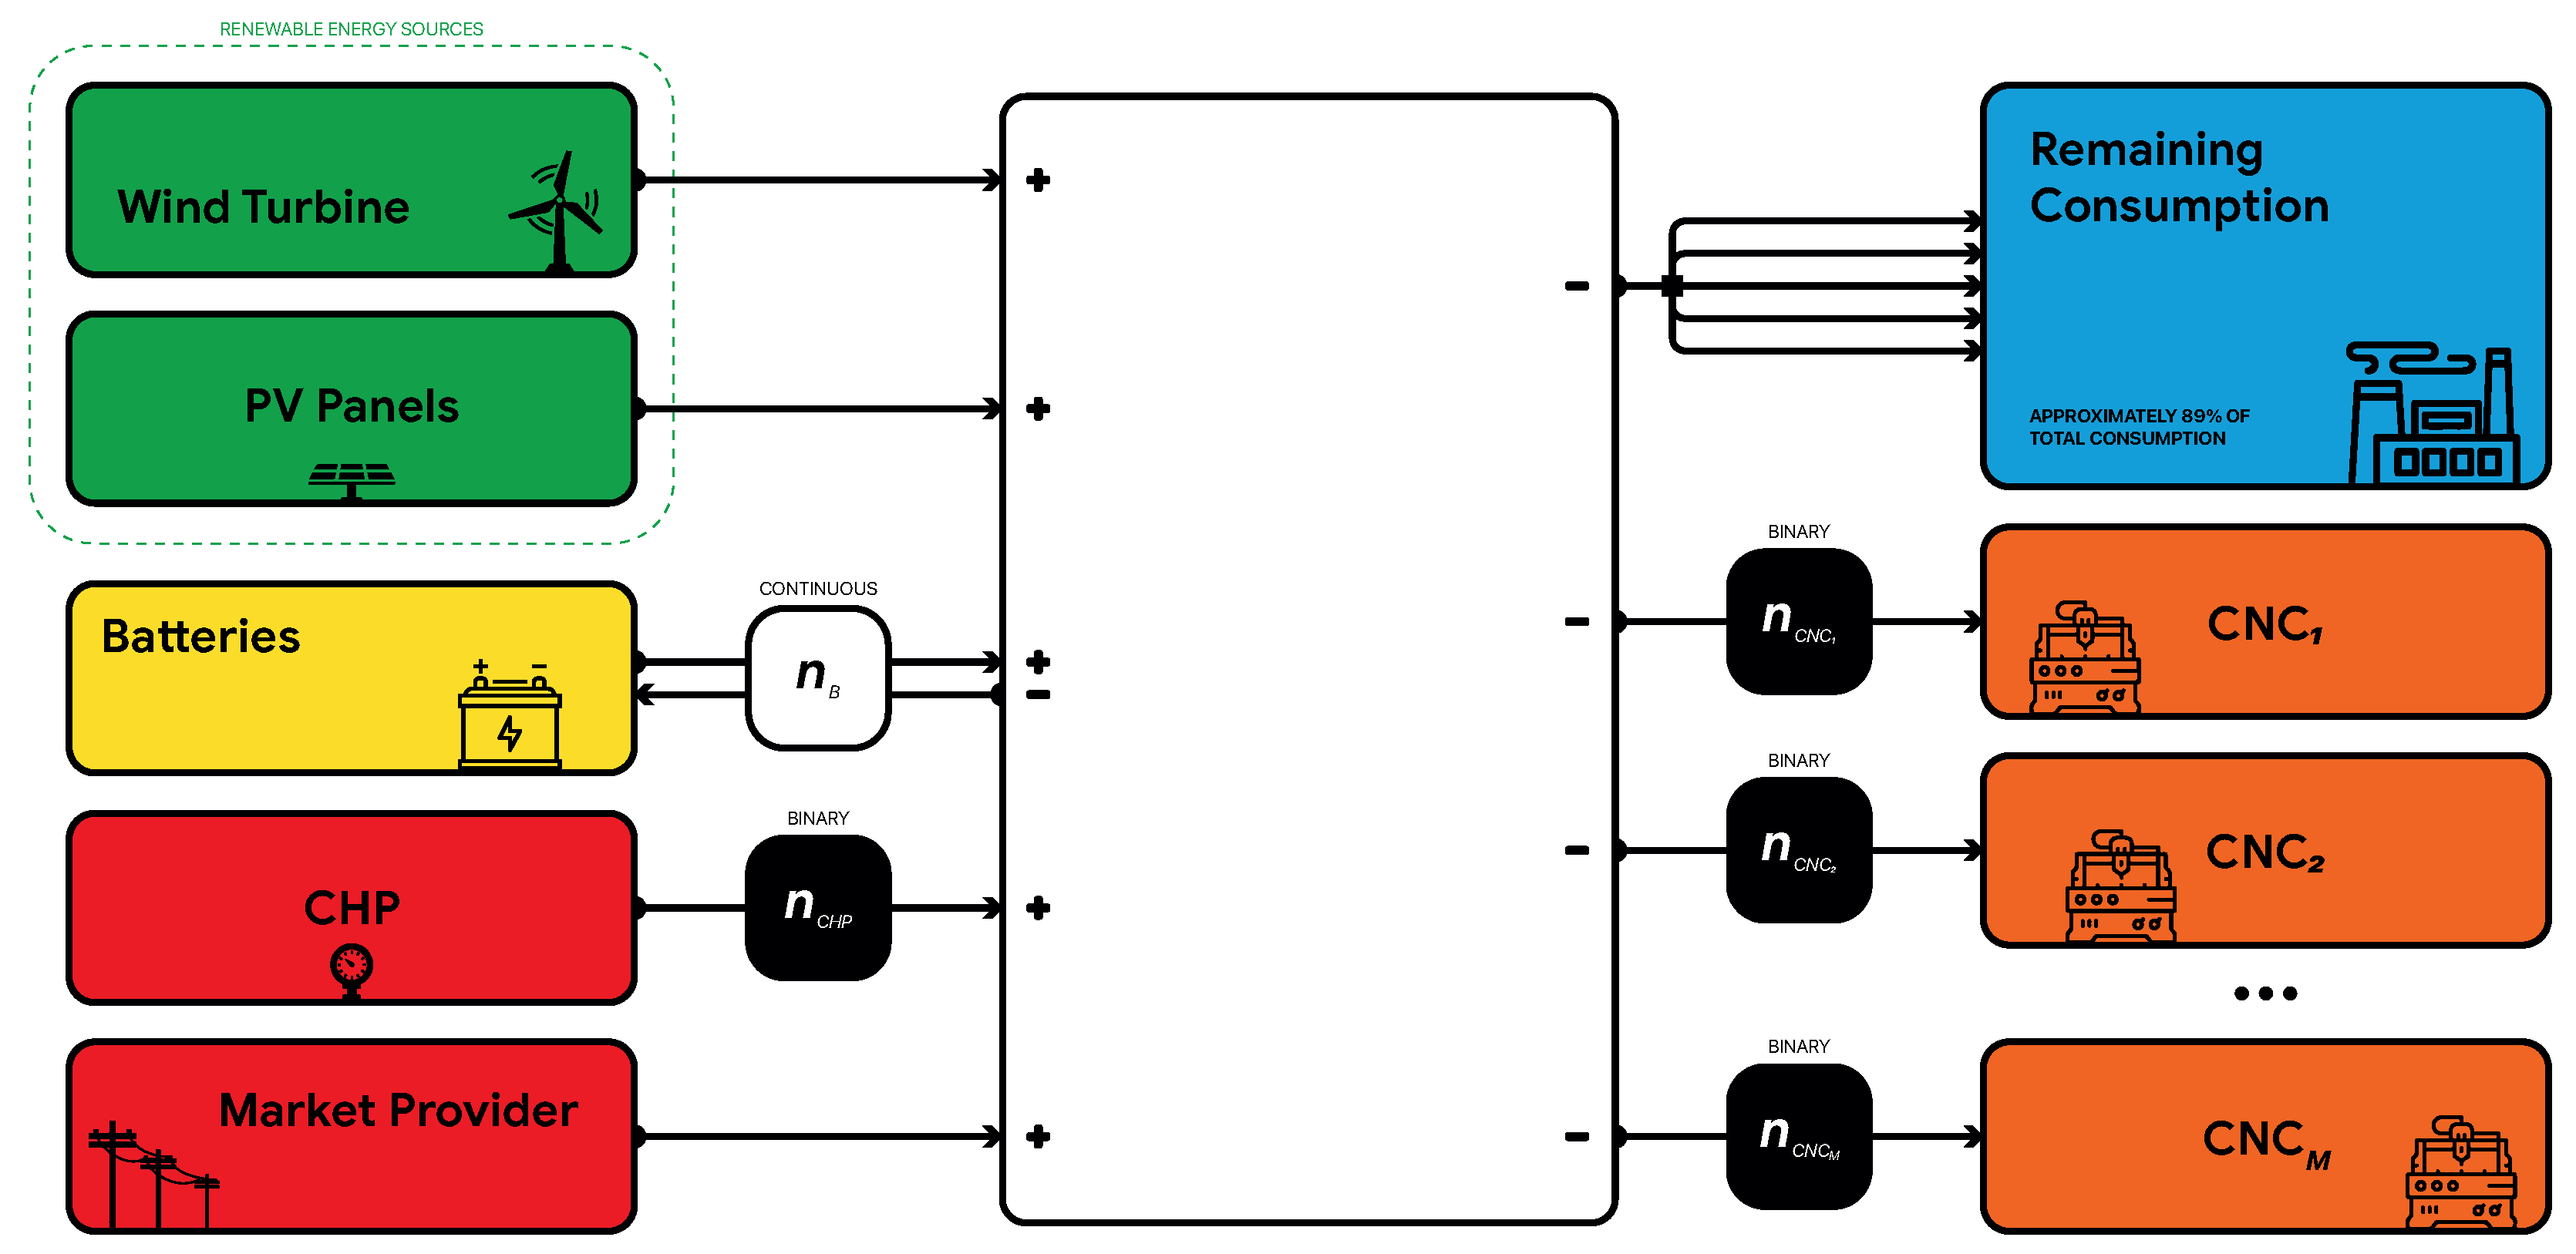
5. Renewable Integration
- Renewable energy sources: there is a wind turbine and a solar plant in this factory.
- Battery bank (B). Store energy and discharge when it is needed.
- Combined Heat and Power (CHP). Produced energy and heat from gas.
- Remaining consumption: all consumption that cannot be manipulated. It is about 90% of the total.
- Manipulable demand as a group of CNCs.
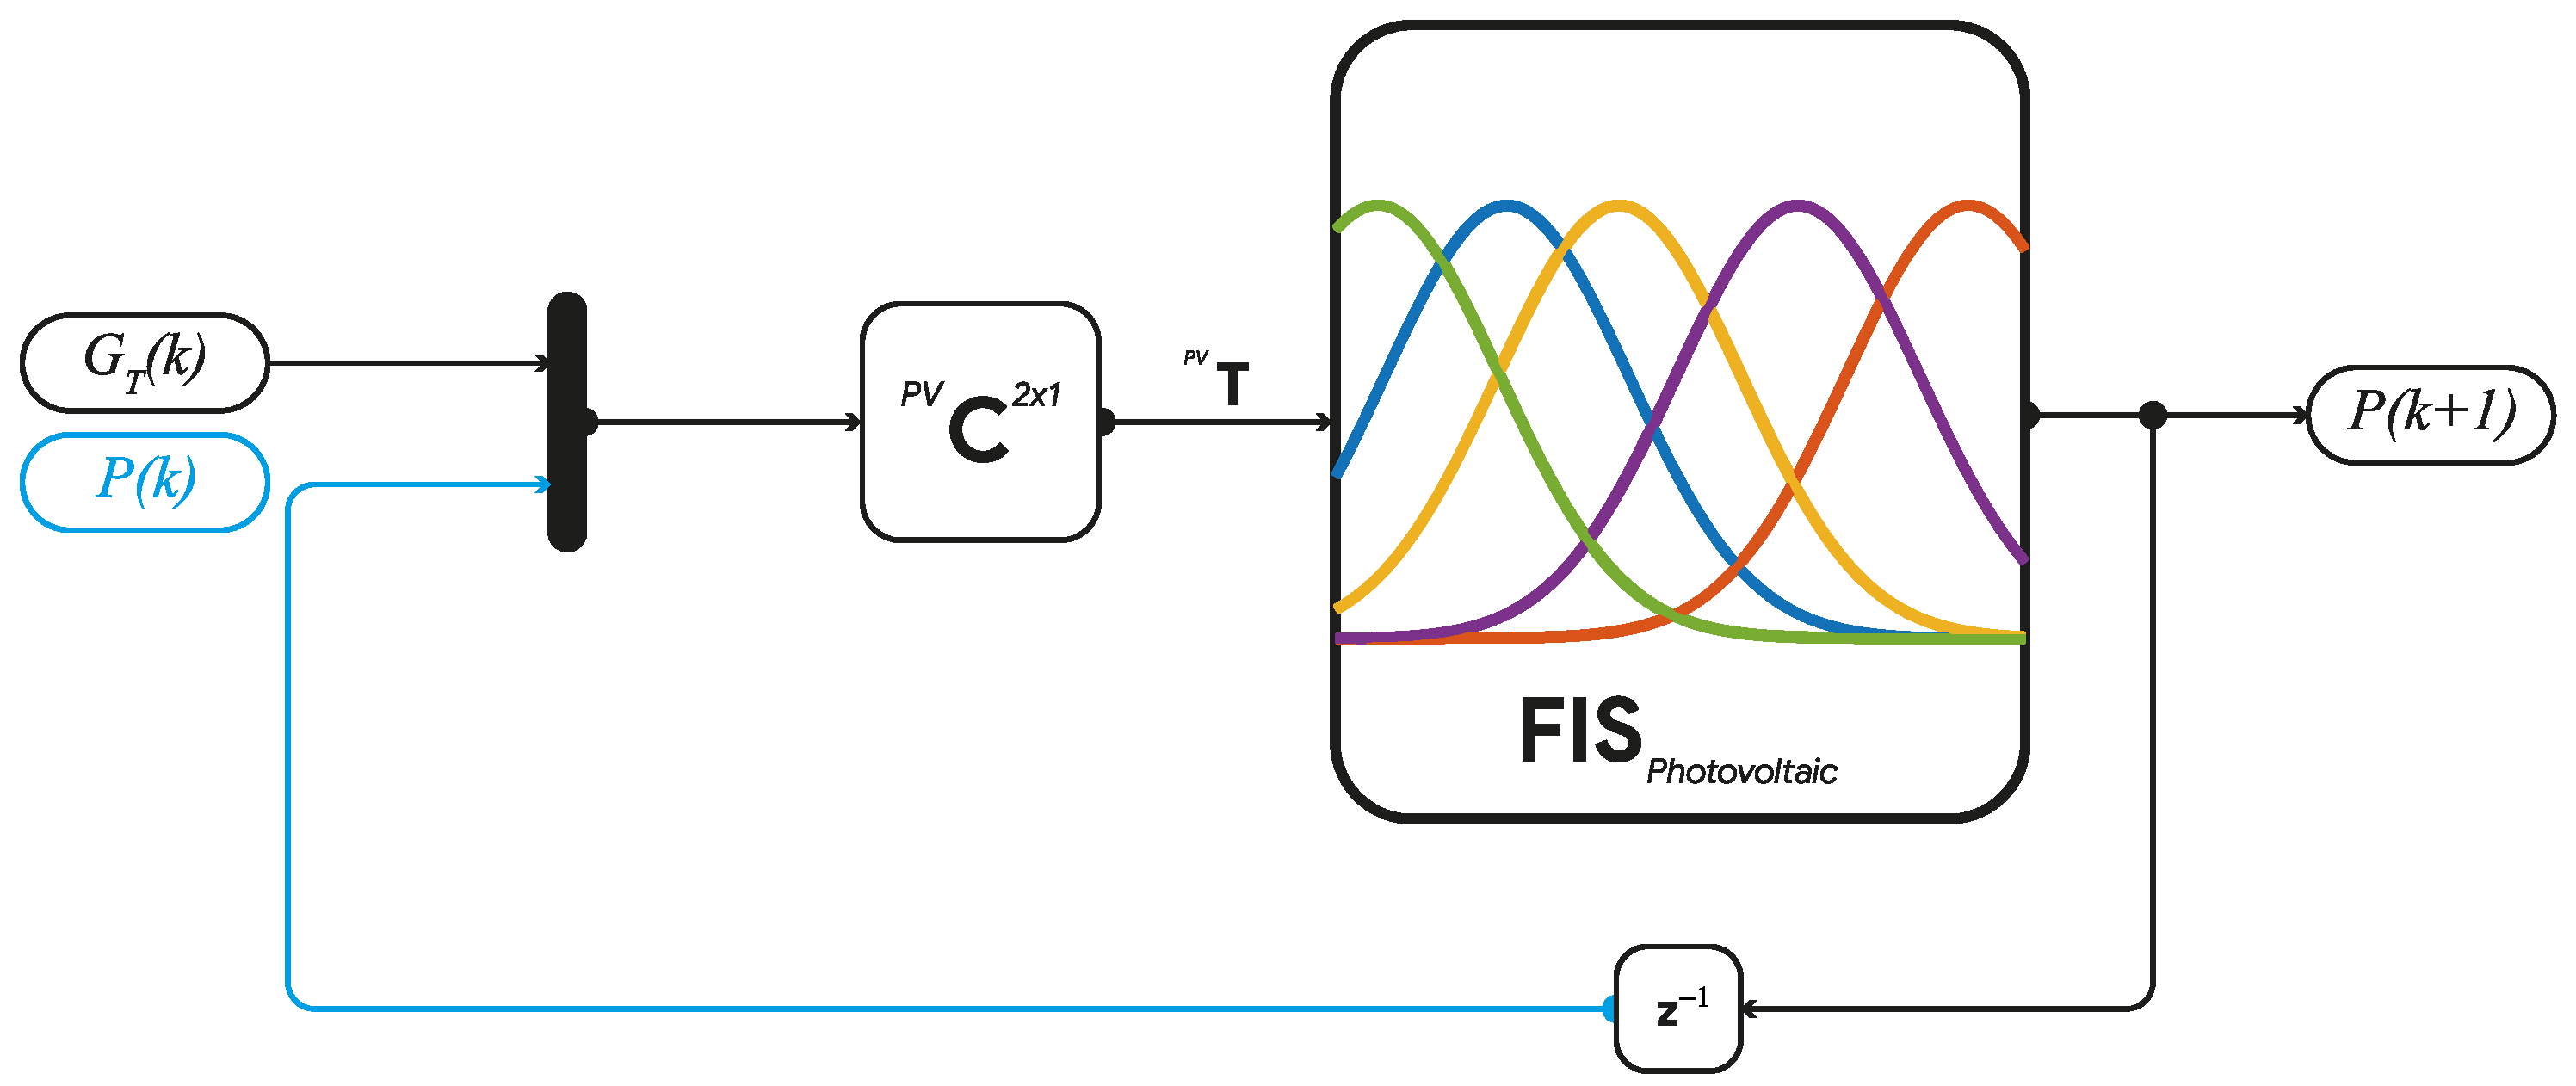
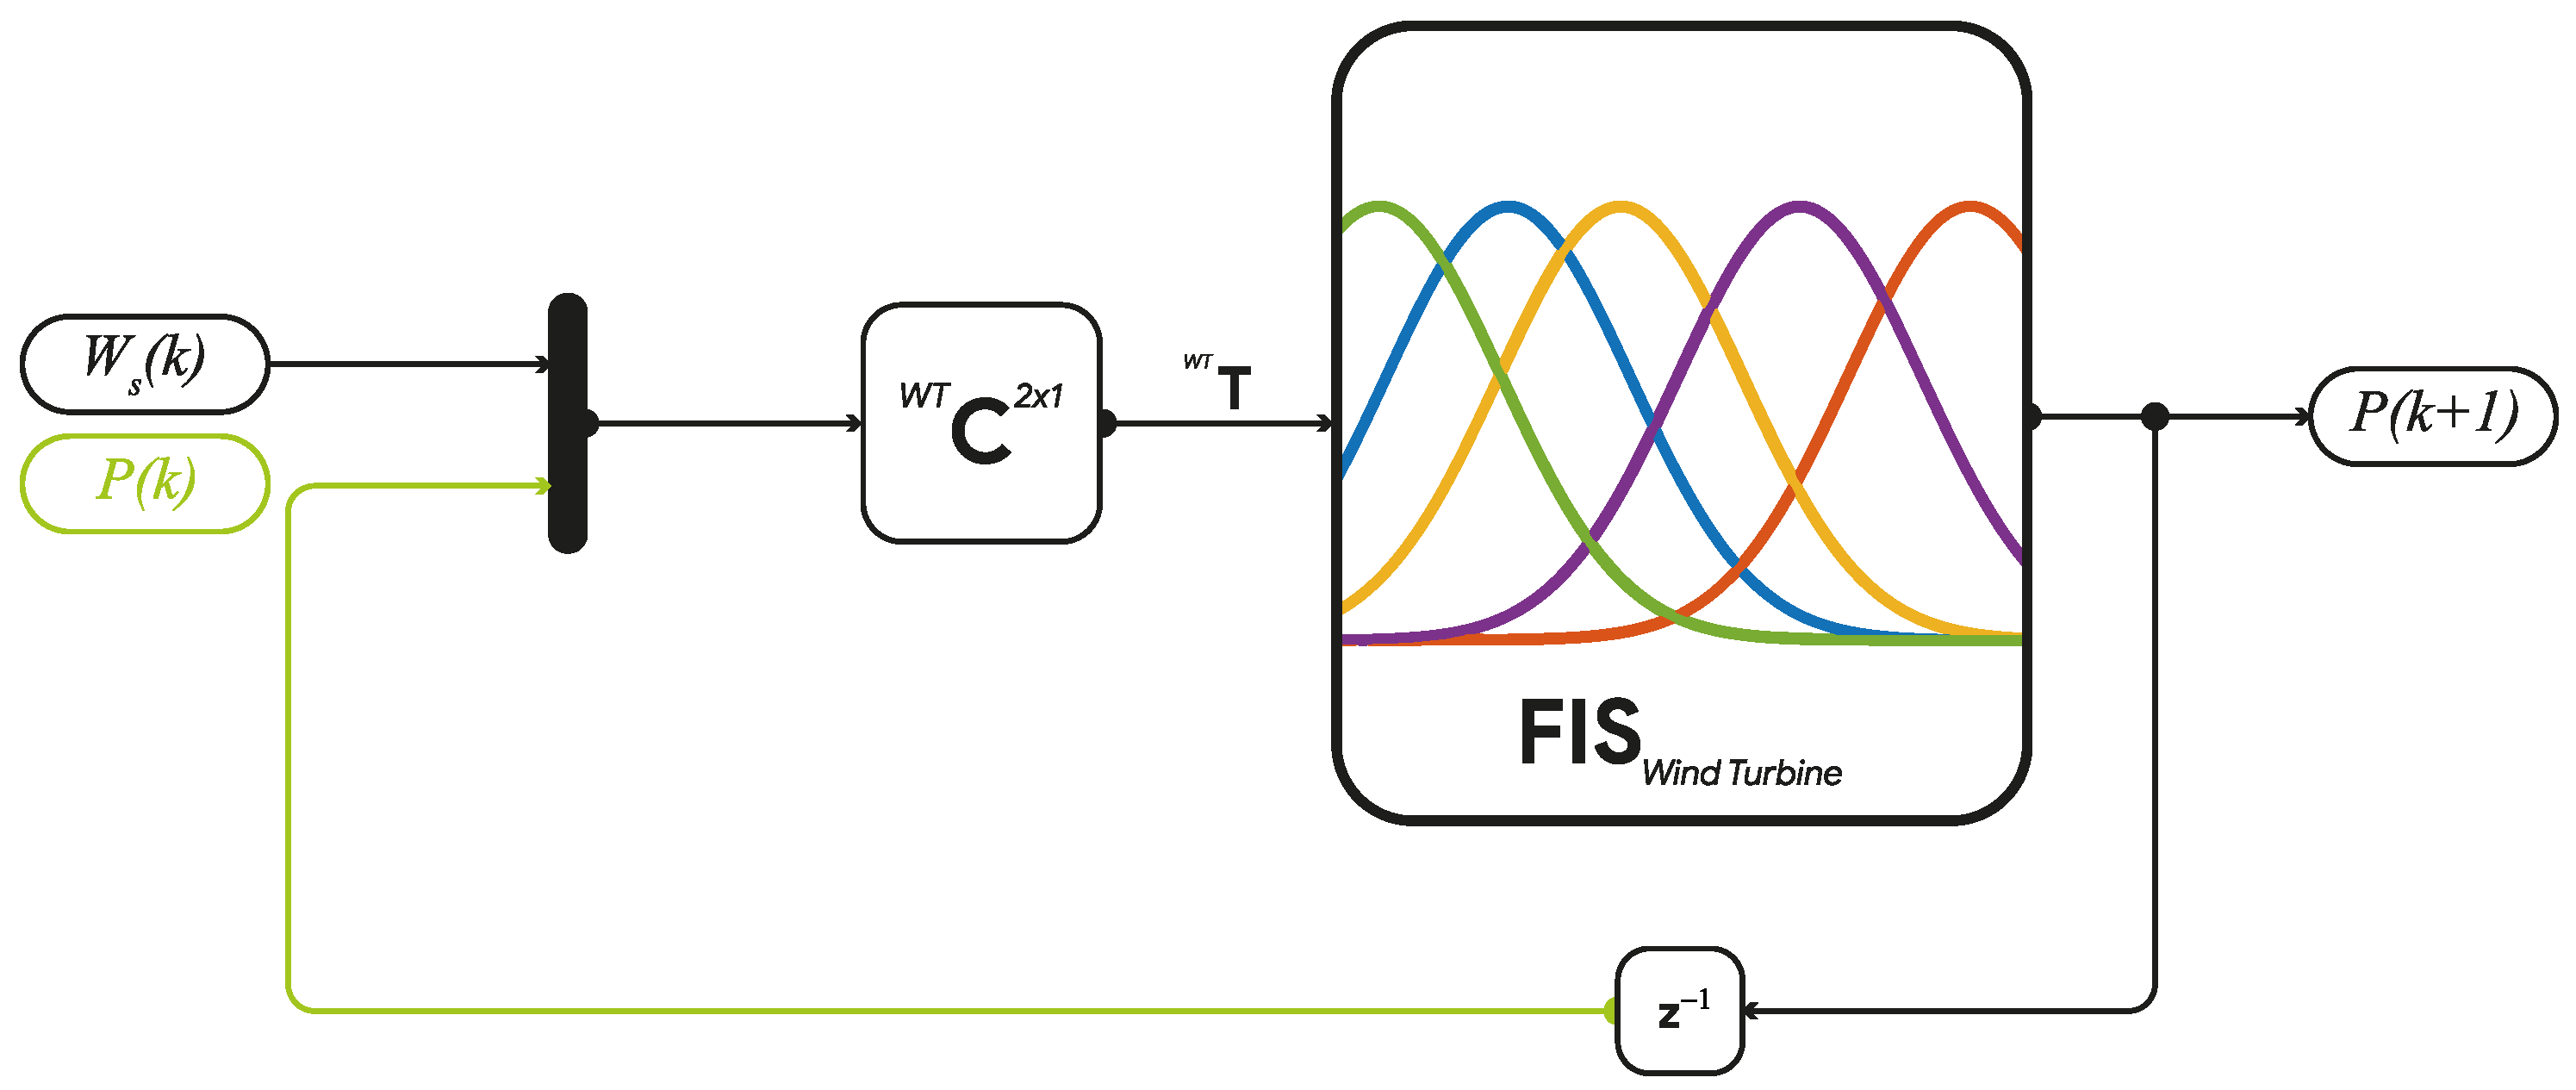
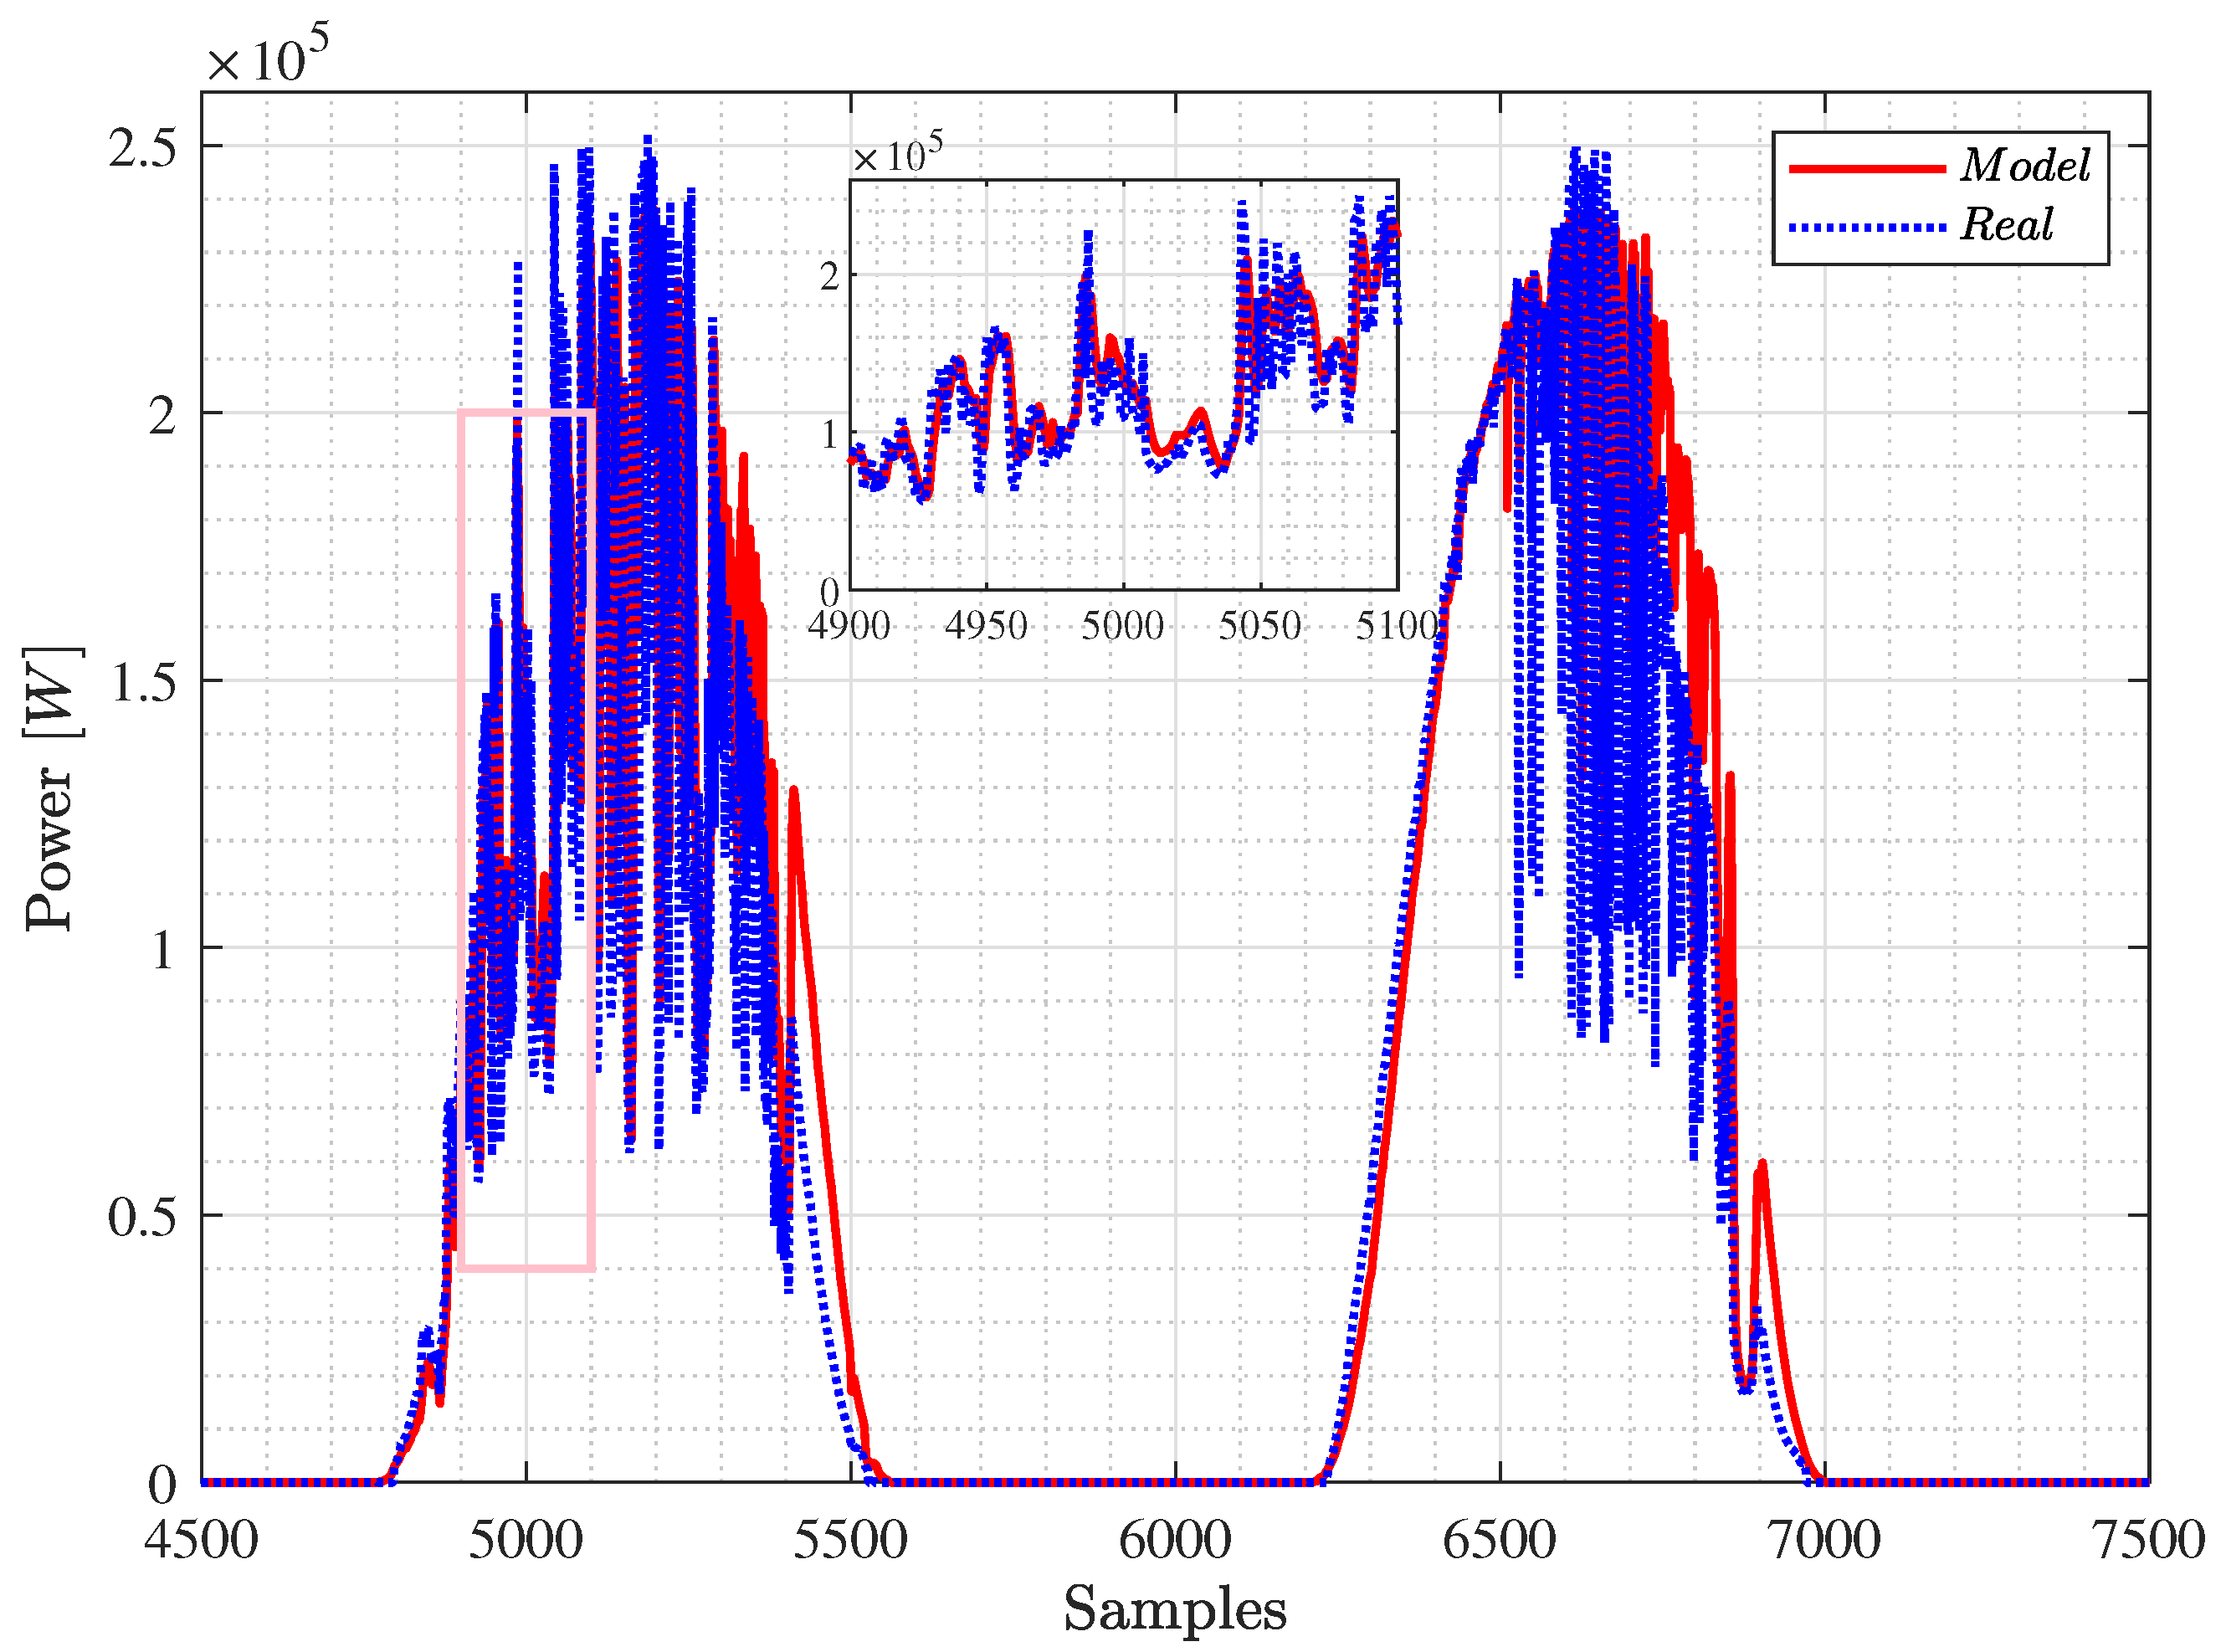
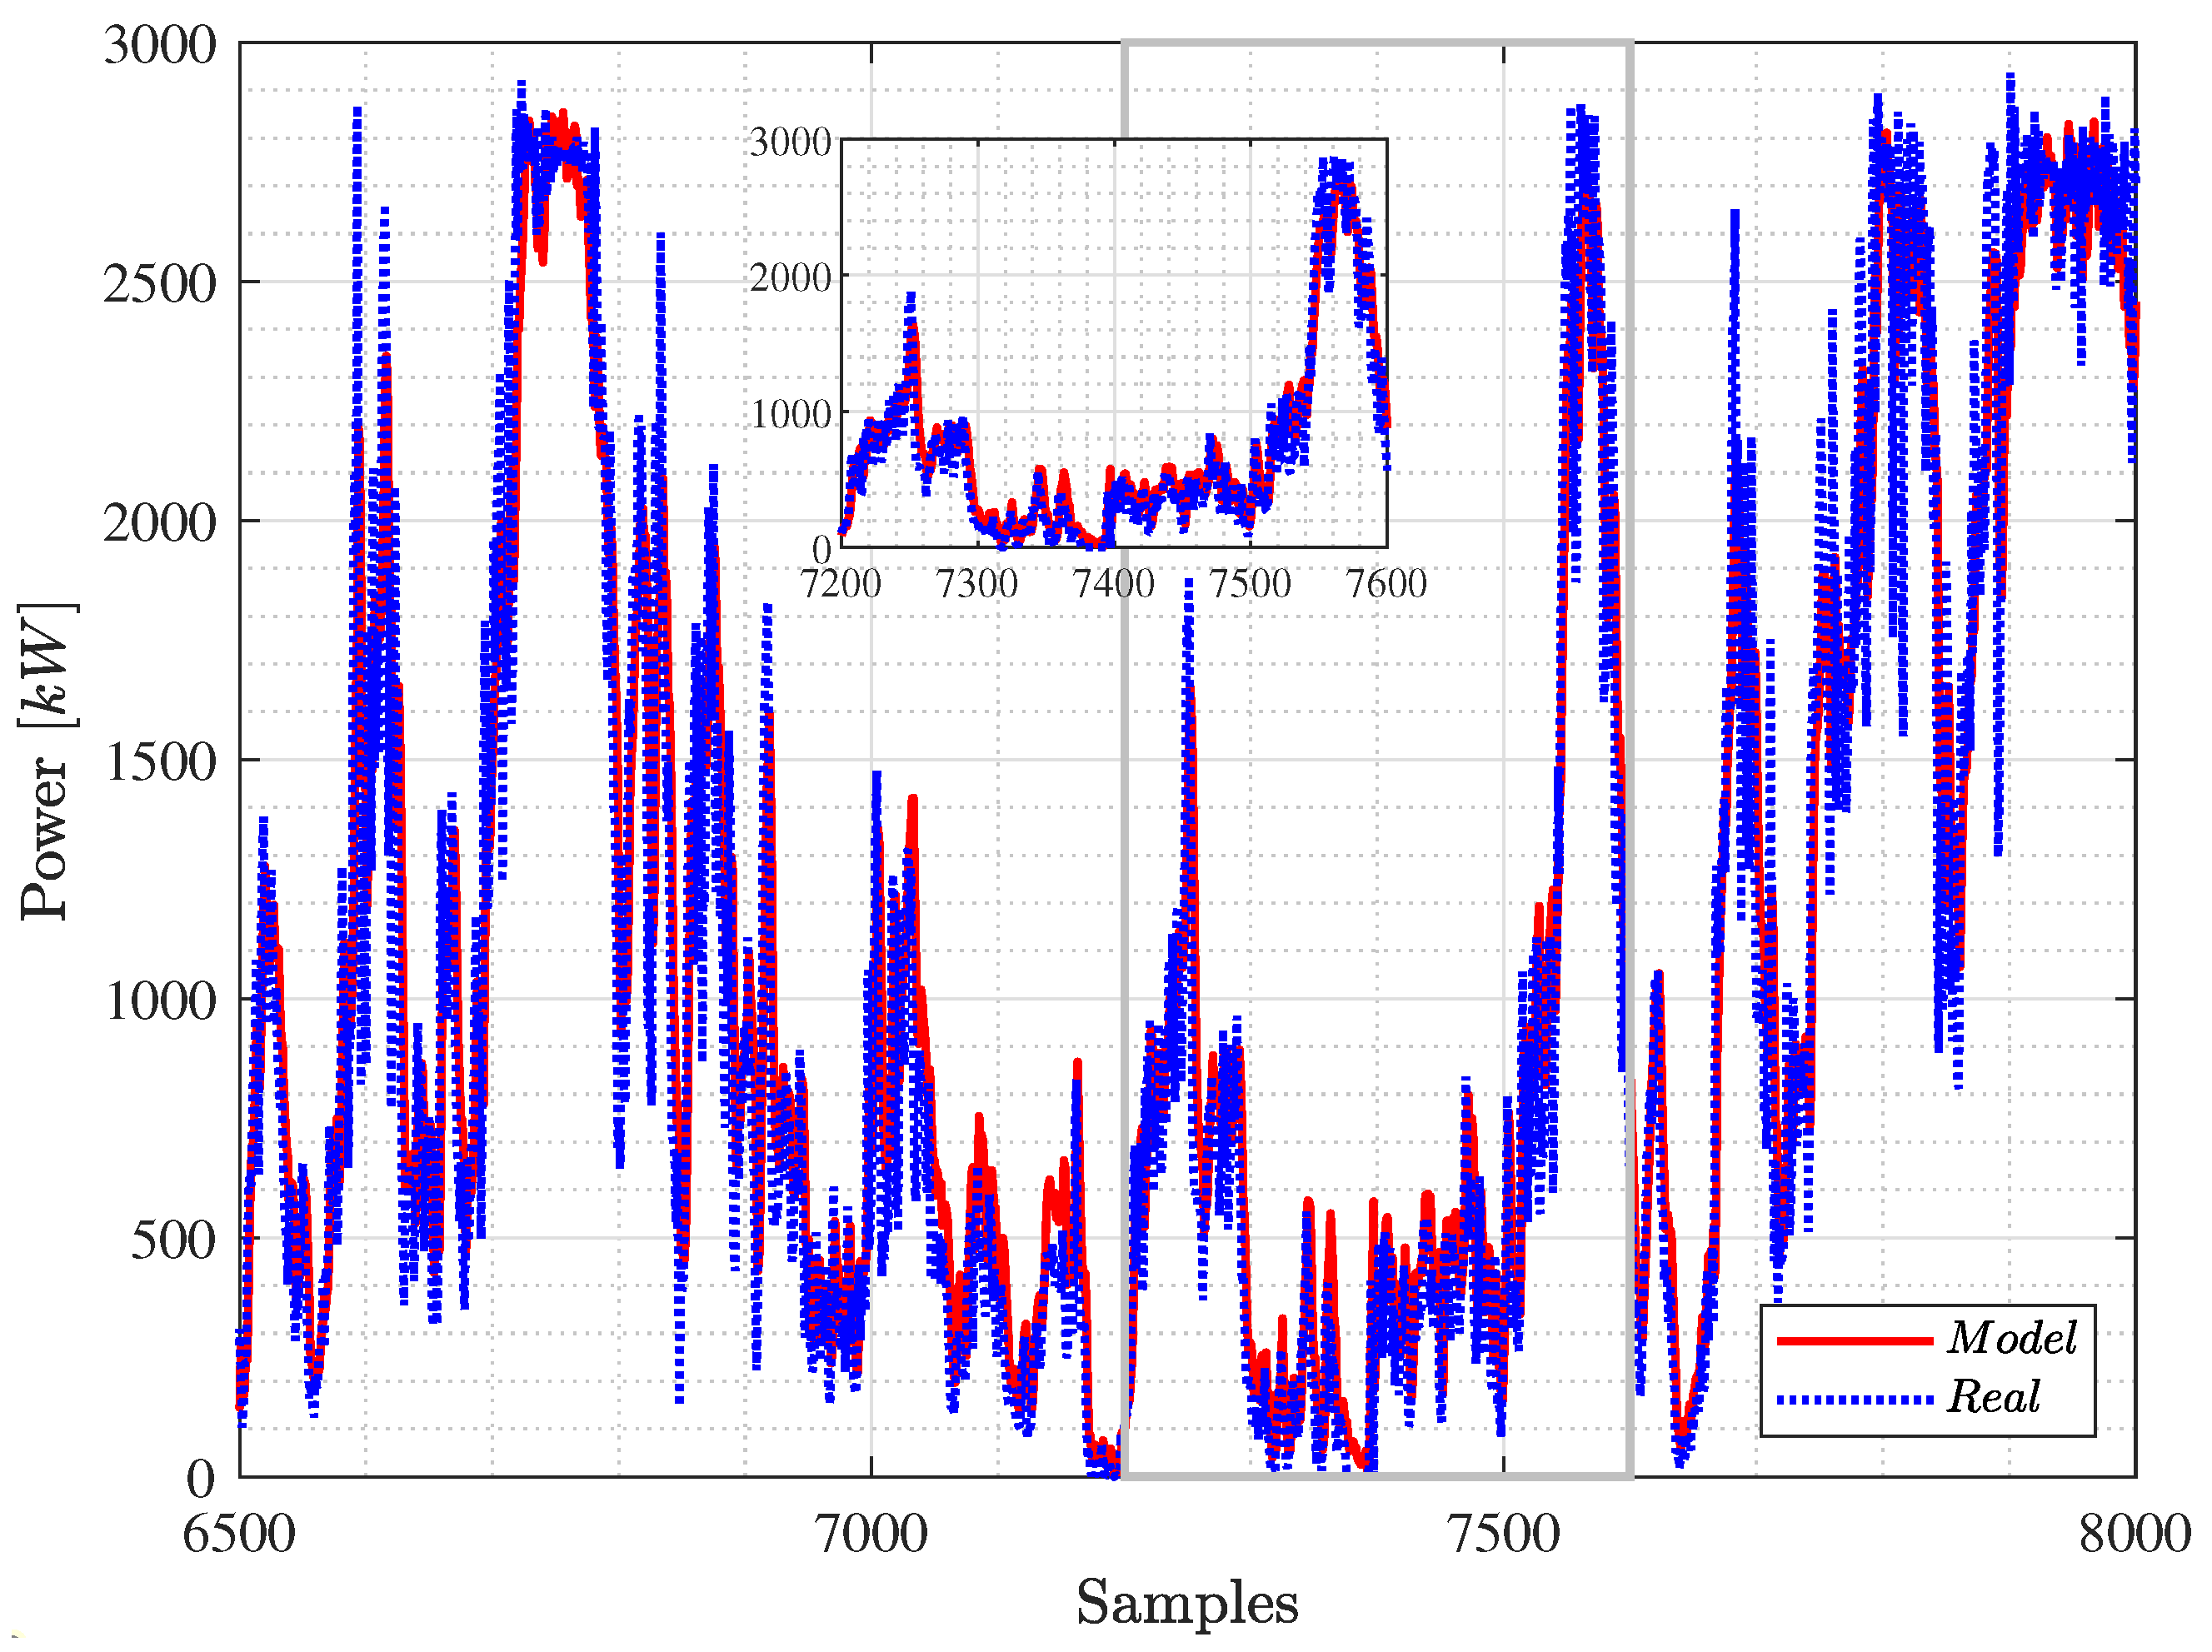
5.1. Renewable Energy Sources Modelling
Neurofuzzy Model of RES
5.2. Tool Architecture
- Actions that are executed automatically, such as battery operation.
- Operator aids for starting up the various machines in the manufacturing process. These are shown through the visualisation tool below.
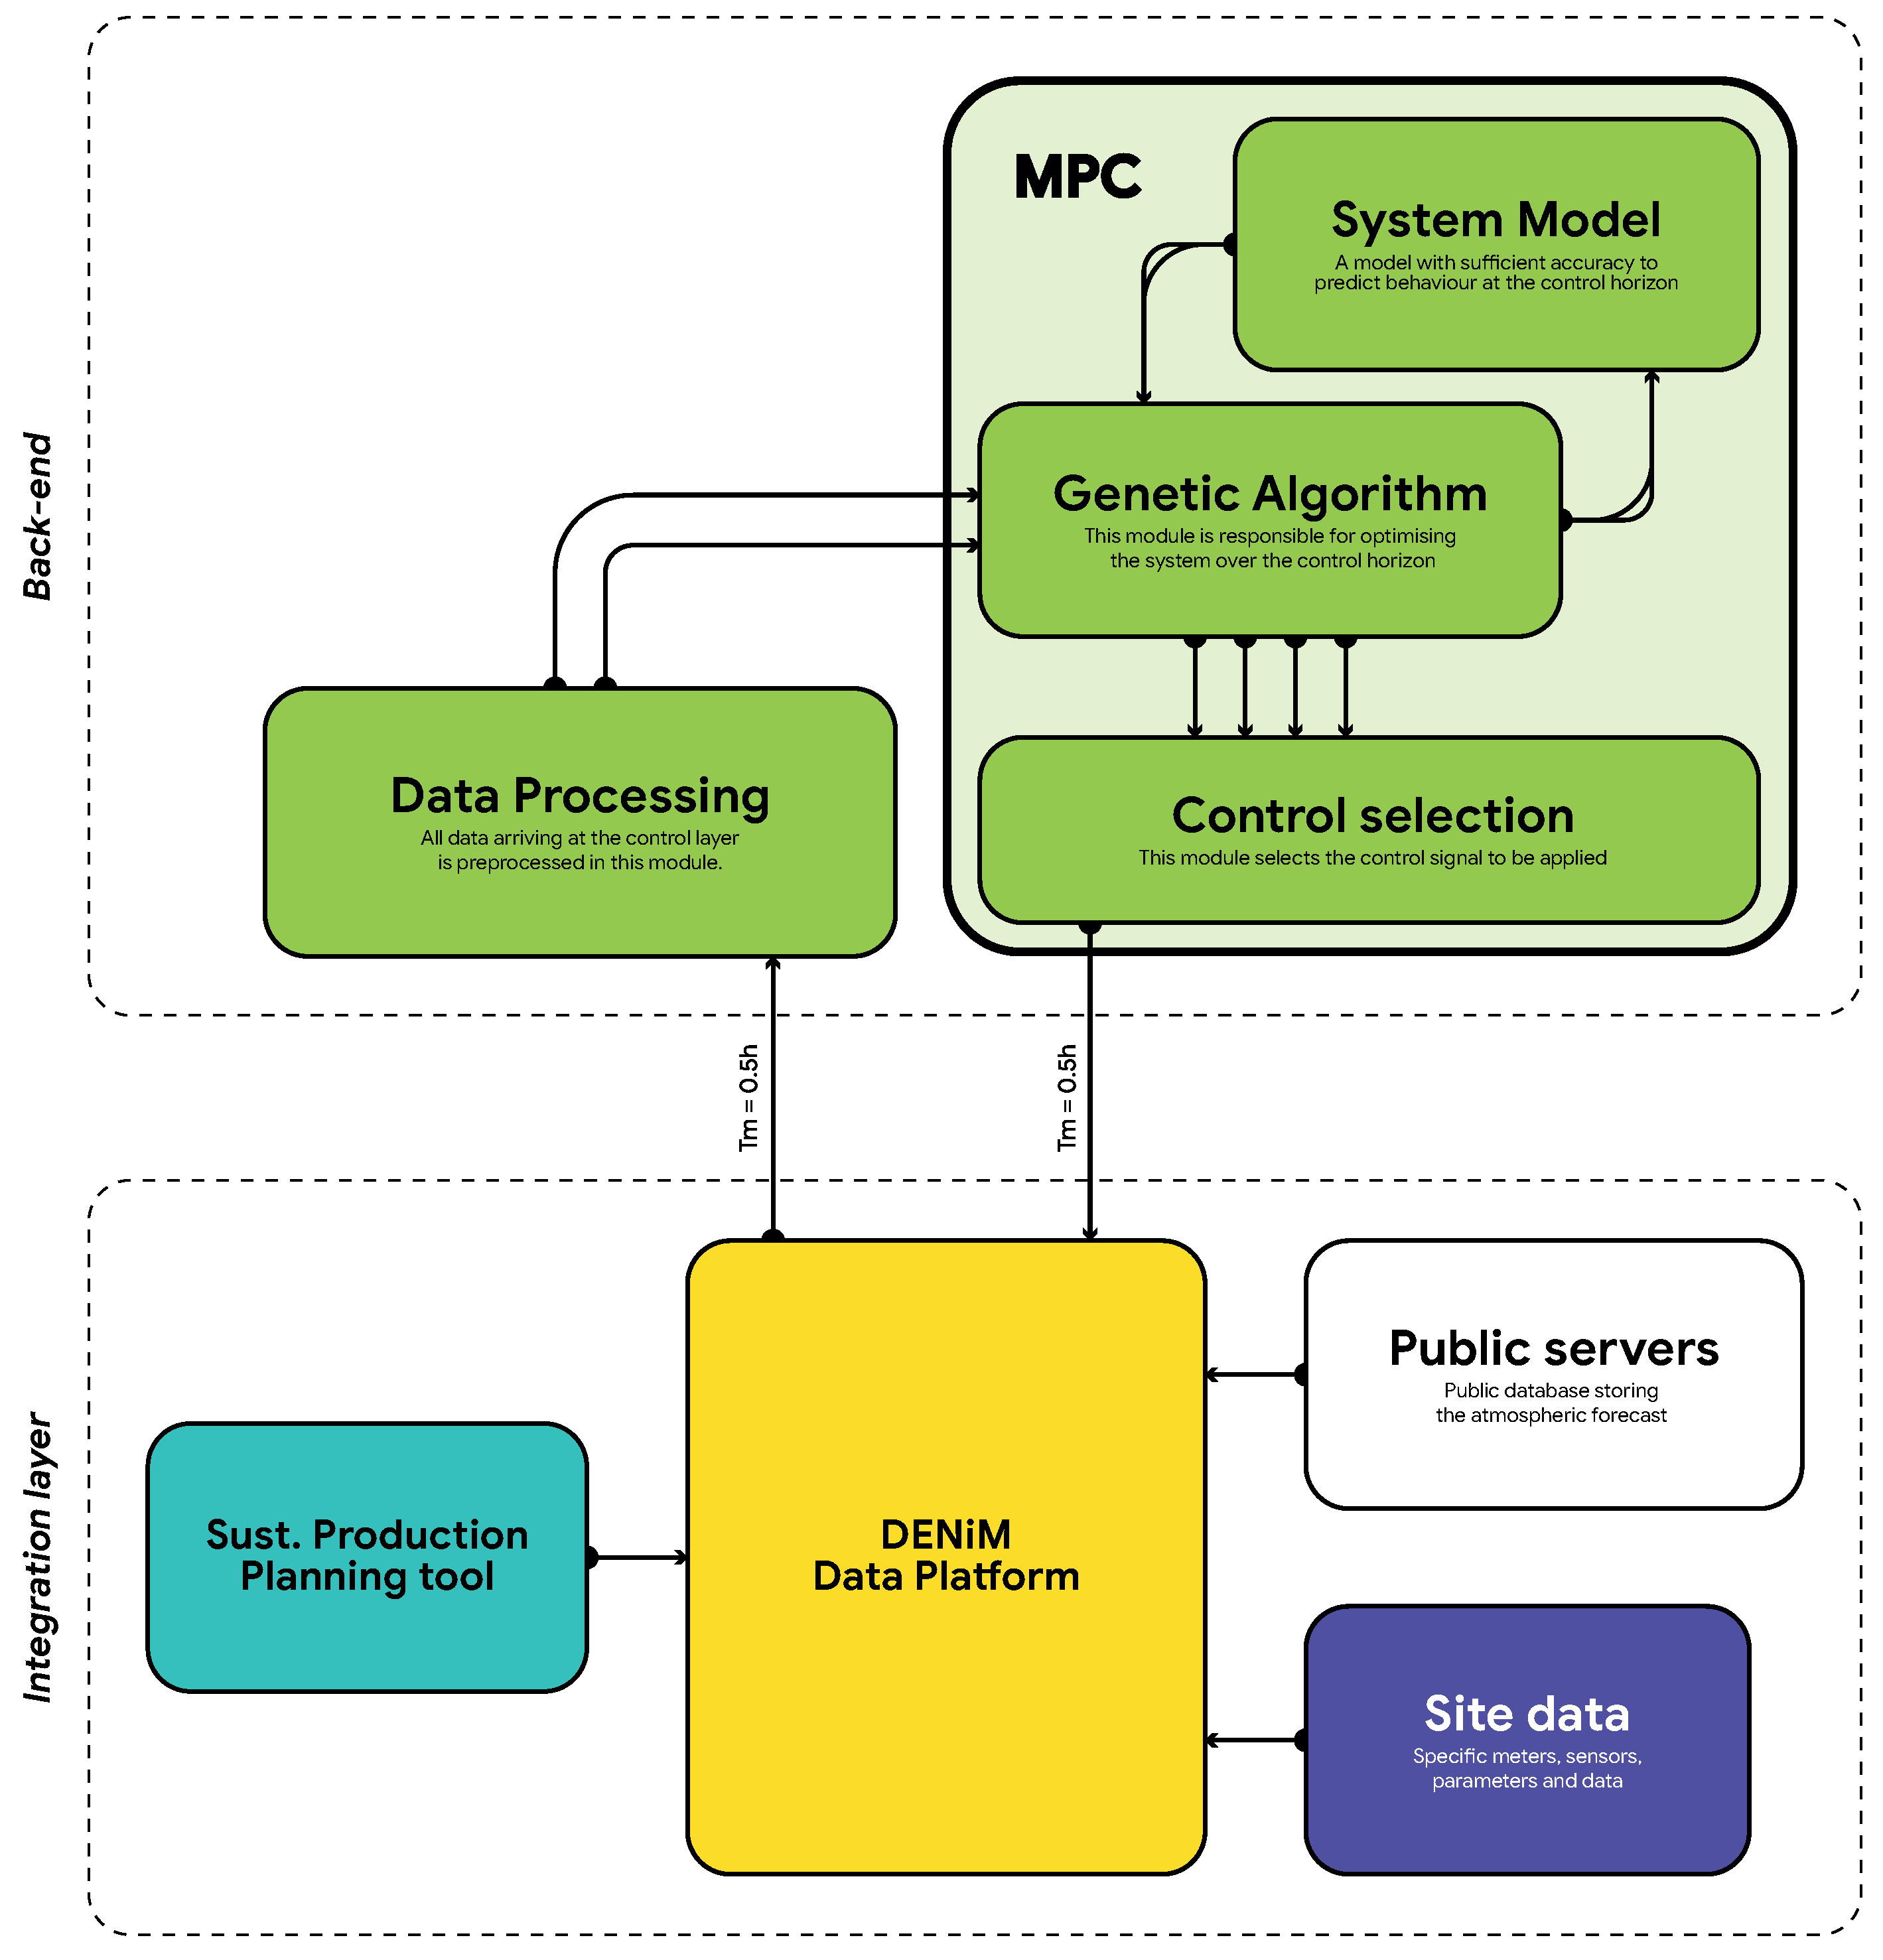
5.2.1. Model Predictive Control
5.2.2. Data Processing Module
- Input data for the models such as wind speed, solar radiation, electricity market prices, and gas prices. These data are obtained from forecasting databases that are updated in real time.
- Feedback from the plant. Data from the plant’s sensors, warnings from the plant’s workers, production carried out, etc.
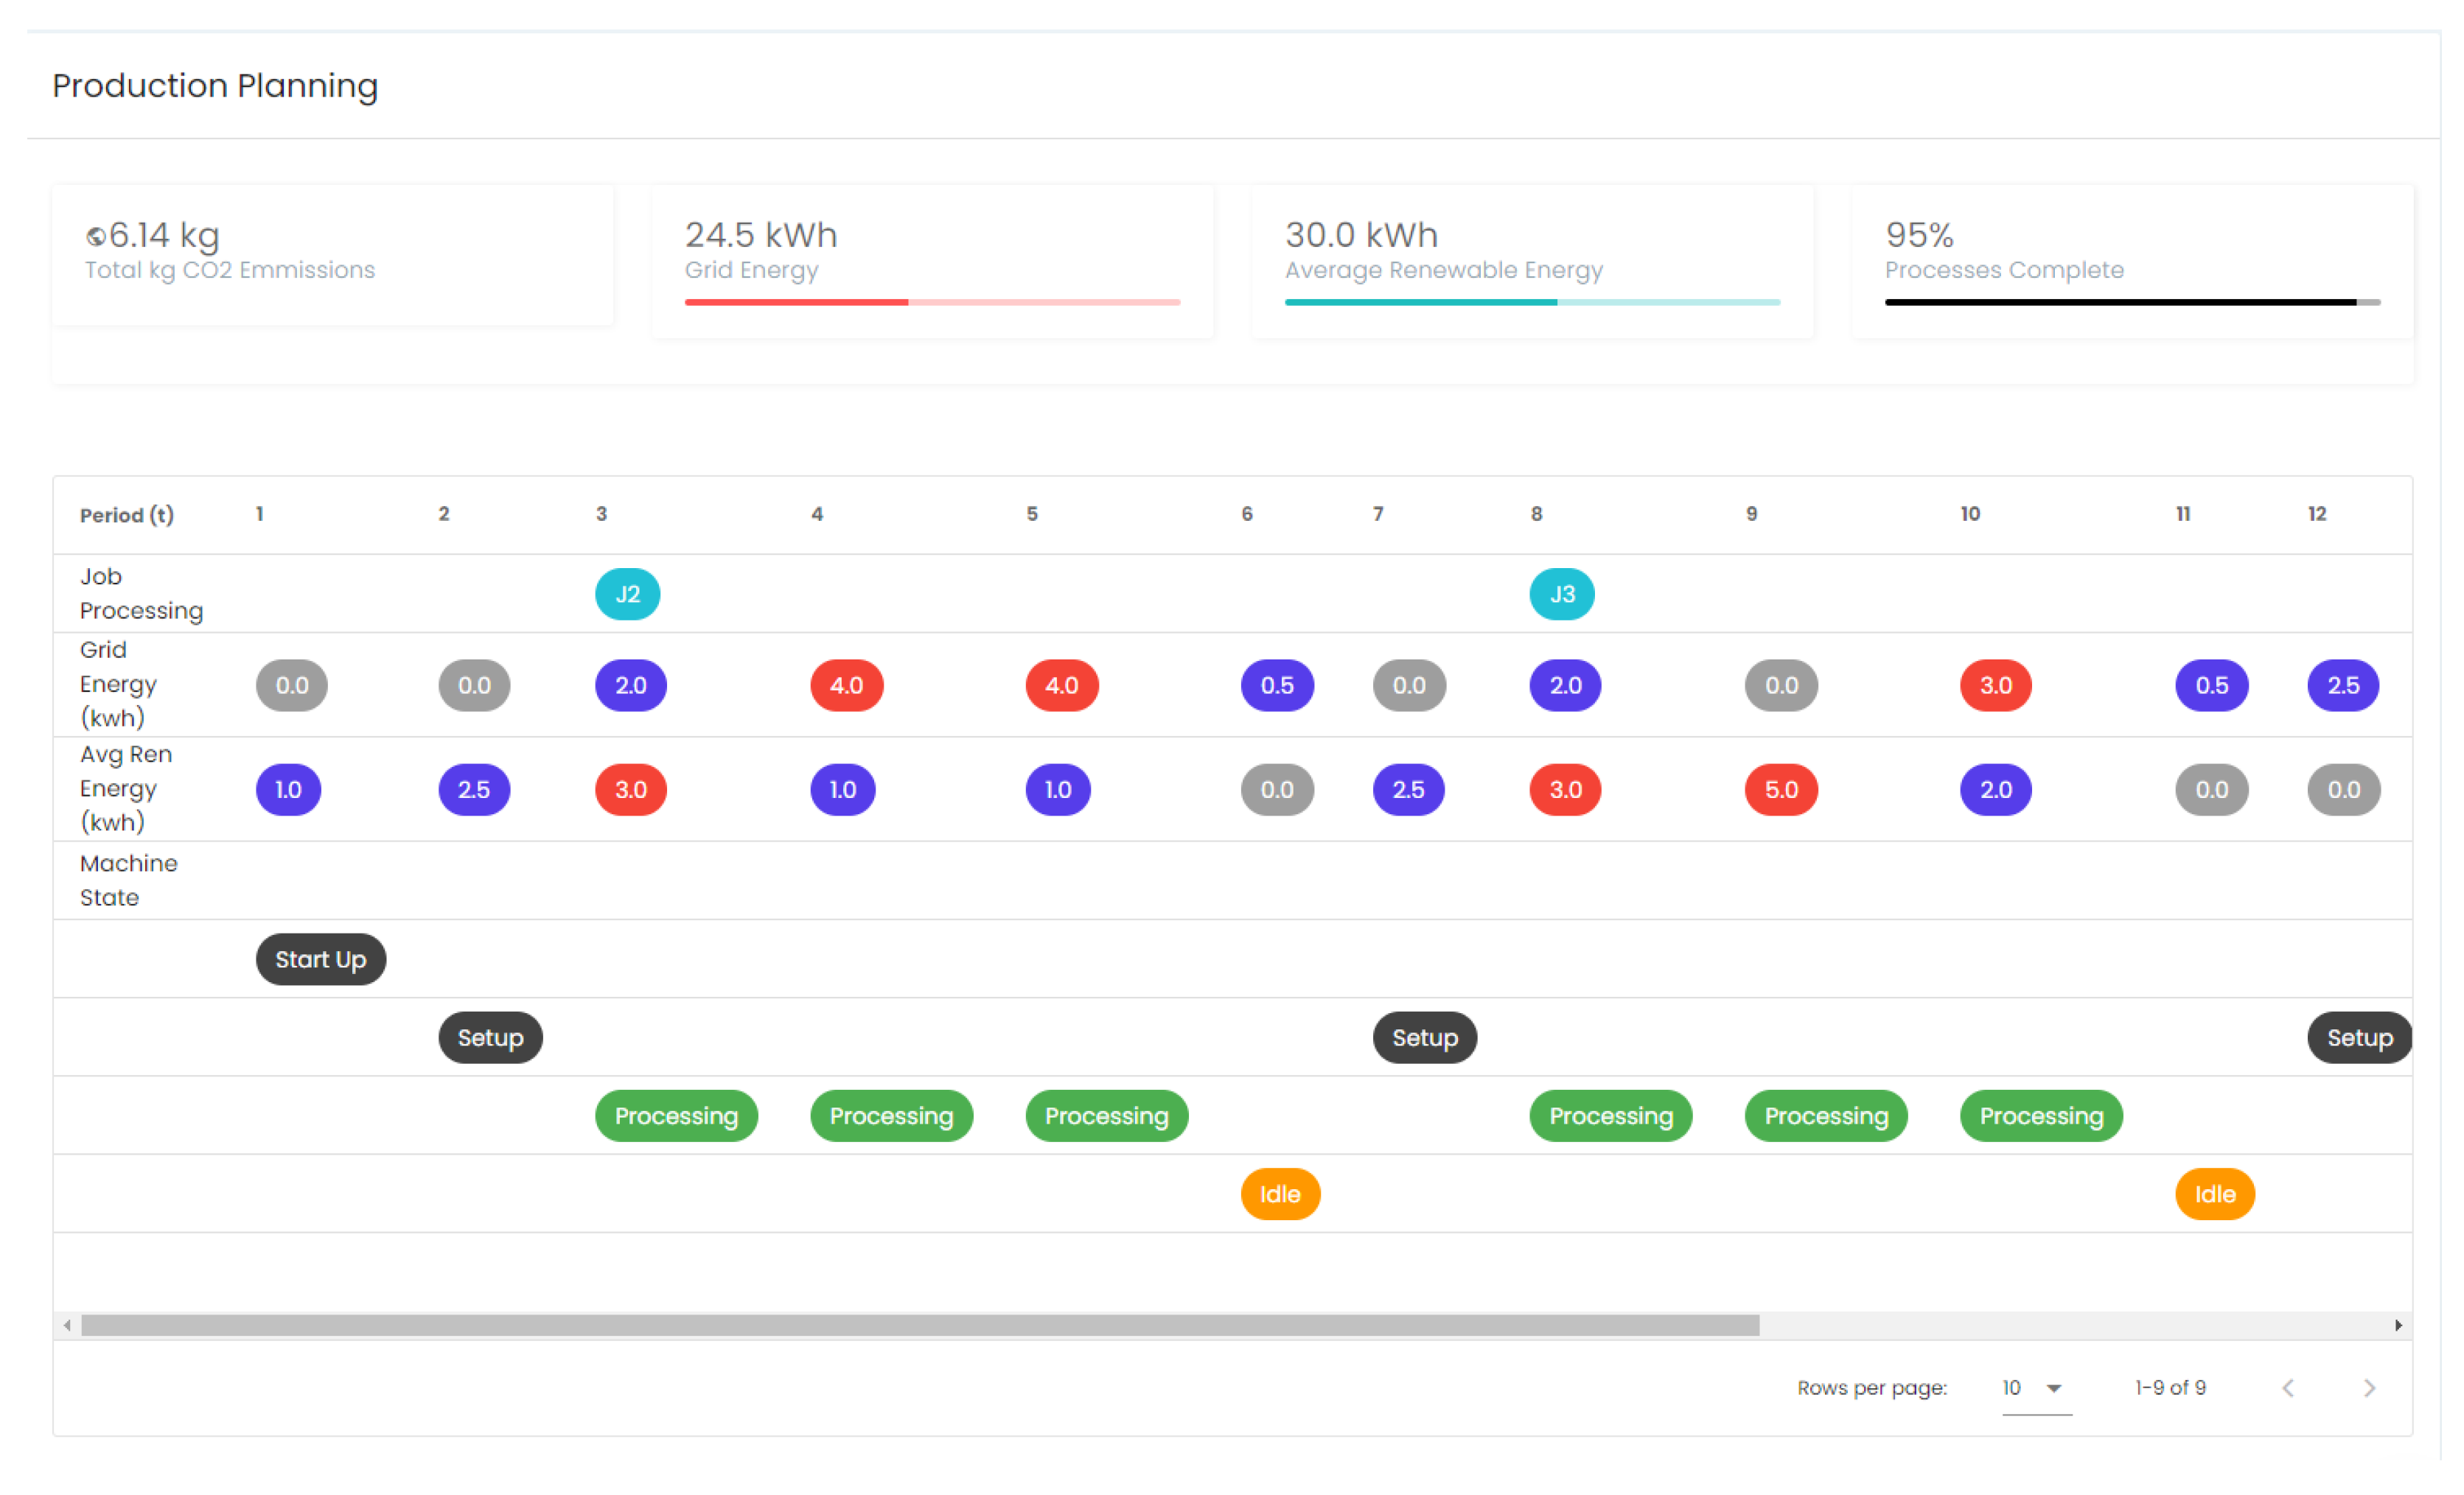
- Data from other tools. Among these data are the schedule optimised by the Sustainable Production Planning tool. This tool optimises the daily schedule by taking into account the carbon footprint, CO2 emission reductions, life cycle of the assets, etc. This schedule is incorporated into the MPC as a starting point for optimisation at the beginning of the day.
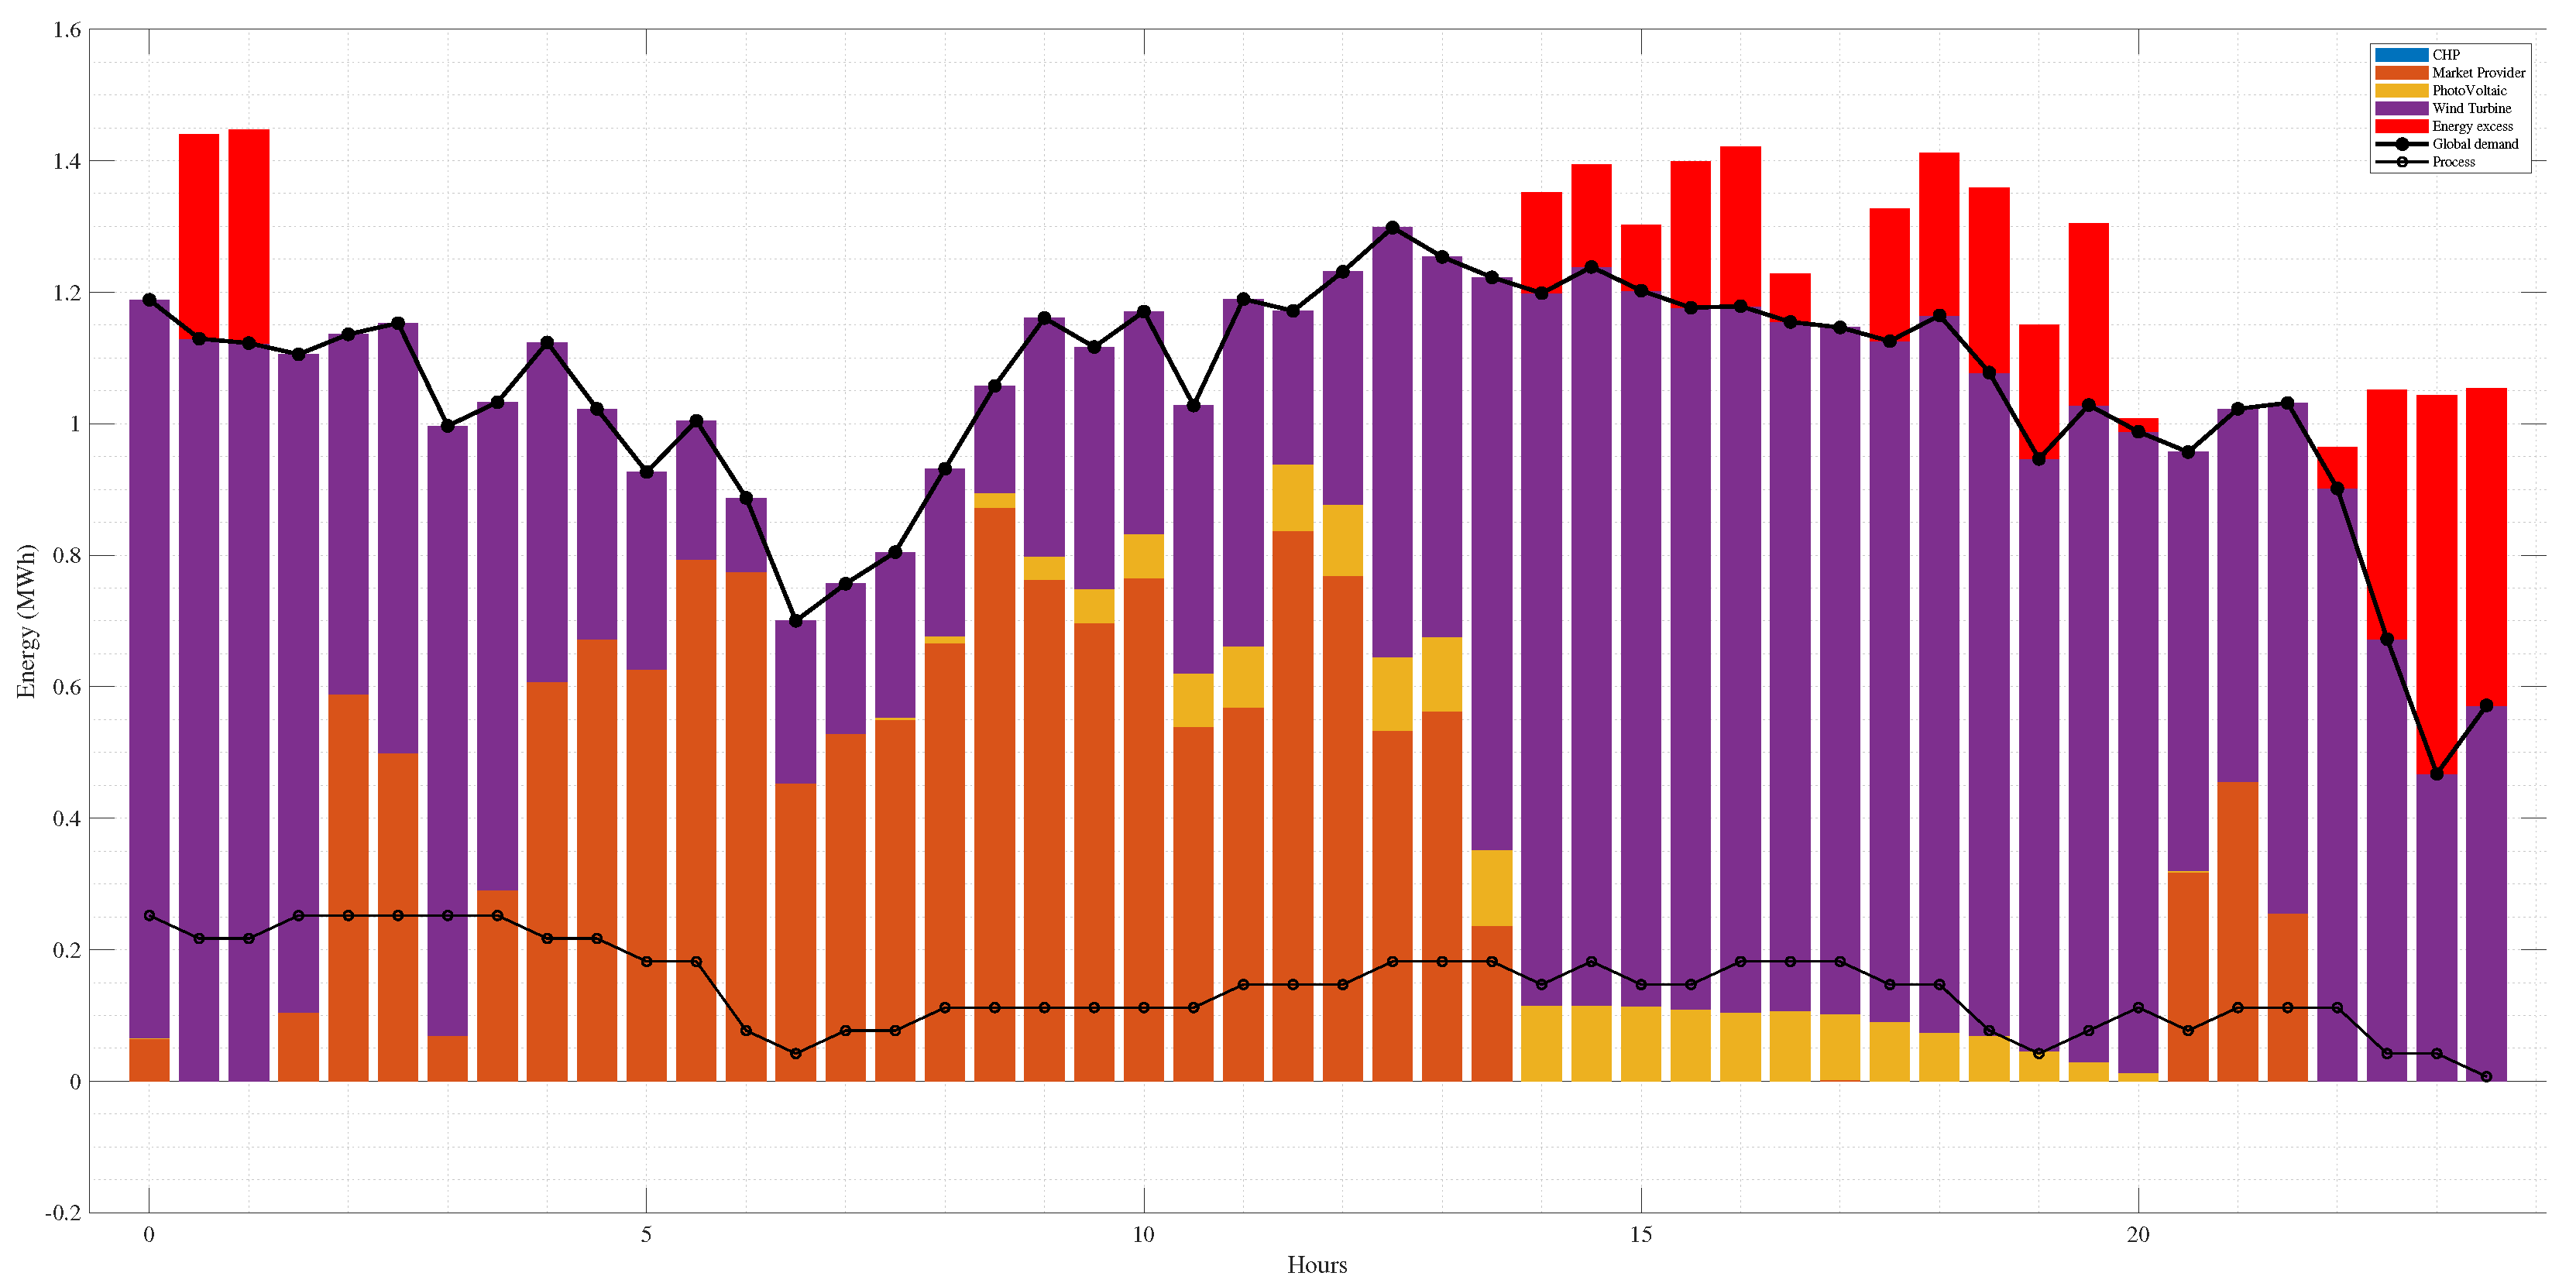
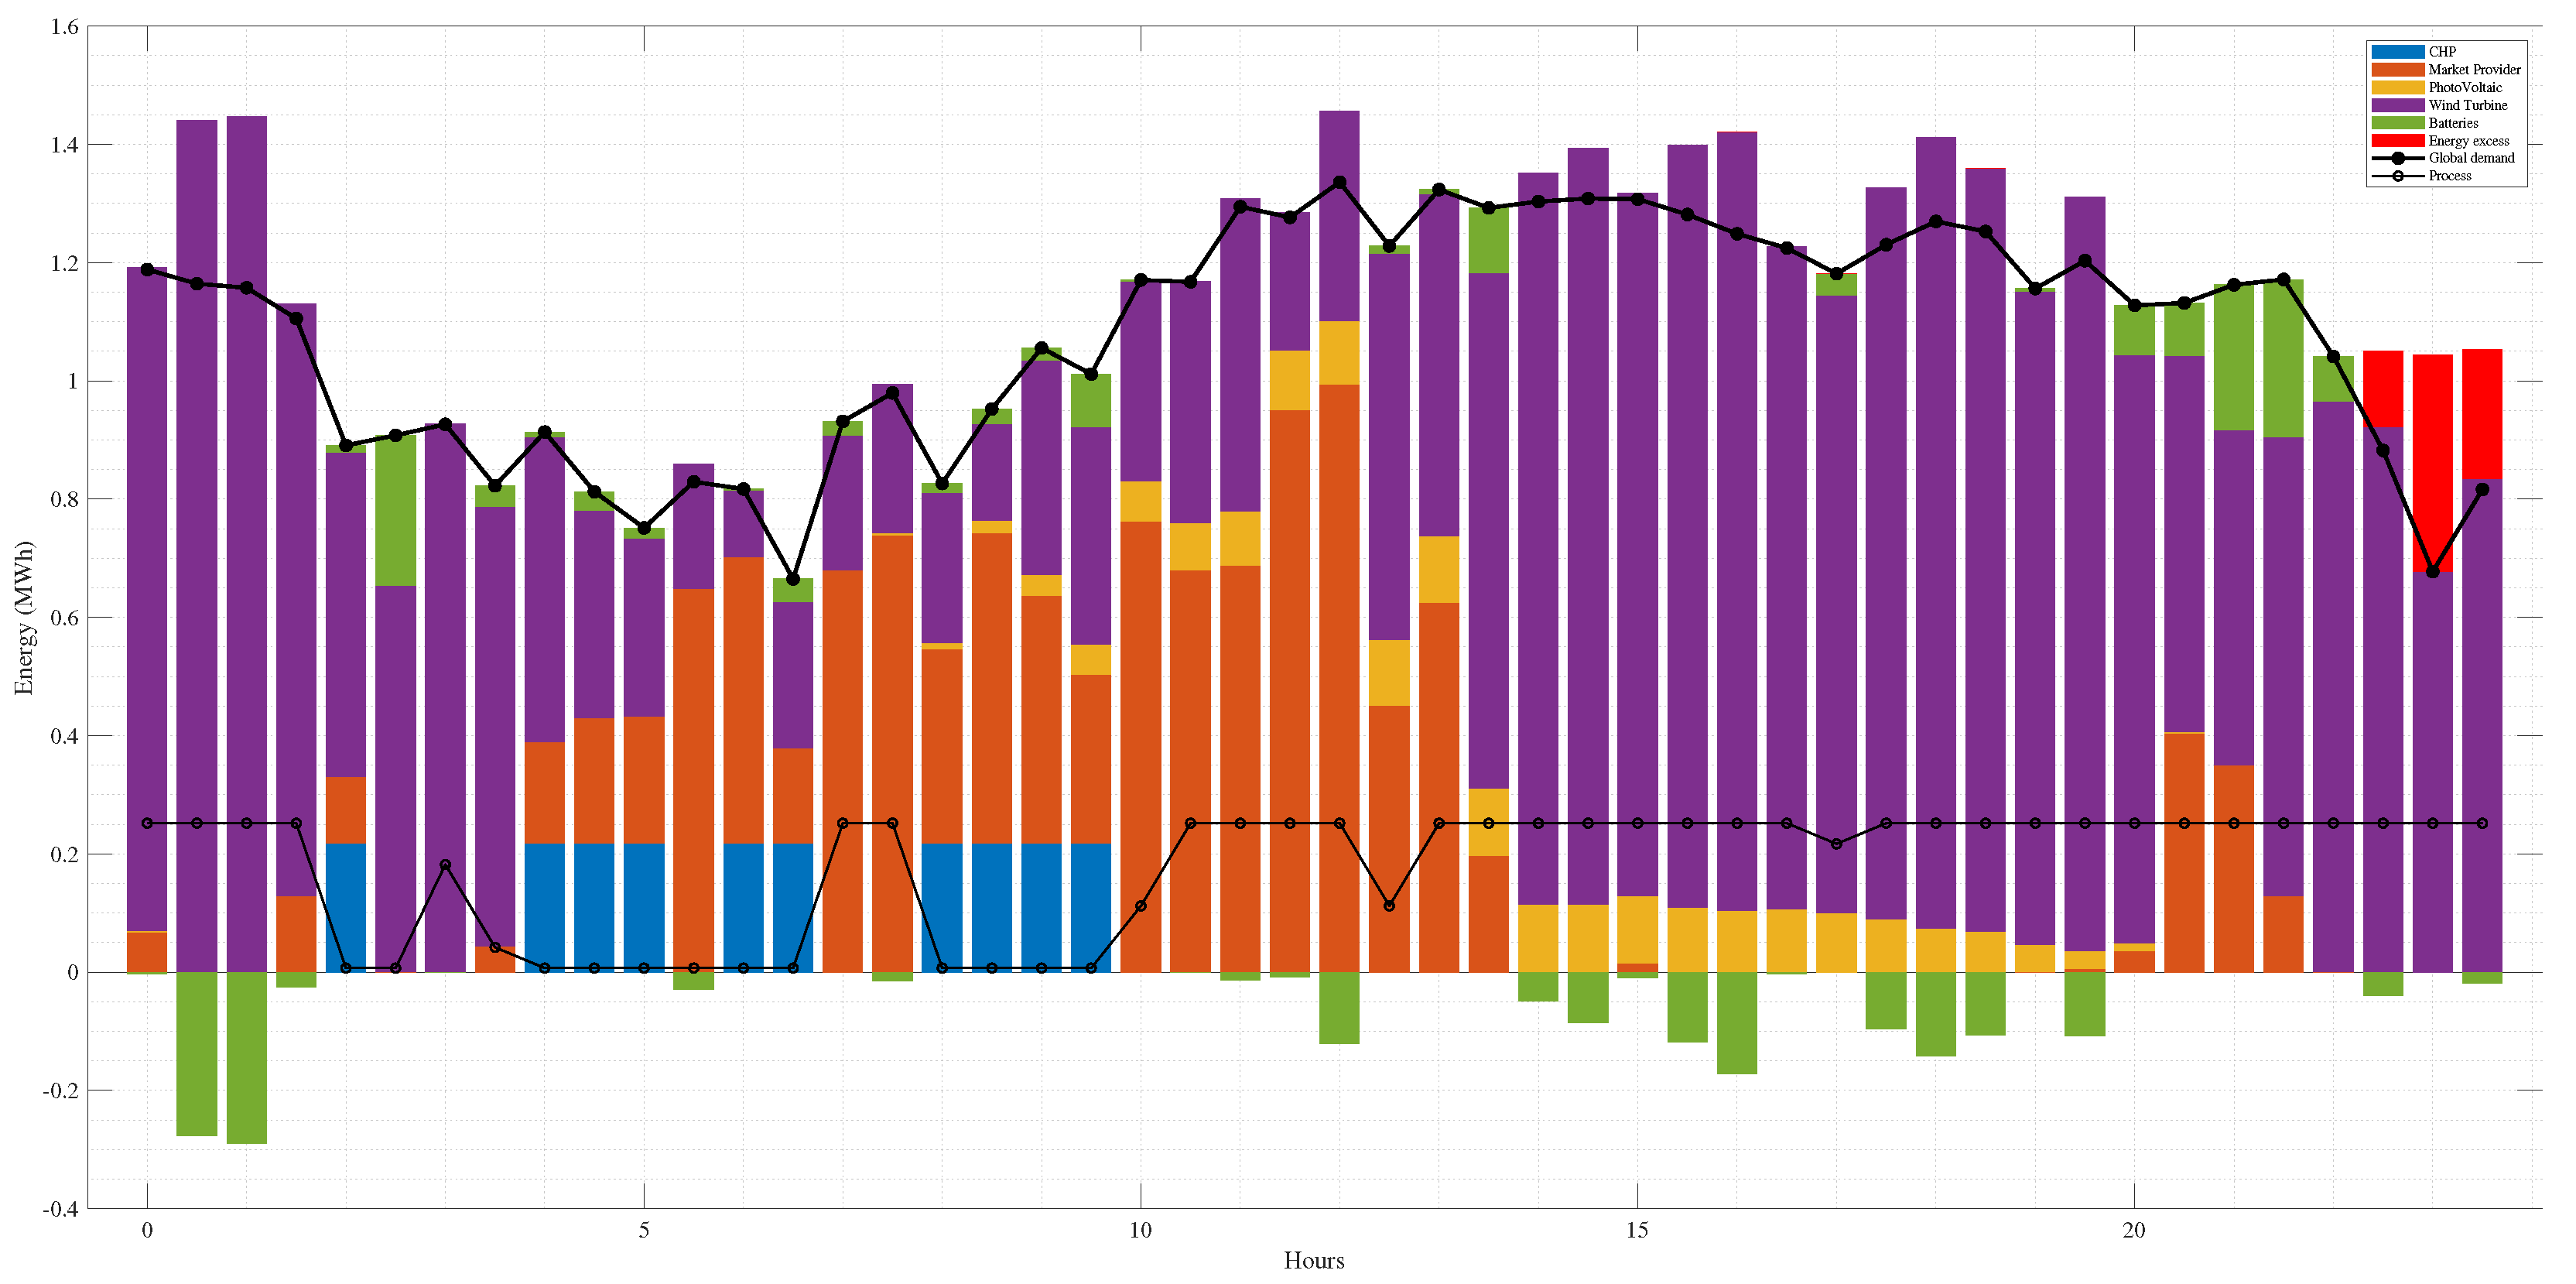
5.3. Results
- The profile of the manipulable process has been adjusted to times when the market price is lower or renewable energy production is higher.
- The inclusion of the battery means that renewable energy losses are minimised, bearing in mind that at the end of the day there is an excess of renewable energy that cannot be harnessed on this day.
- In some instances, power is produced from CHP to take advantage of the weighted price difference between gas and electricity from the market.
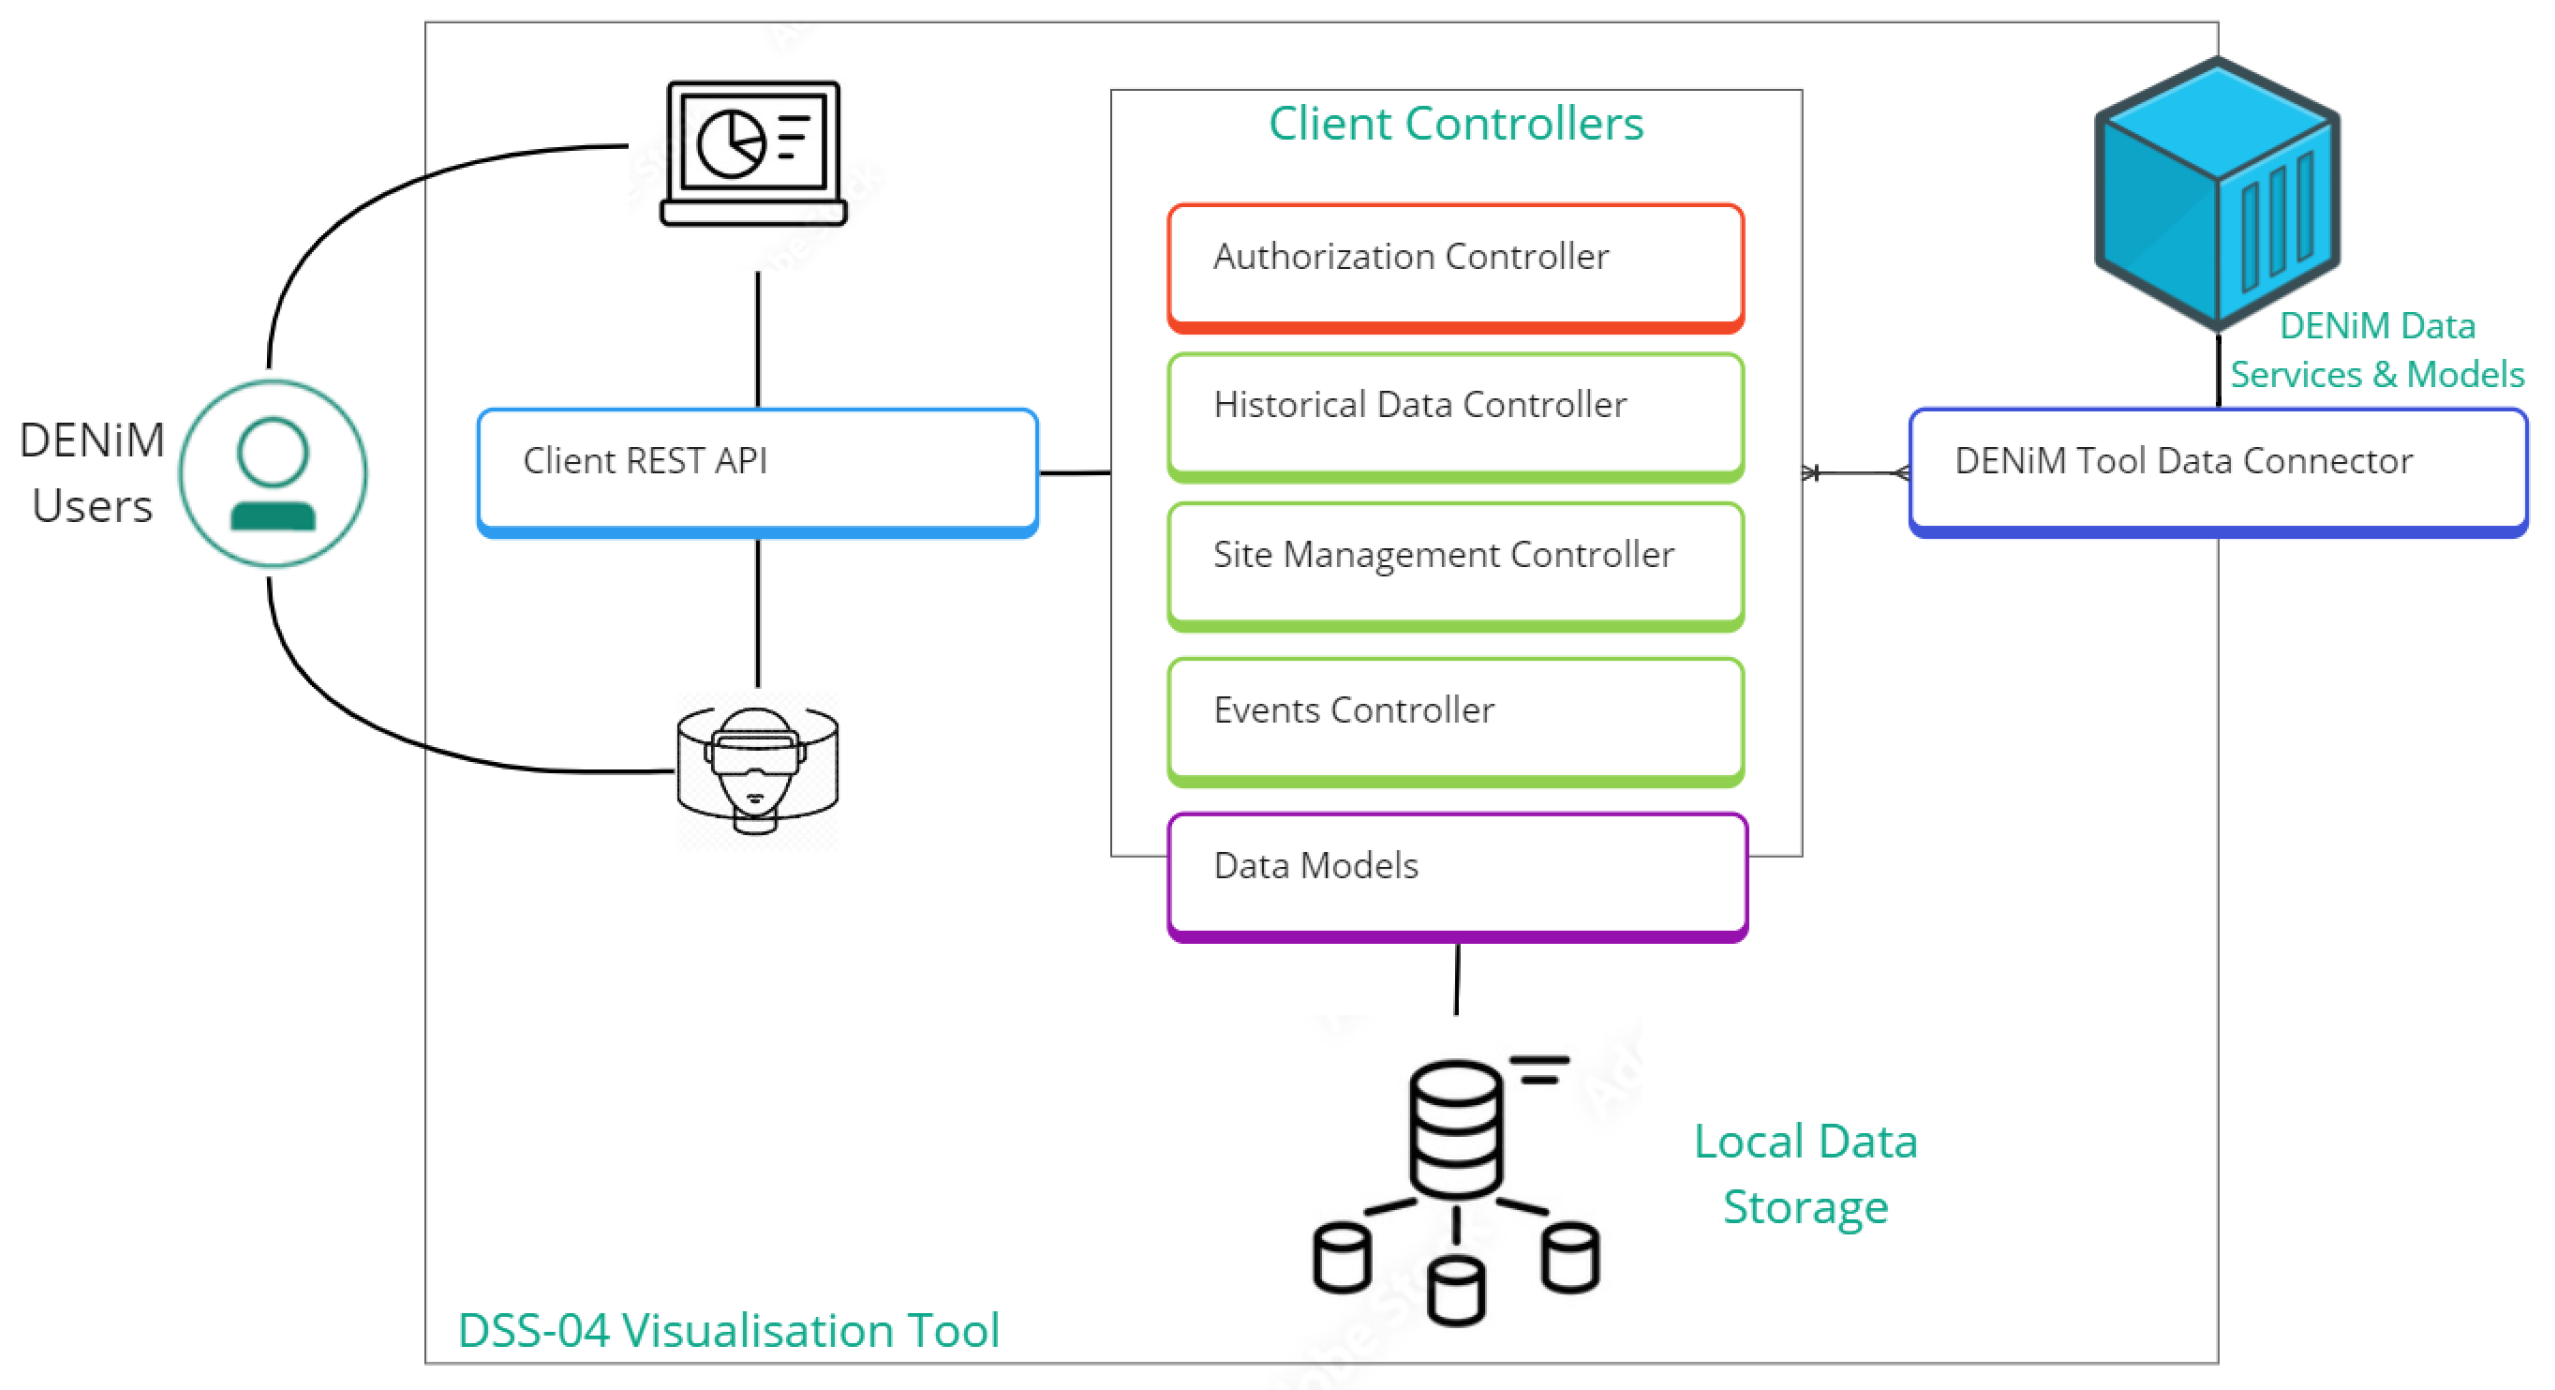
6. User Interface
- Authorisation Controller: facilitates integration with the DENiM authorisation and access control mechanisms to ensure appropriate authorisation and access control to data sources.
- Historical Data Controller: provides a mechanism to the load, query and interrogate of historical data received via the DENiM connectors.
- Site Management Controller: captures a hierarchy of the physical assets, properties and data for a specific site configuration; this is supported by the use of the DENiM semantic model.
- Events Controller: manages any notifications or updates that need to be propagated to the user (e.g., fault alert).
- Data Models: definition of local data models that align and map to visual widgets and components.
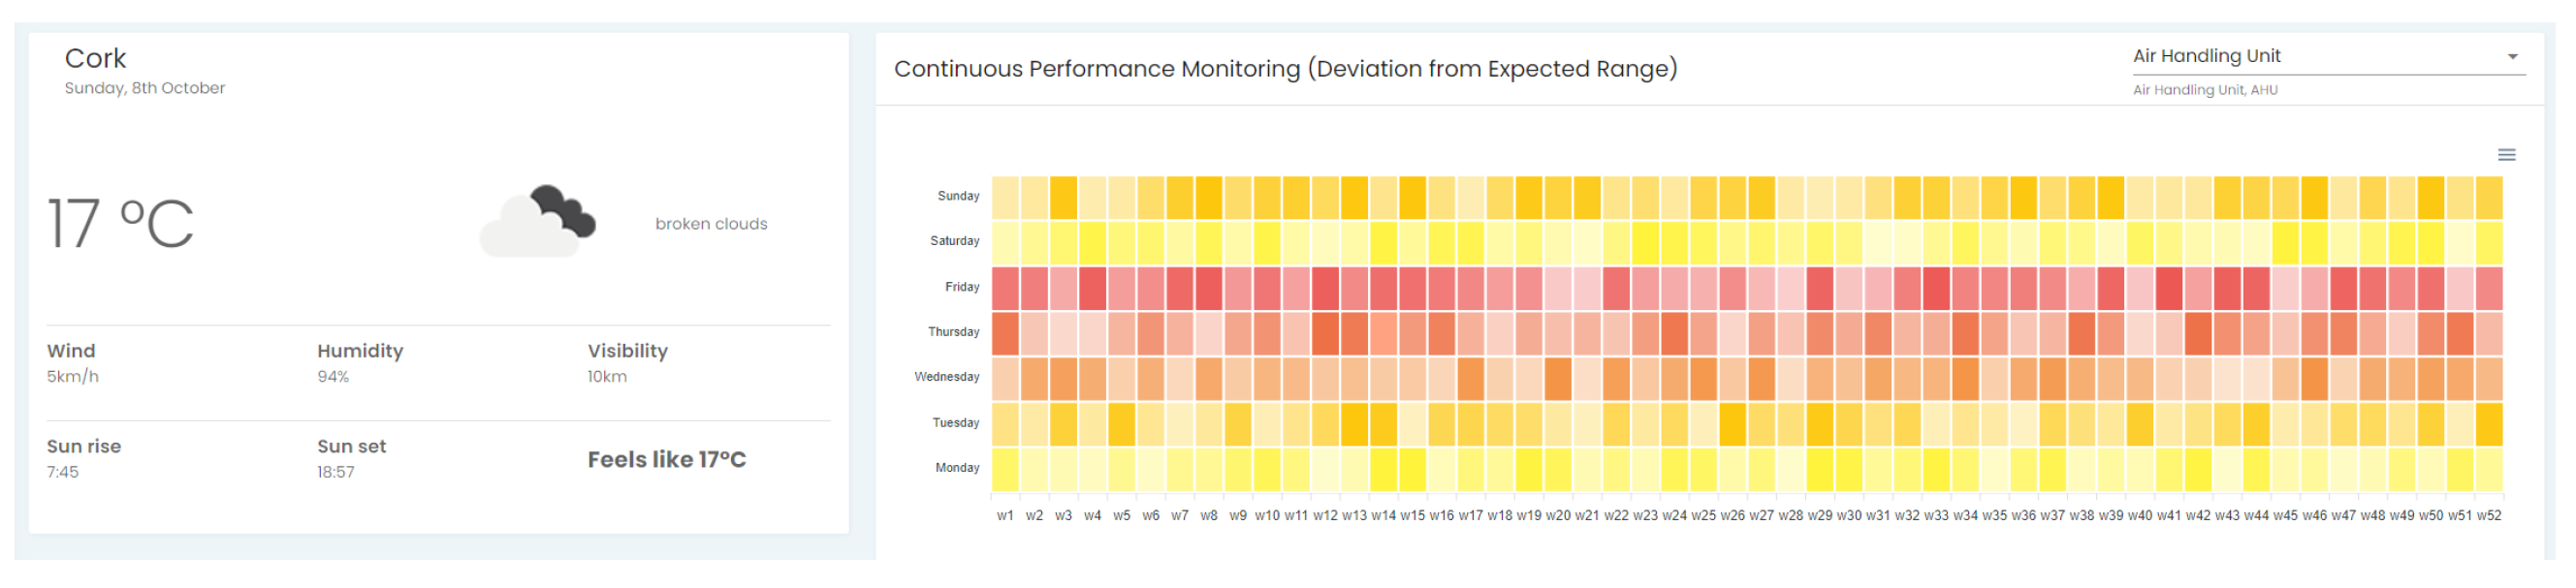
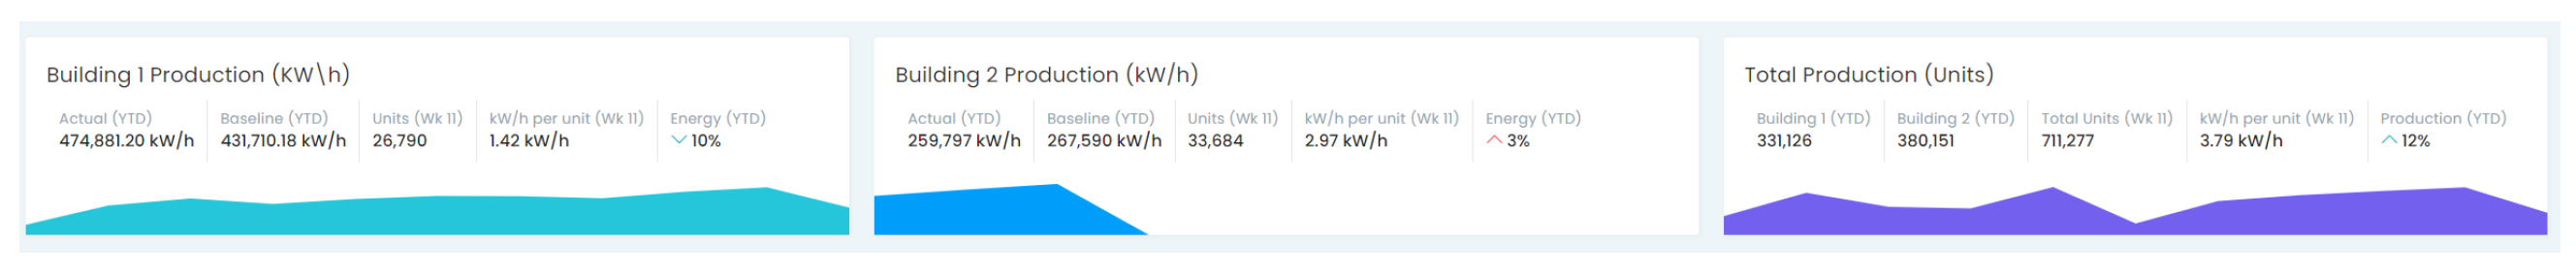
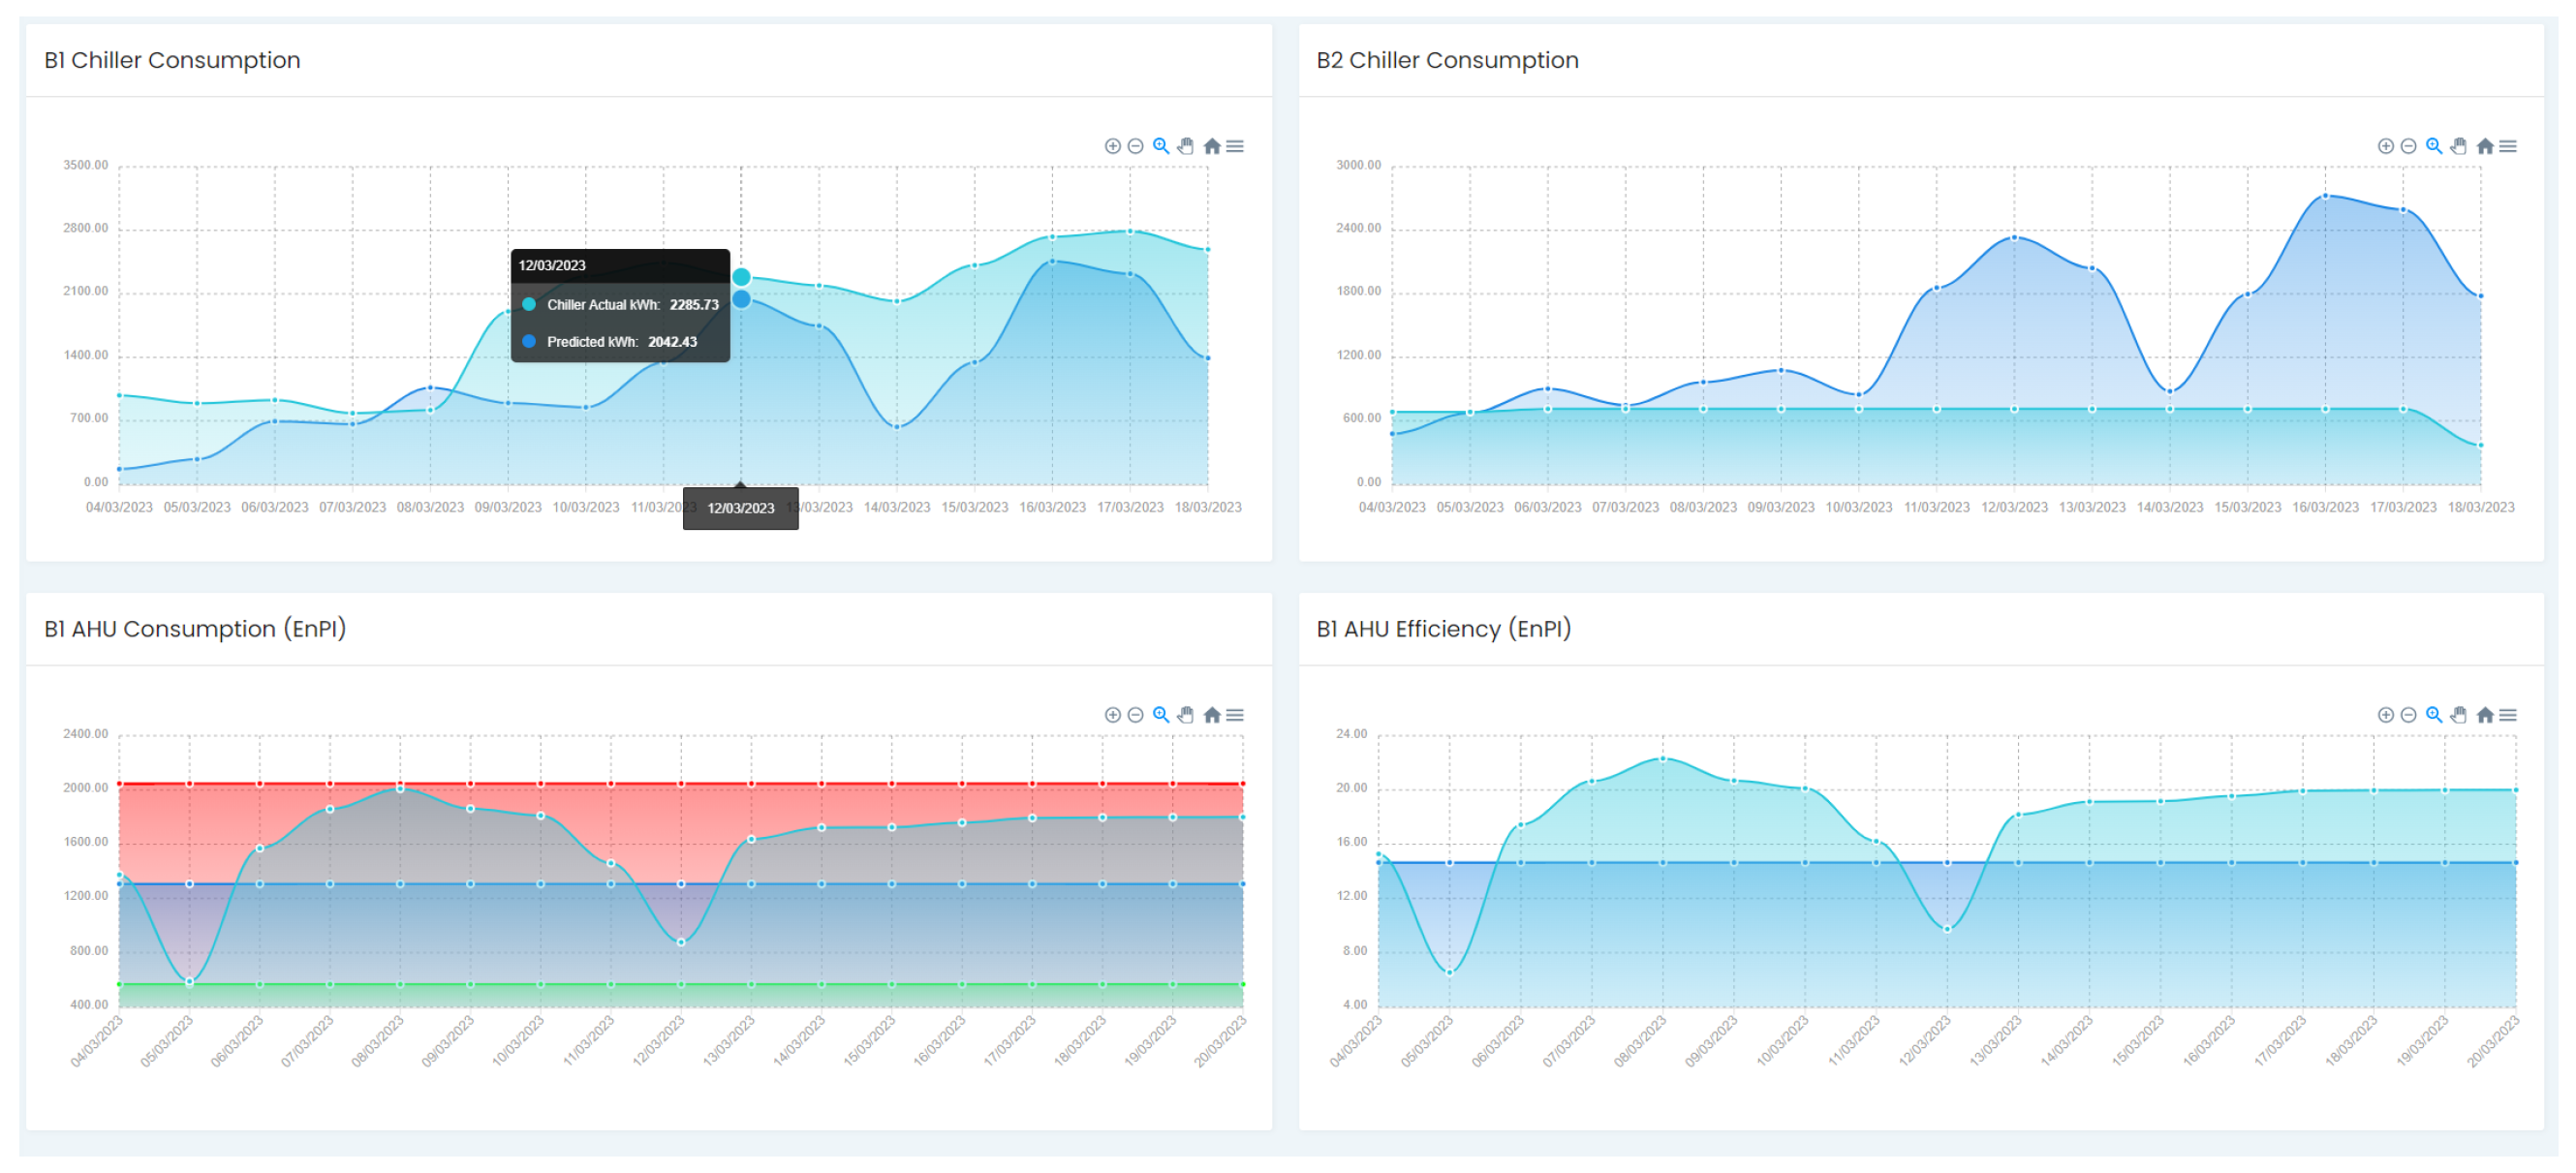
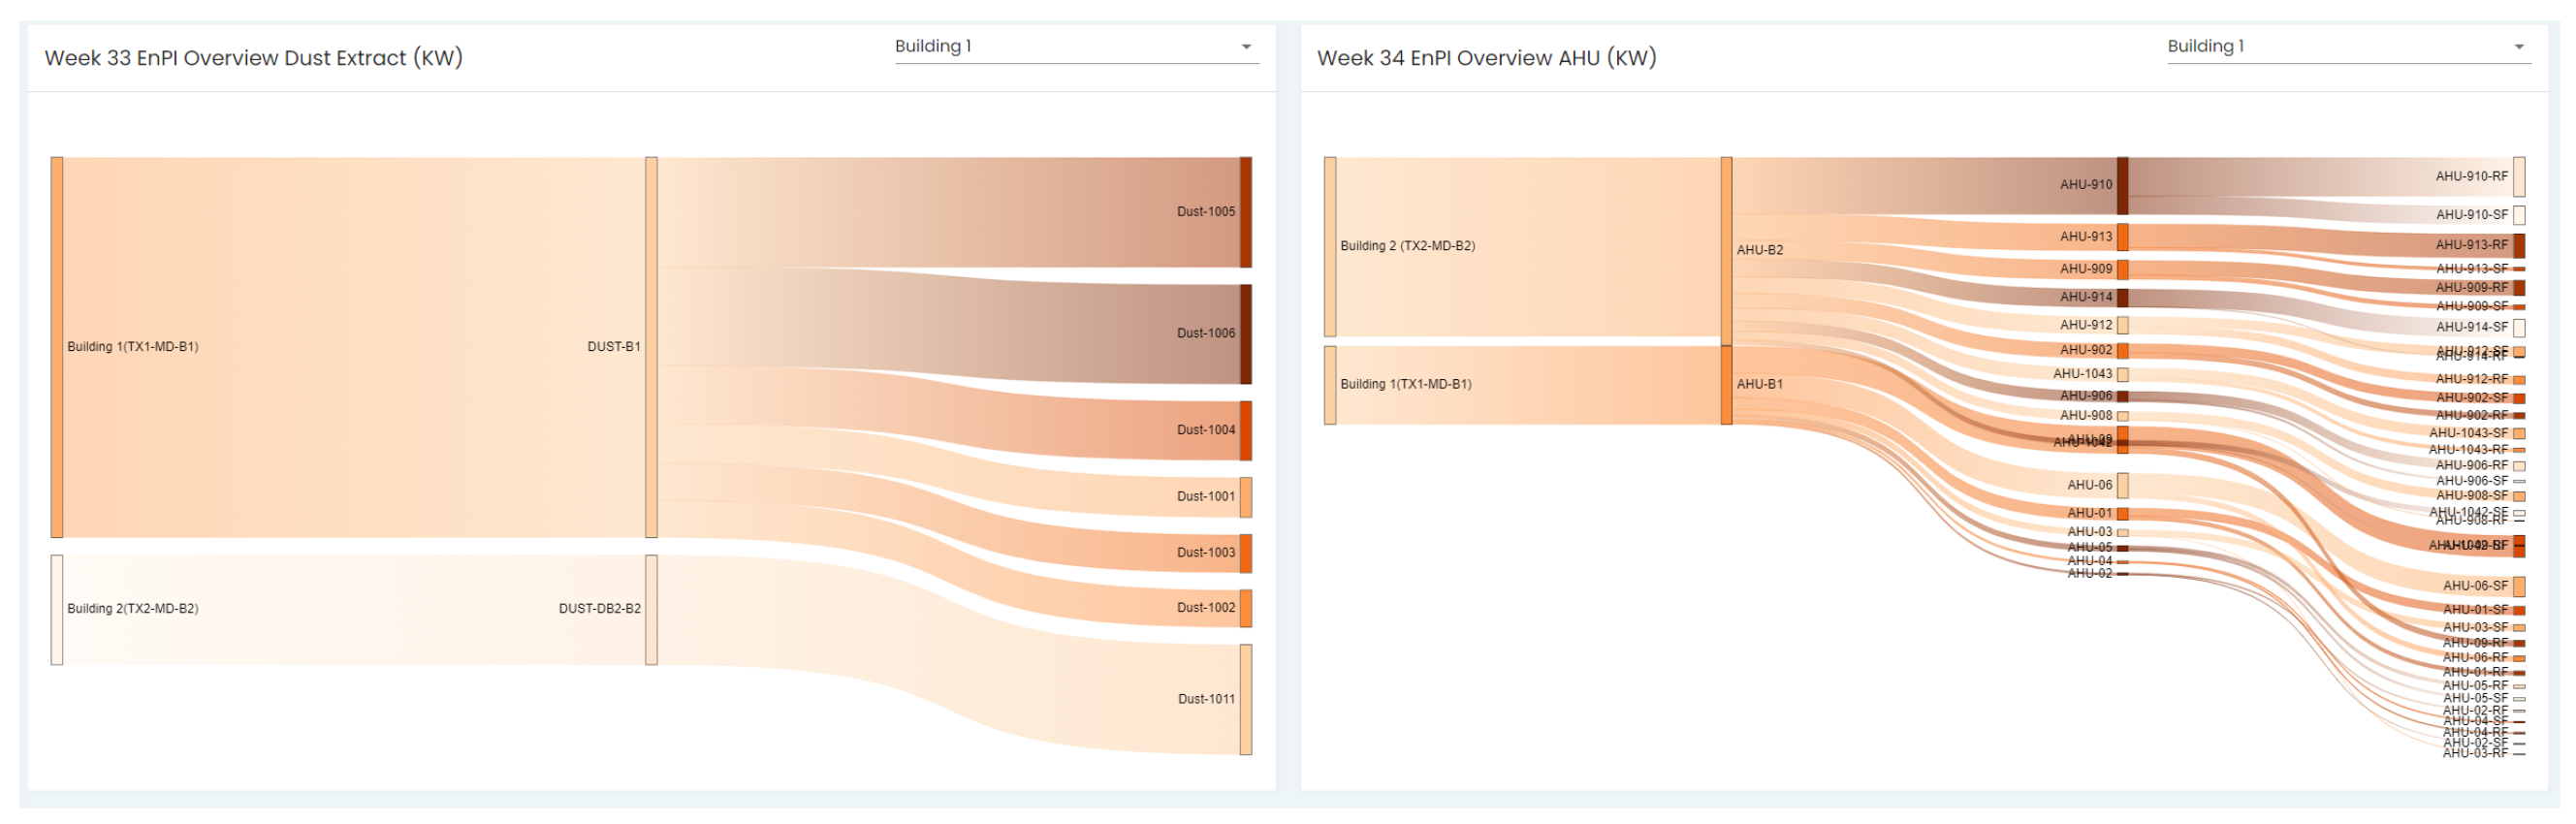
6.1. Dashboard Visualisation
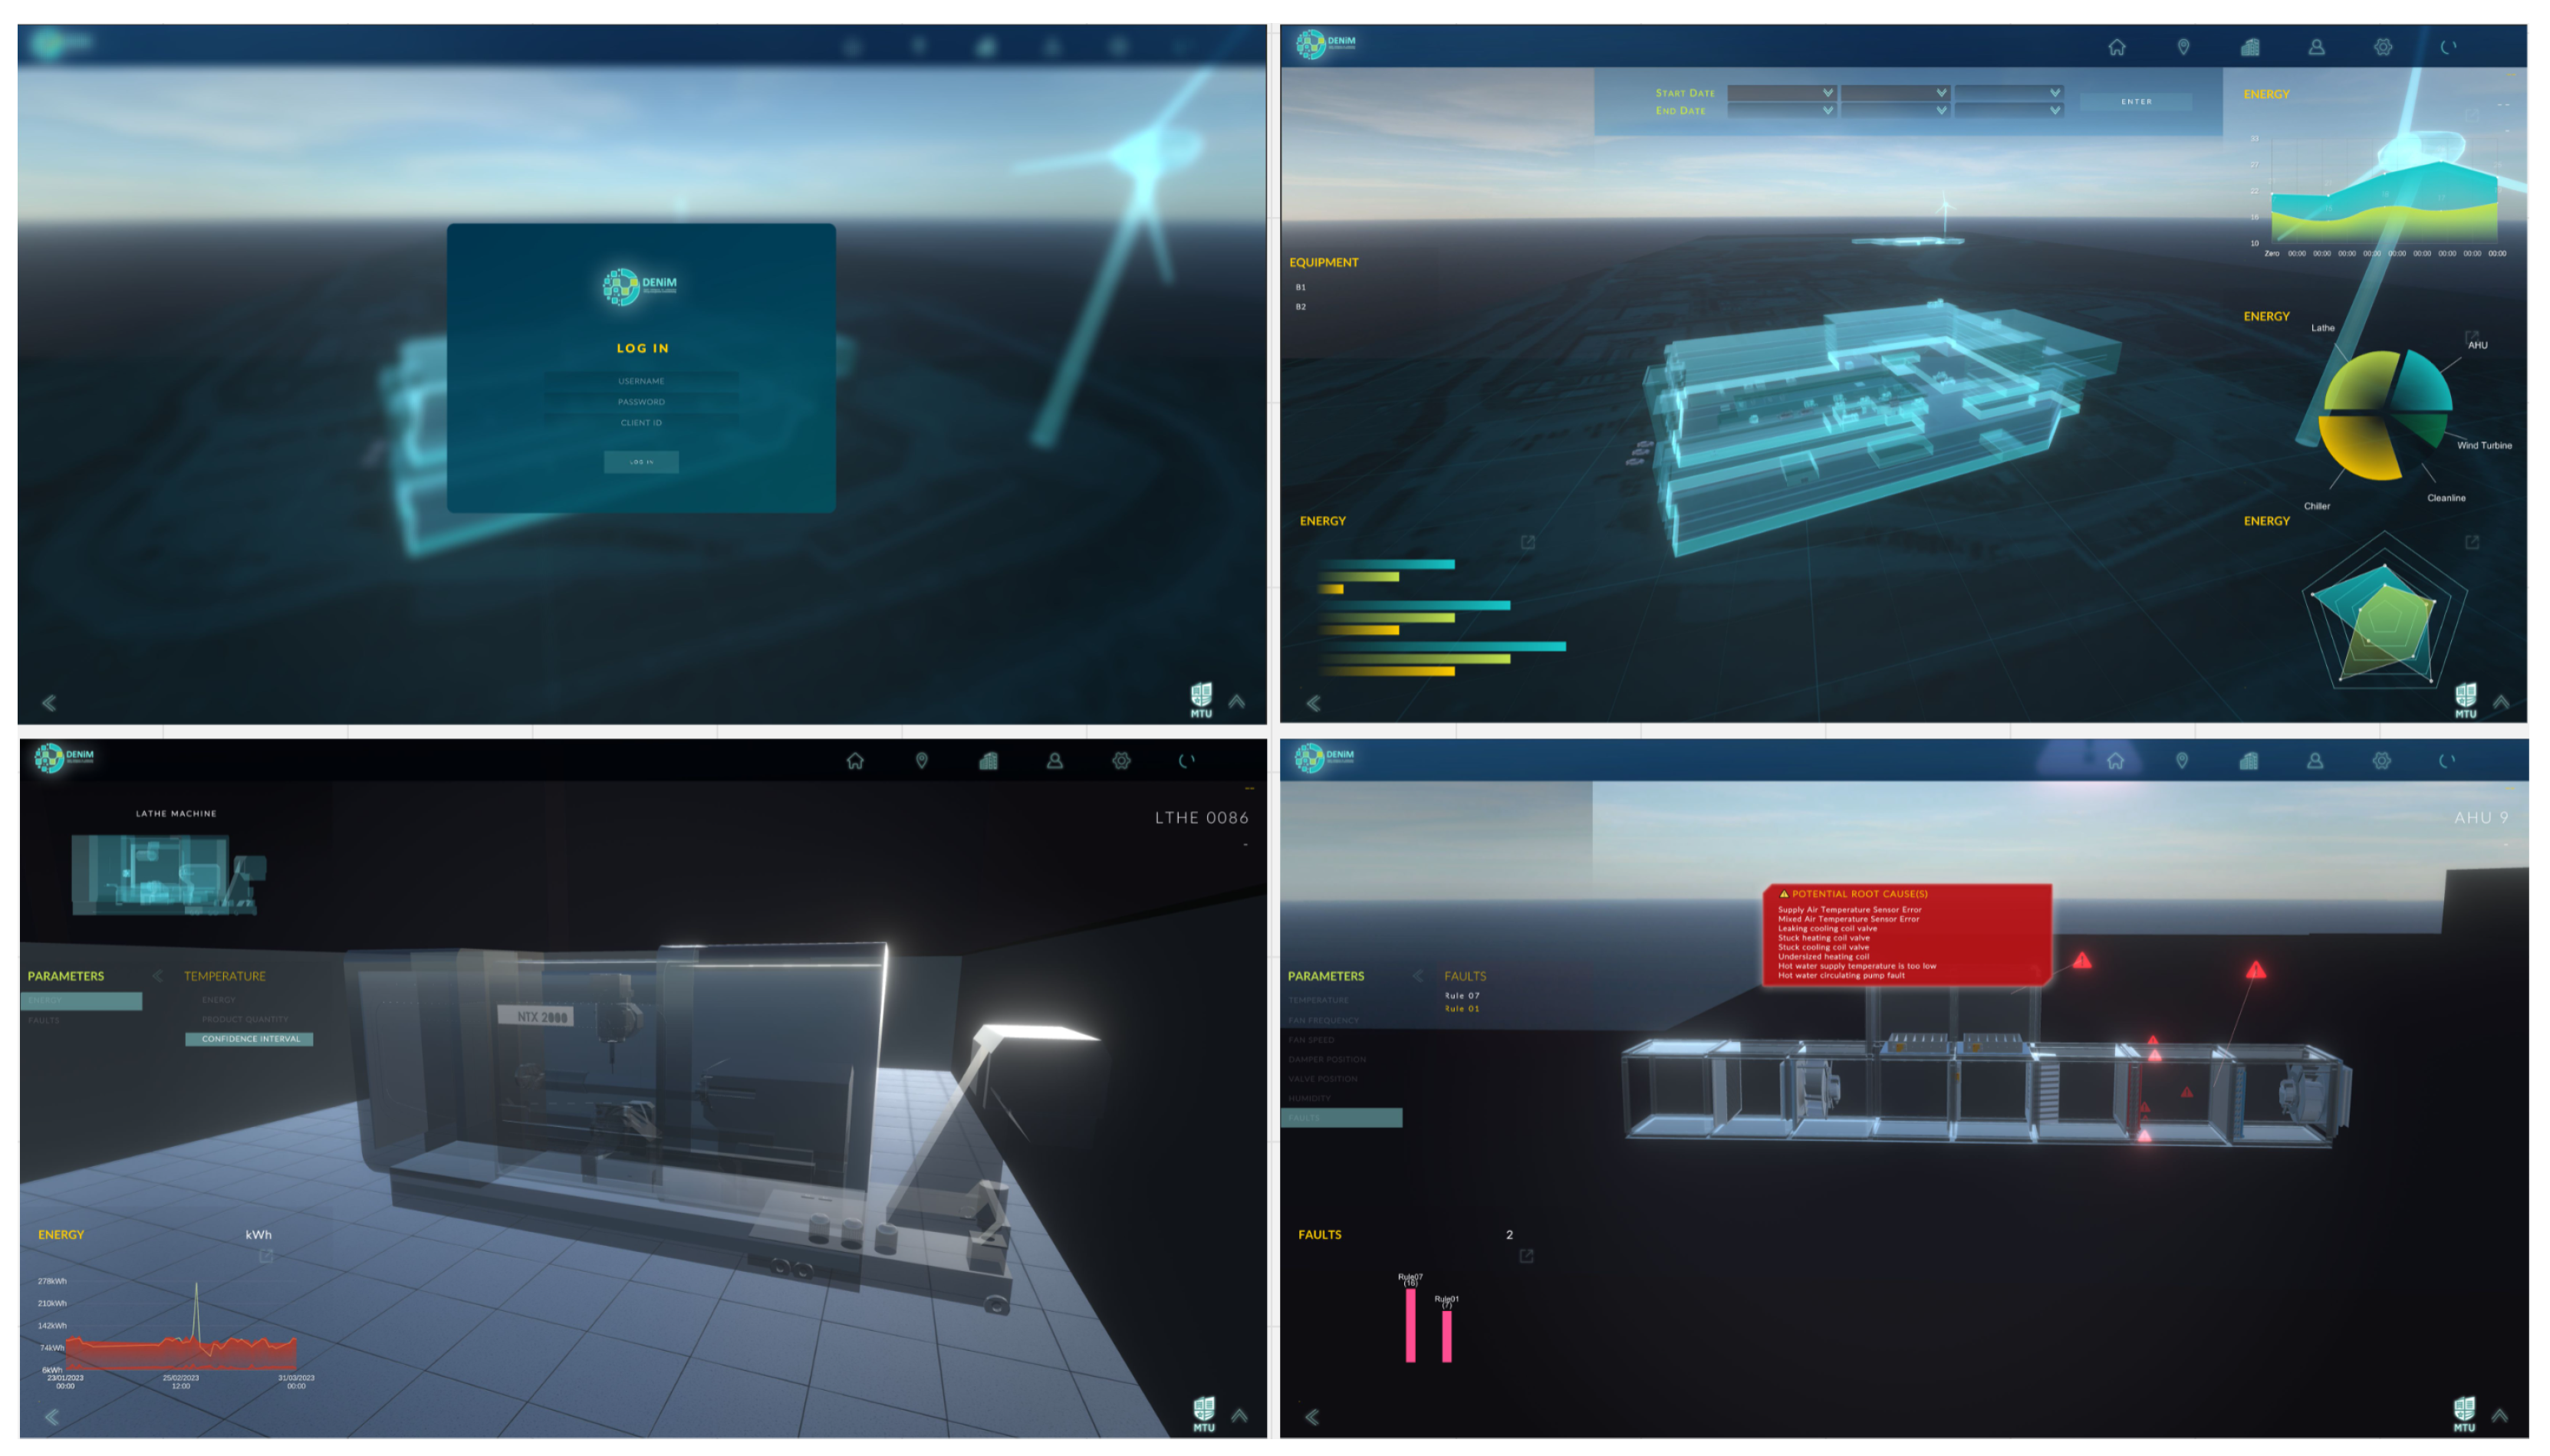
6.2. Digital Twin Visualisation
7. Key Performance Indicators (KPIs)
- KPI-1 85% of Production Assets Monitored: Of the assets within scope, the significant energy users (SEUs) were defined to be those with a rated power consumption of more than 3 kW. With the connection plan fully implemented, 95% of the identified assets have been equipped with IoT sensors and meters, providing monitoring of energy consumption of these assets.
- KPI-2 25% of Production Assets equipped with FDD: The production assets include the saws, lathes and cleanlines. Energy models have been developed for the lathes, which also aid in detecting abnormal energy consumption patterns and offer limited but valuable fault detection. Thus, this KPI has also been reached, with approximately 70% of assets being equipped with fault detection.
- KPI-3 50% of Production Support Assets equipped with FDD: Besides the AHUs, the assets within scope include Chillers and air compressors. Due to the lack of data, this KPI has not been met. However, when data are made available, it is possible to extend the developed FDD tools to cover 75% of the assets.
- KPI-4 Reduce Complexity of Data Collection and Energy Audits: The complexity of data generation was reduced with two digital services deployed, which automatically computed the performance indicators for all assets. Additionally, the integration of the visualisation tool on the platform enabled easy access and visualisation of data aggregated from multiple sources. To enhance the accuracy and quickly identify the faults with sensors, a data validation tool was also incorporated that implemented five different kinds of data checks.
- KPI-5 95% Accuracy in Predicting Energy Consumption of Production Assets: This KPI could not be achieved due to the lack of data. For accurate energy prediction, monitoring the process parameters is a must. Nevertheless, the simple models based on linear regression are still helpful in production planning as well as anomaly detection.
- KPI-6 10% Idle Energy Reduction and Schedule Optimisation: As mentioned in Section 3, the data analysis is based on shift-wise aggregates. In the various scenarios shown, this KPI is met more than satisfactorily. Furthermore, data at a higher resolution will only improve this KPI.
- KPI-7 10% Savings by Optimising Renewable Integration: The renewable integration module was shown to improve renewable integration by approximately 18%. Thus, this KPI is also met.
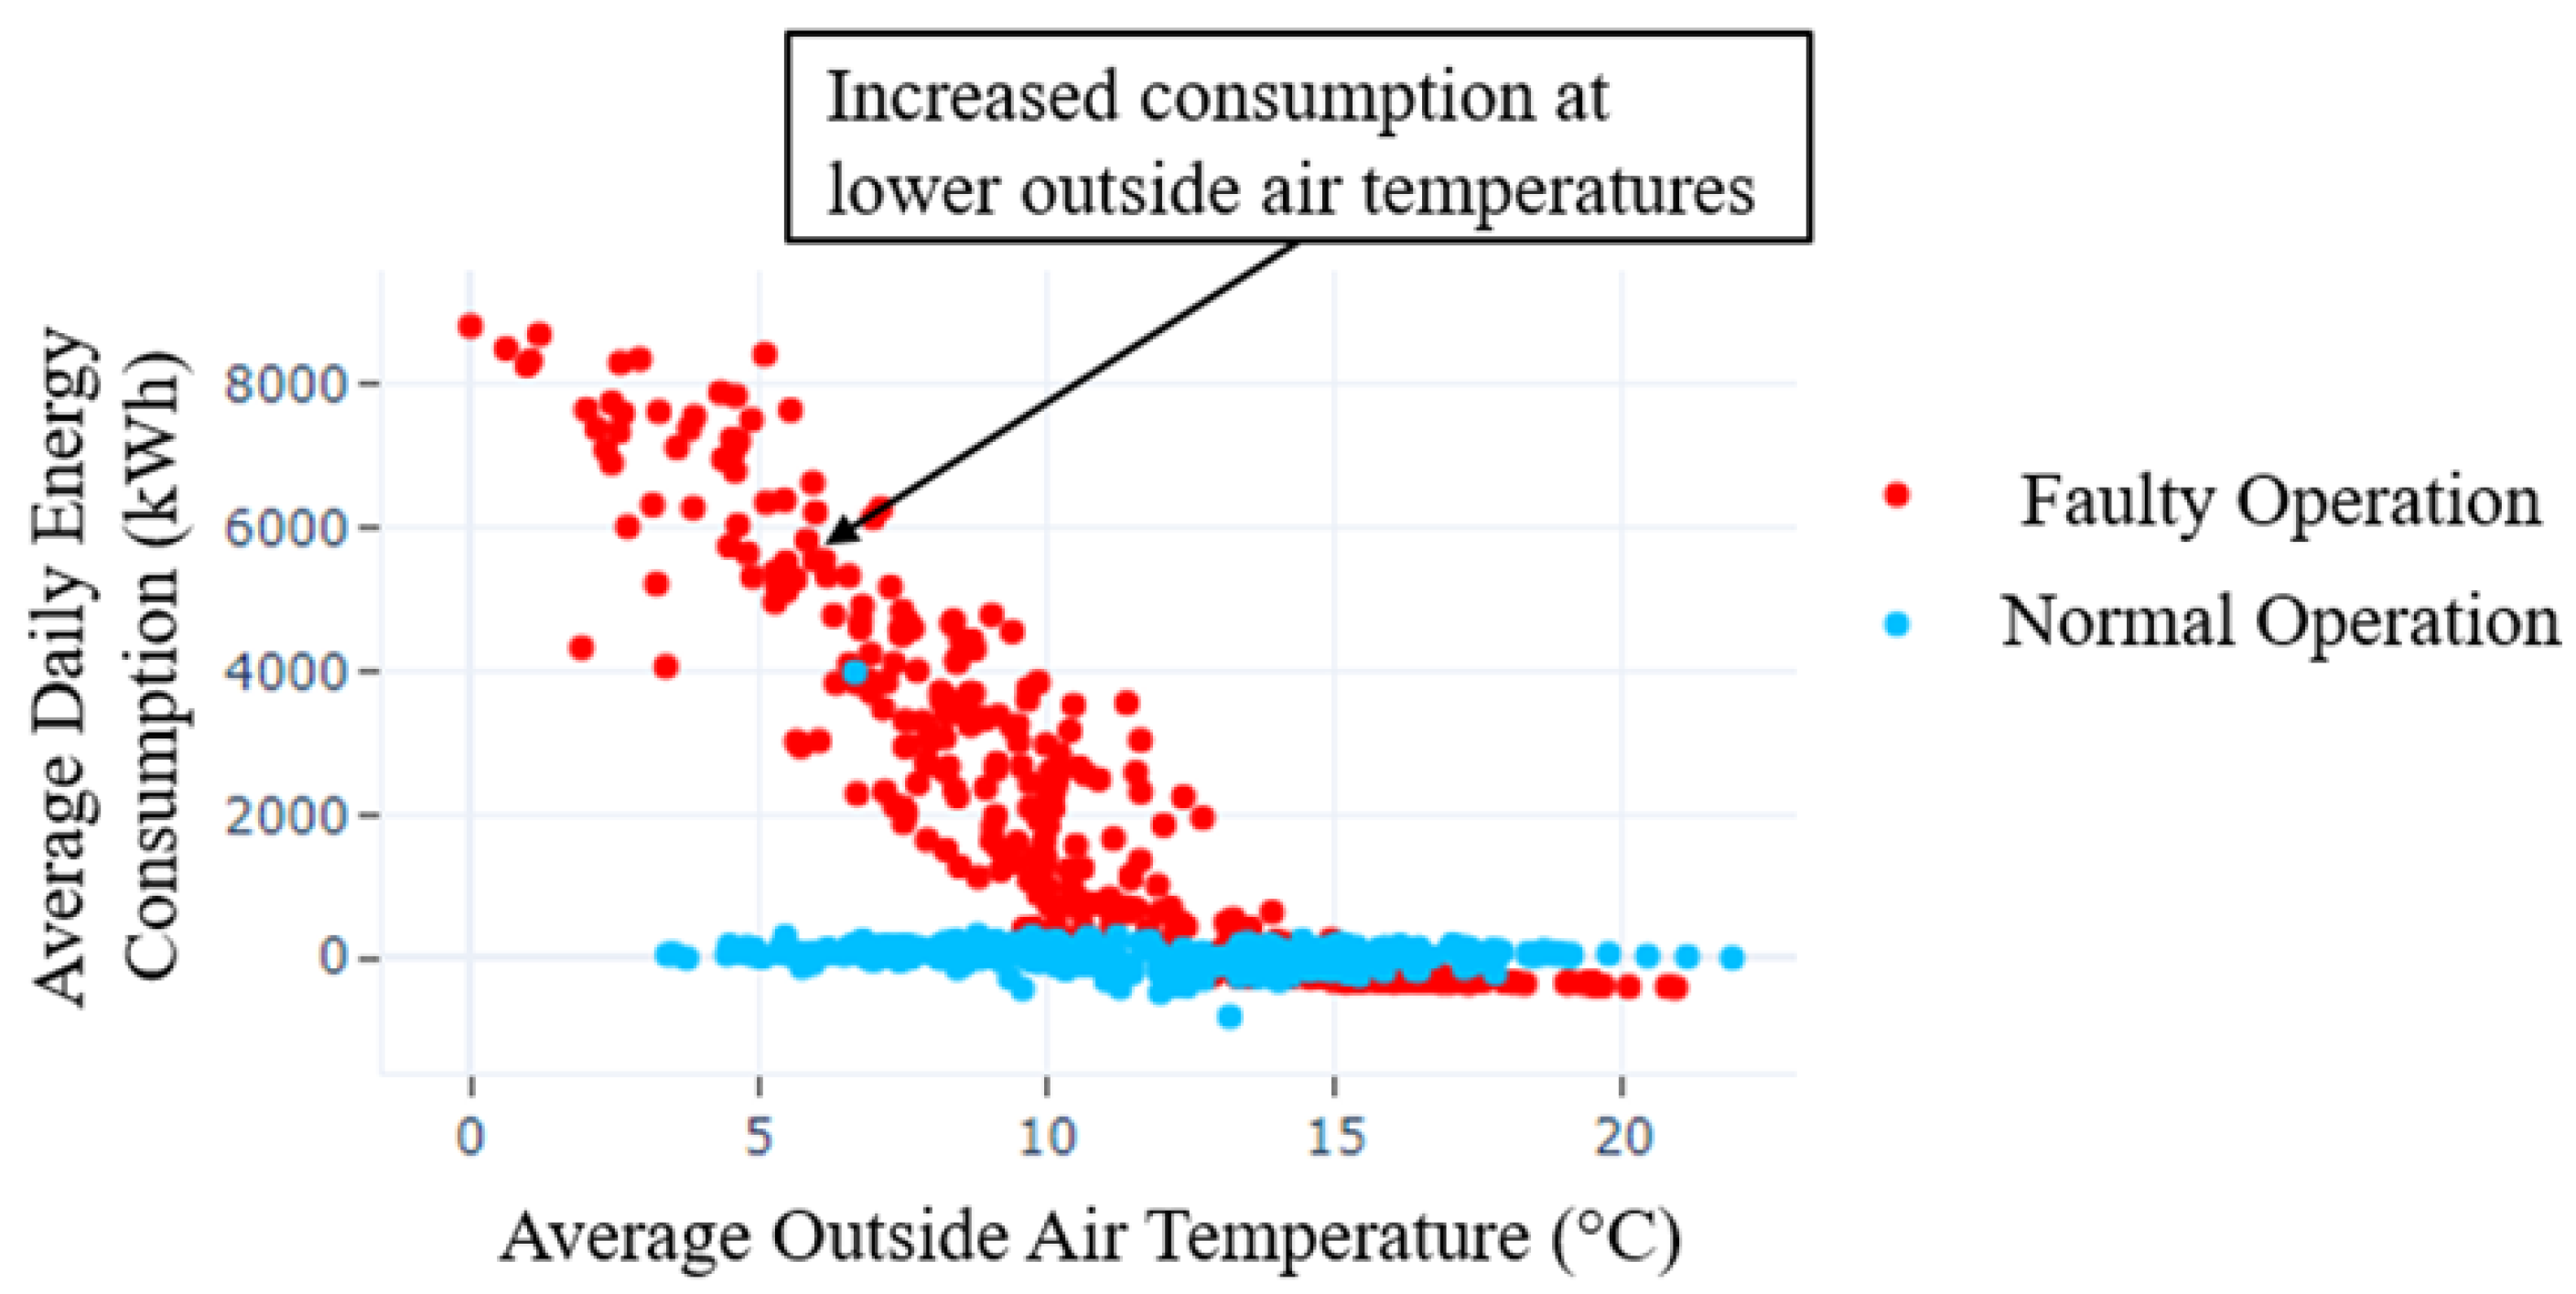
- KPI-8 15% Savings through FDD: Considering the AHU FDD, and assuming that the scenario for 2022 is generally valid for any year, savings of approximately 16% can be made by quickly repairing faults that consume excessive energy compared to normal operation.
8. Conclusions
Author Contributions
Funding
Data Availability Statement
Conflicts of Interest
References
- Kagermann, H.; Lukas, W.D.; Wahlster, W. Industrie 4.0: Mit dem Internet der Dinge auf dem Weg zur 4. industriellen Revolution. VDI Nachrichten 2011, 13, 2–3. [Google Scholar]
- Kagermann, H. Change through digitization—Value creation in the age of Industry 4.0. In Management of Permanent Change; Springer: Berlin/Heidelberg, Germany, 2014; pp. 23–45. [Google Scholar]
- Rivera, J. Gartner’s 2015 Hype Cycle for Emerging Technologies Identifies the Computing Innovations That Organizations Should Monitor. Available online: https://www.gartner.com/en/newsroom/press-releases/2015-08-18-gartners-2015-hype-cycle-for-emerging-technologies-identifies-the-computing-innovations-that-organizations-should-monitor (accessed on 9 November 2023).
- Zhong, R.Y.; Ge, W. Internet of things enabled manufacturing: A review. Int. J. Agil. Syst. Manag. 2018, 11, 126–154. [Google Scholar] [CrossRef]
- Cioffi, R.; Travaglioni, M.; Piscitelli, G.; Petrillo, A.; De Felice, F. Artificial intelligence and machine learning applications in smart production: Progress, trends, and directions. Sustainability 2020, 12, 492. [Google Scholar] [CrossRef]
- Damiani, L.; Demartini, M.; Guizzi, G.; Revetria, R.; Tonelli, F. Augmented and virtual reality applications in industrial systems: A qualitative review towards the Industry 4.0 era. IFAC-Pap. 2018, 51, 624–630. [Google Scholar] [CrossRef]
- Zheng, P.; Wang, H.; Sang, Z.; Zhong, R.Y.; Liu, Y.; Liu, C.; Mubarok, K.; Yu, S.; Xu, X. Smart manufacturing systems for Industry 4.0: Conceptual framework, scenarios, and future perspectives. Front. Mech. Eng. 2018, 13, 137–150. [Google Scholar] [CrossRef]
- Müller, J.M.; Kiel, D.; Voigt, K.I. What drives the implementation of Industry 4.0? The role of opportunities and challenges in the context of sustainability. Sustainability 2018, 10, 247. [Google Scholar] [CrossRef]
- Directorate-General for Research and Innovation, European Commission. Industry 5.0—Towards a Sustainable, Human-Centric and Resilient European Industry. Available online: https://research-and-innovation.ec.europa.eu/knowledge-publications-tools-and-data/publications/all-publications/industry-50-towards-sustainable-human-centric-and-resilient-european-industry_en (accessed on 28 January 2024).
- Bajic, B.; Rikalovic, A.; Suzic, N.; Piuri, V. Industry 4.0 implementation challenges and opportunities: A managerial perspective. IEEE Syst. J. 2020, 15, 546–559. [Google Scholar] [CrossRef]
- Rikalovic, A.; Suzic, N.; Bajic, B.; Piuri, V. Industry 4.0 implementation challenges and opportunities: A technological perspective. IEEE Syst. J. 2021, 16, 2797–2810. [Google Scholar] [CrossRef]
- The DENiM Consortium. DENiM: Unlocking the Energy Saving Potential in Manufacturing Systems. Available online: https://denim-fof.eu/ (accessed on 7 December 2023).
- Buer, S.V.; Semini, M.; Strandhagen, J.O.; Sgarbossa, F. The complementary effect of lean manufacturing and digitalisation on operational performance. Int. J. Prod. Res. 2021, 59, 1976–1992. [Google Scholar] [CrossRef]
- Frank, A.G.; Dalenogare, L.S.; Ayala, N.F. Industry 4.0 technologies: Implementation patterns in manufacturing companies. Int. J. Prod. Econ. 2019, 210, 15–26. [Google Scholar] [CrossRef]
- Pozzi, R.; Rossi, T.; Secchi, R. Industry 4.0 technologies: Critical success factors for implementation and improvements in manufacturing companies. Prod. Plan. Control 2023, 34, 139–158. [Google Scholar] [CrossRef]
- Clancy, R.; Bruton, K.; O’Sullivan, D.T.; Cloonan, A.J. The HyDAPI framework: A versatile tool integrating Lean Six Sigma and digitalisation for improved quality management in Industry 4.0. Int. J. Lean Six Sigma 2022. [Google Scholar] [CrossRef]
- Isermann, R. Fault-Diagnosis Applications: Model-Based Condition Monitoring: Actuators, Drives, Machinery, Plants, Sensors, and Fault-Tolerant Systems; Springer Science & Business Media: Berlin/Heidelberg, Germany, 2011. [Google Scholar]
- Roth, K.W.; Westphalen, D.; Feng, M.; Llana, P.; Quartararo, L. Energy Impact of Commercial Building Controls and Performance Diagnostics: Market Characterization. In Energy Impact of Building Faults and Energy Savings Potential; National Technical Reports Library: Lawrence, KS, USA; U.S. Department of Commerce: Washingtion, DC, USA, 2005; p. 413. [Google Scholar]
- Matetić, I.; Štajduhar, I.; Wolf, I.; Ljubic, S. A Review of Data-Driven Approaches and Techniques for Fault Detection and Diagnosis in HVAC Systems. Sensors 2022, 23, 1. [Google Scholar] [CrossRef] [PubMed]
- Zhao, Y.; Li, T.; Zhang, X.; Zhang, C. Artificial intelligence-based fault detection and diagnosis methods for building energy systems: Advantages, challenges and the future. Renew. Sustain. Energy Rev. 2019, 109, 85–101. [Google Scholar] [CrossRef]
- Chen, Z.; O’Neill, Z.; Wen, J.; Pradhan, O.; Yang, T.; Lu, X.; Lin, G.; Miyata, S.; Lee, S.; Shen, C.; et al. A review of data-driven fault detection and diagnostics for building HVAC systems. Appl. Energy 2023, 339, 121030. [Google Scholar] [CrossRef]
- Mirnaghi, M.S.; Haghighat, F. Fault detection and diagnosis of large-scale HVAC systems in buildings using data-driven methods: A comprehensive review. Energy Build. 2020, 229, 110492. [Google Scholar] [CrossRef]
- Wen, J.; Shun, L. RP-1312—Tools for Evaluating Fault Detection and Diagnostic Methods for Air-Handling Units. Available online: https://www.techstreet.com/standards/rp-1312-tools-for-evaluating-fault-detection-and-diagnostic-methods-for-air-handling-units?product_id=1833299 (accessed on 28 January 2024).
- Granderson, J.; Lin, G. Inventory of Data Sets for AFDD Evaluation; Building Technology and Urban Systems Division, Lawrence Berkeley National Laboratory: Berkeley, CA, USA, 2019. [Google Scholar]
- House, J.M.; Vaezi-Nejad, H.; Whitcomb, J.M. An expert rule set for fault detection in air-handling units/discussion. Ashrae Trans. 2001, 107, 858. [Google Scholar]
- Gómez, J.; Chicaiza, W.D.; Escaño, J.M.; Bordons, C. A renewable energy optimisation approach with production planning for a real industrial process: An application of genetic algorithms. Renew. Energy 2023, 215, 118933. [Google Scholar] [CrossRef]
- Jang, J.S. ANFIS: Adaptive-network-based fuzzy inference system. IEEE Trans. Syst. Man Cybern. 1993, 23, 665–685. [Google Scholar] [CrossRef]
- Lindskog, P. Fuzzy Identification from a Grey Box Modeling Point of View. In Fuzzy Model Identification: Selected Approaches; Hellendoorn, H., Driankov, D., Eds.; Springer: Berlin/Heidelberg, Germany, 1997; pp. 3–50. [Google Scholar] [CrossRef]
- Chicaiza, W.D.; Sánchez, A.J.; Gallego, A.J.; Escaño, J.M. Neuro-fuzzy Modelling of a Linear Fresnel-type Solar Collector System as a Digital Twin. In Proceedings of the Joint Proceedings of the 19th World Congress of the International Fuzzy Systems Association (IFSA), the 12th Conference of the European Society for Fuzzy Logic and Technology (EUSFLAT), and the 11th International Summer School on Aggregation Operators (AGOP), Bratislava, Slovakia, 19–24 September 2021; Atlantis Press: Amsterdam, The Netherlands, 2021; pp. 242–249. [Google Scholar] [CrossRef]
- Chicaiza, W.D.; Machado, D.O.; Len, A.J.G.; Gonzalez, J.M.E.; Alba, C.B.; de Andrade, G.A.; Normey-Rico, J.E. Neuro-Fuzzy Digital Twin of a High Temperature Generator. IFAC-Pap. 2022, 55, 466–471. [Google Scholar] [CrossRef]
- Duffe, J.A.; Beckman, W.A. Design of Photovoltaic Systems, 4th ed.; John Wiley & Sons, Inc.: Hoboken, NJ, USA, 2013. [Google Scholar]
- Machado, D.; Chicaiza, W.; Escaño, J.; Gallego, A.; de Andrade, G.; Normey-Rico, J.; Bordons, C.; Camacho, E. Digital twin of a Fresnel solar collector for solar cooling. Appl. Energy 2023, 339, 120944. [Google Scholar] [CrossRef]
- Rodríguez, F.; Chicaiza, W.D.; Sánchez, A.; Escaño, J.M. Updating digital twins: Methodology for data accuracy quality control using machine learning techniques. Comput. Ind. 2023, 151, 103958. [Google Scholar] [CrossRef]
- Folgado, F.J.; Calderón, D.; González, I.; Calderón, A.J. Review of Industry 4.0 from the Perspective of Automation and Supervision Systems: Definitions, Architectures and Recent Trends. Electronics 2024, 13, 782. [Google Scholar] [CrossRef]
- Mourtzis, D.; Angelopoulos, J.; Panopoulos, N. The future of the human–machine interface (HMI) in society 5.0. Future Internet 2023, 15, 162. [Google Scholar] [CrossRef]
- Microsoft Hololens; Microsoft Corporation. Available online: https://www.microsoft.com/en-ie/hololens (accessed on 28 January 2024).
- SketchUp: 3D Design Software; Trimble Inc. Available online: https://www.sketchup.com/ (accessed on 15 January 2024).
- Unity Real-Time Development Platform; Unity Technologies. Available online: https://unity.com/ (accessed on 15 January 2024).
- H2020 DT-FOF-09-2020 Project Working Group. Pathways to Energy Efficient Manufacturing through Digitisation, 2023. Available online: https://zenodo.org/records/10039595 (accessed on 15 January 2024).


| Process | Asset | Power (kW) | No. | Metered? |
|---|---|---|---|---|
| Issue Material | Printer | <0.5 | N/A | No |
| Barcode Scanners | <0.5 | N/A | No | |
| Saw | Electric Saw | 16 | 2 | No |
| Machine | CNC Mill | 29.2 | 5 | No |
| CNC Lathe | 19 | 8 | No | |
| Inspect | CMM 1 | 0.7 | 9 | No |
| Shadow Graph | <0.5 | 3 | No | |
| Surface Tester | <0.5 | 2 | No | |
| Laser | <0.3 | 1 | No | |
| Clean | Multi-stage Cleanline | 90 | 2 | Yes |
| Label | Printer | <0.5 | N/A | No |
| Barcode Scanners | <0.5 | N/A | No | |
| Package | Sealer | <0.25 | 12 | No |
| Digitisation | Energy Efficiency | Cost Efficiency |
|---|---|---|
| 85% of all poly value stream assets monitored | 95% accuracy in prediction of energy consumption | 10% savings through schedule optimisation |
| 25% of production assets enabled with FDD | 10% reduction in energy by idle time reduction | 15% savings through FDD on support assets |
| 50% of support assets enabled with FDD | Reduce complexity of energy audits | |
| Reduce complexity of data collection |
| Asset Type | Data Points | Data Sources | Responsible |
|---|---|---|---|
| Production | Energy | Data Historian (OSI Pi) | Person A |
| Product Logs | Operations Management System (OMS) | Person B | |
| Support | Air Handling Units | Building management System | Person C |
| Chillers | |||
| Compressors | Peak API * | Person D x | |
| Renewables | Wind | Data Historian (OSI Pi) | Person A |
| Enercon API * | Person E x | ||
| Solar | Data Historian (OSI Pi) | Person A | |
| Huawei API * | Person F x |
| Asset Group | No. | Idle % | Idle 5% | Idle 10 % |
|---|---|---|---|---|
| All assets | 14 | 3.06 | 18.32 | 26.37 |
| Cleanlines | 2 | 0.61 | 0.77 | 51 |
| Saws | 2 | 0 | 0 | 0.4 |
| Lathes | 10 | 8.24 | 55 | 71.23 |
| Mode | Rule No. | Rule Expression |
|---|---|---|
| Heating | 1 | |
| 2 | For : | |
| 3 | & | |
| 4 | ||
| Cooling with outdoor air | 5 | |
| 6 | ||
| 7 |
| Error Indexes | Model | Model |
|---|---|---|
| 7.424 [kW] | 28.42 [kW] | |
| 24.587 [kW] | 267.89 [kW] | |
Disclaimer/Publisher’s Note: The statements, opinions and data contained in all publications are solely those of the individual author(s) and contributor(s) and not of MDPI and/or the editor(s). MDPI and/or the editor(s) disclaim responsibility for any injury to people or property resulting from any ideas, methods, instructions or products referred to in the content. |
© 2024 by the authors. Licensee MDPI, Basel, Switzerland. This article is an open access article distributed under the terms and conditions of the Creative Commons Attribution (CC BY) license (https://creativecommons.org/licenses/by/4.0/).
Share and Cite
Ranade, A.; Gómez, J.; de Juan, A.; Chicaiza, W.D.; Ahern, M.; Escaño, J.M.; Hryshchenko, A.; Casey, O.; Cloonan, A.; O’Sullivan, D.; et al. Implementing Industry 4.0: An In-Depth Case Study Integrating Digitalisation and Modelling for Decision Support System Applications. Energies 2024, 17, 1818. https://doi.org/10.3390/en17081818
Ranade A, Gómez J, de Juan A, Chicaiza WD, Ahern M, Escaño JM, Hryshchenko A, Casey O, Cloonan A, O’Sullivan D, et al. Implementing Industry 4.0: An In-Depth Case Study Integrating Digitalisation and Modelling for Decision Support System Applications. Energies. 2024; 17(8):1818. https://doi.org/10.3390/en17081818
Chicago/Turabian StyleRanade, Akshay, Javier Gómez, Andrew de Juan, William D. Chicaiza, Michael Ahern, Juan M. Escaño, Andriy Hryshchenko, Olan Casey, Aidan Cloonan, Dominic O’Sullivan, and et al. 2024. "Implementing Industry 4.0: An In-Depth Case Study Integrating Digitalisation and Modelling for Decision Support System Applications" Energies 17, no. 8: 1818. https://doi.org/10.3390/en17081818