Abstract
The Kingdom of Saudi Arabia is experiencing a surge in electricity demand, with power generation increasing 4 times in 25 years from 1990 to 2014. Despite the abundant primary renewable energy sources, the country has overlooked them in the past in national energy policies. However, in recent years, renewable energy has become a part of the Kingdom of Saudi Arabia’s energy conservation policy due to climate changes, technological progress, economies of scale, and increased competitiveness in supply chains. The Saudi government has created the King Abdullah City for Atomic and Renewable Energy (KACARE) to develop national strategies for effectively utilizing renewable and nuclear energy. This paper reviews the current state of the art of the renewable energy technologies available on the market and evaluates the installation of renewable energy plants near Saudi Arabia’s East Coast for a new town, focusing on technical rather than economic aspects. The paper provides a wide review of the possible technical solutions to exploit the producibility of different renewable sources, considering the challenging climate conditions typical of desert areas. The analysis of a real case study shows a high availability of wind and solar irradiance that allow a net energy production of 354 and 129 GWh, respectively. In addition, the comparison between a typical ground-mounted photovoltaic (PV) system and an emerging floating PV reveals that for the same installed power, occupied area, and environmental conditions, the latter has a 4% greater performance ratio due to the cooling effect of water.
1. Introduction
The Kingdom of Saudi Arabia (KSA) is a rapidly developing nation facing a significant surge in electricity demand in the last 20 years. Power generation has increased by more than 4 times in 25 years from 1990 to 2014 [1]. The energy sources are crucial determinants of any nation’s economic development [2]: the KSA relies predominantly on fossil fuels for power generation, with over 15% of its domestic oil production used for electrical generation [3]. Furthermore, over 50% of gas production is powering electrical plants. The scenario is similar to other Middle Eastern countries where the oil and gas markets are the main sources of income [4], and which are heavily dependent on fossil fuels for energy supply and domestic consumption [5]. Although the Middle East has a vast potential in renewable resources, the energy mix used for power generation still exploits fossil fuels predominately [6].
Renewable energy in the KSA has been at a critical juncture for many years [7]. Some energy analysts advocated for a more prominent role of renewable energy sources (RESs) [8] in national energy policy. The environmental and public benefits of RESs were generally acknowledged and commended. However, there was a widespread belief that RESs are optional in the short- to medium-term strategies for industrial and energy investments in the KSA. This perception was evident through the comparatively modest spending on projects to develop RES plants, the neglect of renewable energy in developing national energy policies, and the limited investment capital allocated to renewable energy projects.
Despite the price of fossil fuels being one of the cheapest in the world, renewable energy has become a part of KSA’s energy conservation policy for several reasons. The KSA has sizeable primary sources; for instance, the solar radiation is up to 2200 kWh/m2/yr [9] and the wind source is abundant [10,11]. Additionally, renewable electricity prices have substantially declined over the past decade due to technological progress, economies of scale, enhanced competitiveness in supply chains, and increased competence among developers. Since 2010, utility-scale solar photovoltaic (PV) electricity prices have declined substantially, dropping by 82%. Concentrated solar power (CSP) experienced a decline of 47%, onshore wind saw a dip of 39%, and offshore wind decreased by 29%, according to the IRENA report in 2020 [12]. Finally, in recent years, rapid population growth, climate, and water cycle changes have justified the need to integrate RESs [4]. Renewable energy is a viable solution for green power generation [13], currently accounting only for 3% of electricity production in the Middle East.
Renewable energy is increasingly more economically efficient than any newly established electricity generation capacity that depends on fossil fuels. According to recent statistics [14], newly created renewable power production projects continuously provide lower pricing compared to well-established coal-fired facilities. From a statistical standpoint, the costs of constructing new solar PV and onshore wind power are lower than those of maintaining multiple existing coal plants. The auction results demonstrate that this pattern is gathering pace, bolstering the case for completely eradicating coal. According to a report by IRENA in 2020 [12], the operating costs of adding new utility-scale solar PV systems may be lower than the expenses of maintaining up to 1200 GW of existing coal capacity in the upcoming years.
In this scenario, RESs have been identified as crucial for maintaining a healthy global economy, especially in industrialized nations like the KSA [15]. For these reasons, the Saudi government has created King Abdullah City for Atomic and Renewable Energy (KACARE) to formulate national strategies for effectively utilizing renewable and nuclear energy. It has been announced that the KSA is looking into the Advanced Power Reactor 1400 (APR1400) and a high temperature reactor (HTR) as part of its grand plan for the deployment of both large and small modular reactors (SMRs) as well as the development of a nuclear fuel cycle [16,17]. Both reactors can be modeled using the Monte Carlo burnup (MCB) code, as shown in [18,19]. Nuclear power generation can have a beneficial effect on the quality of the environment. In fact, a 1% increase in nuclear-generated electricity reduces emissions per capita by approximately 0.13%. It is estimated that the emissions of a nuclear power plant are two orders of magnitude lower than those of fossil fuel power plants [20]. Although nuclear energy has an important role for reducing emissions, nuclear power plant operation entails risks, which are largely dependent on social, economic, and political factors [21].
Based on these observations, this paper aims to evaluate the installation of generation plants from RESs near the east coast of Saudi Arabia, to feed energy to an industrial town. After a review of the potentialities of the different technologies available on the shelf in light of the state of the art, the paper presents some scenarios of integration of RESs for a case study, with more attention to the technical aspects (i.e., maximum installed power, productivity, and performance over the years) than to the economic ones. The choice of technologies to be used was driven by a preliminary detailed analysis of the main meteoclimatic site data, i.e., global irradiance incident on a horizontal surface, wind speed and direction, ambient temperature, and precipitation. Such data were obtained by means of the software Meteonorm, whose database exploits interpolation of on-site measurements made directly from weather stations installed in proximity of the survey area. The study makes it possible to assess the feasibility of renewable generation facilities in a given area. In addition, the comparison between a well-established technology, such as the ground-mounted PV and the newer floating photovoltaic (FPV), highlights the differences in terms of yields and performance ratio, despite the proximity of the installation sites.
2. Renewable Energy Source Technologies
Renewable energy is the pillar for sustainable development and energy transition [22,23]. The exploitation of RESs is highly site-specific since the choice of the best technology for a given area involves a preliminary analysis of the local weather and climate conditions [24]. The prediction of the expected energy production using machine learning approaches has become a widely used and reliable method [25,26,27,28,29].
For instance, among renewable sources, solar energy is considered the most desirable due to its abundant availability in the survey area. Because of its geophysical location near the Tropic of Cancer, extensive deserts, and year-round bright sky, the site has significant potential for harnessing solar energy. Therefore, the location is propitious to experience extended periods of sunlight and a substantial amount of horizontal solar radiation.
Air pollution and climate changes are key factors in the global energy transition process. About two-thirds of global greenhouse gas emission (GHG) are due to the use of energy from fossil fuels. The aim of the energy transition is to reduce emissions substantially while ensuring the availability of energy for economic growth [30].
In this scenario, the state of the art of several renewable technologies, chosen in full accordance with the most abundant resources in the survey area, is described below. It is significant to highlight that, based on the information available at this early stage, each of the five potential possibilities in the following sections is considered technically possible, albeit with accompanying risks.
2.1. Photovoltaic Plant
For developers in most of the world, combining bifacial solar panels with single-axis trackers is the most economical option [31], resulting in the lowest levelized cost of electricity (LCOE). According to recent research [32,33], monofacial single-axis trackers were the second-cheapest combination explored by scientists over 87.9% of the continent. Upsizing solar plants from single- to dual-axis trackers resulted in improved performance, with yield rising by 4% on average. However, the study found that the single-axis remained the better choice because of the following cost to be covered for switching to the dual-axis [34].
Private sector engineering businesses and numerous national renewable energy labs have explored the bifacial boost from single-axis tracker arrays. Field testing generally revealed that bifacial gains range between 5 and 6%; modules with better bifaciality factor ratings can produce yield gains of 7% [35].
Table 1 summarizes the main technical and economical data of ground-mounted PV plants (shown in Figure 1).

Table 1.
Main technical and economical parameters of PV power plants.
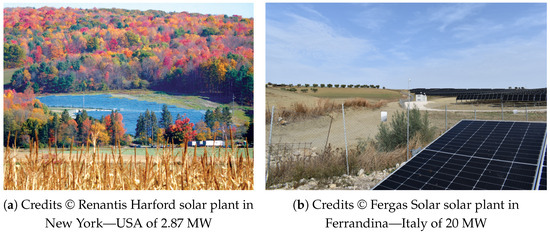
Figure 1.
Ground mounted photovoltaic plants: (a) monofacial panels on fixed racks; (b) bifacial panels on single-axis trackers.
2.2. Floating Photovoltaic Systems
PV modules are usually installed on the ground or on roofs through rigid structures. However, given the limited availability of land in some areas, the growing threat of deforestation, and increasing population density, attention is moving towards new techniques for installing PV systems on oceans, reservoirs, lakes, and canals [36]. In locations where land usage is restricted, the land is hard to reach, or land leasing is expensive, developers install FPV systems on bodies of water [37]. In addition to decreasing competition in land usage, FPV systems can reduce evaporation in water bodies and make it easier to establish dual-use systems that include aquaculture and increase energy production [36].
In an FPV, several floats or pontoons support the solar panels. The floating structure is kept fixed by mooring lines connected to an anchoring system that can be attached to the shore or the seabed [38]. The number and type of anchorages and mooring lines is strongly influenced by the meteo-marine conditions at the installation site [38,39]. The layout of a typical FPV system is shown in Figure 2.
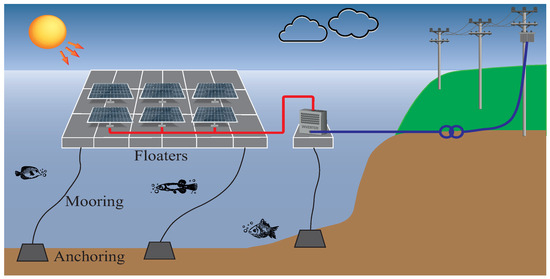
Figure 2.
Typical layout of a floating photovoltaic plant.
The increasing spread of FPV systems led to the development of floating structures that can be mainly divided into the following three classes [39,40]:
- Class 1 consists of large rafts made of high-density polyethylene (HDPE) pipes and steel, aluminium or composite components. On the one hand, the HDPE pipes provide the buoyancy force, on the other hand, the aluminium or steel rafts ensure an optimal panel inclination. This type of structure does not cover completely the water surface, minimizing the positive effect on water evaporation [40];
- Class 2 consists of single-module rafts that are connected by pins to form floating platforms [39]. The main problem of this technology is the lightness of the structure itself, whose connecting pins, made of HDPE, can break under very strong stress due to wind or wave action [41]. Despite the limitations that make this class unsuitable for marine applications, nearshore FPV systems have been realized in the Persian Gulf using this technology [42].
- Class 3 consists of floating pontoons made of plastic but with a low risk of releasing microplastics into the water, in compliance with environmental regulations. The pontoons can be joined in order to form a safe, stable, and easily maintained floating platform [43].
At the design phase of a FPV system, it is important to define the water level [44]. In fact, the free water surface can change as a result of the combined action of astronomical tides (due to the gravitational forces of the Moon and Sun) and meteorological tides (due to storm surges and other weather phenomena) [45]. Both phenomena must be considered for calculating the water boundary level and for the assessment of the load on a floating structure. Knowing water level fluctuations is critical in sizing the mooring system, which must allow for the vertical movement of the floating structure over the entire range of variation. That is the reason for always preferring to use flexible moorings. Another key function of the mooring system is to transmit loads from the floating structure to the seabed. A possible configuration is to connect each platform to the mooring system, increasing the complexity and thus the overall cost of the system. Instead, using a few mooring points would require more rigid and robust moorings, increasing the load transferred throughout the floating structure [46].
2.3. Concentrating Solar Power
Large-scale power generation has found a strong contender in solar thermal technologies. In contrast to other renewable energy technologies, CSP has the potential to operate in hybrid mode with the existing fossil fuel facilities or to integrate thermal storage systems to provide dependable dispatchable power [47]. Consequently, it offers stable generating capacity and is appropriate for base load and peak operation. Water is required for the cooling and routine cleaning of the reflectors using truck-mounted brushes and high-pressure water hoses [48].
2.3.1. Parabolic Trough Systems
Due to their extensive commercial operational history, which dates back to 1984, parabolic trough systems, including a high-temperature heat transfer fluid (HTF), are now the most proven CSP technology. Heat receivers, support structures, and solar collectors (mirrors) comprise parabolic trough collectors (PTC) [49].
A sheet of reflecting material is formed into a parabolic shape to create the parabolic-shaped reflectors, which focus incoming sunlight onto a central receiver tube at the collector’s focal line (Figure 3). Mirror arrays span up to 100 m long, with a curved aperture of 5 and 6 m [50]. Both solar collectors and heat receivers are oriented toward the Sun using a single-axis tracking device. PTC are often along the north–south direction and follow the Sun’s path from east to west to capture as much energy as possible [51].
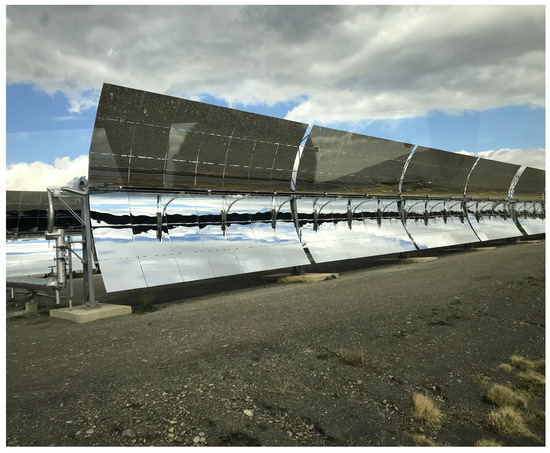
Figure 3.
Parabolic trough collectors (credits © H2020 European Nextower Project).
The receiver’s absorber tube (often made of metal) is housed inside an evacuated glass envelope. Typically, the absorber tube is a coated stainless steel tube that emits minimal infrared (long wave) radiation but effectively absorbs solar (short wave) energy. This coating is spectrally selective. This lessens the loss of heat [52].
The use of evacuated glass tubes contributes to a decrease in heat loss [53]. The HTF is pumped via the absorber tubes to gather solar energy and transport it to the steam generator or, if applicable, to the heat storage system. The HTF used in most parabolic troughs is synthetic oil, which is stable at 400 °C. Melted salt at 540 °C is used in new plants, either as a thermal storage medium or for heat transfer. Dissolved salt at a high temperature can significantly enhance thermal storage efficiency [52,54].
2.3.2. Concentrating Solar Tower
Tower CSP systems utilize many sun-tracking mirrors, called heliostats (Figure 4a), to concentrate sunlight onto a receiver at a tall tower’s apex [55].
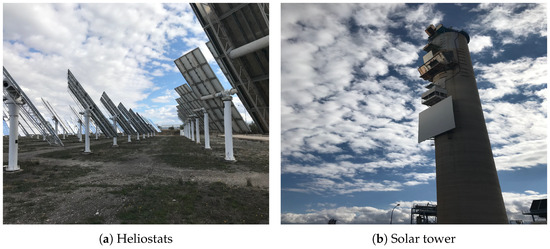
Figure 4.
Main components of a concentrated solar tower plant (credits © H2020 European Nextower Project).
Solar power systems employ a terrestrial array of mirrors to concentrate direct solar radiation onto an elevated receiver atop a central tower (Figure 4b). At the receiver, the light is harnessed and transformed into thermal energy. The heat initiates a thermodynamic process, typically including a water-steam cycle, to generate electrical power. The solar field consists of several heliostats, i.e., computer-controlled mirrors, which independently track the Sun’s motion along horizontal and vertical axes. The mirrors reflect the sunlight onto the center receiver, causing the heating of a fluid [56]. Solar towers achieve higher temperatures than parabolic troughs and linear Fresnel systems due to their ability to focus more sunlight onto a single receiver, hence minimizing heat losses at that particular location [52].
Solar towers now employ water/steam, air, or molten salt as the heat transfer media to convey heat to the heat exchanger/steam turbine system. The top operating temperatures of the receiver can vary from 250 °C to potentially 1000 °C in future plants, depending on the design and the type of working fluid. However, contemporary molten salt designs typically operate at temperatures around 600 °C [56]. The current standard capacity of solar power facilities typically falls between 10 MW and 50 MW. The necessary size of the solar field expands as the intended annual electricity generation grows, resulting in a more significant gap between the receiver and the outside reflectors of the solar field. Consequently, there is a rise in optical losses caused by the absorption of the atmosphere, as well as inevitable deviations in mirror alignment due to flaws in the mirrors and minor inaccuracies in mirror tracking [52].
Currently, two commercially viable solar tower system variants are actively developed [57]:
- In the indirect configuration, a non-aqueous or non-gaseous working fluid is heated in the receiver. If a thermal energy storage (TES) system is present, the fluid is held there before being sent to a steam generator train. The steam produced by the train is then used to power a conventional turbine generator, which generates electricity. Commercial designs employing this concept utilize molten nitrate salts as the working fluid due to their exceptional heat transfer and energy-storage characteristics;
- In the alternative arrangement, known as the direct configuration, water or steam are employed as the working substance. It is heated in the receiver and directed straight to the inlet of the Rankine turbine. The direct steam solar receiver can be equipped with distinct receiver parts dedicated to steam generation, superheating, and, if necessary, reheating. Another alternative architecture, which has yet to be made available for commercial use, involves utilizing a gaseous working fluid such as air or to propel a power system based on the Brayton or Rankine cycle.
Solar towers can utilize synthetic oils or molten salt as both the HTF and the storage medium for thermal energy storage. Synthetic oils constrain the operating temperature, capping it at approximately 390 °C, constraining the steam cycle’s efficiency [52]. Molten salt elevates the theoretical operational temperature to a range from 550 to 650 °C [52,58], which enables the utilization of more efficient supercritical steam cycles. However, the increased expenses associated with these steam turbines may be a limitation. Another option is direct steam generation, which avoids the requirement and cost of heat transfer fluids. However, this technology is still in the early stages of research, and the storage methods for direct steam generation need to be tested and refined [52].
Solar towers possess several potential advantages, rendering them a prospective frontrunner in CSP technology. The primary benefits are as follows:
- Elevated temperatures can enhance the efficiency of the steam cycle and decrease the amount of water needed for cooling the condenser [59];
- The increased temperature also enhances the desirability of utilizing thermal energy storage to enable predictable power generation [59];
- Elevated temperatures will also provide more significant temperature gradients in the storage system, reducing the cost or enabling increased storage capacity at the exact same cost [59].
The primary benefit is the ability to utilize thermal energy storage to increase capacity factors and enable a versatile generating approach to optimize the value of the electricity produced while also attaining higher levels of efficiency [60]. Considering these benefits, solar towers have the potential to capture a substantial market share in the future, even if PTC systems have been the dominant force in the market until now, as long as costs can be lowered and operational expertise is acquired.
2.3.3. Linear Fresnel Reflector
Utilities are increasingly interested in the linear Fresnel reflector (LFR) technology as a potential option for integrating combined cycle systems using DSG. The LFR system, shown in Figure 5a, employs a series of elongated mirror facets that redirect light toward a linear receiver, allowing for direct absorption or further concentration through a compound parabolic reflector [61].
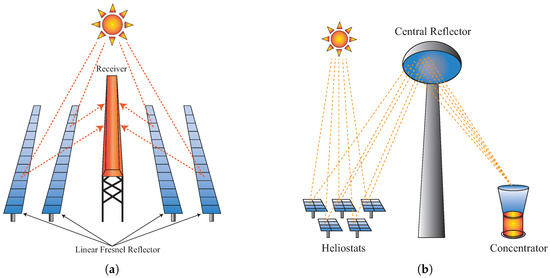
Figure 5.
Typical layout of a linear Fresnel reflector system (a) and of a beam-down solar thermal concentrator (b).
Linear Fresnel collectors (LFCs) are akin to parabolic trough collectors, employing a sequence of elongated flat or slightly curved mirrors positioned at varying angles to focus the sunlight on both sides of an immobile receiver several meters above the main mirror array [62]. Every row of mirrors is equipped with a single-axis tracking mechanism and is uniquely tuned to guarantee continuous concentration of sunlight on the stationary receiver. The receiver comprises a lengthy absorber tube that is selectively coated [63].
Contrary to parabolic trough collectors, the focal line of Fresnel collectors is affected by astigmatism, causing distortion. A secondary reflector, known as mirror, is necessary above the tube to redirect the sunlight that is not captured by the tube. Alternatively, a multi-tube receiver can be utilized, consisting of numerous parallel tubes broad enough to capture most of the concentrated sunlight without needing a secondary reflector [64].
Linear Fresnel CSP systems offer the following several key advantages over parabolic trough systems:
- LFCs have the advantage of utilizing cost-effective flat glass mirrors, readily available as a widely produced commodity [52];
- LFCs necessitate a reduced amount of steel and concrete due to the lighter weight of the metal support framework. Additionally, this facilitates the assembly process [52];
- LFCs experience lower wind stresses, leading to enhanced structural stability, decreased optical losses, and reduced risk of mirror-glass breakage [52];
- The mirror surface area per receiver is greater in LFCs than in PTCs, which is significant considering that the receiver is the costliest element in both PTC and LFC systems [52].
The benefits of LFC solar fields must be weighed against the reduced optical efficiency compared to PTC solar fields caused by the geometric features of LFCs.
The issue is that the receiver remains stationary, resulting in significant cosine losses throughout both morning and afternoon periods, notably higher when compared to PTC. Despite these drawbacks, the relative simplicity of the LFC system makes their manufacturing and installation cheaper than for PTC CSP plants; higher costs are expected since LFCs typically employ direct steam generation, including TES [52]. Hence, whether the costs per kilowatt-hour are more affordable has yet to be determined.
2.3.4. Beam down Solar Thermal Concentrator
The beam-down solar thermal concentrator (BDSTC) is a concentrator that focuses sunlight onto a specific spot using a reflecting surface. The primary reflector system consists of heliostats that track in two axes. The heliostats concentrate sunlight onto a single theoretical focal point located above them. The radiation is caught by a secondary central reflector (CR) atop the tower and redirected to a lower focal point near ground level. The BDSTC is a tower-based system that differs from traditional tower plants since it collects solar energy at the lower focal point near the ground rather than in the heat transfer fluid on top of the tower, as shown in Figure 5b. This is achieved through the use of CR’s secondary optics [65].
2.3.5. Dish/Engine Systems
A dish/engine system, shown in Figure 6, employs a mirrored dish resembling a considerably large satellite dish. However, to reduce expenses, the mirrored dish is typically constructed using numerous smaller flat mirrors arranged in the shape of a dish. The concave surface focuses and intensifies sunlight onto a thermal receiver, positioned at the dish focal point, which absorbs and gathers the heat and delivers it to the engine generator. The Stirling engine is the predominant form of heat engine utilized in dish/engine systems nowadays. This device uses the warm fluid from the receiver to drive pistons and generate mechanical energy. Subsequently, the mechanical power is harnessed to operate a generator or alternator, generating electricity [66].
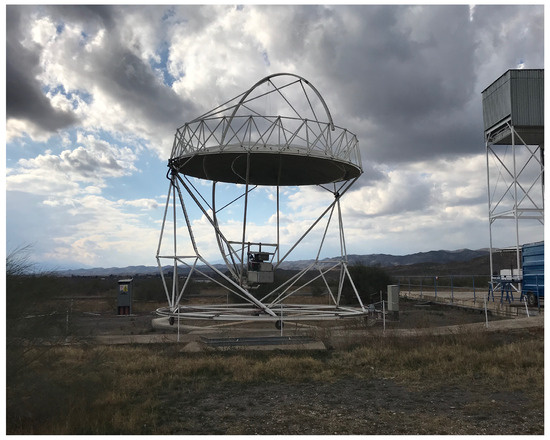
Figure 6.
Dish/Engine system (credits © H2020 European Nextower Project).
The recipient could be a Stirling engine, specifically in dish/engine systems, or a micro-turbine. Stirling dish systems necessitate dual-axis sun tracking to concentrate significant energy onto a single spot, resulting in extremely high temperatures. Stirling dish systems have yet to be implemented on a large scale [67]. The current emphasis of research lies in utilizing a Stirling engine in conjunction with a generator unit positioned at the dish focal point to convert thermal energy into electrical power.
Presently, the following two categories of Stirling engines exist: kinematic and free piston.
Kinematic engines utilize hydrogen as their working fluid and exhibit superior efficiency to free-piston engines. Free-piston engines use helium as a working fluid and operate without generating friction, hence facilitating a decrease in the necessary maintenance.
The main advantages of Stirling dish CSP technologies are as follows [52]:
- The generator is usually located in the receiver of each dish, which minimizes heat losses. This design allows for tiny individual dish-generating capacity, ranging from 5 to 50 kW, making it very modular and suited for distributed generation;
- Stirling dish technology has the best efficiency among all forms of CSP systems;
- Stirling dishes employ dry cooling methods and do not require extensive cooling systems or towers, enabling CSP to generate power in areas with limited water resources;
- Stirling dishes, due to their compact size and self-contained nature, can be installed on slopes or uneven ground, which is impossible with PTC, LFC, and solar towers.
These benefits indicate that Stirling dish technologies can serve a advantageous role in various areas despite the probability of having a higher levelized power cost than other CSP technologies. Stirling dish systems are now in the demonstration phase, and the large-scale production cost is still being determined. In addition to financial considerations, dish systems have the obstacle of limited storage capabilities. Due to their exceptional scalability and compact dimensions, they represent a viable solution in arid regions [52].
Table 2 and Table 3 summarize the main technical and economical data of CSP plants and solar systems in general, respectively.
Table 2.
Main technical and economical parameters of CSP plants.
Table 3.
Reference data for solar systems.
2.4. Wind Power Plants
Wind is an environmentally friendly, cost-free, and plentiful energy resource utilized to produce electricity (Figure 7). Wind turbines operation is based on the following straightforward principle: the movement of wind causes the blades to rotate, generating kinetic energy. Subsequently, a generator transforms the aforementioned kinetic energy into electrical energy [68]. A wind farm is a collection of wind turbines that can operate in a land-based or an offshore configuration, spanning multiple square kilometers of ground or sea, designed to capture, respectively, onshore or offshore wind energy. Wind power costs have decreased due to advancements in manufacturing, turbine design, and increased capacity factors. These improvements have solidified wind power’s role as a significant contributor to the transition towards clean energy. In 2021, as reported by Eurostat, wind power contributed approximately 37% of the EU’s total electricity generated from renewable sources [69].
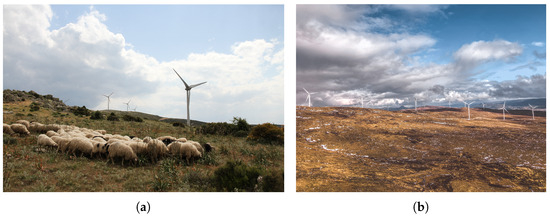
Figure 7.
Onshore wind farms. (a) Credits © Renantis Buddusò windfarm in Sardinia—Italy of 160 MW; (b) Credits © Renantis Millennium windfarm in Scotland—UK of 65 MW.
Offshore wind energy is highly esteemed in numerous coastal states due to its social and economic advantages that surpass mere cost-of-energy evaluations. Offshore large-scale electric-generating projects can be constructed near densely populated areas with minimal disruption to other ocean activities. These projects can rely on more abundant wind resources than those available on land, while avoiding the expensive expenditures associated with locating projects on inhabited land. Additionally, they have the potential to generate thousands of well-paying jobs [70].
Table 4 summarizes the main technical and economical data of wind-based power plants.
Table 4.
Main technical and economical parameters of wind-based power plants.
2.5. Hybrid Systems
2.5.1. CSP and Desalination
The following three different technical solutions are available:
- Small-scale decentralized desalination plants directly powered by concentrating solar thermal collectors, specifically the multi-effect desalination (MED) plants [71];
- Concentrating solar power stations that generate electricity for reverse osmosis (RO) membrane desalination, known as CSP/RO [72];
- Combined electricity and heat generation for thermal multi-effect desalination systems, referred to as CSP/MED [73].
2.5.2. CSP and Gas Systems
An integrated solar combined cycle (ISCC) system is a conventional hybrid technology where the solar field contributes just 5–10% of the total energy. Efficiency losses surpass the amount of solar power injected when turbines are tuned to operate close to maximum capacity. If they need to reduce their output to accommodate the solar field’s contribution, their gas combustion becomes less efficient. Solar steam has a lower temperature than heat-recovery steam, resulting in the reduced efficiency of the turbine steam generator. Thus, direct hybridization can only accommodate small solar contributions. Emerging ideas, such as the decoupled solar combined cycle system, are being developed to overcome these constraints [74].
From an economic perspective, decoupled solar combined cycle technologies offer clear benefits. These technologies utilize a shared TES and steam turbine generator, producing efficient capital recovery costs for these components. As a result, the LCOE for the decoupled solar combined cycle technology can be comparable to that of a regular combined cycle plant while also exhibiting reduced emissions and fuel consumption [74].
3. Case Study: Utility-Scale Renewable Power Plants in Saudi Arabia
Following the global trend promoting the reduction in carbon emissions by favouring energy production from renewable sources over conventional generation, 50% carbon neutrality was set as a target to be achieved by 2030 by the Ministry of Energy of KSA [75]. This goal represents a challenging one for KSA, where renewable sources are being considered only in the recent years, as proved by the fact that in 2018 KSA classified first in oil consumption worldwide, covering the 97.8% of electricity consumption by oil and natural gas [76].
The selection of RES technologies was determined by an analysis of the weather and climate conditions in the survey area, and by consideration of the environmental constraints, restricting the areas available for installation, and the technical constraints, bounded to the availability on the market of specific technologies. Several studies have suggested that the coastal regions have high potential for wind-based power generation; additionally, investments in solar energy production is endorsed by its location, vast desert areas, and climatic conditions [77]. The gathered data and information on the constraints were used to run simulations, allowing for an estimate of the energy production capabilities of the different renewable plants (i.e., wind farms, onshore and offshore PV plants), given the non-uniform distribution of producibility from wind and solar resources over the territory.
The chosen solution combines the use of a PV plant and a wind farm for power generation. This configuration reduces land consumption for the same installed power, fostering continuity in generation. The key factors driving choices and sizing were as follows:
- Land use: an issue that mainly concerns the PV plant, whose layout was chosen so as to avoid shading between parallel rows of modules;
- Power density: a fundamental characteristic for selecting the installation site of a wind turbine and strictly dependent on wind speed;
- Energy produced: estimated by means of globally recognized software.
Hence, the production plants were sized according to different criteria as follows: for the wind farm and the PV field, the key factors were power density and available space, respectively.
3.1. Modeling Software and Tools Used for the Analysis
The main software used for the study are Meteonorm 8.0.3, WaSP 9.1, and PVsyst 7.4.0, which are equipped with internal tools to ease the analysis of the system.
Meteonorm is a meteorological database that contains climatological data for solar applications anywhere in the world. The outputs are generated stochastically from long-term interpolated monthly averages. They represent an average year of the selected climatological period based on user settings. Therefore, the results do not constitute an actual historical year, but a hypothetical year that statistically depicts a typical year at the selected location. Meteonorm is primarily used for calculating solar radiation on any way oriented surfaces, but it also allows for the evaluation of ambient temperature, wind speed and direction, and precipitation on an hourly pattern. Once the coordinates of the location for which meteorological data are required have been defined, data are obtained in the desired format. The software fundamentally operates in two steps. In the first one, surrounding weather stations are searched and their long-term monthly averages are interpolated to the specified site. If the density of the data available from the stations is low, satellite imagery helps to improve the radiation parameters. In a second step, a stochastic weather generator operates on the interpolated monthly data to generate a typical annual average of data with hourly resolution. Wind speed and direction data generated with Meteonorm can be imported into WAsP (Wind Atlas Analysis and Application Program) for modeling the wind climate in the investigation area. This is possible thanks to an integrated tool called observed wind climate (OWC) wizard. When calculating a wind atlas from site data, WAsP does not use the time series of meteorological data but needs a tabular summary of the frequency of occurrence of wind speed versus wind direction. This tabular summary is contained in an OWC file. The wind atlas can only be assessed by having a 3D terrain model since WAsP evaluates the wind speed in the area surrounding the observation point according to orography. At this point, to evaluate the energy production expected from a given wind turbine at a given site, it is necessary to know the power curve of the turbine and the probability density function of the wind speed at hub height. The product of these two functions provides the power density curve, whose integral is the average energy production. This integral is evaluated by WAsP in terms of the parameters of the Weibull distribution and approximating the power curve with a continuous linear function. The WAsP turbine editor tool makes it possible to include the power curve and hub height of the chosen turbine in the simulation.
Finally, PVsyst was used to calculate the producibility of PV plants. PVsyst exploits the climate data collected with Meteonorm and, once the orientation parameters of the modules, i.e., azimuth and inclination, and the layout of the array have been defined, the software can calculate the expected energy production.
3.2. Wind Farm
For the analysis of the wind resource throughout the investigation area, the digital elevation model of the terrain was derived to allow the estimate of the wind climate in the considered area. Unfortunately there are no meteorological stations installed directly at the survey site; wind speed and direction data for the period from June 2021 to May 2022 were collected from weather stations close to the survey area through the Meteonorm software. One of the peripheral stations is double-circled in red in Figure 8.
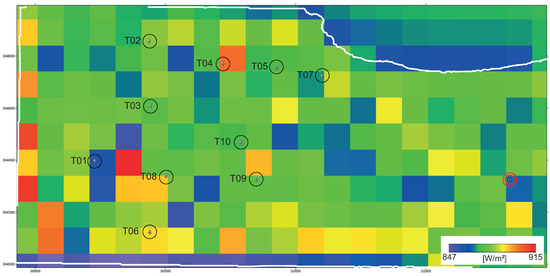
Figure 8.
Power density map for the area of interest (view on WAsP) and installation sites of the wind turbines.
The collected data obviously relate to the measurement point; the extrapolation of wind properties within the study area was performed through the software WAsP. It represents the world’s state of the art for wind machine sitology, allowing to extrapolate available point-level anemometer data with good accuracy within an area of varying radius in the 10–50 km range from the measurement point, depending on orographic complexity.
The wind map is needed to identify the most favourable sites for turbines installation and calculate the annual energy producibility of a wind farm. The latter, the output of WAsP, is related to the estimate of wake losses and gross annual energy production (AEP), when the power curves of the wind turbines and their layout are given in input to the program.
Horizontal axis wind turbine generators were selected from the ones available on the market, as they have high efficiencies and can produce a high amount of electricity in full wind. Main technical data of the wind turbine are given in Table 5.
Table 5.
Main technical data of the wind turbine.
In order to evaluate the annual producibility of each turbine, it is necessary to import the power curve of the chosen aerogenerator into the software. Figure 9b shows the trend of the turbine power output, its maximum power output being 6.2 MW.
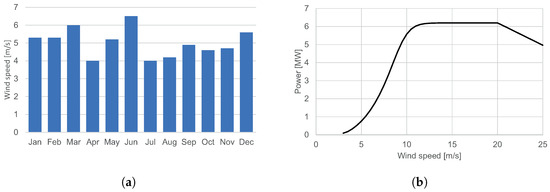
Figure 9.
Monthly average wind speed in the investigation area and power curve of the selected wind turbine. (a) Monthly average wind speed; (b) Power curve (Siemens Gamesa SG 6.0–170).
One of the outputs that the user may produce through the WAsP consists of a power density map for the project area. The territory may be subdivided into a grid of square elements with chosen surface area (herein, 1 km2), as in Figure 8. By means of a color map, the power density associated with each square is displayed, based on the computed average of hourly data of power over a year period. The figure shows that the power density ranges between 847 W/m2 and 915 W/m2.
Based on the obtained map and considering the terrain morphology, the best installation points for wind turbines were then chosen and are shown in Figure 8. The wind farm consists of 10 wind turbines with total installed power 62 MW, total net output 353.8 GWh, and 99.3% efficiency (affected by wake losses). Details corresponding to each wind turbine, located at the labelled sites in Figure 8, are listed in Table 6.
Table 6.
Annual wind farm producibility.
3.3. Photovoltaic Plant
The investigation area is characterized by high global radiation, which also reaches values around 200 kWh/m2 in June and July (Figure 10a). The high irradiance, together with the duration of sunshine, which averages about 9 h during the year (Figure 10b), are promising for the installation of PV systems.

Figure 10.
Monthly global and diffuse radiation, and average daily sunshine duration during months of the year. (a) Radiation; (b) Sunshine duration.
In Figure 11a, the global irradiance trend shows an increase in solar radiation from winter to summer. Considering the general trend of solar irradiance, values lower than expected are found for the months of March and April, in some days even lower than in January. This is justified by a higher average number of days with precipitation in this period, as shown in Figure 11a. As can be seen in Figure 11b, the daily temperature has fluctuations between minimum and maximum values ranging from 10 to 15 °C.
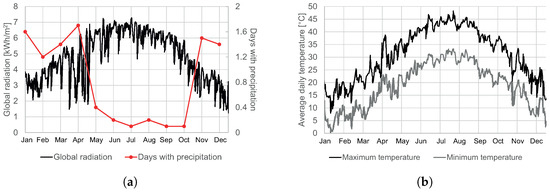
Figure 11.
Sites conditions relevant for sizing the photovoltaic plant. (a) Daily global radiation and number of days with precipitation. (b) Maximum and minimum daily temperature trend.
The PV plant consists of bifacial modules with a rated power of 580 Wp, installed on single-axis trackers in order to increase the whole producibility. The average daily energy produced by the system is 12–20% higher than a fixed-tilt configuration [78] thanks to the backtracking algorithm, driving the axial rotation of the modules according to the changing position of the Sun.
The evaluation of the PV system’s producibility was conducted through the PVsyst software, based on the previously described climatic conditions. The modules cover a total installation area of approximately 0.8 km2. The preferred configuration, favouring a reduction in losses, exercise and maintenance operations for the plant, is a central solar farm, compliant with environmental limitations, and avoiding unavailable areas due to former constructions. For a first raw sizing attempt, an equivalent installation area was considered for the analysis, within which single-axis trackers were arranged in order to minimize mutual shading between structures, maximize the energy production of the plant, and ensure the space required for maintenance.
The electrical characteristics of a photovoltaic string, consisting of 26 PV modules connected in series, are given in Table 7. The proposed arrangement involves the installation of 2403 photovoltaic module support structures, arranged in a north–south direction in parallel rows with suitable spacing.
Table 7.
Characteristics of a single photovoltaic string (standard test conditions).
The proposed technical solution has the following additional advantages in terms of structural stability and soil occupation: immediate use of the support structure, which can be directly subjected to the load; stability and durability of the intervention, thanks to the anchoring operations; cost-effectiveness and environmental compatibility of the intervention, minimizing the disturbance and soil occupation, compared to conventional foundation structures (plinths and foundation slabs).
As a result, the whole system consists of 124,956 bifacial modules for a total installed peak power of 72.47 MWp. Based on the peak power of the PV field, 15 inverters whose main characteristics are given in Table 8 were chosen, one for each subfield. The aim is to keep the overload of the inverters below 10%. The input voltage and current values of this equipment are compatible with those of the respective PV subfield.
Table 8.
Main technical data of the inverter.
The main results of the simulation are depicted in Figure 12. As can be seen, the plant has an average annual performance ratio (PR) of 87.51% and a specific output of 1774 kWh/kWp/year. The PR is expressed as a percentage and defines the ratio resulting from the actual yield; that is, energy actually available for feeding into the grid, and the theoretical yield of the PV system. The total energy expected to be produced is about 128 GWh/year.

Figure 12.
Main simulation results for the land-based photovoltaic system.
3.4. Floating PV
FPV offers several benefits. It reduces soil occupation, better utilized for agricultural or urban expansion. The water-cooling effect of FPV systems increases PV efficiency and energy generation, particularly in hot areas, when compared to ground-mounted systems. Additional potential advantages of FPV include less module shadowing, evaporation from water bodies, and algae growth [79,80].
The efficiency of PV panels is strongly influenced by environmental factors such as air temperature and wind speed, which depend on the location of the system and cannot be controlled [81]. A further cause of a drop in module performance is the accumulation of dirt on their surface [82]. In this case study, the proposed installation site for the floating system is located near the coast of a desert area. Thus, it must be taken into account that, due to the sandstorms typical of desert regions, sand and dust will be deposited more on the glazed cover of the modules, resulting in a reduction in electrical efficiency up to 80% [81]. For this reason the installation of an automated cleaning system is recommended, reducing human intervention and maintenance costs. The system can operate in the afternoon or at night when the FPV plant is switched-off [81]. In the Middle East, the main cause of dirt is dust, which is relatively easy to clean, compared to dirt due to bird droppings and pollution [83]. It is worth noting that for a floating system the tilt angle of the panels is lower than for ground-mounted systems, and the dust will tend to settle more [84]. The most widely used automated cleaning systems in the last two decades can be categorized as follows:
- A waterless brush-based cleaning system (BCS) that acts on the surface of the modules by means of electromechanical devices controlled by an electronic controller. The system, which is extremely simple and lightweight, consists of a cleaning apparatus that can move on the panel surface through rails. The overall simplicity of this technology makes it possible to minimize human intervention while reducing the maintenance costs. The brush replacement frequency of the BCS is strongly influenced by environmental conditions. Furthermore, in the case of bonded dust, the cleaning of the panel must be performed manually to avoid damage to the surface due to friction between the brush and the surface itself [85]. The BCS can exploit different control systems, such as Supervisory Control and Data Acquisition (SCADA), Programmable Logic Controller (PLC), or Arduino [86,87];
- An electrodynamic cleaning system (ECS) that uses the force generated by electrodes installed on the panel, to which a single-phase or multi-phase voltage is applied to generate a travelling or standing wave. These waves generate an electric field whose vertical component can lift charged particles and transport them towards the edge of the panel [84,85]. The efficiency of the cleaning system depends on the width and distance of the electrodes, the voltages and frequencies used, and the inclination of the PV panel [88]. This technology allows to remove more than 90% of dirt in a short time [89];
- Robotic cleaning systems (RCS), which can operate in dry or wet conditions, are the best solution for large-scale installations. RCS are lightweight, efficient, and ideal for arid and desert regions due to the reduced water consumption in the water-based configuration [90]. Most robots exploit control units based on Arduino [91] or Raspberry Pi [92], thus avoiding connections to external devices. The system uses soft plastic wheels powered by DC motors to move, thus avoiding possible scratches or abrasions on the surface of the modules. Furthermore, some robots are equipped with infrared dust sensors that can detect the level of dirt on the panel [93]. The robots are powered by batteries that are charged by means of a docking station or can be connected to the panel’s output battery. The cleaning system generally uses brushes or roller brushes to remove dust, also in combination with a wiper or pad and water for better results [94]. Although their initial and maintenance cost is high, RCS are very efficient in cleaning and can also be used without water [95,96].
The installation of a near-shore FPV was evaluated in this study. The system analysis was conducted also for this configuration through PVsyst. A FPV has the following several advantages compared to a land-based system:
- The natural cooling effect produced by the water reduces the operating temperature of the modules [97,98];
- Less shading losses due to an open and flat installation site [99];
- Less soiling due to dust [84].
In accordance with the above, an FPV temperature 10 °C lower than the ground-mounted system was considered for the simulation [100]. An important dimensionless factor to consider in the analysis is albedo, which represents reflected solar radiation as direct or diffuse radiation. The albedo changes according to the objects surrounding the PV plant and can affect the power generation considerably. On water, the albedo varies between 5 and 7% but it’s strictly dependent on light wavelength, wind speed, water turbidity, waves, and sunlight [36]. Thus, for FPV simulation, the albedo has been set to 5% with respect to 20% used for land-based PV. Figure 13 depicts the main PVsyst outputs for assessing the performance of the system. It is worth nothing that the average annual PR is around 4% greater than for the ground-mounted system. This is mainly due to lower operating temperature increasing the efficiency of the FPV system [36]. The floating plant considered in the simulation has the following same characteristics of the land-based system described in Section 3.3: its nominal peak power is 72.47 MWp, distributed over 15 inverters, and with total water occupation of 0.8 km2.

Figure 13.
Main simulation results of the floating photovoltaic system.
3.5. Proposed Hybrid Farm
The analysed case study led to the proposal of a hybrid farm, integrating generation from both solar and wind energy sources, and is displayed in Figure 14. This was made possible by the orographic configuration of the site, the availability of favourable areas for the allocation of both technologies, and the careful layout of the turbines, chosen so as to avoid shading on the PV modules. The first immediate advantage is the increase in the total installed power from RES equal to 134 GW. The second advantage is that the average daily energy production is expected to be continuous, though fluctuating.
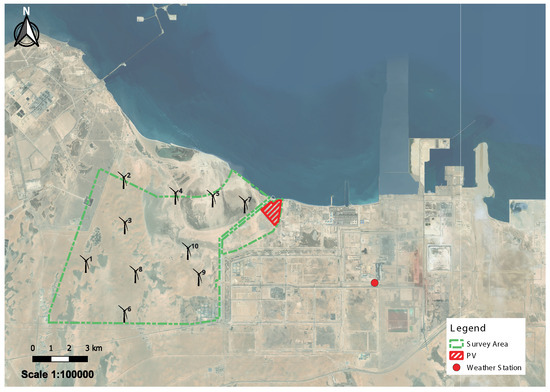
Figure 14.
Arrangement of 10 wind turbines (corresponding to the turbines listed in Table 6) and land-based PV modules for the proposed hybrid farm.
In fact, the analysis of the climatic data of the area of interest showed that the wind speed is usually higher in the afternoon and evening hours. This appears also in Figure 15a, showing the contributions of the net daily energy produced by the wind farm and the PV plant, as discussed in Section 3.2 and Section 3.3, respectively. Indeed, wind turbines have potentialities to support energy production from RES also in the night hours, when the natural unavailability of sunlight prevents PV plants from contributing to the load demand. Non-intermittent energy production is the reason that solar and wind generators are complementary technologies, and are preferred over plants based on the single-source paradigm for reliability reasons [101]. Figure 15b displays the monthly average energy contribution by the solar and wind plants to the expected production of the hybrid farm, varying in a wide range throughout the year, namely, % around the monthly average value, 40 GWh.
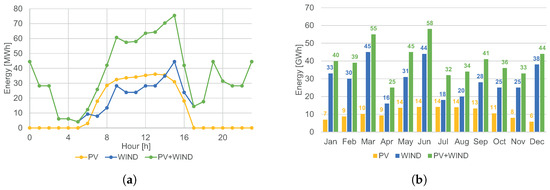
Figure 15.
Estimated producibility for the proposed hybrid farm. (a) Hourly energy production over a day (November). (b) Monthly estimated energy production.
3.6. Discussion
The sustainability assessment of a renewable energy system should be analysed in comparison with the reference base case of a fossil fuel plant by using mainly the following three macro indicators:
- Economic Sustainability Indicator: it considers economic sustainability by highlighting the performance of the proposed solution from the perspective of the installation, operation, maintenance, and management costs;
- Environmental Sustainability Indicator: it considers environmental sustainability by highlighting the performance of the proposed solution from the perspective of energy efficiency and emission of pollutants;
- Technical Sustainability Indicator: it considers technical sustainability by highlighting the performance of the proposed solution from the perspective of functionality, robustness, and reliability.
The economic sustainability indicator encompasses capital expenditures (CAPEX), operational expenditure (OPEX), maintenance cost, payback time, and LCOE. The environmental sustainability indicator encompasses efficiency, environmental friendliness, and land requirement. The technical sustainability indicator encompasses technical readiness, R3 concept (i.e., reliability, robustness, and resilience), maintainability, smart readiness, expendability, and construction and schedule easiness.
Frequently, project developers tend to prioritize the initial capital cost of the project. It is necessary to reconsider and concentrate on enhancing the inherent worth of the plant that is being given. Projects should prioritize the plant’s long-term value over 25–35 years of operation to guarantee the facility’s ability to achieve the financial objectives of the investment. The most promising prospect for success lies in the implementation of execution mechanisms that ensure and incentivize the consistent performance of contracts over the long term.
It is commonly noted that efforts to reduce CAPEX in renewable projects often result in additional challenges during the operating phase. Investing additional funds to obtain a more dependable answer for a particular need yields superior outcomes. An effective resolution to this issue is implementing a more comprehensive and precise definition within the technical requirements provided by the owner.
Experienced teams who have faced the repercussions of cost-cutting measures throughout the design and building stages of renewable energy facilities are typically well aware of this problem. Only professional teams who comprehend the tradeoff between CAPEX and OPEX must be responsible for designing, procuring, constructing, commissioning, and operating projects. Establishing industry-wide standard specifications and definitions will be beneficial. The definitions encompass interfaces, warranty, availability, and cost/scope.
OPEX carries the most significance within this paradigm while considering economic sustainability. It is crucial to prioritize a plant’s early conceptualization and comprehensive design to minimize the facility’s OPEX efficiently. The OPEX is a significant economic concern for renewable technology. Across most facilities, OPEX has shown to be more substantial than the initial financial projections.
The value of CAPEX is moderate due to the substantial savings achieved through cost reductions by equipment manufacturers, diversification of the supply chain, and enhanced knowledge and competitiveness in engineering, procurement, and construction.
The maintenance cost and payback time are less significant as they are indirectly accounted for in the OPEX, which is the primary component.
The LCOE exhibits an intermediate value that is comparable to the CAPEX. The critical factors affecting the LCOE for renewable power plants are the expenses associated with investment and financing, the capacity factors, the lifespan of the plants, the availability of local renewable resources, the discount rates, and the costs of operation and maintenance. The LCOE represents the minimum price at which electricity must be sold for a project to break even, considering the costs incurred and ensuring a return on the invested capital equivalent to the discount rate. An electricity price over this threshold would result in a higher return on investment, while a price below it would lead to a poorer return on investment or possibly a financial loss. The LCOE is a commonly employed primary metric for comparing different power generation systems, particularly those based on renewable energy. Renewable energy project developers can utilize advanced discounted cash flow (DCF) methods that consider factors such as taxation, subsidies, and other incentives to evaluate the viability of actual projects with greater precision.
When it comes to environmental sustainability, the amount of land needed is considered the most critical factor. That is due to a concern surrounding the extensive implementation of renewable power plants, which is the possibility for substantial land utilization. The technologies that utilize renewable energy sources have a power density significantly lower than fossil fuels by several orders of magnitude. As a result, the shift towards alternative energy sources is anticipated to heighten the worldwide struggle for land.
In addition, renewable systems are considered for their efficiency and environmental friendliness, while their land demand may be underrated. That is because renewable systems generally exhibit high efficiencies and are environmentally sustainable.
When it comes to technical sustainability, the most critical aspect of a renewable energy system is the ability to be maintained, followed by the level of reliability. Lastly, there is the level of technical readiness. In general, the design of a renewable plant layout must take into account the following factors:
- Constructability;
- Maintainability;
- Operability;
- Satisfying environmental requirements;
- Cost minimization.
Enhancing the maintainability of renewable power plants is a primary focus in new installations. The project developers prioritize energy production, with availability being a component of that objective. Furthermore, availability is closely linked to maintainability, the primary determining criterion.
The analyses conducted in the present study showed a high potential in terms of wind and solar radiation. The optimal solution is installing a hybrid system with an estimated annual energy production of 482 GWh. The impact of renewable energy is positive as it covers part of the demand while reducing overall carbon emissions.
Generally, a power system master plan should assume a combination of two renewable generation systems managed under tight control with conventional power production as follows:
- Concentrated RESs should be adopted and sized to offer concentrated and non-dispatchable power generation according to renewable resources. Concentrated RES identifies utility-scale renewable power plants usually installed near conventional power plants in large dedicated areas. The concentrated RES plants should be sized and operated to support the conventional generation;
- Distributed RESs should be adopted and sized to offer a distributed (local) power generation integrated into smart microgrids with flexible and managed load, which permits the optimization of the power and energy flows locally, reducing the peaks and keeping the power demand from the system as flat as possible. Distributed RESs should identify the renewable power plants usually installed over buildings, infrastructures, or nearby. These plants are sized and operated to optimize the local power flows and minimize the exchange of power with the transmission lines. Distributed RES power plants are considered to operate in integration with the end-users systems by a supervisory system with the digitalization of the controls to optimize the power flows locally.
Besides RESs, the combined cycle power production could be adopted and sized to cover the power demand and guarantee a reliable balance to the fluctuating feed-in from the forecast renewable and sustainable energy.
Figure 16 evaluates the possible alternatives considered in the power system master plan in the light of the previous three macro indicators, with suitable weights.
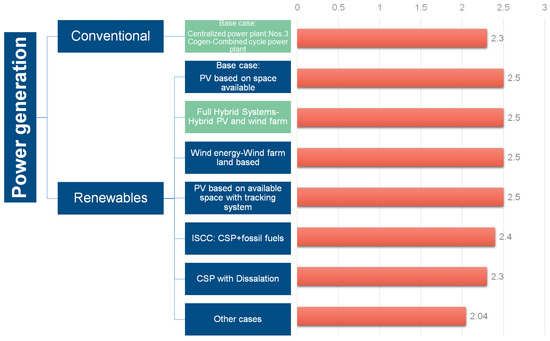
Figure 16.
Alternative cases and overall rates.
Finally, in a wholly decarbonized scenario, conventional fossil fuel production should be dismissed in favour of RES, and other systems, e.g., battery energy storage systems should be extensively applied to provide ancillary grid services such as frequency regulation, voltage support, and energy balance.
4. Conclusions
The paper evaluates the KSA region’s potential for renewable energy resources. After conducting a state-of-the-art review of the technologies available for designing renewable energy plants, the paper investigates the feasibility of several renewable energy installations in the East Coast of the KSA. The choice of RESs was made after a review of the survey area’s weather and climate, as well as environmental limitations that can limit the installation areas and technical limitations related to the accessibility of particular technologies on the market. The paper highlights how RESs can also play a crucial role in countries whose energy production still relies predominantly on fossil fuels today.
The prevailing trend in electrical energy generation is the anticipation of a shift towards affordable, environmentally friendly, sustainable, and renewable energy sources. According to the Energy Information Administration, renewable energy sources are projected to meet 50% of the world’s energy consumption by 2050.
In order to align with global trends and adopt low-emission development strategies, the Vision 2030 of the KSA aims to achieve ambitious targets of producing electricity from RES. KSA has made tremendous advancements in localizing the renewable energy market and aligning it with the highest international standards by implementing the National Renewable Energy Program. The country also possesses the capacity to produce sustainable energy from several sources, including CSP, wind, waste-to-energy, and geothermal. In 2011, the country had a total installed capacity of 14 MW, which grew to 413 MW by 2020. The initial CSP and wind power facilities were constructed in 2018 and 2019. The country’s installed capacity was significantly boosted in 2020 to align with its long-term ambition for 2030. By Vision 2030, the nation intends to construct additional CSP, wind, and PV facilities in various regions. In 2021, the KSA had a rise in its total installed renewable energy capacity to 541 MW. According to the Saudi Arabian Renewable Energy Project Development Office, the country has raised its renewable energy goal for 2030 to 58.7 GW, with 40 GW allocated for PV energy, 16 GW for wind energy, and 2.7 GW for CSP.
The key parameters obtained through the renewable generating systems proposed in the present study are summarized in Figure 17.

Figure 17.
Key parameters of the proposed RES (* tonnes per annum).
Author Contributions
Conceptualization and supervision, R.A. and G.V.; Methodology and software G.D.L.; Investigation G.D.L. and E.S.; writing G.D.L., E.S., G.V. and R.A. All authors have read and agreed to the published version of the manuscript.
Funding
This research received no external funding.
Conflicts of Interest
Author Giovanni Vescio is an employee of Technip Energies. The remaining authors declare that the research was conducted in the absence of any financial and non-financial interest that could be construed as a potential conflict of interest.
References
- Damoom, M.M.; Hashim, S.; Aljohani, M.S.; Saleh, M.A. Adding sustainable sources to the Saudi Arabian electricity sector. Electr. J. 2018, 31, 20–28. [Google Scholar] [CrossRef]
- Stracqualursi, E.; Rosato, A.; Di Lorenzo, G.; Panella, M.; Araneo, R. Systematic review of energy theft practices and autonomous detection through artificial intelligence methods. Renew. Sustain. Energy Rev. 2023, 184, 113544. [Google Scholar] [CrossRef]
- Lashin, A.; Al Arifi, N. Geothermal energy potential of southwestern of Saudi Arabia “exploration and possible power generation”: A case study at Al Khouba area—Jizan. Renew. Sustain. Energy Rev. 2014, 30, 771–789. [Google Scholar] [CrossRef]
- Nematollahi, O.; Hoghooghi, H.; Rasti, M.; Sedaghat, A. Energy demands and renewable energy resources in the Middle East. Renew. Sustain. Energy Rev. 2016, 54, 1172–1181. [Google Scholar] [CrossRef]
- Bayomi, N.; Fernandez, J.E. Towards sustainable energy trends in the Middle East: A study of four major emitters. Energies 2019, 12, 1615. [Google Scholar] [CrossRef]
- Nathaniel, S.; Anyanwu, O.; Shah, M. Renewable energy, urbanization, and ecological footprint in the Middle East and North Africa region. Environ. Sci. Pollut. Res. 2020, 27, 14601–14613. [Google Scholar] [CrossRef] [PubMed]
- Alnatheer, O. The potential contribution of renewable energy to electricity supply in Saudi Arabia. Energy Policy 2005, 33, 2298–2312. [Google Scholar] [CrossRef]
- Alaqeel, T.; Suryanarayanan, S. A comprehensive cost-benefit analysis of the penetration of Smart Grid technologies in the Saudi Arabian electricity infrastructure. Util. Policy 2019, 60, 100933. [Google Scholar] [CrossRef]
- Ramli, M.A.; Hiendro, A.; Sedraoui, K.; Twaha, S. Optimal sizing of grid-connected photovoltaic energy system in Saudi Arabia. Renew. Energy 2015, 75, 489–495. [Google Scholar] [CrossRef]
- Baseer, M.; Meyer, J.; Alam, M.M.; Rehman, S. Wind speed and power characteristics for Jubail industrial city, Saudi Arabia. Renew. Sustain. Energy Rev. 2015, 52, 1193–1204. [Google Scholar] [CrossRef]
- Barashid, K.; Munshi, A.; Alhindi, A. Wind Farm Power Prediction Considering Layout and Wake Effect: Case Study of Saudi Arabia. Energies 2023, 16, 938. [Google Scholar] [CrossRef]
- IRENA. Renewable Power Generation Costs in 2019; Technical Report; International Renewable Energy Agency: Masdar City, United Arab Emirates, 2020. [Google Scholar]
- Bahrampour, H.; Beheshti Marnani, A.K.; Askari, M.B.; Bahrampour, M.R. Evaluation of renewable energies production potential in the Middle East: Confronting the world’s energy crisis. Front. Energy 2020, 14, 42–56. [Google Scholar] [CrossRef]
- IRENA. Renewable Power Generation Costs in 2022. Available online: https://mc-cd8320d4-36a1-40ac-83cc-3389-cdn-endpoint.azureedge.net/-/media/Files/IRENA/Agency/Publication/2023/Aug/IRENA_Renewable_power_generation_costs_in_2022.pdf?rev=cccb713bf8294cc5bec3f870e1fa15c2 (accessed on 4 January 2024).
- Amran, Y.A.; Amran, Y.M.; Alyousef, R.; Alabduljabbar, H. Renewable and sustainable energy production in Saudi Arabia according to Saudi Vision 2030; Current status and future prospects. J. Clean. Prod. 2020, 247, 119602. [Google Scholar] [CrossRef]
- Alrammah, I.A. Analysis of nuclear accident scenarios and emergency planning zones for a proposed Advanced Power Reactor 1400 (APR1400). Nucl. Eng. Des. 2023, 407, 112275. [Google Scholar] [CrossRef]
- Johari, J.; Dewayatna, W.; Sarjono, S.; Rianto, S.; Yusnitha, E.; Adhi, A.; Suryaman, G.; Rahmadi, G.; Langenati, R.; Rachmawati, M. Preliminary assessment of sustainability of HTR fuel programme for newcomer countries. Nucl. Eng. Des. 2022, 398, 111971. [Google Scholar] [CrossRef]
- Oettingen, M.; Kim, J. Detection of Numerical Power Shift Anomalies in Burnup Modeling of a PWR Reactor. Sustainability 2023, 15, 3373. [Google Scholar] [CrossRef]
- Kępisty, G.; Oettingen, M.; Stanisz, P.; Cetnar, J. Statistical error propagation in HTR burnup model. Ann. Nucl. Energy 2017, 105, 355–360. [Google Scholar] [CrossRef]
- Baek, J. A panel cointegration analysis of CO2 emissions, nuclear energy and income in major nuclear generating countries. Appl. Energy 2015, 145, 133–138. [Google Scholar] [CrossRef]
- Kartal, M.T. The role of consumption of energy, fossil sources, nuclear energy, and renewable energy on environmental degradation in top-five carbon producing countries. Renew. Energy 2022, 184, 871–880. [Google Scholar] [CrossRef]
- Di Lorenzo, G.; Stracqualursi, E.; Araneo, R. The Journey Towards the Energy Transition: Perspectives from the International Conference on Environment and Electrical Engineering (EEEIC). Energies 2022, 15, 6652. [Google Scholar] [CrossRef]
- Di Lorenzo, G.; Stracqualursi, E.; Micheli, L.; Martirano, L.; Araneo, R. Challenges in Energy Communities: State of the Art and Future Perspectives. Energies 2022, 15, 7384. [Google Scholar] [CrossRef]
- stergaard, P.A.; Duic, N.; Noorollahi, Y.; Mikulcic, H.; Kalogirou, S. Sustainable development using renewable energy technology. Renew. Energy 2020, 146, 2430–2437. [Google Scholar] [CrossRef]
- Rosato, A.; Altilio, R.; Araneo, R.; Panella, M. Prediction in Photovoltaic Power by Neural Network. Energies 2017, 10, 1003. [Google Scholar] [CrossRef]
- Rosato, A.; Panella, M.; Araneo, R.; Andreotti, A. A neural network-based prediction system of distributed generation for the management of microgrids. IEEE Trans. Ind. Appl. 2019, 55, 7092–7102. [Google Scholar] [CrossRef]
- Rosato, A.; Panella, M.; Araneo, R. A distributed algorithm for the cooperative prediction of power production in PV plants. IEEE Trans. Energy Convers. 2019, 34, 497–508. [Google Scholar] [CrossRef]
- Succetti, F.; Rosato, A.; Araneo, R.; Panella, M. Deep Neural Networks for Multivariate Prediction of Photovoltaic Power Time Series. IEEE Access 2020, 8, 211490–211505. [Google Scholar] [CrossRef]
- Rosato, A.; Panella, M.; Andreotti, A.; Mohammed, O.A.; Araneo, R. Two-stage dynamic management in energy communities using a decision system based on elastic net regularization. Appl. Energy 2021, 291, 116852. [Google Scholar] [CrossRef]
- Østergaard, P.A.; Duic, N.; Noorollahi, Y.; Kalogirou, S. Renewable energy for sustainable development. Renew. Energy 2022, 199, 1145–1152. [Google Scholar] [CrossRef]
- Kopecek, R.; Libal, J. Bifacial photovoltaics 2021: Status, opportunities and challenges. Energies 2021, 14, 2076. [Google Scholar] [CrossRef]
- Di Lorenzo, G.; Araneo, R.; Mitolo, M.; Niccolai, A.; Grimaccia, F. Review of O&M Practices in PV Plants: Failures, Solutions, Remote Control, and Monitoring Tools. IEEE J. Photovolt. 2020, 10, 914–926. [Google Scholar]
- Di Lorenzo, G.; Stracqualursi, E.; Micheli, L.; Celozzi, S.; Araneo, R. Prognostic Methods for Photovoltaic Systems’ Underperformance and Degradation: Status, Perspectives, and Challenges. Energies 2022, 15, 6413. [Google Scholar] [CrossRef]
- Rodríguez-Gallegos, C.D.; Liu, H.; Gandhi, O.; Singh, J.P.; Krishnamurthy, V.; Kumar, A.; Stein, J.S.; Wang, S.; Li, L.; Reindl, T.; et al. Global techno-economic performance of bifacial and tracking photovoltaic systems. Joule 2020, 4, 1514–1541. [Google Scholar] [CrossRef]
- Wang, S.; Shen, Y.; Zhou, J.; Li, C.; Ma, L. Efficiency Enhancement of Tilted Bifacial Photovoltaic Modules with Horizontal Single-Axis Tracker—The Bifacial Companion Method. Energies 2022, 15, 1262. [Google Scholar] [CrossRef]
- Gorjian, S.; Sharon, H.; Ebadi, H.; Kant, K.; Scavo, F.B.; Tina, G.M. Recent technical advancements, economics and environmental impacts of floating photovoltaic solar energy conversion systems. J. Clean. Prod. 2021, 278, 124285. [Google Scholar] [CrossRef]
- Niccolai, A.; Grimaccia, F.; Di Lorenzo, G.; Araneo, R.; Ughi, F.; Polenghi, M. A Review of Floating PV Systems with a Techno-Economic Analysis. IEEE J. Photovolt. 2023, 14, 23–24. [Google Scholar] [CrossRef]
- Ghigo, A.; Faraggiana, E.; Sirigu, M.; Mattiazzo, G.; Bracco, G. Design and analysis of a floating photovoltaic system for offshore installation: The case study of Lampedusa. Energies 2022, 15, 8804. [Google Scholar] [CrossRef]
- Claus, R.; López, M. Key issues in the design of floating photovoltaic structures for the marine environment. Renew. Sustain. Energy Rev. 2022, 164, 112502. [Google Scholar] [CrossRef]
- Kumar, M.; Niyaz, H.M.; Gupta, R. Challenges and opportunities towards the development of floating photovoltaic systems. Sol. Energy Mater. Sol. Cells 2021, 233, 111408. [Google Scholar] [CrossRef]
- Nguyen, D. The Global Evolution of Floating Solar PV; Technical report, Working Paper; IFC: Washington, DC, USA, 2017. [Google Scholar]
- Emiliano, B. Floating PV in the Persian Gulf. Available online: https://www.pv-magazine.com/2020/02/17/floating-pv-in-the-persian-gulf/ (accessed on 4 January 2024).
- Cazzaniga, R. Chapter 4—Floating PV Structures. In Floating PV Plants; Rosa-Clot, M., Marco Tina, G., Eds.; Academic Press: Cambridge, MA, USA, 2020; pp. 33–45. [Google Scholar] [CrossRef]
- SERIS. Where Sun Meets Water—Floating Solar Market Report. Available online: http://hdl.handle.net/10986/31880 (accessed on 4 January 2024).
- Idier, D.; Bertin, X.; Thompson, P.; Pickering, M.D. Interactions between mean sea level, tide, surge, waves and flooding: Mechanisms and contributions to sea level variations at the coast. Surv. Geophys. 2019, 40, 1603–1630. [Google Scholar] [CrossRef]
- Acharya, M.; Devraj, S. Floating Solar Photovoltaic (FSPV): A Third Pillar to Solar PV Sector; The Energy and Resources Institute: New Delhi, India, 2019. [Google Scholar]
- Rashid, K.; Mohammadi, K.; Powell, K. Dynamic simulation and techno-economic analysis of a concentrated solar power (CSP) plant hybridized with both thermal energy storage and natural gas. J. Clean. Prod. 2020, 248, 119193. [Google Scholar] [CrossRef]
- Rohani, S.; Went, J.; Duvenhage, D.F.; Gerards, R.; Wittwer, C.; Fluri, T. Optimization of water management plans for CSP plants through simulation of water consumption and cost of treatment based on operational data. Sol. Energy 2021, 223, 278–292. [Google Scholar] [CrossRef]
- Awan, A.B.; Khan, M.; Zubair, M.; Bellos, E. Commercial parabolic trough CSP plants: Research trends and technological advancements. Sol. Energy 2020, 211, 1422–1458. [Google Scholar] [CrossRef]
- Alami, A.H.; Olabi, A.G.; Mdallal, A.; Rezk, A.; Radwan, A.; Rahman, S.M.A.; Shah, S.K.; Abdelkareem, M.A. Concentrating solar power (CSP) technologies: Status and analysis. Int. J. Thermofluids 2023, 18, 100340. [Google Scholar] [CrossRef]
- Arnaoutakis, G.E.; Katsaprakakis, D.A. Concentrating Solar Power Advances in Geometric Optics, Materials and System Integration. Energies 2021, 14, 6229. [Google Scholar] [CrossRef]
- Gielen, D. Renewable Energy Technologies: Cost Analysis Series; International Renewable Energy Agency: Masdar City, United Arab Emirates, 2012; Volume 1. [Google Scholar]
- Dhaou, M.H.; Mellouli, S.; Alresheedi, F.; El-Ghoul, Y. Numerical assessment of an innovative design of an evacuated tube solar collector incorporated with PCM embedded metal foam/plate fins. Sustainability 2021, 13, 10632. [Google Scholar] [CrossRef]
- Saini, P.; Singh, S.; Kajal, P.; Dhar, A.; Khot, N.; Mohamed, M.; Powar, S. A review of the techno-economic potential and environmental impact analysis through life cycle assessment of parabolic trough collector towards the contribution of sustainable energy. Heliyon 2023, 9, e17626. [Google Scholar] [CrossRef] [PubMed]
- Wei, X.; Lu, Z.; Yu, W.; Zhang, H.; Wang, Z. Tracking and ray tracing equations for the target-aligned heliostat for solar tower power plants. Renew. Energy 2011, 36, 2687–2693. [Google Scholar] [CrossRef]
- Alam, M.I.; Nuhash, M.M.; Zihad, A.; Nakib, T.H.; Ehsan, M.M. Conventional and Emerging CSP Technologies and Design Modifications: Research Status and Recent Advancements. Int. J. Thermofluids 2023, 20, 100406. [Google Scholar] [CrossRef]
- Kearney, D. Utility-Scale Power Tower Solar Systems: Performance Acceptance Test Guidelines; Technical Report; National Renewable Energy Lab. (NREL): Golden, CO, USA, 2013.
- Singer, C.; Giuliano, S.; Buck, R. Assessment of improved molten salt solar tower plants. Energy Procedia 2014, 49, 1553–1562. [Google Scholar] [CrossRef]
- Zhang, H.; Baeyens, J.; Degrève, J.; Cacères, G. Concentrated solar power plants: Review and design methodology. Renew. Sustain. Energy Rev. 2013, 22, 466–481. [Google Scholar] [CrossRef]
- Ortega, J.I.; Burgaleta, J.I.; Téllez, F.M. Central receiver system solar power plant using molten salt as heat transfer fluid. J. Sol. Energy Eng. 2008, 130, 024501. [Google Scholar] [CrossRef]
- González-Mora, E.; Durán García, M.D. Methodology for an opto-geometric optimization of a linear Fresnel reflector for direct steam generation. Energies 2020, 13, 355. [Google Scholar] [CrossRef]
- IRENA. Renewable Power Generation Costs in 2014; Technical report; International Renewable Energy Agency: Masdar City, United Arab Emirates, 2015. [Google Scholar]
- Rungasamy, A.; Craig, K.; Meyer, J.P. A review of linear Fresnel primary optical design methodologies. Sol. Energy 2021, 224, 833–854. [Google Scholar] [CrossRef]
- Hachicha, A.A. Numerical Modelling of a Parabolic trough Solar Collector. Ph.D. Thesis, Universitat Politècnica de Catalunya, Barcelona, Spain, 2013. [Google Scholar]
- Mokhtar, M.B. The Beam-Down Solar Thermal Concentrator: Experimental Characterization and Modeling. Master’s Thesis, Masdar Institute of Science and Technology, Masdar City, United Arab Emirates, 2011. [Google Scholar]
- Concentrating Solar Power Basics. Available online: https://www.nrel.gov/research/re-csp.html (accessed on 4 January 2024).
- Guarino, S.; Buscemi, A.; Messineo, A.; Lo Brano, V. Energy and Environmental Assessment of a Hybrid Dish-Stirling Concentrating Solar Power Plant. Sustainability 2022, 14, 6098. [Google Scholar] [CrossRef]
- IRENA. Renewable Energy and Jobs: Annual Review 2023. Available online: https://mc-cd8320d4-36a1-40ac-83cc-3389-cdn-endpoint.azureedge.net/-/media/Files/IRENA/Agency/Publication/2023/Sep/IRENA_Renewable_energy_and_jobs_2023.pdf?rev=4c35bf5a1222429e8f0bf932a641f818 (accessed on 4 January 2024).
- European Commision. EU Wind Energy. Available online: https://energy.ec.europa.eu/topics/renewable-energy/eu-wind-energy_en (accessed on 4 January 2024).
- Musial, W.; Green, R.; DeMeo, E.; Cooperman, A.; Housner, S.; Marquis, M.; MacDonald, S.; McDowell, B.; Hein, C.; Rolph, R.; et al. Great Lakes Wind Energy Challenges and Opportunities Assessment; National Renewable Energy Lab. (NREL): Golden, CO, USA, 2023.
- Liponi, A.; Tempesti, C.; Baccioli, A.; Ferrari, L. Small-scale desalination plant driven by solar energy for isolated communities. Energies 2020, 13, 3864. [Google Scholar] [CrossRef]
- Mohammadi, K.; Saghafifar, M.; Ellingwood, K.; Powell, K. Hybrid concentrated solar power (CSP)-desalination systems: A review. Desalination 2019, 468, 114083. [Google Scholar] [CrossRef]
- Gohil, P.P.; Desai, H.; Kumar, A.; Kumar, R. Current Status and Advancement in Thermal and Membrane-Based Hybrid Seawater Desalination Technologies. Water 2023, 15, 2274. [Google Scholar] [CrossRef]
- Power, C.S. Clean Power on Demand 24/7; World Bank: Washington, DC, USA, 2021. [Google Scholar]
- Saudi & Middle East Green Initiative. Available online: https://www.greeninitiatives.gov.sa/about-sgi/sgi-targets/reduce-carbon-emissions/ (accessed on 4 January 2024).
- Almulhim, A.I. Understanding public awareness and attitudes toward renewable energy resources in Saudi Arabia. Renew. Energy 2022, 192, 572–582. [Google Scholar] [CrossRef]
- Hepbasli, A.; Alsuhaibani, Z. A key review on present status and future directions of solar energy studies and applications in Saudi Arabia. Renew. Sustain. Energy Rev. 2011, 15, 5021–5050. [Google Scholar] [CrossRef]
- Lazaroiu, G.C.; Longo, M.; Roscia, M.; Pagano, M. Comparative analysis of fixed and sun tracking low power PV systems considering energy consumption. Energy Convers. Manag. 2015, 92, 143–148. [Google Scholar] [CrossRef]
- Bontempo Scavo, F.; Tina, G.M.; Gagliano, A.; Nižetić, S. An assessment study of evaporation rate models on a water basin with floating photovoltaic plants. Int. J. Energy Res. 2021, 45, 167–188. [Google Scholar] [CrossRef]
- Majumder, A.; Innamorati, R.; Frattolillo, A.; Kumar, A.; Gatto, G. Performance analysis of a floating photovoltaic system and estimation of the evaporation losses reduction. Energies 2021, 14, 8336. [Google Scholar] [CrossRef]
- Antonelli, M.G.; Zobel, P.B.; De Marcellis, A.; Palange, E. Autonomous robot for cleaning photovoltaic panels in desert zones. Mechatronics 2020, 68, 102372. [Google Scholar] [CrossRef]
- Alghamdi, A.S.; Bahaj, A.S.; Blunden, L.S.; Wu, Y. Dust removal from solar PV modules by automated cleaning systems. Energies 2019, 12, 2923. [Google Scholar] [CrossRef]
- Shah, A.H.; Hassan, A.; Laghari, M.S.; Alraeesi, A. The influence of cleaning frequency of photovoltaic modules on power losses in the desert climate. Sustainability 2020, 12, 9750. [Google Scholar] [CrossRef]
- Zahedi, R.; Ranjbaran, P.; Gharehpetian, G.B.; Mohammadi, F.; Ahmadiahangar, R. Cleaning of floating photovoltaic systems: A critical review on approaches from technical and economic perspectives. Energies 2021, 14, 2018. [Google Scholar] [CrossRef]
- Derakhshandeh, J.F.; AlLuqman, R.; Mohammad, S.; AlHussain, H.; AlHendi, G.; AlEid, D.; Ahmad, Z. A comprehensive review of automatic cleaning systems of solar panels. Sustain. Energy Technol. Assess. 2021, 47, 101518. [Google Scholar] [CrossRef]
- Sivan, A.; Sivan, A.; Lakshmi Priya, G.; Mathew, S. Automatic Self Cleaning Solar Panel. Int. Res. J. Eng. Technol. (IRJET) 2017, 4, 2035–2037. [Google Scholar]
- Sreega, R.; Nithyananthan, K.; Nandhini, B. Design and development of automated solar panel cleaner and cooler. Int. J. Electr. Electron. Eng. 2017, 9, 186–197. [Google Scholar]
- Wu, G.; Inderbitzin, A.; Bening, C. Total cost of ownership of electric vehicles compared to conventional vehicles: A probabilistic analysis and projection across market segments. Energy Policy 2015, 80, 196–214. [Google Scholar] [CrossRef]
- Mazumder, M.; Horenstein, M.N.; Stark, J.W.; Girouard, P.; Sumner, R.; Henderson, B.; Sadder, O.; Hidetaka, I.; Biris, A.S.; Sharma, R. Characterization of electrodynamic screen performance for dust removal from solar panels and solar hydrogen generators. IEEE Trans. Ind. Appl. 2013, 49, 1793–1800. [Google Scholar] [CrossRef]
- Anderson, M.; Grandy, A.; Hastie, J.; Sweezey, A.; Ranky, R.; Mavroidis, C.; Markopoulos, Y.P. Robotic device for cleaning photovoltaic panel arrays. In Mobile Robotics: Solutions and Challenges; World Scientific: Singapore, 2010; pp. 367–377. [Google Scholar]
- Jawale, J.; Karra, V.; Patil, B.; Singh, P.; Singh, S.; Atre, S. Solar panel cleaning bot for enhancement of efficiency—An innovative approach. In Proceedings of the 2016 3rd International Conference on Devices, Circuits and Systems (ICDCS), Coimbatore, India, 3–5 March 2016; pp. 103–108. [Google Scholar]
- Divya, R.; Sheeba, K.; Gayadhiri Dhevi, J.; Sandhiya, S.; Vennila, S. Automatic cleaning of solar panel with maximum power tracking by using Arduino. Int. J. Adv. Res. Ideas Innov. Technol. 2018, 2, 5. [Google Scholar]
- Hadipour, M.; Derakhshandeh, J.F.; Rezaei, R. Fully automatic cleaning system of smart street lights: A new design via Alf and vegard’s RISC processor. SN Appl. Sci. 2020, 2, 1212. [Google Scholar] [CrossRef]
- Lu, X.; Zhang, Q.; Hu, J. A linear piezoelectric actuator based solar panel cleaning system. Energy 2013, 60, 401–406. [Google Scholar] [CrossRef]
- Parrott, B.; Zanini, P.C.; Shehri, A.; Kotsovos, K.; Gereige, I. Automated, robotic dry-cleaning of solar panels in Thuwal, Saudi Arabia using a silicone rubber brush. Sol. Energy 2018, 171, 526–533. [Google Scholar] [CrossRef]
- Jaradat, M.A.; Tauseef, M.; Altaf, Y.; Saab, R.; Adel, H.; Yousuf, N.; Zurigat, Y.H. A fully portable robot system for cleaning solar panels. In Proceedings of the 2015 10th International Symposium on Mechatronics and its Applications (ISMA), Sharjah, United Arab Emirates, 8–10 December 2015; pp. 1–6. [Google Scholar]
- Sukarso, A.P.; Kim, K.N. Cooling effect on the floating solar PV: Performance and economic analysis on the case of west Java province in Indonesia. Energies 2020, 13, 2126. [Google Scholar] [CrossRef]
- Liu, H.; Krishna, V.; Lun Leung, J.; Reindl, T.; Zhao, L. Field experience and performance analysis of floating PV technologies in the tropics. Prog. Photovolt. Res. Appl. 2018, 26, 957–967. [Google Scholar] [CrossRef]
- Sahu, A.; Yadav, N.; Sudhakar, K. Floating photovoltaic power plant: A review. Renew. Sustain. Energy Rev. 2016, 66, 815–824. [Google Scholar] [CrossRef]
- Micheli, L. The temperature of floating photovoltaics: Case studies, models and recent findings. Sol. Energy 2022, 242, 234–245. [Google Scholar] [CrossRef]
- Roy, P.; He, J. Grid-connected hybrid wind-solar farm hourly dispatching with battery and supercapacitor energy storage. In Proceedings of the IECON 2020 the 46th Annual Conference of the IEEE Industrial Electronics Society, Singapore, 18–21 October 2020; pp. 1831–1836. [Google Scholar]
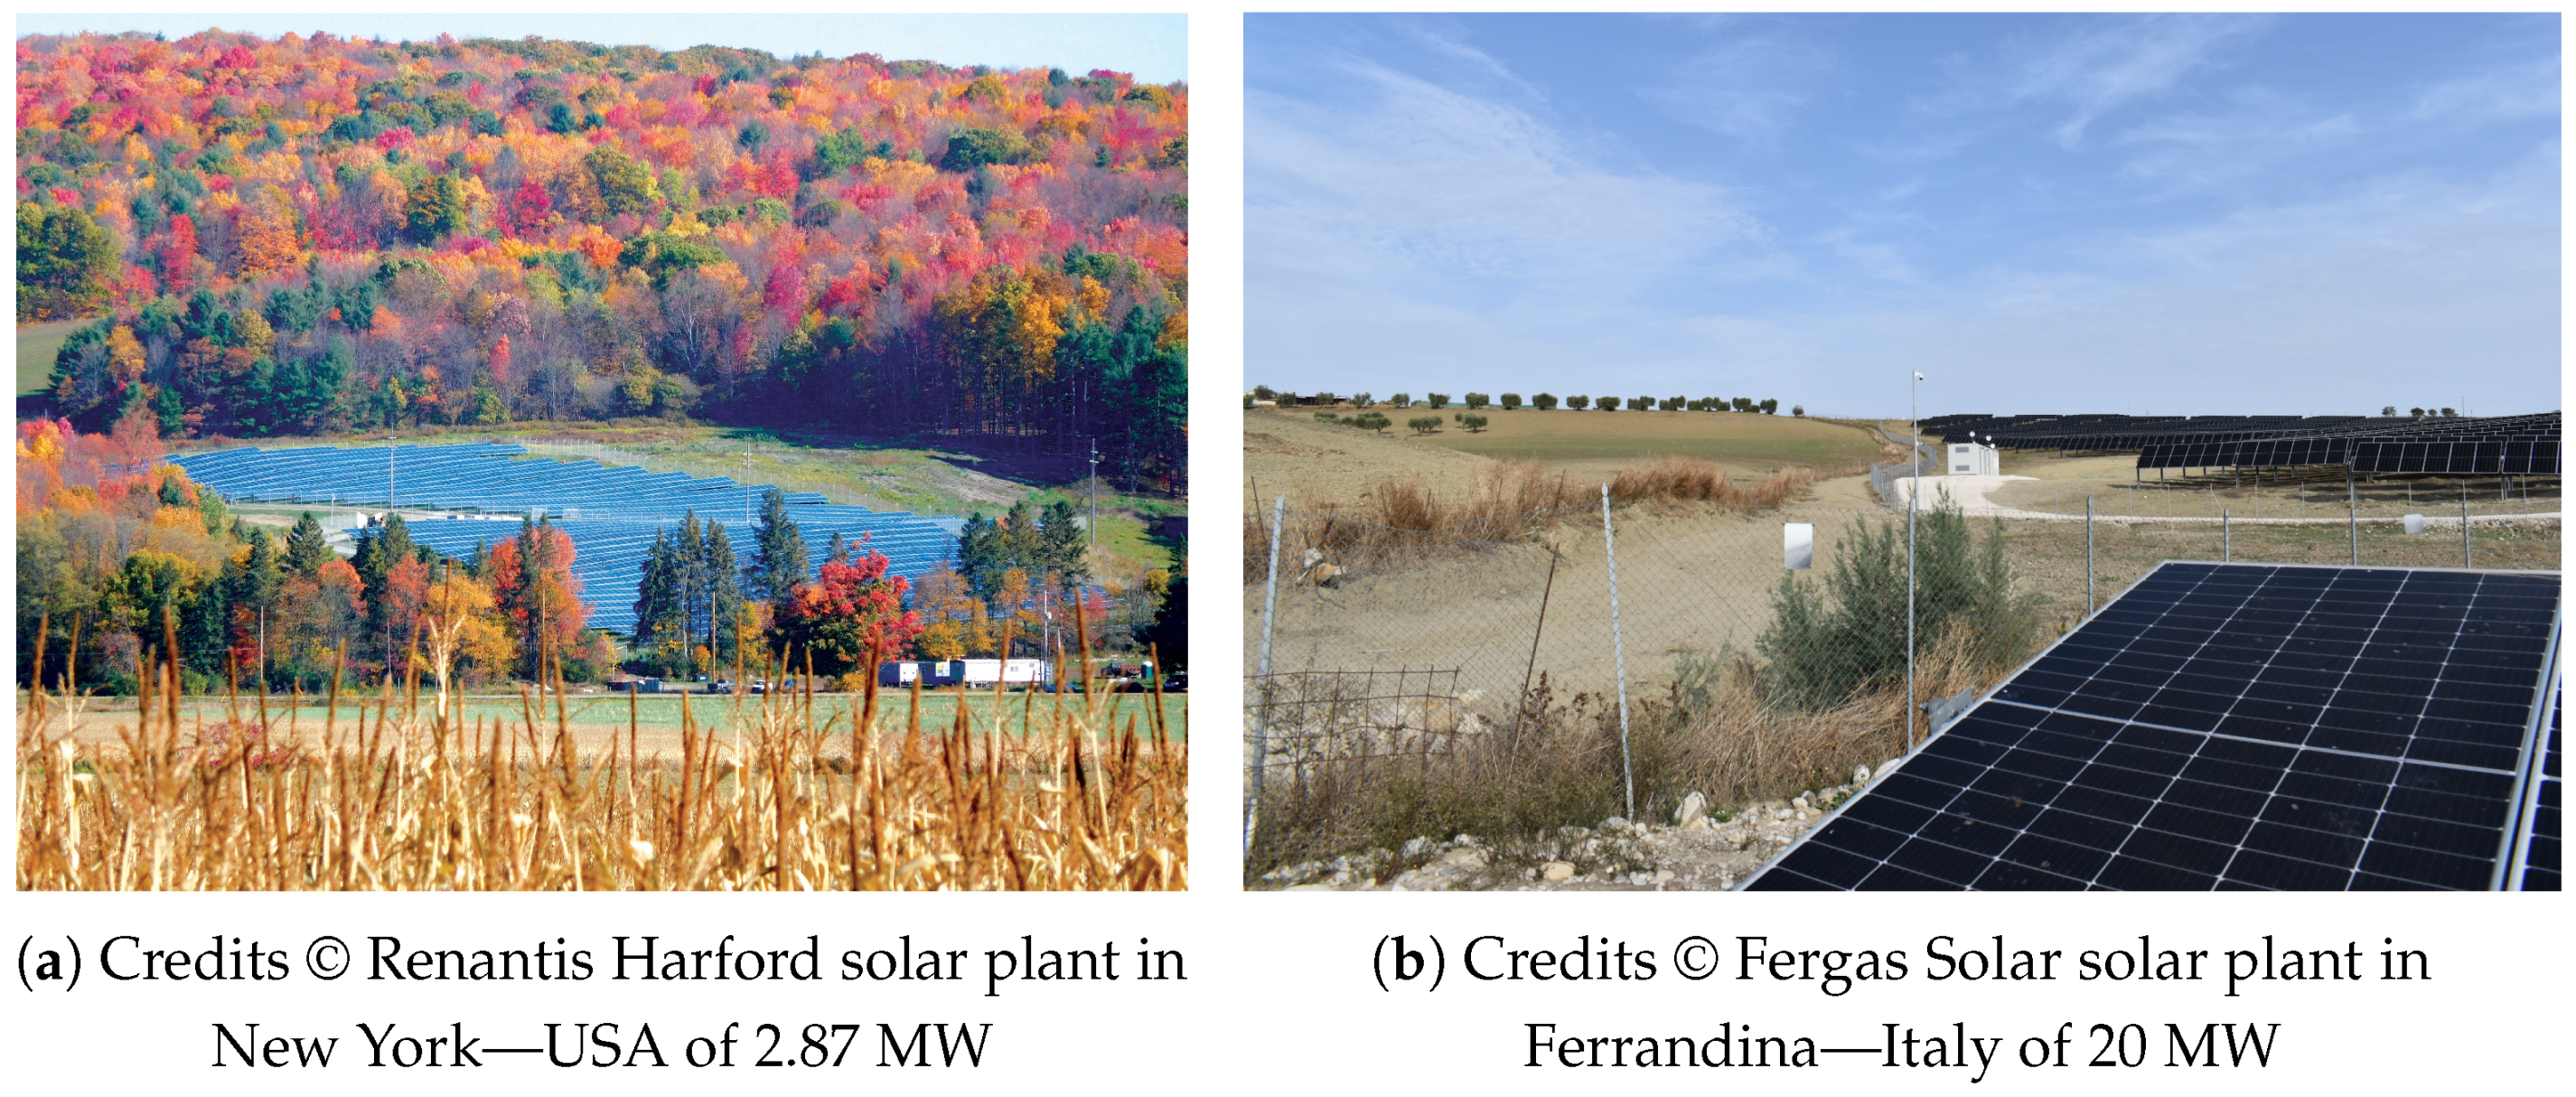


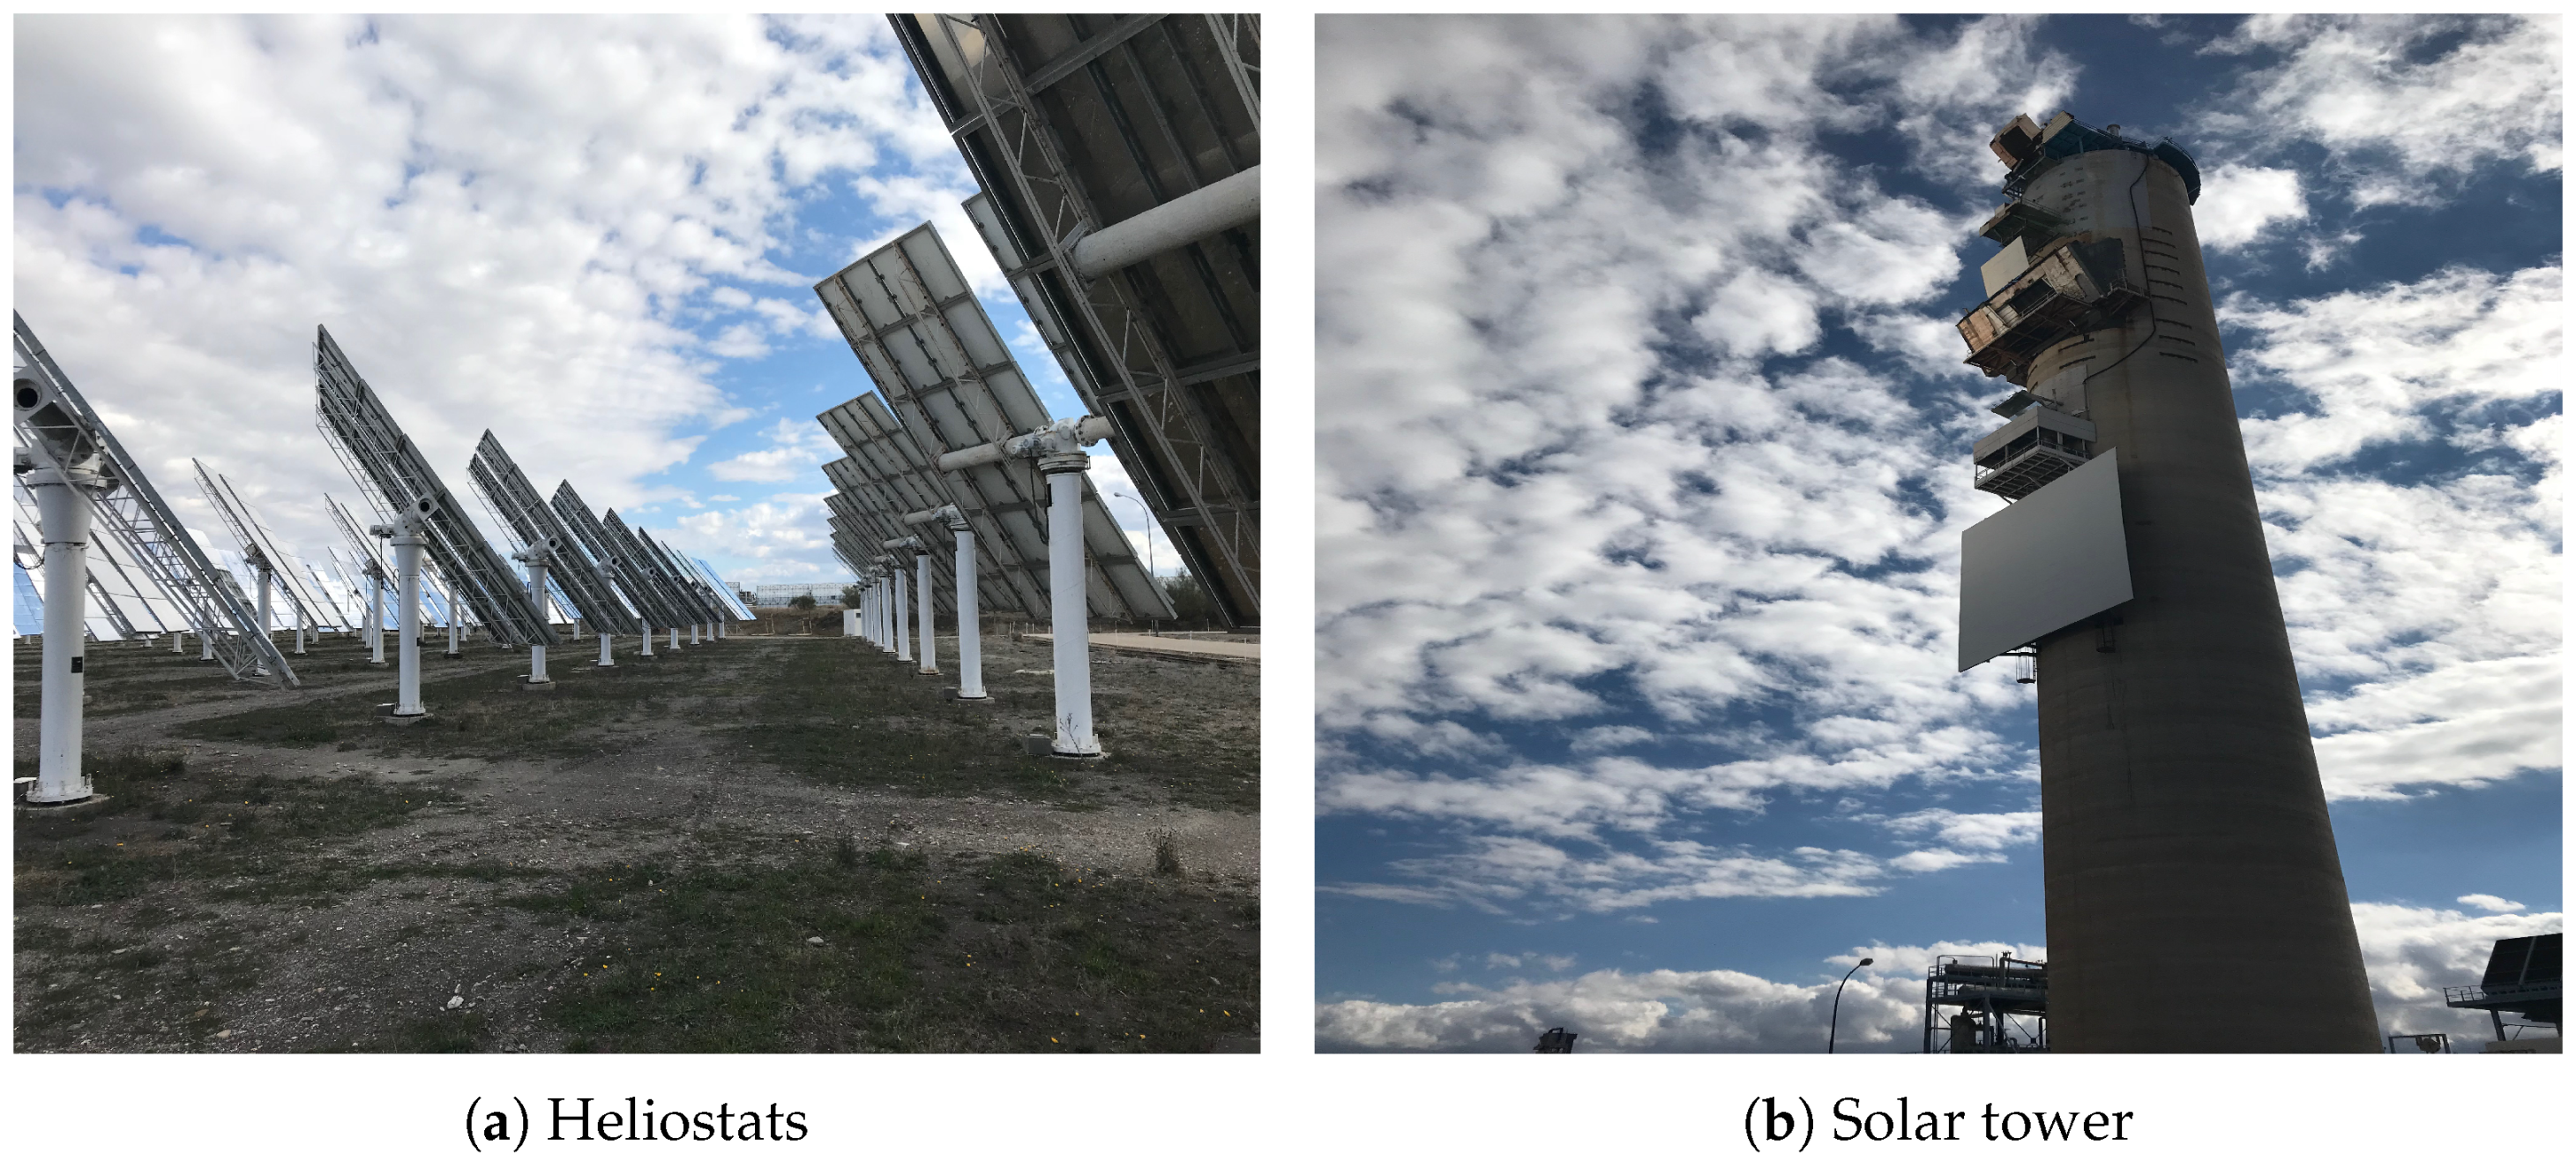
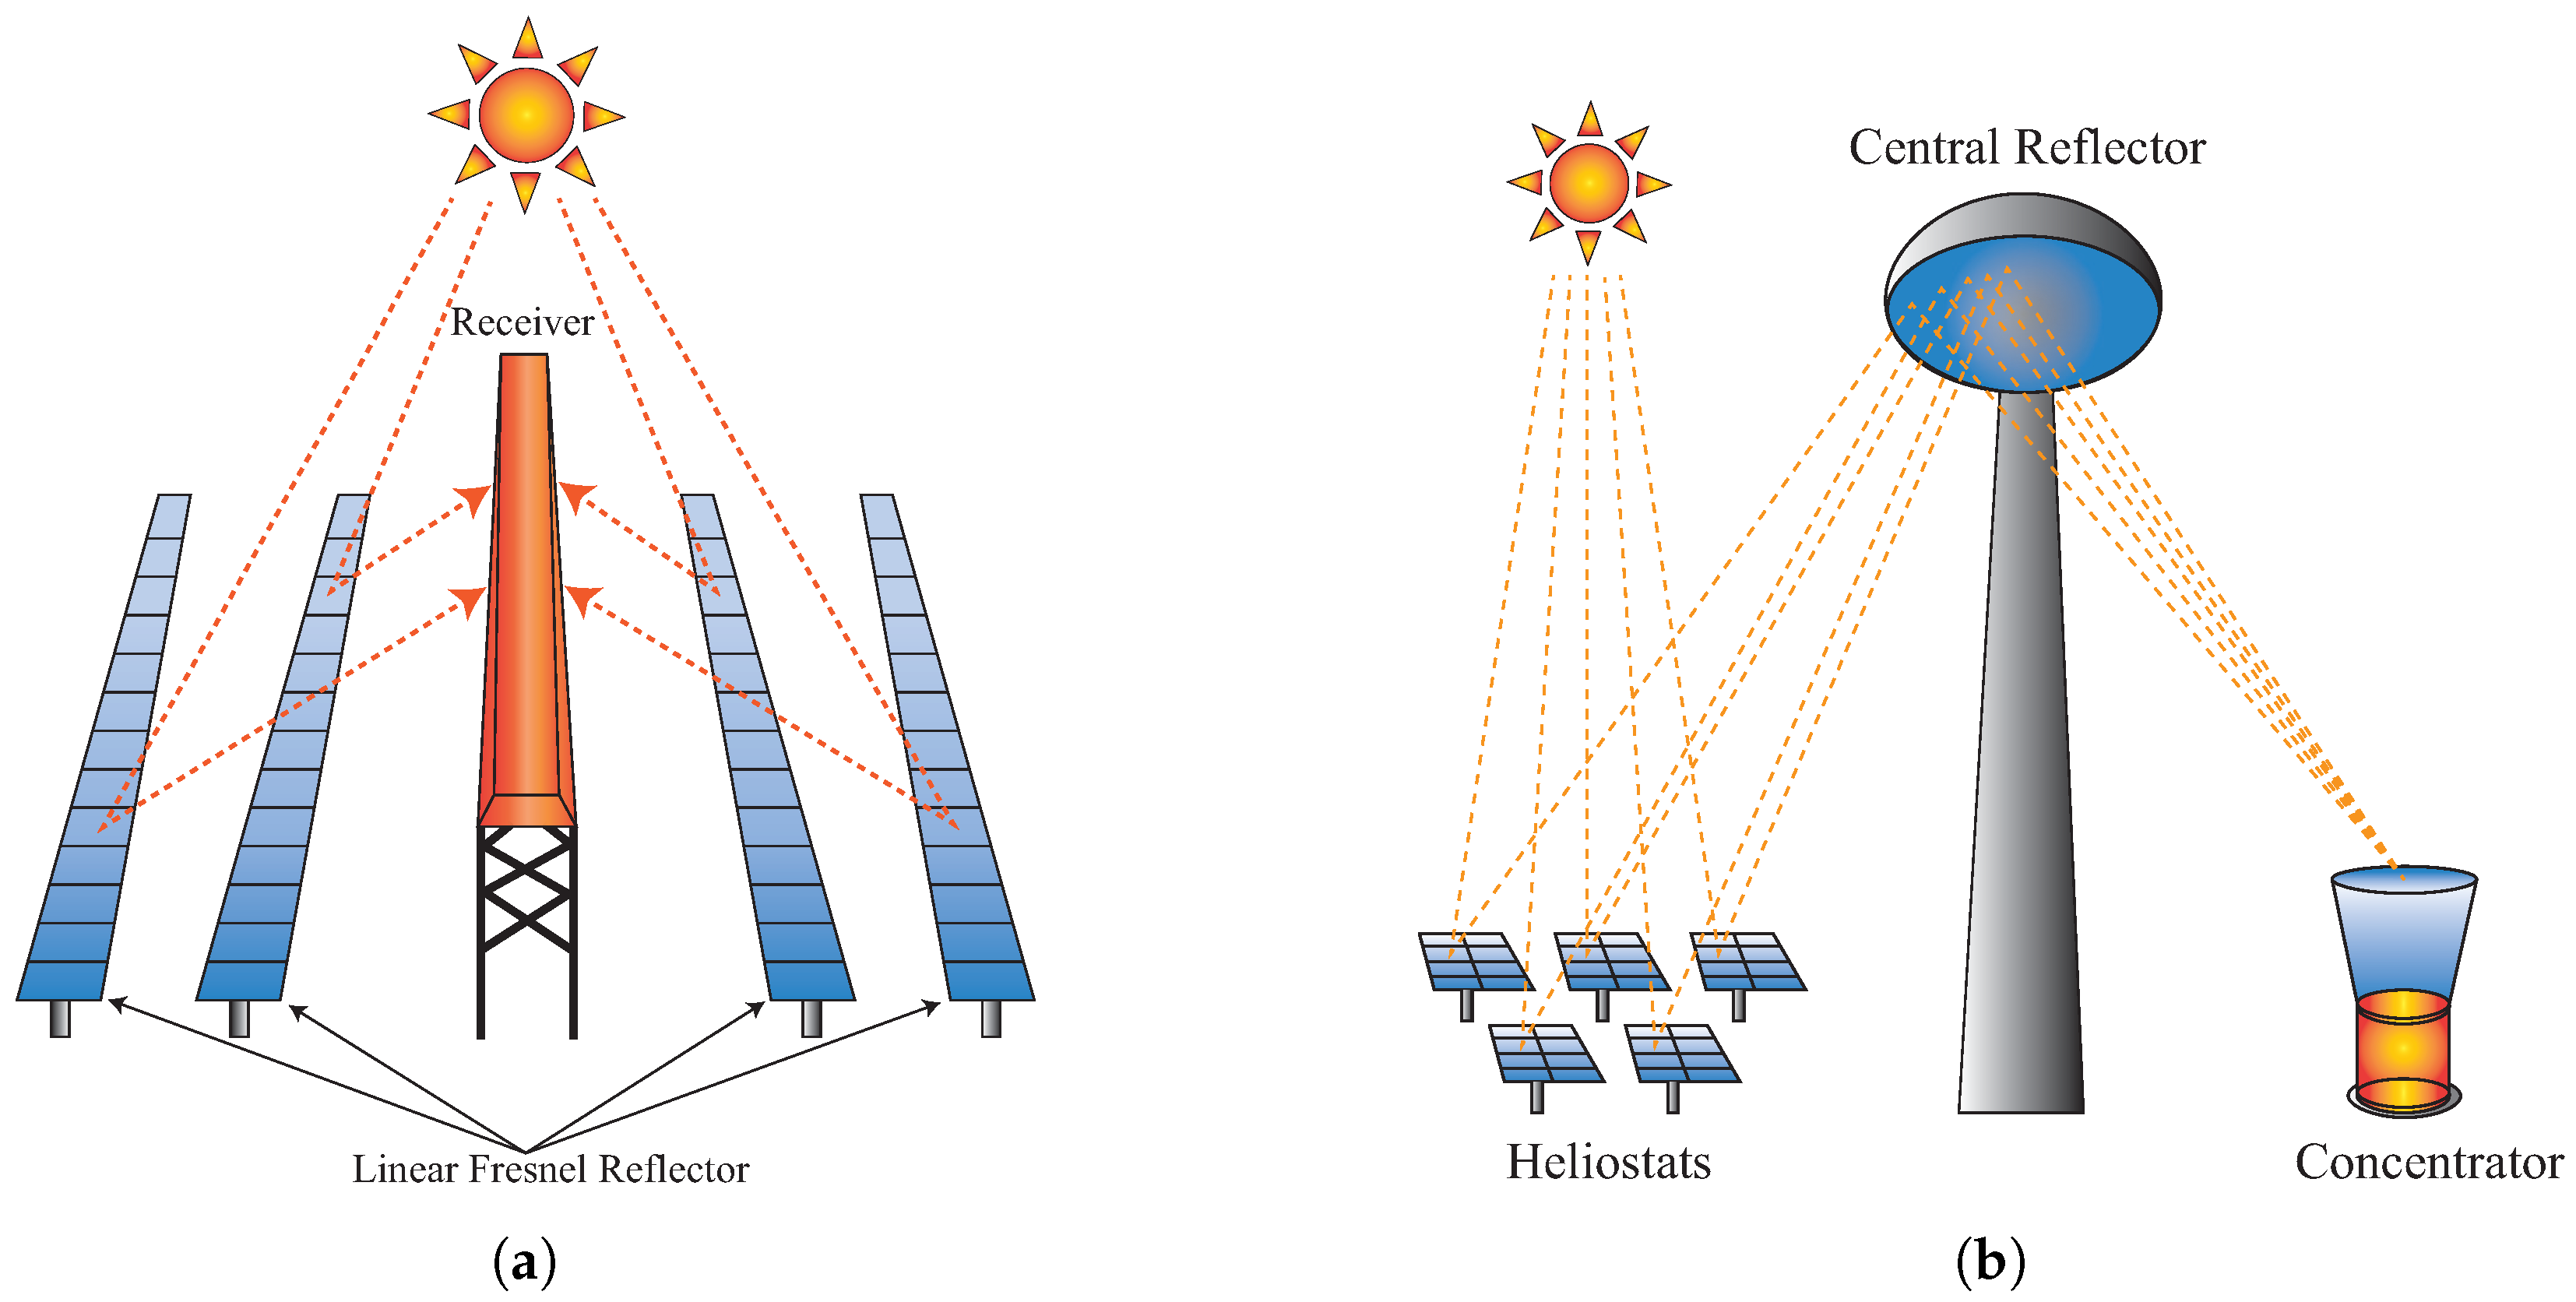
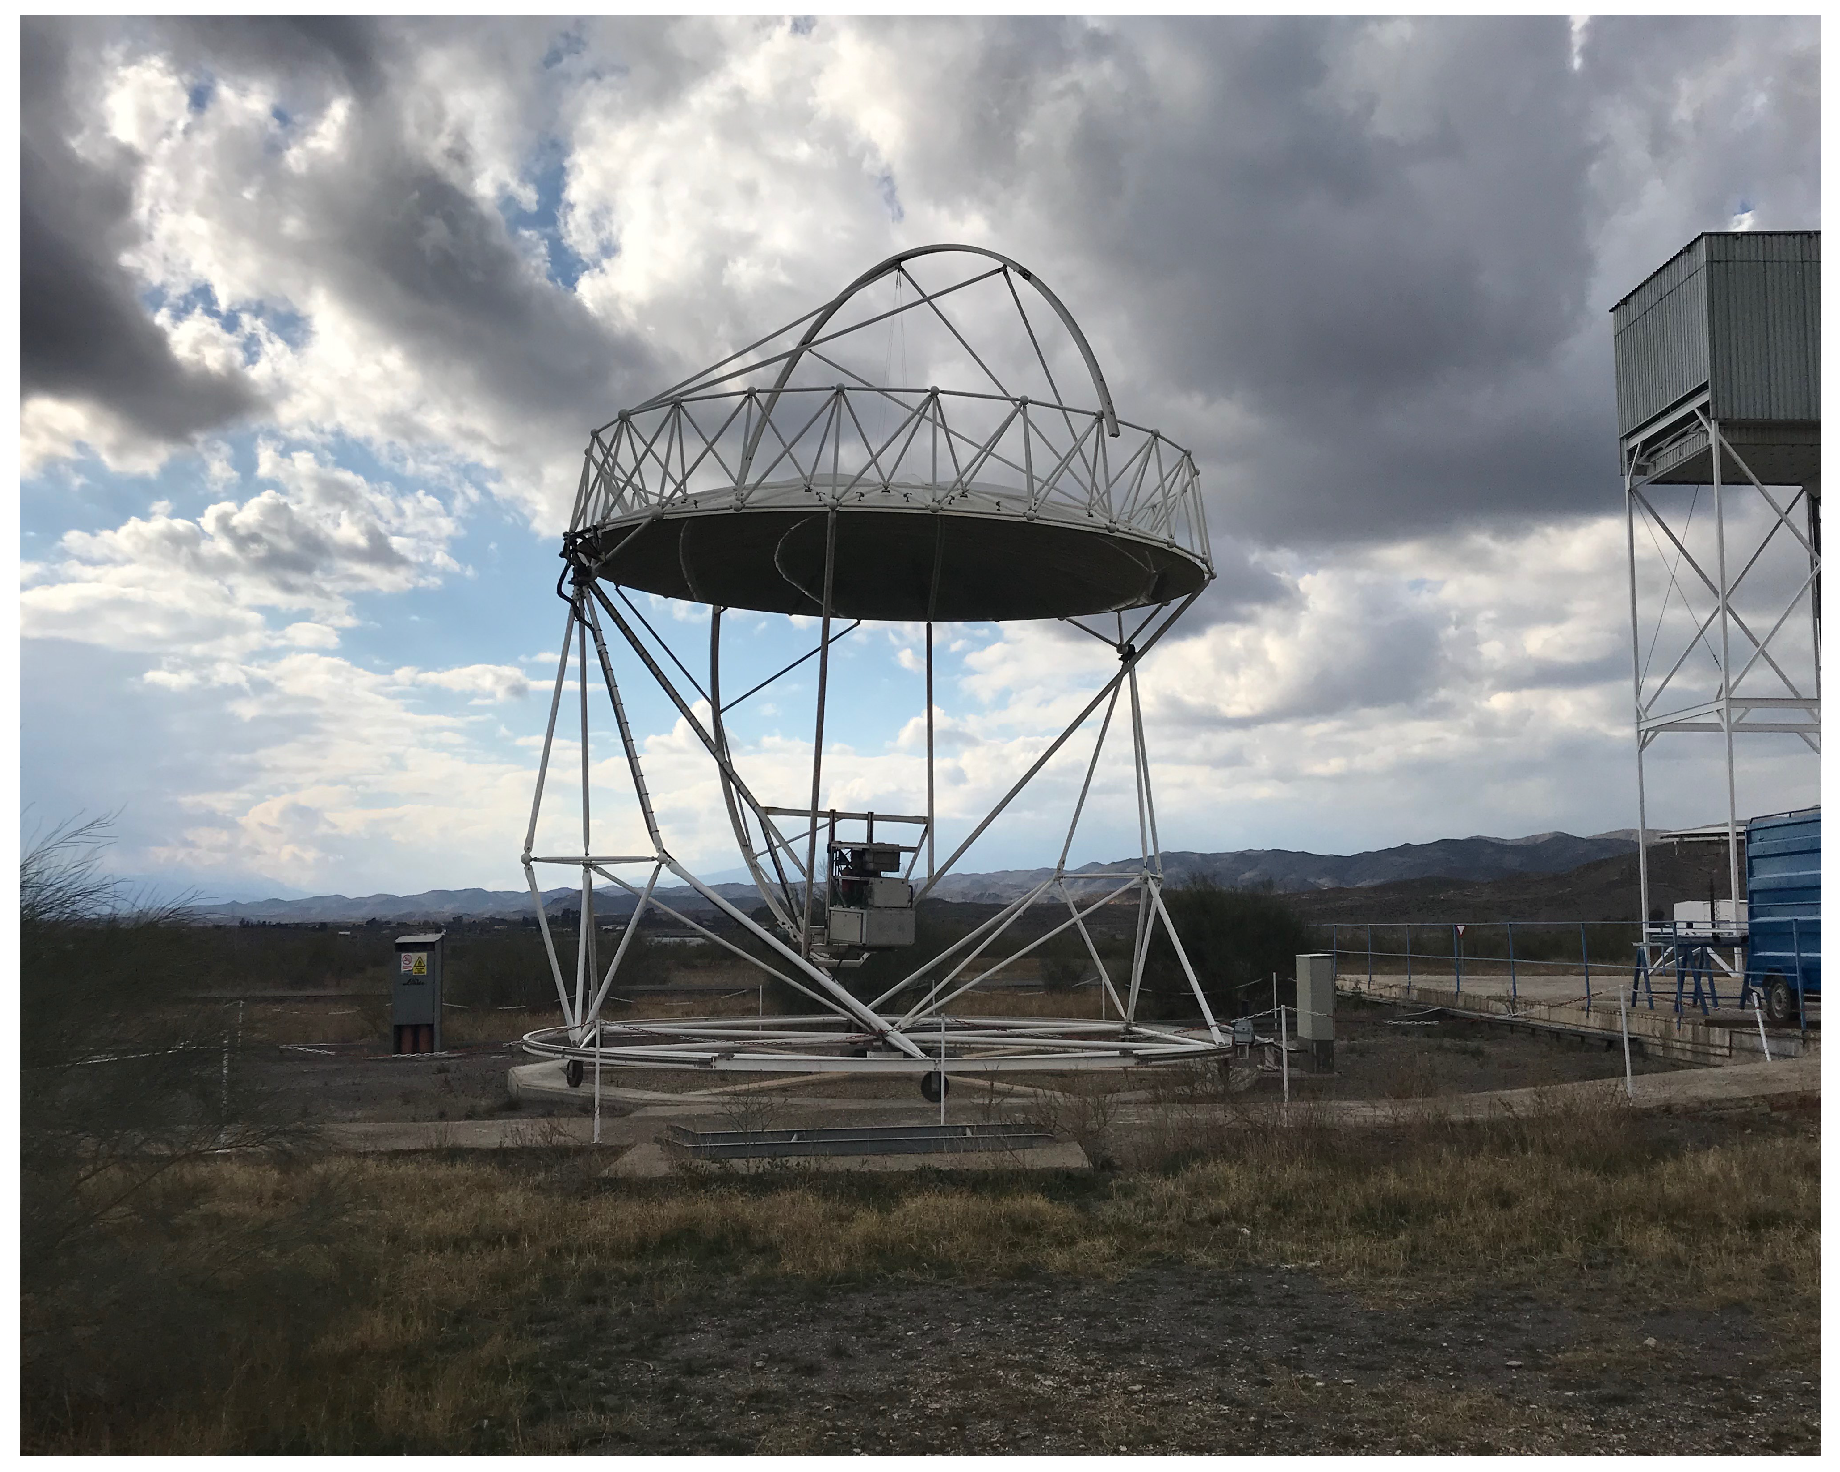


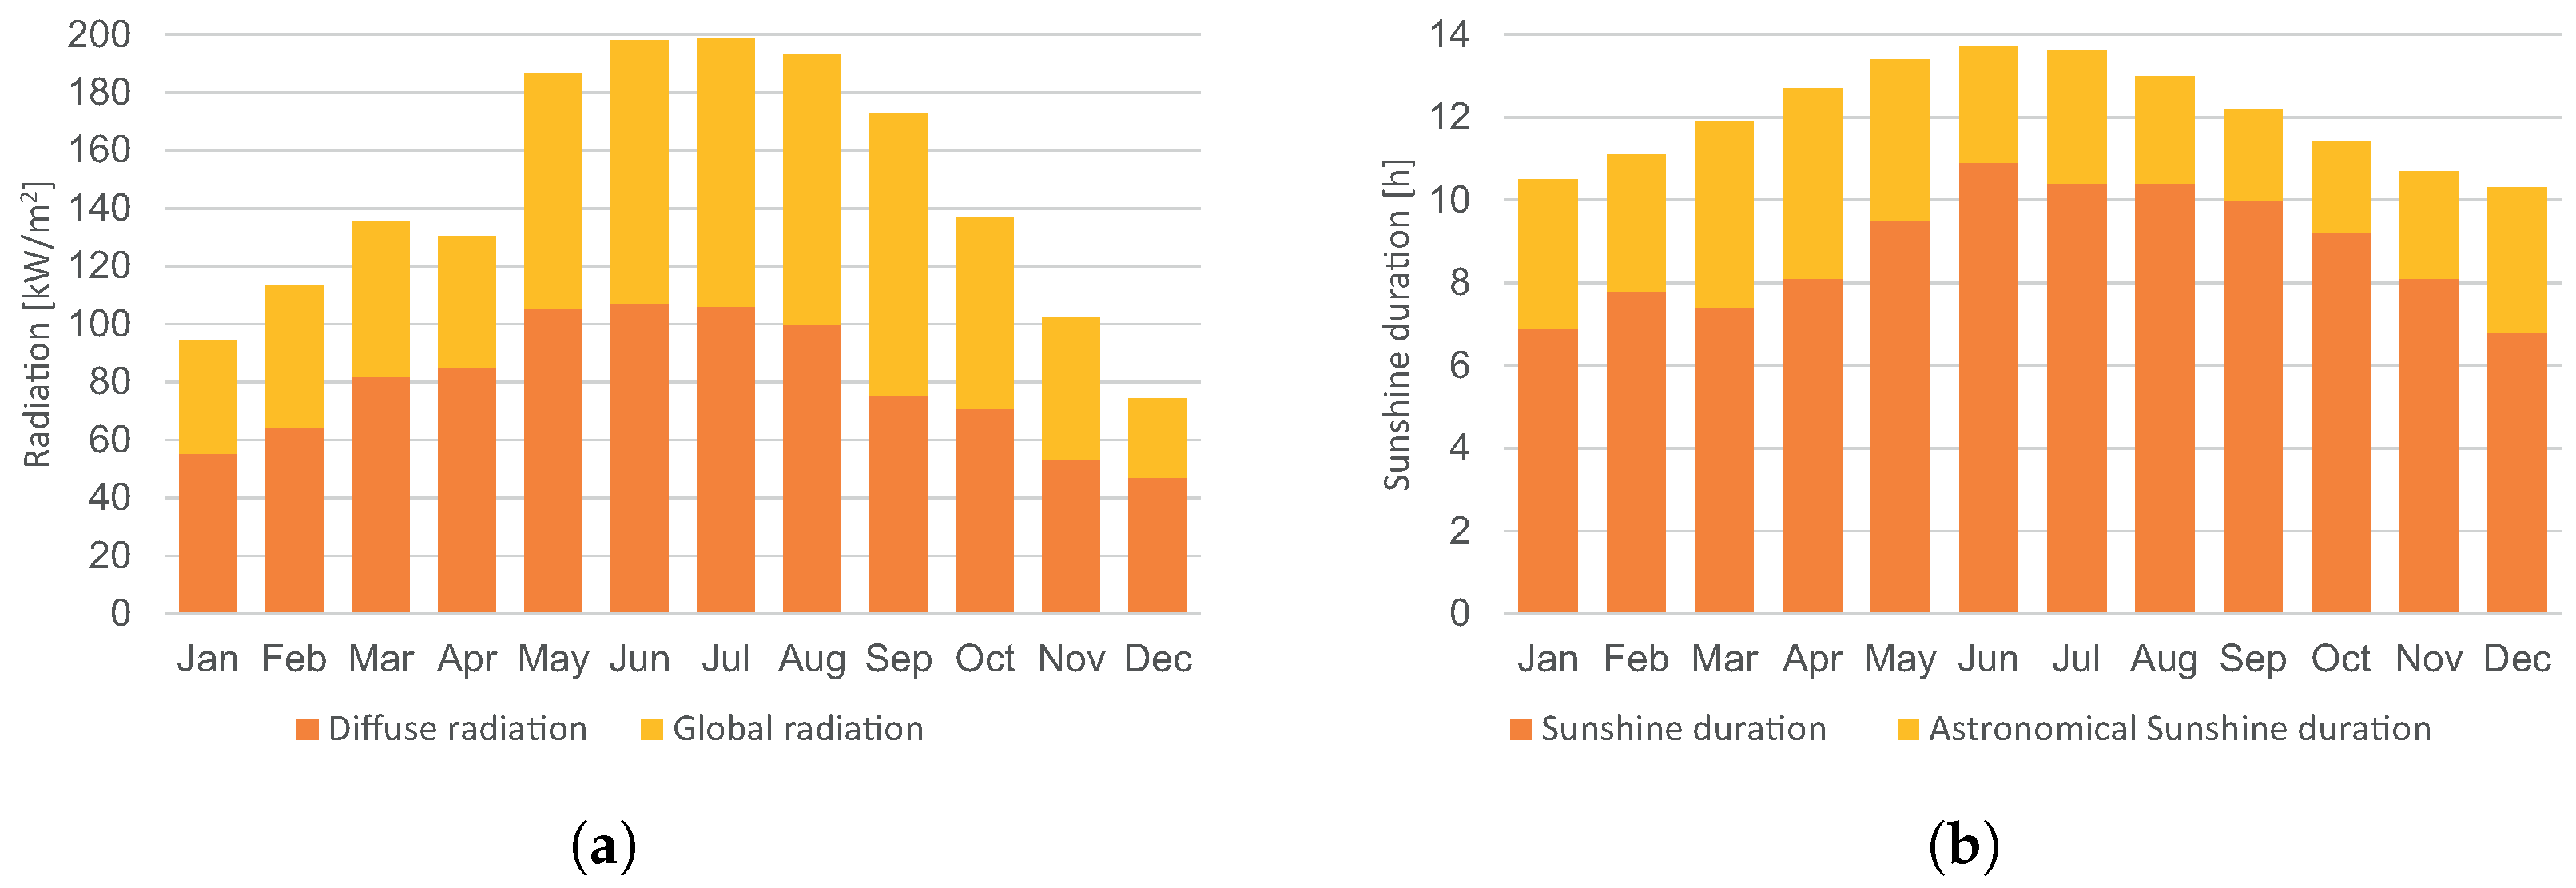
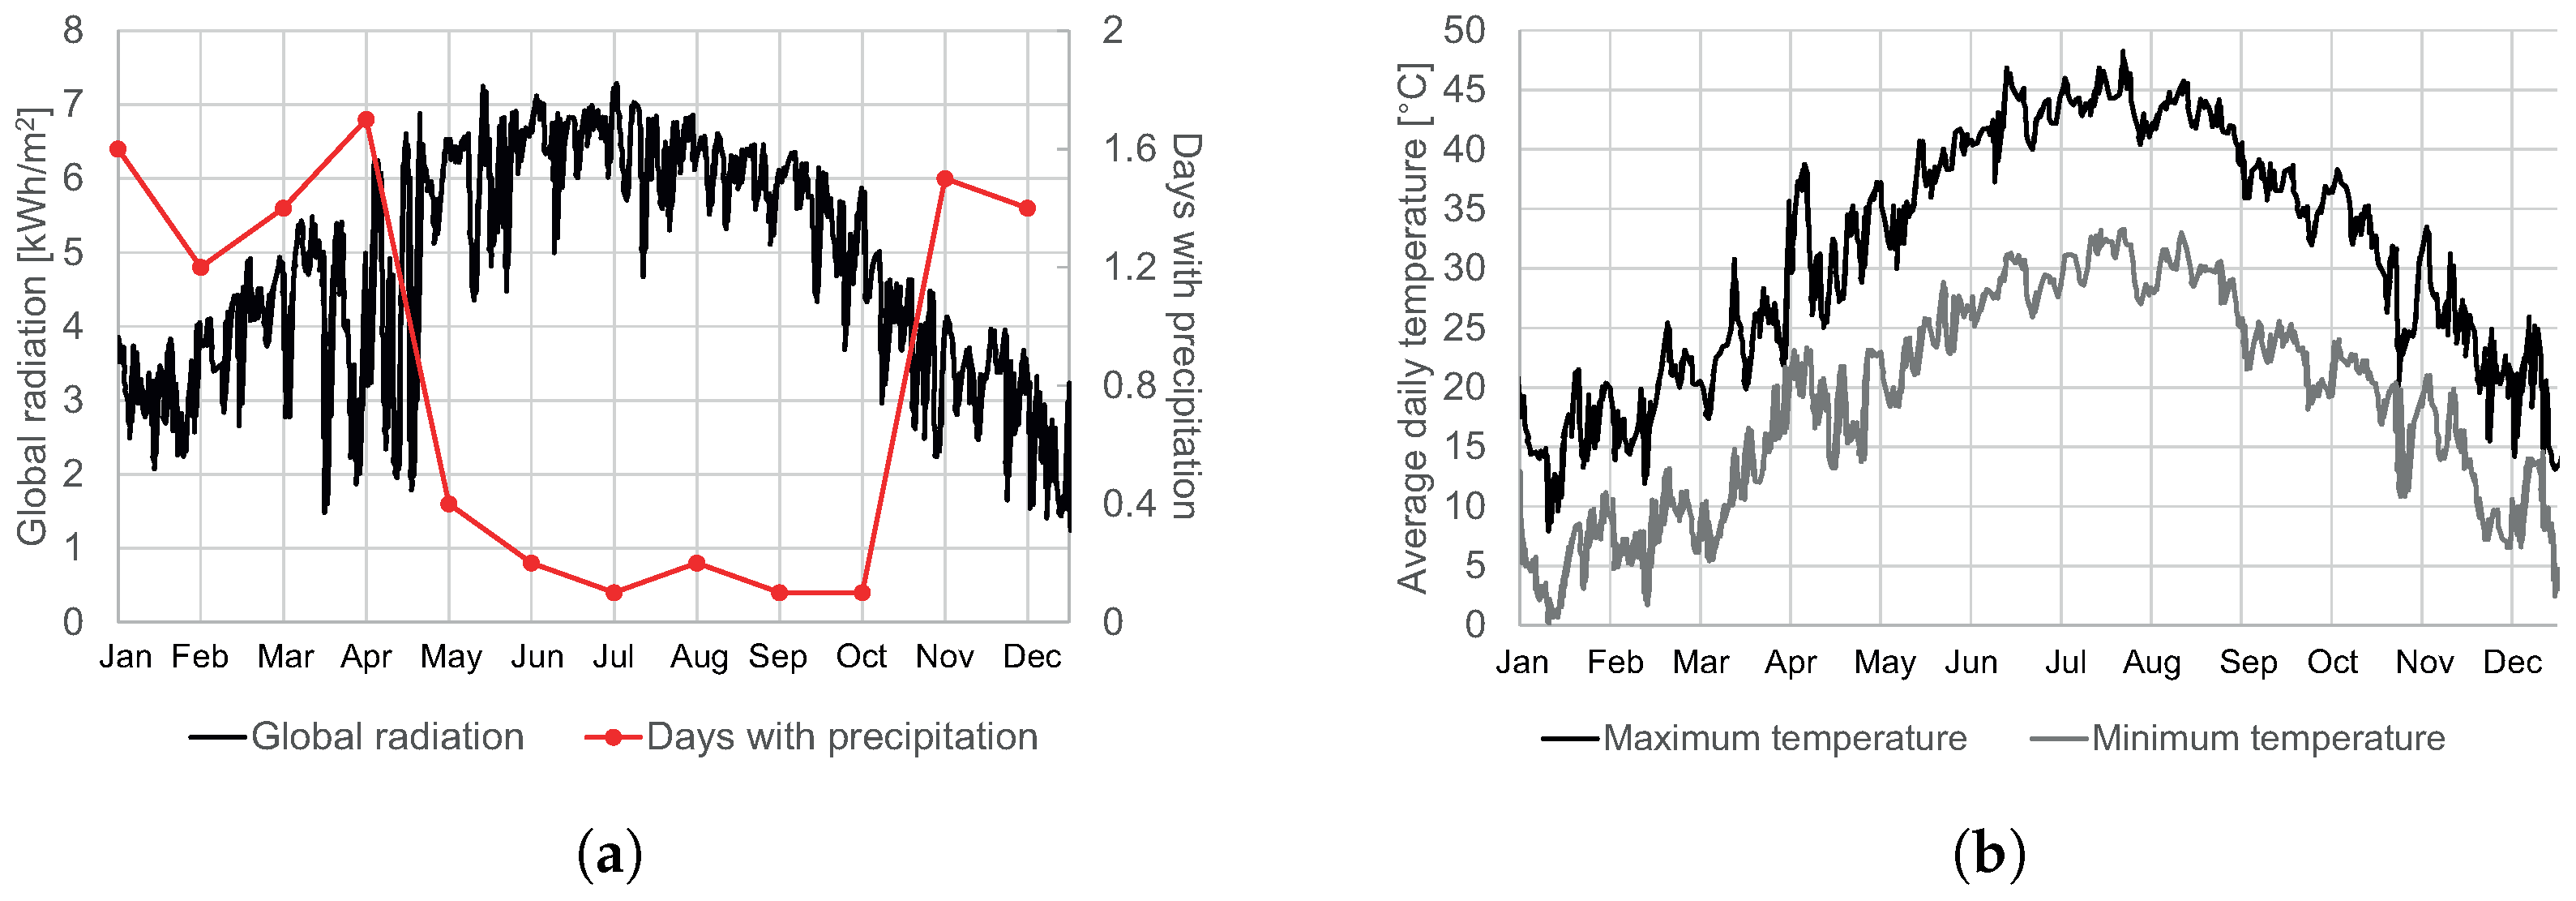
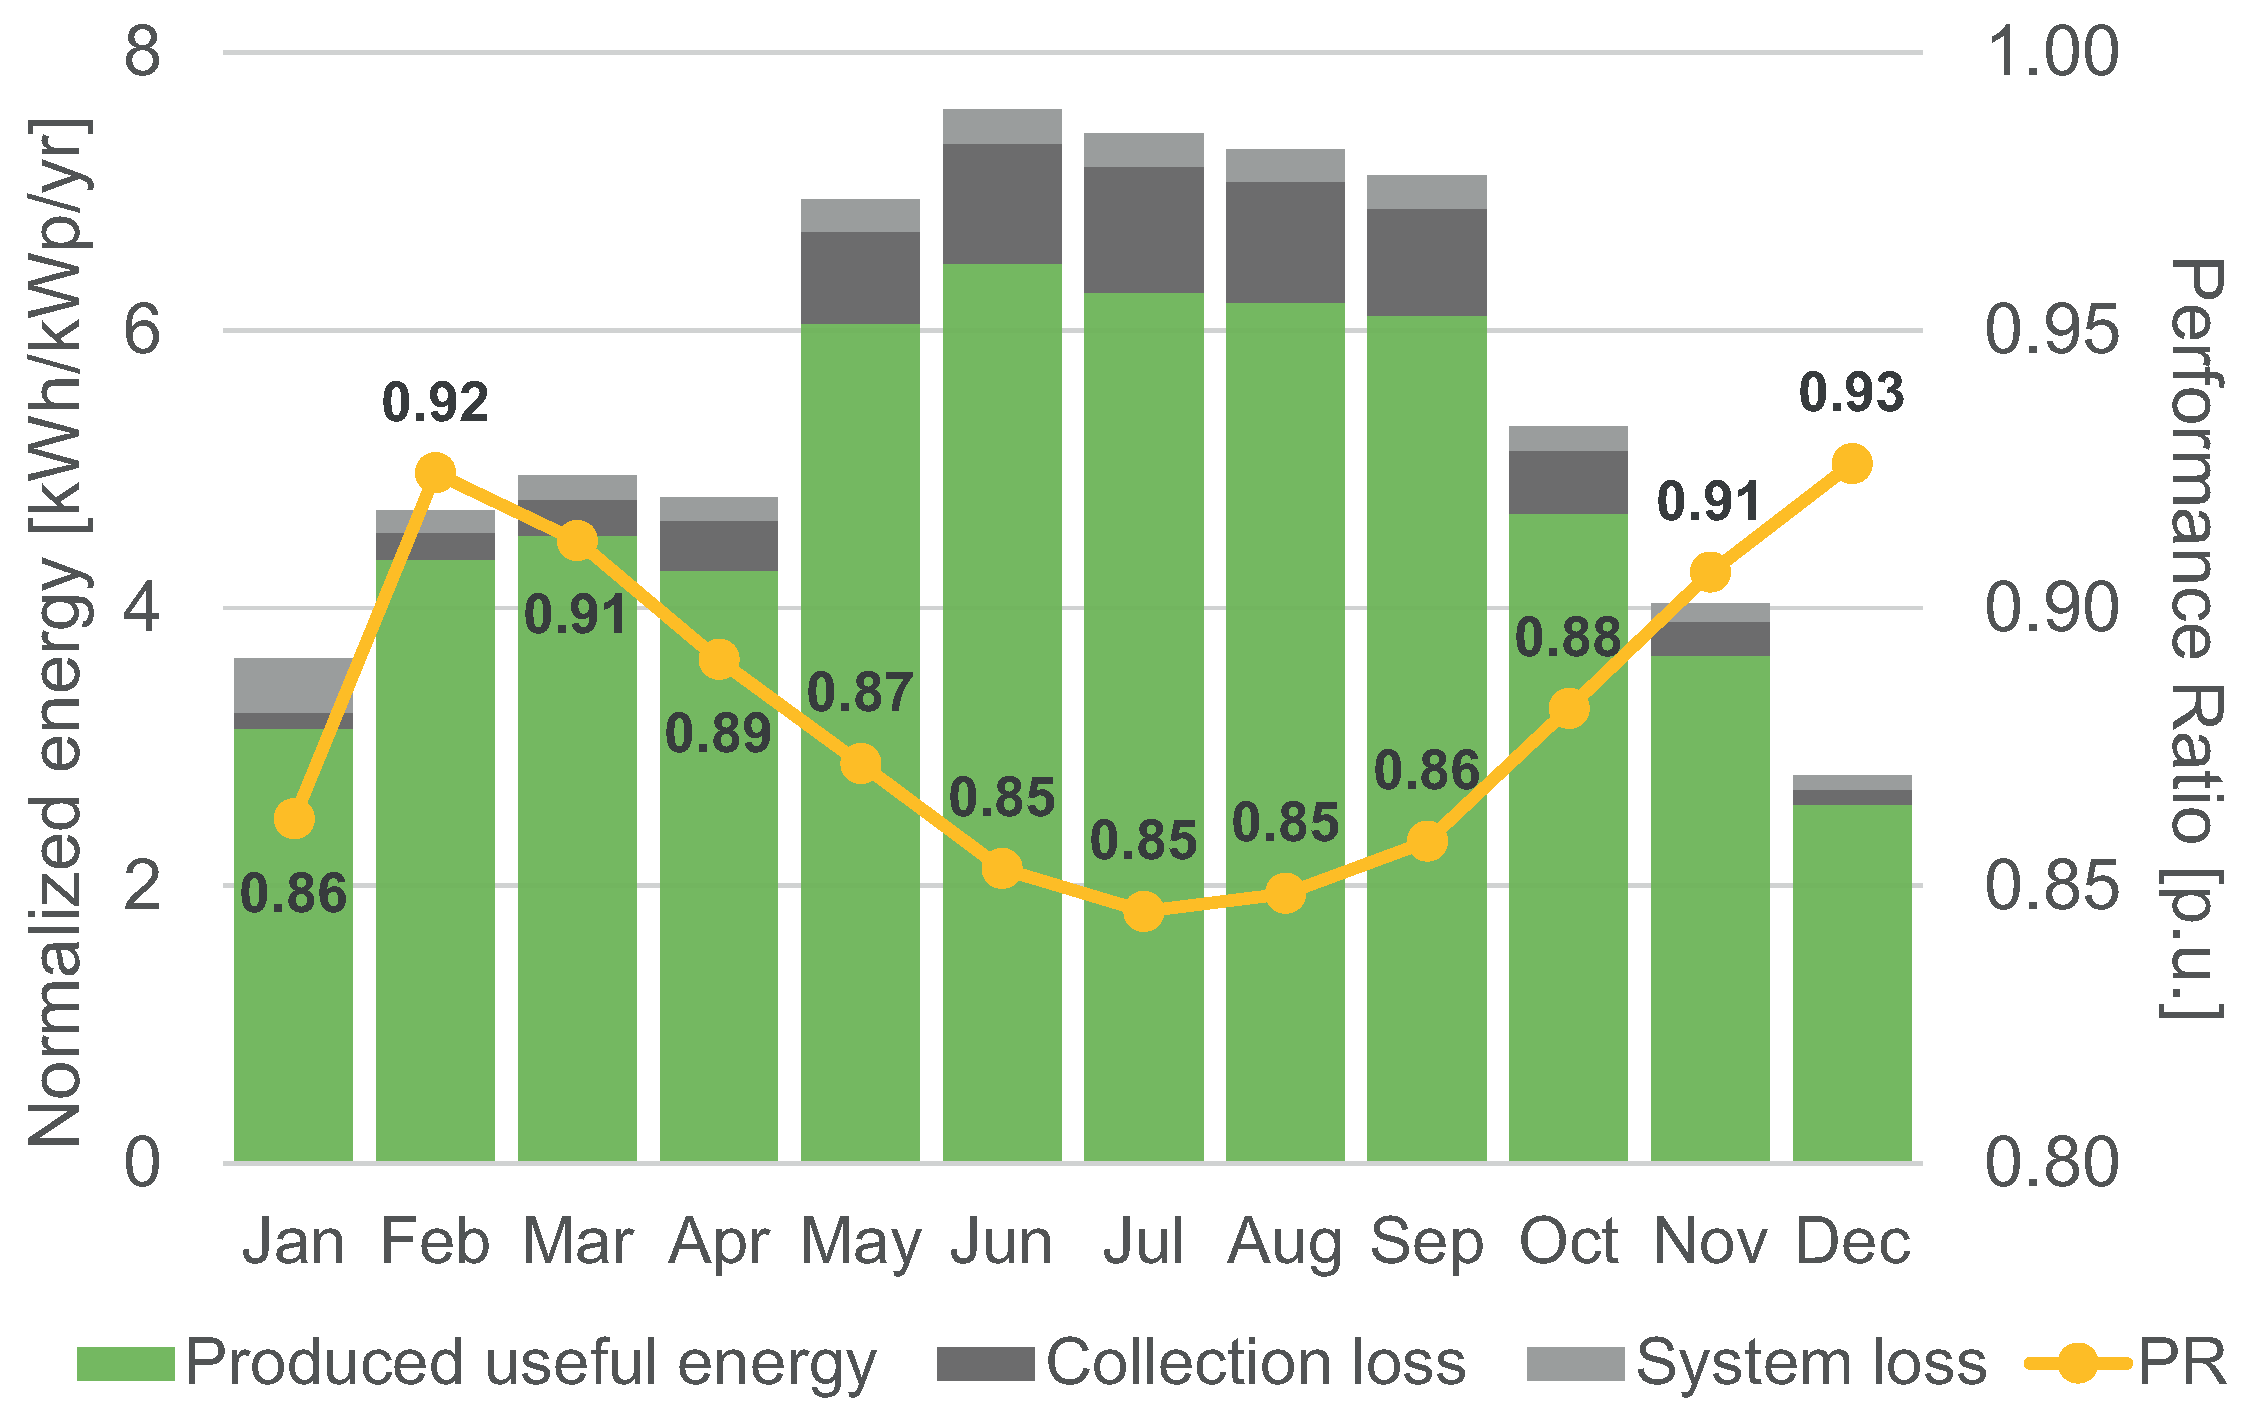
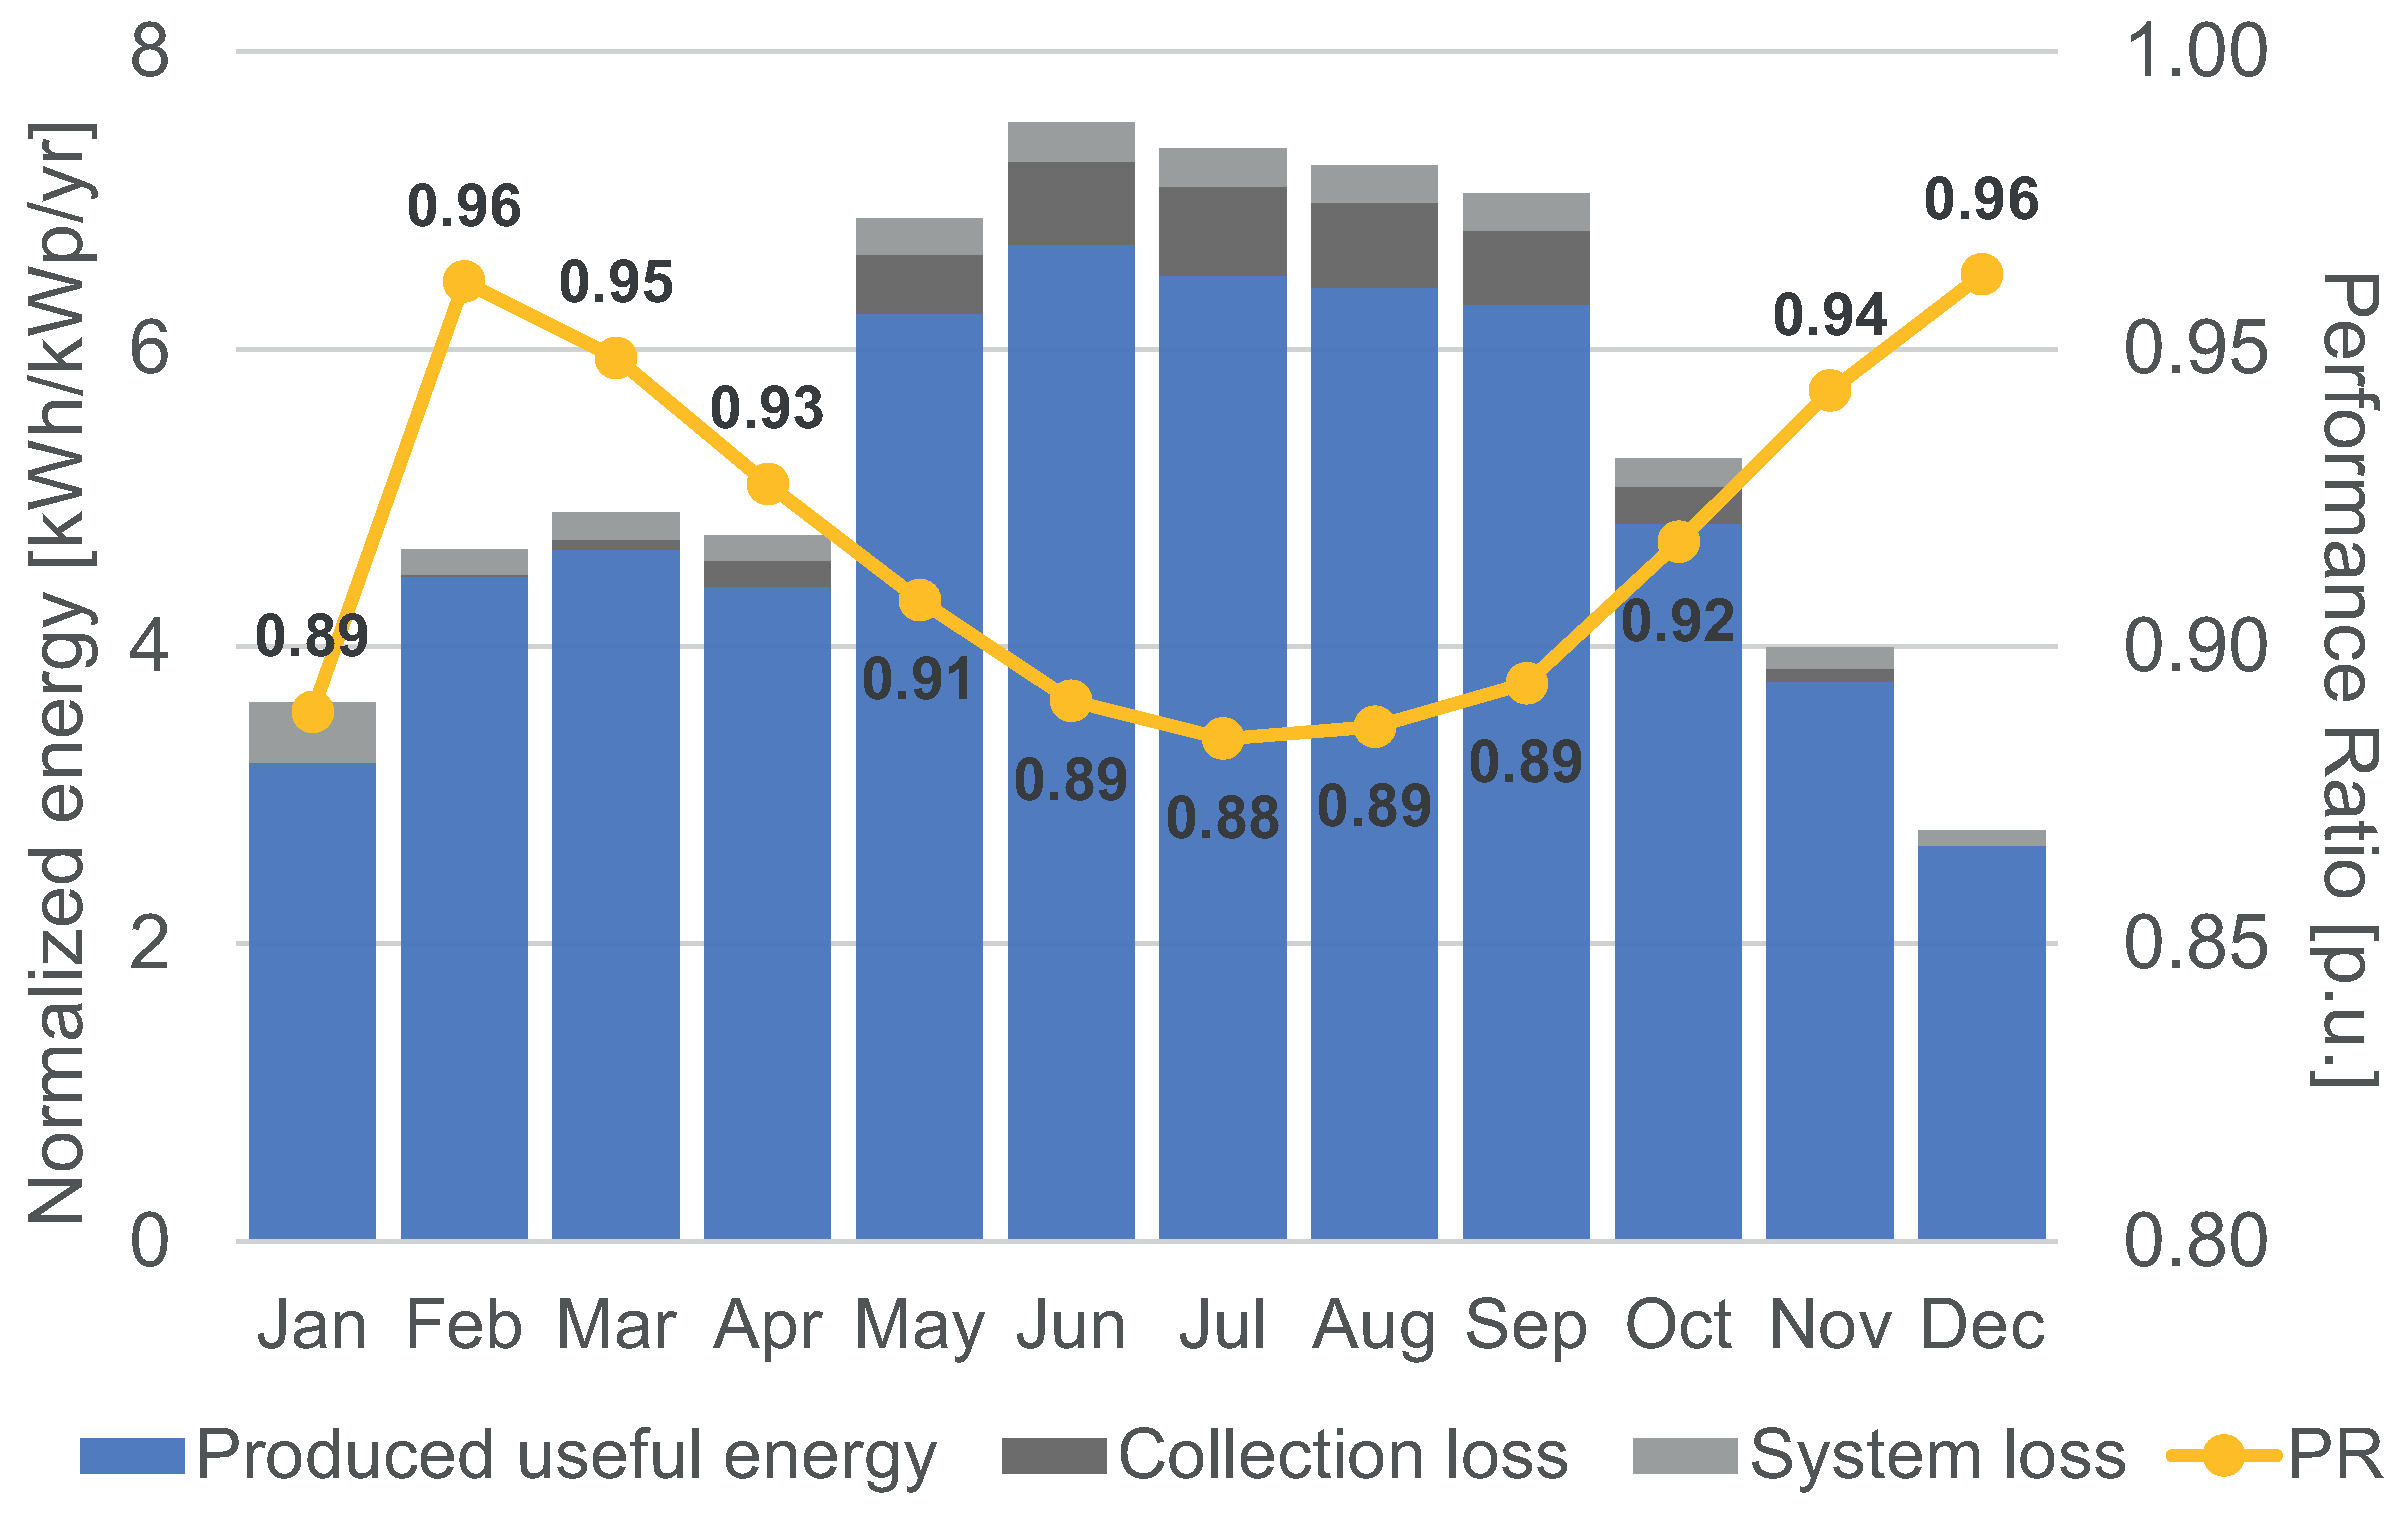
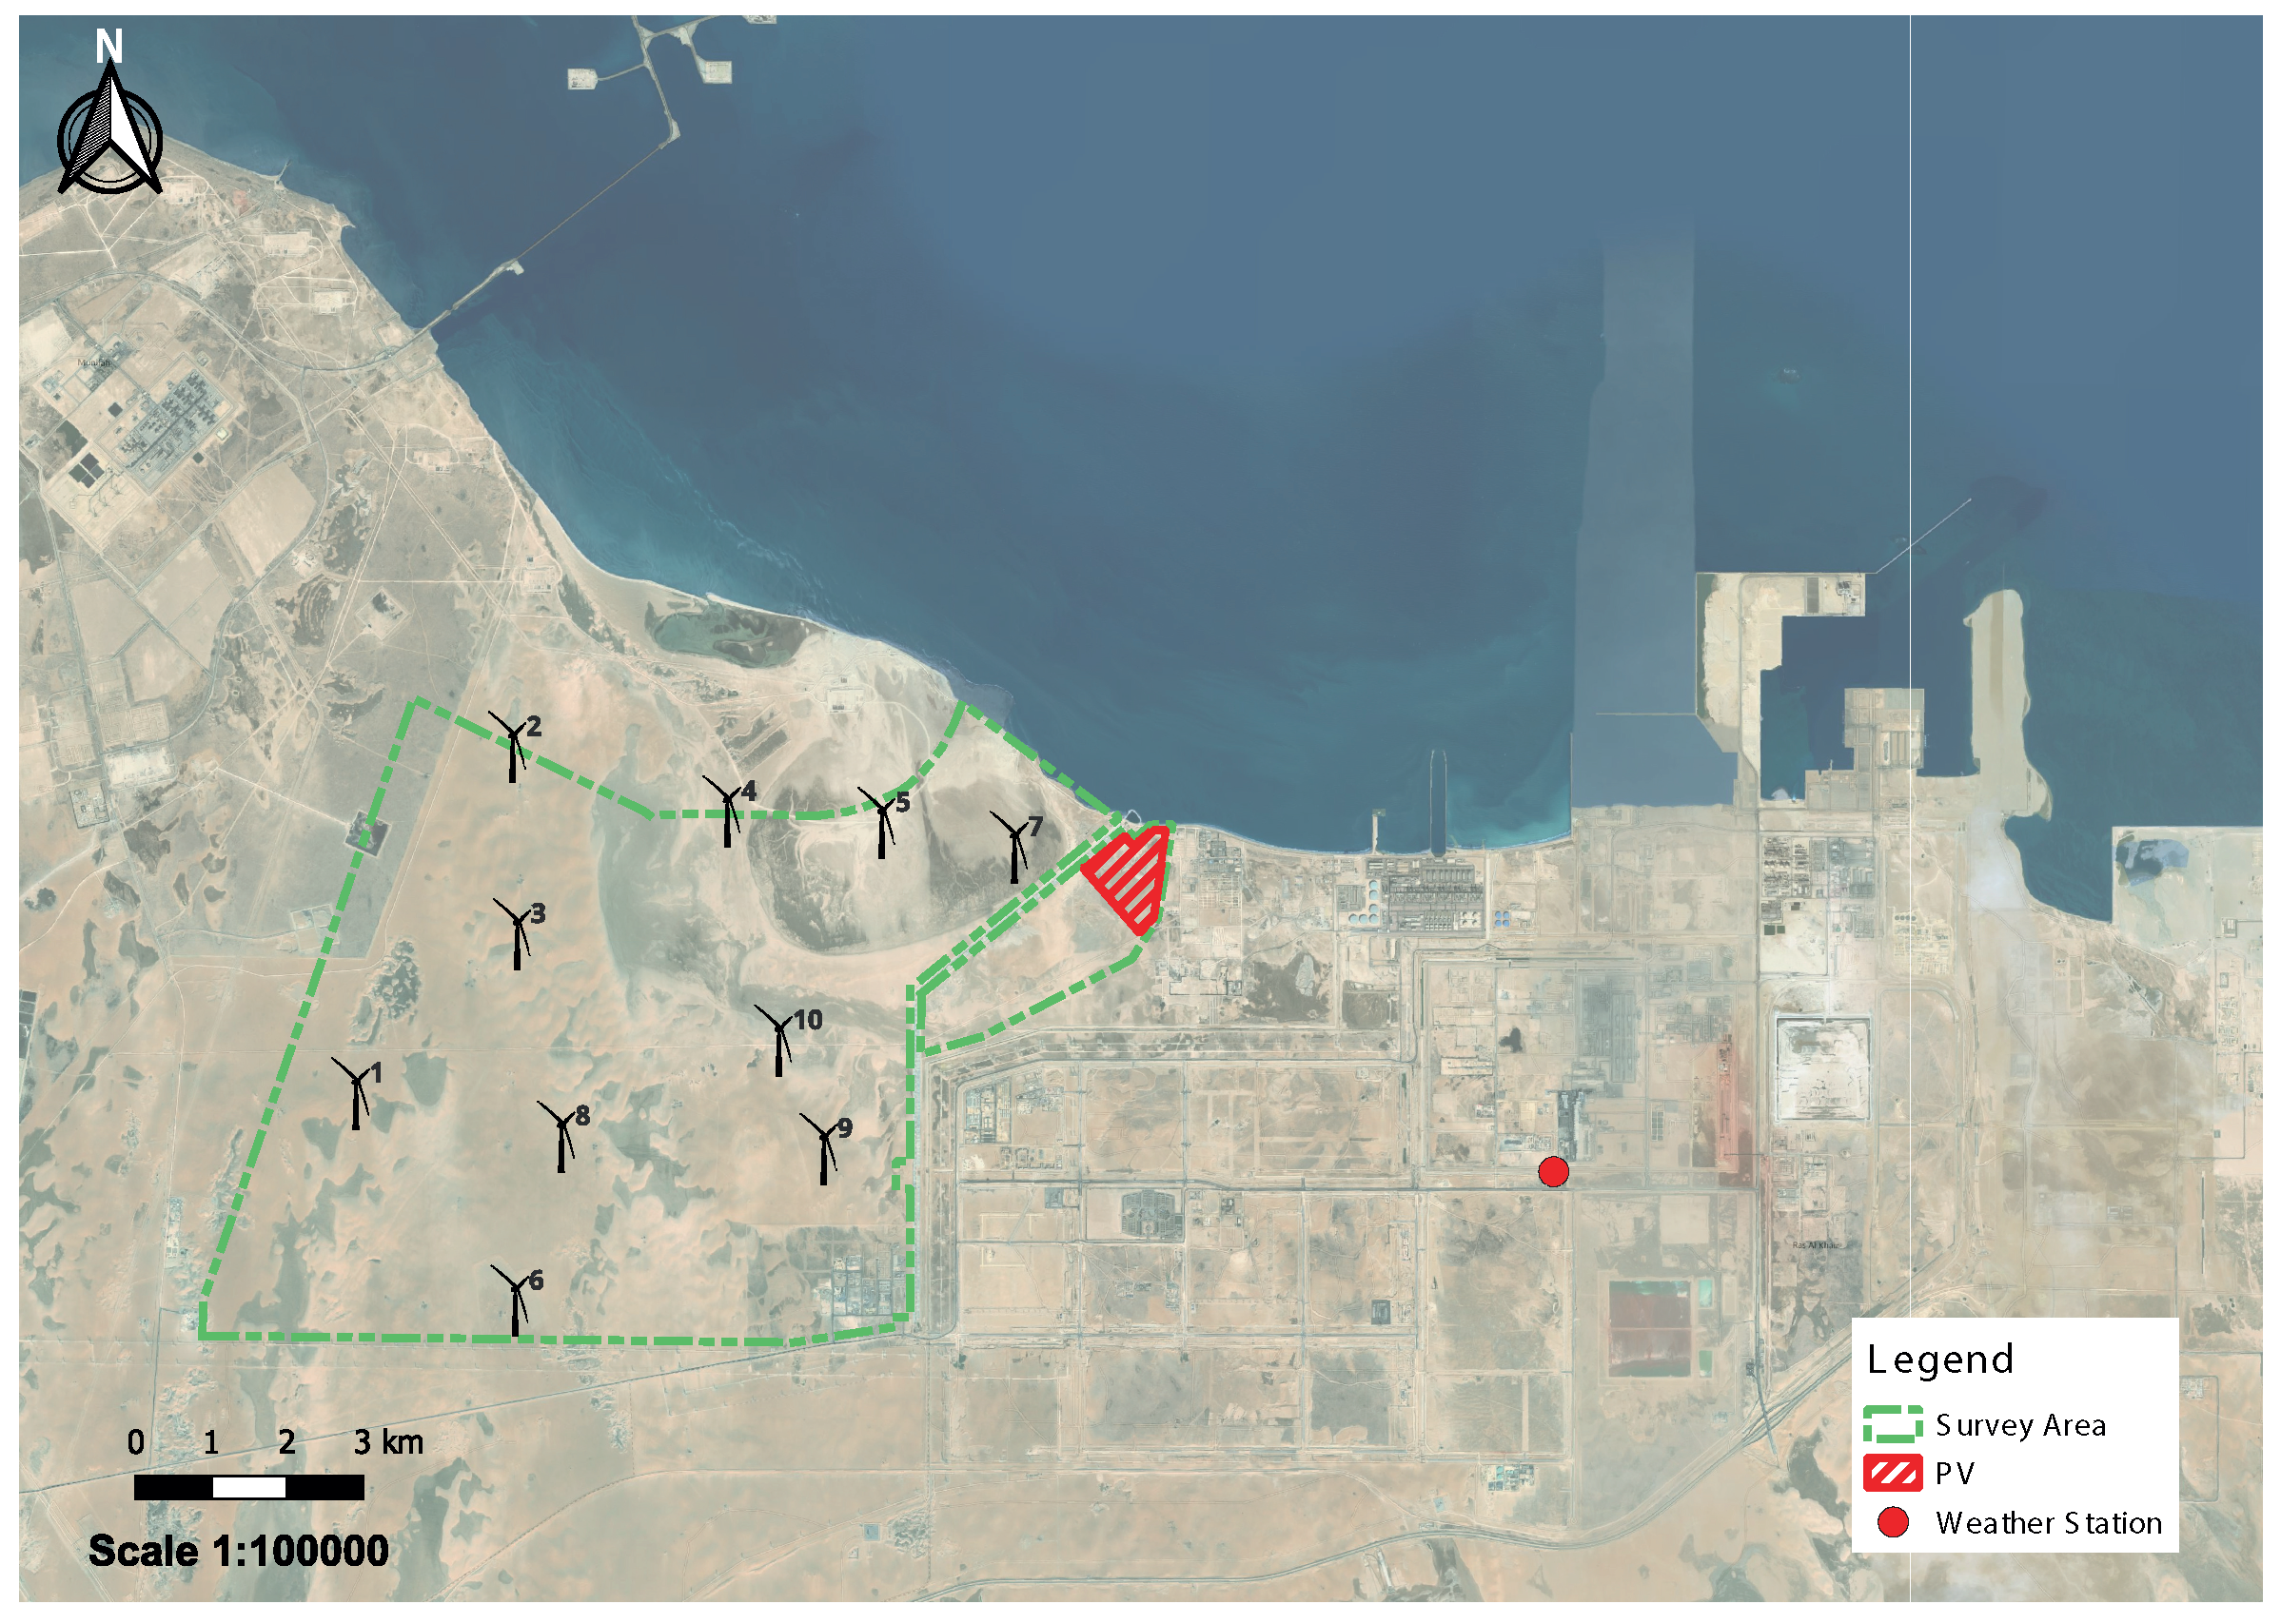
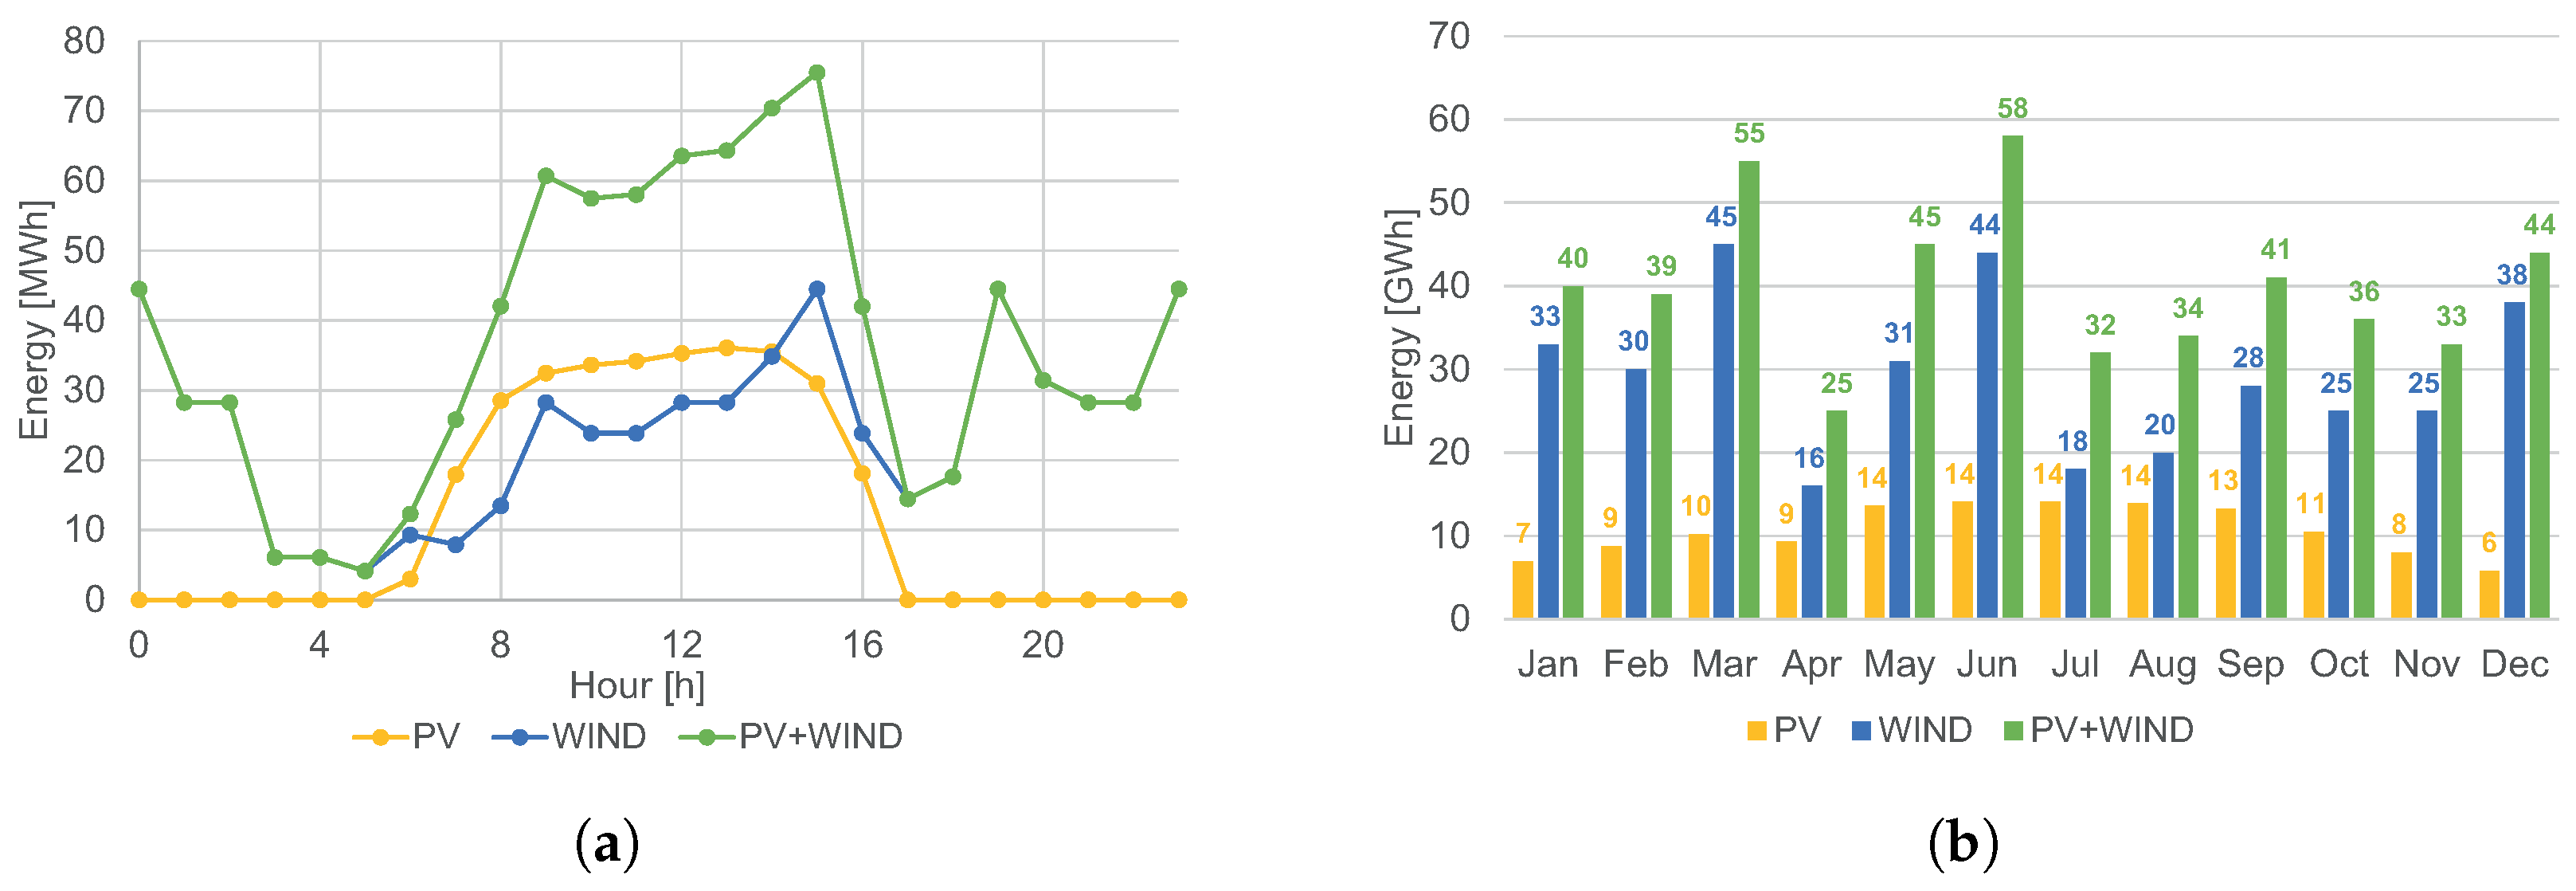
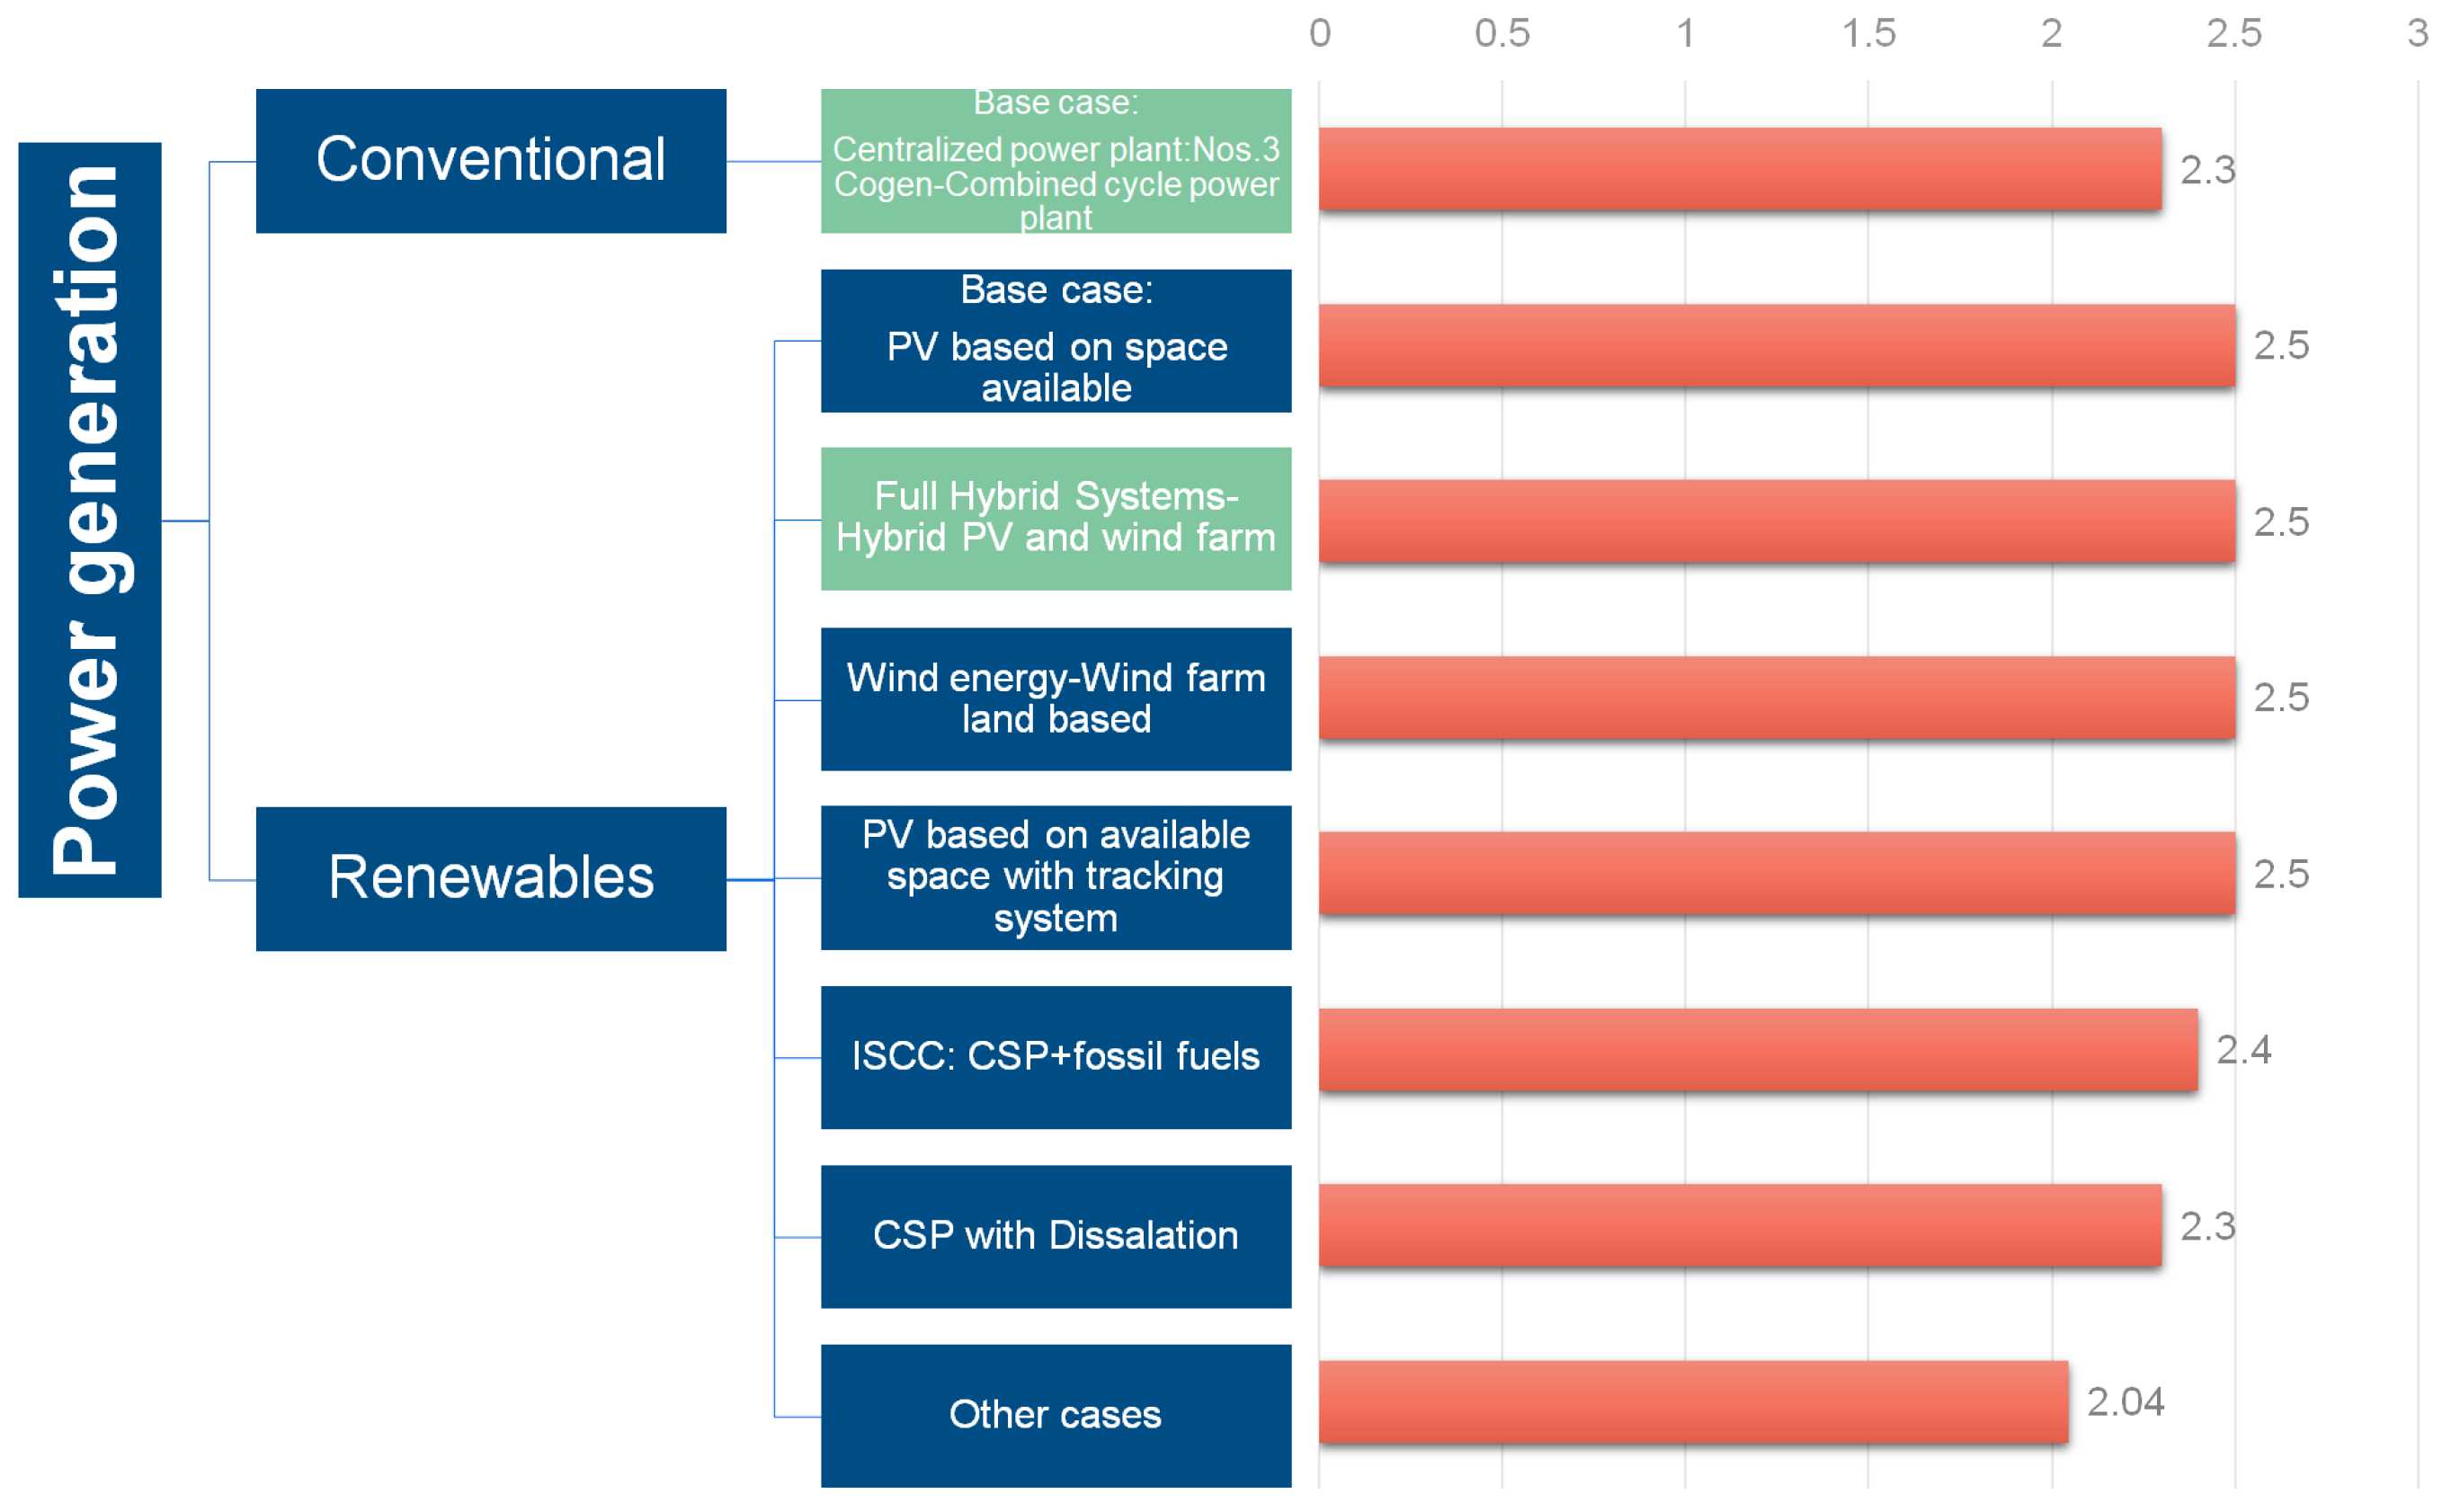
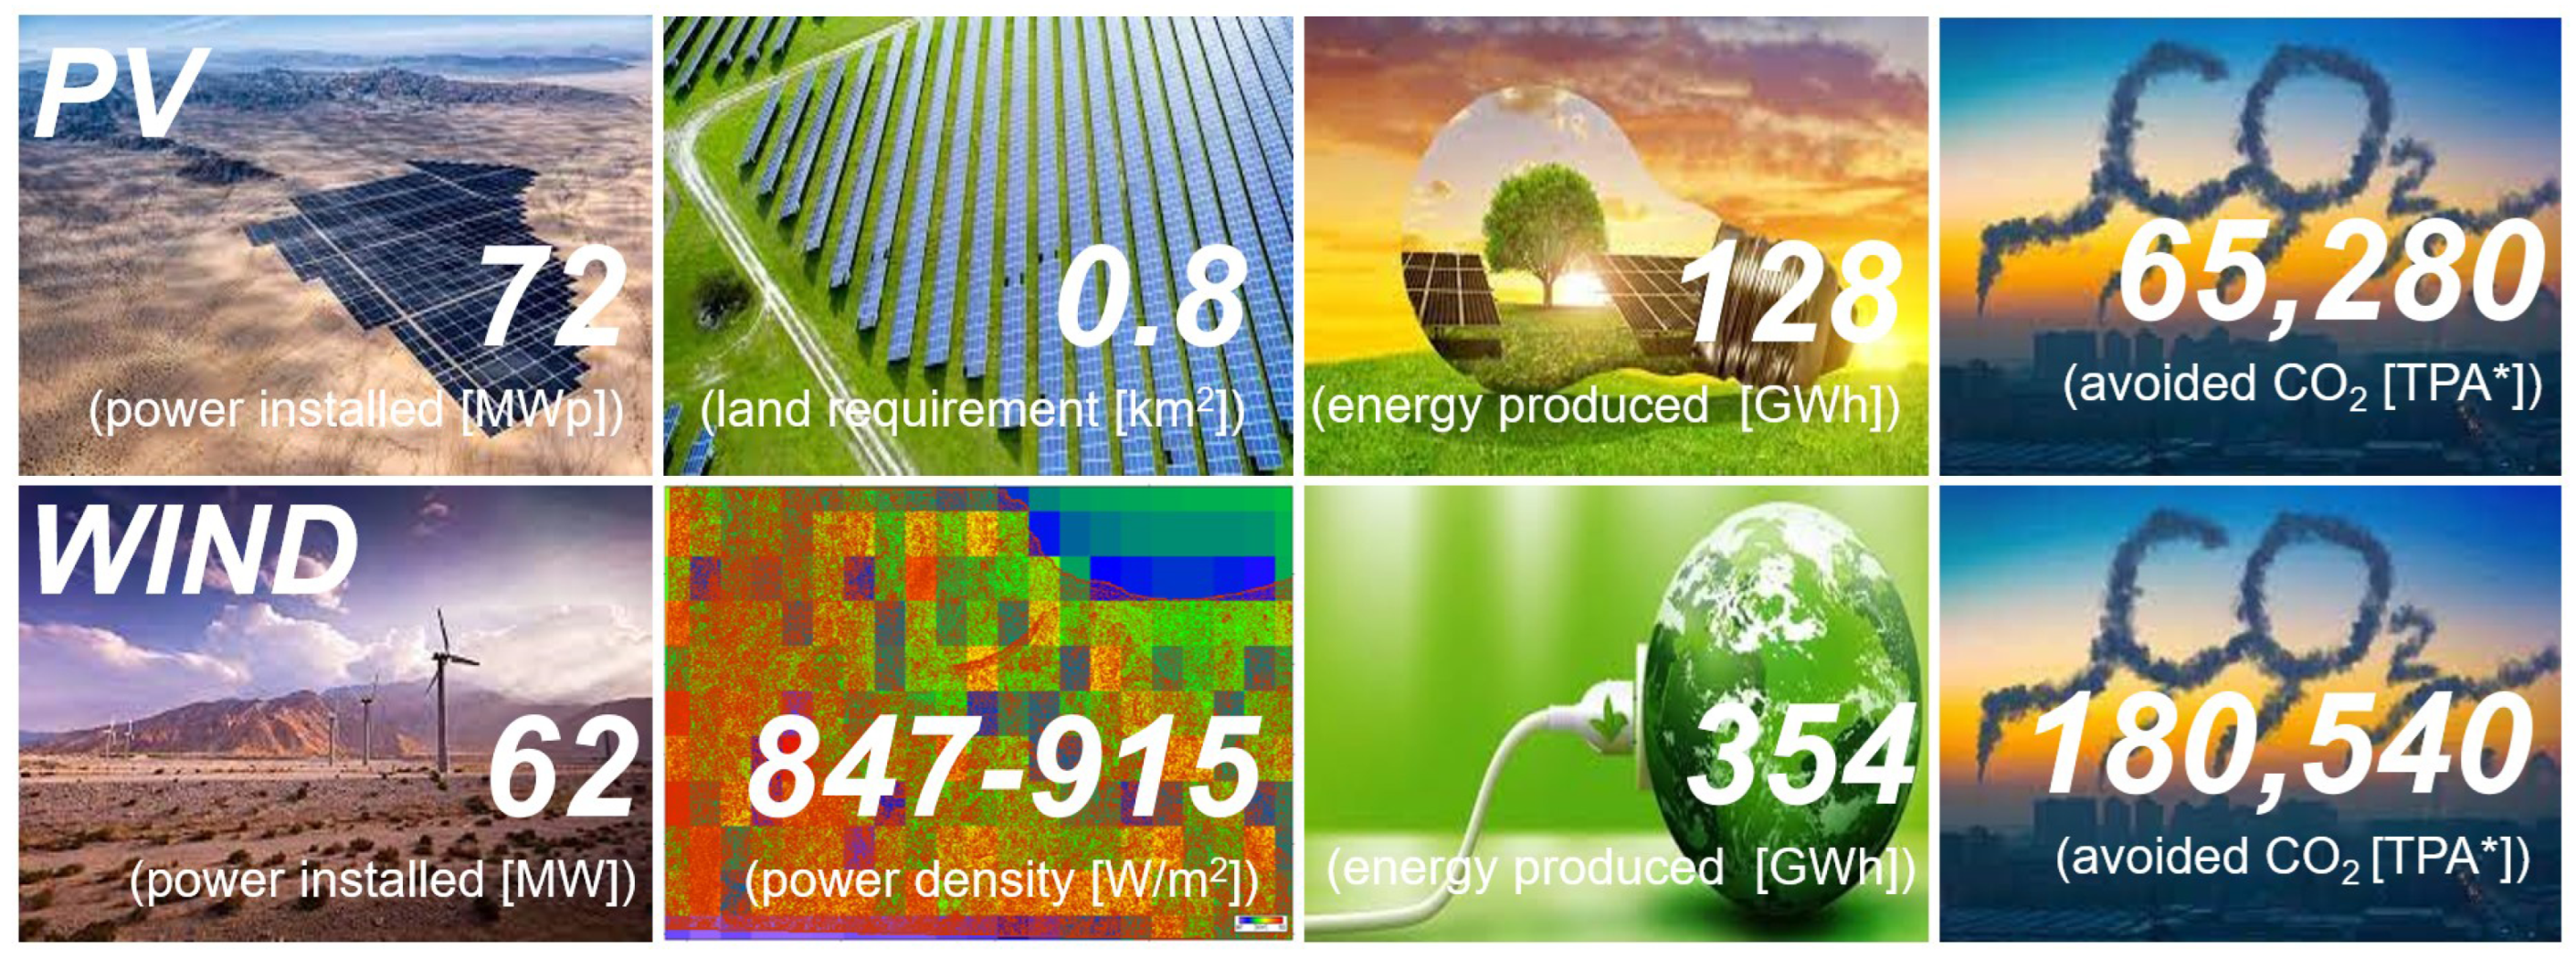
Disclaimer/Publisher’s Note: The statements, opinions and data contained in all publications are solely those of the individual author(s) and contributor(s) and not of MDPI and/or the editor(s). MDPI and/or the editor(s) disclaim responsibility for any injury to people or property resulting from any ideas, methods, instructions or products referred to in the content. |
© 2024 by the authors. Licensee MDPI, Basel, Switzerland. This article is an open access article distributed under the terms and conditions of the Creative Commons Attribution (CC BY) license (https://creativecommons.org/licenses/by/4.0/).