1. Introduction
Lithium-ion batteries have been widely used in electric vehicles (EVs) owing to their high energy density, high power density, and long cycle life [
1,
2]. The state estimation of batteries, as a key part of battery management, has been extensively researched. But, for the battery pack of an EV, which is always connected in series and parallel by hundreds or thousands of cells, it is still a challenge to develop an online state estimation with the characteristics of being simple, efficient, and accurate simultaneously, given the ever-increasing amount of preliminary experiments required for deepening aging modeling and the ever-increasing amount of online computations with deteriorating consistency [
3,
4].
In the existing research, the early research idea for the state estimation of battery packs is the ‘big battery’ method. In this method, a battery pack is simplified as a ‘big cell’, and the estimation method for cells is directly applied to battery packs, such as the model-based approach [
5,
6] and data-driven approach [
7,
8]. However, this simple but crude method does not take into account the cell-to-cell inconsistency in battery packs. And the inconsistency between cells will be further worsened because of aging factors such as the ambient temperature and battery use. The inconsistency will greatly reduce the accuracy of the state estimation, which may result in behaviors such as the overcharging and over-discharging of cells.
To cope with the problem of inconsistent deterioration [
9,
10,
11], the basic method is to estimate the state of each cell in a battery pack. However, a huge computational cost would be incurred, which is an extremely heavy task in the battery management system (BMS). To reduce the computational cost, a method based on the mean-difference model has been proposed [
12,
13]. In this method, the mean-difference model was used to evaluate the inconsistency of cells, and it used dual time scales to reduce the computational complexity. For example, in Ref. [
14], the first-order resistance capacitance (RC) model was used as the mean model to represent the overall performance of battery packs, the internal-resistance (Rint) model was used as the difference model to evaluate battery differences, and the dual time-scale implementation was designed to estimate the state of charge (SOC) by the extended Kalman fuzzy adaptive joint filtering algorithm. In Ref. [
10], the second-order RC model was selected as the mean model, and the Rint model was used as the difference model. The extended Kalman filter was used to estimate the SOC of battery packs. Although these methods consider the inconsistency of cells, they do not consider the impact of capacity loss during battery use. To further consider the impact, in Ref. [
15], the mean-difference model was built first, and the spatial equation was established to obtain the coupled relationship between the SOC and state of health (SOH). The joint estimation of the SOC and SOH was realized under the multiple time scales. However, with this method, to obtain the SOC and SOH relationships, a large number of preliminary experiments are required. And the gradually increasing inconsistency requires the mean-difference model to evaluate the battery difference periodically, which consumes computations in real applications.
Another estimation method that considers battery inconsistency has also been proposed, which is called the special cell method [
16,
17]. In this method, the cell that can represent the performance of battery packs is mainly selected as a special cell, and the state of battery packs is then obtained by estimating the state of the special cells. The cell with the highest/lowest terminal voltage during charging/discharging is regarded as a special cell.
But, with battery use, the terminal voltage would no longer always directly reflect the electric quantity state of cells due to the internal resistance increase [
18]. To avoid the influence of internal resistance change, in Ref. [
19], the open circuit voltage (OCV) in the Rint model was used to select special cells. However, this method needs to identify the parameters for each cell in battery packs, which seriously increases the computational cost. Additionally, these methods are still not free of the huge time cost caused by a large number of preliminary experiments.
Based on the above discussion, the time costs for aging modeling and the computational costs for online management are still urgent problems to be solved for pack state estimation. In this paper, to solve these problems and ensure the accuracy of state estimation, a training-free estimation method for the SOC and SOH of series battery packs under various load profiles is proposed. The specific contributions are listed as follows:
- (1)
The estimation of the battery pack is summed up to the estimation of two decisive cells, and the corresponding selection approach for the decisive cells is adopted.
- (2)
The training-free state estimation for decisive cells and battery packs is realized based on the selection of characteristic parameters that only exhibit local curve shrinkage with aging.
- (3)
Multiple estimation approaches are effectively combined by the respective dynamic weights to ensure a good estimation accuracy under various load profiles.
The remainder of this paper is organized as follows. The state estimation of battery packs is described in
Section 2. The experimental design is introduced in
Section 3. The experimental results and discussions are provided in
Section 4. And the conclusions are summarized in
Section 5.
2. Training-Free Estimation Strategy for Battery Packs
In this section, to minimize the scales of computation for online management, a new method for decisive cells’ selection is firstly proposed. And the SOC and SOH estimation of battery packs is realized by the estimation of the two decisive cells. In the framework for this estimation strategy, two novel ideas are implemented for the state estimation of selected cells. On the one hand, training-free characteristic parameters are selected for decisive cells based on the battery aging mechanism to avoid the constraint of pre-experiment; on the other hand, to ensure the accuracy of the state estimation for decisive cells under various load profiles, multiple estimation approaches are effectively combined by their respective dynamic weights.
2.1. The Choices of SOC Definitions for Cells and Packs, Respectively
The SOC, as the ratio of battery remaining electric quantity to the battery capacity, is a general concept. However, its definition with different capacities as the denominator will present nonuniform meanings. Choosing an appropriate SOC definition will make the calibration of cell aging more comparable and the estimation of battery states easier [
20,
21].
- (1)
For the cells in packs, since the SOC does not need to be displayed to the user, the chose of SOC definition could be flexible according to the needs of the algorithm. In this paper, the initial capacity of fresh cells is chosen as the denominator [
22], and the SOC definition of cells is shown in Equation (1), wherein,
is the SOC of cells;
is the remaining electric quantity of cells; and
is the initial capacity of fresh cells, which is obtained through a capacity test experiment for fresh cells.
By this definition, the SOC of cells can present more information as follows: the actual remaining electric quantity of cells can be directly judged by the SOC value; the health state of cells can be directly reflected by the maximum SOC value.
In addition, the SOH of cells is defined as the ratio of the current capacity to the initial capacity of fresh cells [
23], as shown in Equation (2), where
is the SOH of cells; and
is the current capacity of cells.
- (2)
For battery packs, different SOC definitions of battery packs may be used in different application scenarios. The specific definitions are as follows:
For the scenario where only the remaining mileage needs to be displayed, the initial capacity of fresh battery packs should be chosen as the denominator [
24], and the SOC definition of battery packs is shown in Equation (3). By this definition, the actual remaining electric quantity of battery packs can be directly obtained by the SOC value, where
is the SOC definition of battery packs with the initial capacity of fresh packs as the denominator;
is the remaining electric quantity of battery packs; and
is the initial capacity of fresh packs.
For the scenario where the SOC value needs to cover 0% to 100% regardless of the degree of aging, the current capacity of battery packs is chosen as the denominator [
19], and the SOC definition of battery packs is shown in Equation (4), where
is the SOC definition of battery packs with the current capacity as the denominator; and
is the current capacity of battery packs.
It should be noted that for these two different SOC definitions of battery packs, they can be converted flexibly, e.g.,
can be converted to
via
(i.e., Equation (5)). The conversion formula is as shown in Equation (6), wherein
is the SOH of battery packs. Based on this, to be consistent with definitions in the existing literature,
is chosen as a unified SOC definition of battery packs in this paper. And the symbol, i.e.,
, is used to represent the SOC of battery packs instead of
.
2.2. State Estimation of Packs and Selection of Decisive Cells
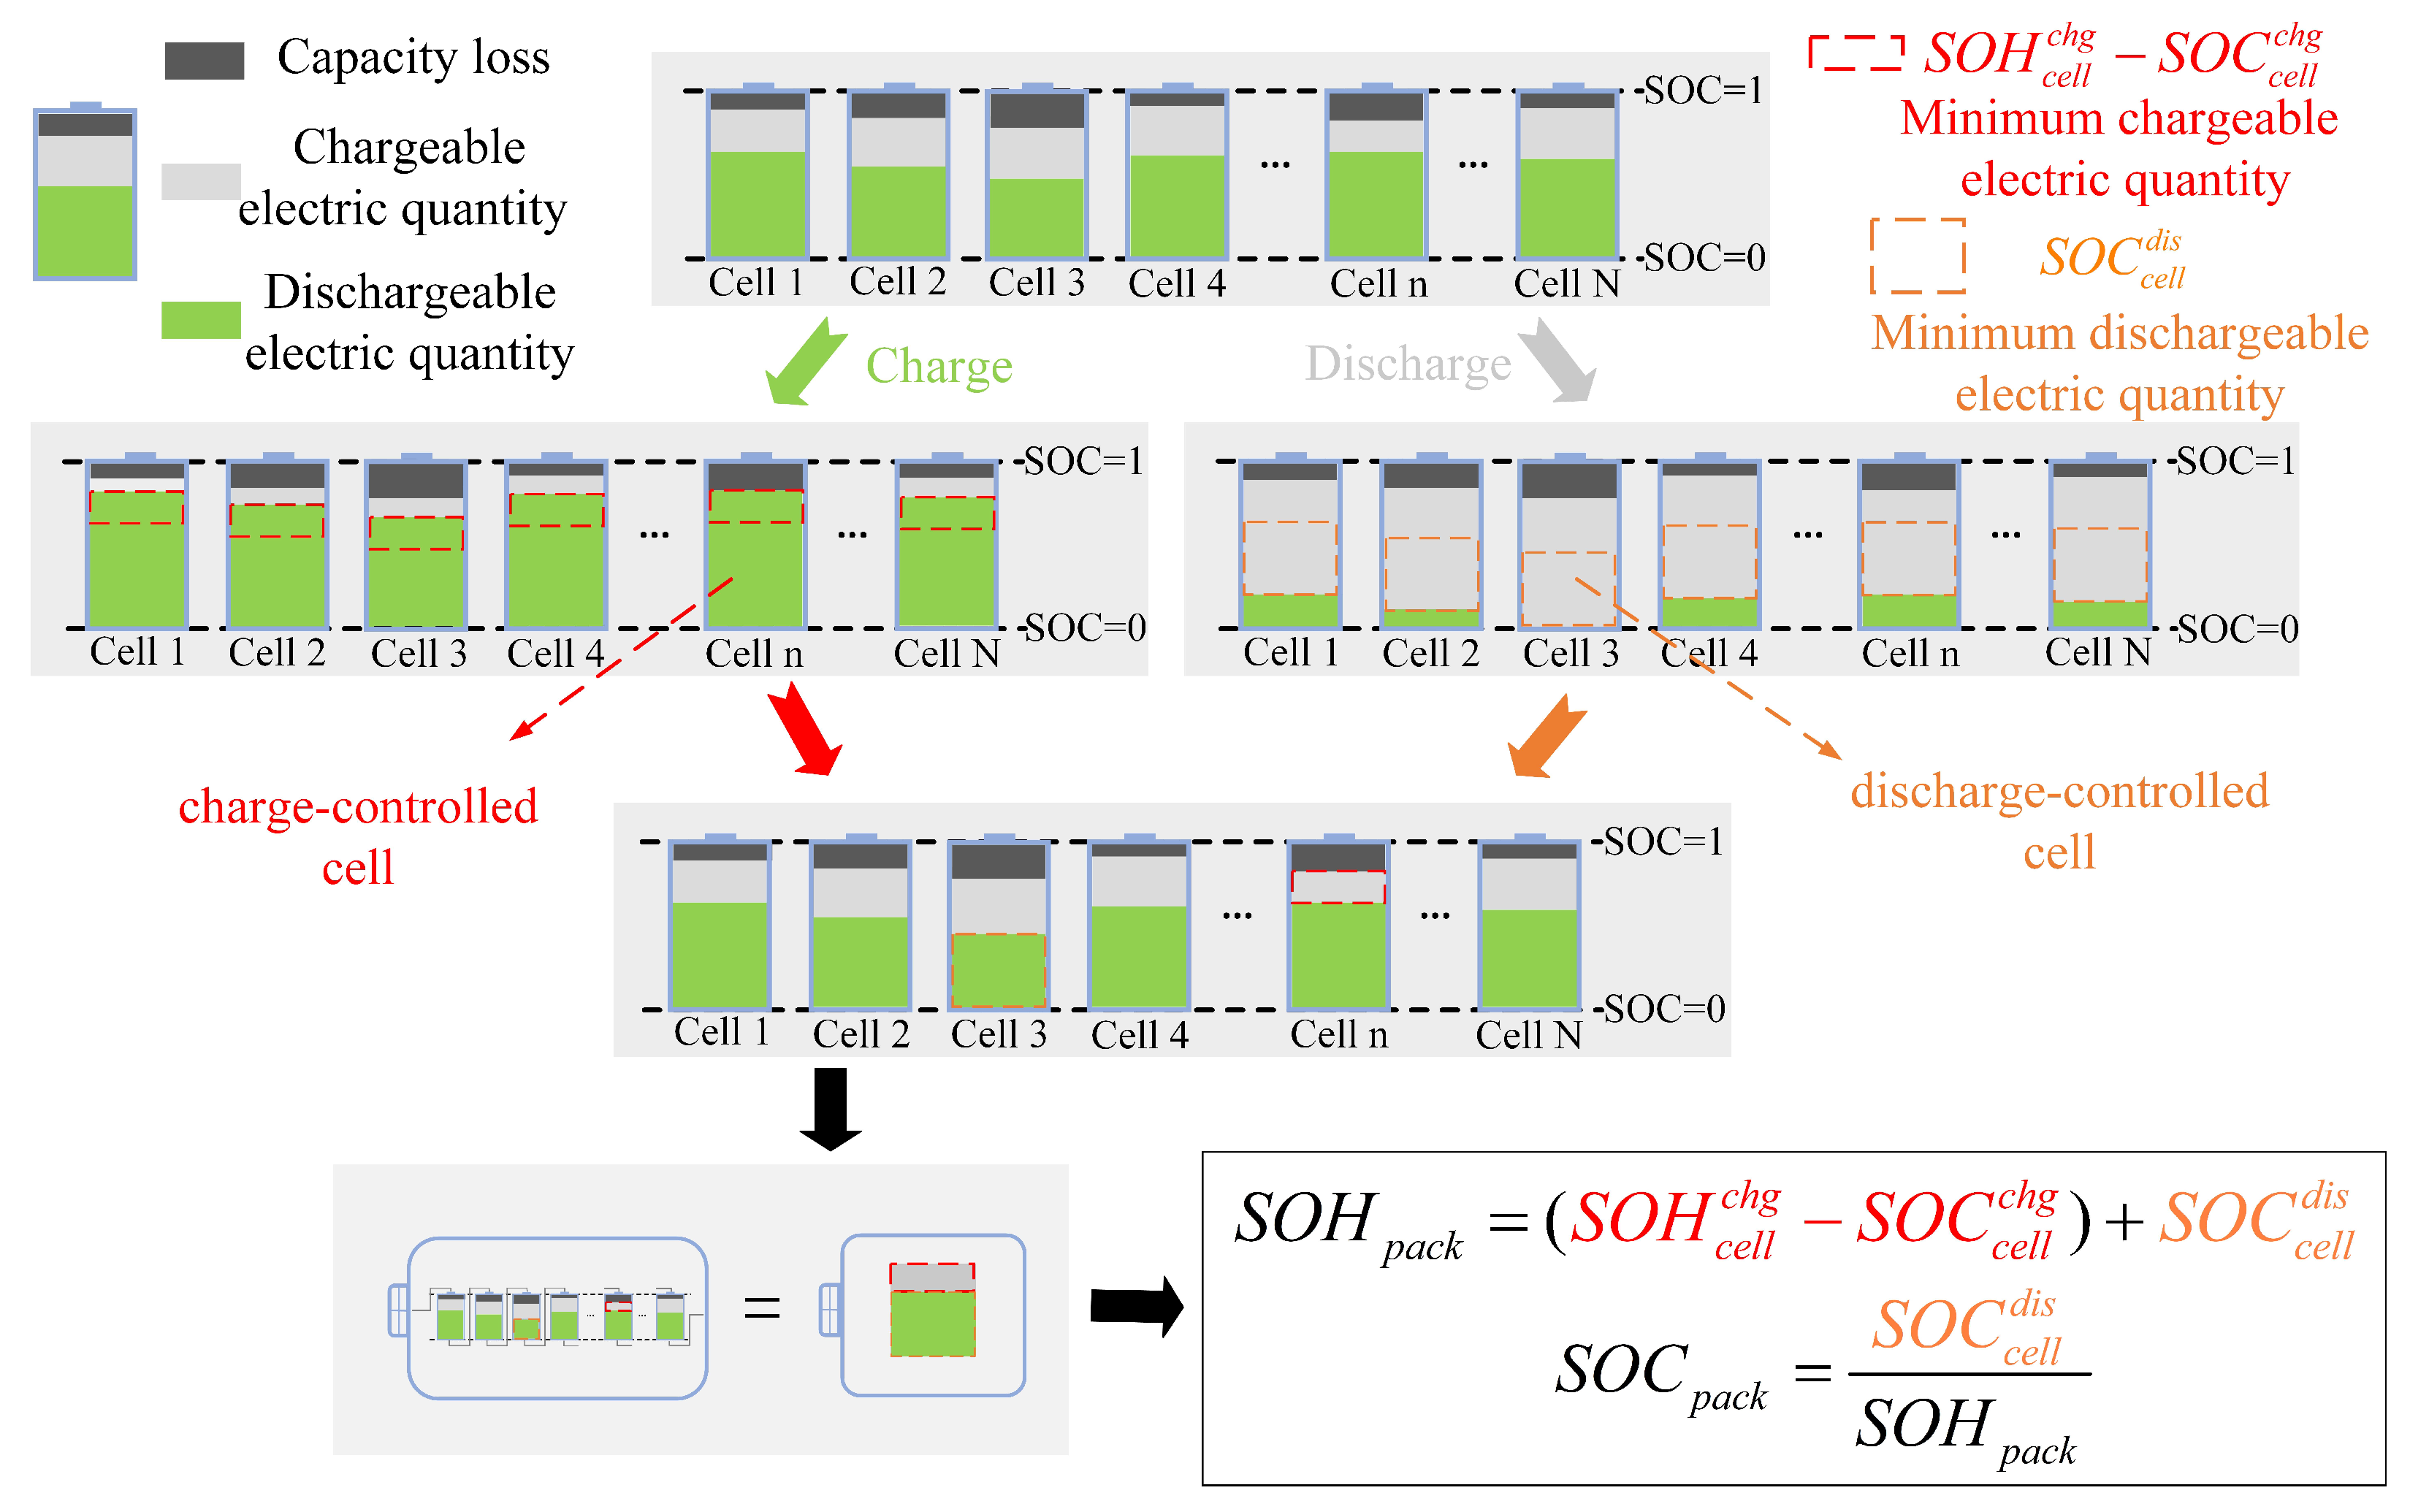
To ensure the accuracy of the SOC and SOH estimation for battery packs while minimizing the scales of computation for online management, the cells that can represent the overall performance of battery packs should be selected first. For a series battery pack composed of
N cells, the cell whose terminal voltage may first reach the upper limit of the terminal voltage will be selected as the charge-controlled cell, and the cell whose terminal voltage could first drop to the lower limit of the terminal voltage will be selected as the discharge-controlled cell [
16]. As shown in
Figure 1, due to the unavoidable inconsistency of cells in the SOC state and capacity loss, the chargeable and dischargeable electric quantity of the battery pack will be determined by that of the selected charge-controlled and discharge-controlled decisive cells (i.e., the minimum chargeable and dischargeable electric quantity between individual cells), respectively.
With this strategy, combined with the two decisive cells, the state of health of battery packs, i.e.,
, can be obtained [
14]. It is shown in Equation (7).
where
and
are the SOC and SOH of the charge-controlled cell, respectively; and
is the SOC of the discharge-controlled cell.
On the basis of the calculated
, the SOC of battery packs, i.e.,
, can be obtained using Equation (8).
For the selection of decisive cells that should be judged by the highest or lowest OCV rather than the terminal voltage, to avoid the influence of internal impedance increases, a new selection approach based on the detection of steep voltage changes will be adopted. With this approach, the judgment of decisive cells will only be made in the charging process, and the characteristics of the OCV curve with steep rising processes will be exploited. For the selection of the charge-controlled cell, when the cell is about to be fully charged, the rapid rise of the OCV curve will introduce the corresponding rapid rise behavior in the terminal voltage. Since the rate of voltage change is a voltage difference between two sampling points, the voltage effect of the same polarization behavior will be eliminated. Considering that the internal resistance cannot change abruptly, the rate of voltage change will not be affected by resistance and mainly reflect the change of the OCV and SOC. Therefore, in the high SOC region, the cell that the voltage difference is the first to rise rapidly (i.e., the OCV is the first to rise rapidly) is selected as the charge-controlled cell. Different from the charge-controlled cell, in the low SOC region, the cell that the voltage difference is the last to rise rapidly (i.e., the OCV is the last to rise rapidly) is selected as the discharge-controlled cell. It should be noted that to avoid conflicts in the selection of charge-controlled and discharge-controlled cells, the SOC value of the charge-controlled cell is used as the dividing line, and the judgment of the corresponding decisive cells’ selection is only made in the corresponding SOC region.
In this way, just through a simple judgment of the voltage difference, the accurate selection of decisive cells can be realized. Furthermore, this rapid change in the OCV will not be affected by aging, which means our method can be applied to the whole lifetime of aging battery packs without any training.
2.3. Training-Free Characteristic Parameter Selection for Decisive Cells
For the selection of training-free characteristic parameters, two factors need to be considered. On the one hand, the selected parameters should be able to reflect both the SOC and SOH changes of cells to ensure that the cell state can be estimated by the detection of parameters changes; on the other hand, the changes in these parameters need to be regular and stable with aging. Thus, the resistance-related parameters are first excluded, and the parameters related to the equilibrium voltage or OCV are taken as the focus of the investigation.
It is noted that for capacity loss, there are two main aging mechanisms, i.e., the loss of lithium inventory (LLI) and the loss of active material (LAM), respectively [
25]. However, for lithium-ion batteries in the use stage of electric vehicles (i.e., the capacity loss rate is generally less than 20%), the capacity loss is mainly caused by the consumption of the lithium inventory, because of the formation and thickening of the SEI film on the surface of the negative electrode, and there is almost no LAM [
26,
27,
28]. So, only the influence of the LLI on the equilibrium voltage needs to be considered.
In addition, to ensure that the state estimation of decisive cells can still maintain good estimation accuracy under various load profiles, different training-free characteristic parameters are selected for different application scenarios based on the study of the aging mechanism.
2.3.1. Static Equilibrium Voltage
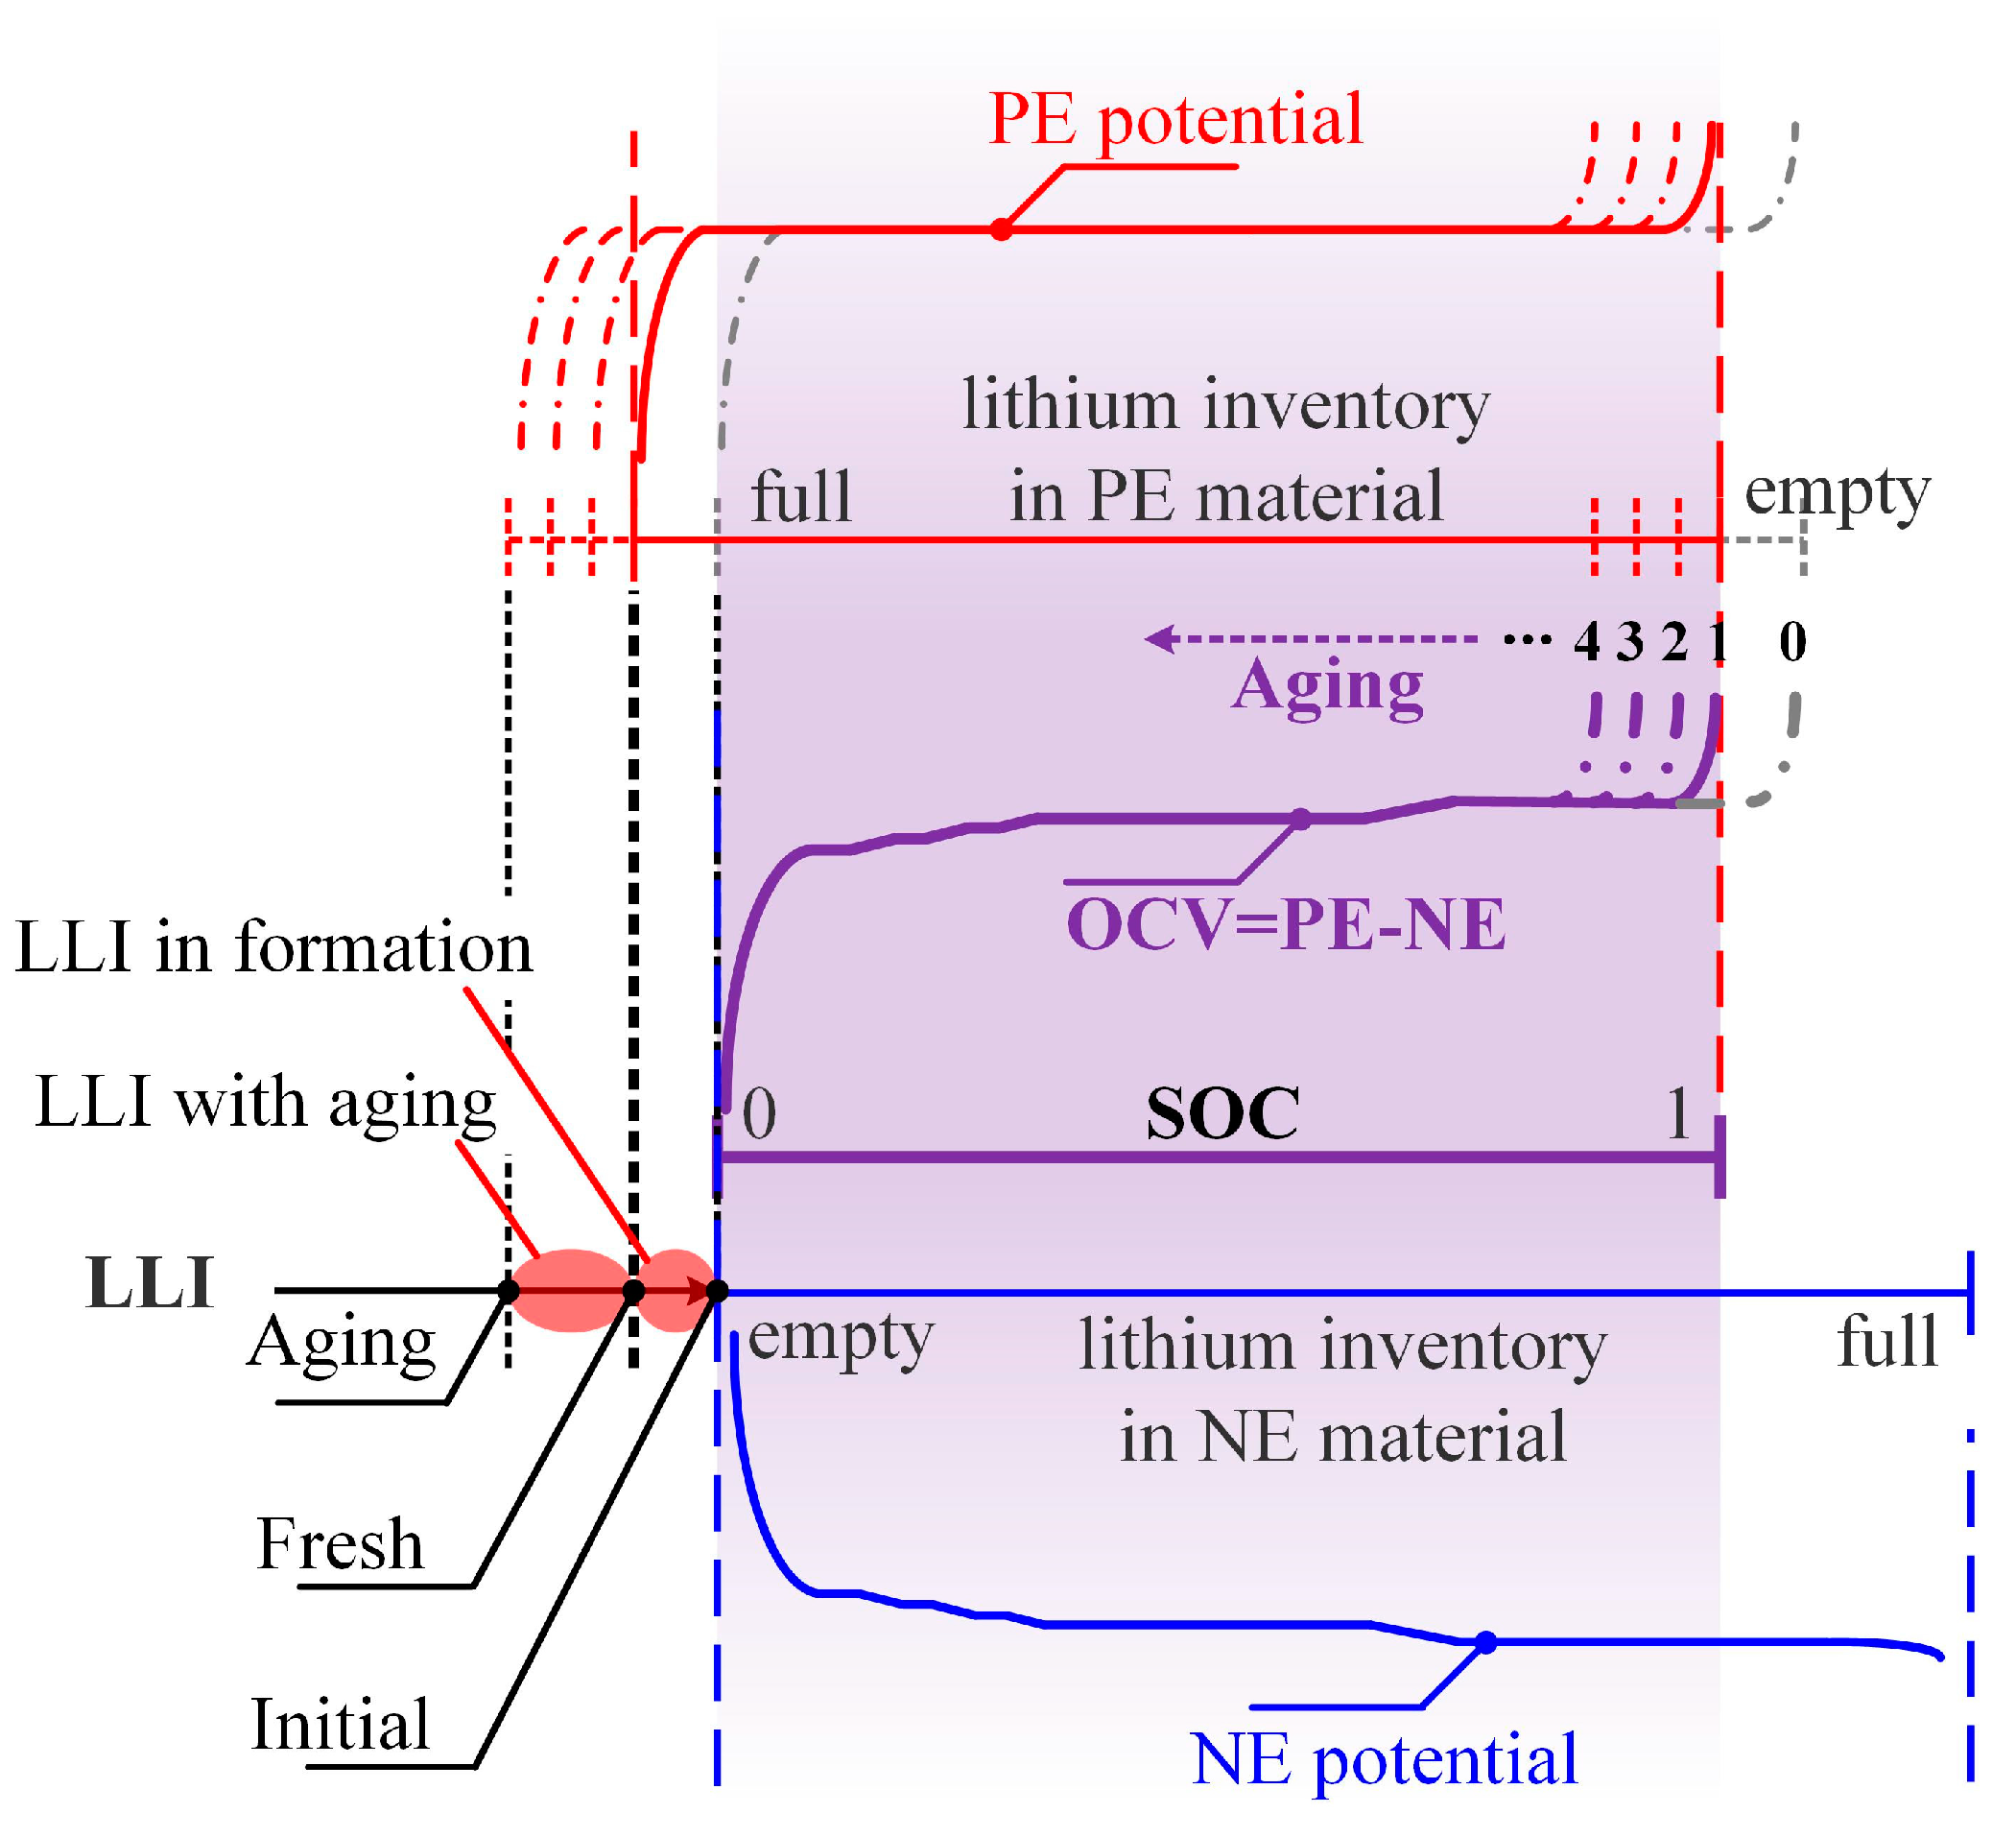
For a cell, the static equilibrium voltage is just its OCV. In lithium-ion batteries, the OCV of the battery comprehensively reflects its positive and negative electrode span and the matching relationship between them [
29]. As shown in
Figure 2, the OCV is determined by the difference between the positive electrode (PE) potential and negative electrode (NE) potential. Therefore, when battery aging affects the relative position relationship between the PE and NE curves, the OCV curve will also change accordingly, whereby the lithium (PE) axis in the positive electrode material and the lithium (NE) axis in the negative electrode material will present the complete positive and negative potential curves with the change in the lithium intercalation rate, where ‘empty’ means that the lithium intercalation rate in the corresponding active material is 0% and ‘full’ means the lithium intercalation rate in the corresponding active material is 100%.
Along with the loss of lithium inventory (including the LLI in the formation process), both the PE and NE materials will show a growing surplus for the remaining lithium ions [
30]. Because both the lithium-poor ends of the PE and NE can always become ‘empty’ as the cut-off conditions for battery charge and discharge respectively, all the surplus lithium will be located on the lithium-rich end of the PE and NE. Thus, from
Figure 2, it can be observed that the horizontal distance between the PE’s rich end and the NE’s poor end (or that between the PE’s poor end and the NE’s rich end) will continue to increase with the growing LLI. In other words, there will be an increasing horizontal shift between the PE and NE curves with the deepening of battery aging. Thus, for a full battery, the changes in the OCV curve can be concluded as follows: as the battery ages, the corresponding relationship between the OCV and SOC will not change in most SOC ranges but only exhibit the gradual disappearance of the voltage platform in the high SOC region. This law provides a good theoretical basis for the training-free estimation of battery states.
2.3.2. Dynamic Equilibrium Voltage
Different equilibrium voltages will be used for different operating profiles. The dynamic equilibrium voltage (DEV) is the online identified equilibrium voltage by the equivalent circuit model, which is based on the OCV and includes the extra voltage behaviors of the phase formation and phase exchange process in a multi-particle system [
31]. Because it only superimposes the influence of the phase stability link on the basis of the OCV, the influence of the phase stability link will directly determine the change trend of the DEV during the aging process. During the aging process of the vehicle stage, capacity loss is mainly caused by the LLI, but the change in the phase stability link depends more on the occurrence of LAM. Therefore, the overpotential corresponding to the phase stability link of the battery will hardly change. The DEV curve will reflect the same change law as the OCV.
2.3.3. Steady Equilibrium Voltage
The steady equilibrium voltage (SEV) is the steady-state voltage measured in the constant current profile or constant power profile, which contains both the effect of the OCV and resistance on the battery voltage [
32]. With battery aging, its behavior will exhibit an apparent upward trend, and as the current increases, the trend will further increase. But, this upward trend only leads to an overall rise in the SEV curve and will not influence the change law of the curve. Thus, it will also reflect the same change law as the OCV.
2.4. SOC Estimation for Decisive Cells Based on Multi-Approach Fusion
Since batteries will go through different working scenarios, using a single estimation method may result in large estimation errors. To reduce this error, four different estimation approaches are effectively combined by their respective dynamic weights. They are the coulomb counting method for the basic, OCV-based method for the static operating condition, DEV-based method for the dynamic operating condition, and SEV-based method for the charging operating condition, respectively.
By analyzing the specific scenario of the battery and the possible errors caused by the estimation methods, these methods are effectively combined through the dynamic weights. The specific calculation formula is shown in Equation (9).
where
is the absolute SOC of cells;
and
are the SOC and weight obtained by the coulomb counting method;
and
are the SOC and weight obtained by the OCV method;
and
are the SOC and weight obtained by the DEV method based on the equivalent circuit model;
and
are the SOC and weight obtained by the charging matching method; and
sum(
w) is the sum of weight.
2.4.1. The SOC and Weight in the Coulomb Counting Method
The coulomb counting method estimates the battery
by accumulating the change of the electric quantity [
33,
34]. It is shown in Equation (10).
where
SOC0 is the initial SOC of cells;
ηchg is the charge–discharge coulombic efficiency of cells;
Icell is the current through the cells;
t is the working time; and
is the initial capacity of fresh cells.
For the coulomb counting method, as an open-loop method, though the SOCCC estimation result will gradually deviate from the true value, it can maintain good accuracy in a short period of time. Thus, its weight will not change, and it is set to 0.5 in our method.
2.4.2. The SOC and Weight in the Open Circuit Voltage Method
When the battery is completely open and fully static, the OCV will become the best observation for
SOCOCV estimation [
35,
36]. However, considering that the slope of the OCV-SOC curve in the flat area is very small, the small OCV measurement error in these regions will lead to a large estimation error. By analyzing the possible errors and combining the specific curve forms in different regions, a method of dynamic weight distribution is proposed. The specific algorithm of the weight distribution is seen in Algorithm 1.
| Algorithm 1. The specific algorithm of the weight distribution. |
| Step 1: The possible maximum error caused by the measurement error and prediction error can be obtained as shown in Equation (11) [37]. |
| (11) |
| where δOCV is the overall error of the OCV; δUm is the measurement error; and δUp is the prediction error. |
| Step 2: The possible SOC error at each OCV point can be obtained by calculating the SOC difference between and [38]. It is shown in Equation (12) |
| (12) |
| where δSOCOCV is the SOC error generated by the overall error of the OCV; and FOCV-SOC is the relationship function of the battery OCV-SOC. |
| Step 3: The dynamic weight at each OCV point is obtained. |
| (a): If the δSOCOCV at a certain OCV point is more than the actual SOC maximum allowable error δmaxSOCOCV, the weight is set to 0. |
| (b): Otherwise, the weight is calculated using Equation (13). |
| (13) |
| where δmaxSOCOCV is the maximum allowable error for SOC estimation. |
For a fresh cell, the weight of the OCV method will change continuously between 0 and 1. However, considering the characteristic that the voltage curve gradually disappears in the high SOC area after battery aging, is selected as the threshold, and the weight is set to 0 when the is higher than 0.7.
2.4.3. The SOC and Weight in the Equivalent Circuit Method
When the battery is in a dynamic state, the DEV will be identified online by the equivalent circuit model using a recursive least squares method, and the
SOCDEV estimation is realized through the corresponding relationship between the DEV and SOC [
39,
40]. The weight of the DEV curve is also set by Algorithm 1. When the battery is in non-dynamic operating conditions or its
is greater than 0.7, the weight will be set to 0.
2.4.4. The SOC and Weight in the Charging Matching Method
When the battery is in a constant current charging state, the SEV will be the best observation for
estimation [
41,
42]. However, due to the SEV curve showing an overall upward and downward trend at different charging rates, this results in the fact that the SOC cannot be accurately estimated through only the existing correspondence between the SEV and SOC. To remove this effect, the characteristic that the change law of the SEV curve does not change with the charging rate is utilized. Through this characteristic, the accurate curve matching between the current and existing SEV curves can be achieved by correlation analysis of the curve change law. The
estimation can be realized through the corresponding relationship between the SEV and SOC after matching. The correlation is achieved by calculating the Pearson correlation coefficient [
43]. To elaborate further, when the correlation coefficient is less than 0.95, the weight of the SEV curve is set to 0. The main purpose of this design is to ensure an accurate estimation when the correlation is weak. In addition, the weight of the SEV curve is set to 0.5, and when the
is higher than 0.7, the weight of the SEV curve is set to 0.
2.5. SOH Estimation for Decisive Cells Based on the Aging Law of Equilibrium Voltages
This section introduces a novel approach to estimating the SOH of decisive cells in this paper. By utilizing the aging law of characteristic parameters that only exhibit local curve shrinkage with aging, the SOH estimation of cells can be realized.
Based on the estimated
and using the aging law of the equilibrium voltages (i.e., the corresponding relationship between the equilibrium voltages and SOC will not change in most SOC ranges but only exhibit the gradual disappearance of the voltage platform in the high SOC region), the SOH estimation of cells will be introduced in this part. Considering the unavoidable charging behavior of the user after the vehicle is used, the SEV is the best selection for SOH estimation here. Due to the characteristic that the SEV curve will show an increasing horizontal shift with the deepening of battery aging, the aging degree of batteries can be reflected by the distance of horizontal shift compared with the SEV curve of the new battery. To obtain the distance, the estimation methods of
and
are analyzed separately. On the one hand, for the
, the
is estimated by the corresponding relationship of the fresh battery curve. This means that in the high SOC region, the
and the real SOC will have a difference, and the difference is the distance of capacity loss. On the other hand, for the
, due to dynamic weight setting, when the
is higher than 0.7,
is obtained by the coulomb counting method, and this
can be approximated as the real SOC. In this way, the distance of horizontal shift can be calculated by the difference in the
and
. In addition, to ensure the accuracy of the SOH, only when the
is higher than 0.95, the SOH starts to be estimated. The SOH is calculated using Equation (14).
where
is the state of health of cells;
is the SOC obtained by the charging matching method; and
is the absolute SOC of cells.
3. Experimental Design
3.1. Test Objects and Specific Experiments
In this paper, 4 lithium iron phosphate (LiFePO4) batteries of 202Ah were selected as the test objects and named Cell 1, Cell 2, Cell 3, and Cell 4, respectively. To verify the law of equilibrium voltages and ensure the feasibility of training-free estimation, the characteristic test experiments and cyclic aging experiments are firstly designed for each equilibrium voltage curve. Additionally, to test the state estimation accuracy of cells and packs under various load profiles, these 4 batteries are connected in series to make up a battery pack. The working condition verification experiments are designed for this battery pack. The specific experiments are as follows:
- (1)
Capacity test (CAP test): After the battery is fully charged, the battery is discharged at a constant current of 1/2 C. The electric quantity discharged during this process is used as the capacity.
- (2)
Characteristic test experiment: It consists of 3 parts: open circuit voltage test (OCV Test), dynamic equilibrium voltage test (DEV Test) and steady equilibrium voltage test (SEV Test). For the OCV test, it is realized by discharging 5% of the battery capacity with 1/2 C, while the rest of the SOC range is obtained by interpolation. For the DEV test, it is realized by the FUDS profiles with a maximum discharge power of 1.00 C. For the SEV test, it is achieved by charging the battery with a constant current at 0.50 C, 0.75 C and 1.00 C. And these experiments are repeated at 10 °C, 25 °C and 40 °C.
- (3)
Cyclic aging experiment (CYC Exp): It consists of two parts: the conventional aging and the high temperature-accelerated aging. For the conventional aging, the battery is fully charged and discharged at 1.00 C at 25 °C. For the high temperature-accelerated aging, the battery is fully charged and discharged at 1.00 C at 60 °C, wherein a high temperatures (60 °C) condition is selected to accelerate the aging process. In addition, the CAP test is conducted after every 100 cycles.
- (4)
Working condition verification experiment: It consists of two parts: the stable working condition experiment (STB Test) oriented to constant current charging conditions and the dynamic working condition experiment (DYN Test) oriented to dynamic DST conditions. Among them, the STB Test is realized under the constant current charging condition of 100A, while the DYN Test is realized under the DST condition with the maximum current of 100A.
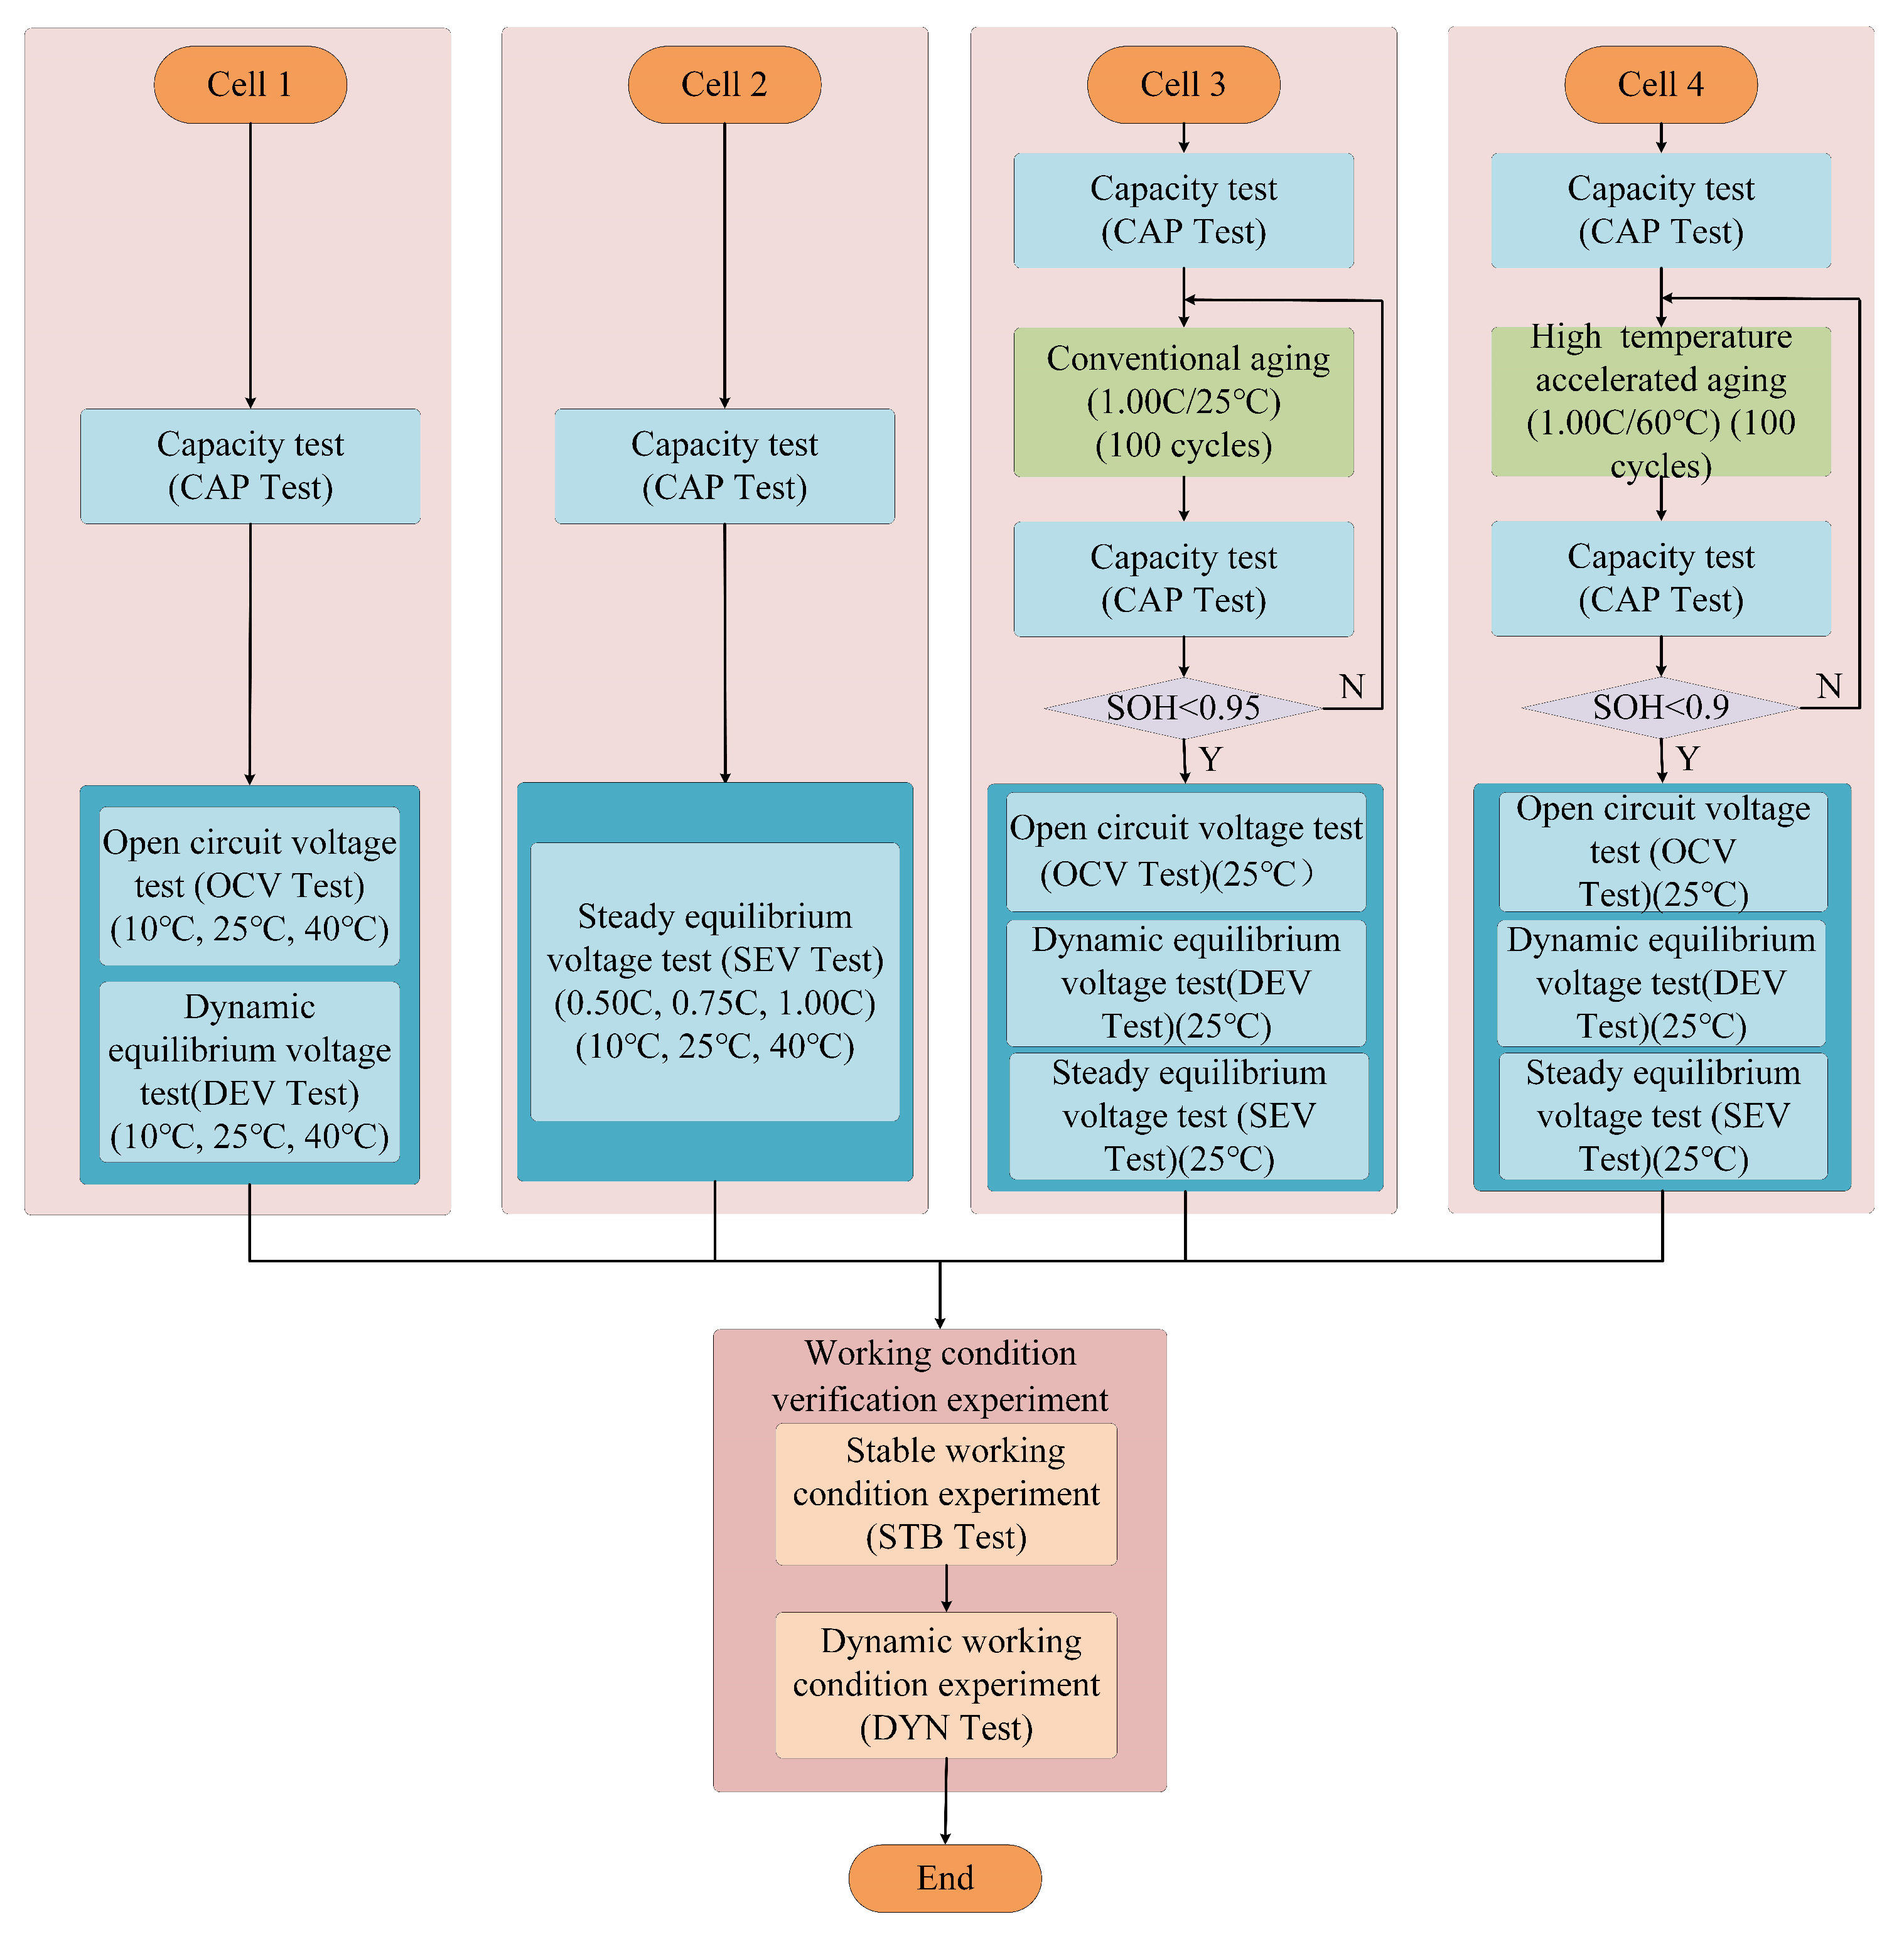
3.2. The Experimental Process and Arrangements
In this experiment, the 4 batteries are carried out with different experimental processes. For Cell 1, the OCV and DEV curves at different temperatures (10 °C, 25 °C, 40 °C) are obtained by the OCV Test and DEV Test. For Cell 2, the SEV curves at different temperatures (10 °C, 25 °C, 40 °C) and charging rates (0.50 C, 0.75 C, 1.00 C) are obtained by the SEV Test. For Cell 3, the OCV, DEV and SEV curves at SOH = 0.95 are obtained by conventional aging and characteristic test experiments. For Cell 4, the OCV, DEV and SEV curves at SOH = 0.9 are obtained by high temperature-accelerated aging and characteristic test experiments. On this basis, the law of equilibrium voltages and the feasibility of training-free estimation can be verified.
Then, 4 batteries are connected in series to make up a battery pack. Since the results of the proposed battery pack estimation method are determined by two decisive cells, a battery pack composed of 4 cells is enough to test the state estimation methods of the battery pack. To better verify the estimation accuracy of packs under various load profiles, the imbalance among the cells in packs is introduced. These 4 batteries are connected in series with different initial SOC and SOH to form a battery pack. The specific experiment process is shown in
Figure 3. According to the overall experimental process, with 4 experimental channels, the specific experimental arrangement is shown in
Table 1.
4. Results and Discussion
The experimental results and discussions are introduced in this section. Firstly, the equilibrium voltage curve of batteries is provided and analyzed. Through these characteristic curves, the feasibility of training-free estimation is demonstrated. Then, the SOC and SOH estimation results of the cells and the dynamic weights of the different methods are provided. Finally, the state estimation results for the battery packs are provided and analyzed.
4.1. Analysis of Equilibrium Voltage Characteristic Curve
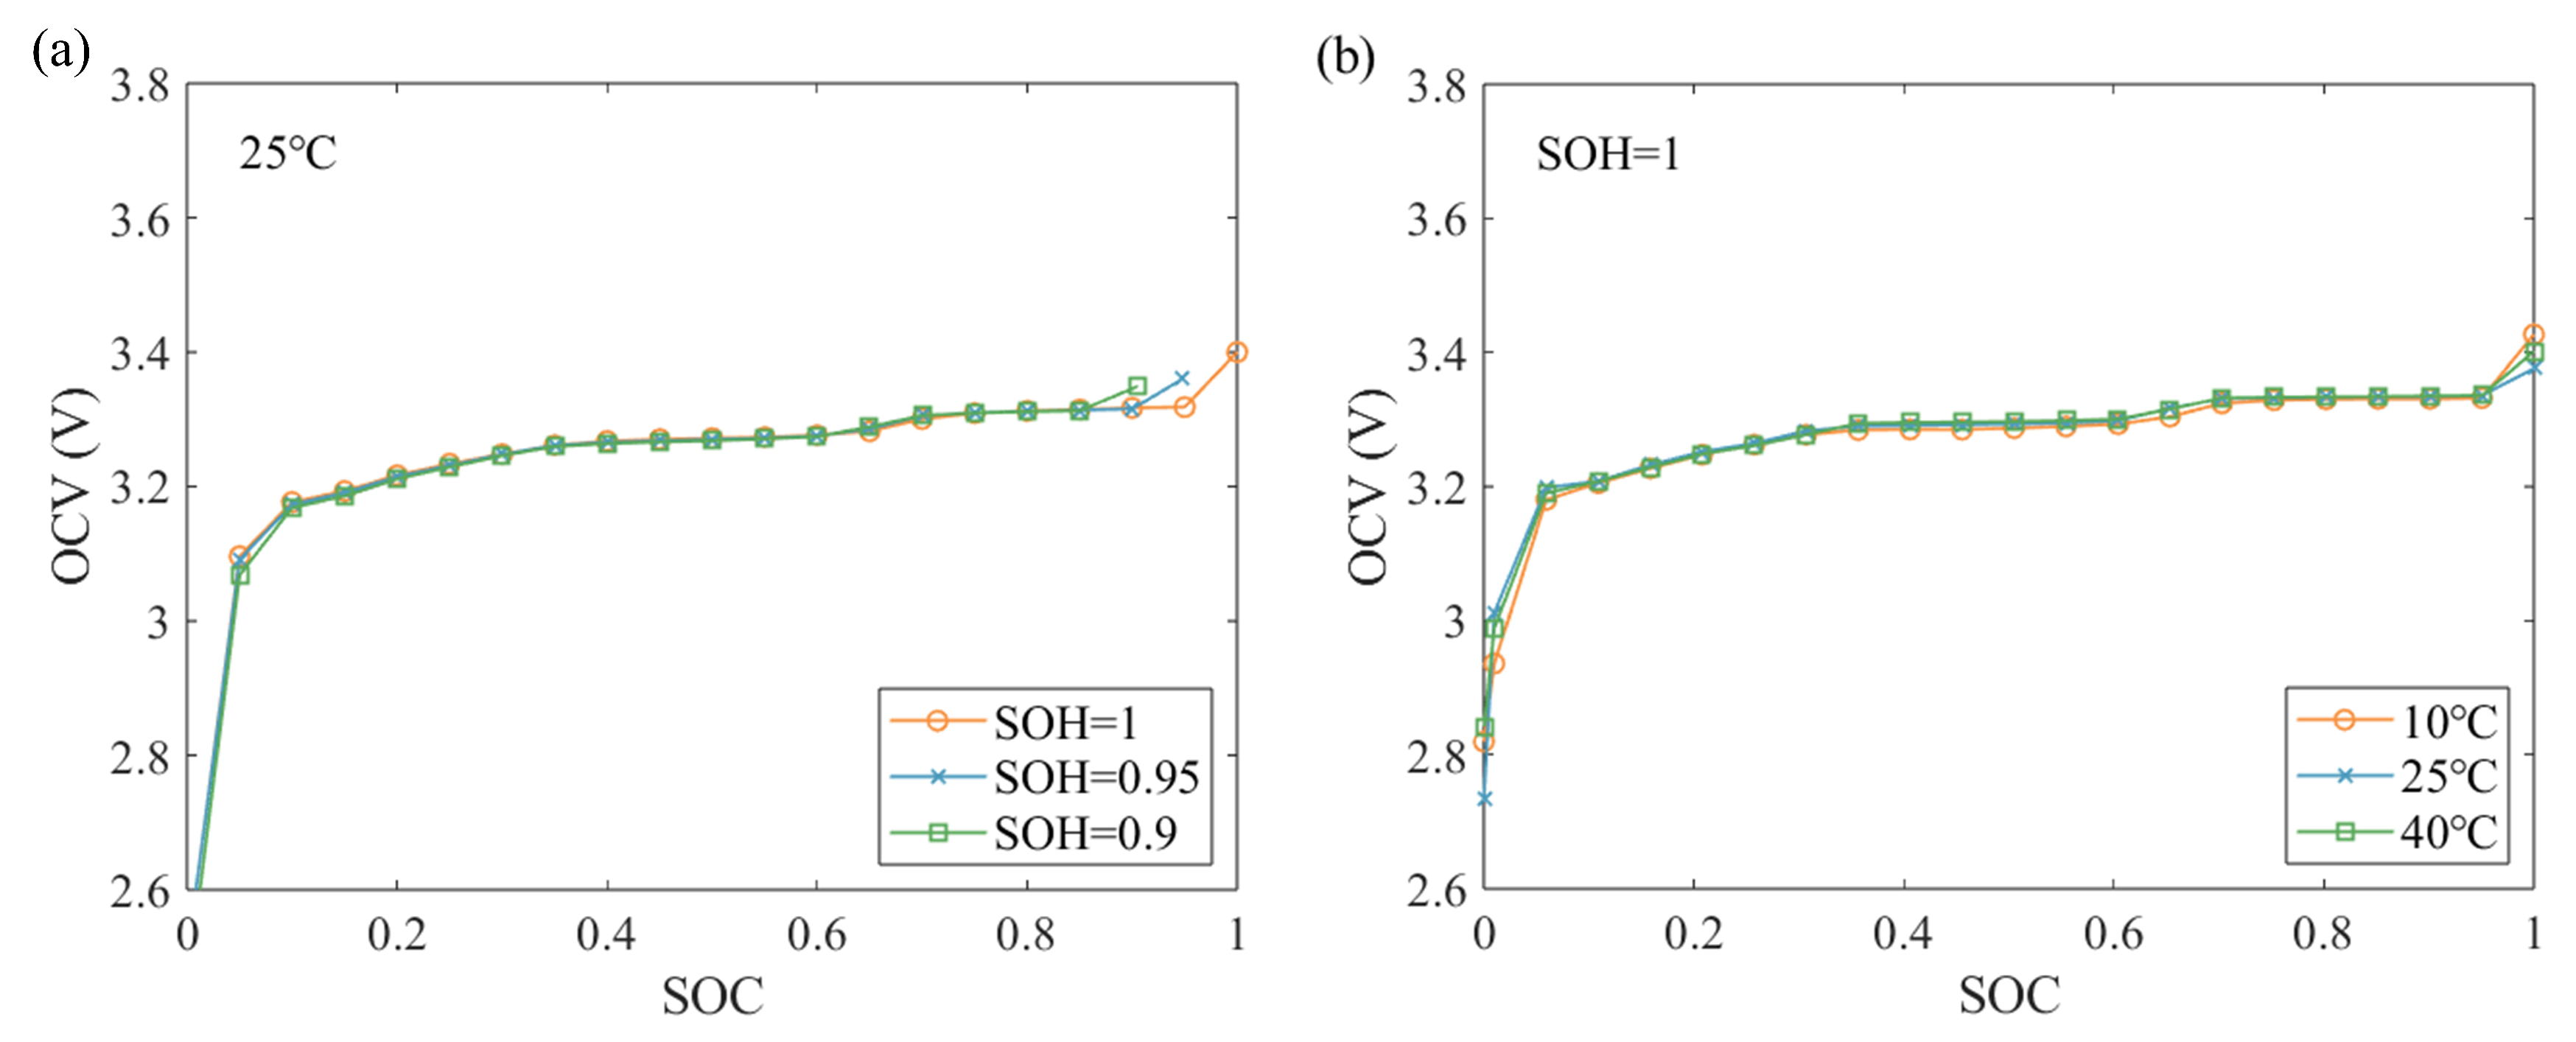
4.1.1. Analysis of OCV Curve Characteristic
As depicted in
Figure 4a, with battery aging, the OCV curves at 25 °C only disappear in the high SOC region, while in other areas of the SOC, the OCV curves still maintain a good consistency with a negligeable difference at SOH = 1, 0.95 and 0.9. In addition, as shown in
Figure 4b, in most SOC ranges, the OCV curves still maintain a good consistency at 10 °C, 25 °C and 40 °C for the fresh battery. This ensures that the OCV curves of the current temperature obtained by interpolation can still have the same curve change law as the OCV. And this proves under the condition of considering the temperature effect that the OCV curve obtained by interpolation can still be used for training-free estimation.
4.1.2. Analysis of DEV Curve Characteristic
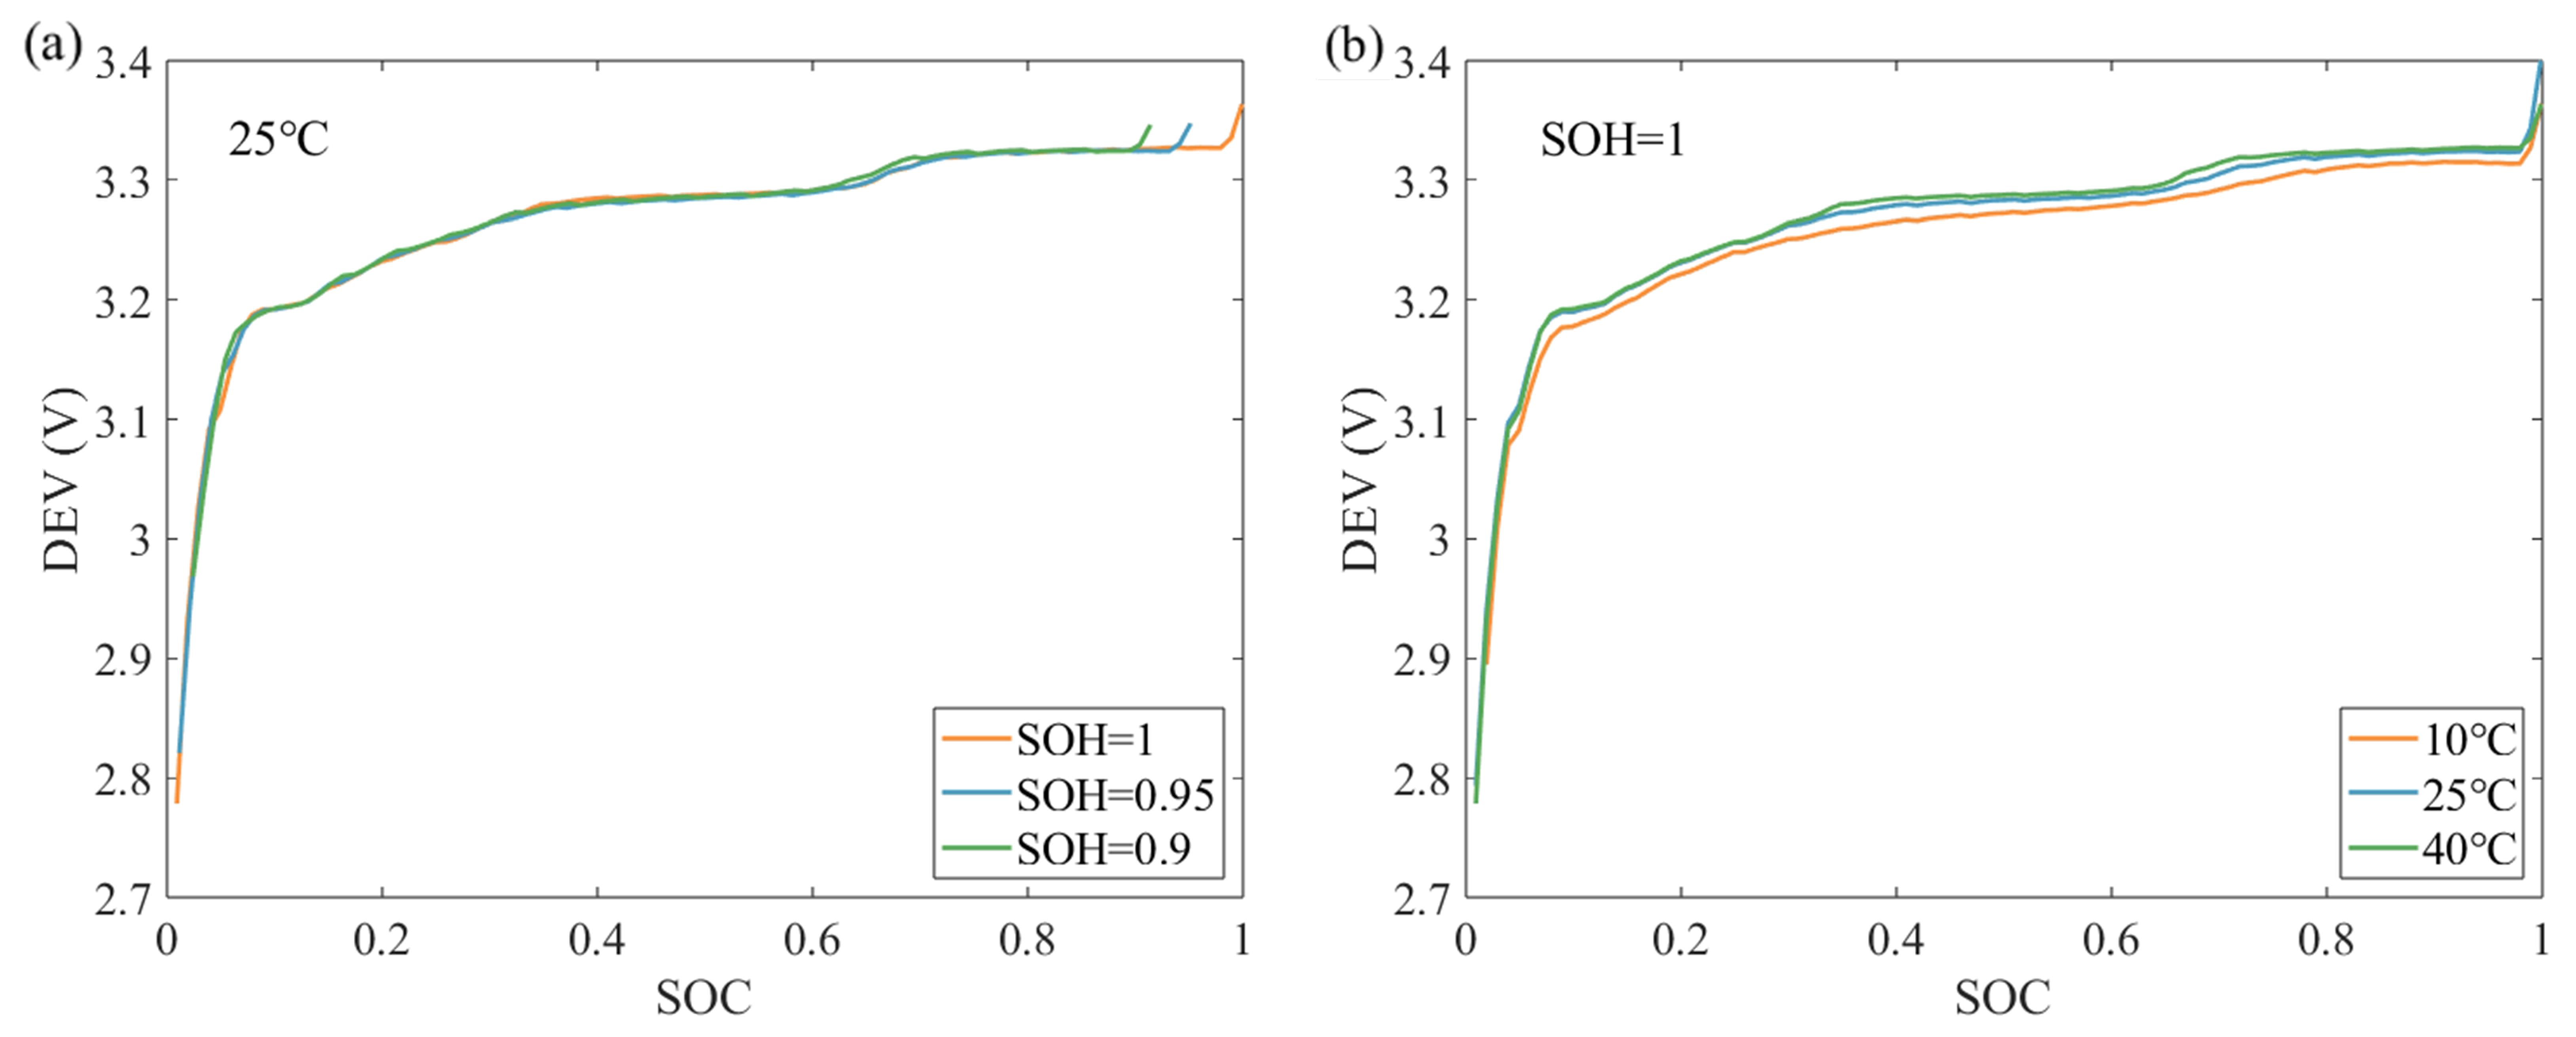
The DEV curves are obtained through recursive least squares identification under dynamic conditions. As shown in
Figure 5a, it can be seen that at 25 °C, the change law of the DEV at SOH = 1, 0.95 and 0.9 is consistent with the change law of the OCV. And as shown in
Figure 5b, the DEV curves at 10 °C, 25 °C and 40 °C from the fresh battery also have the same curve change law as the OCV. This proves that the DEV curves of the current temperature obtained by interpolation can still be used for training-free estimation.
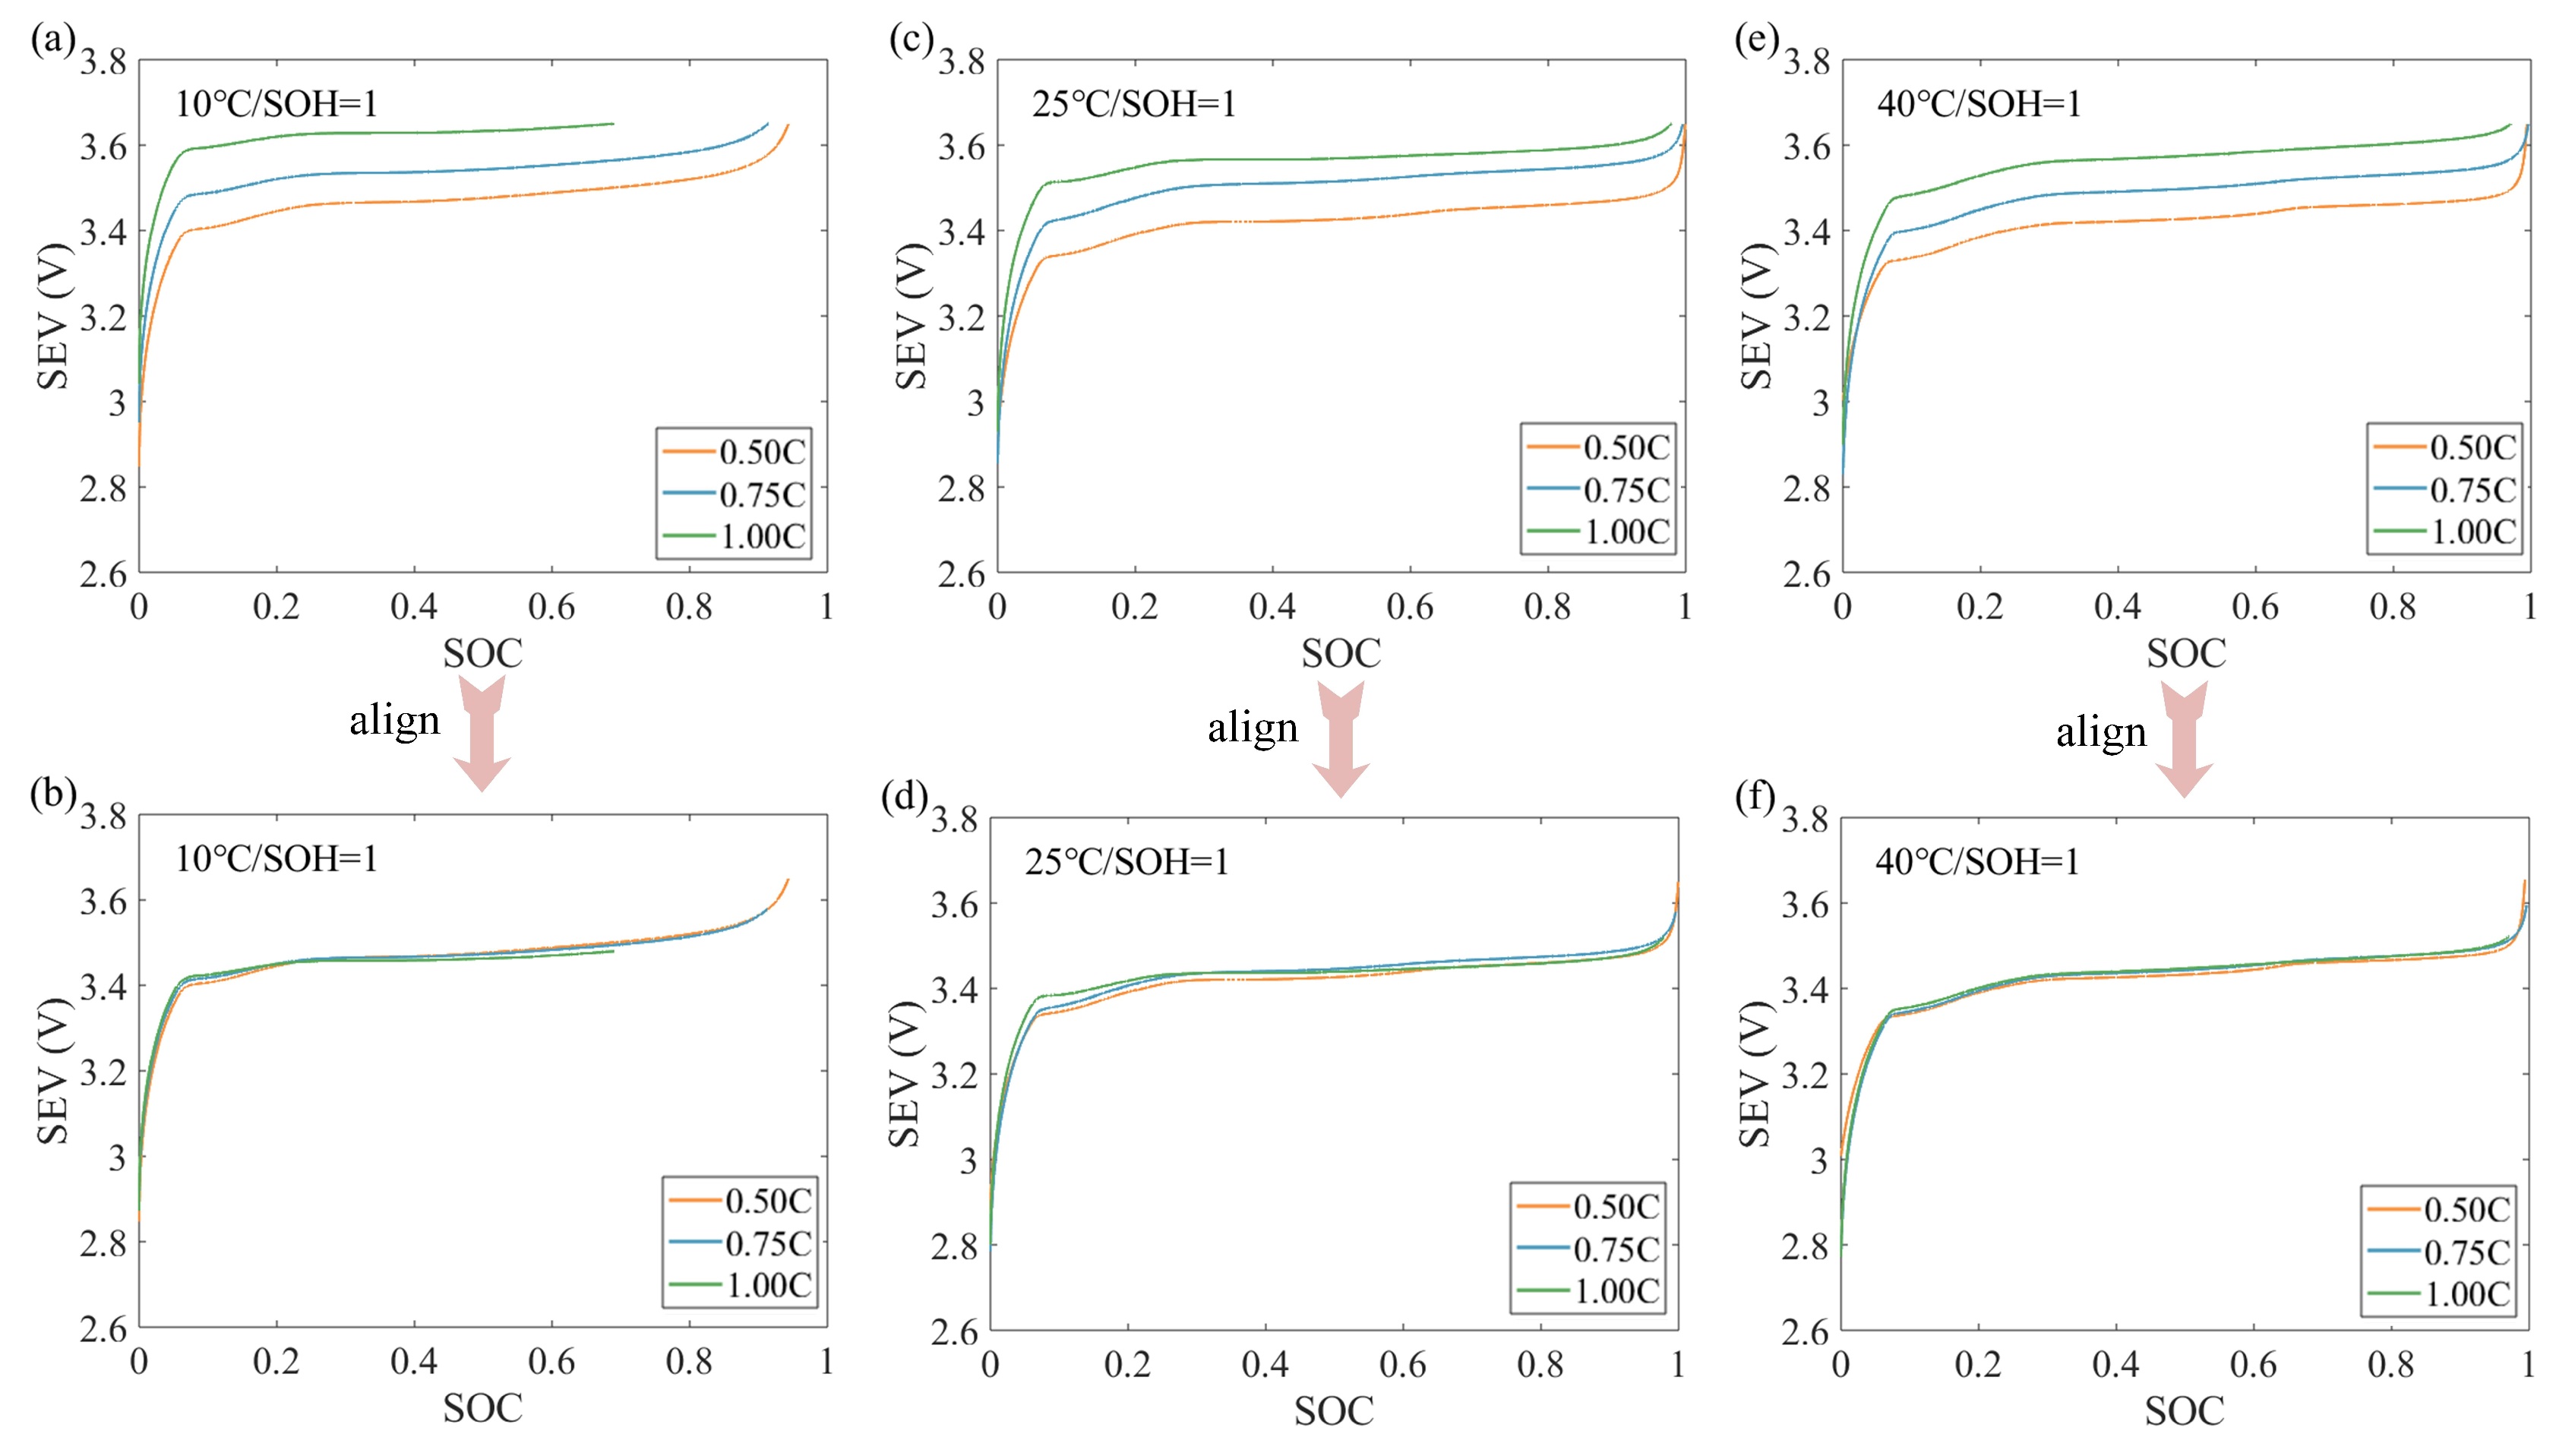
4.1.3. Analysis of SEV Curve Characteristic
For the SEV curves, firstly, the changing law of the voltage curve under different charging rates is discussed. As shown in
Figure 6a, it can be seen that the SEV curves at 10 °C show a certain upward trend from 0.50 C to 1.00 C. This is because under charging conditions, the SEV is affected by the voltage of internal resistance. And with the increase in the charge rate, the SEV curves will show an upward trend. But, as shown in
Figure 6b, they can still maintain a good consistency after the SEV curves are aligned. And, as shown in
Figure 6c,d, the SEV curves at 25 °C also maintain a good consistency at 0.50 C, 0.75 C and 1.00 C after the SEV curves are aligned. Finally, as shown in
Figure 6e,f, the SEV curves at 40 °C also maintain a good consistency at 0.50 C, 0.75 C and 1.00 C after the SEV curves are aligned. This proves that the change law of the SEV at 0.50 C, 0.75 C and 1.00 C is also consistent with the change law of the OCV.
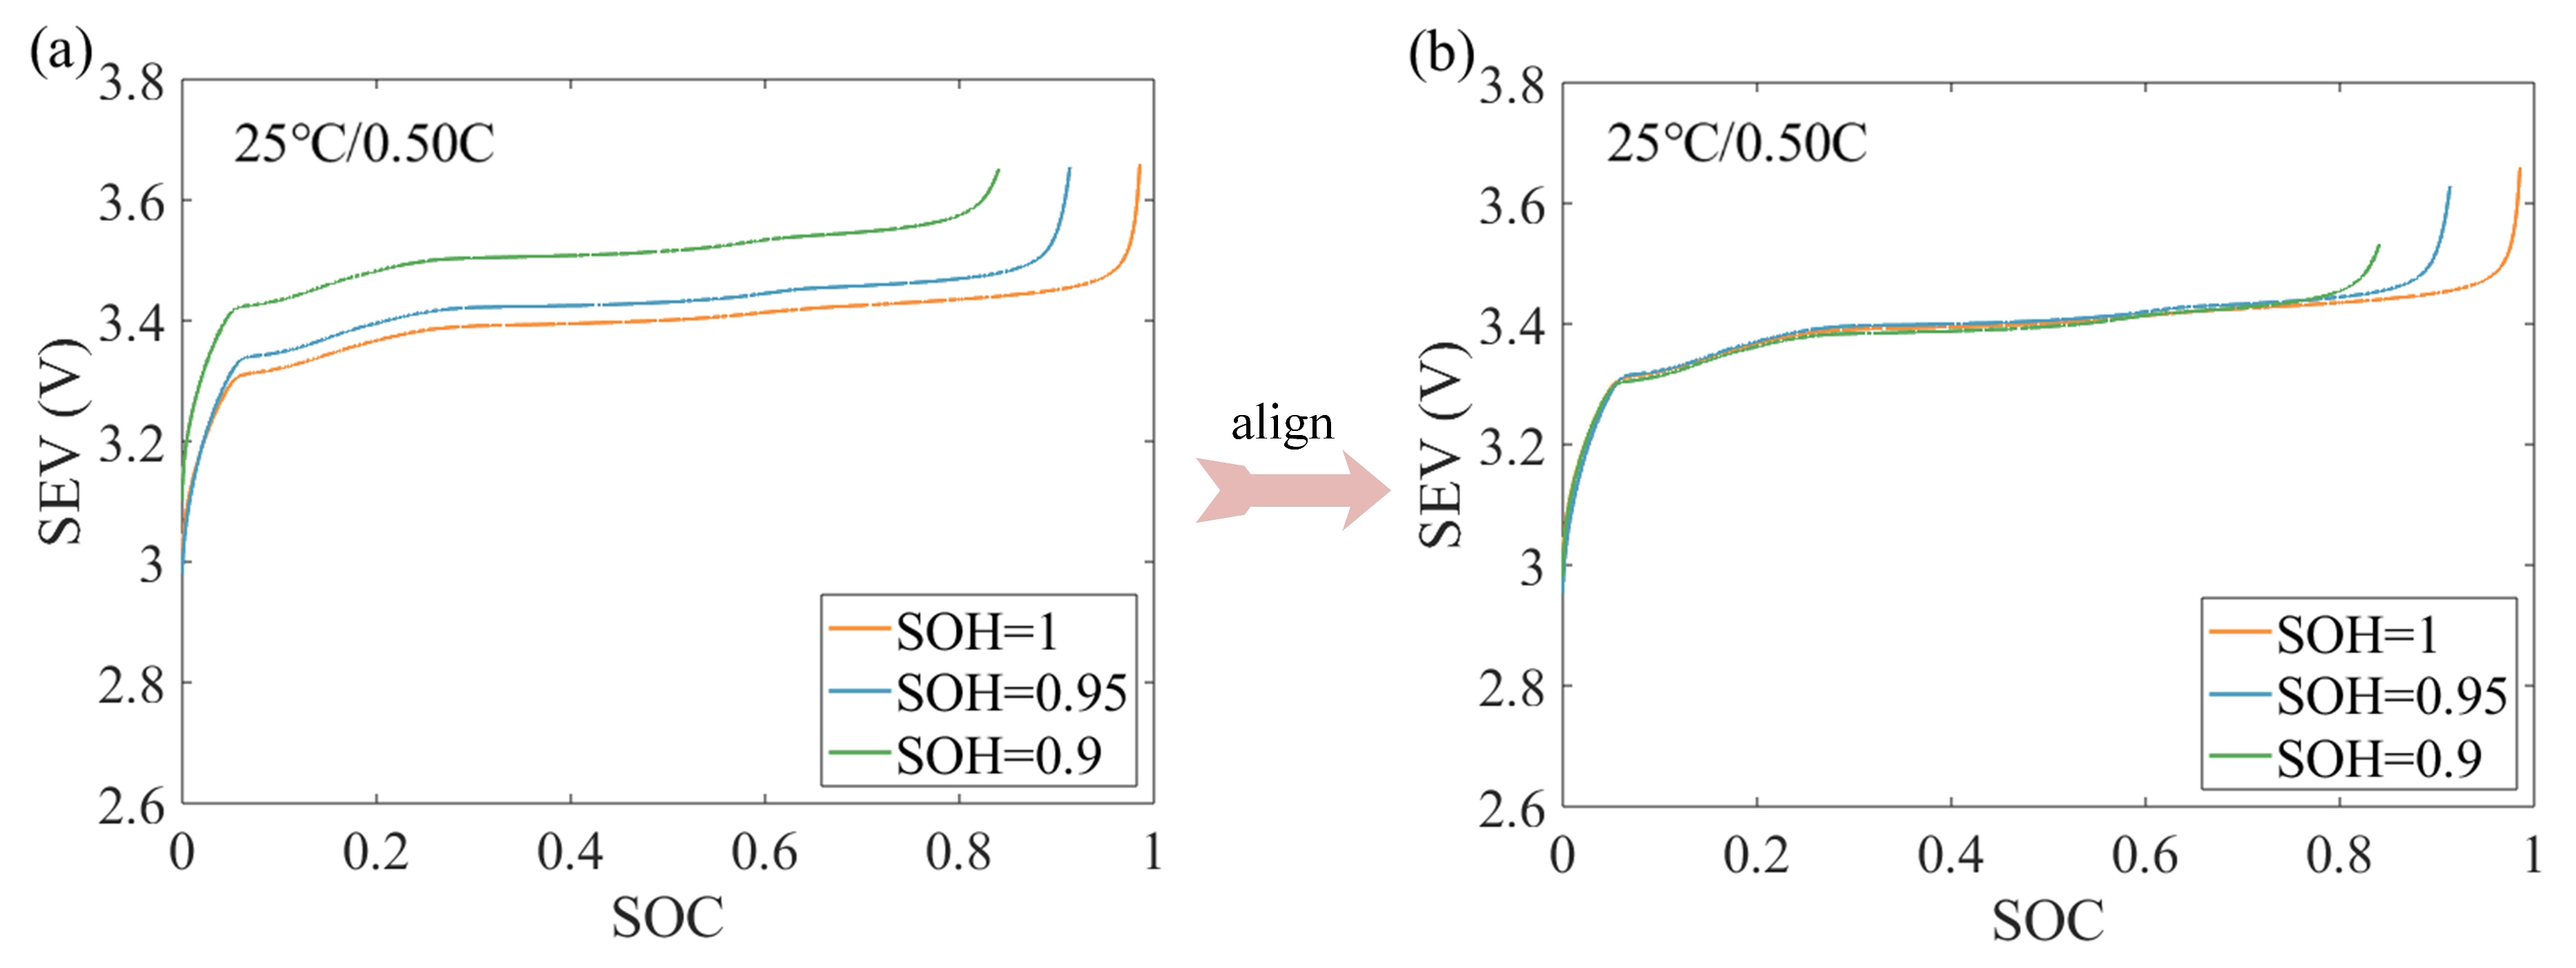
To study the aging law of the SEV curve more clearly, voltage curves with different aging degrees (SOH = 1, 0.95 and 0.9) at the same charging rate (0.50 C) and temperature (25 °C) are given, as shown in
Figure 7a. It can be seen that the SEV curves at SOH = 1, 0.95 and 0.9 have a certain rise with battery aging. This is because the internal resistance of the battery increases with the aging of the battery, which in turn affects the change in the SEV. However, as shown in
Figure 7b, it is not difficult to see that the SEV curves at SOH = 1, 0.95 and 0.9 also have almost the same change law as the OCV after alignment.
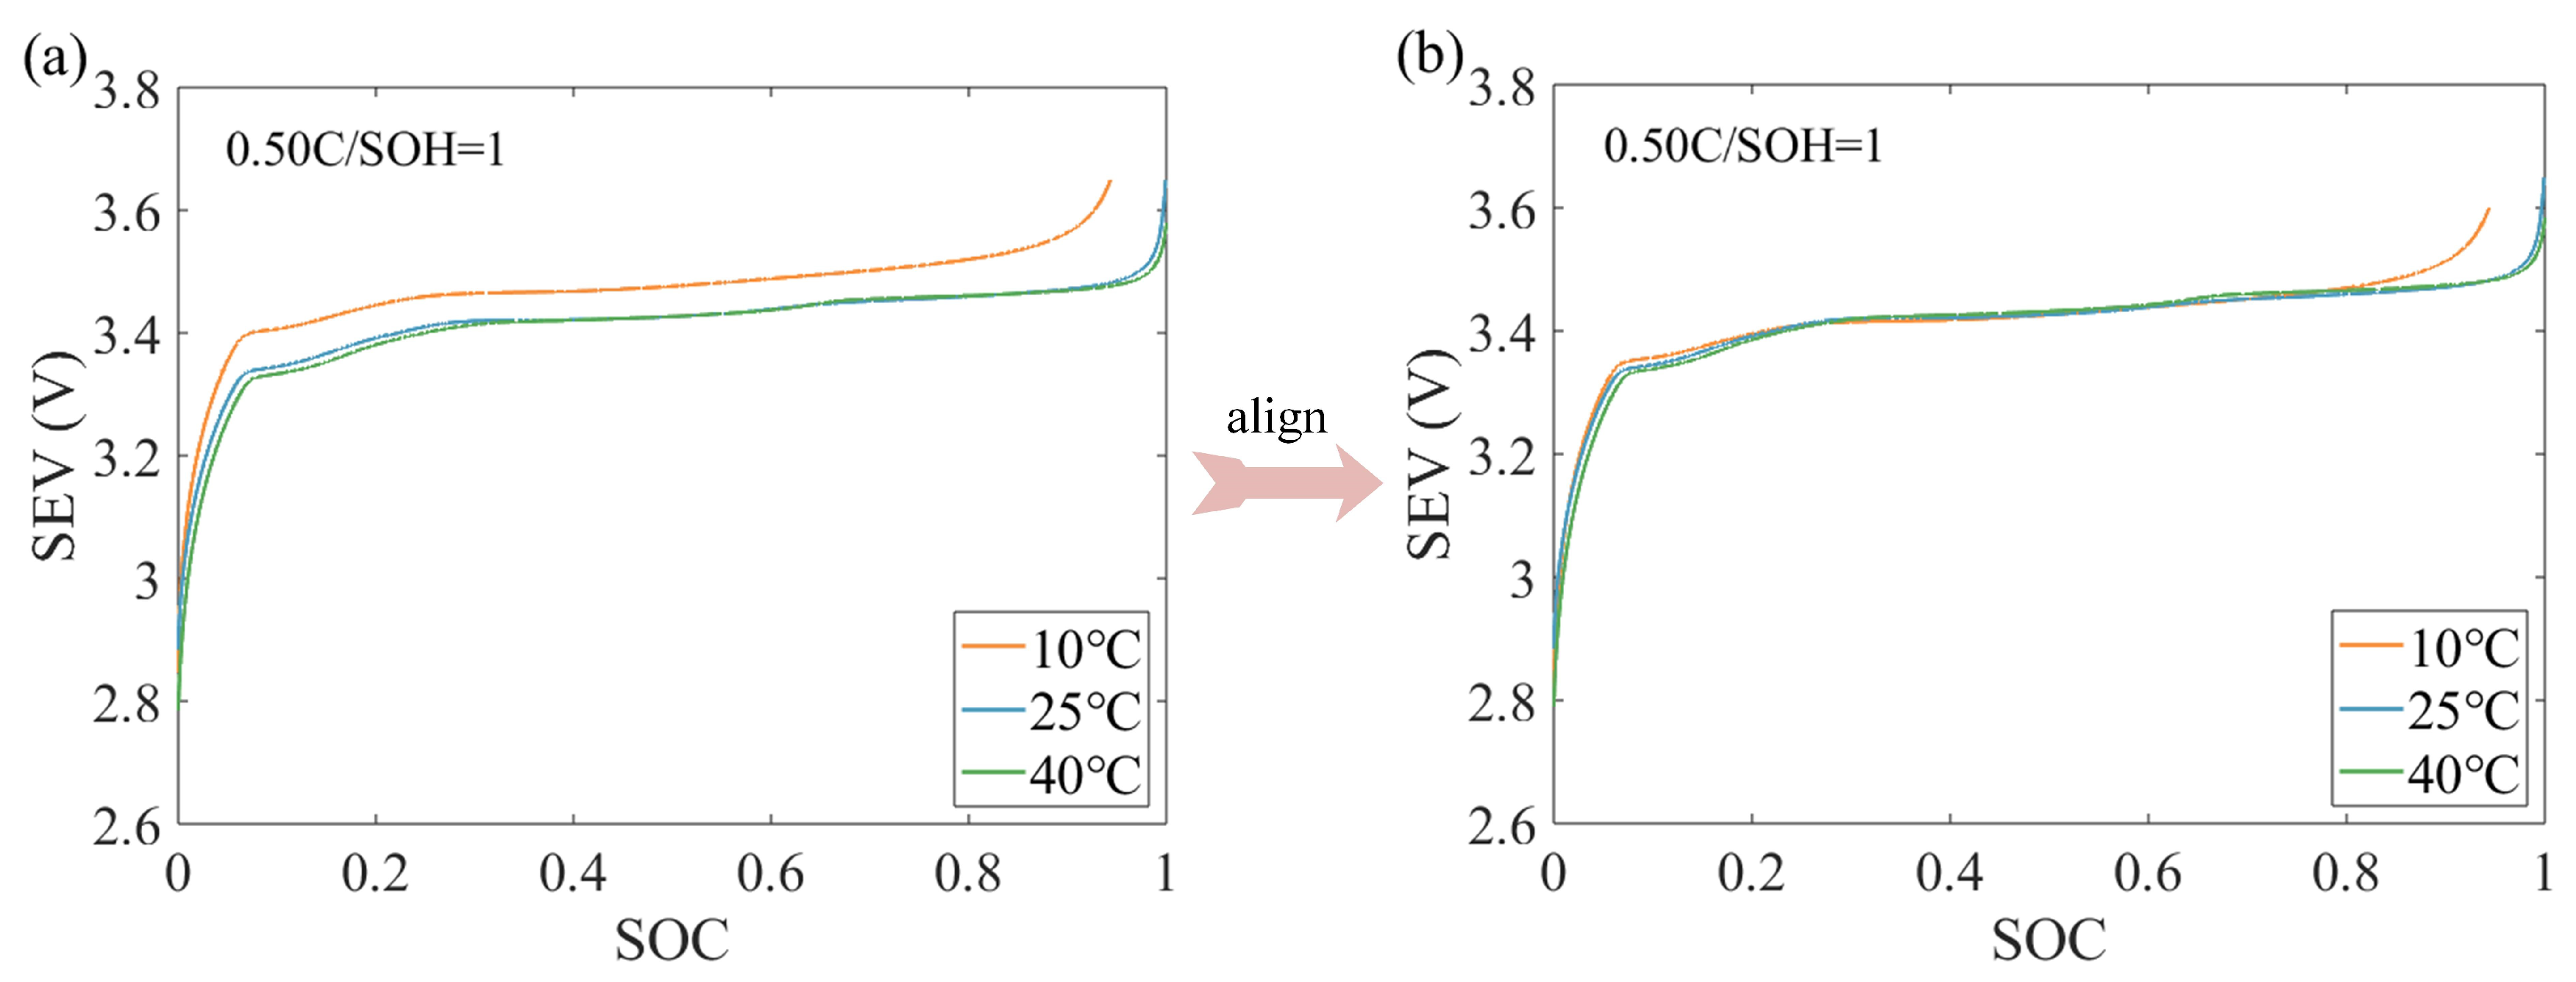
In addition, as shown in
Figure 8a, the SEV curves from the fresh battery with different temperatures (10 °C, 25 °C and 40 °C) at the same rate (0.50 C) and the same aging degree (SOH = 1) are displayed. And the aligned SEV curves at 10 °C, 25 °C and 40 °C also have the same curve change law as the OCV, as shown in
Figure 8b. This proves that the SEV curves of the current temperature obtained by interpolation can still be used for training-free estimation. And it should be noted that although the SEV curves under different conditions still have slight deviations after alignment, the
SOCSEV estimation error can be avoided by the charging matching method. This is because this method focuses more on the shape similarity of the SEV curves, i.e., as long as the curves maintain a good consistency in shape, the estimation of the
SOCSEV can maintain a good estimation accuracy.
Therefore, the feasibility of the selected characteristic parameters for training-free estimation is further demonstrated through these experiments.
4.2. SOC and SOH Estimation Results for Cells
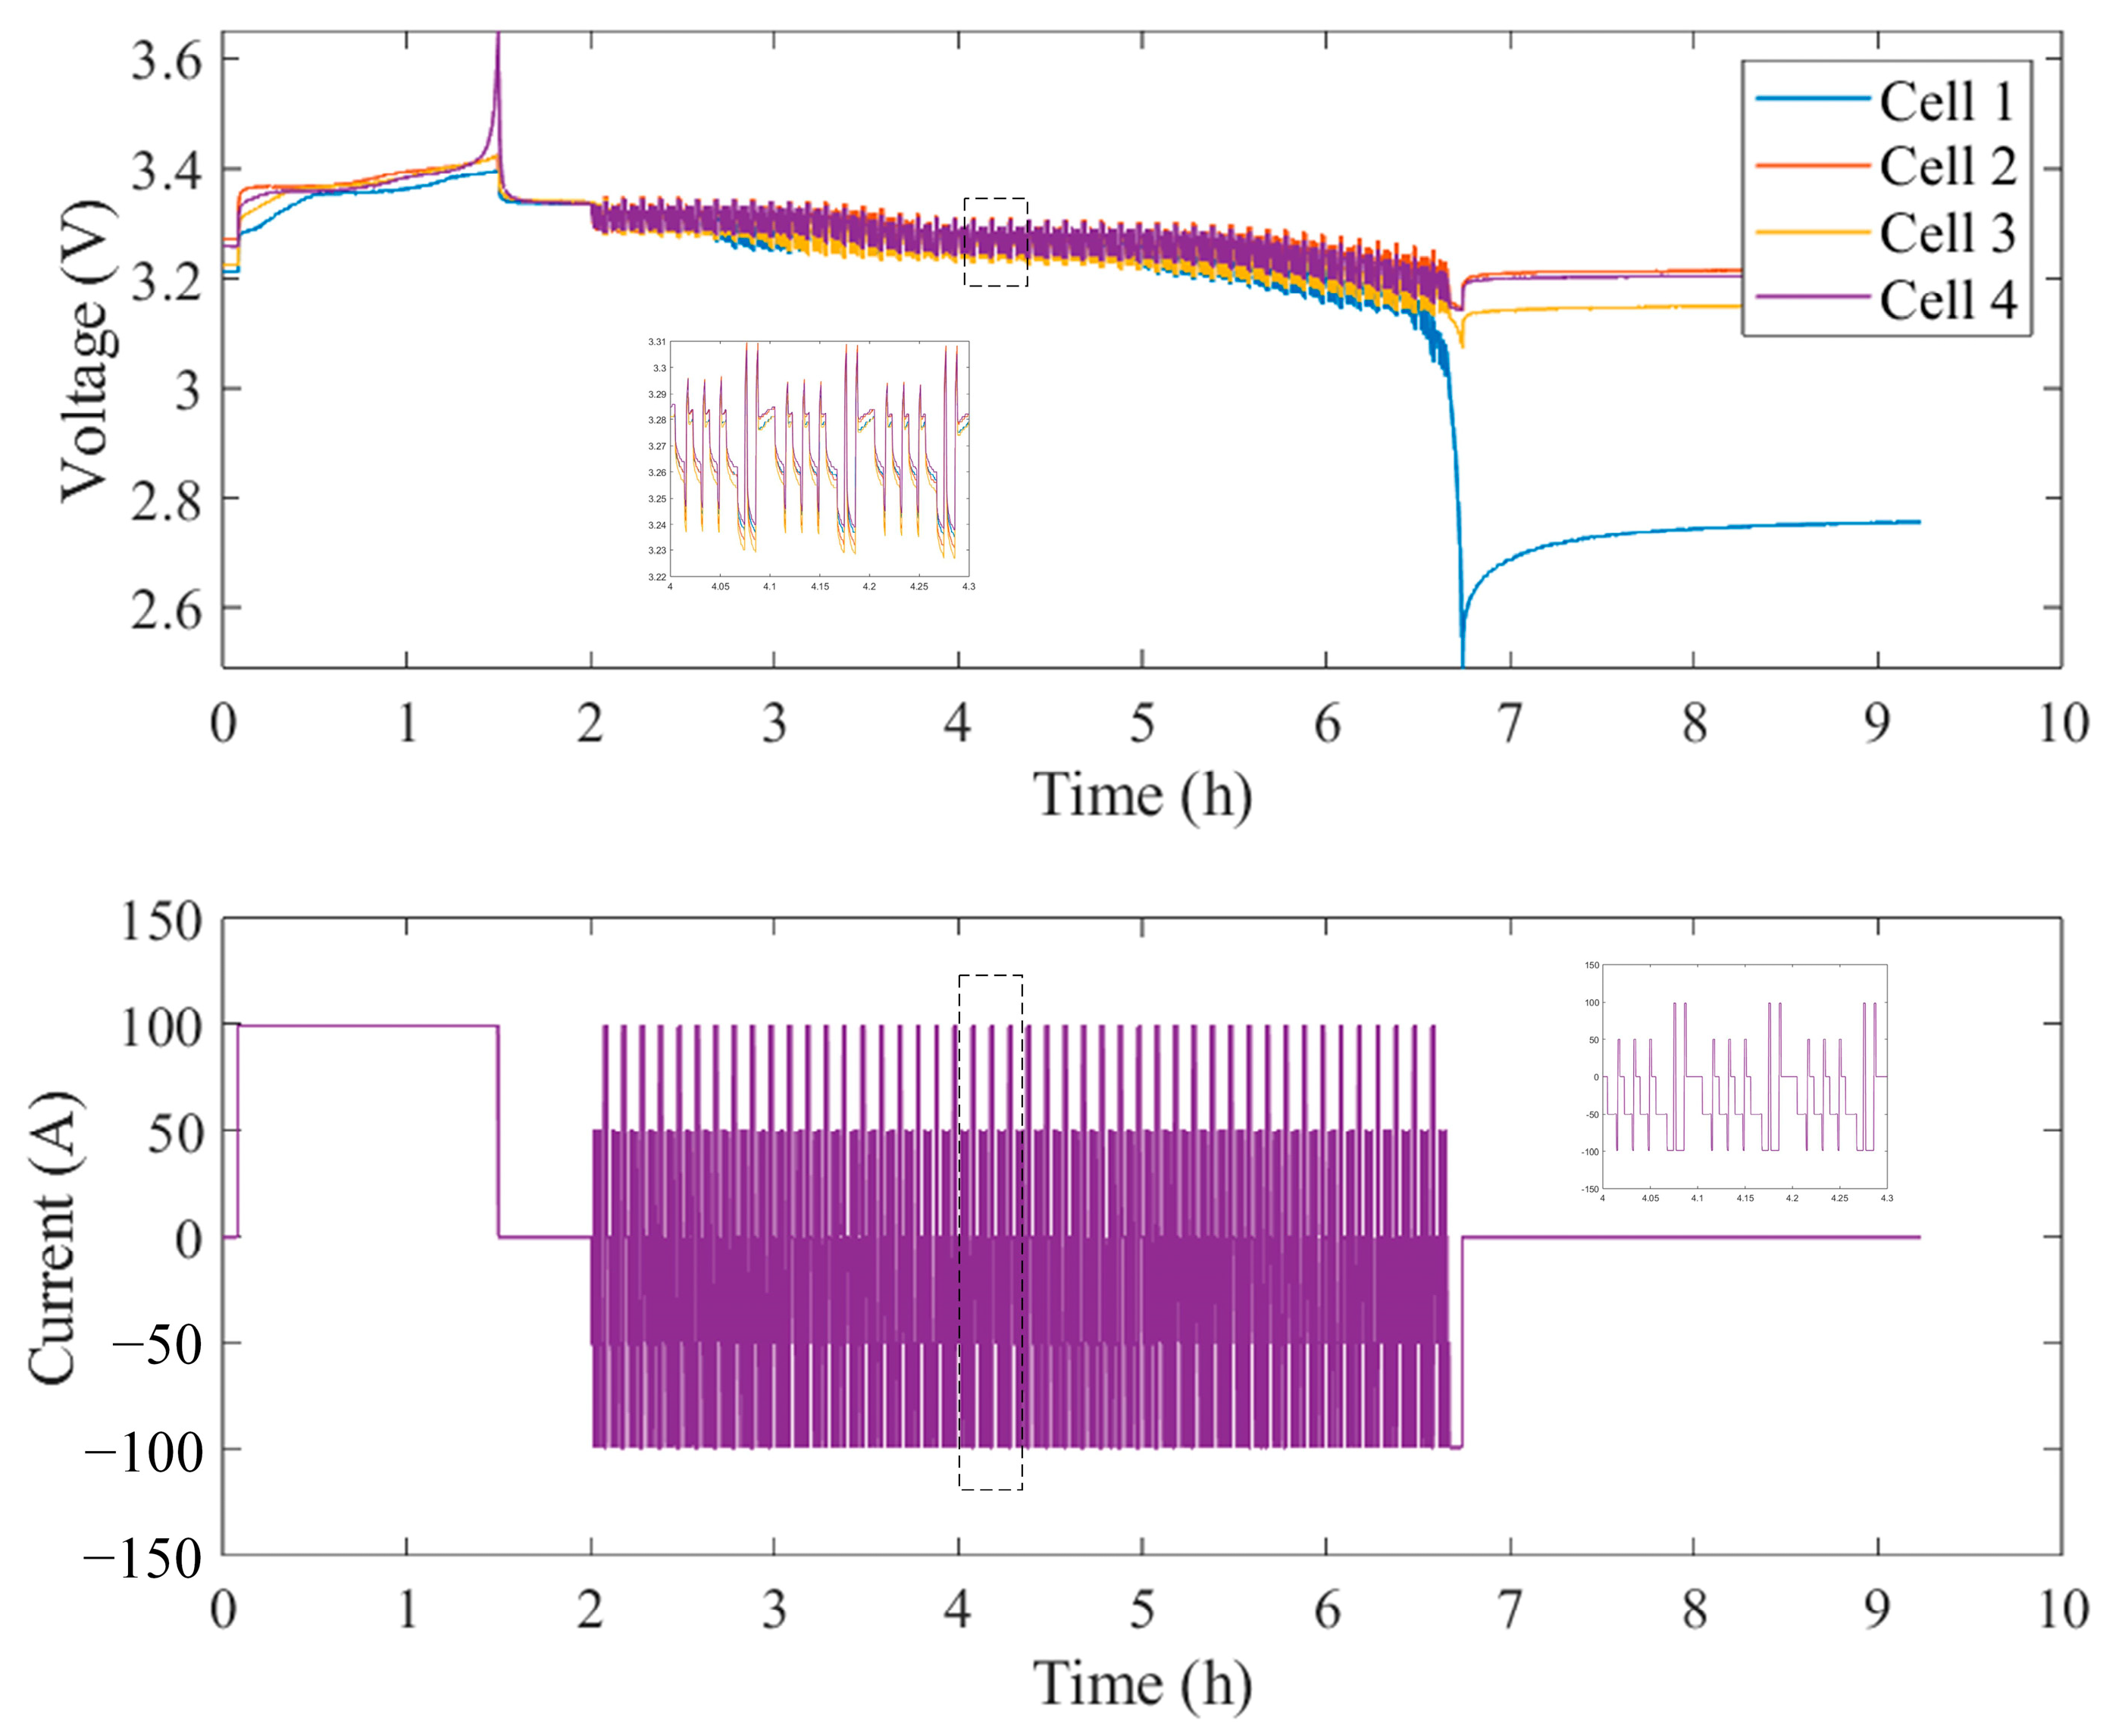
To have a clearer understanding of the charging and discharging processes of batteries, the voltage and current curves of four batteries connected in series with different initial SOC and SOH are given, as shown in
Figure 9.
It can be seen that, firstly, the STB Test is conducted to simulate constant current charging conditions. Then, the dynamic working condition experiment is conducted to simulate dynamic DST conditions. Finally, it is released for a long time.
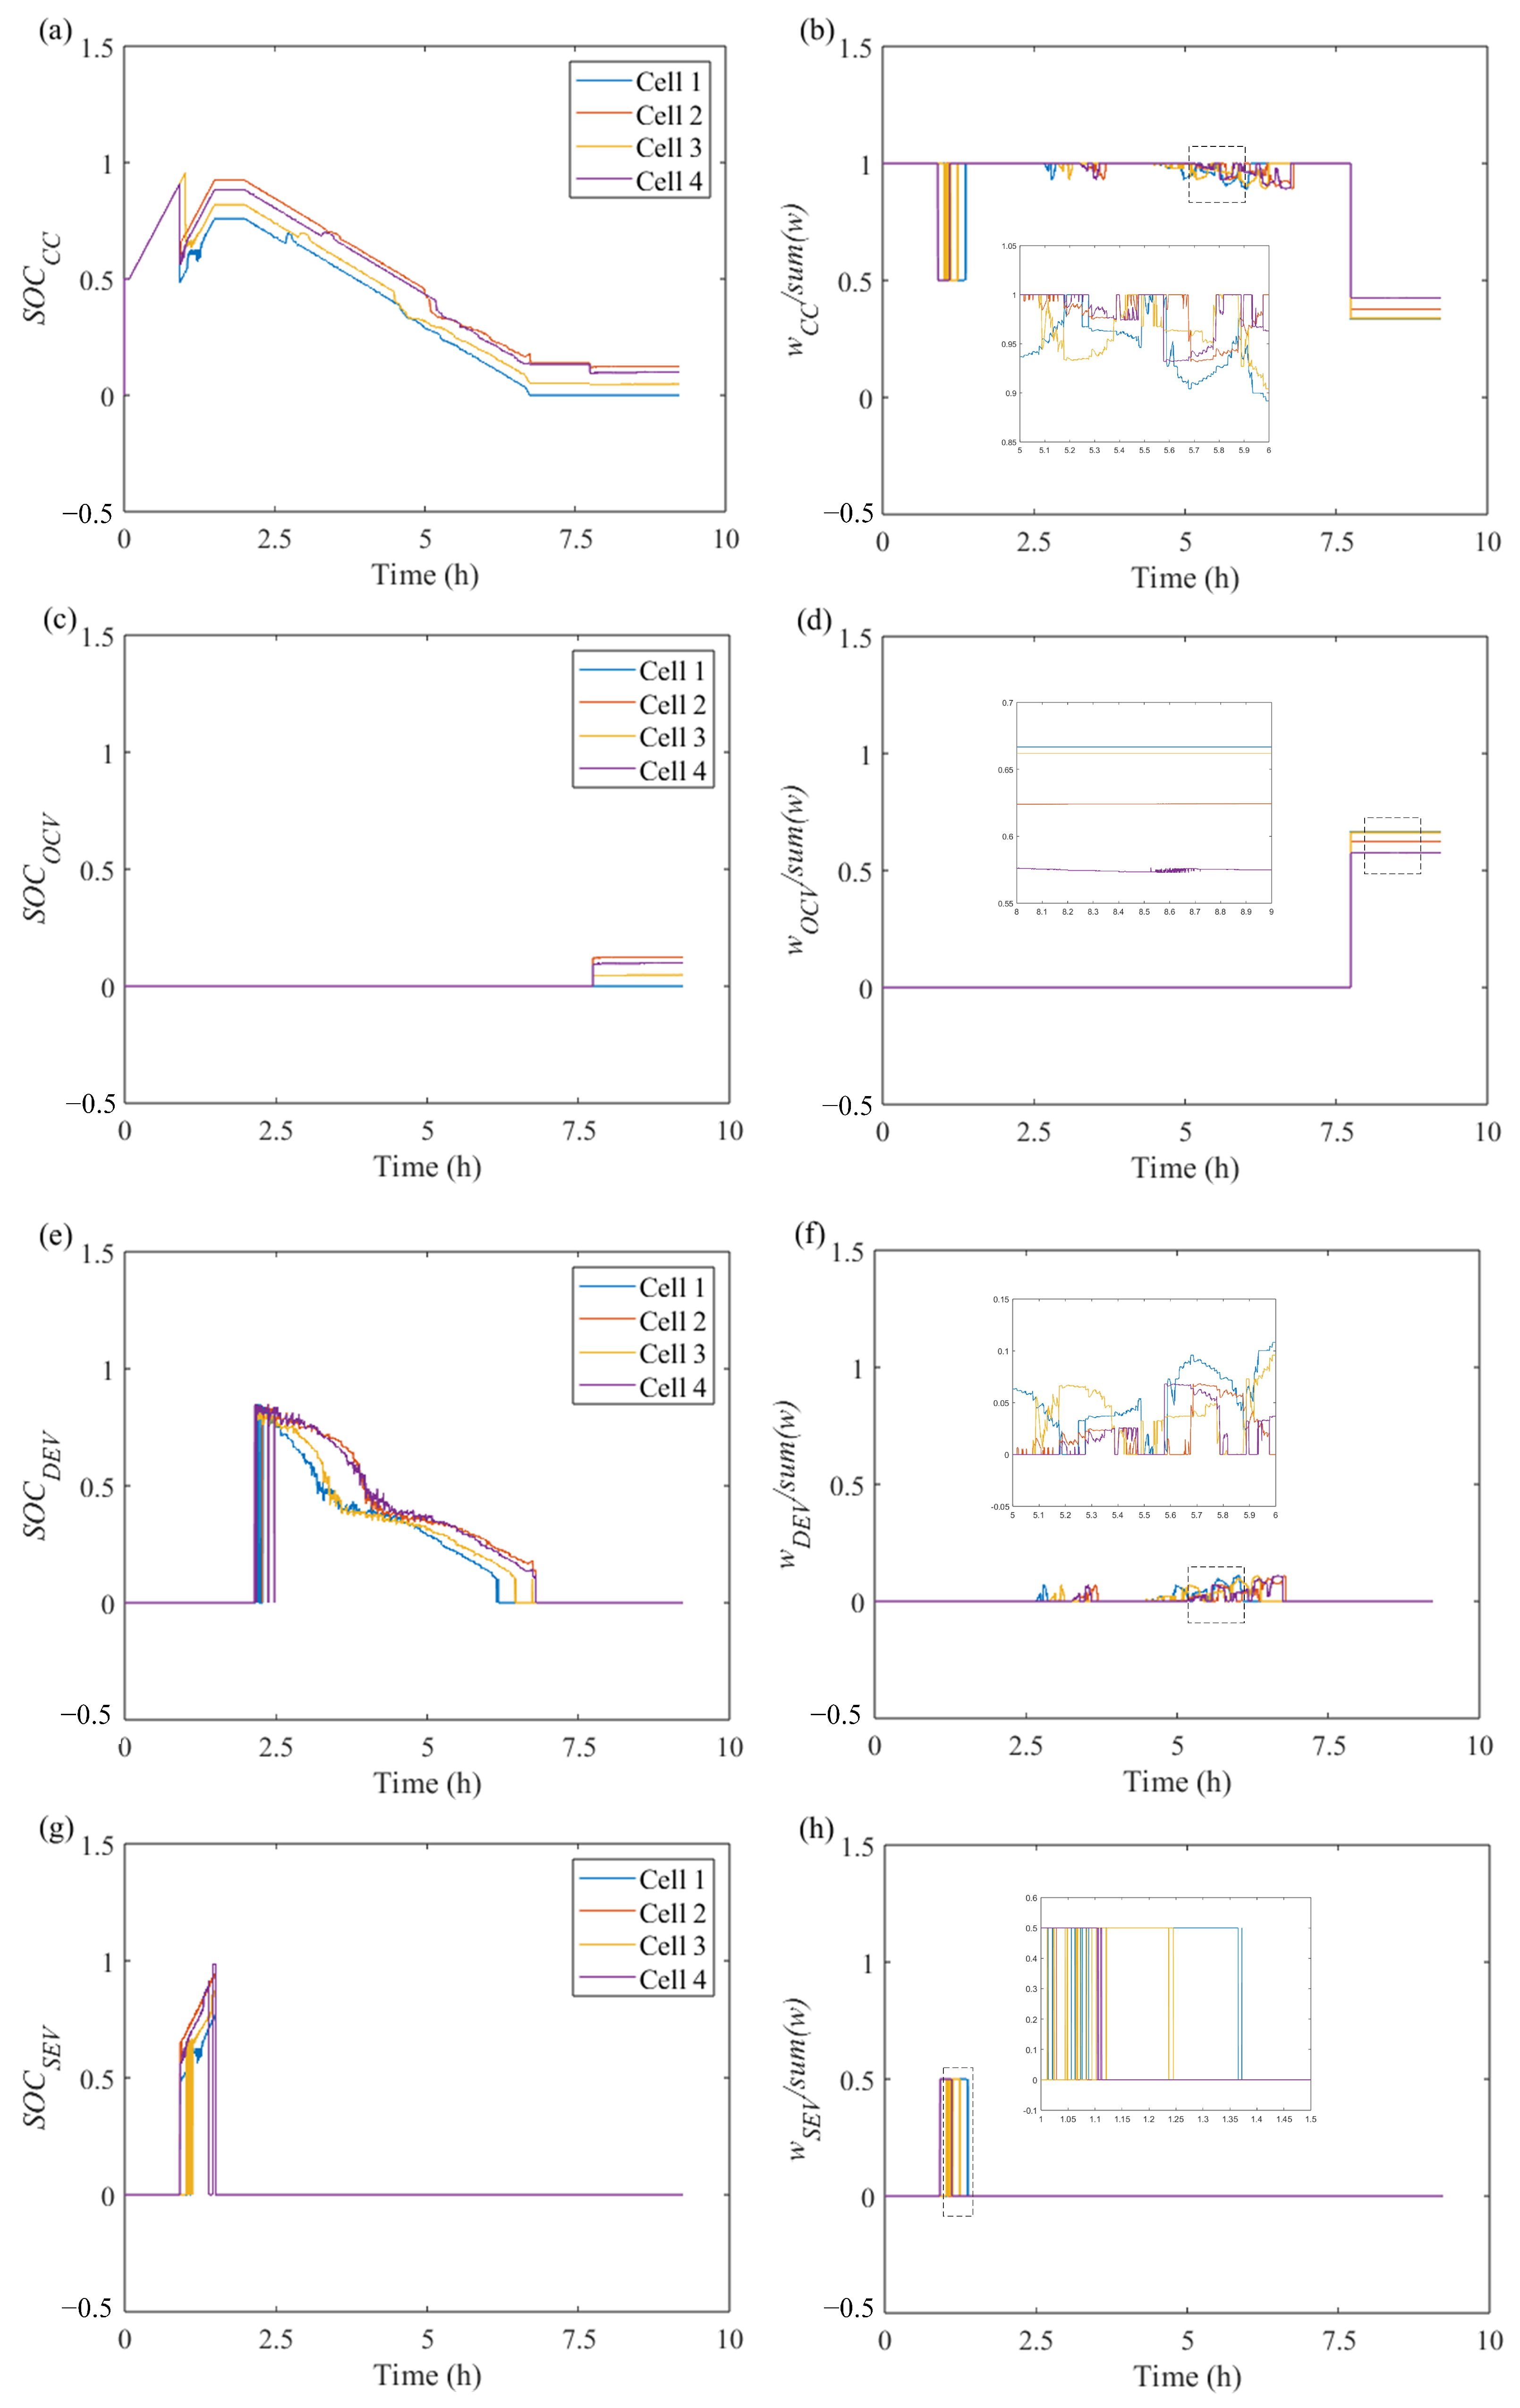
To further analyze the accuracy of training-free estimation with dynamic weight distribution, the weight and SOC estimation results of four series batteries are respectively analyzed. In this experiment, the initial SOC is set to 0.5. The dynamic weight distribution and SOC value of each method is shown in
Figure 10. As shown in
Figure 10a,c,e,g, it can be seen that the SOC in the coulomb counting method is corrected by other methods. When the battery is in a constant current charging state for a long time, the charging matching method is used to correct the SOC, so that the battery SOC quickly converges to the true value. When the battery is in a dynamic current state for a long time, the equivalent circuit method is used to correct the SOC. When the battery is in a static state for a long time, the open circuit voltage method is used to correct the SOC. Then, the proportion of the weight in the total weight for each method is shown in
Figure 10b,d,f,h. The sum of all the weights is always 1, and its weight is always dynamically changed according to the relevant algorithm settings following the detail in
Section 2.4 of this paper.
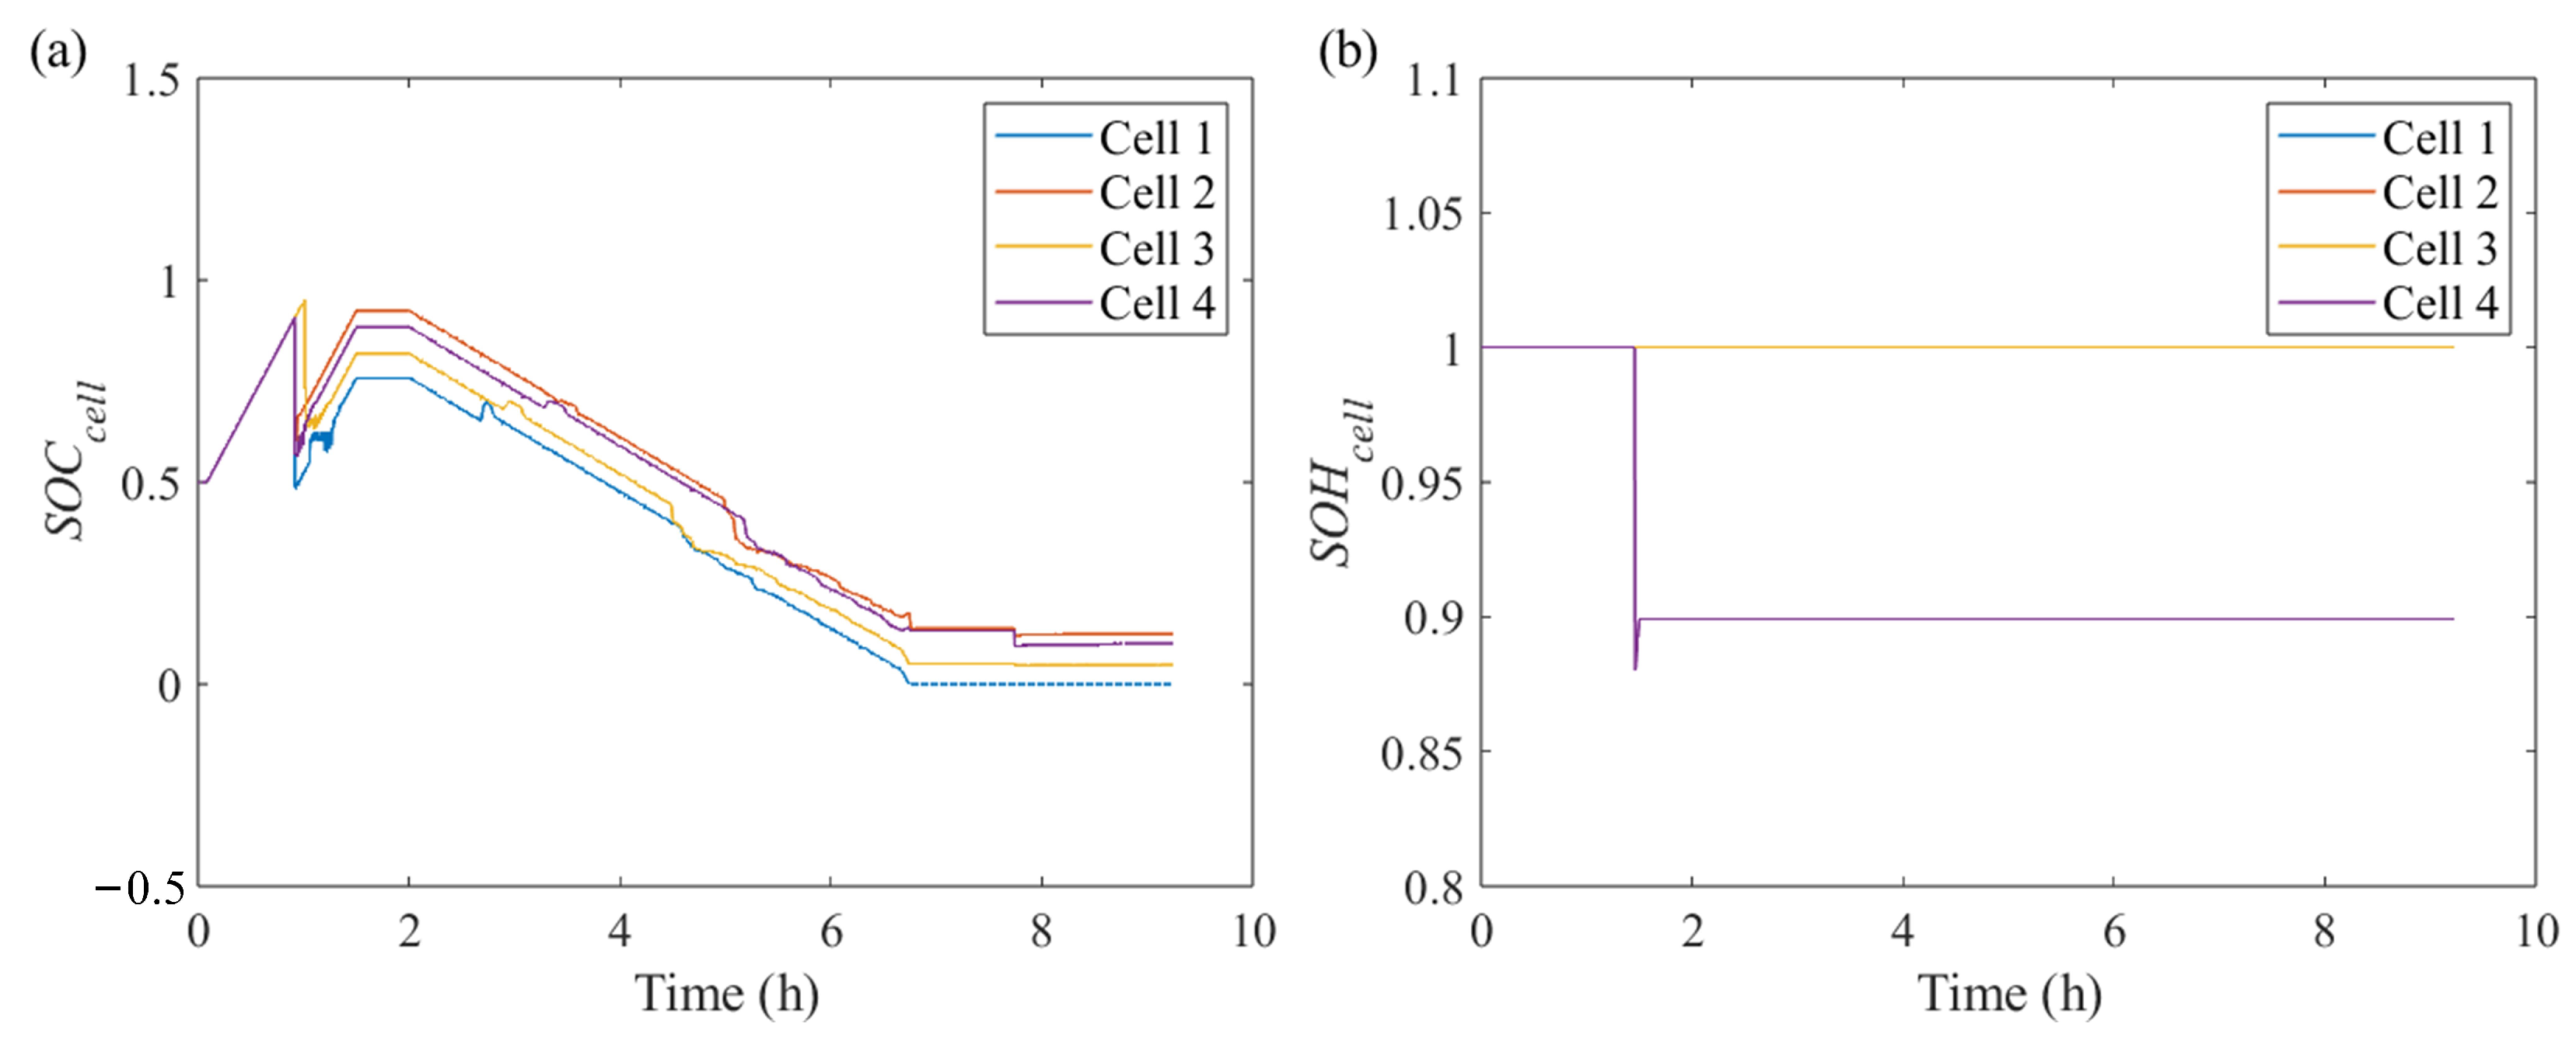
Finally, the results of the SOC estimation for the four batteries are given in
Figure 11a, and the results of the SOH estimation for the four batteries are given in
Figure 11b. It can be seen that for four lithium iron phosphate batteries that are set to an initial SOC value of 0.5 and an initial SOH value of 1, due to the correction of different methods and the distribution of dynamic weights, the proposed method can quickly correct the initial setting deviations and have a high estimation accuracy under various load profiles. And the SOH estimation is realized through the aging law of the SEV curve, as shown in
Figure 11b, and only when the
is higher than 0.95, the SOH of Cell 4 is estimated.
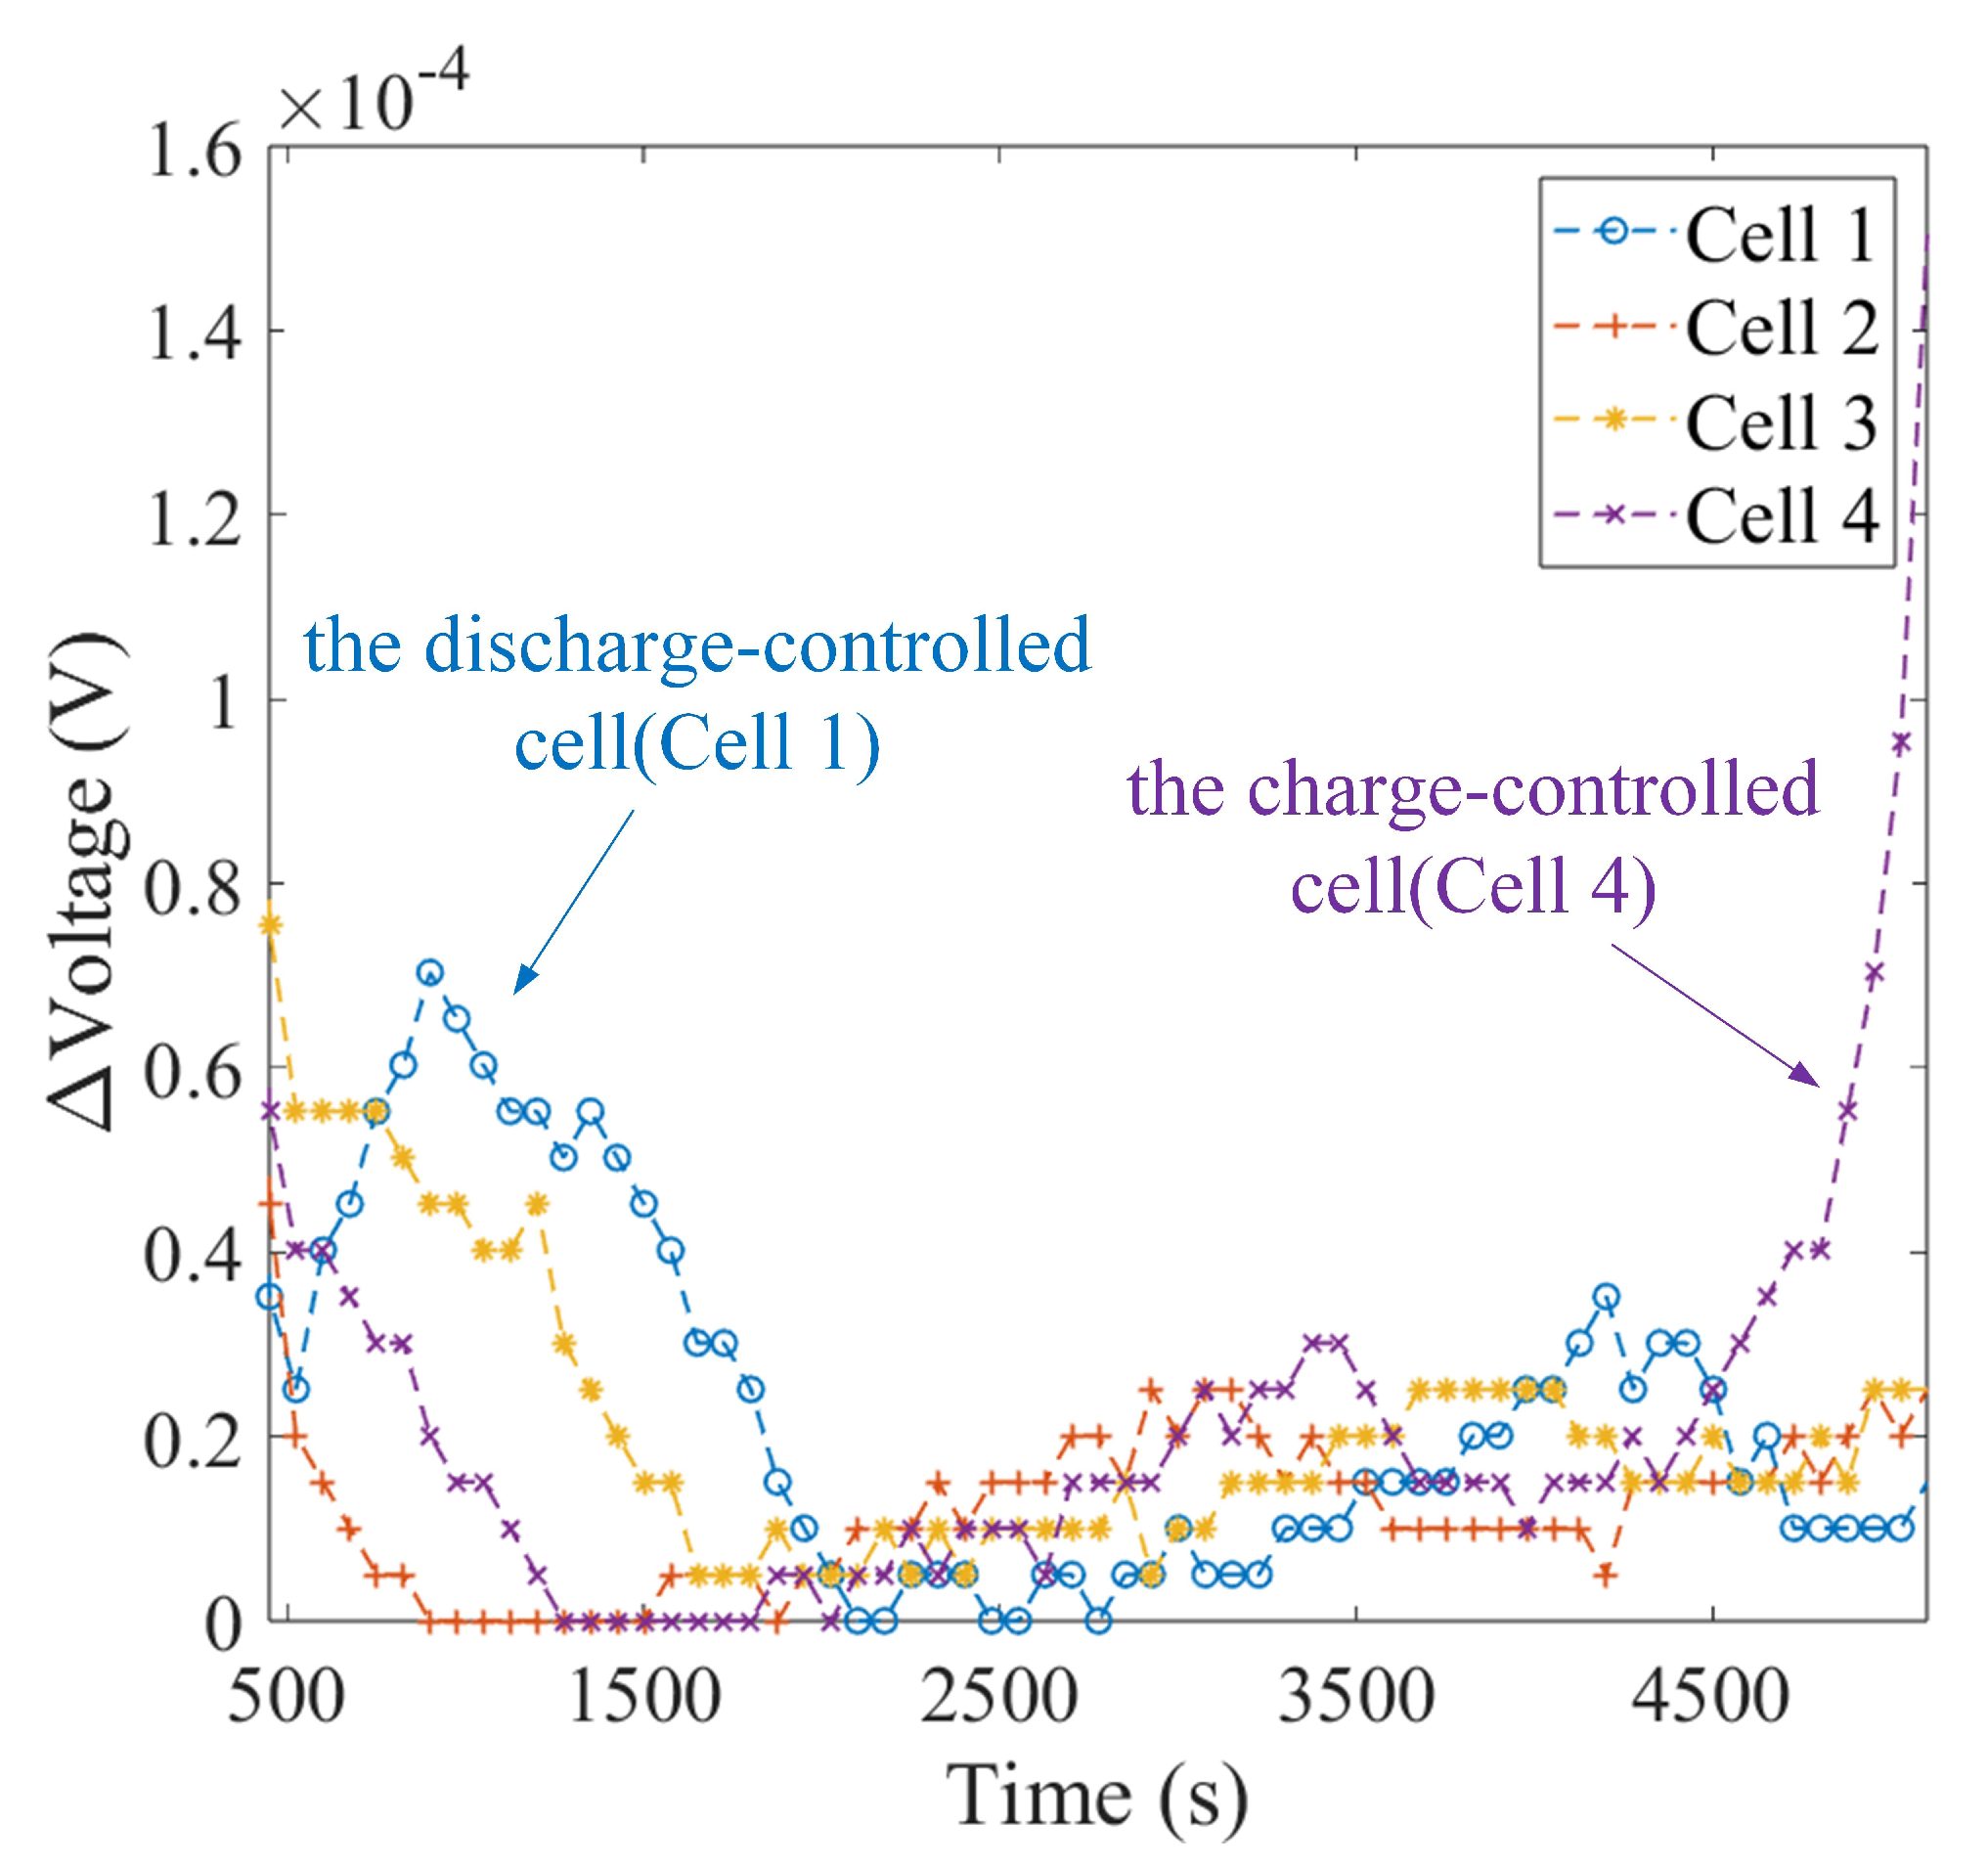
To verify the effectiveness of the proposed method for decisive cell selection, the voltage difference of four cells is shown in
Figure 12. In addition, to reduce the impact of voltage sensor accuracy, the difference is calculated at 75 sampling intervals. The charging capacity in these intervals is less than 1%
. As shown in
Figure 12, the voltage difference is calculated every 75 sampling points. It can be clearly seen that the rapid change in the OCV curve introduces the corresponding behavior in the voltage difference. In the low SOC region, the cell that the voltage difference is the last to rise rapidly is selected as the discharge-controlled cell. In the high SOC region, the cell that the voltage difference is the first to rise rapidly is selected as the charge-controlled cell. It should be noted that to avoid conflicts, the SOC value of the charge-controlled cell is used as the dividing line, and the judgment of the corresponding decisive cells’ selection is only made in the corresponding SOC region. The SOC value is set to 0.5 here.
It is worth noting that the above state estimation for four batteries is mainly for better explanation and verification. For the actual estimation of battery packs, only two decisive cells need to be estimated.
4.3. SOC and SOH Estimation Results of Battery Packs
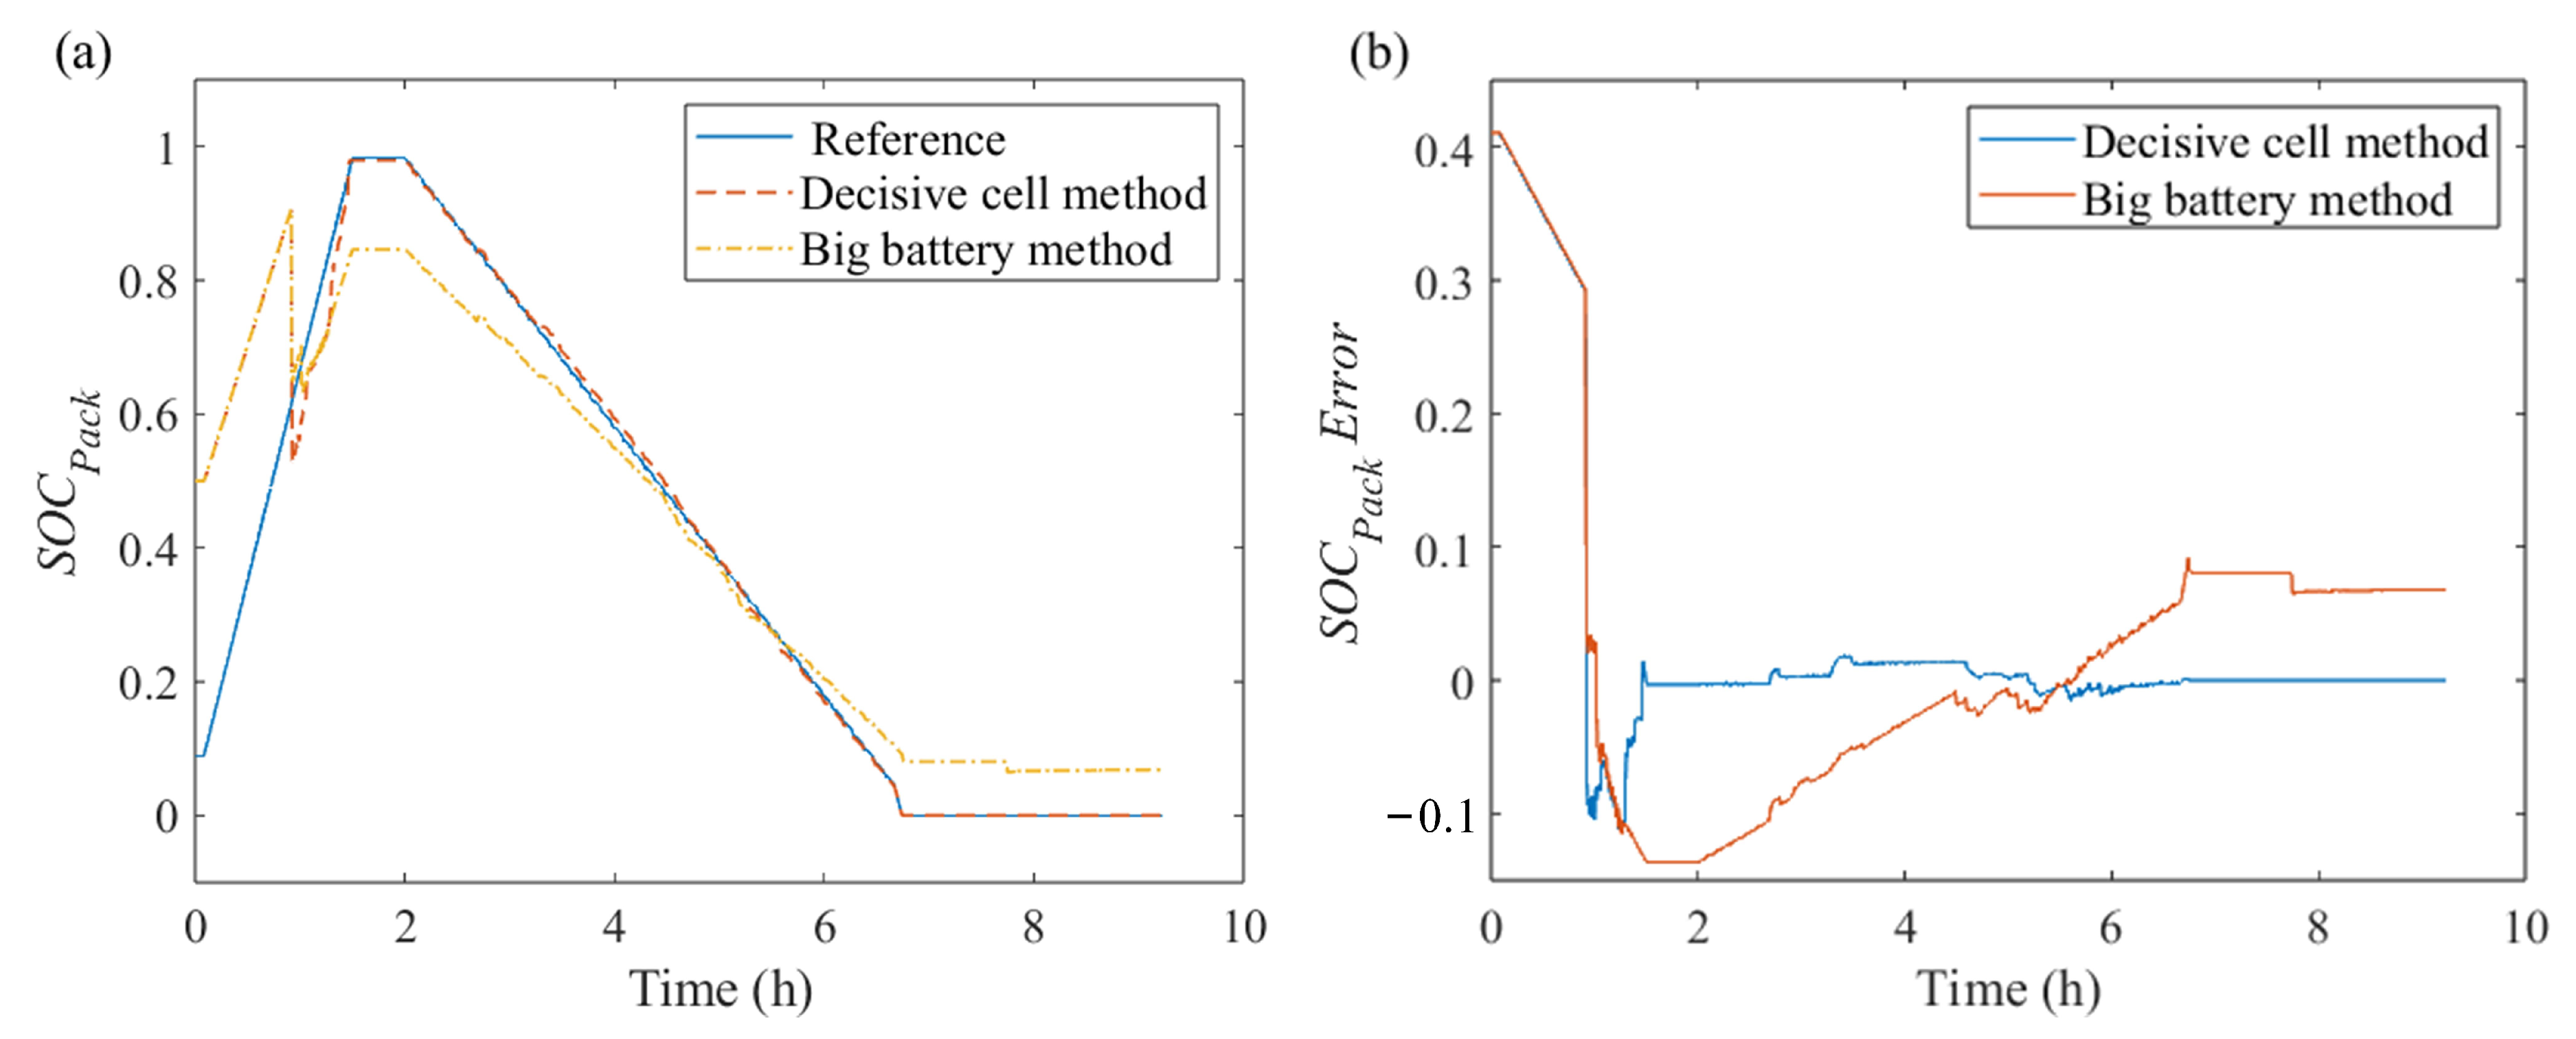
To verify the accuracy of the proposed estimation method for battery packs, the SOC and SOH of battery packs are estimated under the working condition of a verification experiment. The complete discharge method is used to trace back the true SOC of the battery packs, and the CAP Exp is used to obtain the true SOH of the battery packs.
Figure 13 shows the estimated SOC and error results. It can be seen that the SOC estimation errors in our method are significantly lower than the traditional ‘big battery’ method. The proposed method can maintain a high estimation accuracy for the SOC within 2% for a series battery pack consisting of cells with obvious inconsistency. In contrast, under extremely harsh operating conditions, the accuracy of the ‘big battery’ method reaches 10%.
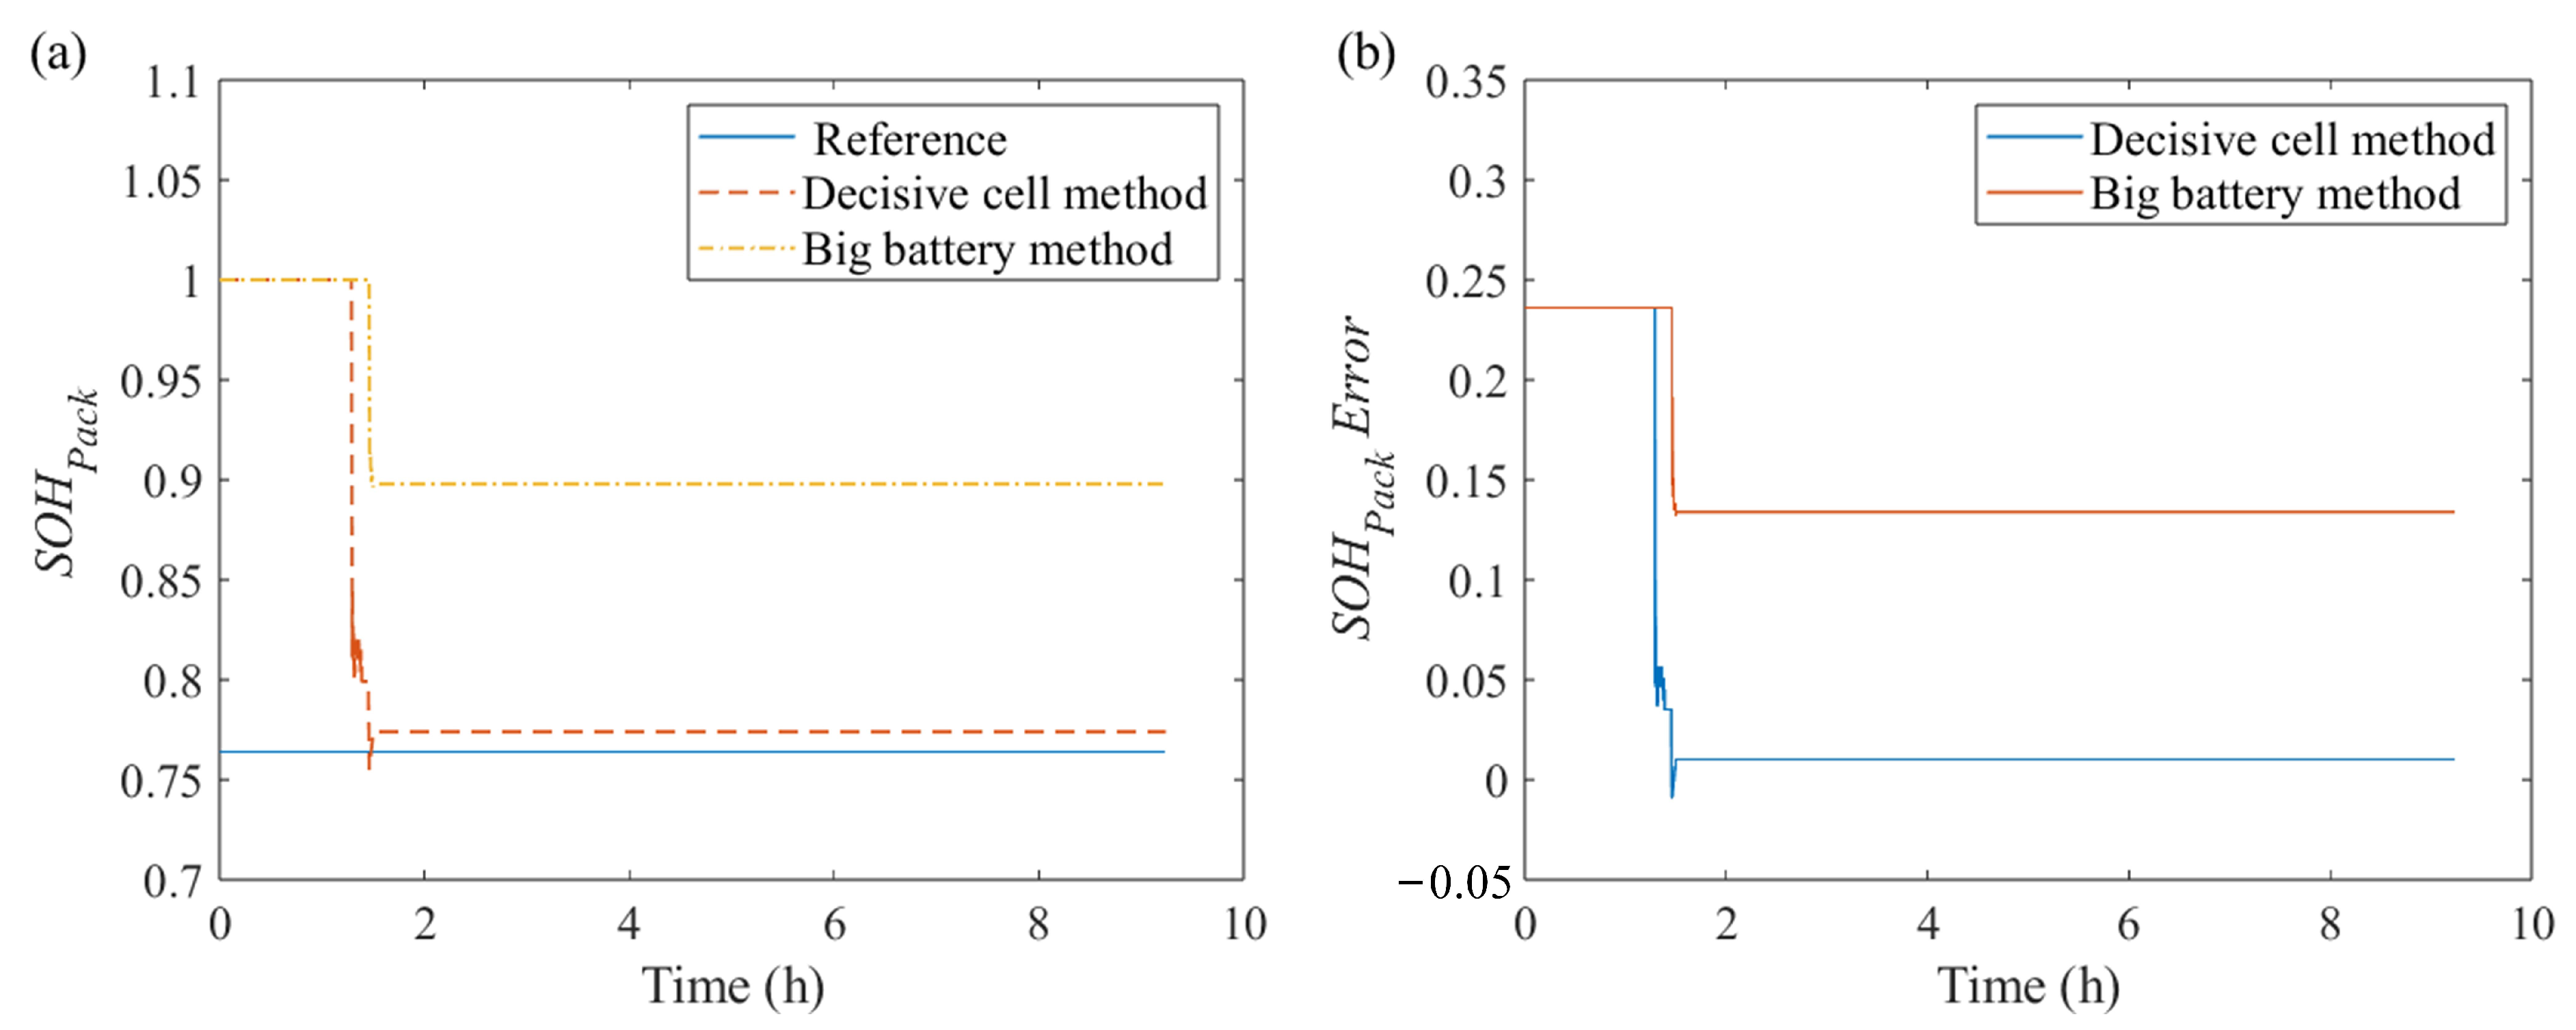
Figure 14 shows the estimated SOH and error results for battery packs. It can be seen that different from the ‘big battery’ method, the SOH estimation errors can also have a high estimation accuracy within 2% when using the proposed method.
It is worth noting that the above experimental conclusions were obtained without relying on any aging experimental data. The aging experiment mentioned in this paper is only used for the verification of the characteristic parameter laws (i.e., the characteristic parameters only exhibit local curve shrinkage with aging) and the detail in
Section 4.1 of this paper.
In addition, in the actual driving process of the vehicle, the behavior for estimating the battery packs’ state is a continuous process rather than a single charge and discharge cycle. This means that based on the proposed method, the state estimation of battery packs can always maintain a high accuracy.


