
Applying Deep Electrical-Resistivity Tomography Techniques for the Exploration of Medium- and Low-Geothermal Energy Resources

 ,
,  ,
,  ,
,  ,
,  and
and 
Abstract
1. Introduction
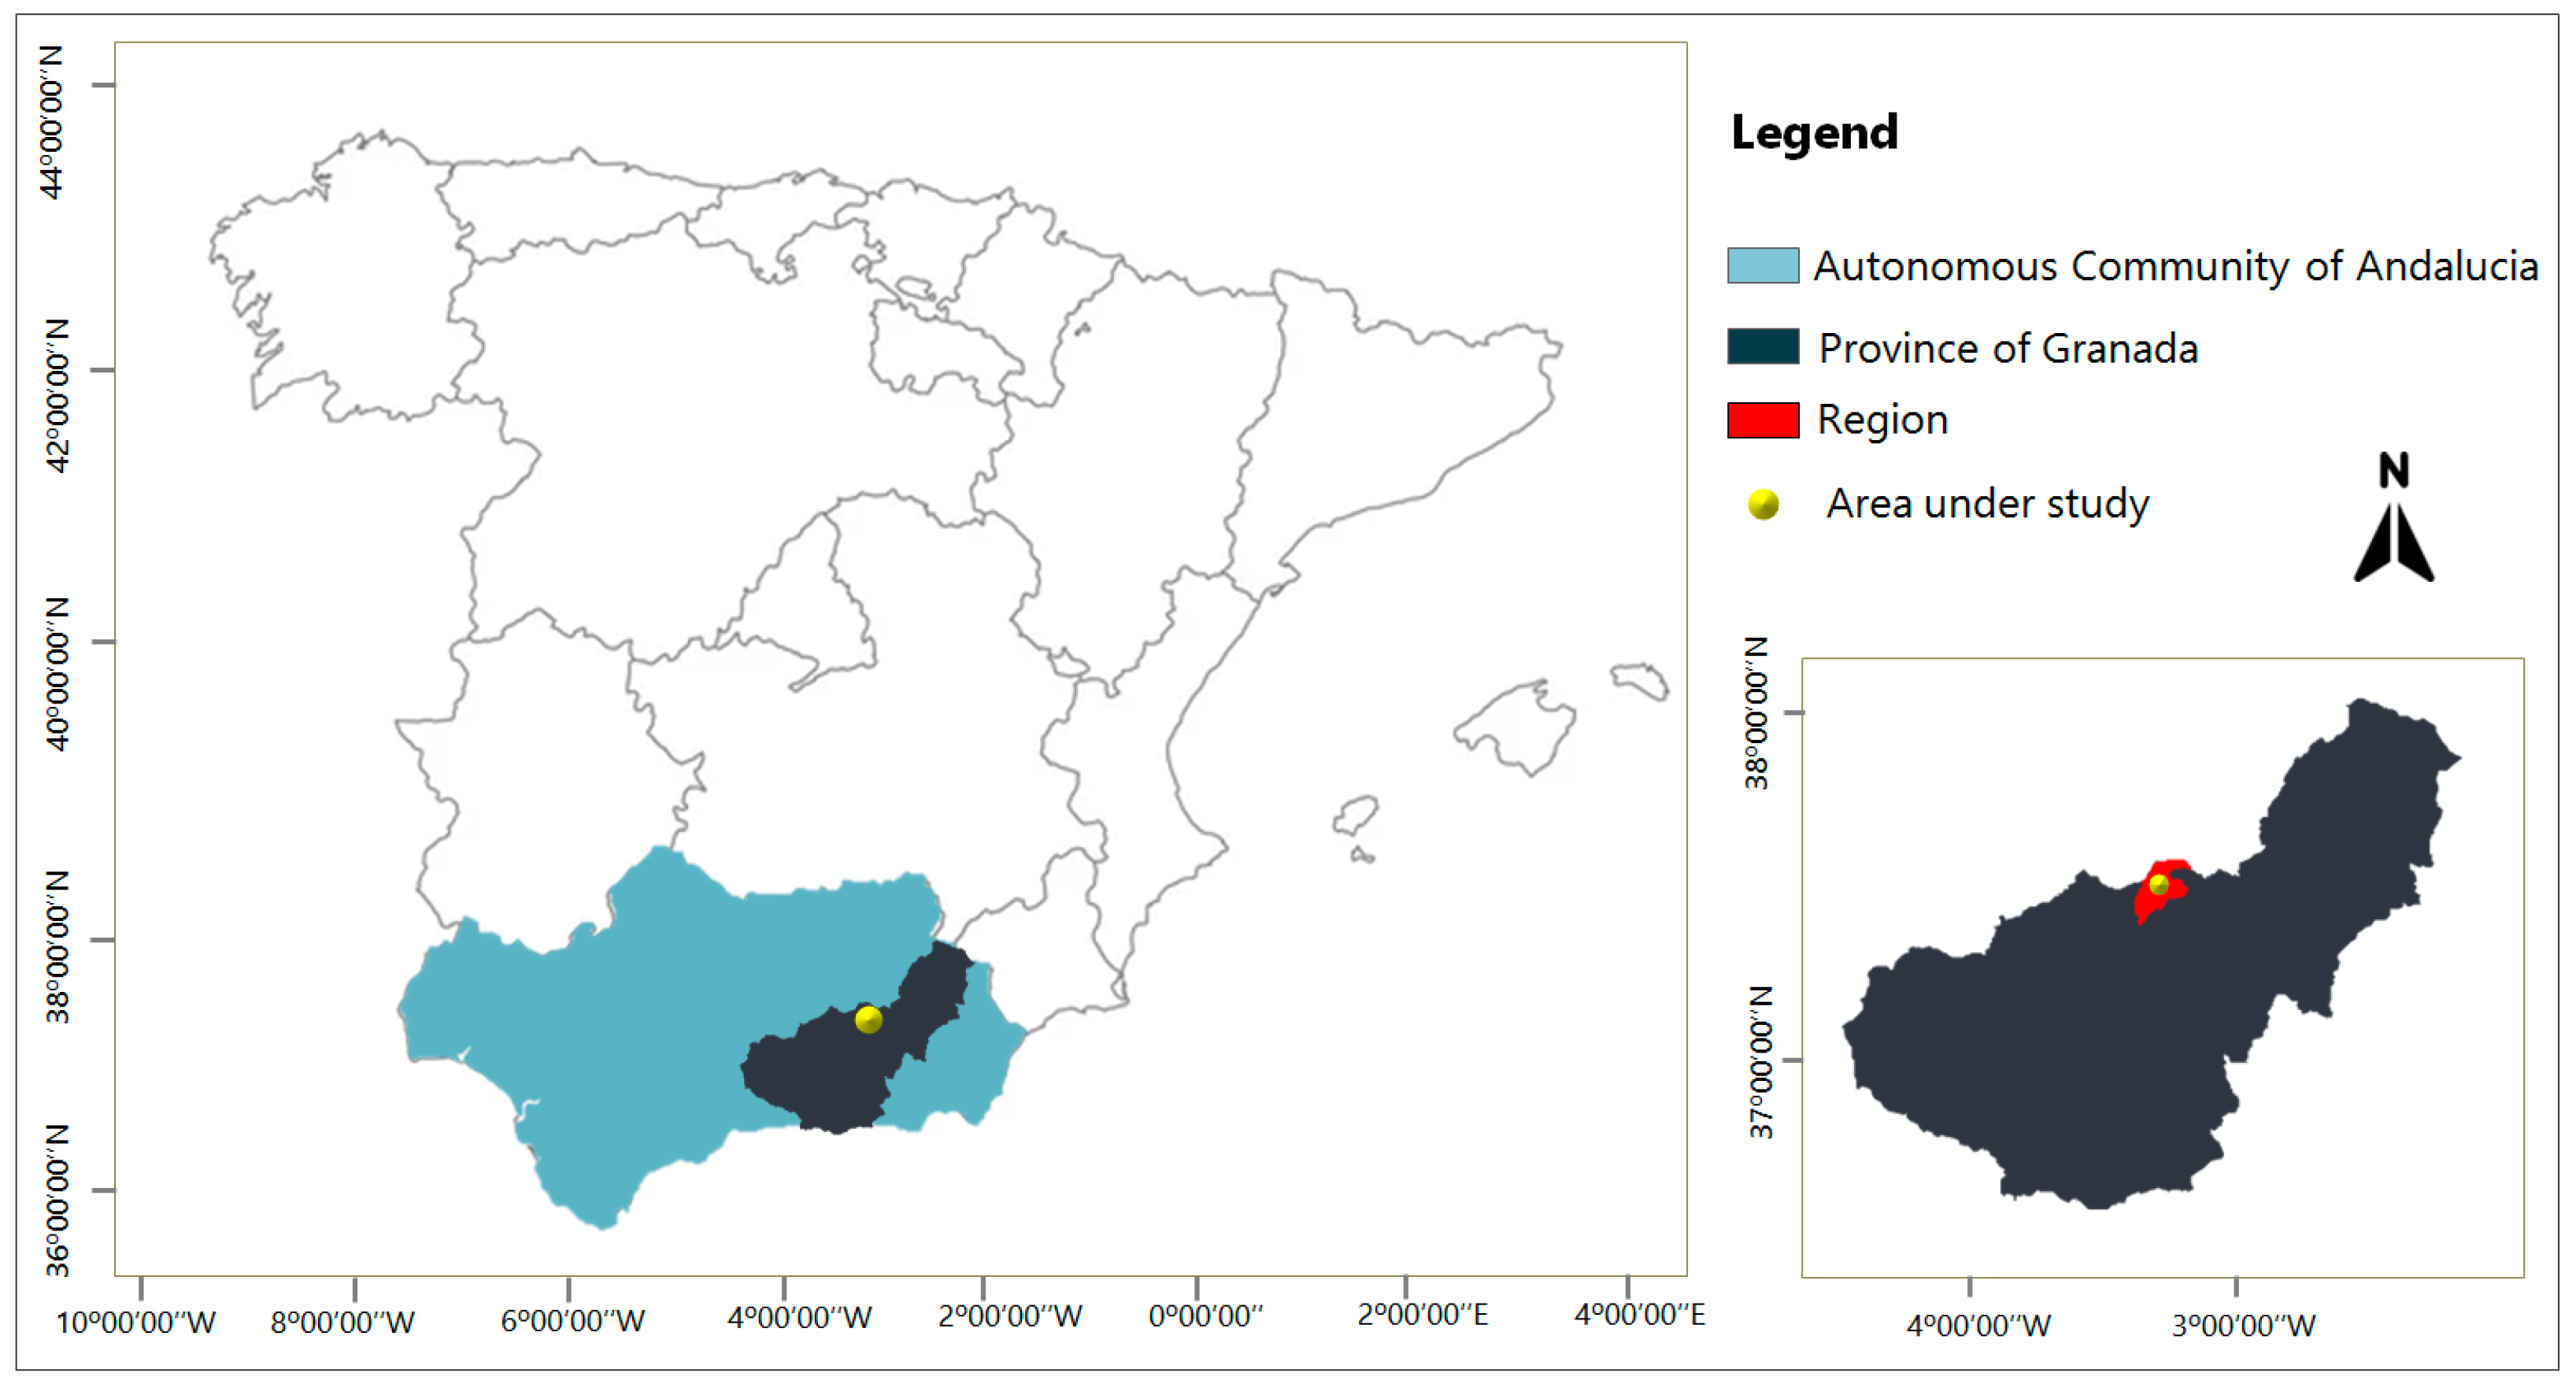
2. Preliminary Study-Area Characterization
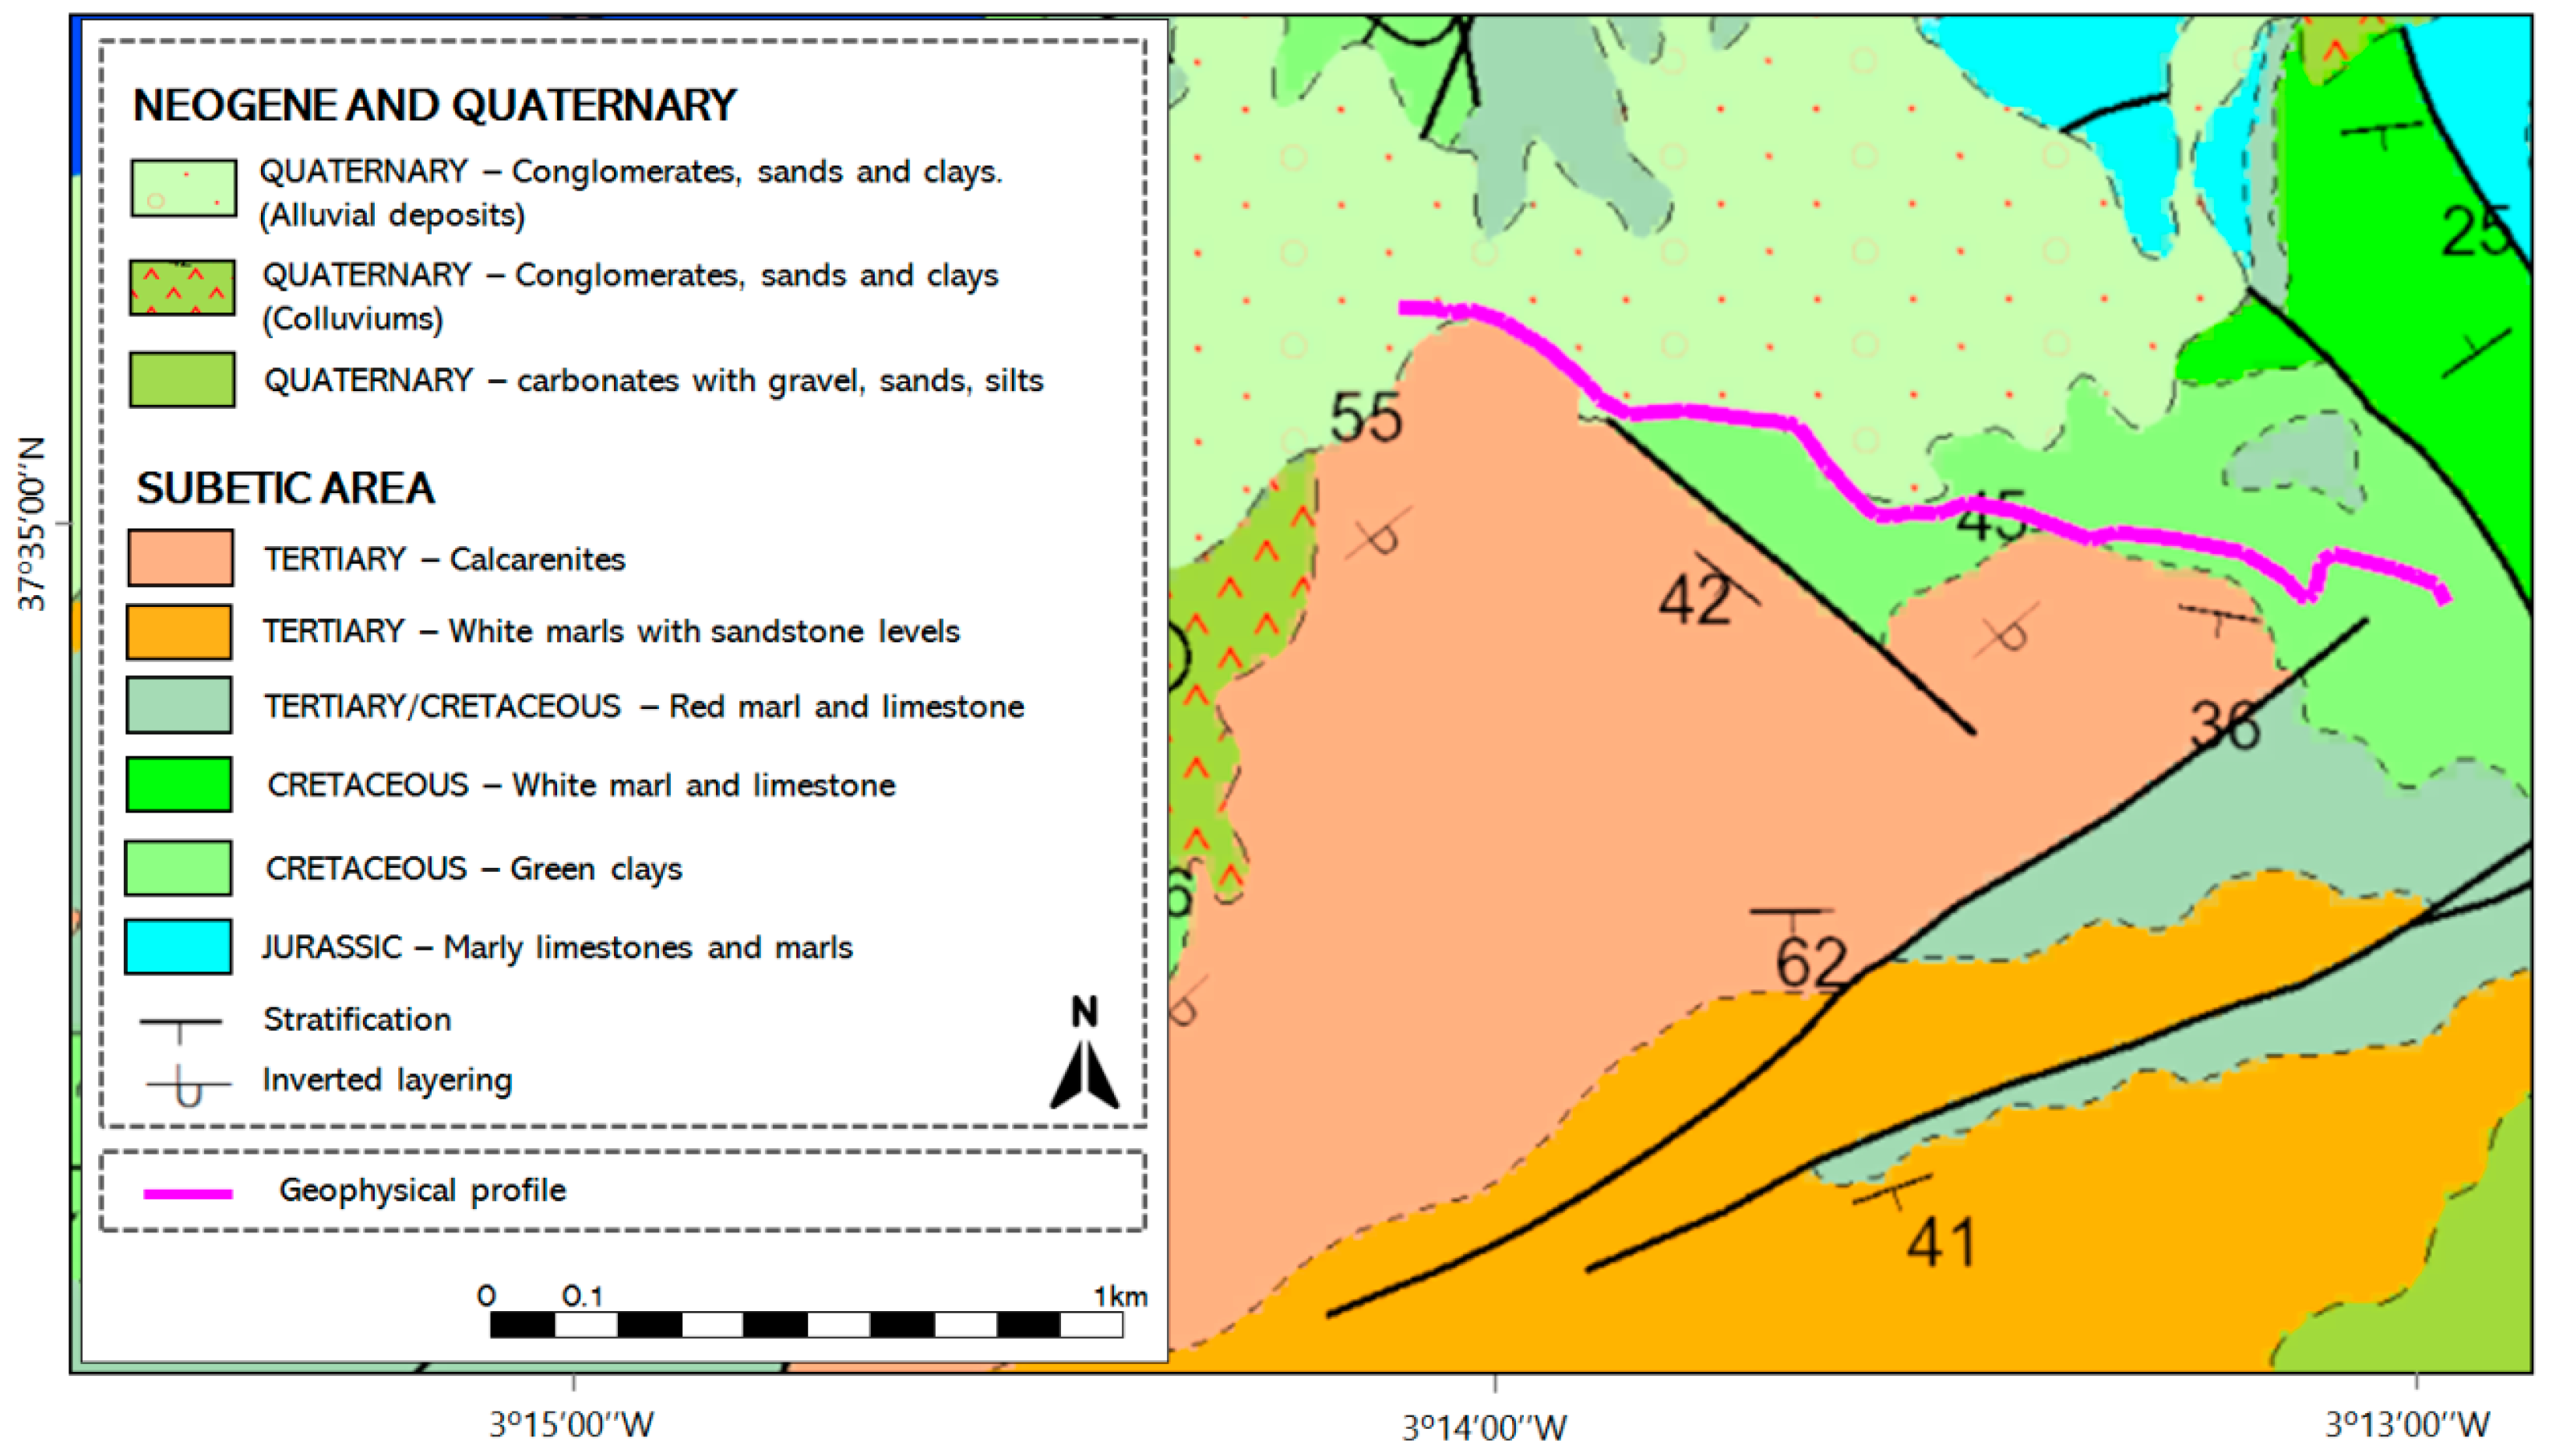
2.1. Geology and Structural Setting
- -
- External sub-Baetic, corresponding to an area in which limestone materials predominate, acquiring great development levels of condensation.
- -
- Medium sub-Baetic, predominating marly materials that appear as characteristic lithologies, radiolarites, and submarine volcanic rocks.
- -
- Internal sub-Baetic that covers a relatively slightly subsiding sector in which exclusively limestone materials outcrop.
2.2. Previous Geothermal Evidences
3. Materials and Methods
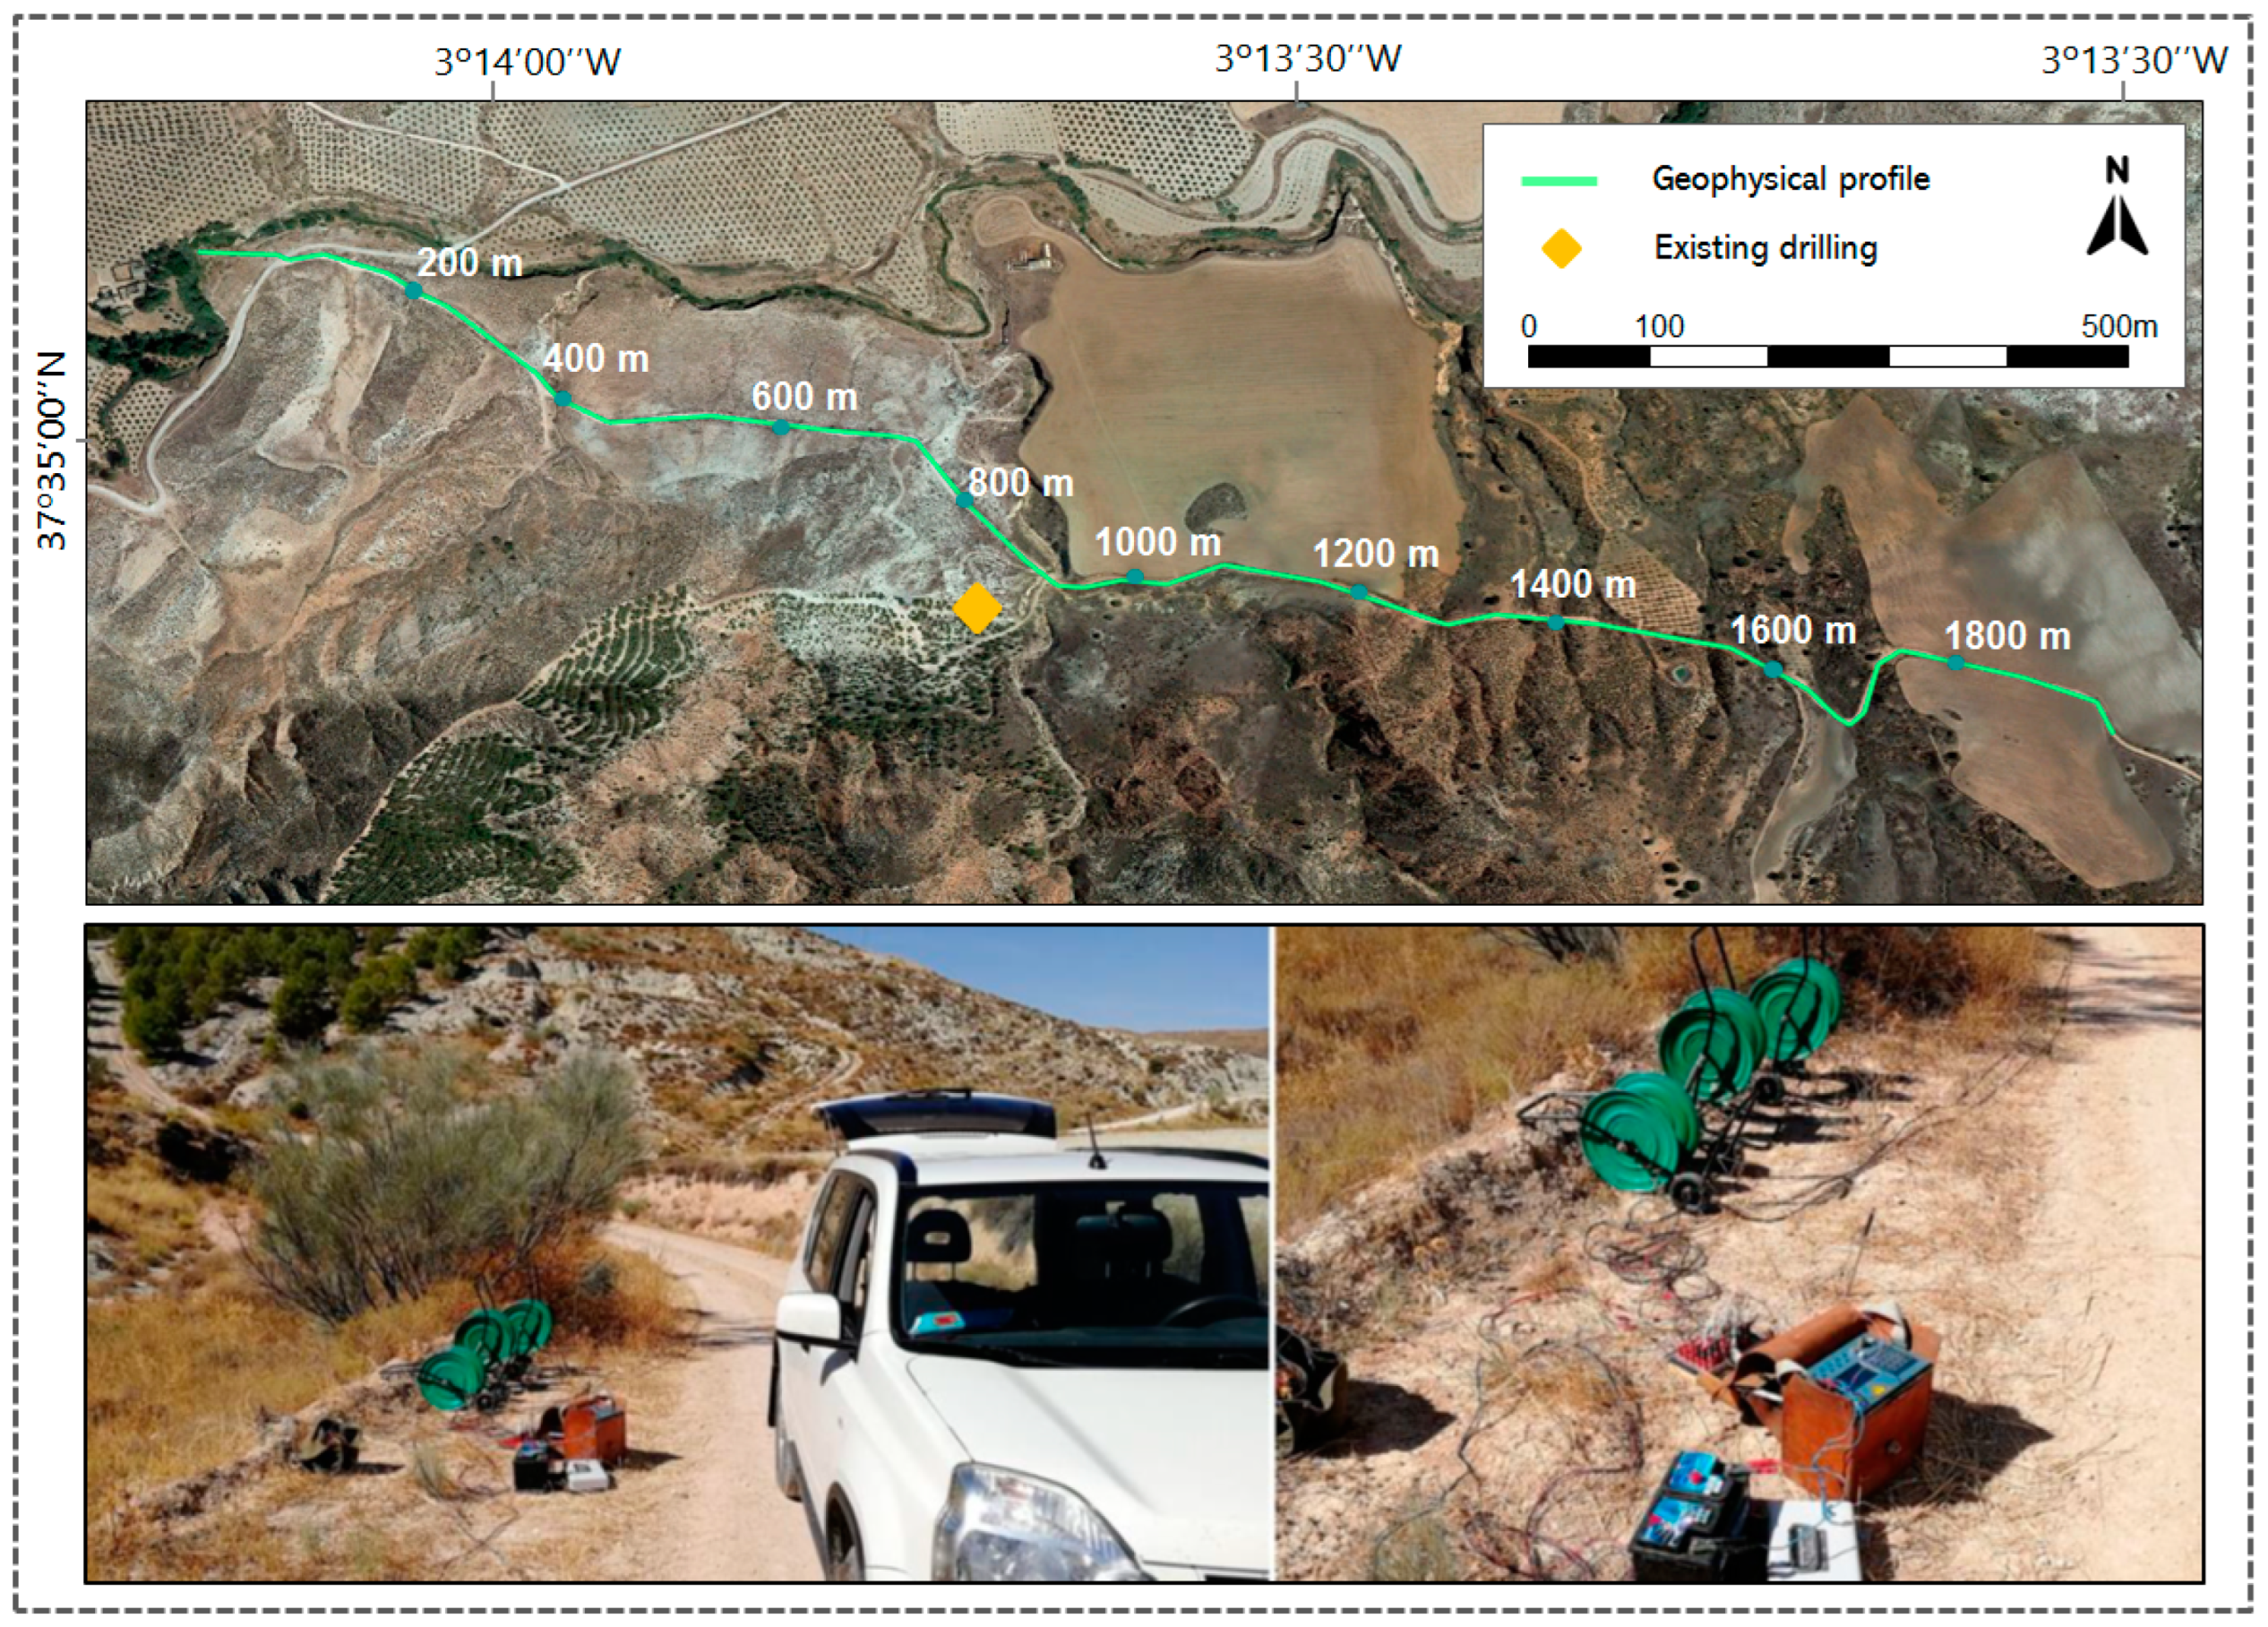
3.1. Geophysical Surveys-ERT
3.1.1. ERT for Geothermal Characterization Review
3.1.2. Fundamentals of the Method and Application on the Study Case
3.1.3. Inversion-Model Approach
4. Results
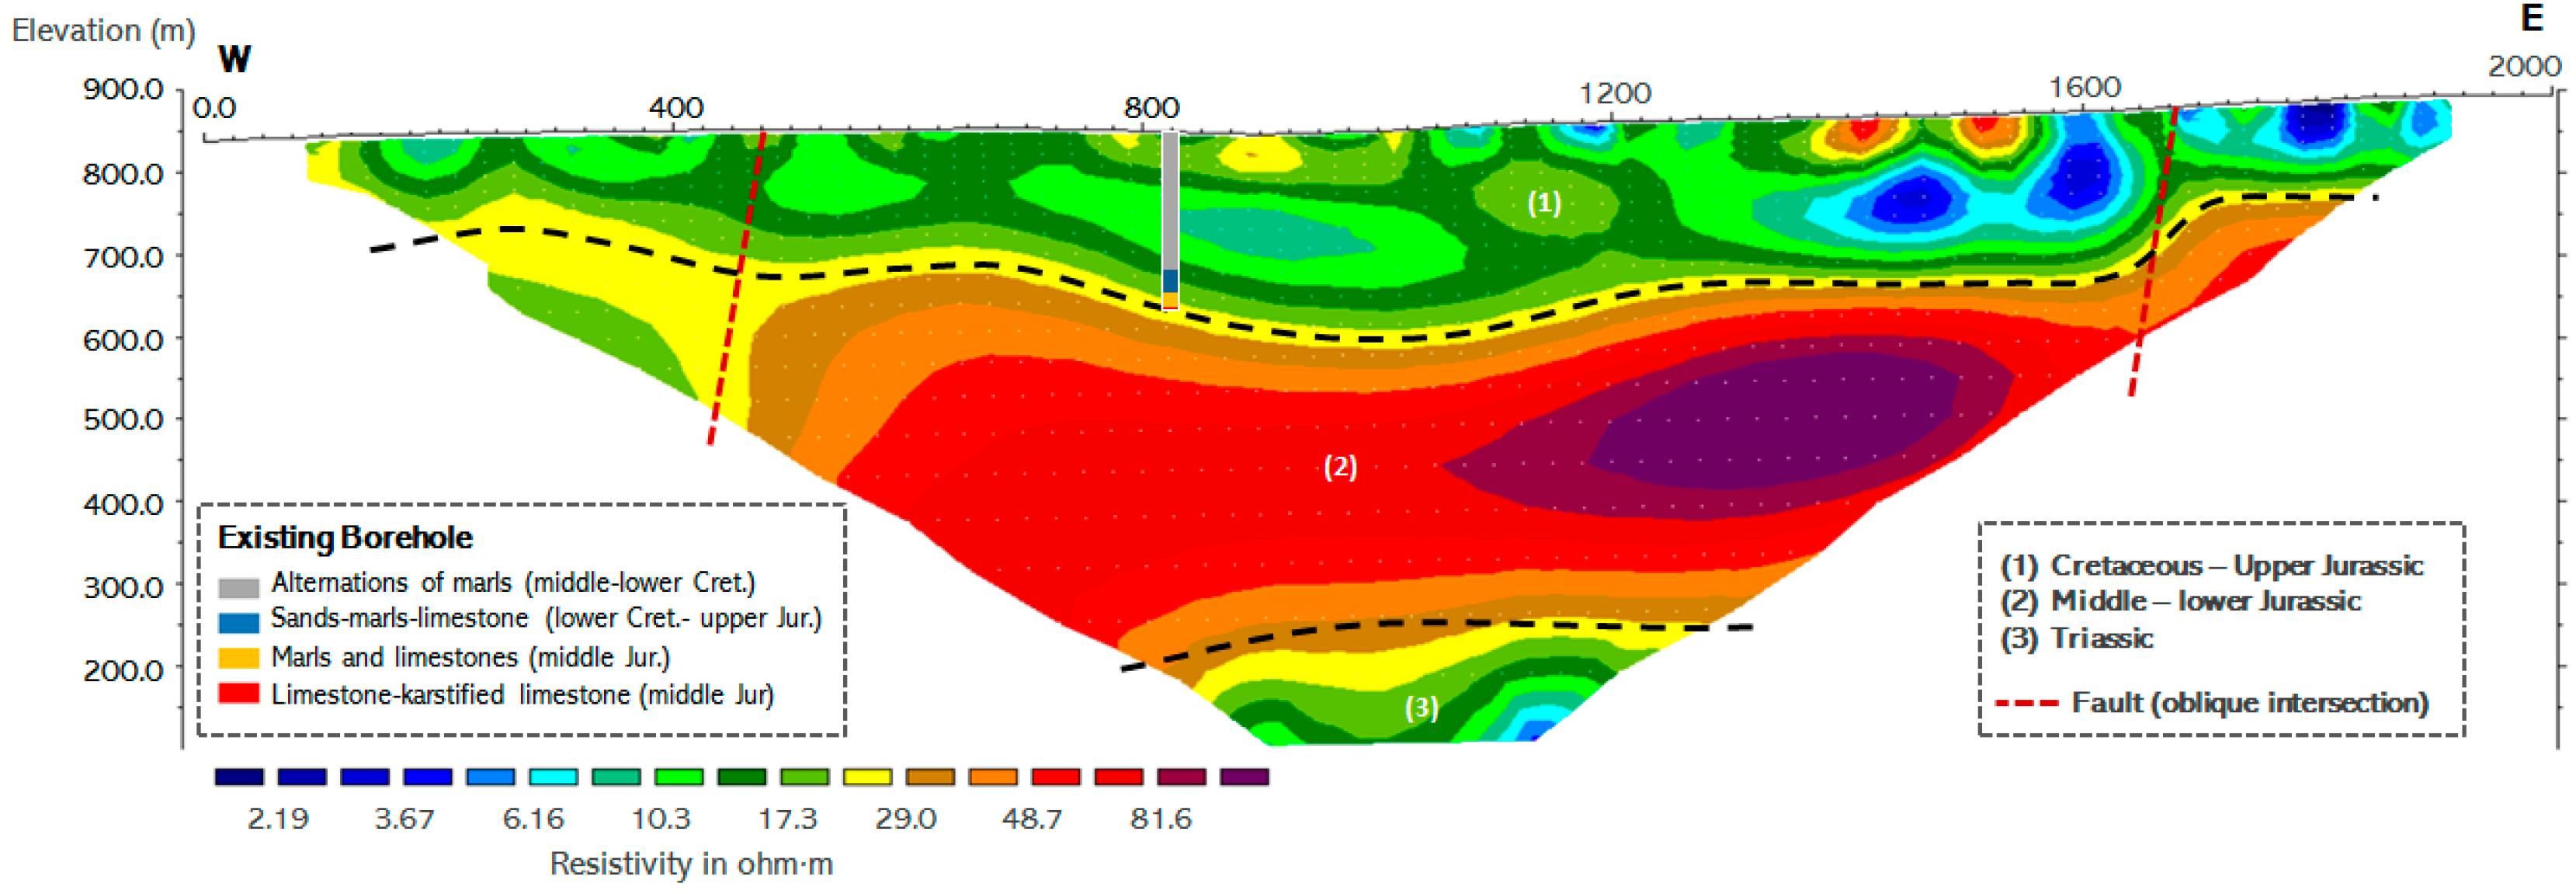
4.1. 2D ERT Profile
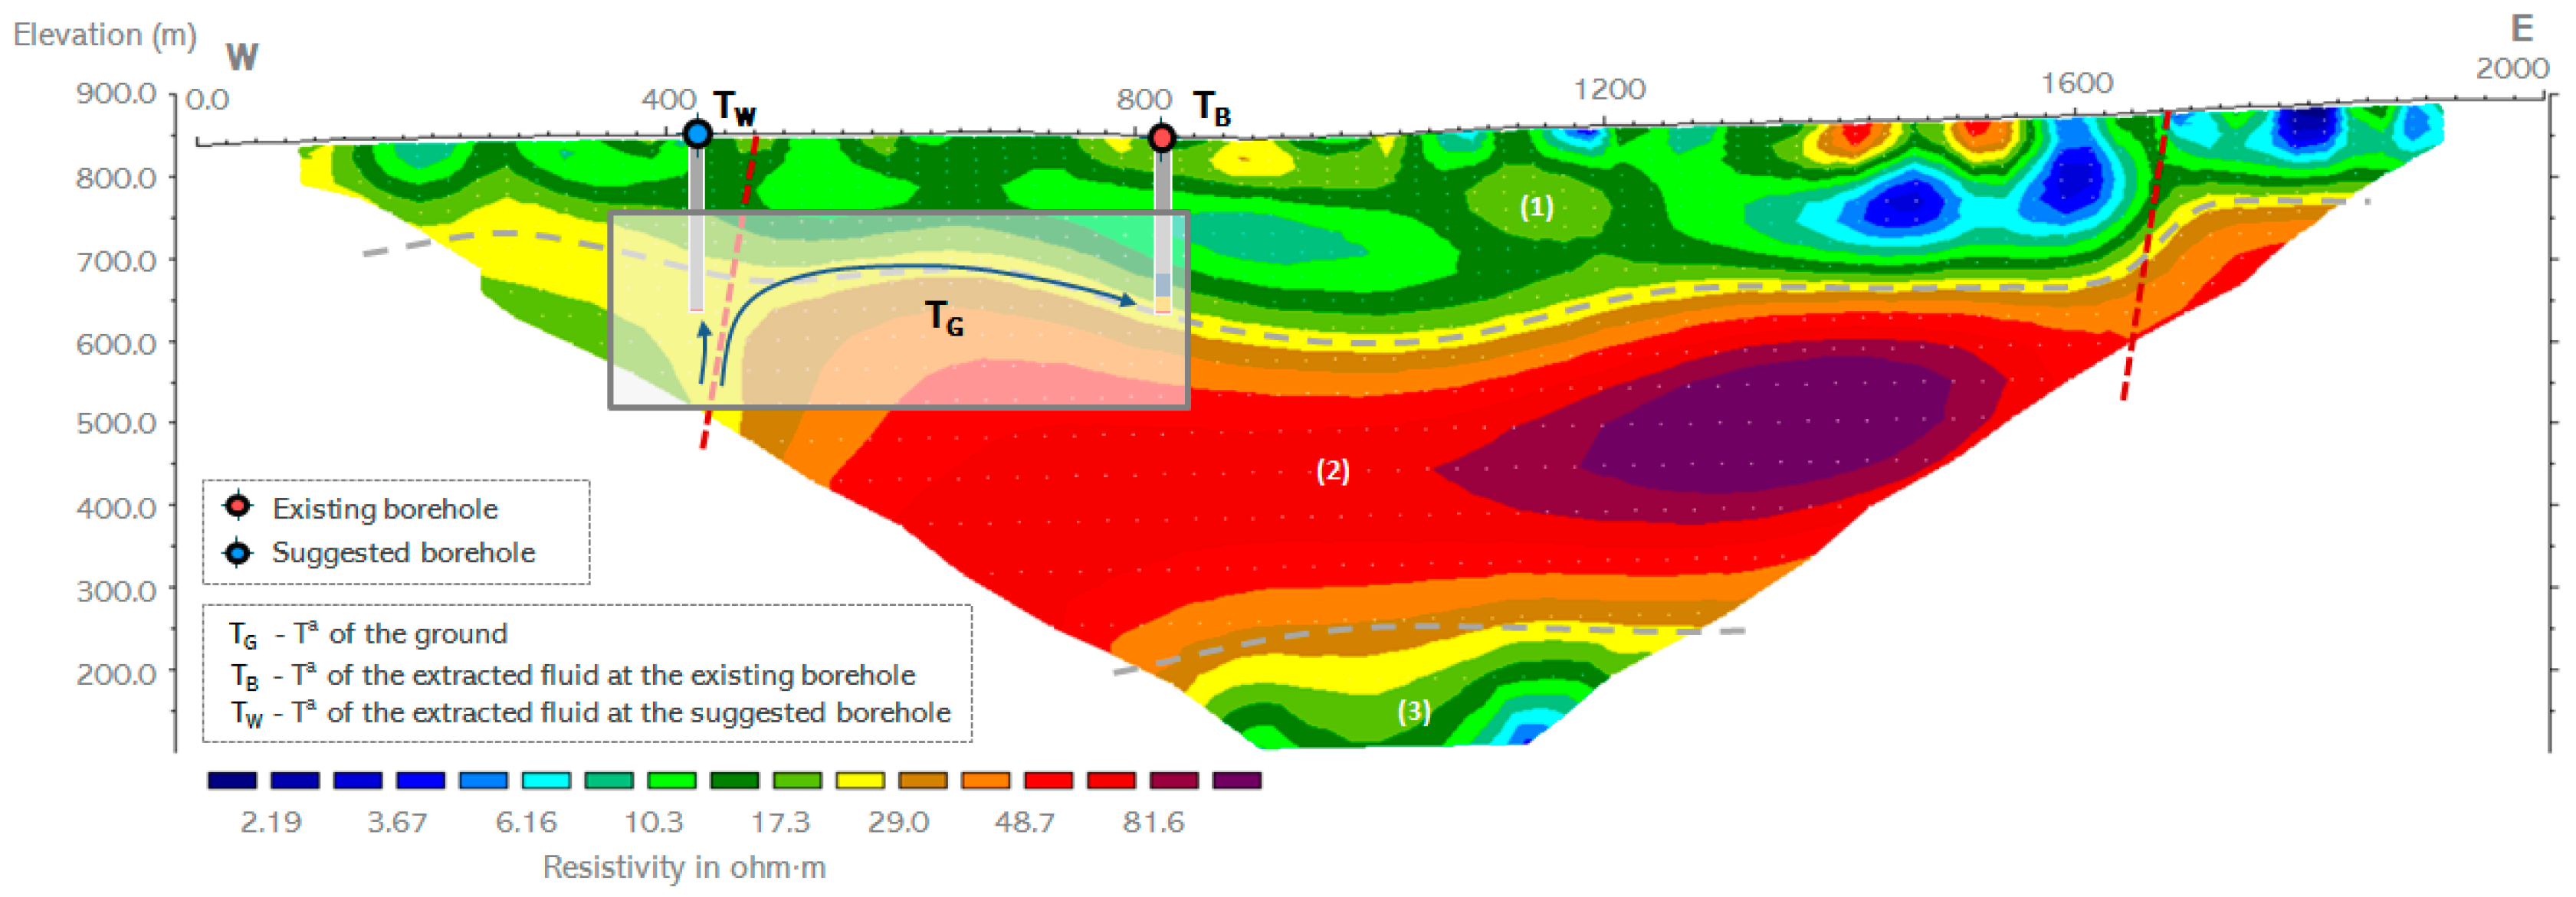
- A first outcropping surface layer (1) of a relatively conductive nature, corresponding to Cretaceous and Upper Jurassic materials mainly constituted by alternations of sandy, limestone, and marly materials. As observed in the 2D profile, Layer (1) presents a more conductive character in the extreme east, indicating the majority presence of clays and marls. Regarding the thickness of the layer, it ranges between 120–250 m.
- An intermediate resistive layer (2), constituted by carbonate materials from the middle and lower Jurassic. This layer has a significant thickness higher than 300 m and presents two main fracture areas (also included in Figure 4):
- ○
- A fracture located around Meter 450 of the 2D profile. The area is defined by the lateral change in resistivity observed in the model that descends at that point in a westerly direction. It should be noted that this fracture context agrees with the fault mapped by the consulted geological database [23], which intersects the trace of the profile at this point, but with a very oblique character. This factor could influence the resistivity values obtained from the geophysical prospecting campaign.
- ○
- A fracture formation appearing approximately at Meter 1700 of the ERT profile, defined by the jump and elevation observed at the top of layer (2), estimated at about 80 m.
- A final conductive basal layer (3), determined by the clear decrease in resistivity, which could indicate the presence of Triassic materials.
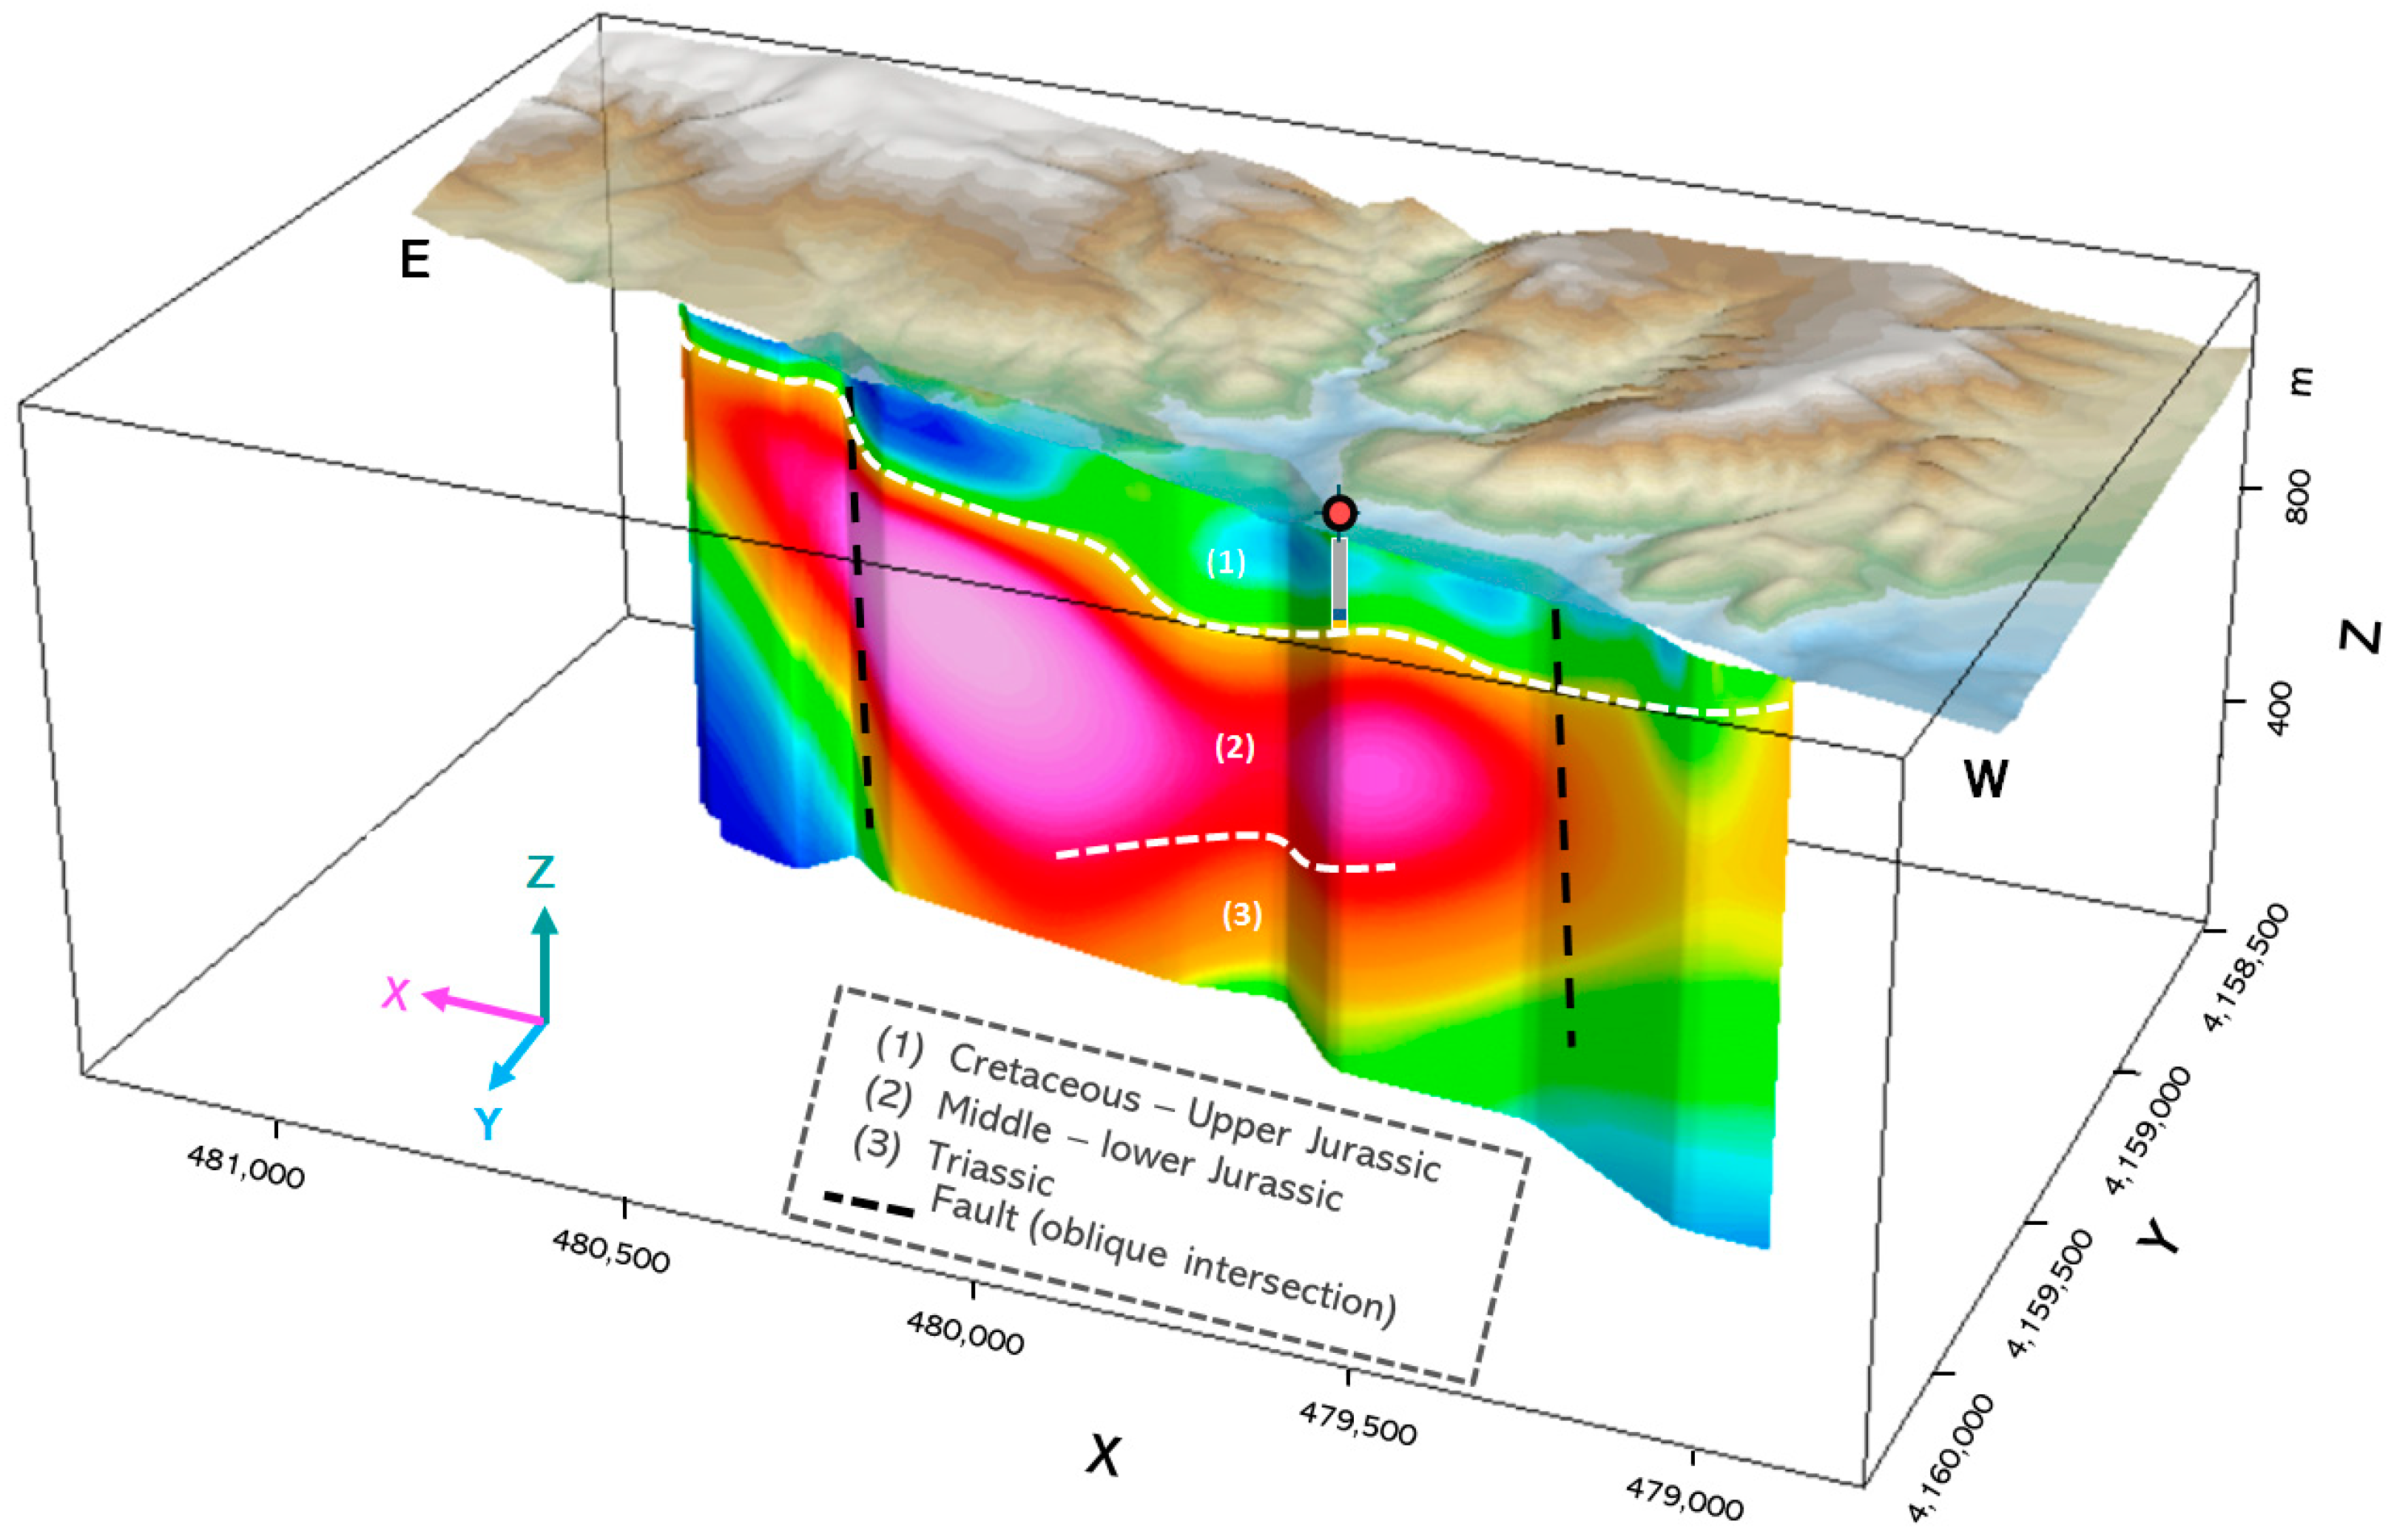
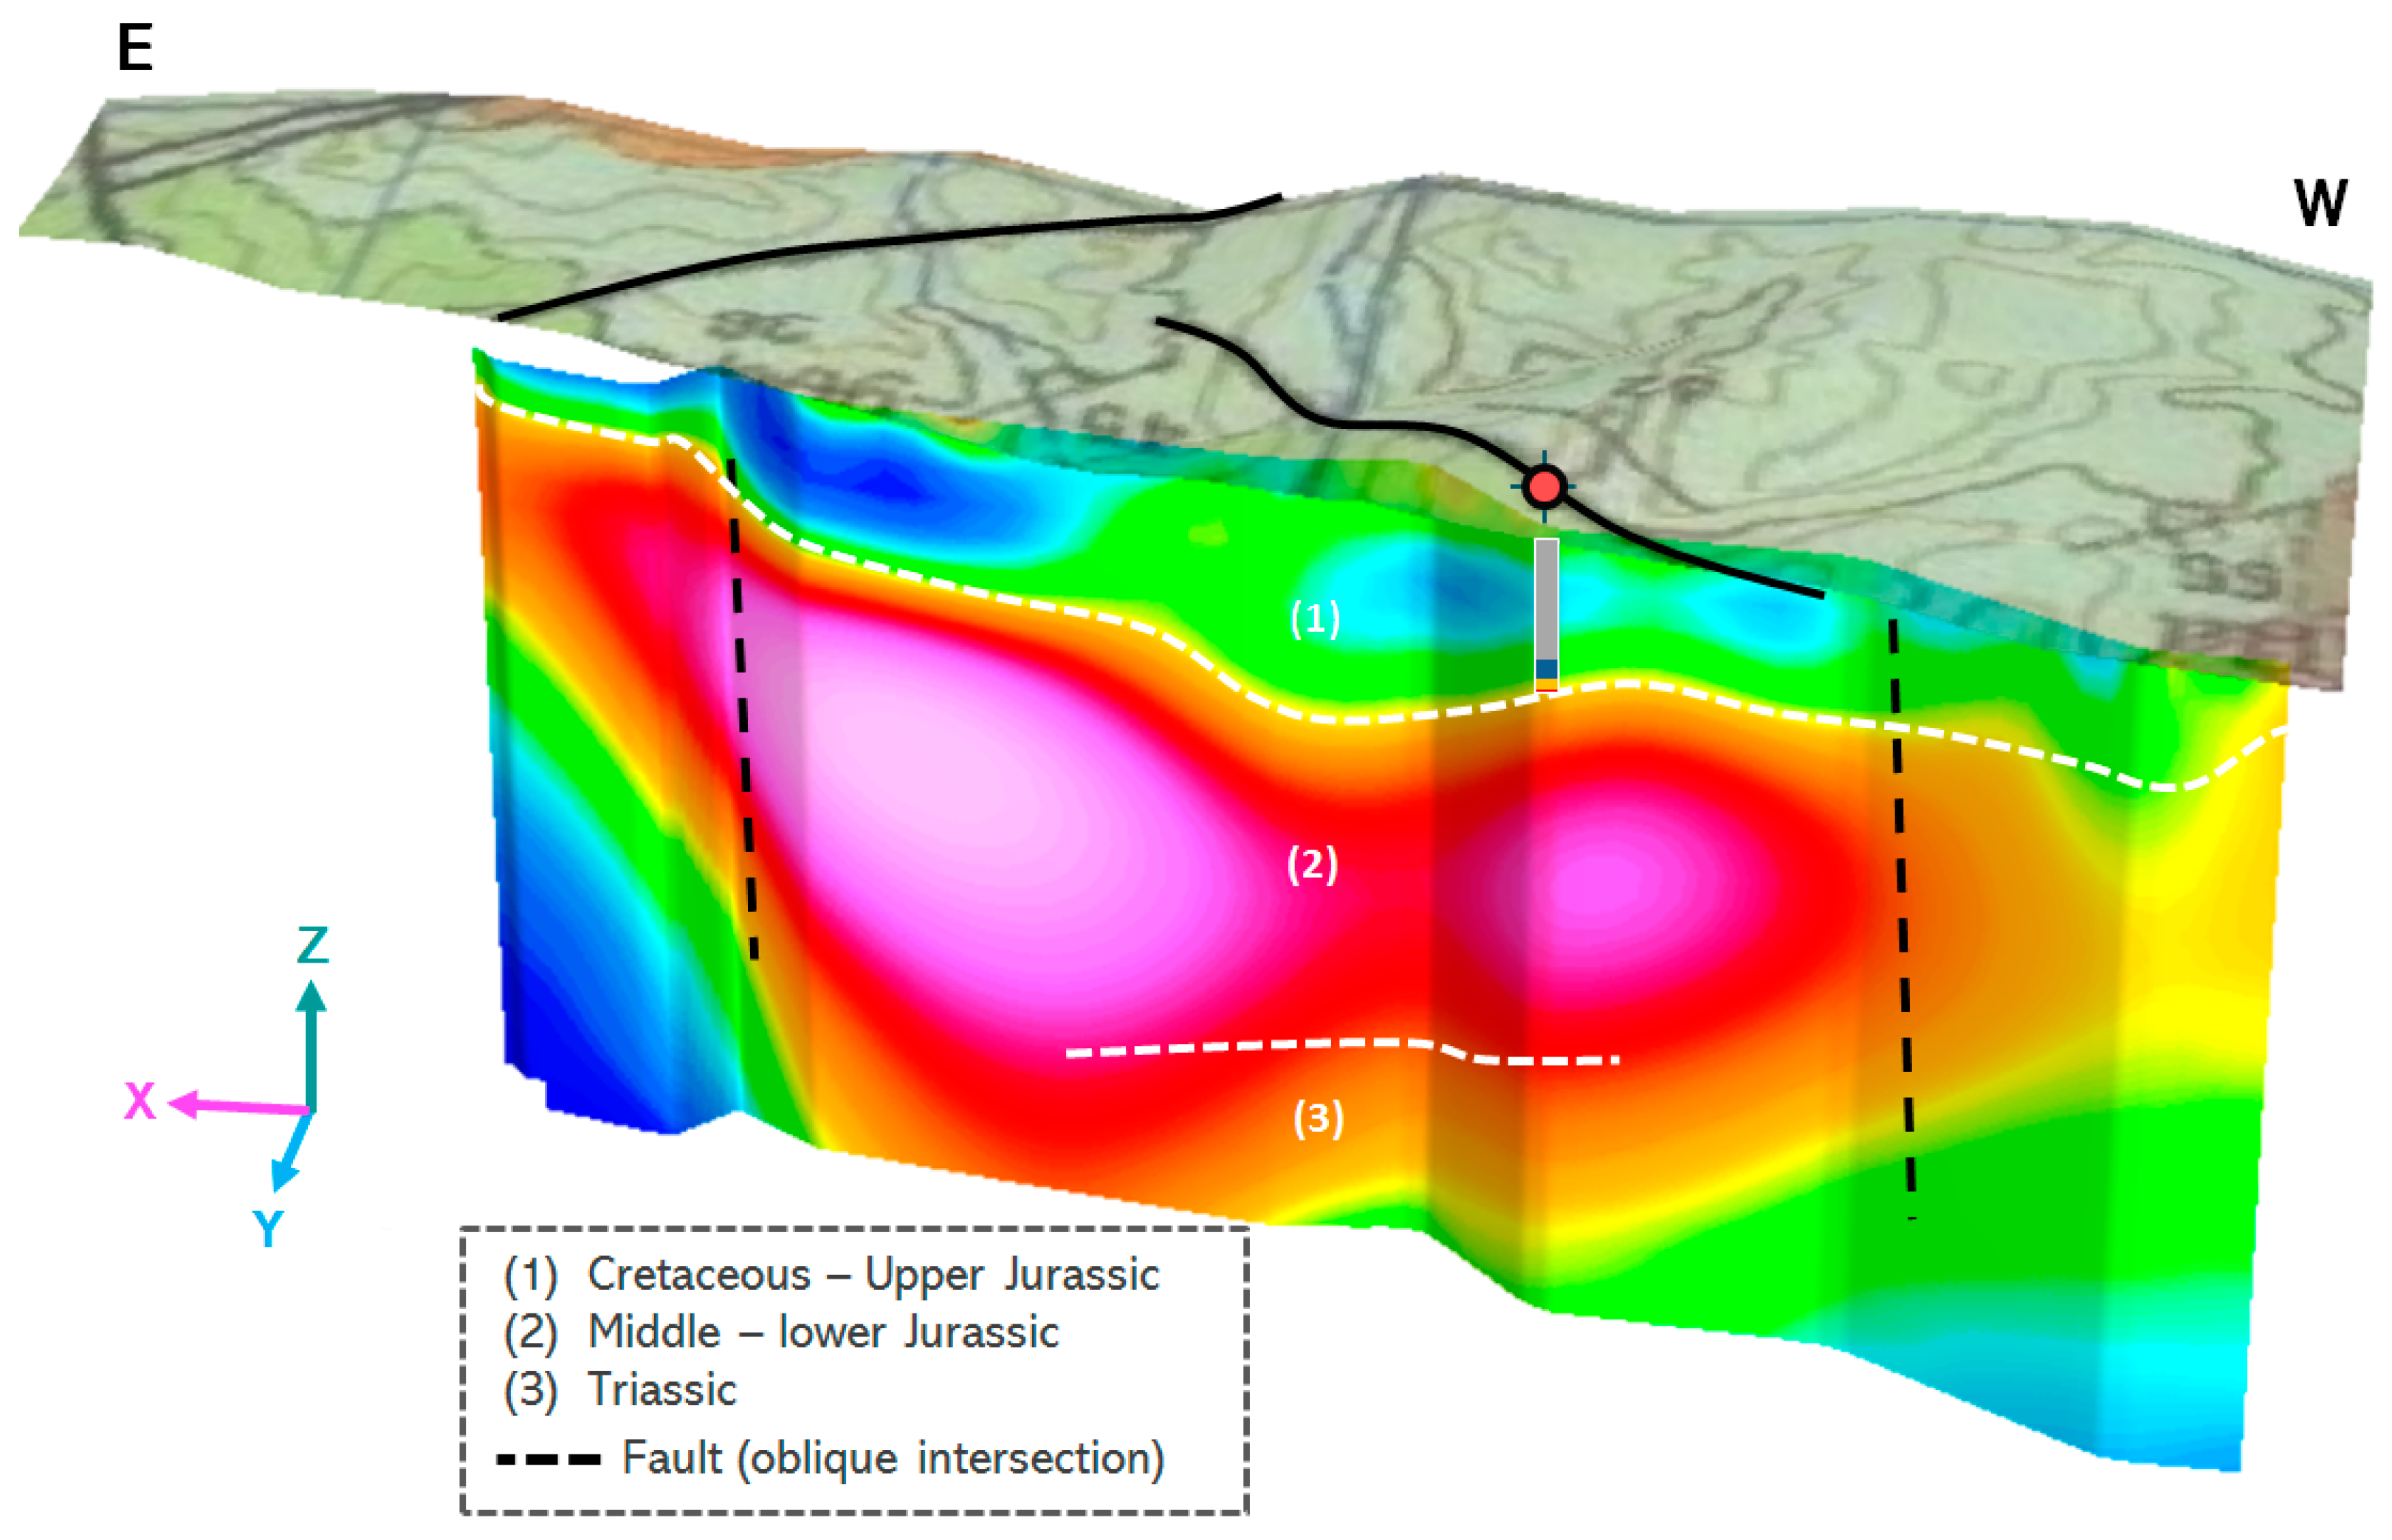
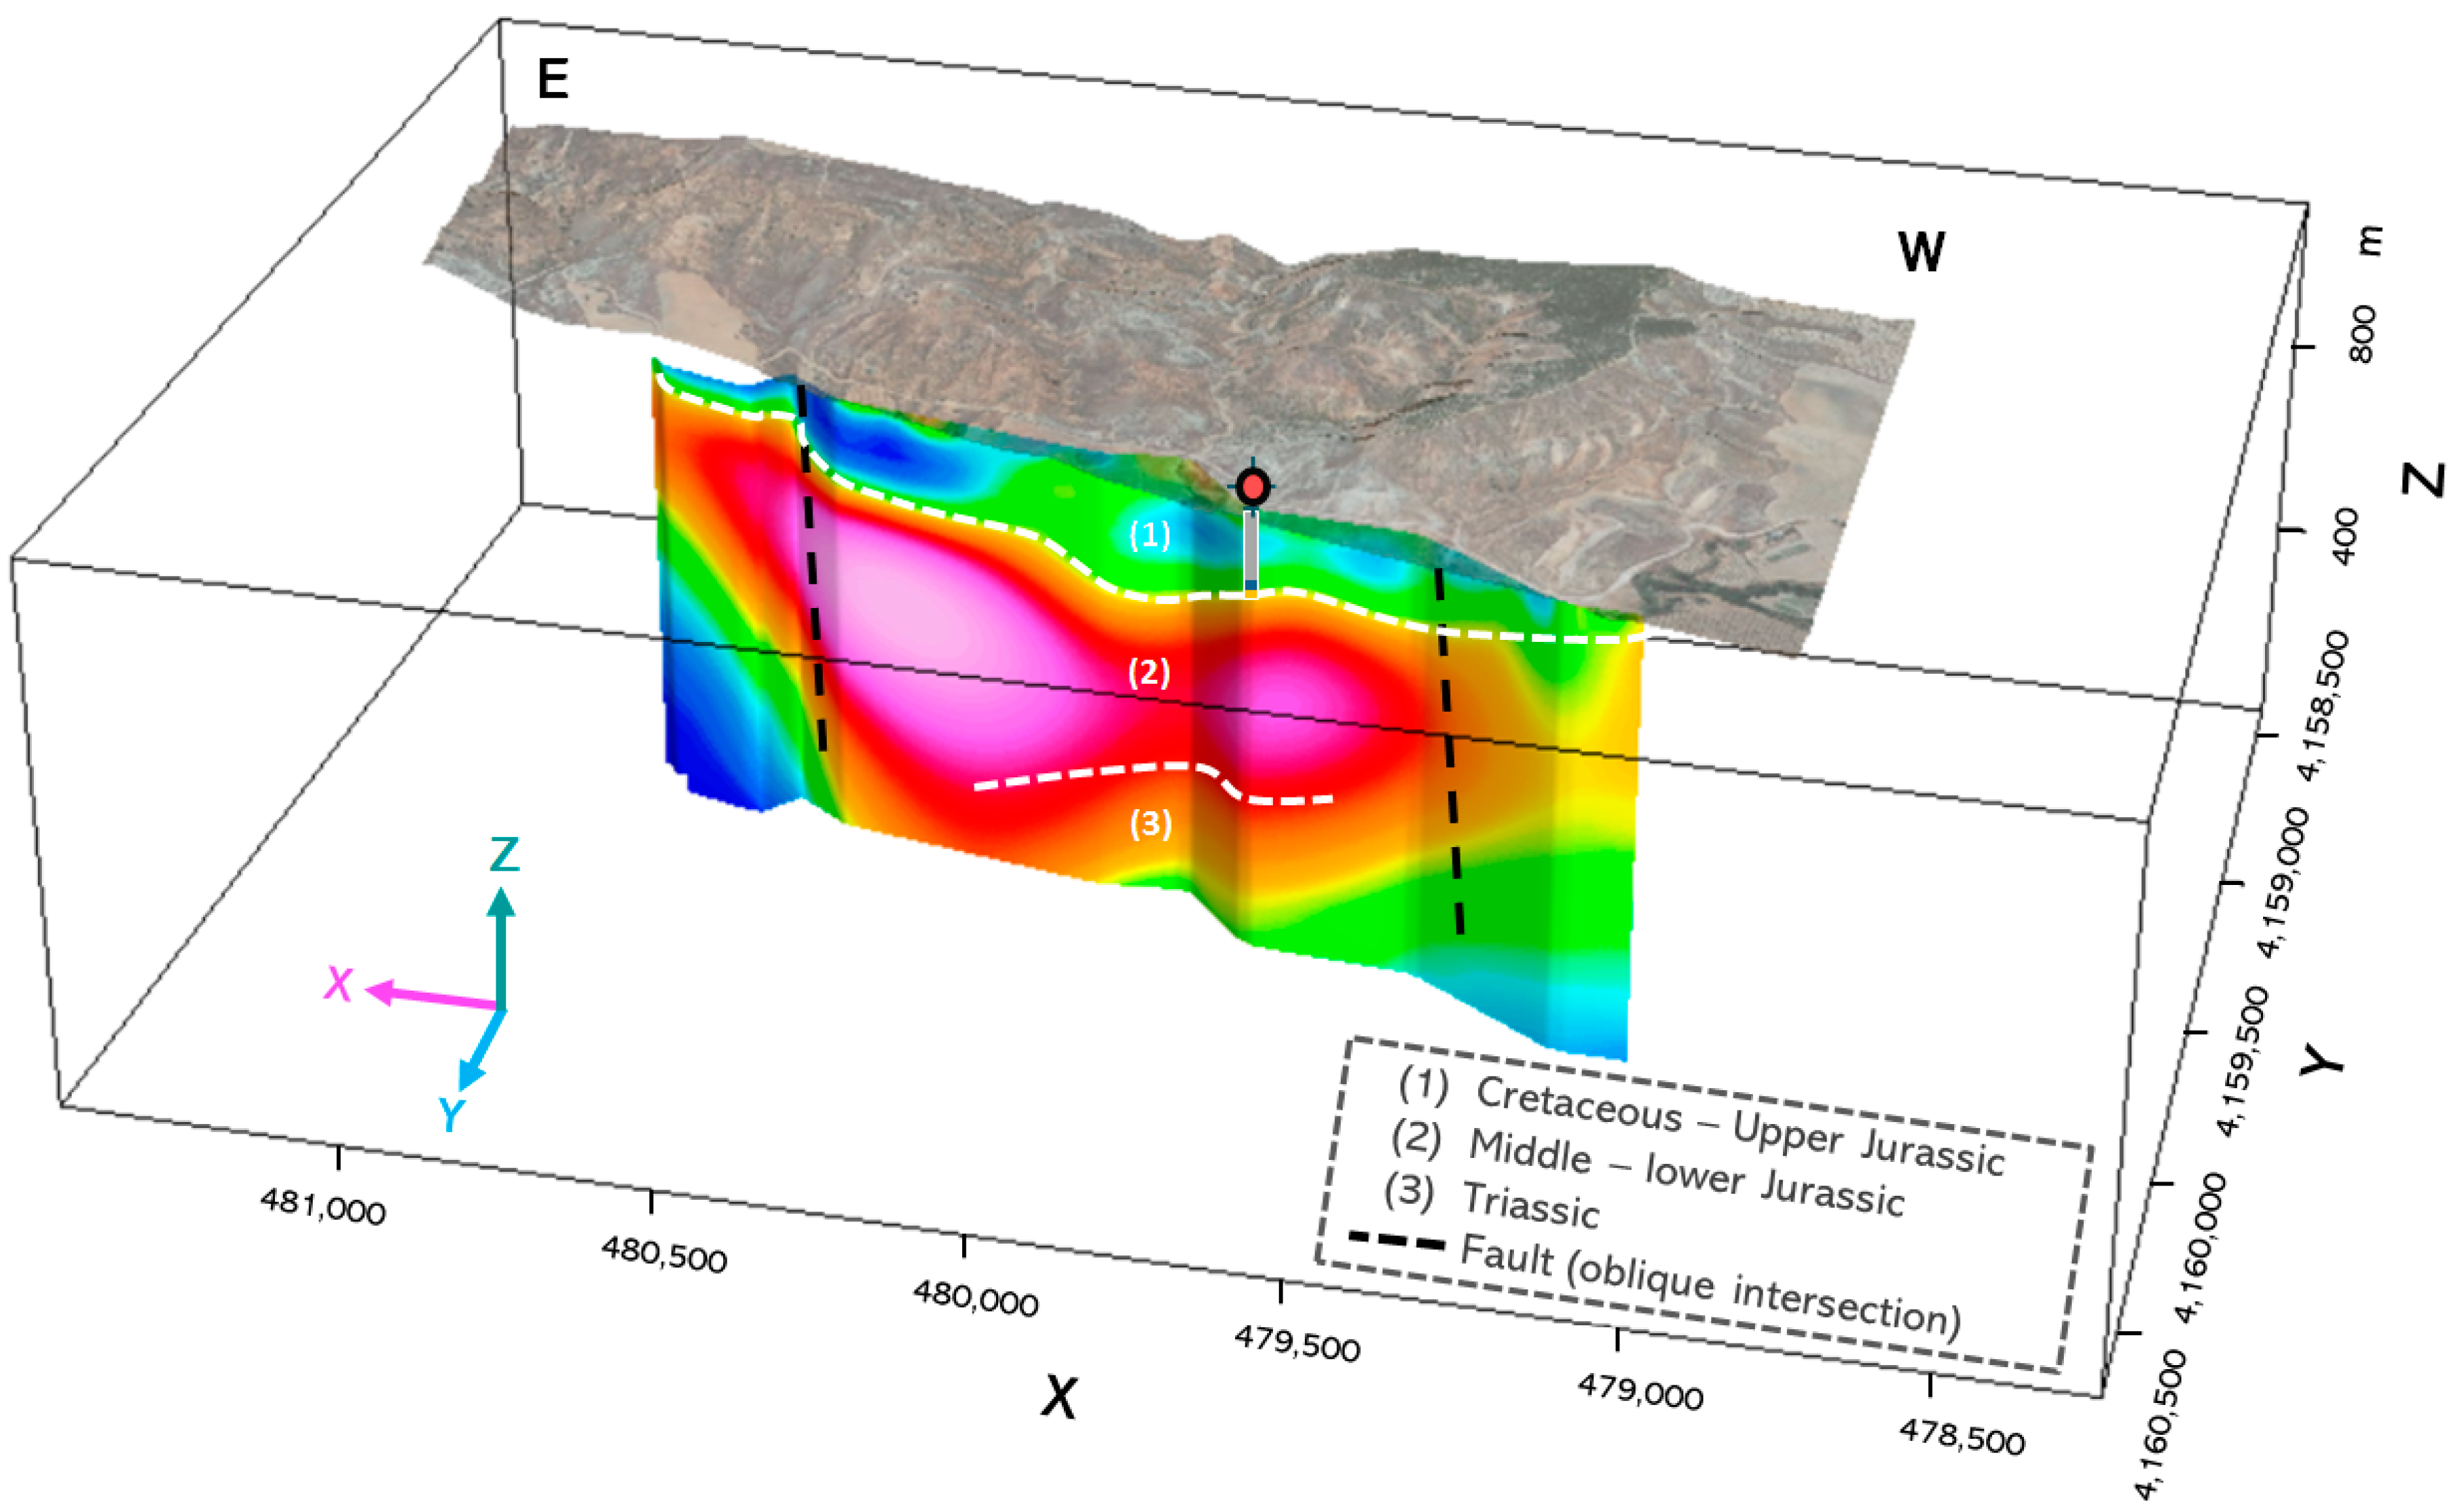
4.2. Pseudo-3D ERT Model
5. Discussion
5.1. Model Validation
5.2. Geothermal Exploitation

| Main Site Parameters | |
| Flow diameter (DF) | 3.2 m |
| Ground Temperature (TG) | 19.5 °C |
| Temperature of the water borehole (TB) | 35.2 °C |
| Length of the area (LA) | 400 m |
| Thickness of the area (TA) | 40 m |
| Considered depth (DP) | 220 m |
| Fluid Properties | |
| Kinematic viscosity | 1 × 10⁻⁶ m2/s |
| Dynamic viscosity | 1 × 10⁻³ kg/m·s |
| Specific heat (cp) | 4184 J/kg·K |
| Thermal conductivity (k) | 0.6 W/m·K |
6. Conclusions
Author Contributions
Funding
Data Availability Statement
Acknowledgments
Conflicts of Interest
Nomenclature
| Acronyms | |
| GHP | Geothermal Heat Pump |
| GSHP | Ground-Source Heat Pump |
| GWHP | Ground-Water Heat Pump |
| NZEB | Nearly Zero-Energy Building |
| ERT | Electrical-Resistivity Tomography |
| GPS | Global Positioning System |
| IGME | Instituto Geológico y Minero de España |
| DF | Flow diameter |
| TG | Ground Temperature |
| TB | Temperature of the water borehole |
| Temperature of the water | |
| LA | Length of the area |
| TA | Thickness of the area |
| DP | Considered depth |
| Kinematic viscosity | |
| v | Flow velocity |
| Dynamic viscosity | |
| cp | Specific heat |
| k | Thermal conductivity |
| Re | Reynolds number |
| Pr | Prandtl number |
| Nu | Nusselt number |
| h | Thermal convection coefficient |
| Area of circulation of the fluid in the formation | |
| Mass flow rate | |
| E | Specific energy |
| m | Mass of the circulating fluid |
References
- Fridleifsson, I.B. Geothermal energy for the benefit of the people. Renew. Sustain. Energy Rev. 2001, 5, 299–312. [Google Scholar] [CrossRef]
- García-Gil, A.; Goetzl, G.; Kłonowski, M.R.; Borovic, S.; Boon, D.P.; Abesser, C.; Janza, M.; Herms, I.; Petitclerc, E.; Erlström, M.; et al. Governance of shallow geothermal energy resources. Energy Policy 2020, 138, 111283. [Google Scholar] [CrossRef]
- Dickson, M.H.; Fanelli, M. Geothermal Energy: Utilization and Technology; Routledge: London, UK, 2013; ISBN 978-1-84407-184-5. [Google Scholar]
- Lund, J.W.; Toth, A.N. Direct utilization of geothermal energy 2020 worldwide review. Geothermics 2021, 90, 101915. [Google Scholar] [CrossRef]
- Sáez Blázquez, C.; Martín Nieto, I.; Farfán Martín, A.; González-Aguilera, D.; Carrasco García, P. Comparative analysis of different methodologies used to estimate the ground thermal conductivity in low enthalpy geothermal systems. Energies 2019, 12, 1672. [Google Scholar] [CrossRef]
- Limberger, J.; Boxem, T.; Pluymaekers, M.; Bruhn, D.; Manzella, A.; Calcagno, P.; Beekman, F.; Cloetingh, S.; van Wees, J.-D. Geothermal energy in deep aquifers: A global assessment of the resource base for direct heat utilization. Renew. Sustain. Energy Rev. 2018, 82, 961–975. [Google Scholar] [CrossRef]
- Rybach, L. Global Status, Development and Prospects of Shallow and Deep Geothermal Energy. Int. J. Terr. Heat Flow Appl. Geotherm. 2022, 5, 20–25. [Google Scholar] [CrossRef]
- Lund, J.W.; Huttrer, G.W.; Toth, A.N. Characteristics and trends in geothermal development and use, 1995 to 2020. Geothermics 2022, 105, 102522. [Google Scholar] [CrossRef]
- Blázquez, C.S.; Borge-Diez, D.; Nieto, I.M.; Martín, A.F.; González-Aguilera, D. Multi-parametric evaluation of electrical, biogas and natural gas geothermal source heat pumps. Renew. Energy 2021, 163, 1682–1691. [Google Scholar] [CrossRef]
- D’Agostino, D.; Mazzarella, L. What is a Nearly zero energy building? Overview, implementation and comparison of definitions. J. Build. Eng. 2019, 21, 200–212. [Google Scholar] [CrossRef]
- Blázquez, C.S.; Borge-Diez, D.; Nieto, I.M.; Martín, A.F.; González-Aguilera, D. Technical optimization of the energy supply in geothermal heat pumps. Geothermics 2019, 81, 133–142. [Google Scholar] [CrossRef]
- Magrini, A.; Lentini, G.; Cuman, S.; Bodrato, A.; Marenco, L. From nearly zero energy buildings (NZEB) to positive energy buildings (PEB): The next challenge-The most recent European trends with some notes on the energy analysis of a forerunner PEB example. Dev. Built Environ. 2020, 3, 100019. [Google Scholar] [CrossRef]
- Sorman, A.H.; García-Muros, X.; Pizarro-Irizar, C.; González-Eguino, M. Lost (and found) in Transition: Expert stakeholder insights on low-carbon energy transitions in Spain. Energy Res. Soc. Sci. 2020, 64, 101414. [Google Scholar] [CrossRef]
- Arrizabalaga, I.; De Gregorio, M.; De Santiago, C.; García de la Noceda, C.; Pérez, P.; Urchueguía, J.F. Country update for the Spanish geothermal sector. In Proceedings of the World Geothermal Congress, Melbourne, Australia, 19–24 April 2015; pp. 19–24. [Google Scholar]
- Arrizabalaga, I.; De Gregorio, M.; De Santiago, C.; García de la Noceda, C.; Pérez, P.; Urchueguía, J.F. Country update for the Spanish geothermal sector. In Proceedings of the World Geothermal Congress, Reykjavik, Iceland, 27 April–1 May 2020; p. 12. [Google Scholar]
- Vivas, C.; Salehi, S.; Tuttle, J.D.; Rickard, B. Challenges and opportunities of geothermal drilling for renewable energy generation. GRC Trans. 2020, 44, 904–918. [Google Scholar]
- Anderson, A.; Rezaie, B. Geothermal technology: Trends and potential role in a sustainable future. Appl. Energy 2019, 248, 18–34. [Google Scholar] [CrossRef]
- Blázquez, C.S.; Nieto, I.M.; González, M.Á.M.; García, P.C.; Martín, A.F.; González-Aguilera, D. Geophysical exploration for shallow geothermal applications: A case study in Artà, (Balearic Islands, Spain). Geothermics 2022, 105, 102517. [Google Scholar] [CrossRef]
- Sáez Blázquez, C.; Carrasco García, P.; Nieto, I.M.; Maté-González, M.Á.; Martín, A.F.; González-Aguilera, D. Characterizing geological heterogeneities for geothermal purposes through combined geophysical prospecting methods. Remote Sens. 2020, 12, 1948. [Google Scholar] [CrossRef]
- Carrier, A.; Fischanger, F.; Gance, J.; Cocchiararo, G.; Morelli, G.; Lupi, M. Deep electrical resistivity tomography for the prospection of low-to medium-enthalpy geothermal resources. Geophys. J. Int. 2019, 219, 2056–2072. [Google Scholar] [CrossRef]
- Nieto, I.M.; Carrasco García, P.; Sáez Blázquez, C.; Farfán Martín, A.; González-Aguilera, D.; Carrasco García, J. Geophysical prospecting for geothermal resources in the south of the Duero Basin (Spain). Energies 2020, 13, 5397. [Google Scholar] [CrossRef]
- Ismail, N.; Syukri, M.; Idroes, R. Deep and shallow structures of geothermal Seulawah Agam based on electromagnetic and magnetic data. Geomate J. 2019, 16, 141–147. [Google Scholar] [CrossRef]
- Mohamed, M.A.; Pajares, A.J.M.; Moreno, J.L.; Herrador, M.B.; Álvarez, F.P.; Reyes, J.M.G. Phylogenetic relationships of “Erysimum”(Brassicaceae) from the Baetic Mountains (SE Iberian Peninsula). In Anales del Jardín Botánico de Madrid; Real Jardín Botánico: Madrid, Spain, 2014; Volume 71, p. 5. [Google Scholar] [CrossRef]
- Sala, M. Baetic Cordillera and Guadalquivir Basin. In Geomorphology of Europe; Palgrave: London, UK, 1984; pp. 323–340. [Google Scholar] [CrossRef]
- Albir, A.E.; López Olmedo, F.L.; Díaz de Neira, J.A. Mapa y memoria explicativa de la Hoja 970, El Rubio. MAGNA. IGME. 1981. [Google Scholar]
- Guzmán, S.J. Sondeo de Agua Minero Industrial de Origen Termal “Alamedilla 1” Capacity Report; Junta de Andalucía: Andalusia, Spain, 2015. [Google Scholar]
- Lévy, L.; Maurya, P.K.; Byrdina, S.; Vandemeulebrouck, J.; Sigmundsson, F.; Árnason, K.; Ricci, T.; Deldicque, D.; Roger, M.; Gibert, B.; et al. Electrical resistivity tomography and time-domain induced polarization field investigations of geothermal areas at Krafla, Iceland: Comparison to borehole and laboratory frequency-domain electrical observations. Geophys. J. Int. 2019, 218, 1469–1489. [Google Scholar] [CrossRef]
- Singh, S.; Gautam, P.K.; Bagchi, D.; Singh, S.; Kumar, S.; Kannaujiya, S. 2D electrical resistivity imaging for geothermal groundwater characterization and rejuvenation of the Gaurikund hot spring in the Main Central Thrust (MCT) zone of the Garhwal Himalaya, Uttrakhand, India. Groundw. Sustain. Dev. 2021, 15, 100686. [Google Scholar] [CrossRef]
- Kumar, D.; Thiagarajan, S.; Rai, S.N. Deciphering geothermal resources in Deccan Trap region using electrical resistivity tomography technique. J. Geol. Soc. India 2011, 78, 541–548. [Google Scholar] [CrossRef]
- Vanhooren, L.; Fontaine, O.; Caudron, C.; Vrancken, E.; Dekoninck, W.; De Lathauwer, H.; Hermans, T. Characterization and Monitoring of the Gunnuhver Geothermal Site Using Electrical Methods (No. EGU23-12873); Copernicus Meetings; EGU: Vienna, Austria, 2023. [Google Scholar] [CrossRef]
- Cheng, Y.; Wang, C.; Da, W.; Kong, Y.; Hu, X. Anatomy of the convective geothermal system from geophysical and hydrochemical data: A case study from the Changshou geothermal field, South China. Geophysics 2023, 88, 1–43. [Google Scholar] [CrossRef]
- Ussher, G.; Harvey, C.; Johnstone, R.; Anderson, E. Understanding the resistivities observed in geothermal systems. In Proceedings of the World Geothermal Congress, Kyushu, Japan, 28 May–10 June 2000; pp. 1915–1920. [Google Scholar]
- Marwan, M.; Isa, M.; Idroes, R.; Nursyafira, N.; Idris, S.; Yanis, M.; Ghani, A.A.; Paembonan, A.Y. Geoelectrical Model of Geothermal Spring in ie Jue Seulawah Deriving from 2D Vlf-Em and dc Resistivity Methods. J. Appl. Eng. Sci. 2023, 21, 59–69. [Google Scholar] [CrossRef]
- Abdullah, A.I.; Musa, M.D.T.; Uno, I.; Jayadi, H. Resistivity model of hallow subsurface to find the path of geothermal manifestation in Bora Village of Sigi Regency of Central Sulawesi. J. Phys. Conf. Ser. 2019, 1242, 012048. [Google Scholar] [CrossRef]
- Cumming, W.; Mackie, R. Resistivity imaging of geothermal resources using 1D, 2D and 3D MT inversion and TDEM static shift correction illustrated by a Glass Mountain case history. In Proceedings of the World Geothermal Congress, Bali, Indonasia, 25–30 April 2010; pp. 25–29. [Google Scholar]
- Arjwech, R.; Everett, M.E. Application of 2D electrical resistivity tomography to engineering projects: Three case studies. Songklanakarin J. Sci. Technol. 2015, 37, 675–681. [Google Scholar]
- Zhou, B.; Bouzidi, Y.; Ullah, S.; Asim, M. A full-range gradient survey for 2D electrical resistivity tomography. Near Surf. Geophys. 2020, 18, 609–626. [Google Scholar] [CrossRef]
- Carrasco García, P. Avance en Técnicas Geofísicas Para la Caracterización del Subsuelo Mediante Innovación y el Uso de Herramientas de Gestión de Información Espacial. Ph.D. Thesis, Escuela Politécnica Superior de Ávila, Univ de Salamanca, Ávila, Spain, 2013; p. 523. [Google Scholar]
- Robain, H.; Bobachev, A. X2IPI Toolbox for 2D DC measurements with SYSCAL equipment. User manual, 2002; 25p. [Google Scholar]
- Loke, M.H.; Dahlin, T. A comparison of the Gauss–Newton and quasi-Newton methods in resistivity imaging inversion. J. Appl. Geophys. 2002, 49, 149–162. [Google Scholar] [CrossRef]
- Telford, W.M.; Telford, W.M.; Geldart, L.P.; Sheriff, R.E. Applied Geophysics; Cambridge University Press: Cambridge, UK, 1990; ISBN 1139642928/9781139642927. [Google Scholar]
- Arifin, M.H.; Kayode, J.S.; Ismail, K.I.; Abdullah, M.; Embrandiri, A.; Nazer, S.M.; Azmi, A. Data for the industrial and municipal environmental wastes hazard contaminants assessment with integration of RES2D techniques and Oasis Montaj software. Data Brief 2020, 33, 106595. [Google Scholar] [CrossRef]
- Galindo-Zaldívar, J.; Jabaloy, A.; Serrano, I.; Morales, J.; González-Lodeiro, F.; Torcal, F. Recent and present-day stresses in the Granada Basin (Betic Cordilleras): Example of a late Miocene-present-day extensional basin in a convergent plate boundary. Tectonics 1999, 18, 686–702. [Google Scholar] [CrossRef]
- Mao, Y.; Zhang, Y. Thermal conductivity, shear viscosity and specific heat of rigid water models. Chem. Phys. Lett. 2012, 542, 37–41. [Google Scholar] [CrossRef]
- Abraham, J.P.; Sparrow, E.M.; Tong, J.C.K. Heat transfer in all pipe flow regimes: Laminar, transitional/intermittent, and turbulent. Int. J. Heat Mass Transf. 2009, 52, 557–563. [Google Scholar] [CrossRef]
- Crittenden, J.C.; Trussell, R.R.; Hand, D.W.; Howe, K.J.; Tchobanoglous, G. MWH’s Water Treatment: Principles and Design, 3rd ed.; John Wiley & Sons: Hoboken, NJ, USA, 1861; ISBN 978-0-470-40593-0. [Google Scholar]
- Domenico, P.A.; Palciauskas, V.V. Theoretical analysis of forced convective heat transfer in regional ground-water flow. Geol. Soc. Am. Bull. 1973, 84, 3803–3814. [Google Scholar] [CrossRef]


| Use | MWt | TJ/Year |
|---|---|---|
| Individual space heating | 5.20 | 133.6 |
| Greenhouse heating | 22.0 | 165.4 |
| Bath and swimming | 3.80 | 92.0 |
| Geothermal heat pumps | 513.0 | 3542.0 |
| Total for the country | 544.0 | 3933.0 |
| Length | Geological Description |
|---|---|
| 0–170 m | Alternations of light and white colors marls assigned to the middle–lower Cretaceous |
| 170–198 m | Alternation of sandy and marl sections with limestone From the Lower Cretaceous and Upper Jurassic |
| 198–214 m | Marls and white limestones from the Middle Jurassic |
| 214–219 m | Tabled limestone and karstified gray dolomitic limestone |
| Scenario | (°C) | E (J) | E (th) |
|---|---|---|---|
| Existing drilling | 15.70 | 1.42 × 10¹⁰ | 3388.93 |
| Suggested drilling | 29.39 | 2.66 × 10¹⁰ | 6343.99 |
Disclaimer/Publisher’s Note: The statements, opinions and data contained in all publications are solely those of the individual author(s) and contributor(s) and not of MDPI and/or the editor(s). MDPI and/or the editor(s) disclaim responsibility for any injury to people or property resulting from any ideas, methods, instructions or products referred to in the content. |
© 2024 by the authors. Licensee MDPI, Basel, Switzerland. This article is an open access article distributed under the terms and conditions of the Creative Commons Attribution (CC BY) license (https://creativecommons.org/licenses/by/4.0/).
Share and Cite
Sáez Blázquez, C.; Martín Nieto, I.; Carrasco, J.; Carrasco, P.; Porras, D.; Maté-González, M.Á.; Farfán Martín, A.; González-Aguilera, D. Applying Deep Electrical-Resistivity Tomography Techniques for the Exploration of Medium- and Low-Geothermal Energy Resources. Energies 2024, 17, 1836. https://doi.org/10.3390/en17081836
Sáez Blázquez C, Martín Nieto I, Carrasco J, Carrasco P, Porras D, Maté-González MÁ, Farfán Martín A, González-Aguilera D. Applying Deep Electrical-Resistivity Tomography Techniques for the Exploration of Medium- and Low-Geothermal Energy Resources. Energies. 2024; 17(8):1836. https://doi.org/10.3390/en17081836
Chicago/Turabian StyleSáez Blázquez, Cristina, Ignacio Martín Nieto, Javier Carrasco, Pedro Carrasco, Daniel Porras, Miguel Ángel Maté-González, Arturo Farfán Martín, and Diego González-Aguilera. 2024. "Applying Deep Electrical-Resistivity Tomography Techniques for the Exploration of Medium- and Low-Geothermal Energy Resources" Energies 17, no. 8: 1836. https://doi.org/10.3390/en17081836
APA StyleSáez Blázquez, C., Martín Nieto, I., Carrasco, J., Carrasco, P., Porras, D., Maté-González, M. Á., Farfán Martín, A., & González-Aguilera, D. (2024). Applying Deep Electrical-Resistivity Tomography Techniques for the Exploration of Medium- and Low-Geothermal Energy Resources. Energies, 17(8), 1836. https://doi.org/10.3390/en17081836