1. Introduction
The liberalization of retail and wholesale markets increases competition in electricity markets [
1]. Suppliers, producers, aggregators, retailers, and big consumers trade energy in competitive wholesale markets [
2]. Wholesale markets usually are divided into long-term derivative and bilateral markets, short-term marginal day-ahead and intraday markets, close to real-time marginal real-time markets and continuous pay-as-bid intraday markets, and real-time ancillary services [
3,
4]. The liberalization of retail markets increased the number of different suppliers, such as retailers, aggregators, traders, and, more recently, energy communities, also known as “Citizen Energy Communities” (CECs) or Local Energy Communities. Furthermore, retail competition increases the number of tariffs proposed to consumers in retail markets. Consumers may choose the best tariff according to their load profiles [
5,
6]. Suppliers shall study consumers’ behavior and propose attractive tariffs to persuade them to join their portfolios [
6,
7,
8]. The switching behavior of consumers increases retail competition and reduces tariffs [
8,
9].
The worldwide goals for a carbon-neutral society and the decreasing costs of new renewable plants, e.g., solar PV plants, increases the number of decentralized power plants and the possible competitiveness of CECs [
10,
11,
12]. Furthermore, electrification and sector coupling are increasing the need for electrical energy for cooking, heating, cooling, electric vehicles, heat pumps, etc. [
13]. Indeed, investments in variable renewable energy sources (vRES) and electrification reduce pollution, energy poverty, and outside dependency by reducing the need for fossil fuels [
14,
15,
16].
Traditionally, energy resources were extracted or generated in large centralized industries. In the case of electrical energy, big power plants produced energy, which was transported and then distributed to end-use consumers [
3]. Centralized and liberalized energy markets have been created to increase competition, but local markets and balance are important to avoid grid congestion and incentivize local sustainability [
17,
18,
19]. The increasing number of decentralized energy resources increases the complexity of managing distribution grids [
20]. Furthermore, it originates a new paradigm where energy flows go from distribution to transmission power grids. The increasing number of decentralized generation and demand led governments to provide economic incentives to local citizen energy communities (CECs) [
21,
22]. They have grid access discounts, incentivizing their local self-consumption and energy sustainability, which may reduce the usage of high-voltage power grids and avoid their consequent congestion [
23,
24]. Thus, flexible CECs are incentivized to help the management of the local grid, reducing the effort of local system operators [
20,
25].
Against this background, consumers are incentivized to be part of CECs and to manage their local resources [
26,
27,
28,
29]. Indeed, the European legislation’s flexibility regarding CECs allows the formation of multiple types of energy communities, from a microgrid community with one owner similar to a prosumer to a national-level virtual community similar to a retailer [
30,
31,
32,
33,
34]. The main issues about the community business models consist of their formation, weight, and scope [
35,
36,
37,
38]. Multiple CECs’ business models have been proposed in the literature [
19,
39,
40]. Small CECs do not have all economic benefits by needing intermediaries to participate in wholesale markets, while virtual national-level CECs may have grid access and usage restrictions and costs [
32,
41,
42,
43,
44]. One of the main problems of local communities are their lack of expertise to become active market players [
42,
45]. Some CECs are formed by retailers, providing small discounts to consumers compared with their potential cost reduction [
9]. The formation and management of CECs are important to guarantee their economic sustainability [
35,
36,
37,
38]. CEC’s agents shall be equipped with decision protocols, intra-team strategies, forecast methodologies, and strategic bidding [
42,
46,
47,
48]. Furthermore, self-consumption CECs shall be capable to explore vRES generation complementarity, optimal investment models, and resource management [
36,
49,
50]. Legally, consumers can choose their suppliers without a fixed loyalty period. Thus, CECs with self-consumption shall propose attractive, stable, and diversified tariffs to guarantee the loyalty and retention of their members [
8,
9].
This article focuses on the competitiveness of local CECs. In this case, the community is considered large enough to participate in wholesale markets and invest in local generation, benefiting from reduced grid usage and access costs and contributing to the local energy balance [
51,
52]. This type of community proposes tariffs similar to retailers, attracting consumers to a well-known market environment [
6]. However, it also proposes tariffs indexed to local generation and dynamic market prices, preparing consumers for uncertain productions and prices of power systems with high vRES penetrations. Specifically, the purpose of this paper is three-fold:
Design of a business model for agent-based CECs, comprising competitive tariffs, optimal investment in local vRES, and strategic bidding of local net load by adapting different forecast methodologies;
Design of a model simulating consumers’ behavior when selecting tariffs and investing in self-consumption;
A study to test the previous models in the Iberian market of electricity (MIBEL) considering data of: (i) Portuguese consumers, (ii) market prices, and (iii) the vRES investment, operational, and maintenance costs.
The remainder of this paper is structured as follows.
Section 2 presents a literature review regarding citizen energy communities.
Section 3 presents the main concepts of electricity markets, bilateral contracts, and tariffs.
Section 4 presents the optimal assets investments of CECs, tariffs they propose to members, and their strategic bidding.
Section 5 presents the consumers’ behavior on retail markets.
Section 6 presents a study testing the negotiation models.
Section 7 summarizes the main conclusions of the work.
2. Literature Review
The liberalization and decarbonization of the energy sector led to the establishment of new, decentralized, small market players, such as prosumers. Deng and Lv [
14] presented a review of optimization models for power system planning with increasing penetrations of vRES. Hampton et al. [
9] presented a review of the three main retail strategies to engage consumers: client focus, tariff designs, and innovation. Small players may not have the expertise and weight to participate in wholesale markets. To avoid the use of intermediaries, they may form coalitions, such as local CECs.
Consumers are being incentivized to form CECs, with CECs being well spread worldwide [
19,
34,
39]. The European Union (EU) legislation strongly incentivizes the formation of CECs, from local microgrids to a national level (similar to retailers) [
30,
31]. Member states of the EU, such as Italy and Portugal, are investing billions of euros in the support of CECs and self-consumption. The Italian National Recovery and Resilience Plan allocated 2.2 billion EUR to incentive CECs [
53]. In Portugal, the regulator provides 50% and 100% discount in the General Economic Interest Cost (GEIC) as part of the grid-access price for CECs and CECs with self-consumption, respectively. This cost is paid by end-use consumers due to over costs of the tariff deficit related to the renewable support schemes, capacity mechanisms, and other externalities [
21]. In the United States, the Inflation Reduction Act of 2022 reserved 370 billion USD for financial incentives to support CECs that invest in renewable generation [
54]. In Australia, the Alkimos Beach trial, allowed a community of 119 households to share a battery during five years, resulting in savings of 81 thousand AUD, and a significant decrease in their peak net load [
55]. In India, the prosumers of a CEC in Lucknow with rooftop PV sell their excess energy between them for a price 43% lower than the wholesale price [
56]. In Brazil, the RevoluSolar energy initiative promoted energy sustainability in a favela by supporting a local CEC of 30 families with access to solar PV generation [
57]. In South Africa, a CEC composed of 30 consumers has been created with access to an embedded microgrid of rooftop PV aiming at provide local energy sustainability [
58,
59].
Ceglia et al. [
38] identified that the main barriers for the dissemination of CECs are lack of information and technical skills after analyzing 111 references, since they are mainly composed of consumers and prosumers. Lazdins, Mutule, and Zalostiba [
41] analyzed 68 references to identify the need for a common policy framework and peer-to-peer markets as the leading solutions for CECs dissemination. Zepter et al. [
29] studied a set of residential prosumers in London, concluding that by investing in storage and considering peer-to-peer trades, each prosumer can reduce its costs with electricity by 30%. However, if they they act coordinated as a community, they can save around 60%.
Modeling the business models of CECs has been the focus of the most recent literature. Gjor et al. [
23] presented a review of the actors and their roles and interactions in CECs. They benchmarked the literature concerning the objectives, models, and constraints of CECs designs, reviewing the numerical indicators that quantify the economic, environmental, social, and technical impacts of CECs.
Kubli and Puranik [
34] identified 25 different business model designs after analyzing the implemented cases of 90 CECs. They concluded that generating renewable energy, increasing self-consumption, reducing energy costs, and coordinating partners are the main drivers for the current business models of CECs, mainly for residential prosumers. However, prominent business models such as providing system services, increasing grid reliability, and being active market players are also in the scope of some of the studied CECs.
Schwidtal et al. [
19] presented 221 business options between 7 CECs’ members or partners (consumers, prosumers, aggregators, retailers, the grid platform, and storage operators) after reviewing 135 journal papers. They concluded that the academic studies consider three market models: (i) peer-to-peer, (ii) community self-consumption, and (iii) transitive energy. Prosumers are considered the central players of these market models. While peer-to-peer models consider only local transactions of energy between local players, the other market models are more complex. Community self-consumption models consider the coordination of local partners together with system operators to gather local flexibility and providing services to increase the grid reliability. Transitive energy models consider a significant diversification of business models, considering aggregators/CECs of local partners the key facilitators of their active participation in the provision of system services and participation in wholesale markets.
Reis et al. [
39] identified 8 business models of 36 CECs, concluding that the majority focus on self-consumption and a few on important models to the energy transition, such as aggregation, energy efficiency, flexibility, and mobility.
Some works modeled the scope and operation of consumers and local CECs. Wei et al. [
47] presented a review of 128 forecast models of demand and concluded that forecasts of small-scale consumers have higher errors than forecasts of large-scale consumers, indicating that the best forecasts have a mean absolute percentage error (MAPE) until 10%. Hong et al. [
8] presented a bilevel game-theoretic model for strategic retailers participating in wholesale and local electricity markets. They concluded that modeling the consumers’ behavior when choosing tariffs is very important to increase retail competition and decrease retail prices.
Most CECs consider small communities of consumers and prosumers to consume local renewable generation and reduce costs. These CECs may need a profit-seeking intermediary to trade their excess or lack of energy. The model presented in this work considers an active agent-based CEC that can cooperatively invest and manage local renewable generation and participate in wholesale markets to minimize costs. Against this background, modeling communities and their dynamic distributed players and resources as software agents, and equipping them with the required trading models can be relevant for their efficient participation in competitive markets. Klusch and Gerber [
28] used the concept of dynamic coalition formation to simulate the alliance of partners as software agents who want to achieve a common goal by cooperatively responding to events. Sanchez-Anguix et al. [
48] designed a negotiation model of alliances that uses bottom-up methodologies applied to achieve Pareto-optimal agreements. Mansour et al. [
60] presented a hybrid negotiation strategy to define the offers and counter-offers of software agents. The model consists of preference-based and fuzzy-similarity methods used for quantitative and qualitative issues, respectively. The authors concluded that the hybrid strategy improved the negotiation output of agents when compared to other strategies.
This contribution extends prior research of the main authors of this work within the scope of CECs, namely:
Their regulatory framework, indicating their role in power systems and their potential members, benefits, and functions [
21].
A review and model for their agent-based formation and management of their resources [
27].
Their agent-based model equipped with coalition formation and management models, decision protocols, and intra-team strategies [
36].
Their strategic bidding process, considering their active participation in wholesale markets without the need for intermediaries [
46].
Their interaction and decision protocols in an automated negotiation between alliances and opponents. It presented a decision-support model for energy alliances considering automated negotiation, enabling small market players to form and manage teams and their decisions [
42].
These previous studies identified the economic benefits for consumers being part of active CECs by allowing their competitive participation in wholesale markets. The work developed in these studies together with the developed modeling frameworks of retail competition [
6], contract characteristics [
61], and wholesale markets [
62] are used in the work presented in this paper.
3. Electricity Markets, Bilateral Contracts, and Tariffs
Consumers sign private bilateral contracts with suppliers, being subject to energy tariffs. Those tariffs may have different risk levels for consumers [
5]. They have no risk if fixed and high risk if indexed to wholesale prices. Suppliers define tariffs according to the expected prices of wholesale markets plus a risk premium to compensate for their risk exposure [
61,
63]. Furthermore, the energy part of tariffs is subject to more fees than wholesale energy prices, such as grid access, which incentives consumers to invest in self-consumption.
3.1. Electricity Markets and Bilateral Contracts
Electricity markets are divided into spot, continuous, balancing, derivatives, and bilateral contracts markets [
2,
4].
Spot markets are auction-based marginal markets such as day-ahead, intraday, and real-time markets. Continuous markets consider the direct match of opposite bids using the pay-as-bid scheme. Balancing markets balance demand and supply during real-time operation, guaranteeing frequency stability [
62,
64]. Derivatives and bilateral contracts markets consider the negotiation of standard and non-standard bilateral contracts, respectively [
61].
Bilateral contracts can be standard, non-standard, physical, or financial [
3]. Standard bilateral contracts can consider physical and financial trading of forwards, futures, options, and swaps (also known as contracts for differences). Using forward contracts, traders define the price at present to a future period. In futures contracts, traders define a price subject to financial settlement in the future. Options contracts are divided into: (i) put and (ii) call options, i.e., option to sell or buy an asset, respectively. The buyers of those options guarantee a fixed future asset price by paying a premium, reserving the choice to use the option or not. Sellers receive a premium but are obliged to follow the decision from buyers. Swaps are only subject to a financial settlement according to the strike price. Sellers compensate buyers when spot prices are higher than strike prices. Otherwise, buyers compensate sellers [
61]. Physical contracts consider energy delivery and financial settlement, while financial contracts only consider the latter. They are used to hedge against the volatility of spot markets. Non-standard contracts, such as power purchase agreements, can be traded both on wholesale and retail markets.
Consumers negotiate private bilateral contracts with retailers and other intermediaries to hedge against the volatility of wholesale prices. These private contracts are non-standard contracts, which means that several terms and conditions can be agreed (see, e.g., [
61]). Typically, conditions such as the type of tariff are fixed, but prices may suffer periodic updates (e.g., yearly updates).
3.2. Tariffs
Tariffs are divided into two parts, a fixed price for contracted power, and a variable price per unit of consumed electricity [
5]. The variable price of the tariff is divided into two parts, the energy part from wholesale market prices and the other part from the system costs. The other part of the variable term is fixed and defined by the regulator. It includes grid access, considering the GEIC, commercialization and the global system, transportation, and distribution grid usage [
65]. Thus, grid investment, maintenance and operation, and renewable support are included in this fixed part of the variable term.
The most used tariffs are single and time-of-use (TOU) tariffs. Typically, TOU tariffs consider two-rate, three-rate, and four-rate tariffs (involving peak, mid-peak, off-peak, and super off-peak periods). Consumers select TOU tariffs when they consume more during off-peak periods or have the flexibility to do so. These tariffs are used as a demand-side response (DSR) strategy, when regulators and retailers try to adapt typical consumption behaviors to reduce the need to use traditional generation. Typically, this kind of long-term demand response (DR) induces a change in the consumption profiles of consumers according to each net load period. Net load is the difference between consumption and vRES generation. High/low net loads mean energy scarcity/excess of vRES generation, respectively. Energy scarcity/excess induces high/low wholesale prices and the need for a high/low production of traditional generation, respectively. In power systems with relevant penetrations of variable renewable energy, wholesale prices are more volatile. Thus, the use of TOU tariffs may not reflect the real-time power system needs, by not providing the right price signals to consumers. In these power system, retailers and regulators may propose tariffs with precise short-term price signals to hedge against the volatility of wholesale prices.
On liberalized markets, retailers are also proposing tariffs indexed to wholesale market prices, such as real-time pricing (RTP) and day-ahead hourly (DAHP) and monthly pricing (DAMP) tariffs. These tariffs reduce retailers’ risk and incentive flexible consumers to change their short-term consumption behavior (short-term DR). These tariffs also include the commissions from retailers. However, those commissions are fixed and lower when compared with single and TOU tariffs, subject to high-risk premiums [
5,
21,
66].
In these indexed tariffs, consumers do not know precisely the price to pay before consuming because they are subject to energy losses computed by the regulator. DAHP tariffs are the ones that provide consumers more precise information about hourly prices between 12 and 36 h before real-time dispatch. They consider the day-ahead hourly price plus a fixed value for real-time imbalances. These tariffs allow consumers to schedule their consumption. However, they do not provide the most precise price signals, since forecast errors can lead to periods of scarcity/excess of energy according to the programmed dispatch, which may lead to higher/smaller imbalance costs. RTP tariffs are the ones that provide the most accurate prices according to the actual wholesale price of energy. However, retailers can only compute those prices after consumption, which does not give consumers the best information to schedule consumption. These tariffs are adequate for flexible consumers that can comply with their programmed dispatch without deviations. These consumers may avoid the payment of risk premiums to protect themselves from paying imbalance penalties by choosing RTP tariffs. DAMP tariffs consider the average monthly day-ahead prices of the entire portfolio plus a fixed fee for real-time imbalances, which do not incentive consumers to change their consumption behavior.
Notice that all consumers have indexed tariffs available. Usually, the only risk-free tariffs available for medium voltage consumers are four-rate TOU tariffs. Consumers connected to the low voltage grid may only choose from single to three-rate TOU tariffs and high-voltage consumers may choose hourly tariffs.
Table 1 presents the main characteristics of each type of tariff considering the risk and price signals given to each party after analyzing the literature [
1,
5,
6,
7,
8,
9].
The requested risk premiums by suppliers depend on their exposure to risk. Thus, single and TOU tariffs may be higher than other types of tariffs during stable periods. However, they protect consumers in the case of unexpected price spikes. Actual suppliers may protect consumers by offering fixed tariffs for a period (e.g., one year) but do not incentive consumers to update their tariffs.
Power systems with high penetrations of vRES need supply and demand flexible resources. Nowadays, investing in storage assets such as batteries is expensive. Thus, suppliers and operators shall incentivize flexible consumers to accept indexed tariffs and demand response programs to avoid price spikes and load shedding in scarcity periods.
The tariff structure incentivizes prosumers and CECs to invest in storage to avoid selling their excess energy at low prices and buying their missing energy at high prices [
29]. However, regulators shall consider dynamic tariffs to incentivize consumers to use their flexible energy resources to help the management of the local grid. Furthermore, distribution system operators shall incentivize consumers to participate in local system services. Thus, tariffs shall provide dynamic price signals according to the real-time power system needs to avoid increased energy costs because of investments in centralized generation backup and storage assets.
4. Optimal Assets Investments, Tariffs, and Strategic Bidding of Communities
Being part of Citizen Energy Communities is one of the most competitive solutions for consumers [
21,
22,
42]. Besides reducing the price of the other fees of the energy part of the tariff, CECs may invest in local generation, proposing more competitive green tariffs to local consumers. Consuming locally in self-consumption CECs means that consumers may only pay local grid usage besides the investment costs in local generation and storage assets. Furthermore, CECs may invest in a cheaper and more efficient large-scale generation when compared to the small-scale units available for consumers. Even considering these investments, CECs shall propose competitive, stable, and diversified tariffs to be more attractive to local consumers than regulated and retail tariffs. Against this background, CECs may investigate potential investments in local assets to feed their portfolio of consumers when compared to wholesale prices.
4.1. Optimal Asset Investments
The potential investment of CECs in local assets affects the proposed tariffs. To be attractive and stable, tariffs proposed by CECs may keep the best features of actual tariffs and improve their worst features. Thus, they shall be fixed for a period to protect consumers in case of price increases but also shall recommend consumers to update tariffs in case of price decreases.
One way to propose more competitive and stable tariffs to local consumers consists of satisfying their consumption using local variable renewable energy. vRES have substantial fixed costs but near-zero marginal costs, which means that investors know exactly their annual costs with these technologies. Their main source of uncertainty is their hourly prediction, being their annual production stable. However, it is possible to compute their levelized costs of energy (LCOE) and compare them with wholesale prices to evaluate a potential investment. The LCOE considers that investors recover all annual,
n, fixed,
, and variable,
, costs of a technology,
v, during its life cycle,
N, according to its production,
, and discount rate,
r:
The yearly production,
, is computed considering the hourly generation,
, of the technology as follows, with
T being the number of hours of that year:
For investment purposes, LCOE can be predicted using the expected capacity factor of the technology,
, its nominal power
, and the number of hours per investment period:
The optimal investment solution uses historical generation data of each technology,
v, using per unit production,
, to extrapolate and forecast its future production,
. Furthermore, it uses forecasts of long-term portfolios consumption,
, and levelized wholesale market prices,
, from each spot market,
, using multivariate time series presented in previous works, to compute the optimal capacity of each technology,
, as follows [
5,
6]:
subject to:
where
c is the expected total cost of the community with the energy required by its consumers and the investment in vRES and
is the expected quantity transacted on each spot market.
If the LCOE of technologies is lower than wholesale prices, the optimization may suggest investment in high vRES’ capacities than needed to sell energy excess. Equation (
7) constrains the limited investment to the expected quantity required by the consumers of the community.
4.2. Community Tariffs
To attract local consumers to being part of the community has been proposed single, four-rate TOU, DAHP, and RTP tariffs. These tariffs are valid for a specific period, being periodically updated. Members may change their tariff on all updates or be forced to accept new prices after their tariffs’ valid period. Single and TOU tariffs are associated with vRES investments, while DAHP and RTP tariffs are indexed to markets. Single and TOU tariffs consider each vRES technology or a hybrid solution that integrates all vRES.
Suppliers are exposed to risks, such as wholesale price volatility and consumption uncertainty in fixed retail tariffs. Furthermore, if CECs invest in local generation, they are also exposed to uncertain local production. By consuming locally, members have discounts related to the other fees part, , of the energy tariff, , by only using the local grid with a limited number voltage levels, U. The other fees part of the energy tariff, , is computed according to the expected local net load of the community.
It is important to notice that the other fees component of the energy tariff to propose in the fixed single and TOU tariffs are based on forecast data (conditions 1–3, but check the following plan template presented in Equation (
8)), while in the case of indexed tariffs observed values are used (condition 4). Forecast data of market prices is also used, as well as local demand and vRES generation to compute the expected costs with the other fees part of the tariff (conditions 1–3). Thus, if the expected generated energy is higher than the expected energy consumed by members, they will only pay the usage of power grids to transact that energy (condition 1). If the expected generated energy is zero, they will pay the fixed CEC fee,
, for a unit of consumed energy. Otherwise, members with a tariff associated with a local vRES technology have priority in consuming its energy (condition 2). Furthermore, members with tariffs associated with hybrid technologies (condition 3) have priority regarding consumers with indexed tariffs (condition 4). If the expected energy produced by local vRES are not enough to satisfy the previous groups of consumers, it is applied pro rata, i.e., generation is distributed uniformly per each priority group using the weight,
w. The previous conditions allow to compute the other fees part of the tariff according to the following plan template (PT):
where
is the fee for using the power grid with voltage
u in period
T,
and
are the forecast quantity consumed by the group of consumers with a tariff associated with technology
v and hybrid
h, respectively, and
w is the relative net load, i.e., the weight of the expected local generation concerning consumption. Single and TOU energy parts of the tariff,
, are computed according to the expected vRES/Hybrid production, portfolio consumption, and wholesale prices plus a premium,
k, to cover the risk exposition of the community, as follows:
In the case of single tariffs considering one or multiple technologies, v is fixed or , respectively. In the case of four-rate TOU tariffs, only the tariff value for each period is considered, obtaining a tariff matrix with four prices.
This work considers that CECs may also propose DAHP and RTP indexed tariffs. DAMP tariffs are neglected because they do not incentive local communities’ cooperative behavior neither incentive consumers to respond to local energy scarcity/excess and grid congestion, and high/low wholesale prices. Because of potential penalties due to imbalances, CECs consider a risk premium,
k, when computing the energy price of a DAHP tariff as follows:
where
is the hourly day-ahead energy price. RTP tariffs also consider dynamic ancillary services prices,
, being the energy price consumers pay, computed as follows:
Besides these prices, CECs also have to lead with energy losses. If energy is consumed and generated locally, losses are lower. Thus, it also incentives self-consumption. The strategic bidding of CECs to feed their members is presented in the next section.
4.3. Strategic Bidding in Wholesale Markets
CECs can be composed of consumers, prosumers, and distributed generation and storage. They can invest in self-consumption. By investing in self-consumption CECs know their annual financial obligations beforehand, reducing their exposure to the volatility of spot prices. However, CECs shall forecast their net load needs according to their consumption and production uncertainty. They may trade energy on marginal wholesale markets, such as the day-ahead (DAM) and intraday (IDM) spot markets. Furthermore, as balance responsible parties, to avoid the payment of penalties, they can use the intraday pay-as-bid continuous market to trade their expected deviations 1 hour ahead of real-time operation [
62,
67].
4.3.1. Clustering and Long-Term Forecast
The Multivariate Time series (MTS) forecast methodology has been adapted from [
5] and [
6] to predict the electricity cost and consumption per consumer, respectively. The presented data consider the gross consumption of different consumers. To verify the type of consumer, clustering methodologies are used to compare typical consumption profiles with observed consumption. To do so, the Calinski–Harabasz (CH) index is used to obtain the optimal number of clusters, dividing each consumer by its consumption segment.
4.3.2. Strategic Bidding and Short-Term Forecast
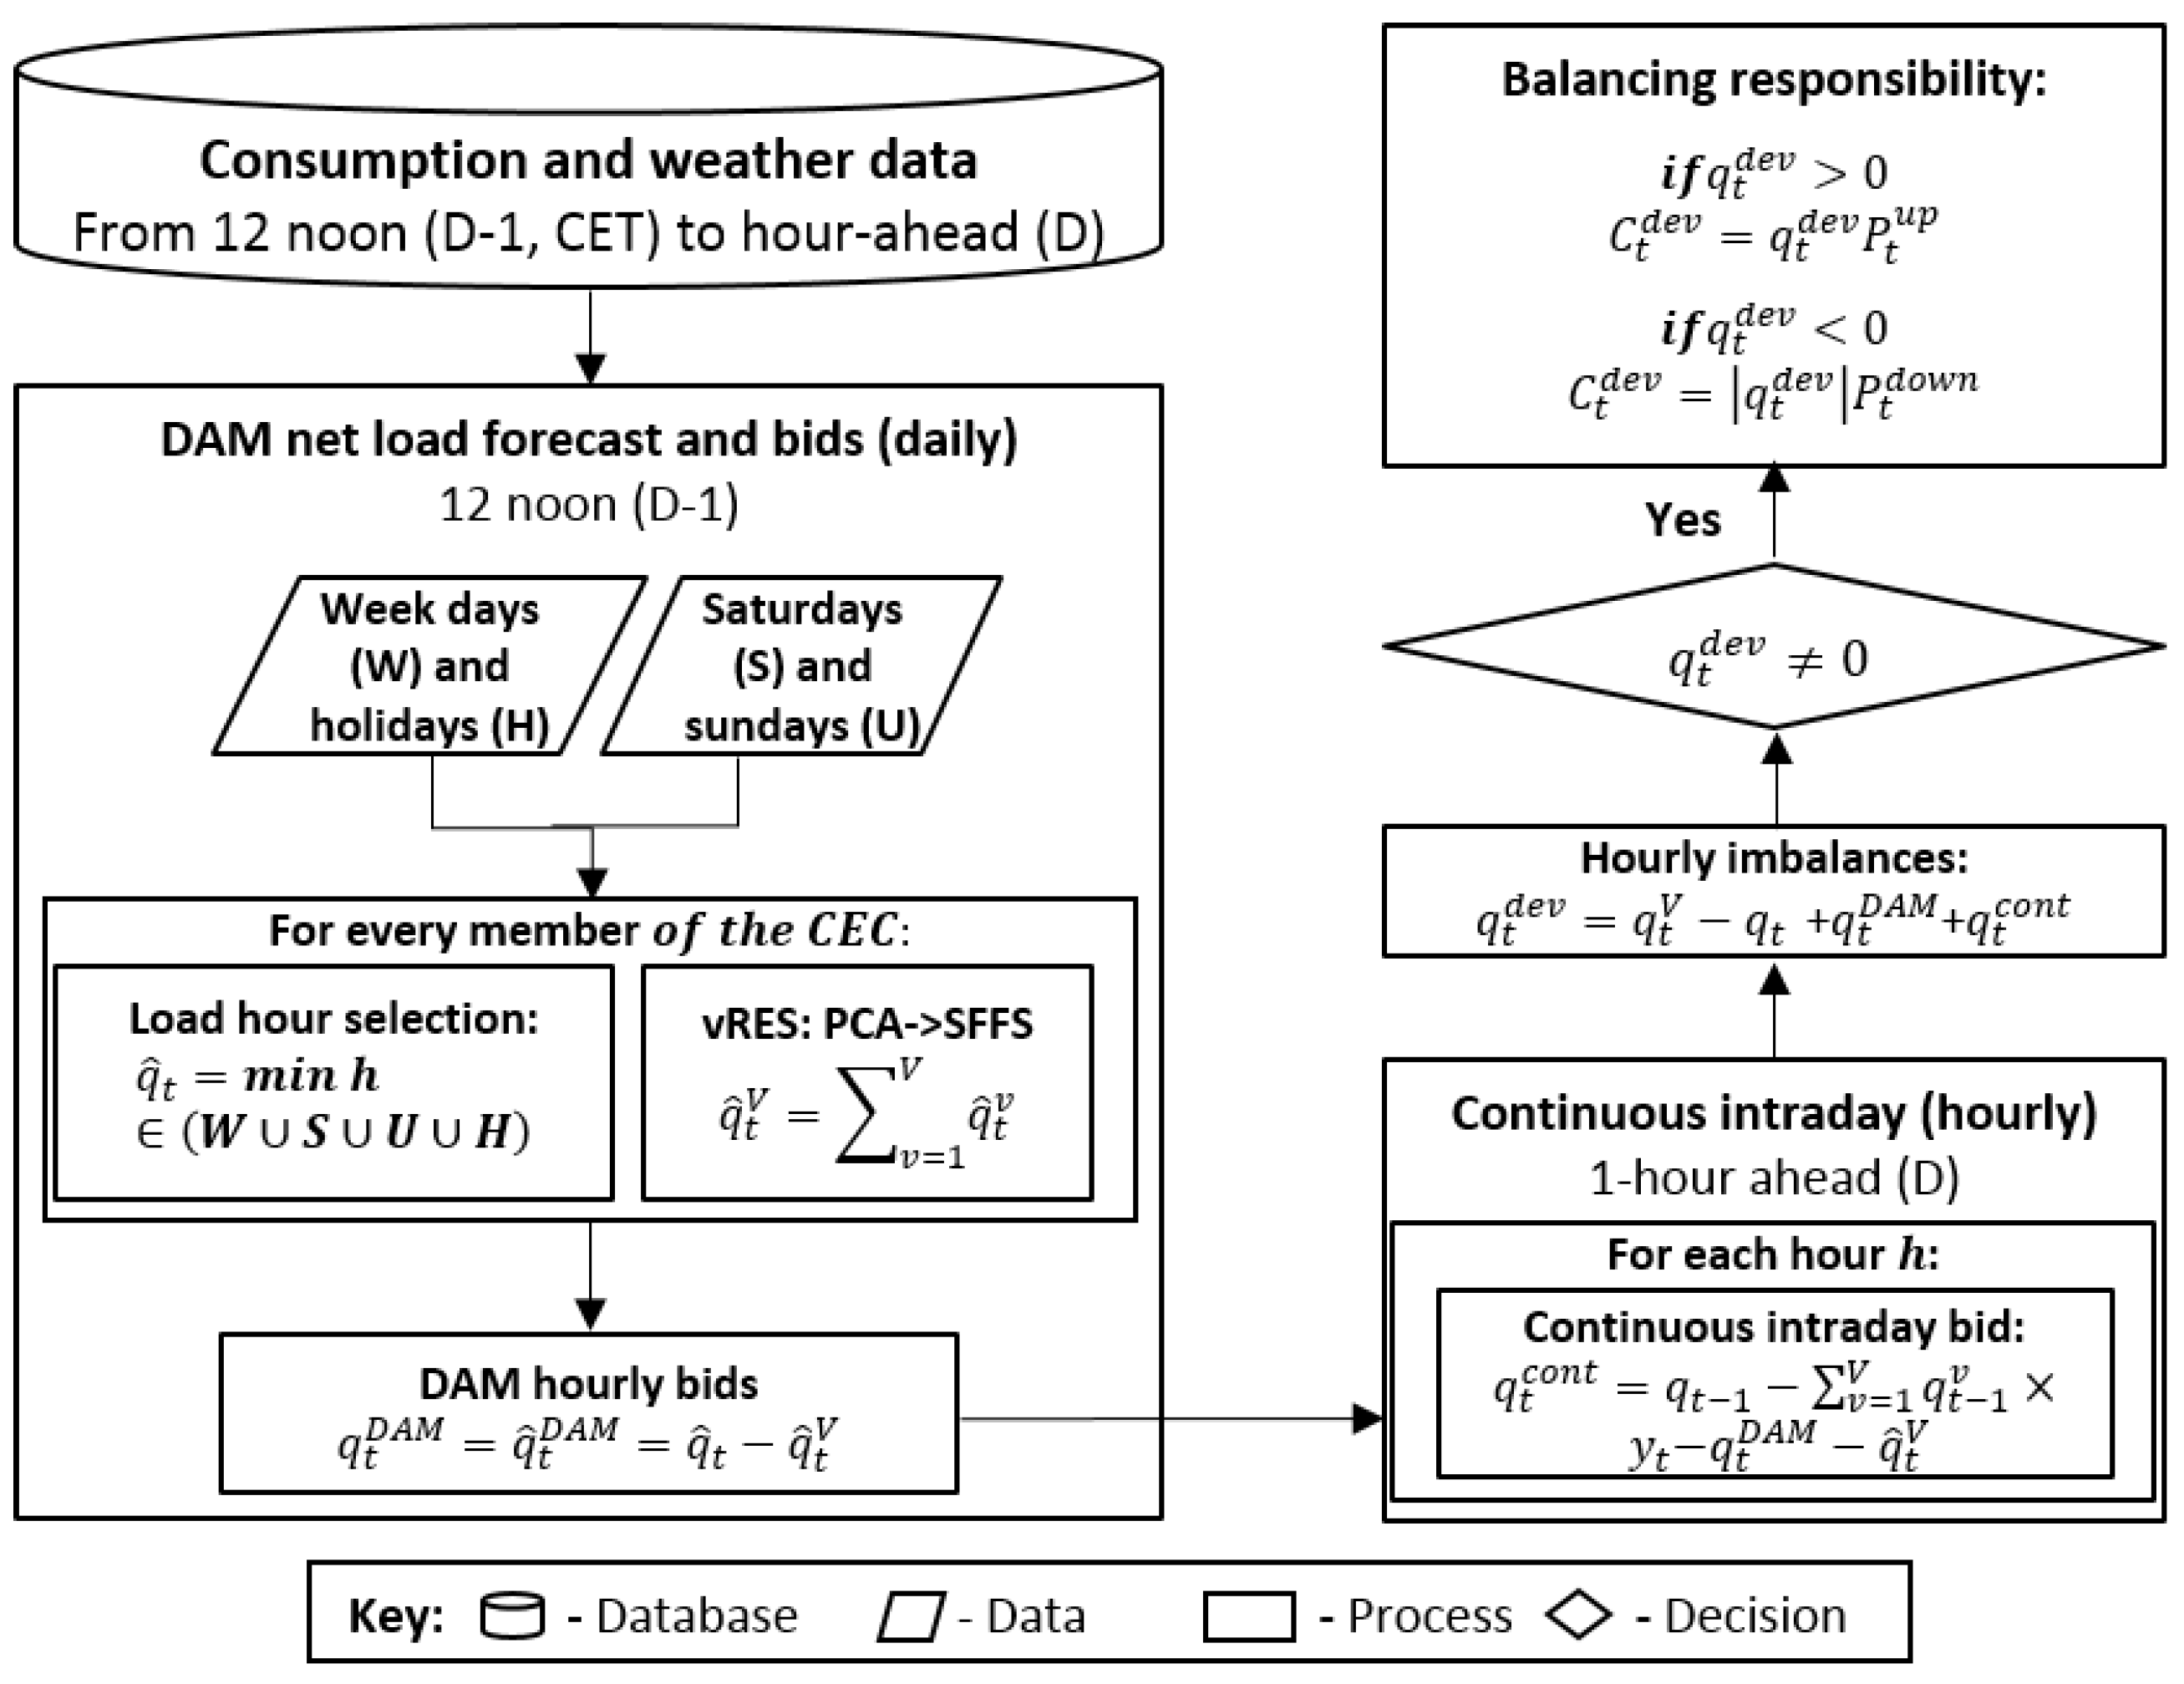
This section presents a process for strategic bidding in wholesale electricity markets adapted from [
46], considering that CECs can also invest in self-consumption (see also
Figure 1). The process uses different types of data. It uses historical data to forecast the next-day consumption in the DAM based on a forced forecast. It selects from the database the most recent hour with an hourly consumption,
h, according to the type of forecast day (
): weekday (
), Saturday (
), Sunday (
), or holiday (
). Considering the database with the historical daily consumption data,
, the formulation to obtain the forecast is:
subject to:
For every time period, CECs can have multiple generation technologies
v. Thus, the total quantity of electricity expected to be produced by all technologies,
, is used to compute the bids to each period of the DAM,
. The wind and solar PV forecasting methodology employed a sequential forward feature selection (SFFS) algorithm to select meteorological parameters from a numerical weather prediction model, as described in detail in [
68]. The goal was to optimize a predefined objective function, specifically to minimize the root mean square error (RMSE). The forecasting process began by subjecting each meteorological parameter to Principal Components Analysis (PCA). The PCA identified principal components based on their correlations, which were then ranked. These ranked principal components were subsequently used as inputs for the SFFS algorithm, which employed an artificial neural network statistical approach to generate the forecasts. A detailed description of the methodology is provided in [
68]. Here, the methodology was also adapted to the solar power forecast case by including additional meteorological parameters such as cloud cover at different heights, allowing to compute the expected generation of solar PV and onshore wind technologies:
For each continuous intraday period,
t, the forecast,
, uses the most updated local consumption and generation information to forecast the net load of the CEC and submit bids for the required electricity session. The intraday methodology has been adapted from a forecast methodology for retailers [
6]. CECs compute the bids to submit to the continuous intraday market considering the historical net load behavior,
. The energy price,
, is assumed to be the day-ahead price,
. The energy quantity,
, is computed as follows:
where
and
are the average members’ consumption and generation on time
t, respectively. Then, the real-time imbalance,
, of period
t, is computed considering the difference between the real-time consumption of the CEC,
, and the final programmed dispatch,
, respectively:
Each time period balance responsibility of the CEC,
, considering its deviations,
, and the prices of the excess or lack of electricity, in cases of up,
, or down,
deviations, respectively, are computed as follows:
Each technology
v has its own
, and thus, each time period cost,
, of the CEC is:
To evaluate the performance of the forecast techniques are used two different indicators, MAPE and normalized RMSE (NRMSE) [
6]:
where
is the maximum observed quantity. The value of
depends on the time horizon of each market forecasts, being equal to
in the case of day-ahead forecasts and equal to
in the case of continuous intraday forecasts.
Consumers may choose among multiple types of tariffs from communities and suppliers. Thus, the next section studies how consumers select their tariffs.
5. Consumers Costs and Behavior on Retail Markets
Usually, consumers select the most affordable tariff adapted to their consumption behavior. However, price-based DSR mechanisms involve suppliers proposing tariffs to change typical consumption behaviors. Consumers may change their consumption behavior if that results in substantial savings. Normally, energy prices can be dynamic, but grid access fees are defined by regulators. According, the consumer’s cost,
c, in period
T, is computed as follows:
where
is the energy part of the tariff, divided into the energy price and other fees parts,
and
, per time
t, respectively, and
is the quantity consumed.
In case of single and TOU tariffs, the energy and other fees prices are fixed for all periods. In case of indexed tariffs, only the other fees are fixed, with the energy price of a DAHP computed as follows:
where
k is the supplier’s risk premium (fixed margin) and
are the hourly losses defined by the regulator. This tariff incentives consumers to respond to dynamic day-ahead prices, being all variables except hourly losses known from 12 to 36 h before they consume. RTP tariffs are similar, with the difference that the prices of ancillary services are also dynamic, with the energy price consumers pay computed as follows:
This tariff increases the risk to consumers, since they only know the day-ahead price before consuming. Thus, it does not incentive consumers to respond to prices so much as DAHP, but may reduce energy costs by reducing the risk premium associated with fixed ancillary services prices. Suppliers submit bids for entire portfolios based on demand forecasts, not informing clients about their programmed dispatch. Hence, the costs of ancillary services are paid by all consumers, even if they have the flexibility for self-regulation. Thus, both CECs and flexible consumers benefit from potential cooperation.
The energy price of DAMP is computed considering the average monthly day-ahead price of the supplier’s portfolio,
, as follows:
This type of tariff does not incentive consumers to adapt their consumption because they are not aware of energy prices before consuming.
With the liberalization of the retail market, its increasing competition allows consumers to select among a significant number of tariffs. Allowing consumers to change between tariffs and retailers without constraints increase competition but also the risk to suppliers. Against this background, this work modeled the consumers’ selection of the best tariff,
, with
O being all available options, as follows:
The previous formulation computes the costs consumers will have or expect to have with all available tariffs, according to if they are using scheduled or expected consumptions, respectively. If they use scheduled consumption, they can be trustful about changing tariffs. Otherwise, they shall be careful and only change tariffs if expecting significant savings. Changing tariffs when expecting small savings may lead to extra costs if consumers consider expected consumptions. Accordingly, consumers may change to the potential best tariff,
, that minimizes their costs, as follows:
If consumers are part of an energy community, they may significantly reduce energy costs with other fees. Furthermore, if the community has self-consumption, consumers can practically eliminate those costs. Investing in self-consumption is another way consumers have to reduce/eliminate those costs. A similar optimal investment can be used to consumers regarding the one used by CECs in Equation (
4), as follows:
subject to:
where
is the defined risk premium if the consumer sells its excess energy. Normally, this value is fixed and defined by the regulator to compensate the losses and deviation costs originated by this energy. However, in CECs this energy can be traded locally. Thus, CECs may compute a dynamic periodic risk premium, which can be high in case of local energy excess and negative in case of local energy deficit, which incentive members with self-consumption to adapt their consumption to local needs. Equations (
7) and (
31) constrain the limited investment to the expected quantity and previous investment of each consumer, respectively.
This work presents two different optimization models to consumers because investing in self-consumption shall be optional (see Equations (
29) and (
30)). Even if investing in self-consumption is cheaper than all tariffs, consumers may not have the required budget.
6. Case Study
The study considers one Citizen Energy Community attracting 312 local consumers to its portfolio during 2019 (see [
69] for more details about the consumers). It competes with the regulator and retailers’ tariffs. These consumers are connected to the medium voltage 30 kV grid, meaning that some of them are part of aggregations of residential and small commercial consumers. Using the K-means clustering algorithm and the CH criterion, it is possible to divide them into the following five consumption segments: 10 industrial, 11 large commercial, 189 aggregations of small commercial, 71 aggregations of residential consumers, and 31 other aggregations. Real consumption data have been used from 1 January 2012 to 31 December 2013 extrapolated to 2019 using MTS forecasts adapted from [
5,
6]. Furthermore, the market prices of MIBEL have been used, as well as the most competitive tariffs proposed by the Portuguese regulator and retailers (see the Data Availability Statement for details).
To compute the optimal investment assets of both CECs and consumers, we considered a discount rate of 4%, a life cycle of 25 years, and an investment payment of 20 years for all technologies. Furthermore, we considered the typical capacity factors and the 2019 fixed and operation and maintenance (O&M) marginal costs of the studied technologies in Portugal, as presented in
Table 2 [
70].
Accordingly, in the first step, the CEC computes the tariffs to propose to consumers, presented in the next section.
6.1. Tariff Proposals
In Portugal, demand-side players have to pay for grid access and usage independently of being active market players, but legislation strongly incentive self-consumption. The regulator defined that consumers with self-consumption pays a risk premium of 10% for the excess of energy. In the case of communities without and with self-consumption the legislation provides them a 50% and 100% discount in the GEIC part of the variable cost of energy, respectively. In Portugal, the 2019 prices of each part of the variable term of energy for medium voltage consumers are equal to (all in EUR/MWh) [
65]:
Consumers with self-consumption have the potential to reduce costs with energy, with the considered periods to apply four-rate TOU tariffs presented in
Table 3.
The CEC computes annual tariffs according to a forecast of the market prices and local consumption using the presented MTS forecast methodologies. Furthermore, it forecasts the market values of each vRES technology according to its historical production. Single and four-rate TOU tariffs are subject to risk premiums of 6% and 5% over the expected energy costs of the variable term of the tariff, respectively. These risk premiums compensate for CEC’s risk in forecasting energy prices, vRES generation, local consumption, and balancing costs. The DAHP tariff is also subject to a risk premium of 5% over expected energy prices, while the RTP tariff does not have a risk premium.
Using the optimization model presented in
Section 4.1, it is possible to compute the single and four-rate TOU (PV, Wind, and Hybrid) tariffs allocated to each vRES technologies to invest for. Hybrid tariffs have an optimal proportion of 77.6% PV and 22.4% onshore wind. We have used the per unit expected production values of each technology to plan its investment and compute the tariffs associated with local vRES production. The final investment in local vRES capacity depends if local consumers choose these tariffs. These tariffs compete with the regulator and the three most competitive retail tariffs. The regulator proposes a four-rate TOU tariff and retailers DAHP, DAMP, and RTP tariffs. The main characteristics of these tariffs are presented in
Table 4.
Analyzing
Table 4, it is possible to verify a significant reduction in the prices of the vRES tariffs proposed by the CEC compared with the regulator’s tariff. These reductions in tariffs are driven by the lower costs of investing in local renewable generation, but also to the low risk premiums of the CEC compared to competition, and the discounts provided by the regulator to CECs, reflected when CECs are not consuming local energy. Thus, consumers will never select the regulator’s tariff, such as simple wind and hybrid tariffs, because better tariffs are available.
Indeed, in the case of solar PV and hybrid tariffs, the mid-peak tariff is the lowest because of the high solar PV production during this period. Commercial consumers may benefit from these reductions by having their highest consumption during mid-peak periods.
The next section presents the selection of tariffs by consumers.
6.2. Consumers’ Behavior
In this section, consumers select the tariff that minimizes their costs with electricity for 2019 according to the optimization model of
Section 5. Assuming consumers do not have forecast expertise, they select the best tariff using their historical consumption data. Thus, consumers use their consumption in 2018 to compute the best tariff for 2019 according to the options presented in
Table 4. Furthermore, consumers also computed their costs with self-consumption and being part of a CEC, which results in the selection of the single PV tariff by 116 consumers, the TOU PV tariff by 1 consumer, and the TOU Hybrid tariff by 195 consumers. The other tariffs were not selected by consumers, such as investing in small-scale self-consumption (rooftop solar PV). Cooperative consumption and coordination of local resources proved to reduce more the costs of consumers than investing in small-scale self-consumption, because of the lower investments per unit of produced energy and higher efficiency of large-scale renewable technologies, as can be verified by the LCOE values presented in
Table 2.
Table 5 presents the final levelized costs of electricity for consumers and their savings regarding the best retail tariffs considering: (i) all proposed tariffs, (ii) the selected tariffs, and (iii) the optimal solution in the case consumers always have the tariff that minimizes their costs. The levelized costs are the average costs per every unit of consumed energy.
Analyzing
Table 5, it is possible to conclude that all tariffs proposed by the CEC originate savings regarding the best retail tariff from 15% to 29%. The selected annual tariffs of consumers have a levelized price slightly above 2 EUR/MWh regarding their optimal selection of tariffs every month. This means that the tariffs proposed by the CEC guarantee stable and low prices to members without changing tariffs or suppliers all the time.
Investing in self-consumption is not a good solution for members of the CEC because they will invest more per unit in small-scale PV for lower productivity. However, it is a good option if they have regulated or retail tariffs and do not want to be part of a CEC. Accordingly, to the consumers’ selected tariffs, the results of the strategic behavior of the CEC in the wholesale market is presented in the next section.
6.3. Strategic Behavior of the CEC Using Forecasts of Local Net Loads
The selection of vRES tariffs by consumers led the CEC to invest in 745 MW of large-scale solar PV and 207 MW of onshore wind using forecast data. Besides the forecast of their members’ consumption, the CEC has to forecast the production of its local PV and wind power plants. This investment led the CEC to achieve carbon neutrality and sustainability indexes of 87% and 36%, respectively (the formulation of these indexes is presented in [
21]). This means that the CEC generates almost all the energy required by its members (carbon neutrality index), but not necessarily during the period they want to consume it (sustainability index). As a result, it depends on the transport power grid connection and wholesale markets to buy and sell local scarcity and excess energy, respectively. As presented in
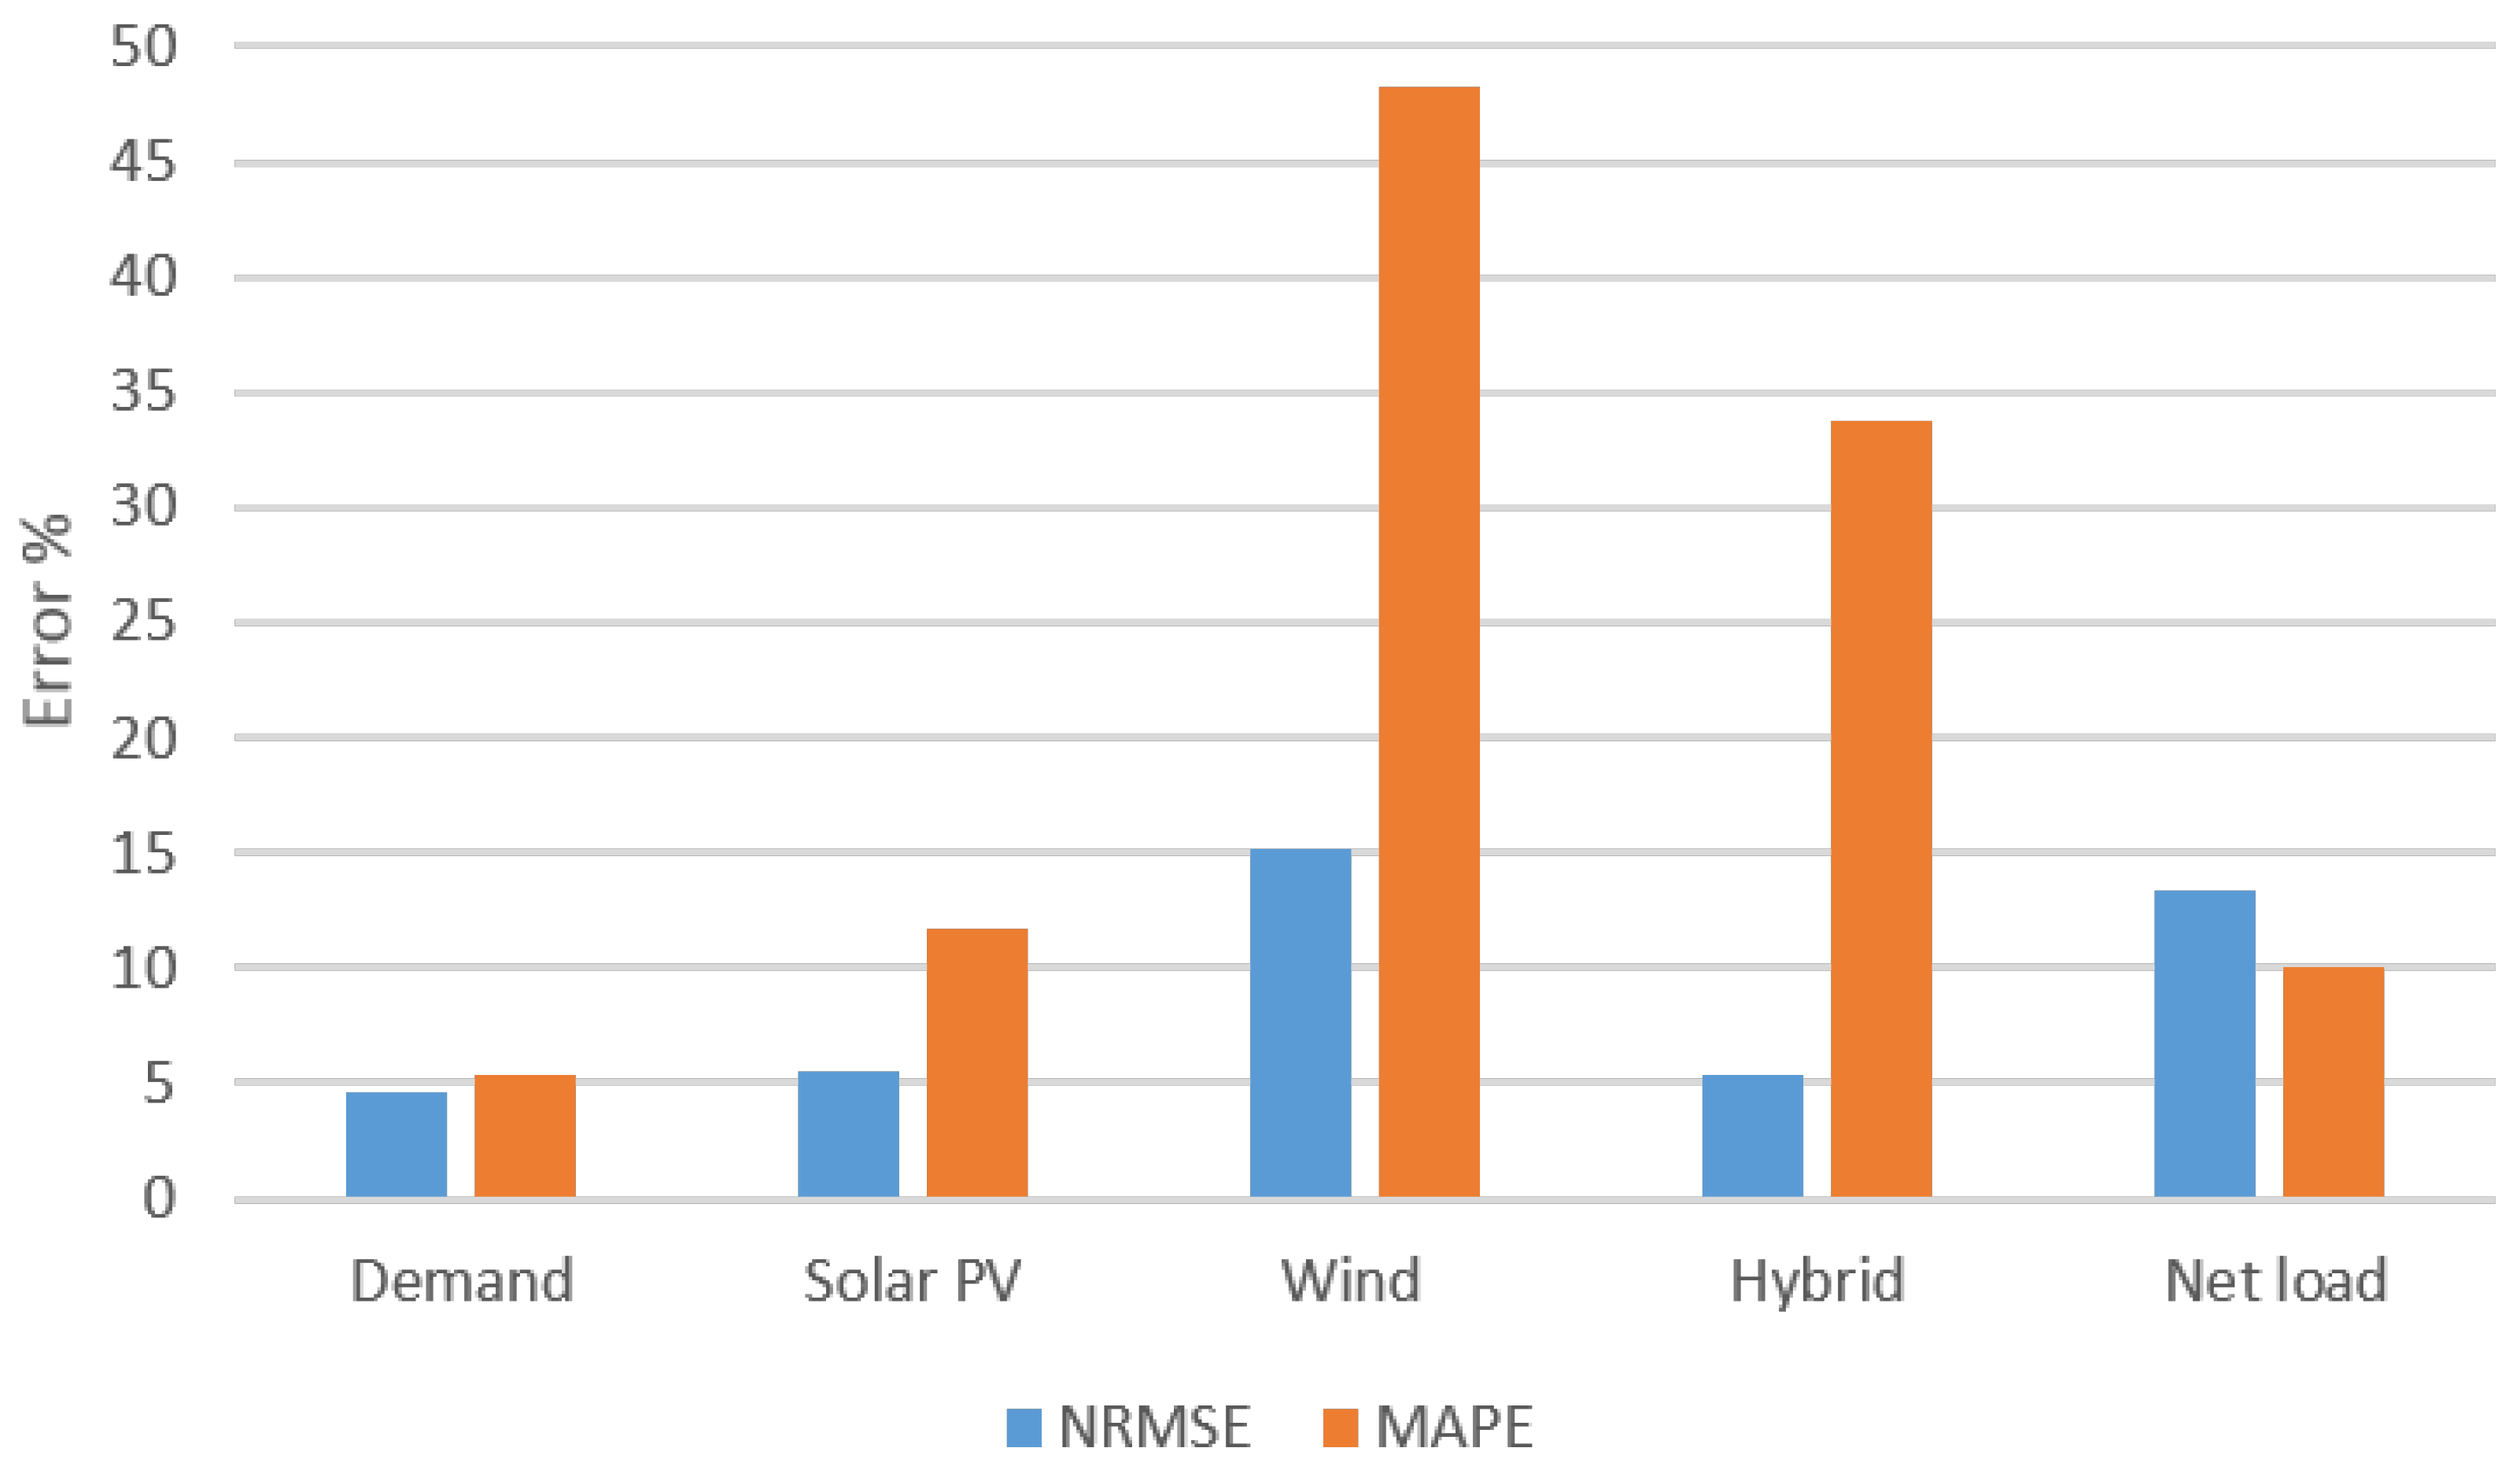
Section 4, the CEC first forecasts the day-ahead consumption and production of the local members. Its strategy consists of first forecasting local trading to reduce costs with grid usage and then bidding the day-ahead net load into the day-ahead market. Against this background,
Figure 2 presents the forecast errors of the day-ahead forecasts.
Analyzing
Figure 2 we can conclude that while demand and solar PV forecasts have low errors (notice that PV has no deviations around 50% of the time, since no production is expected), onshore wind have high errors that are reduced in the case of hybrid power forecasts. However, net load forecasts have lower errors, which also supports the incentives provided to CEC to manage local renewable generation. According to Wei et al. [
47], the employed forecast methodologies have high forecast accuracies for predicting local demand and net load. Local CECs have the potential to also benefit system operators by reducing local imbalances and contribute to the reliability of the local grid.
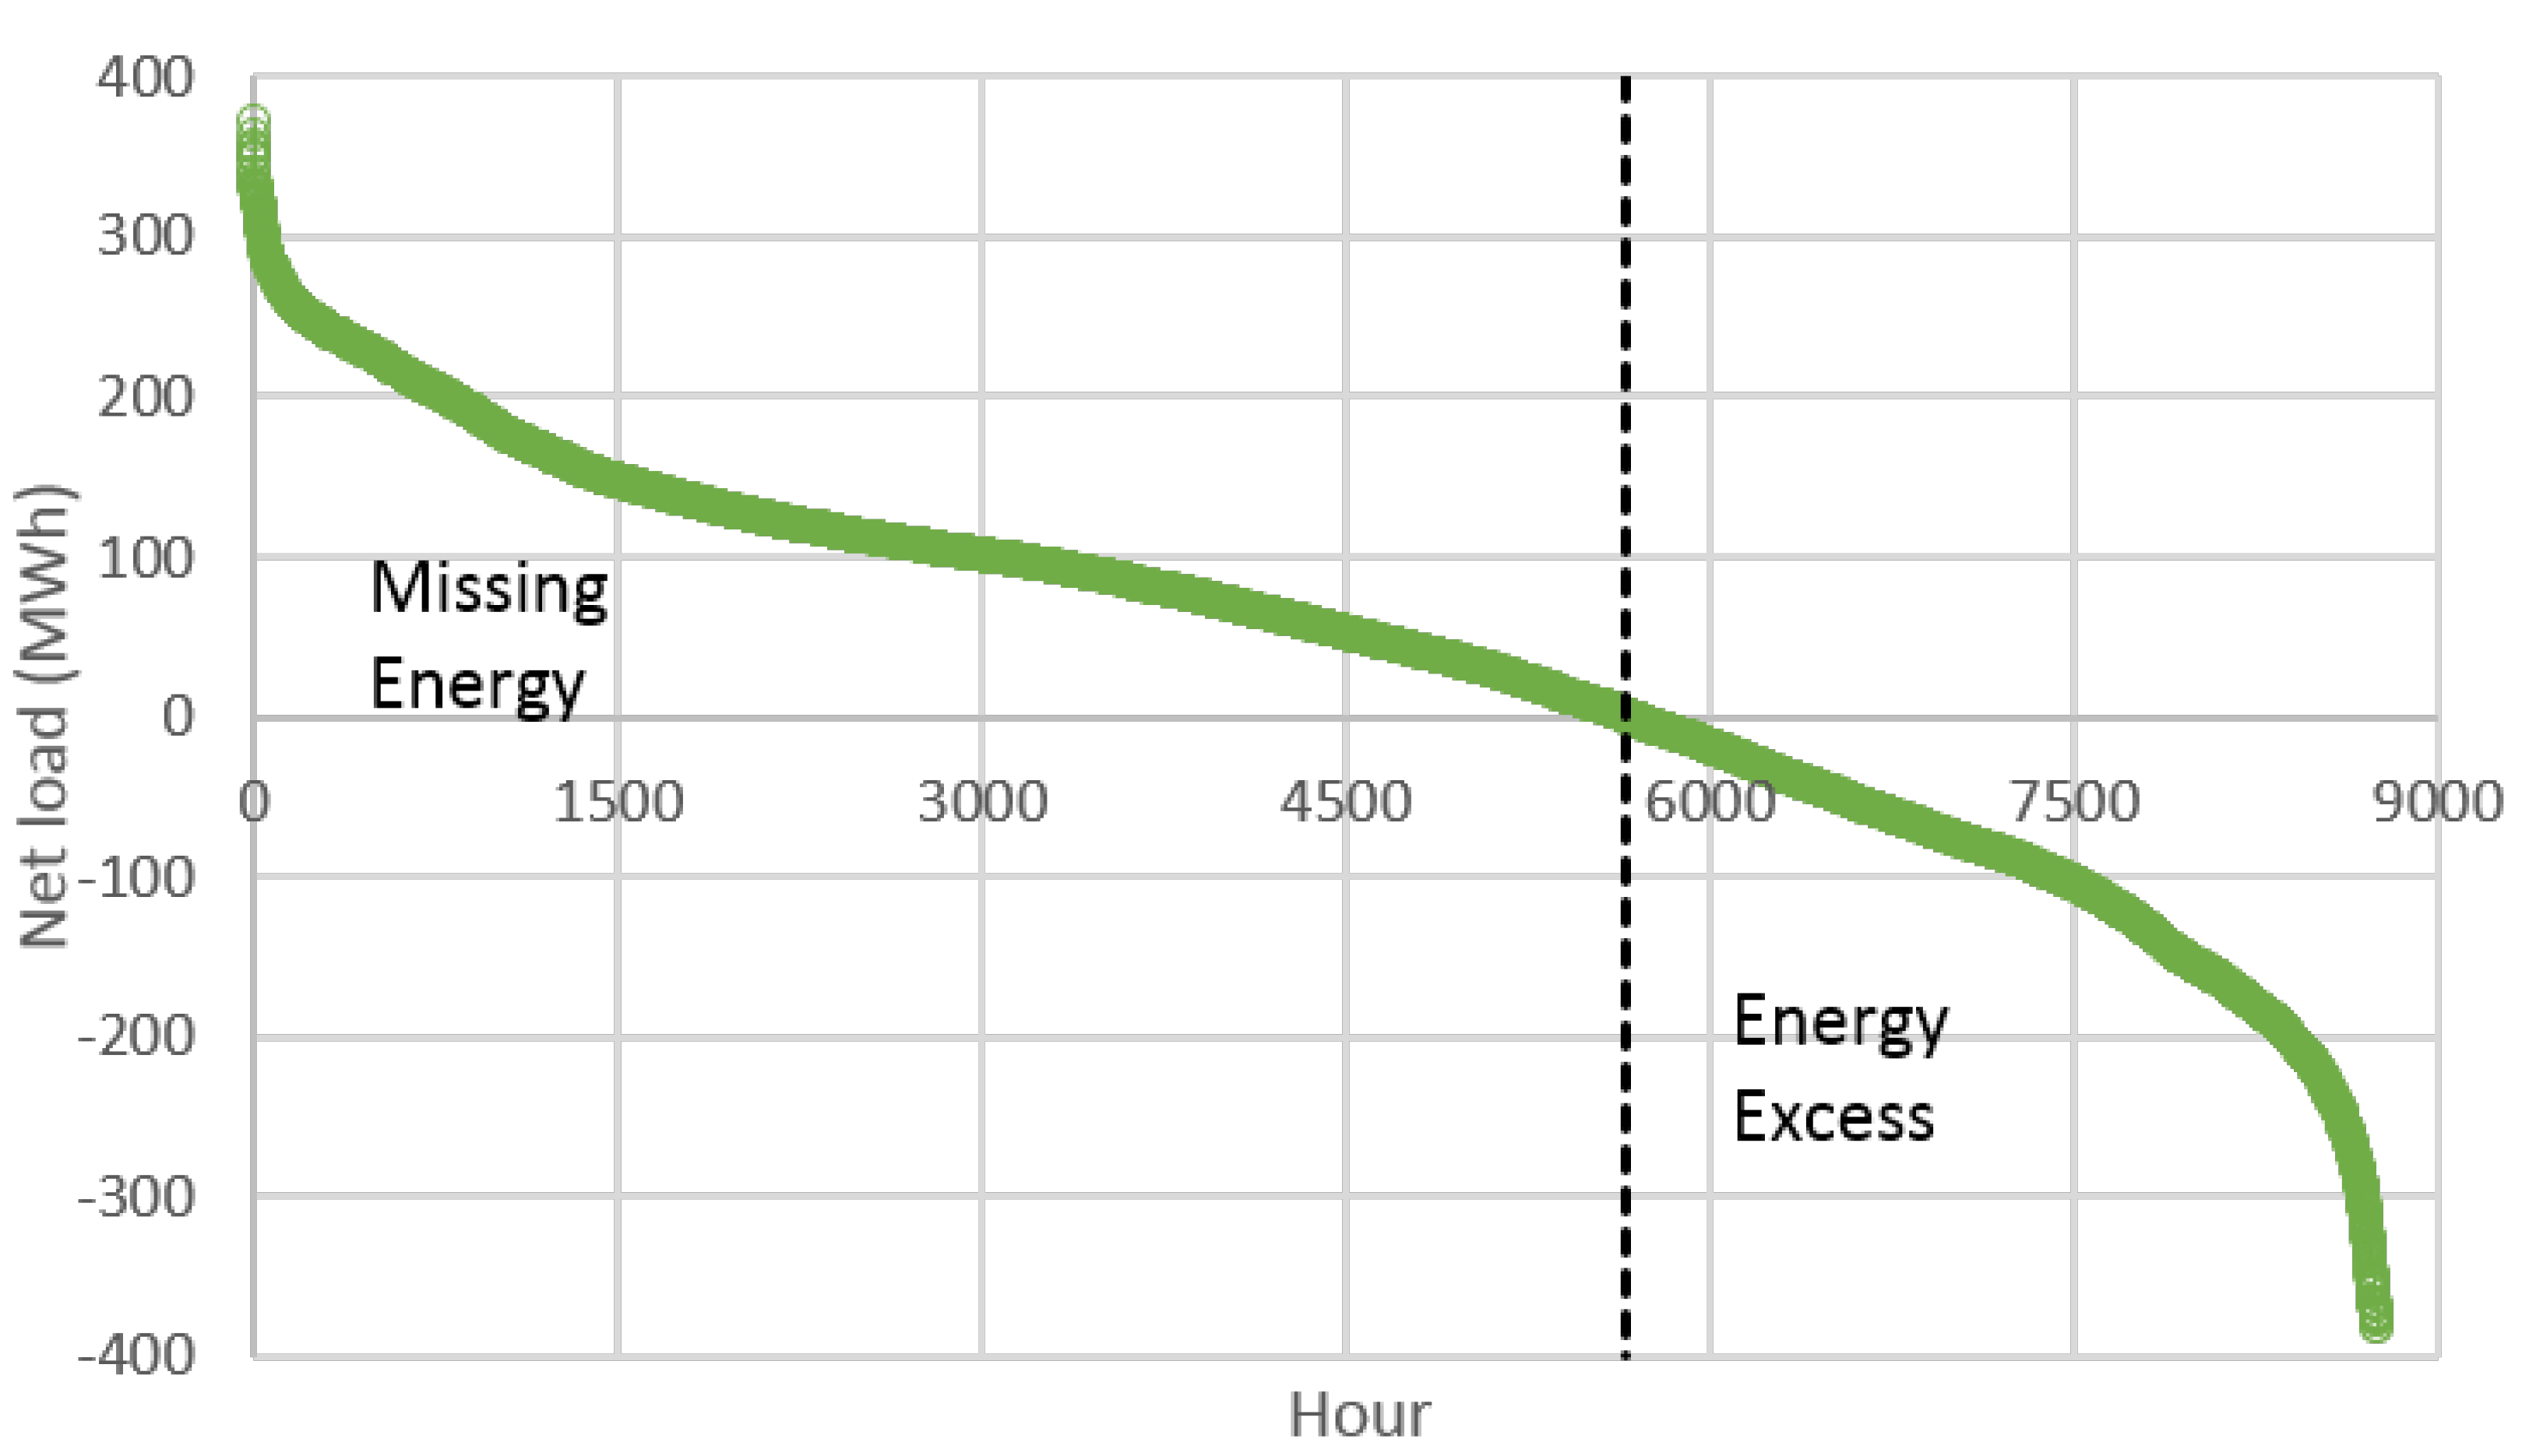
Figure 3 presents the monotone curve of the CEC net load in 2019.
Analyzing
Figure 3, it is possible to verify that the CEC has more periods with missing energy than excess energy, being its sustainability index equal to 36%. Thus, it will need to buy more energy from wholesale markets than sell it, with its carbon neutrality index being equal to 87%.
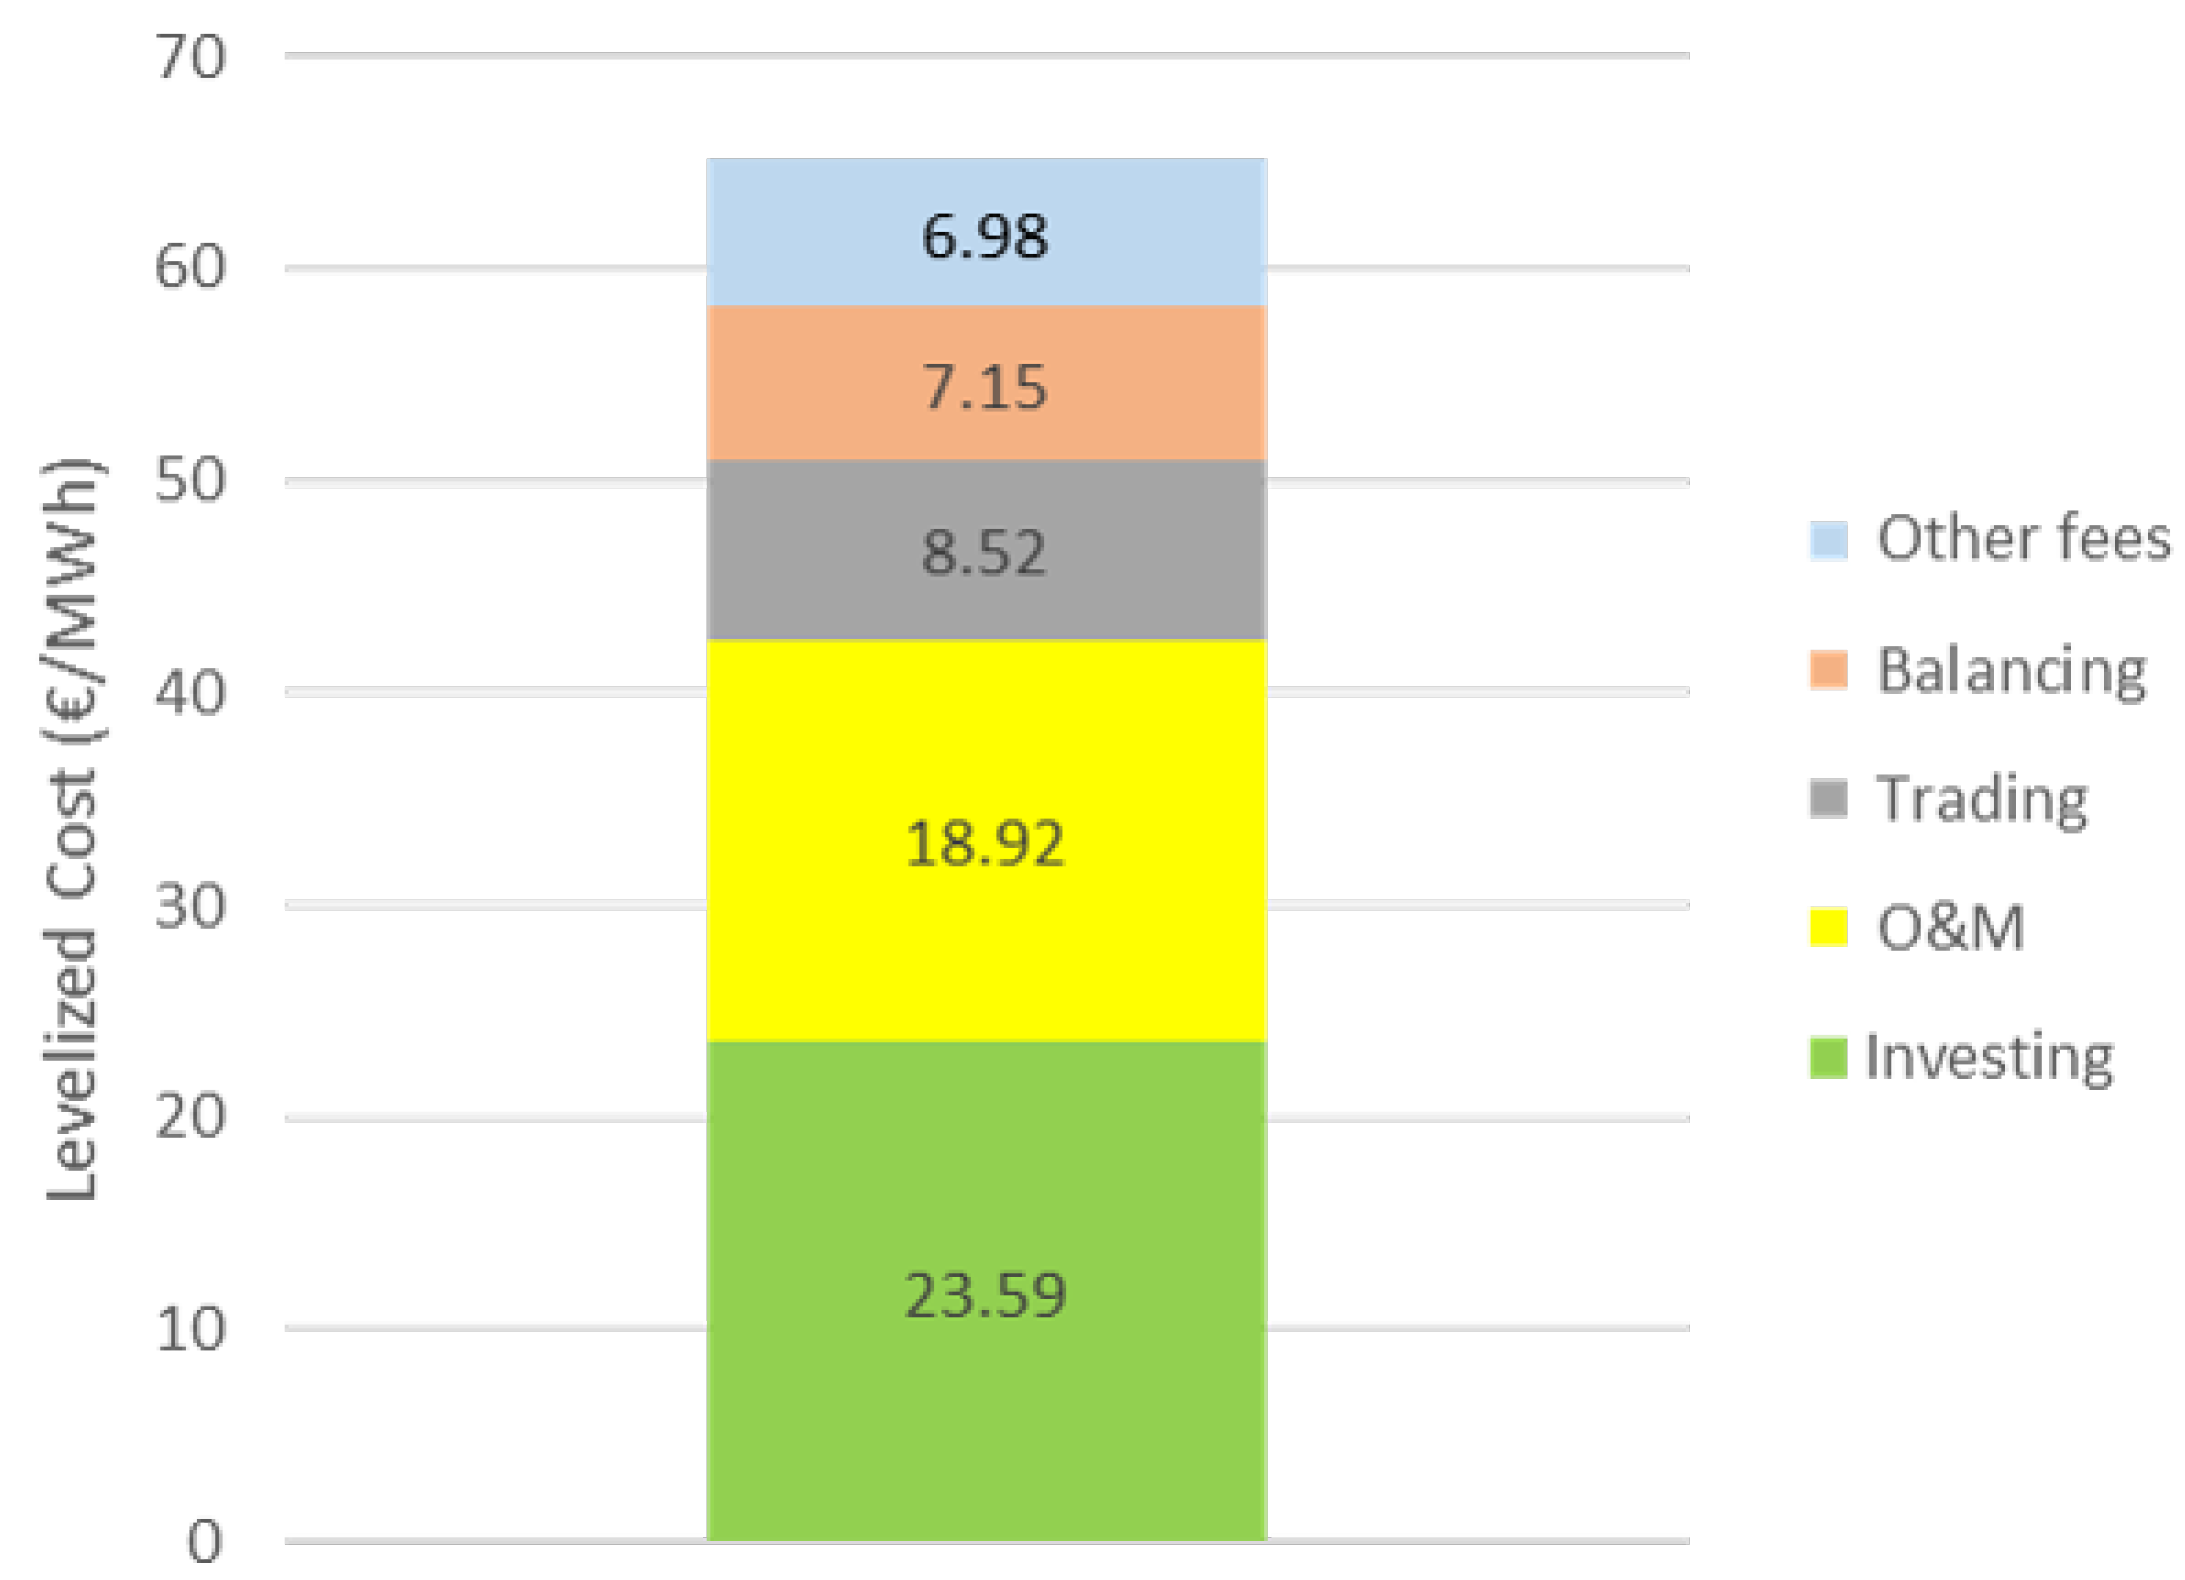
Figure 4 presents the levelized costs of the CEC divided per type of cost.
Analyzing
Figure 4 it is possible to conclude that the CEC has a levelized cost of 65.16 EUR/MWh, with all required 2019 net load and vRES investments of its members. This means that considering the cost of consumers of 67.14 EUR/MWh (see the “Selected” tariff costs in
Table 5), it has a profit of 1.98 EUR/MWh (4.36 million EUR). The CEC may use this profit to guarantee the long-term payment of the vRES investments, but also has backup to compensate consumers when retail tariffs are more attractive than its own tariffs. Thus, CECs may retain members by at least proposing the same tariffs as the competition.
The majority of CEC costs are with annual investing, operation, and maintenance costs with vRES. Trading costs exist because of the small local sustainability index (see
Figure 3). However, the CEC earns money in the case of energy excess and pays otherwise. Even so, it buys more energy than sells, with its trading costs being significant (13% of the total costs). Trading, balancing, and other fees costs illustrate the required improvements. Improvements in the forecast accuracy and/or enough flexibility to keep the CEC sustainable and balanced may completely mitigate trading and balancing costs. Furthermore, a fully sustainable CEC may decrease the other fees costs to the medium voltage access costs of 1.38 EUR/MWh. In conclusion, by being part of CECs, consumers may reduce costs by 29%. Furthermore, improvements in forecast accuracy and incentives to demand response programs towards local sustainability may reduce the CEC costs by 22.65 EUR/MWh (35%) to 42.51 EUR/MWh, 54% less than the best retail tariff (see the costs of the DAHP tariff in
Table 5). Savings of 54% are aligned with the other studies from the literature (e.g., [
29]) Thus, fully sustainable CECs hedge against wholesale price volatility and its future price uncertainty, being their costs based on expected investment and O&M costs with their local resources. Furthermore, CECs can contribute to the local balance and grid reliability since the pricing structure of tariffs incentivize them to be sustainable.
7. Conclusions
This paper studied the behavior of competitive local citizen energy communities participating in wholesale markets. It presented models for optimal investment in local generation assets, tariffs definition, and the strategic bidding behavior of CECs in wholesale markets. Furthermore, it presented a model that simulates the behavior of consumers when selecting tariffs. These models were tested in a computational study using real consumers and market data from the Iberian Market of Electricity (MIBEL).
Using forecasts of market prices and consumption, the CEC designed and proposed eight different tariffs to consumers competing with the regulator and the three most competitive retail tariffs. Those types of tariffs are single, four-rate TOU, DAHP, DAMP, and RTP. Furthermore, the CEC proposed green tariffs to consumers assigned to local onshore wind, large-scale solar PV, and a hybrid solution with both technologies. Consumers may also invest in their own solar rooftop PV. All consumers select the four-rate solar PV and Hybrid TOU tariffs and the single PV tariffs proposed by the CEC. Their choices led to savings of 27% compared with the best retail tariff. If they always select the best monthly tariff, their savings increase to 29%. Using the strategic bidding and behavior of the CEC in wholesale and retail markets allows the CEC to profit 3% regarding the difference between its members payments and its total costs.
The majority of the costs of the CEC are in its investments in local generation (36%) and their operation and maintenance costs (29%). However, it also has relevant costs on trading (13%), balancing (11%), and other fees (11%) related to grid usage. Trading costs and other fees can be reduced by increasing local sustainability. The local sustainability index is only 34%. Thus, most energy is traded in wholesale markets, even considering that the CEC produces almost all it consumes (carbon neutrality index of 87%). Resource complementarity and demand response shall be used to increase local sustainability and reduce these costs. In addition to these solutions, improving forecast accuracy is also relevant to reduce balancing costs.
Future work aims at improving local resource complementarity and forecast accuracy as well as the inclusion of storage solutions. Furthermore, it also aims at considering the consumers’ demand response and dynamic monthly choice of tariffs considering a monthly response of the CEC by proposing new tariffs adapted to the markets and consumers’ behaviors.


