Article

Influence of a Built-in Finned Trombe Wall on the Indoor Thermal Environment in Cold Regions

1
School of Environmental and Municipal Engineering, Lanzhou Jiaotong University, Lanzhou 730070, China
2
Key Laboratory of Railway Vehicle Thermal Engineering, Ministry of Education, Lanzhou 730070, China
*
Author to whom correspondence should be addressed.
Energies 2024, 17(8), 1874; https://doi.org/10.3390/en17081874
Submission received: 18 March 2024 / Revised: 5 April 2024 / Accepted: 9 April 2024 / Published: 14 April 2024
(This article belongs to the Section G: Energy and Buildings)

Abstract

:
This study focuses on energy conservation, reducing the amount of energy consumed to heat a room, and decreasing the intensity of carbon emissions. The research object is a room heated by a floor with a built-in finned Trombe wall (TW) located in Lanzhou, Gansu Province. ANSYS software was employed to conduct a simulation study on parameters such as fin height, transverse spacing, longitudinal spacing, arrangement mode, and fin apex angle. The simulation results were used to determine the fin parameters’ thermal impact on the TW’s thermal performance, including with respect to a room’s thermal environment (TE). The results show that the heat transfer performance of a TW with respect to the thermal environment of a room is the greatest when the height of the heat-absorbing surface is 20 mm, the transverse spacing is 0.20 m, the longitudinal spacing is 0.533 m, and in-line 90° top-angle fins, that is, isosceles right triangle fins, are used. The average Nu number of the fin-type TW is 154.75. Compared with the average Nu number of the finless TW, which is 141.43, the average Nu number increases by 13.32 due to the addition of fins. The optimized fin-type TW has 7.77% higher convective heat supply efficiency than the finless TW. Although the PMV-PPD results of the two TW-type rooms are not very different, the comfort period of the fin-type TW room is longer. At the same time, the LPD3 of the non-finned TW and the finned TW rooms is less than 10%, the wind speed at the head and ankle is less than 0.12 m/s, the air gust sensation is not strong, and the thermal comfort is good, indicating that the addition of fins is beneficial to the improvement of indoor thermal comfort. Compared to standard rooms, finless TW rooms and fin-type TW rooms have energy-saving rates of 36.38% and 44.63%, respectively. Thus, fin-type TW rooms’ energy saving rate is 8.25% higher, resulting in effective savings in heating energy consumption. Therefore, the indoor TE and auxiliary heating conditions are improved, and the integration of solar building technology can be facilitated, which offers significant reference value for energy transformation.

1. Introduction

As human society and economies have been developing rapidly, especially over the past century following the Industrial Revolution, global energy consumption has been rising significantly. According to statistics provided by BP (Petroleum and Petrochemical Corporation) in the “World Energy Statistical Yearbook 2022”, each year witnesses a global energy consumption increase, and primary energy demand will double by 2050 [1]. At present, China is in a critical stage of achieving its “double carbon” goal, and energy transformation is the most important part of it. Solar energy, a type of renewable energy, is a form of clean energy with the greatest potential and widest applications and no geographical restrictions. In China’s current energy consumption landscape, building energy usage constitutes nearly 30% of the country’s energy consumption. Heating and ventilation constitute the predominant share of energy consumption in buildings. The “solar building integration” project represents a substantial movement for transforming energy consumption. It can save energy, improve indoor TE, and help significantly realize China’s “carbon peak and carbon neutrality” goal.
TW technology stands out as one of the most extensively researched passive solar-heating approaches. It represents a traditional yet effective building-integrated solar structure known for its simplicity, high efficiency, environmental friendliness, and cost-effectiveness [2]. In recent years, scholars at home and abroad have mainly studied the performance of Trombe systems in terms of function expansion and structure optimization.
To increase the diversity of a TW systems’ functions, many researchers have proposed air purification TWs [3,4,5], photovoltaic power generation TWs [6,7,8], and multifunctional photocatalysis-photovoltaic TWs [9], integrating photovoltaic power generation, air purification and heating, and hot-water preparation Trombe walls [10,11]. At present, research is being conducted to improve the structure of a TW. In terms of glass cover, there are mainly single-layer, double-layer, and three-layer forms [12,13], as well as the electrochromic type [14] and the use of a water wall instead of glass cover [15]. Additionally, enhancements to TW technology have been explored, including the incorporation of shutters, the integration of DC fans into the lower vent [16], the introduction of newly designed built-in grille channels [17], and modifications to the shape of both the upper and lower vents [18].
Research on the addition of phase change materials (SP-22; concrete changed into mortar-integrated microencapsulated materials; external phase change material wall panels with high absorption/reflectivity coatings; internal phase change material wall panels with active hot/cold water pipes; 55% capric acid and 45% lauric acid; materials integrating new composite PCM/concrete walls, and mixed-nanoparticle- reinforced phase change materials) [19,20,21,22,23] as well as Trombe walls for optimizing thermochromism has been conducted [24].
Adding fins is another approach to changing the structure. Ahmadi et al. [25] conducted numerical and experimental studies regarding the steady-state convective heat transfer of vertically mounted rectangular discontinuous fins. The inclusion of intermittent fins enhanced the capacity for heat dissipation and the electronic components’ natural heat transfer efficiency. Hosseini et al. [26] simulated solar chimneys and evaluated their performance through the arrangement of longitudinal rectangular fins under steady-state conditions. It was found that compared with continuous fins, the use of fins with appropriate discontinuities could enhance solar chimneys’ performance. To enhance a Trombe wall’s thermal efficiency, specifically under Yazd’s arid climate conditions in Iran, Rabani et al. [27] incorporated three fins onto the heat-absorbing surface (HAS) and compared the experimental results. The results show that adding more fins does not guarantee that thermal efficiency can be improved in all cases, and the heating efficiency of copper fins is higher than that of aluminum fins and brass fins. Under steady-state conditions, Wu et al. [28] examined the impact of fin height, spacing, and arrangement on the inlet and outlet temperature, ventilation capacity, and thermal efficiency of a Trombe wall. These observations indicated that incorporating vertical fins measuring 40 mm in height and spaced 16.67 mm apart can enhance thermal efficiency by 23.7% compared to a conventional Trombe wall. Similarly, the addition of horizontal fins with dimensions of 10 mm in height and spaced 25 mm apart can lead to a thermal efficiency increase of 16.54%. Wang et al. [29] conducted a numerical simulation to assess the heat transfer characteristics of a Trombe wall’s HAS and air interlayer by introducing fins in a heating room located in Xining. Additionally, they investigated the room’s energy-saving potential by optimizing the fins. The optimized fin-type Trombe wall exhibited enhanced heat transfer performance, resulting in a 53.57% higher energy-saving rate for the corresponding room compared to a room utilizing a finless Trombe wall.
Currently, most of the research on this topic focuses solely on the fins’ impact on Trombe walls’ heat transfer performance, with few investigations focusing on the effect of fin parameters on the TE within Trombe-wall-incorporating rooms. In this study, a 3D fully coupled numerical model is developed to analyze a Trombe wall with integrated fins and the corresponding indoor space when steady-state conditions exist. The TW’s thermal characteristics under the combined floor heating room are explored by changing the fins’ parameters, and the TE in the fin-type TW room and the non-fin TW room are compared. We used TW technology to increase solar energy efficiency so that it can play an auxiliary heating role during the winter period of the studied building, thereby reducing the use of traditional energy. This research has reference significance for China’s energy transformation in architecture.
The following are the innovations of this paper:
(1)
A three-dimensional numerical model of a coupled fin-type Trombe wall and a room under steady-state conditions was established;
(2)
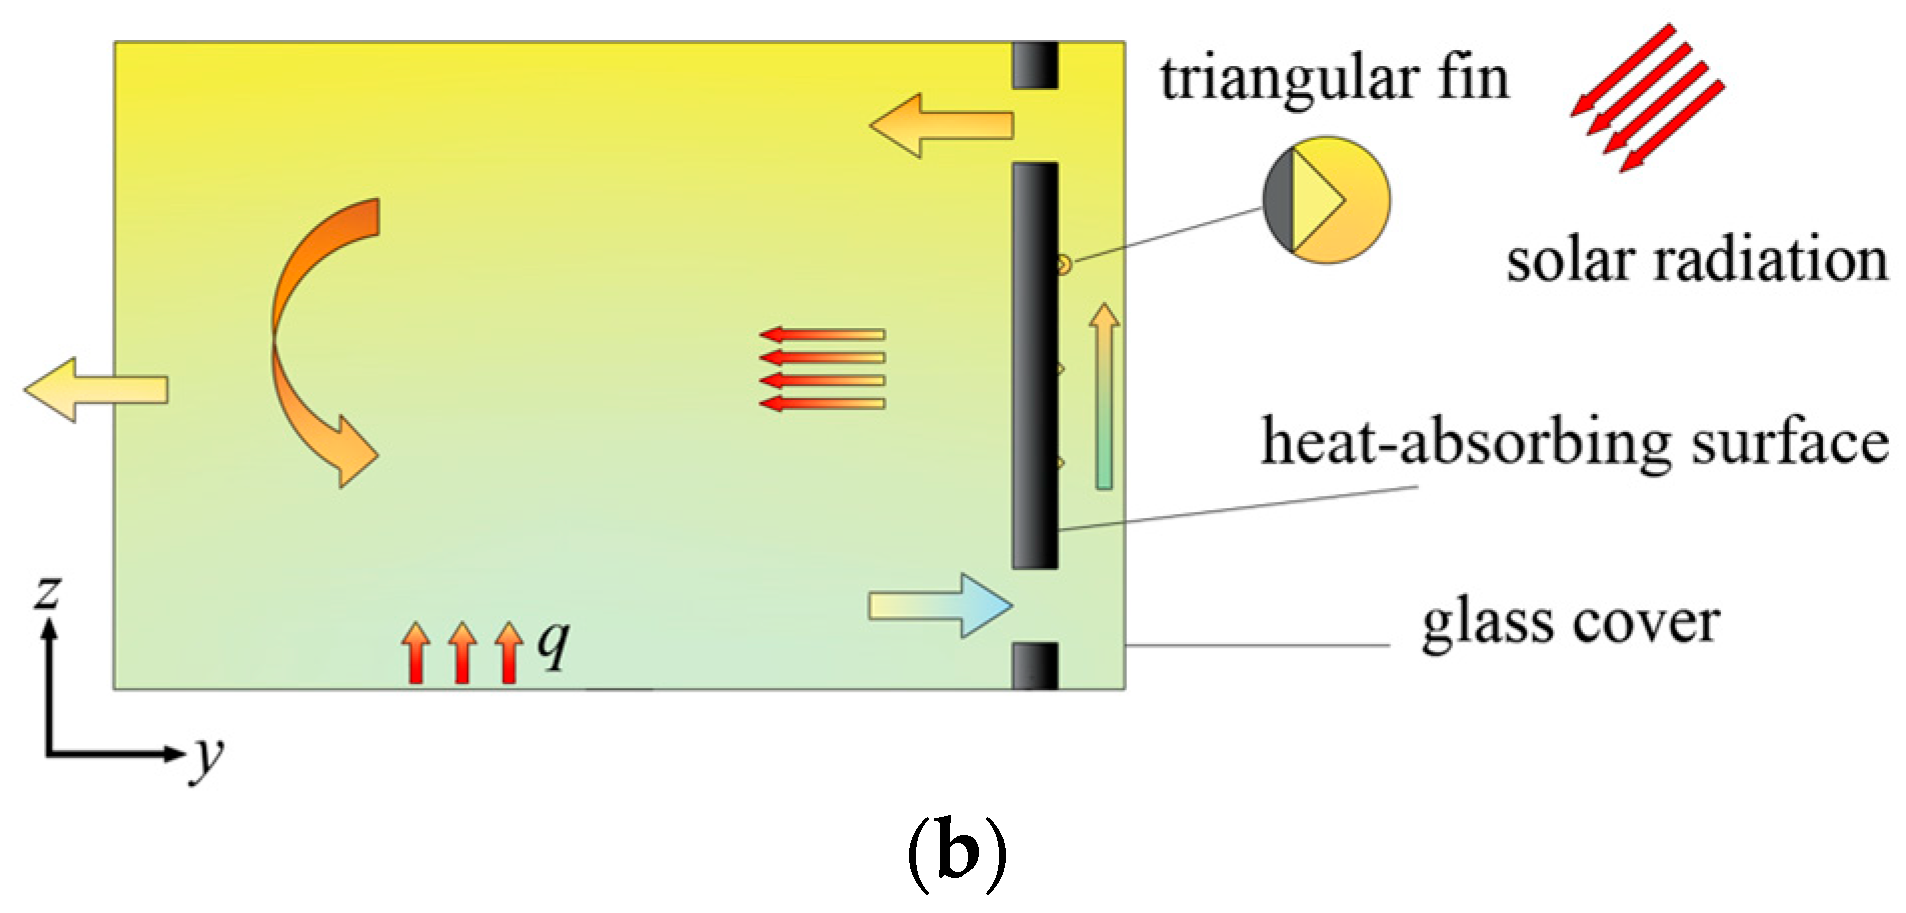
By adding fins to the HAS, the air generates vortices and secondary flow during the flow process, which causes damage to the boundary layer, thereby exchanging the momentum and energy between the mainstream region and the boundary layer region, facilitating the enhancement of convective heat transfer;
(3)
Combined with floor heating, the influence of changing fin parameters on TW heat transfer and the indoor thermal environment under the combined action of solar radiation intensity and indoor floor heating is studied.

2. Numerical Approach
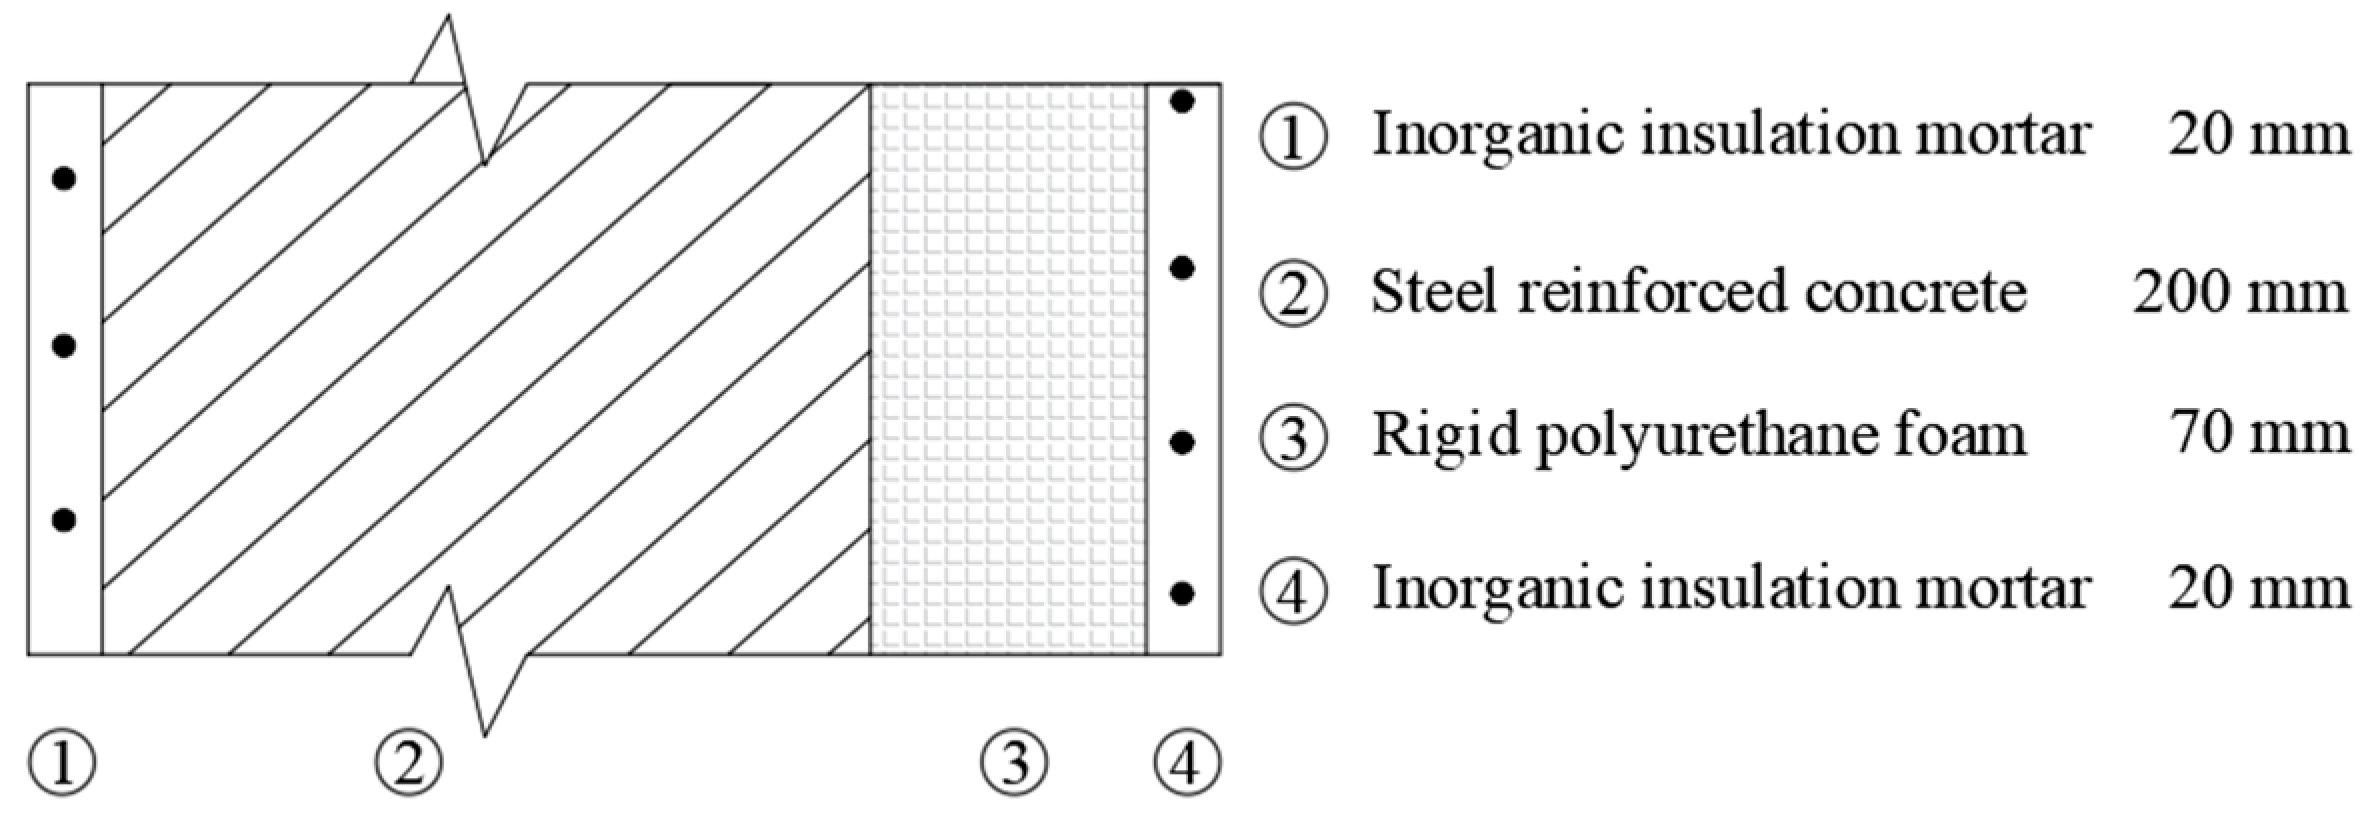
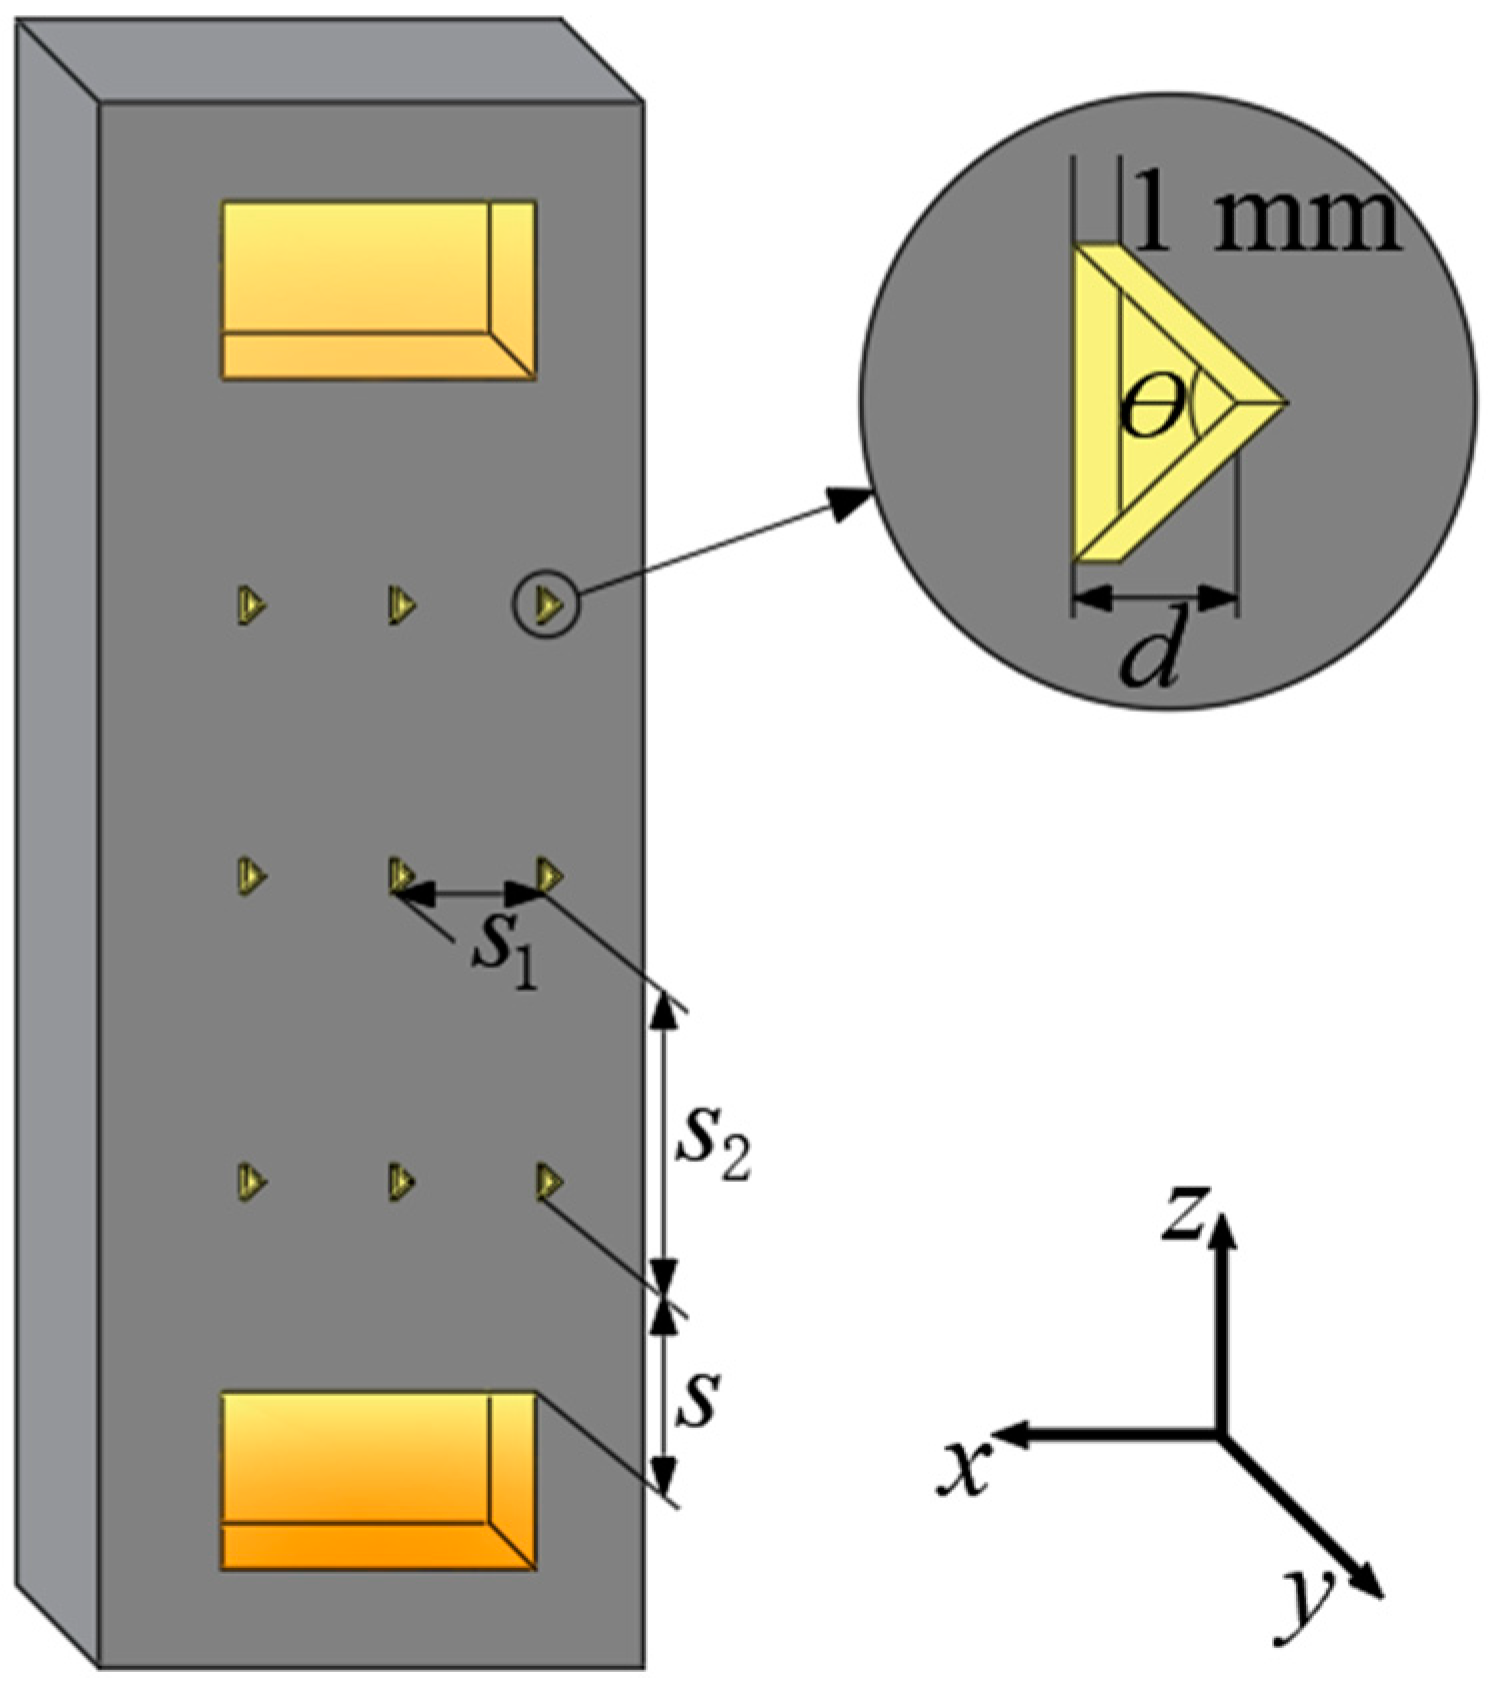
2.1. Physical Model

This research examines the impact of an optimized built-in fin structure within the TW system on the TE within a room during winter heating in Lanzhou, Gansu (36.05° N, 103.88° E, 1517 m above sea level). The physical model is presented in Figure 1. The entire front section of the room faces south. Its east, west, and north sides are ordinary envelope structures, and the south envelope structure is equipped with a TW system. The TW’s air channels on the east, south, and west sides are covered with glass plates, thereby expanding the illuminated area. This arrangement ensures that the HAS effectively captures solar radiation from three directions. Additionally, the south-facing wall features two windows measuring 1000 mm in width and 1800 mm in height. The collector wall’s thickness and the thickness of the air channel of the southward TW system are 200 mm and 300 mm, respectively. The collector wall has an upper and lower vent with a height of 300 mm and a width of 500 mm width. Thus, it is 200 mm away from the top and bottom, respectively.
Figure 2 is a schematic diagram of the building envelope structure, and Table 1 lists the thermal performance parameters of related materials. All these parameters meet the energy-saving design standards of Gansu Province [30]. Specifically, the reinforced concrete has a 200 mm thickness and is coated with a 70 mm polyurethane rigid foam plastic layer on its outer surface. Furthermore, both the inner and outer surfaces are enveloped with inorganic thermal insulation mortar, each with a thickness of 20 mm.
As illustrated in Figure 3, s1 represents the lateral spacing of the fins, s2 denotes the longitudinal spacing, s indicates the distance from the front end of a fin to the upper edge of the lower vent, and d represents the height of a fin. A triangular fin is vertically oriented on the HAS, with a fin thickness of 1 mm. According to the local Nusselt number ( N u j ) equation [31] for the vertical wall turbulent boundary layer under natural convection conditions, the local heat transfer coefficient ( h j ) experiences an increase of less than 1% as s surpasses 0.4 m. Thus, s was set to 0.4 m.

2.2. Mathematical Model

The test case was simulated using the ANSYS-FLUENT 2022R1 software product. The flow and heat transfer problem in the model can be regarded as a natural convection problem driven by buoyancy in a closed cavity [32]. The RNG k-ε model was utilized to compute turbulence terms, while the air was set to behave in accordance with the Boussinesq hypothesis. The specific consideration of this hypothesis is to ignore viscous dissipation in the fluid. All physical properties, except density, are treated as constants. Density is considered only in terms associated with volume force in the momentum equation, while in other equations, it remains constant [29]. Indoor airflow, convection, and radiation heat transfer problems are controlled by the governing equations. The near-wall region of the air interlayer channel experiences significant velocity and temperature gradients, hence the adoption of the enhanced wall function.
Moreover, the radiation model selected is the Discrete Ordinates (DO) model, and the Pressure-Implicit with Splitting of Operators (PISO) algorithm was employed to manage velocity–pressure coupling. The discretization of the control equation was performed using the second-order upwind scheme.
Continuity:
u i x i = 0
Conservation of momentum:
u i u j x j = 1 ρ · p x i + x j ν + ν t u i x j g i β T T
Conservation of energy:
u j T x j = x j Γ T x j
Turbulent kinetic energy (k) equation:
k u i x i = 1 ρ · x j ν + ν t σ k k x j ε + G k
Dissipation rate ( ε ) equation:
ε u i x i = 1 ρ · x j ν + ν t σ ε ε x j + ε k c 1 G k c 2 ε
Γ = ν P r + ν t σ t
G k = ν t ρ · u i x j u i x j + u j x i
Heat conduction is the sole mechanism present in the solid region. The energy equation governing heat conduction is expressed in Equation (8).
λ f 2 T x i 2 = 0
where u i and u j are the velocity components in the x i and x j directions, respectively, in m/s; ρ is air density in kg/m3; ν t and ν are the viscosity coefficients of turbulent and laminar flow, respectively, in m2/s; g i is the acceleration of gravity in the direction of I in m/s2; β is the coefficient of thermal expansion of air, expressed as 1/K; T is the average temperature in K; T is the mainstream temperature in K; Γ is the generalized diffusion coefficient; k is pulsation turbulent kinetic energy in J; ε is the dissipation rate of the kinetic energy of fluid pulsation; c 1 and c 2 are empirical coefficients; G k is the generation term of turbulent kinetic energy; Pr is the Prandtl number; σ k , σ ε , and σ t are the Prandtl numbers of k, ԑ, and t, respectively; and λ f is the thermal conductivity of a solid, expressed as W/(m·K).

2.3. Related Assumptions and Boundary Conditions

2.3.1. Relevant Assumptions

In this study, we developed a three-dimensional numerical model to simulate a TW room with built-in fins under steady-state conditions. To reduce computational expenses, the mathematical model was simplified as follows [28]:
(1)
Air is an incompressible fluid with constant fluid properties;
(2)
Air density corresponds to the Boussinesq hypothesis, and it is assumed to be a radiation-transparent medium, which does not engage in radiation heat transfer;
(3)
Each surface is a diffuse gray surface;
(4)
Heat transfer between the room and the upper room is ignored;
(5)
The glass cover’s heat transfer along the thickness direction is ignored.

2.3.2. Boundary Conditions

Heat flux conditions were applied to the three directions of the glass cover, the HAS, and the fins’ left and right hands and calculated according to Equations (9)–(16) [28]. The floor of the room was modeled with a heat flow boundary condition, and the heat dissipation per unit area was computed according to pertinent technical regulations [33]. Considering the attenuation and delay of the transmission of outdoor temperature waves to the room, the inner surface’s temperature [34] was attained by utilizing the correlation equation for heat transfer through a flat wall when unidirectional harmonic heat is assumed to have an influence, serving as the temperature boundary condition for the inner surface. The air channel’s top and bottom and the room’s top are assigned adiabatic boundary conditions, while the other walls are given coupled boundary conditions. All the solid surfaces of the wall adopt the velocity non-slip boundary condition. Table 2 summarizes the building envelope’s thermal boundary conditions.
The solar radiation absorbed by the glass cover was calculated as follows:
q g , a = α g I
where αg represents the absorptivity of the glass cover, and I represents the intensity of solar radiation in W/m2.
The loss of convective heat transfer from glass cover to the external environment is expressed as follows:
q g , c = h g ( T g T a m b )
where Tg and Tamb refer to the temperature of the glass cover and the ambient temperature in K, respectively; hg represents the coefficient of convective heat transfer, expressed in terms of W/(m2⋅K), which is associated with the ambient wind speed:
h g = 5.7 + 3.8 V w i n d
The loss of radiative heat transfer from the glass cover to the external environment was calculated using the following equation:
q g , r = ε g C 0 ( T g 100 ) 4 ( T s k y 100 ) 4
where εg denotes the emissivity of the glass cover; C0 is the blackbody radiative coefficient, whose value is 5.67 W/(m2⋅K4); and Tsky represents the sky temperature, which was calculated using the following equation:
T s k y = 0.0552 T a m b 1.5
The amount of heat exchange between glass cover and the air in the vertical channel was calculated using the following equation:
q g = q g , a q g , c q g , r
The solar radiation energy absorbed by the absorbing plate was calculated using the following equation:
q p = τ g α x I
where τg represents the transmittance of the glass cover; αx refers to the absorptivity of the surface of the absorbing plate.
The solar radiation absorbed by the absorbent coating layer at the top of the fins is assumed to be a surface heat flux term. The surface heat flux term is defined as follows:
q f = τ g α f I
where αf is the absorptivity of the absorbent coating layer.

3. The Validation of the Numerical Approach

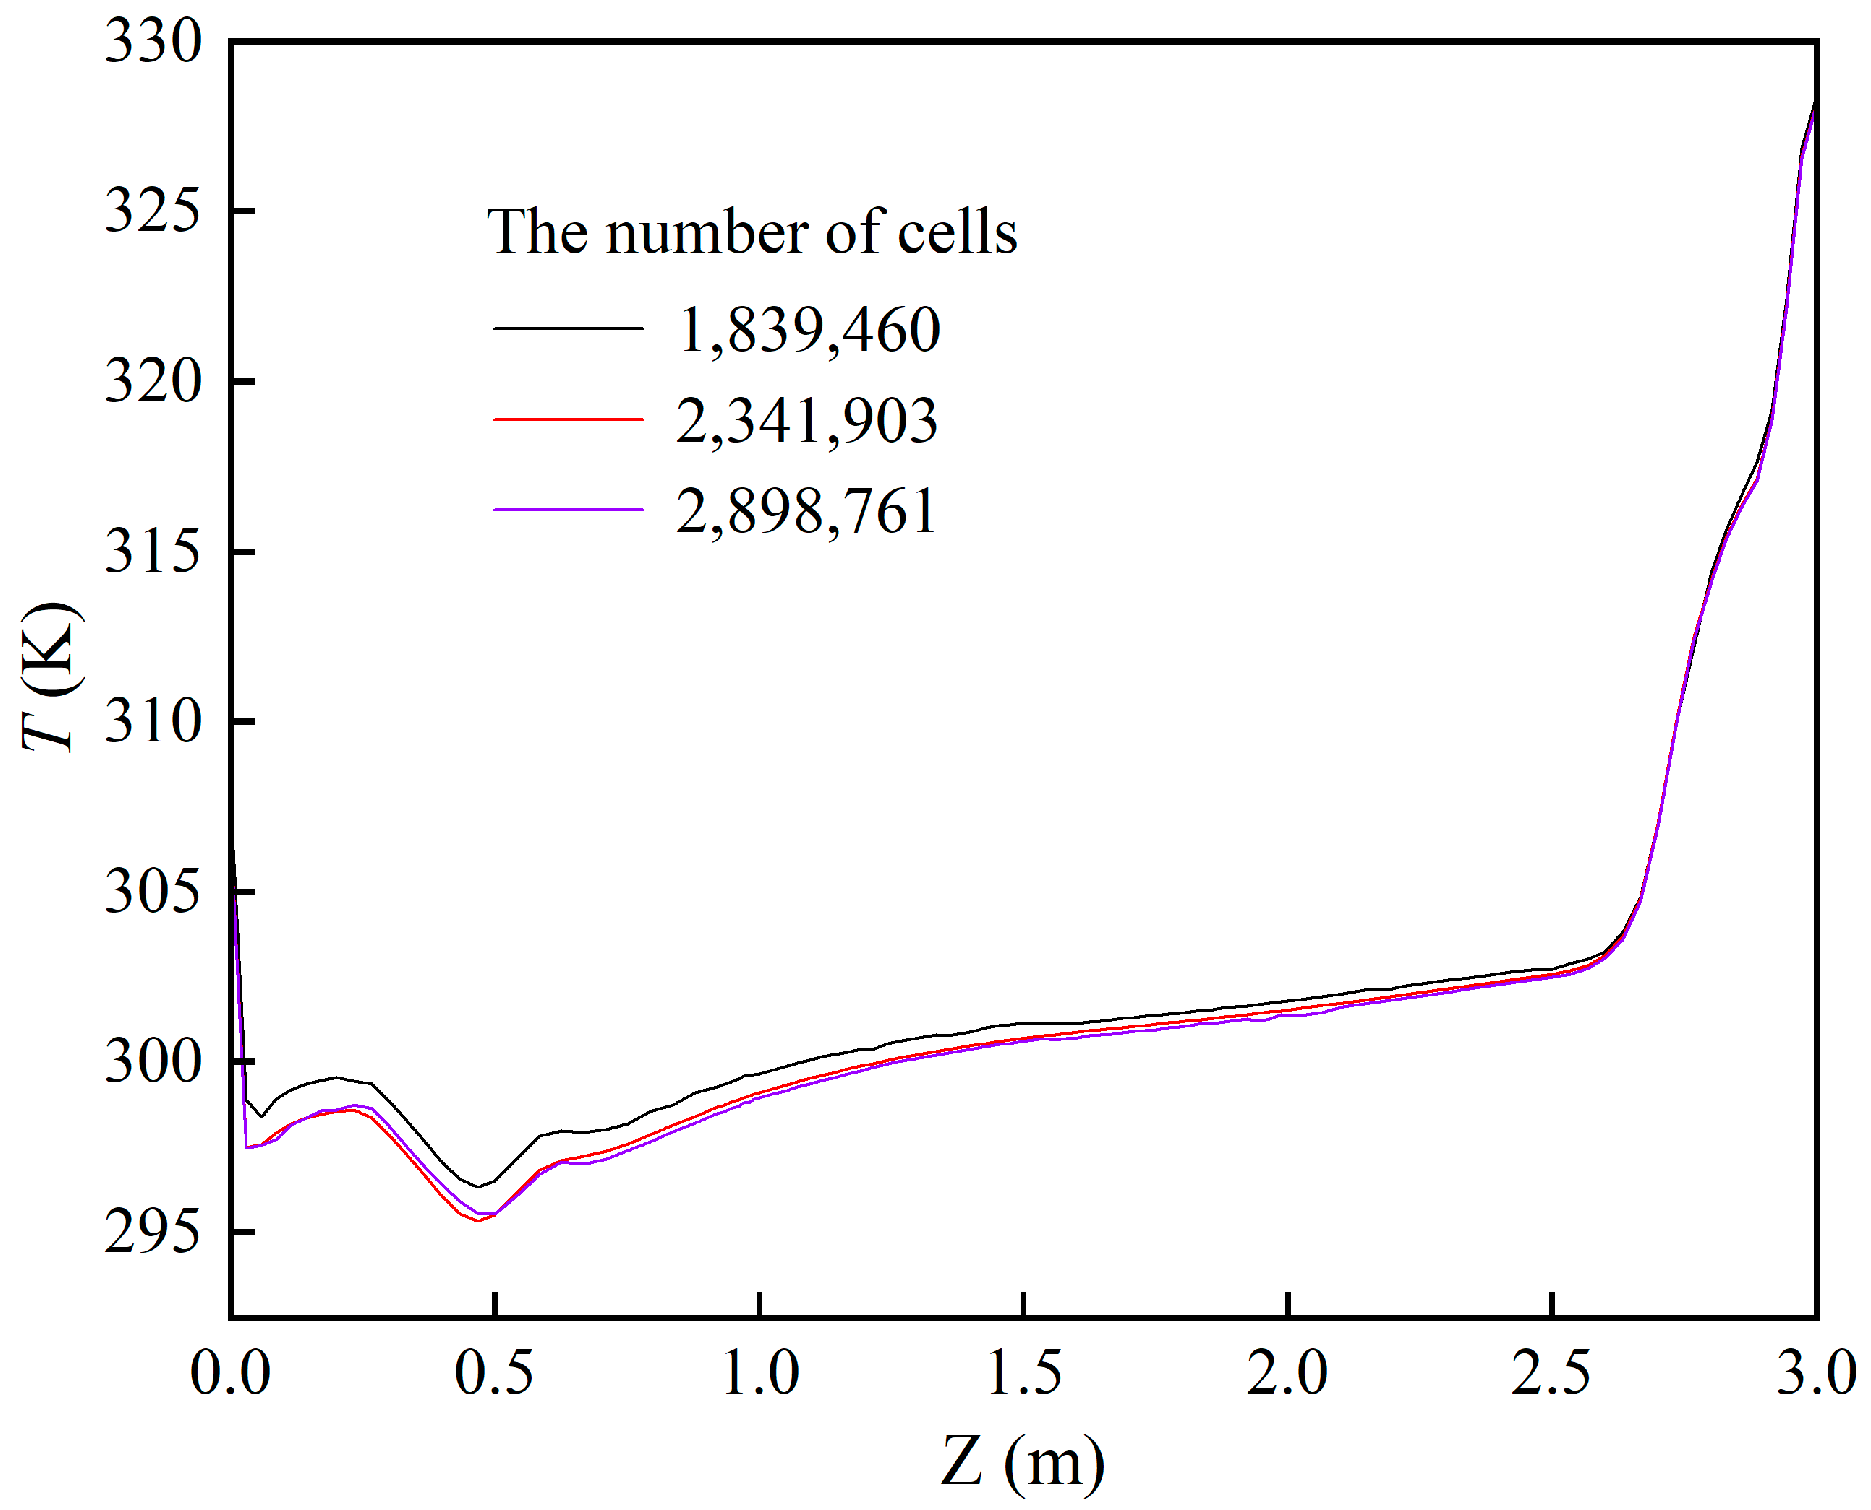
3.1. The Test for Grid Independence

To meet the requirements of calculation accuracy and save costs, grid independence verification is needed. In this study, ANSYS-ICEM was used to divide meshes. Because our model is regular, the mesh was divided into structural components, and local encryption was carried out in the area with fins. As shown in Figure 4, three grid quantities, namely, 1,839,460, 2,341,903, and 2,898,761, were used in this verification. It was found that when the number of grids was 1,839,460, the maximum temperature difference reached 1.4 °C and the minimum reached 0.019 °C compared with the temperature at the same position for the other two grids. The maximum temperature difference between 2,341,903 grids and 2,898,761 grids was 0.34 °C, and the minimum temperature difference was 0.009 °C. That is, when the number of grids was greater than 2,341,903, the error of the calculation result was small, and the result was basically unchanged. Accordingly, this factor was utilized in the following simulations.

3.2. The Validation of the Model

In order to verify the reliability of the proposed mathematical model, the flow and heat transfer process outlined in [27] was numerically simulated. The obtained parameters were compared with the experimental results reported in [27], and the comparison results were drawn into an uncertainty error bar, as shown in Figure 5. It can be seen that the two trends are consistent, and the error is small. The average relative error of the air channel velocity is 5.79%, and the average relative error of the upper vent temperature is 6.18%. Both errors are within the required range, indicating that the corresponding mathematical model and calculation method are reliable.

4. Results and Discussion

The height (d), transverse spacing (s1), and longitudinal spacing (s2) of vertical fins were optimized for a built-in fin TW. The impacts of in-line and staggered fins and isosceles triangles with different angles at the same height and transverse and longitudinal spacing on the natural convective heat transfer performance of a TW were researched. Meanwhile, based on optimizing heat transfer performance, the fins’ influence on the TE in the TW room was studied.
The Nusselt number expresses the strength of the convective heat transfer process. The convective heat transfer intensity of the air on the HAS and the air channel can be measured using the average Nu number ( N u ¯ ) or the local Nu number ( N u j ), as shown in Equations (17) and (18):
N u j = H ( T w T f ) T n
N u ¯ = 1 x 1 z 0 x d x 0 z N u j d z
where H is the height in the Z direction, given in m; Tw is the temperature of the endothermic surface, given in K; and Ta is the temperature of the interlayer air, given in K.
Note that the data at 10:00 were utilized as the operational parameters for the simulation software. The simulation outcomes are used to compute the mean Nusselt number ( N u ¯ ) of the HAS of the TW without fins, which is 141.43 under identical conditions.

4.1. Investigating the Fin Parameters’ Impact on the TW’s Thermal Performance

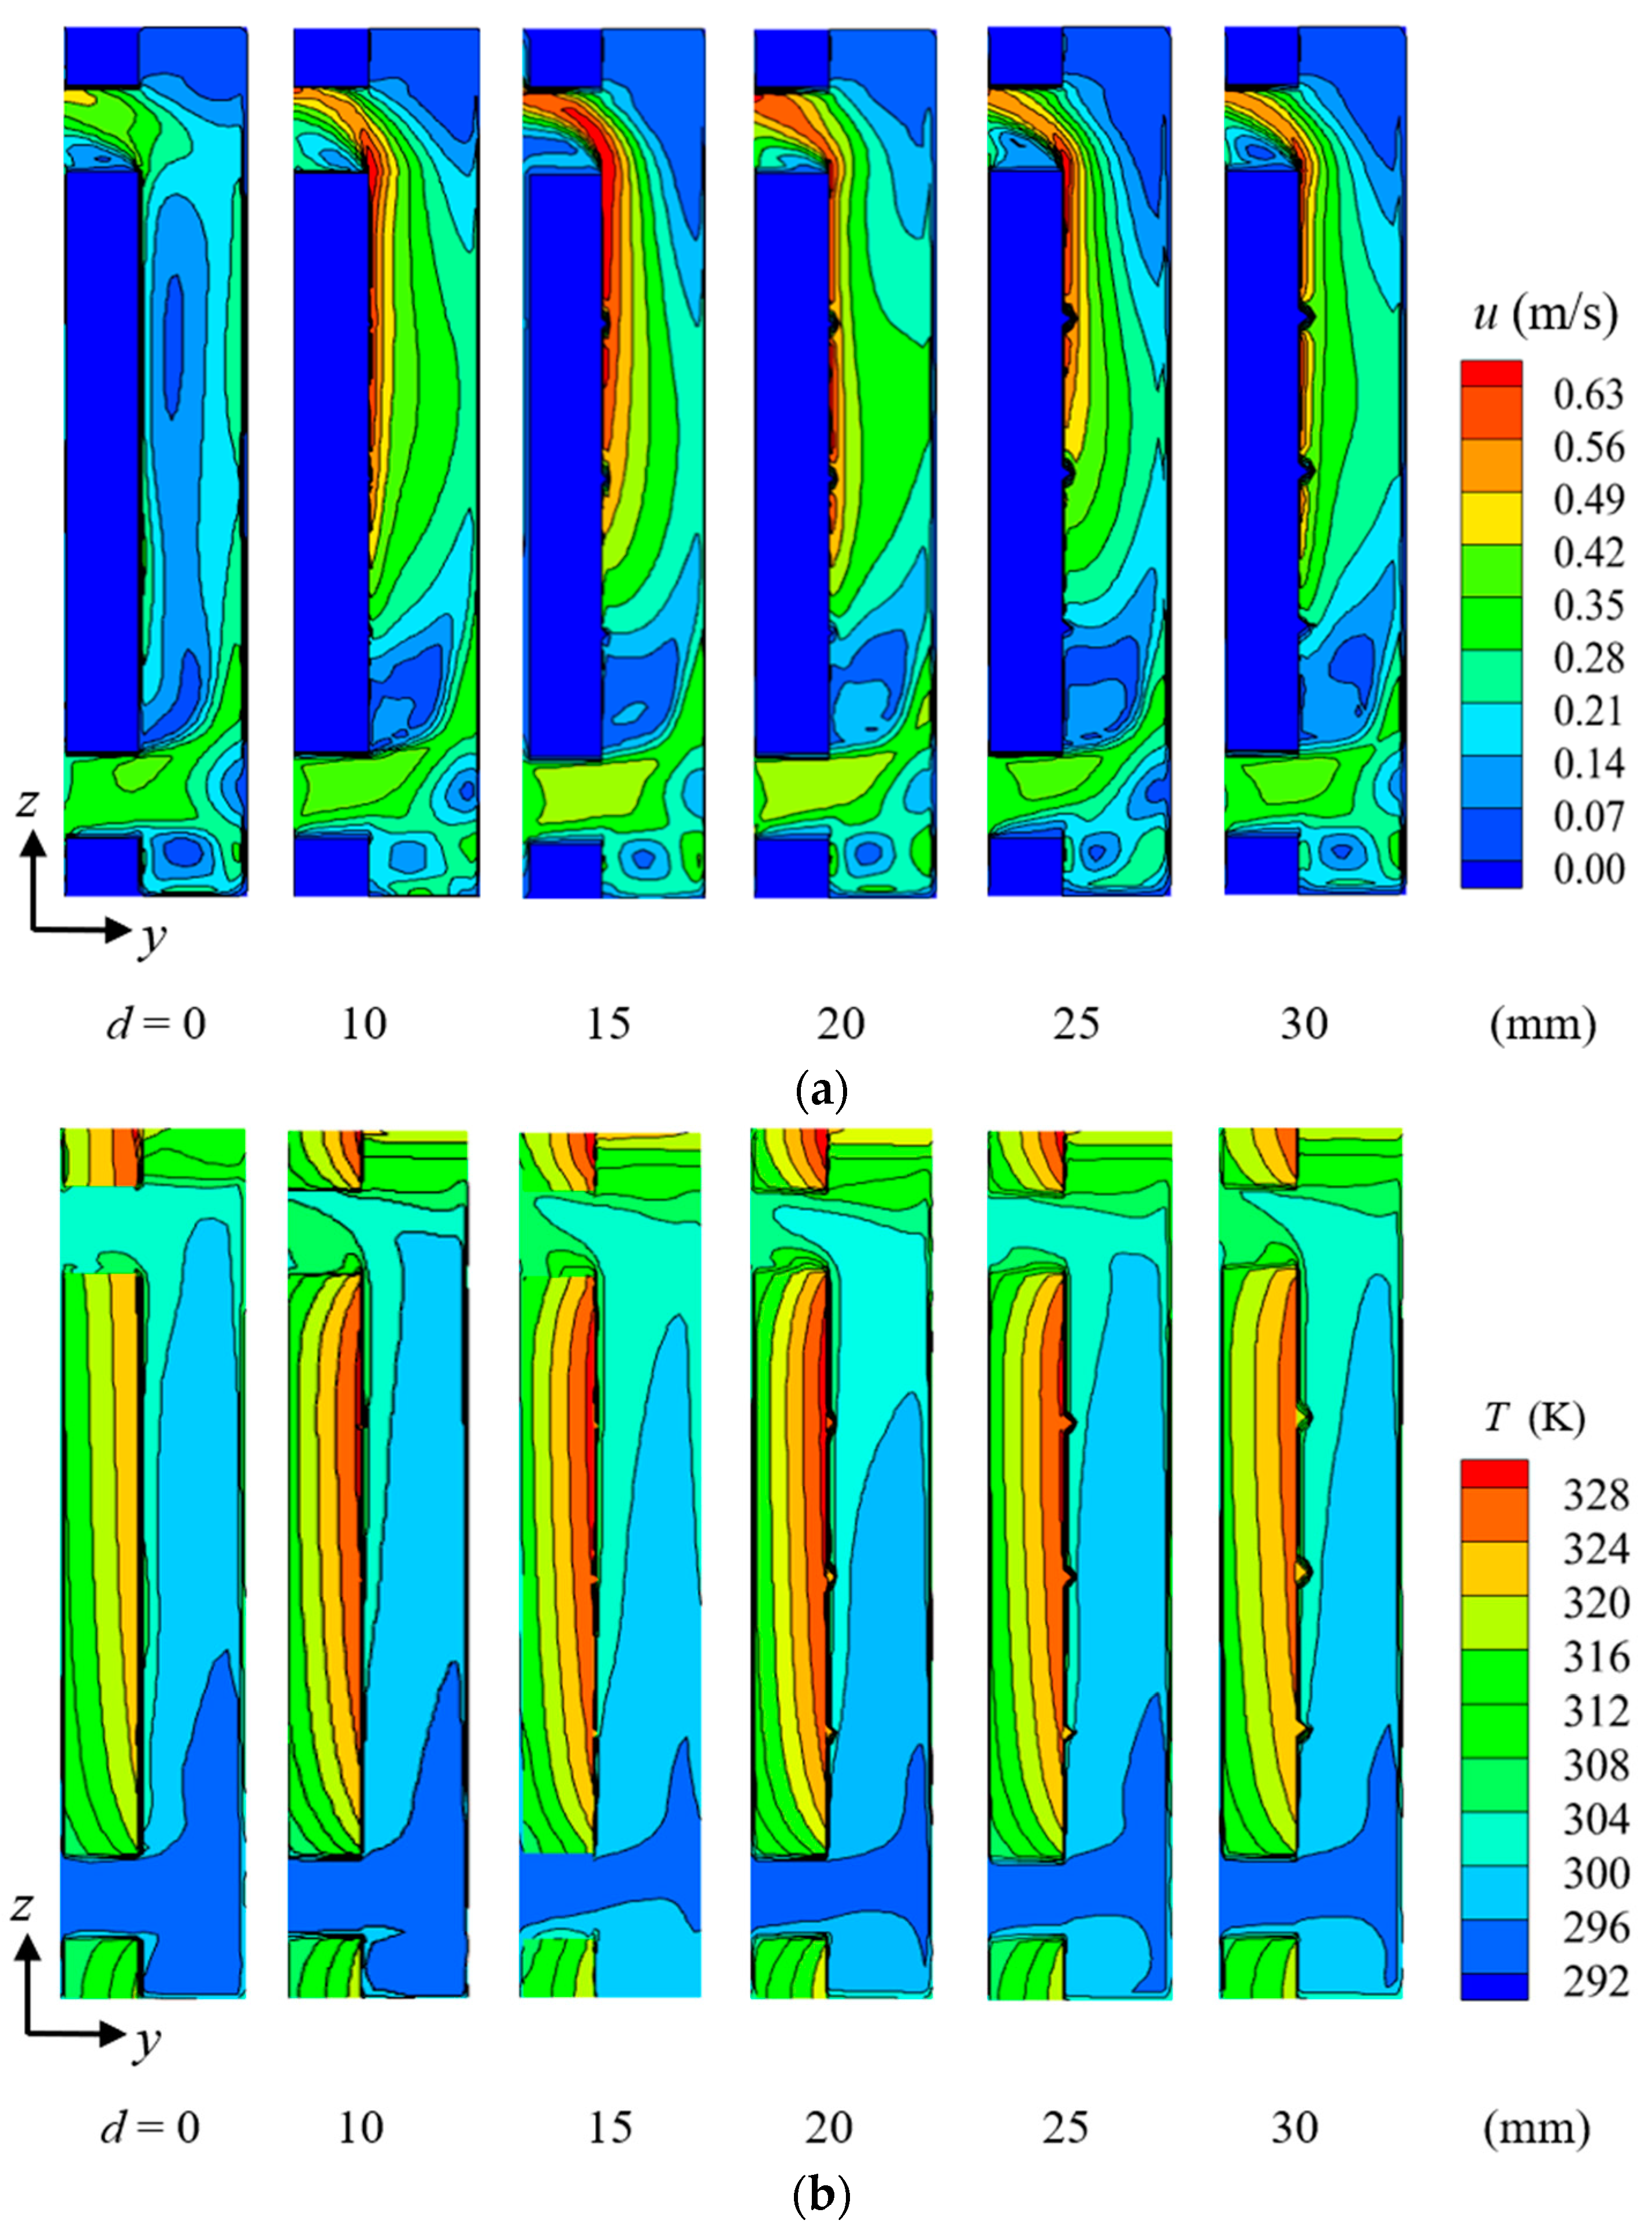
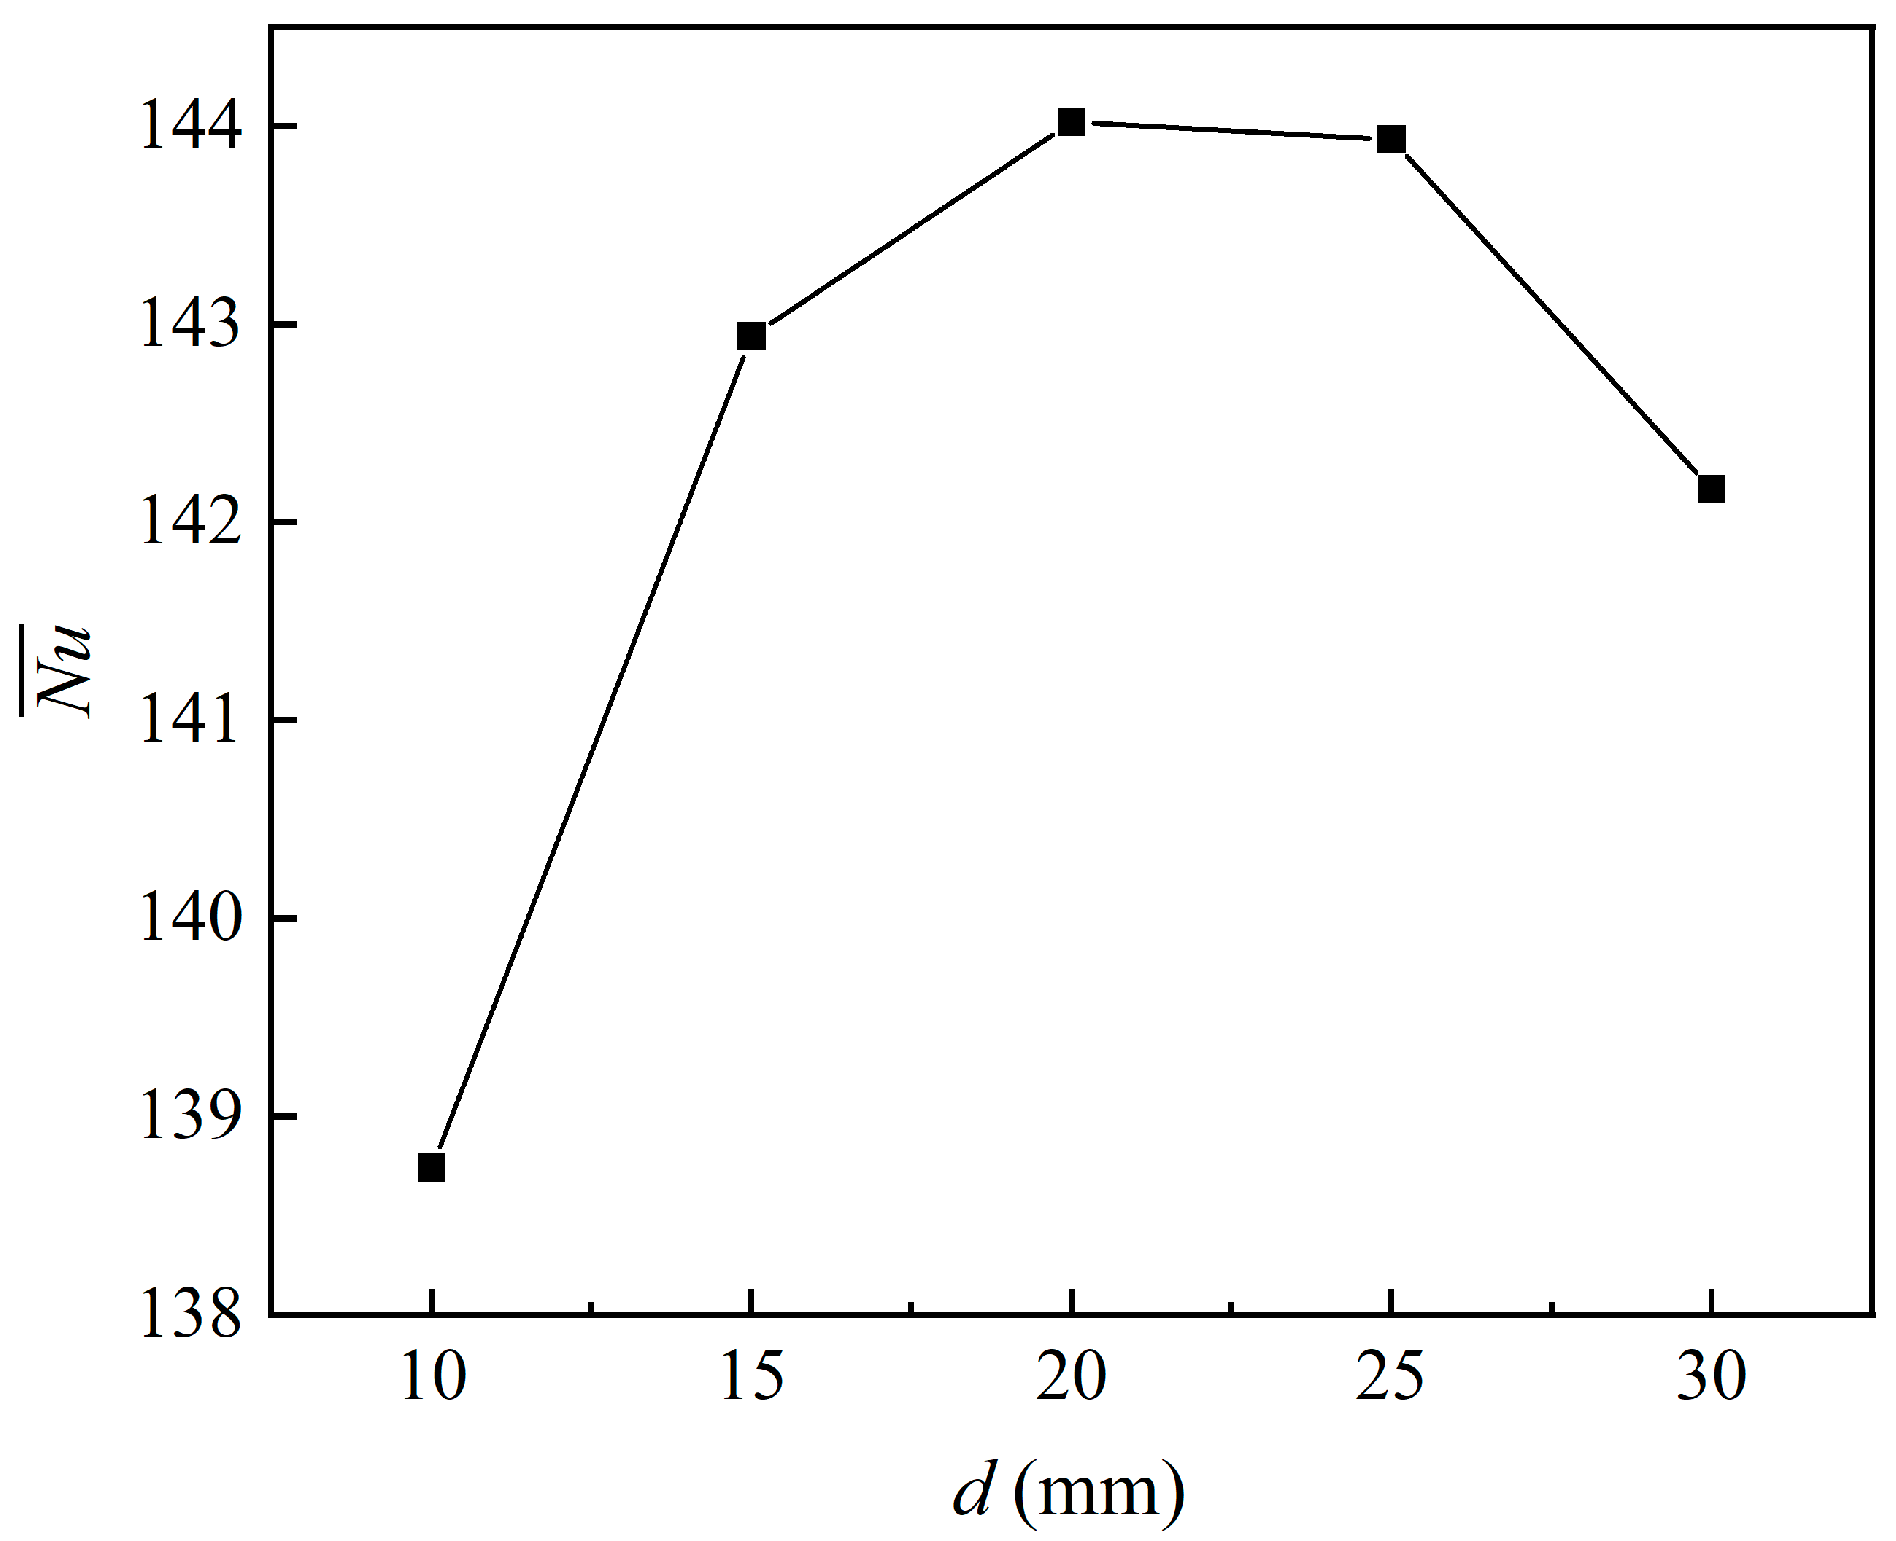
4.1.1. The Height of the Fin

Firstly, the fins with three rows and three columns (s1 = 0.250 m; s2 = 0.533 m) and five parameters of height (d), namely, 10 mm, 15 mm, 20 mm, 25 mm, and 30 mm, were added to the heat absorption surface, and the influence of fin height on the heat transfer performance of the heat absorption surface was researched. Figure 5 displays the velocity and temperature contours for fins with varying heights.
Figure 6a reveals that compared with the finless TW, the presence of fins on the HAS had a certain influence on the velocity of the upper vent. The presence of fins changed the original flow channel of air, increased the pressure drop in the channel, increased the airflow velocity, and increased the low-speed location of the upper vent. The increase in fins will also bring some resistance. When the fin height is higher, the resistance is greater. As the resistance increases, the airflow rate slows down.
As shown in Figure 6b, compared with the finless TW, the presence of fins affects the airflow in the original state. When the fin height is low, the disturbed air alters its state, enhancing heat transfer capacity with respect to the HAS and consequently leading to an increase in the air temperature inside the channel. As the resistance caused by the addition of fins rises with the height of the fins, it impedes the airflow to a greater extent, leading to a decrease in heat exchange capacity. Additionally, the presence of low-speed zones at the vent and the generated vortex further hinders heat exchange, resulting in a reduction in temperature at the upper vent.
Figure 6a,b demonstrate that compared with the finless TW, the air velocity and temperature in the channel increase substantially after the fins are added to the HAS. This is because the airflow in the channel is disturbed by the fins, the boundary layer of the HAS is destroyed, and the vortex is generated on the upper part of the fins, which enhances the heat transfer efficiency between the HAS and the air. Nevertheless, the change in heat transfer efficiency rises first and then reduces when the fin height rises.
The results indicate that distinct HAS N u ¯ values are obtained by adding fins with different heights, as shown in Figure 7. The HAS N u ¯ increases first and then declines. As the height of the fin is 20 mm, it reaches the maximum, which is 144.02. Compared with the HAS N u ¯ of the finless Trombe wall, it is 141.43, corresponding to an increase by 2.59.

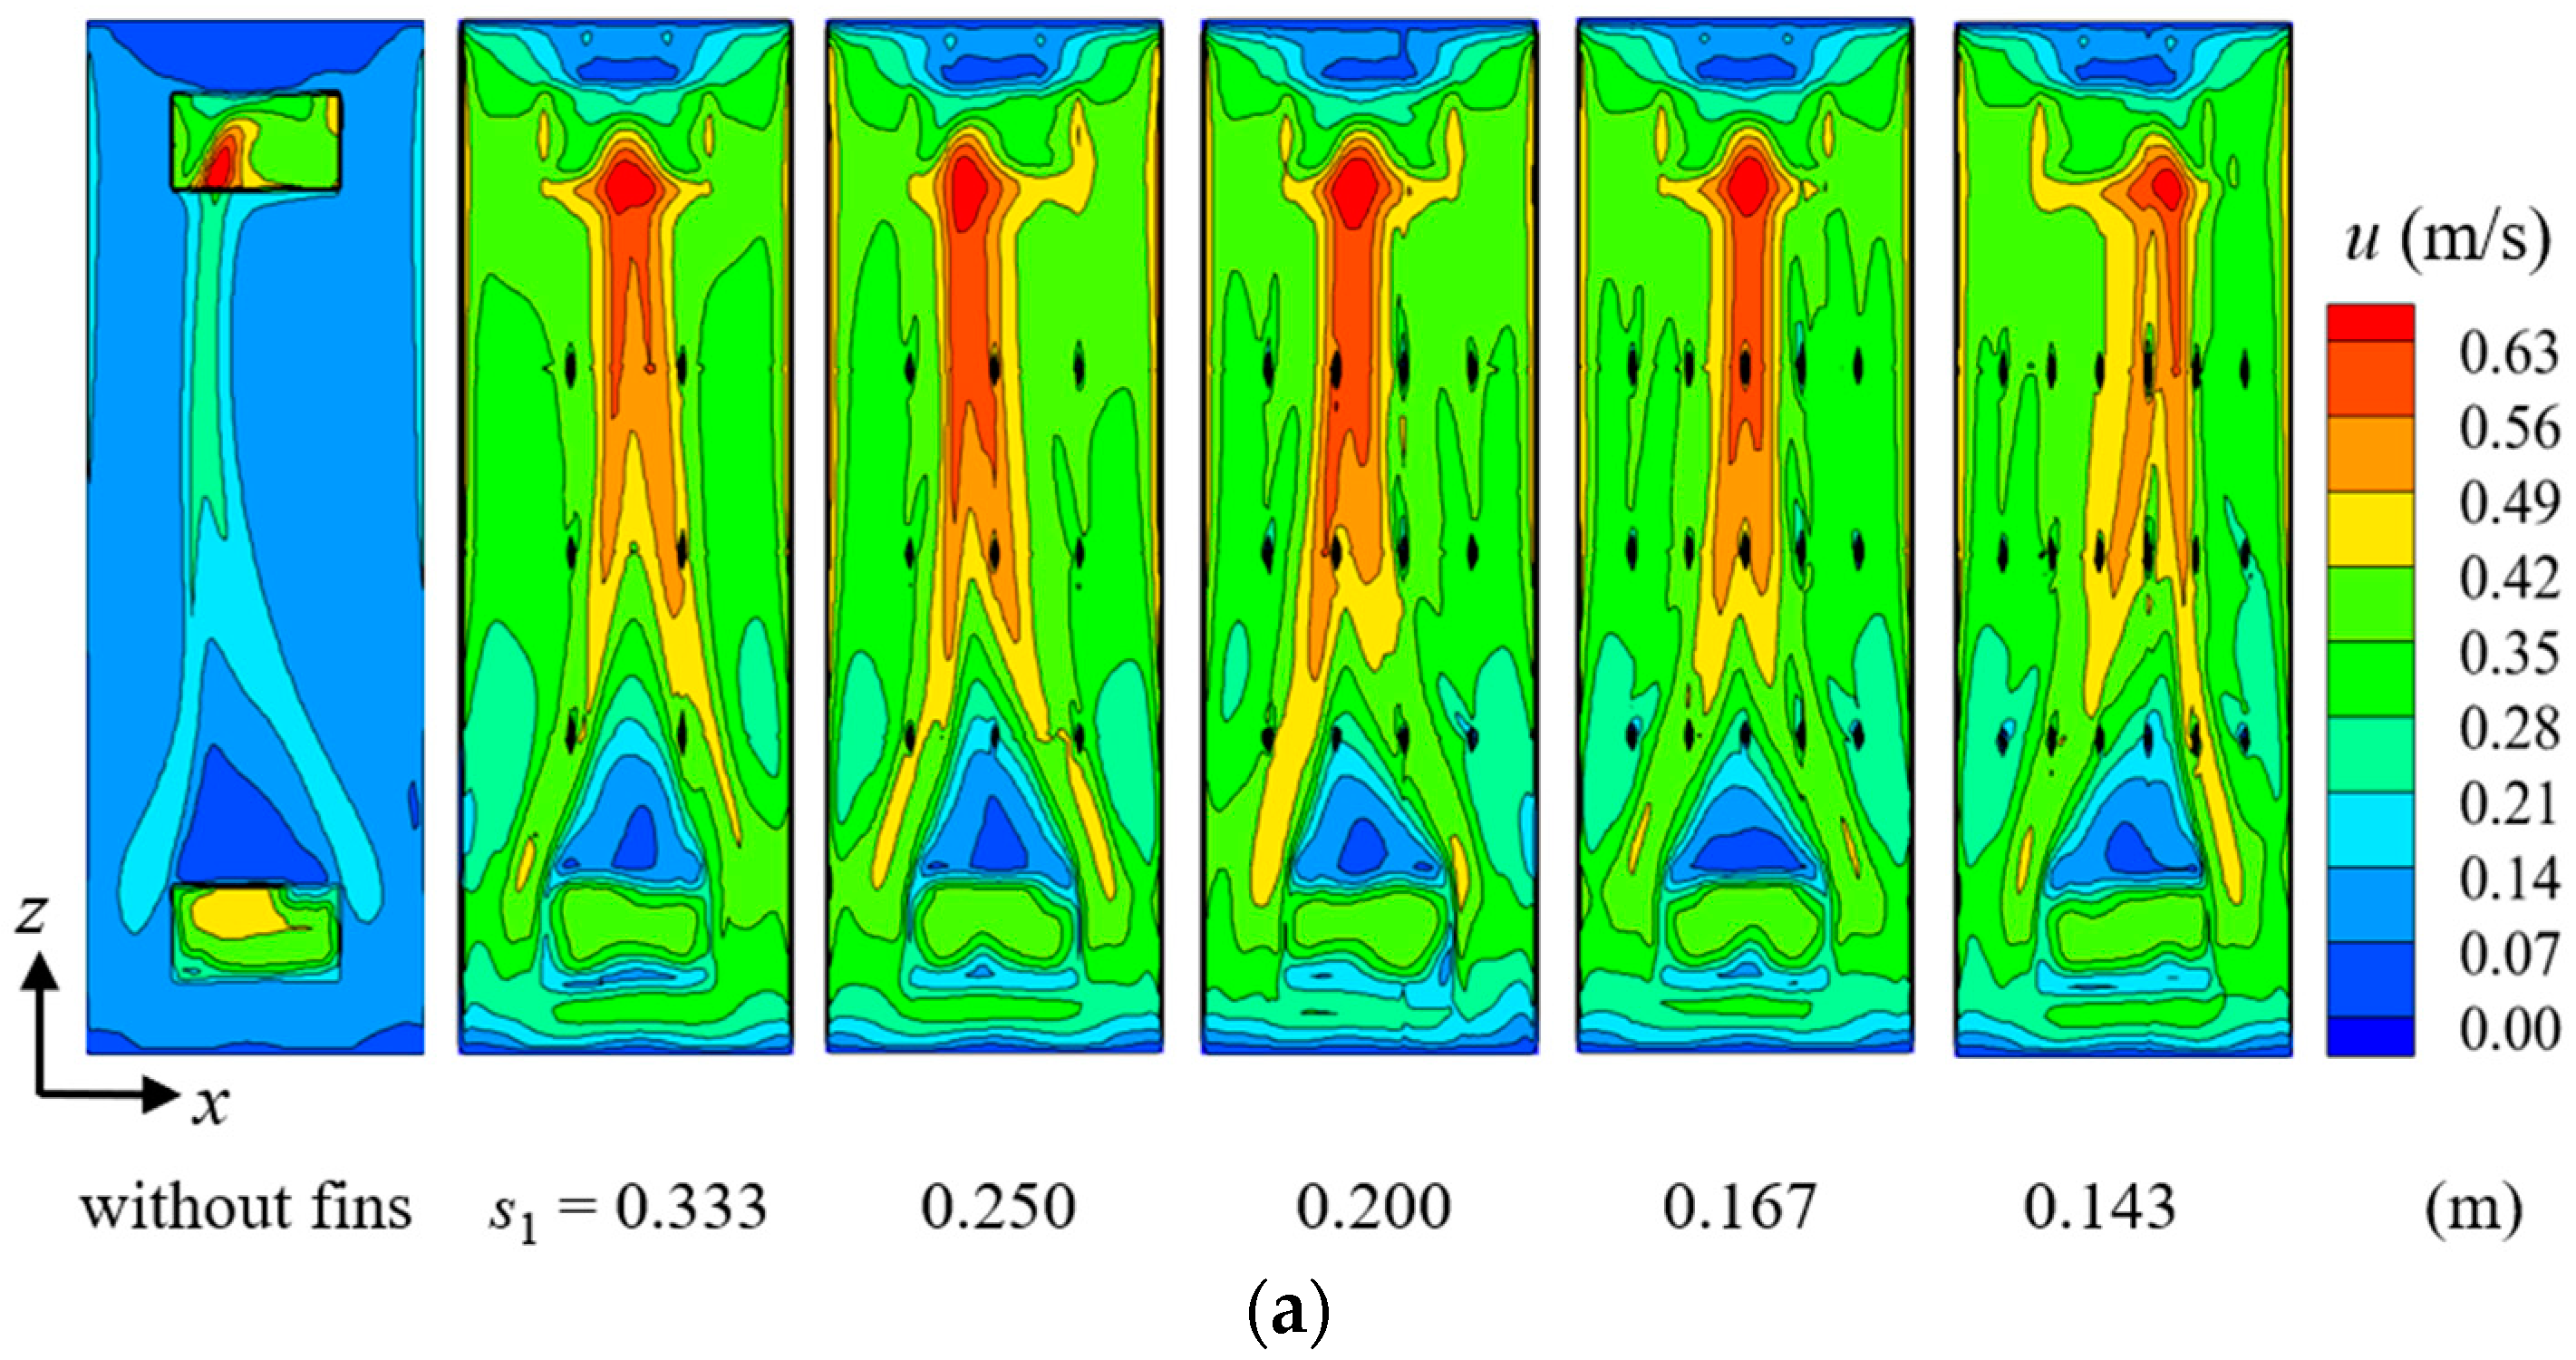
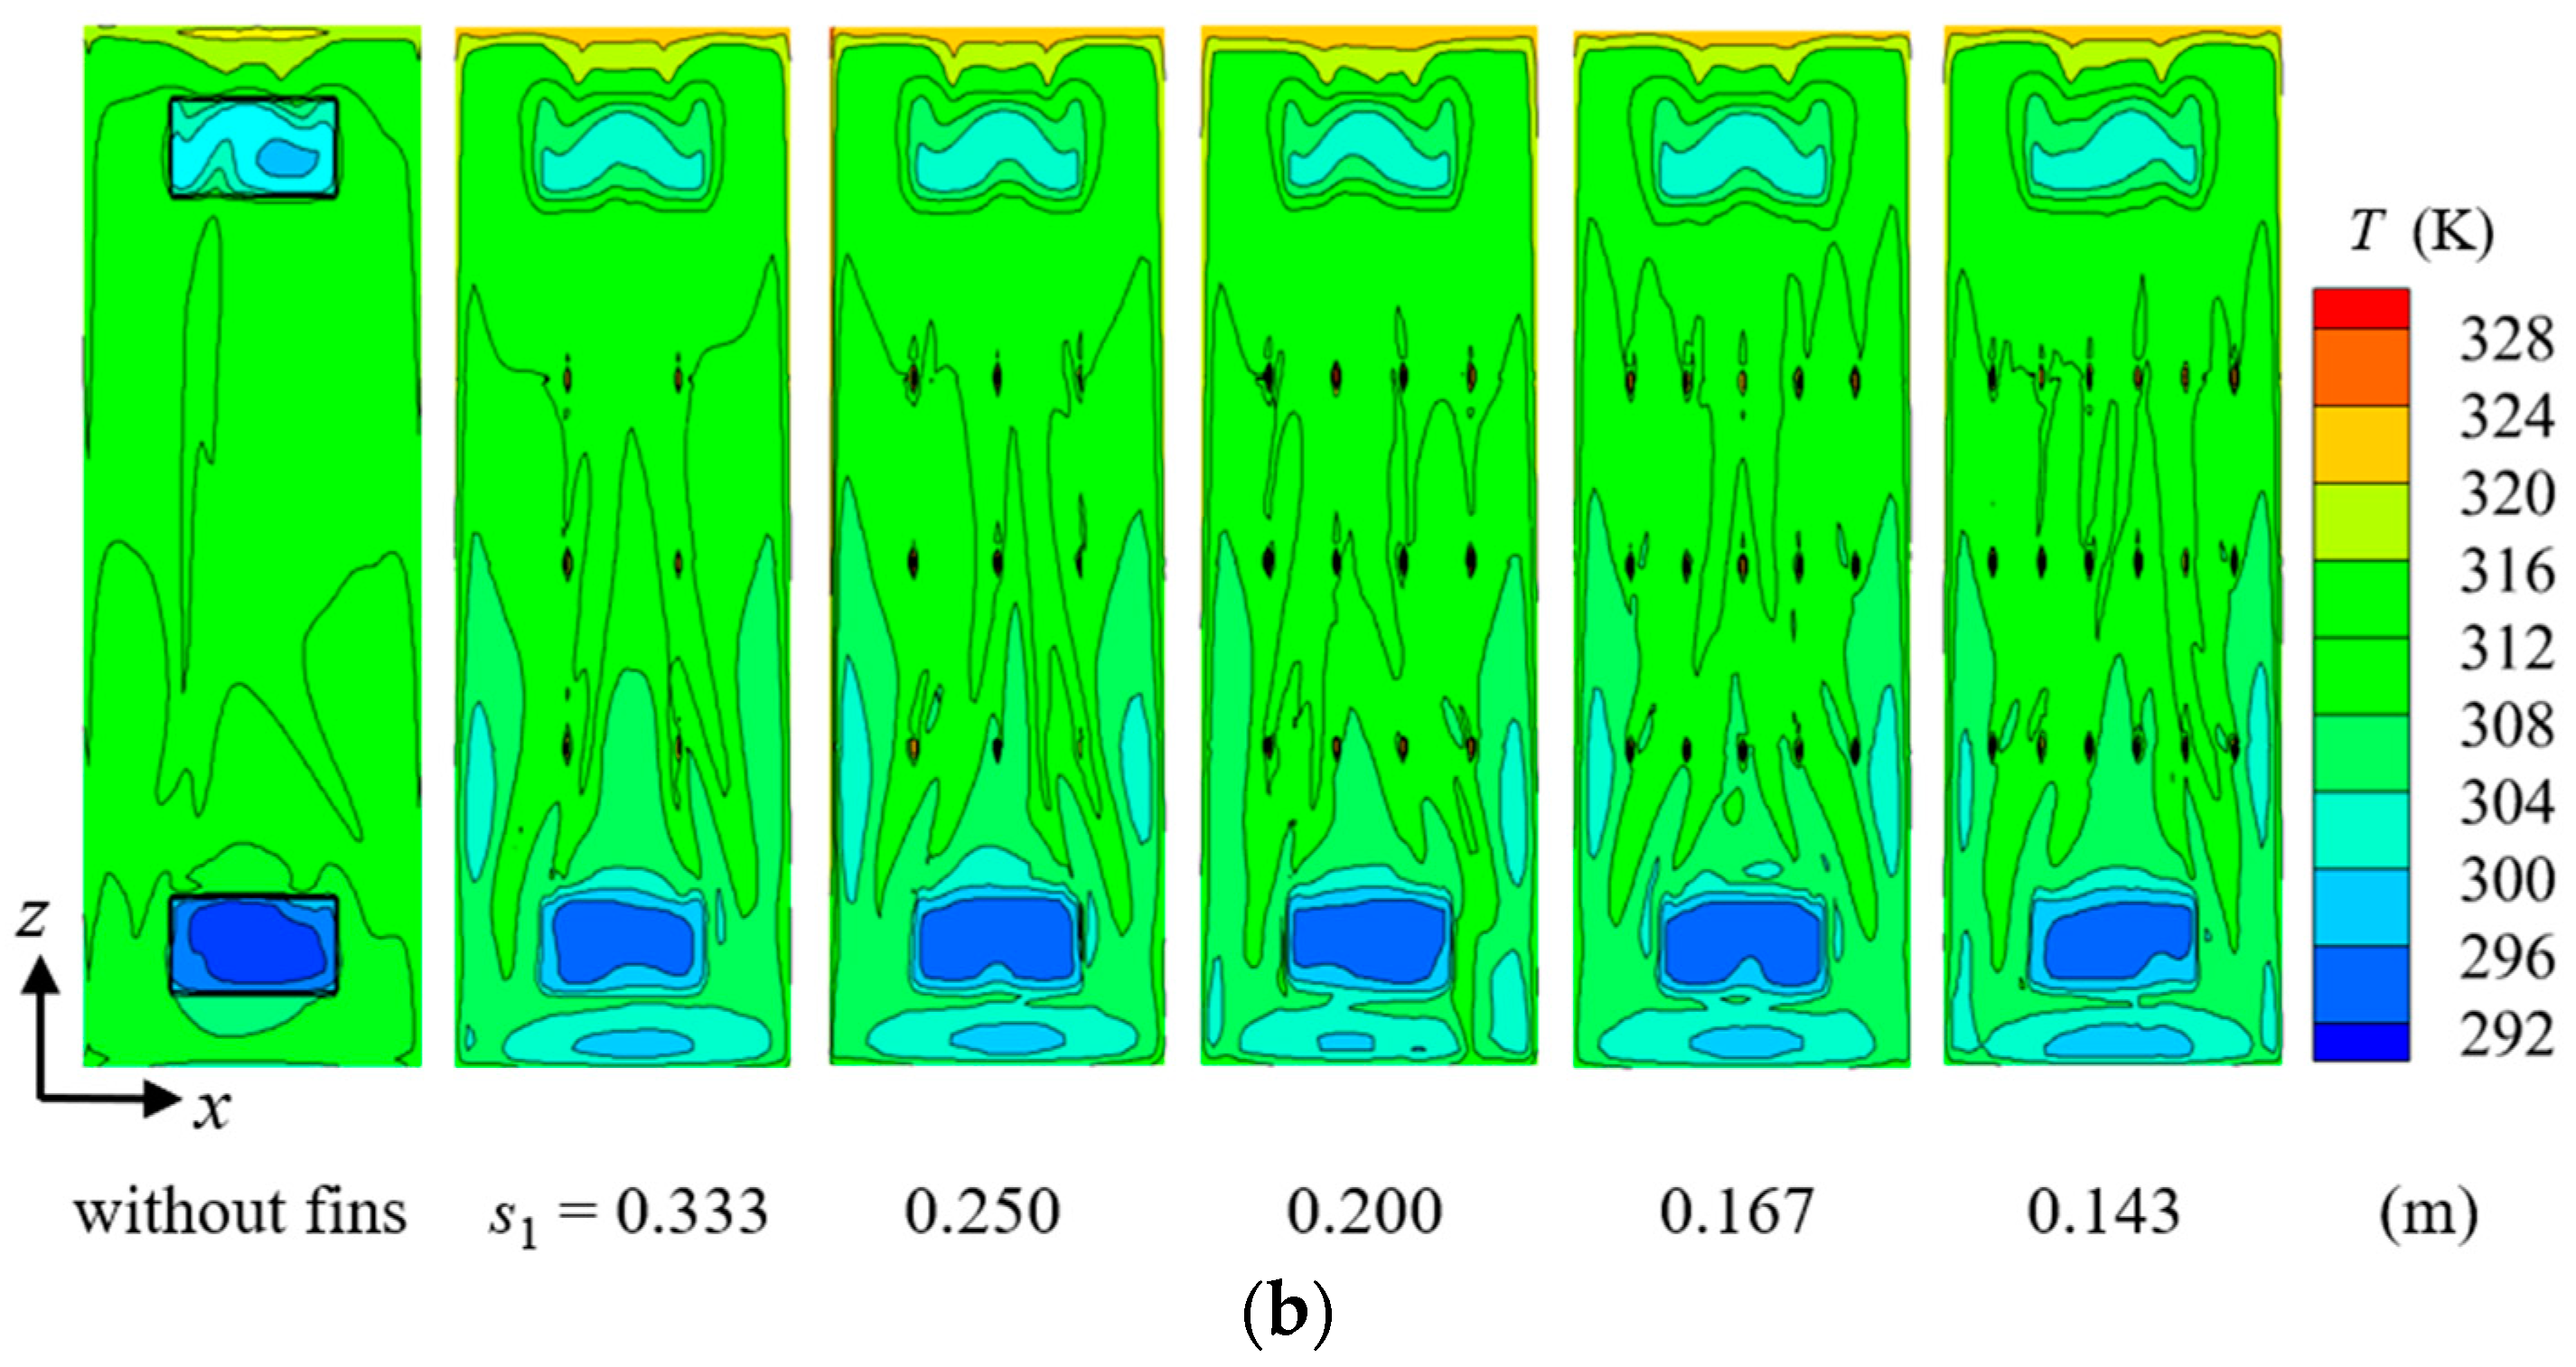
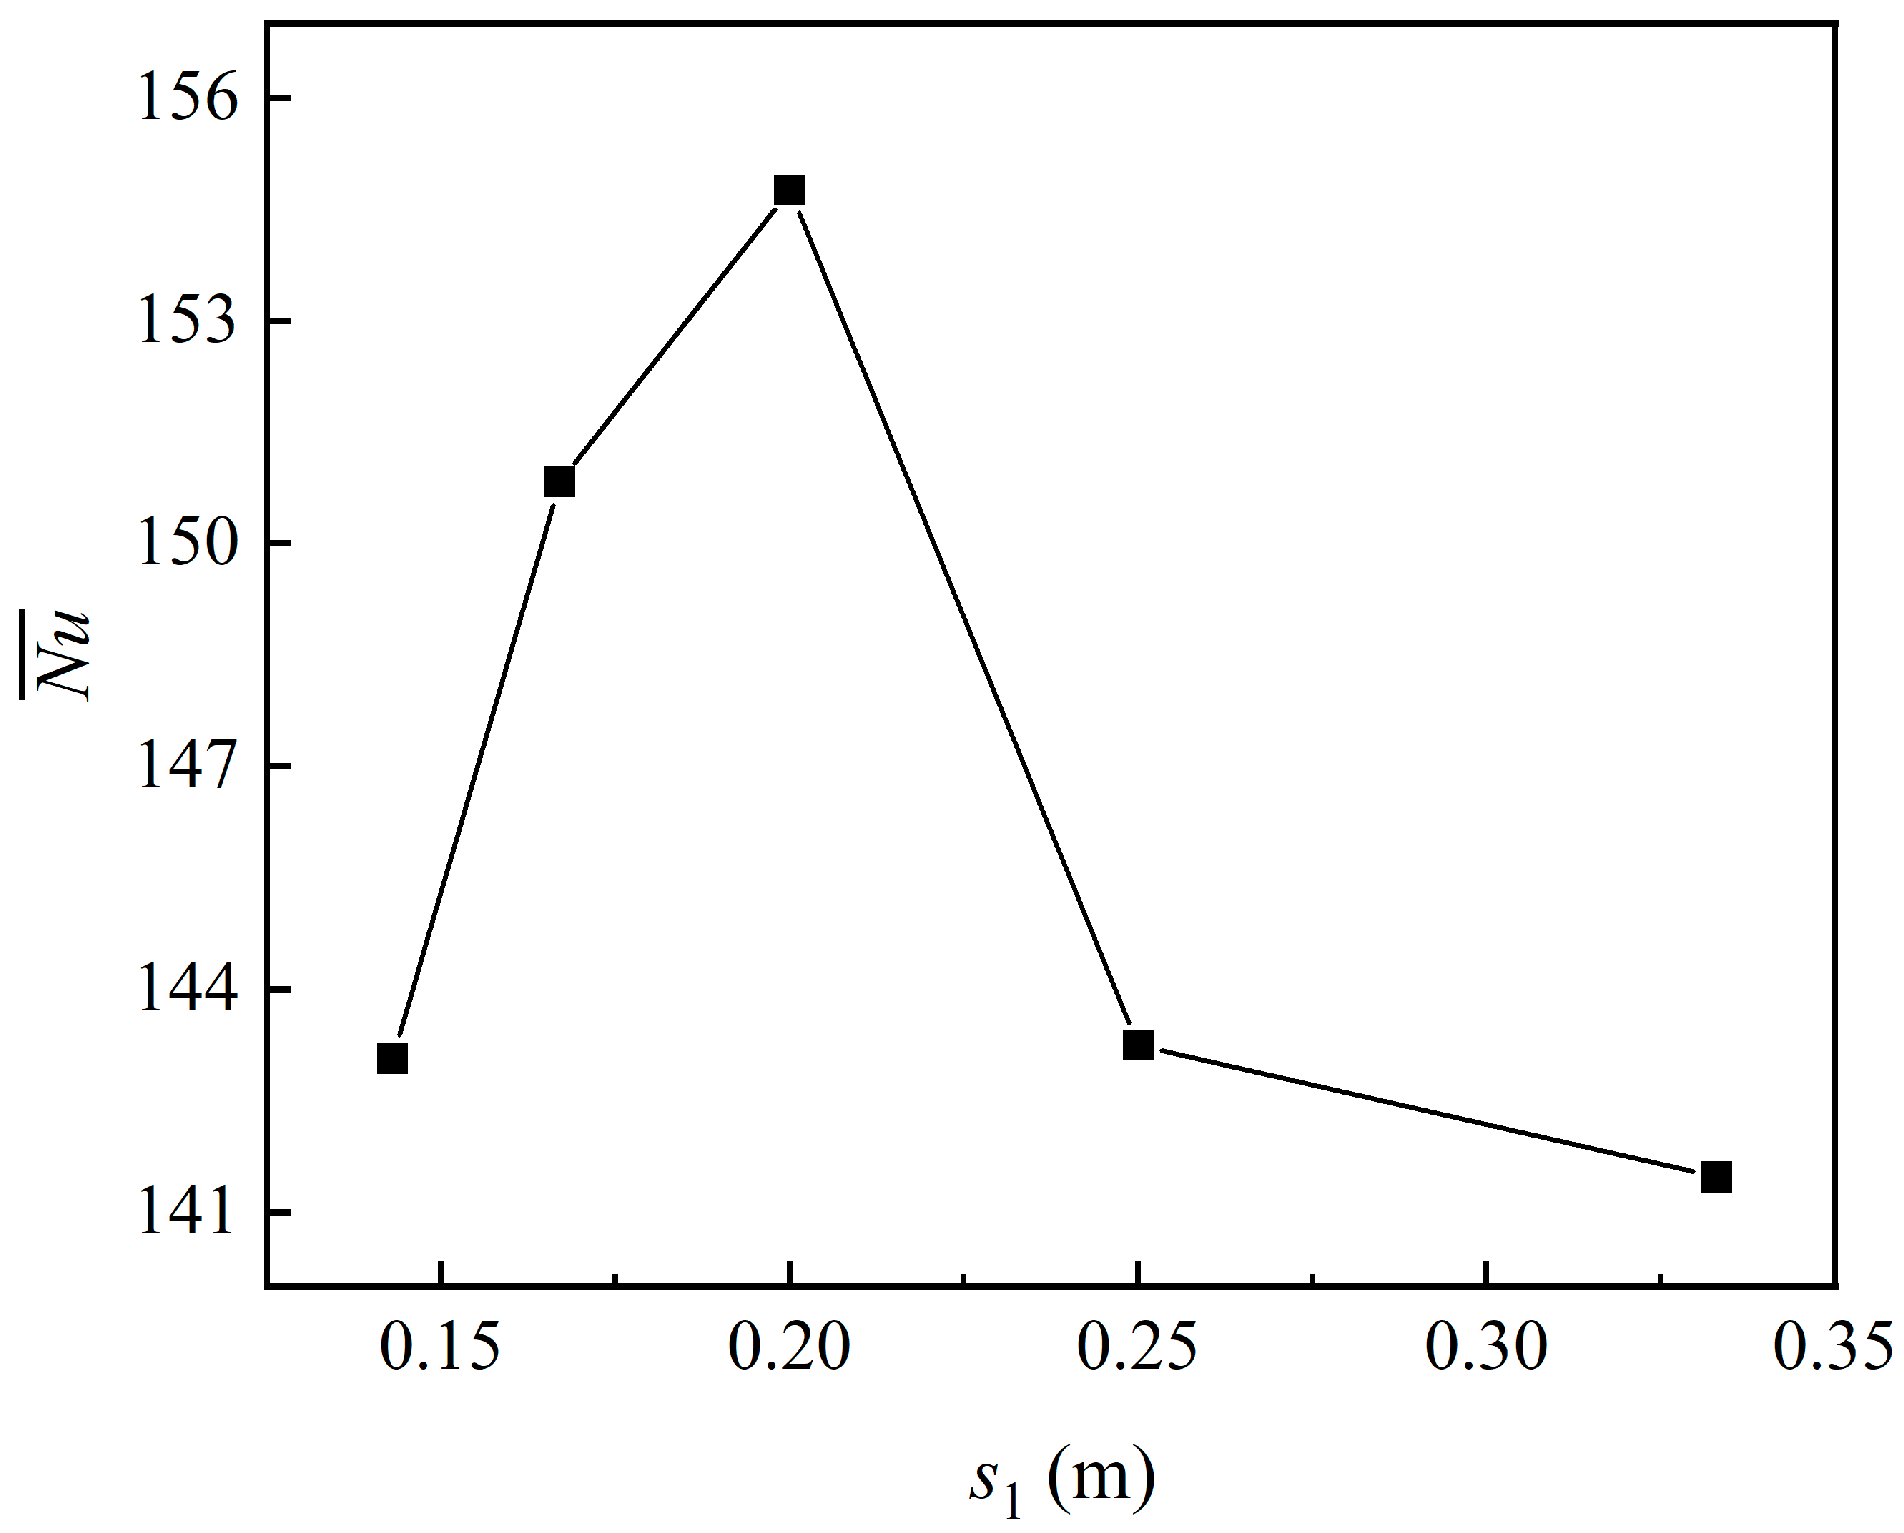
4.1.2. Fin Transverse Spacing

This section explores the influence of fin transverse spacing (s1 = 0.333, 0.250, 0.200, 0.167, and 0.143 m) on the thermal performance of the HAS. Figure 8 and Figure 9 show a local velocity contour cloud diagram, a temperature cloud diagram, and the change relationship diagram of the HAS N u ¯ when the fins are arranged on the HAS with different lateral spacing.
Figure 8a shows that the airflow velocity changes drastically in the whole channel after the arrangement of different transverse spacing fins, and a low-speed region is formed near the lower fins on both sides. Due to the lower pressure between the fins, the airflow speed through the fins increases, causing the speed to become maximal when it reaches the upper vent. As the lateral spacing decreases, the number of fins increases, and the resistance caused by the fins increases, resulting in slower air flow. Compared with the HAS without fins, the velocity field distribution of the HAS with fins tends to develop uniformly. This is because under the influence of fin turbulence, the air velocity increases, and the area of the low-speed location on the upper section of the lower vent changes with the change in fin spacing, reaching a minimum at s1 = 0.200 m.
Figure 8b demonstrates that as the transverse spacing of the fins decreases, the temperature of the HAS increases first and then decreases. Compared with the finless TW, the temperature of the upper and lower vents increases after adding fins with different transverse spacing, and the temperature of the whole air channel changes obviously. As the transverse spacing decreases and the number of fins increases, the low-temperature location created by the low-speed area gradually decreases. The addition of fins increases air velocity, accelerates the exchange frequency between the channel air and the indoor low-temperature air, enhances heat transfer capacity, and raises the temperature of the upper and lower vents, but the temperature gradient of the air channel decreases, and the overall temperature distribution tends to be uniform.
Accounting for the information in Figure 8a,b, compared with the finless Trombe wall, the velocity field and temperature field of the fin-type TW tend to develop uniformly, and the development is sufficient until s1 = 0.200 m and the heat exchange efficiency reaches the maximum level. Upon continuing to increase the number of fins, a large temperature retention zone forms at the lower part of the lower vent, resulting in a gradual decrease in the heat transfer effect.
Figure 9 indicates that as the transverse spacing of the fins declines, the heat absorption surface N u ¯ increases first and then decreases, reaching a maximum of 154.75 when the transverse spacing is 0.200 m. Before the lateral spacing gradually decreases to 0.200 m, due to the spoiler effect of the fins, the airflow rate increases, so the N u ¯ of the HAS gradually increases. When the transverse spacing is less than 0.200 m, the airflow is hindered due to the increase in the number of fins, and a partial temperature retention zone is formed. The HAS’s heat transfer capacity decreases, and the N u ¯ gradually decreases.

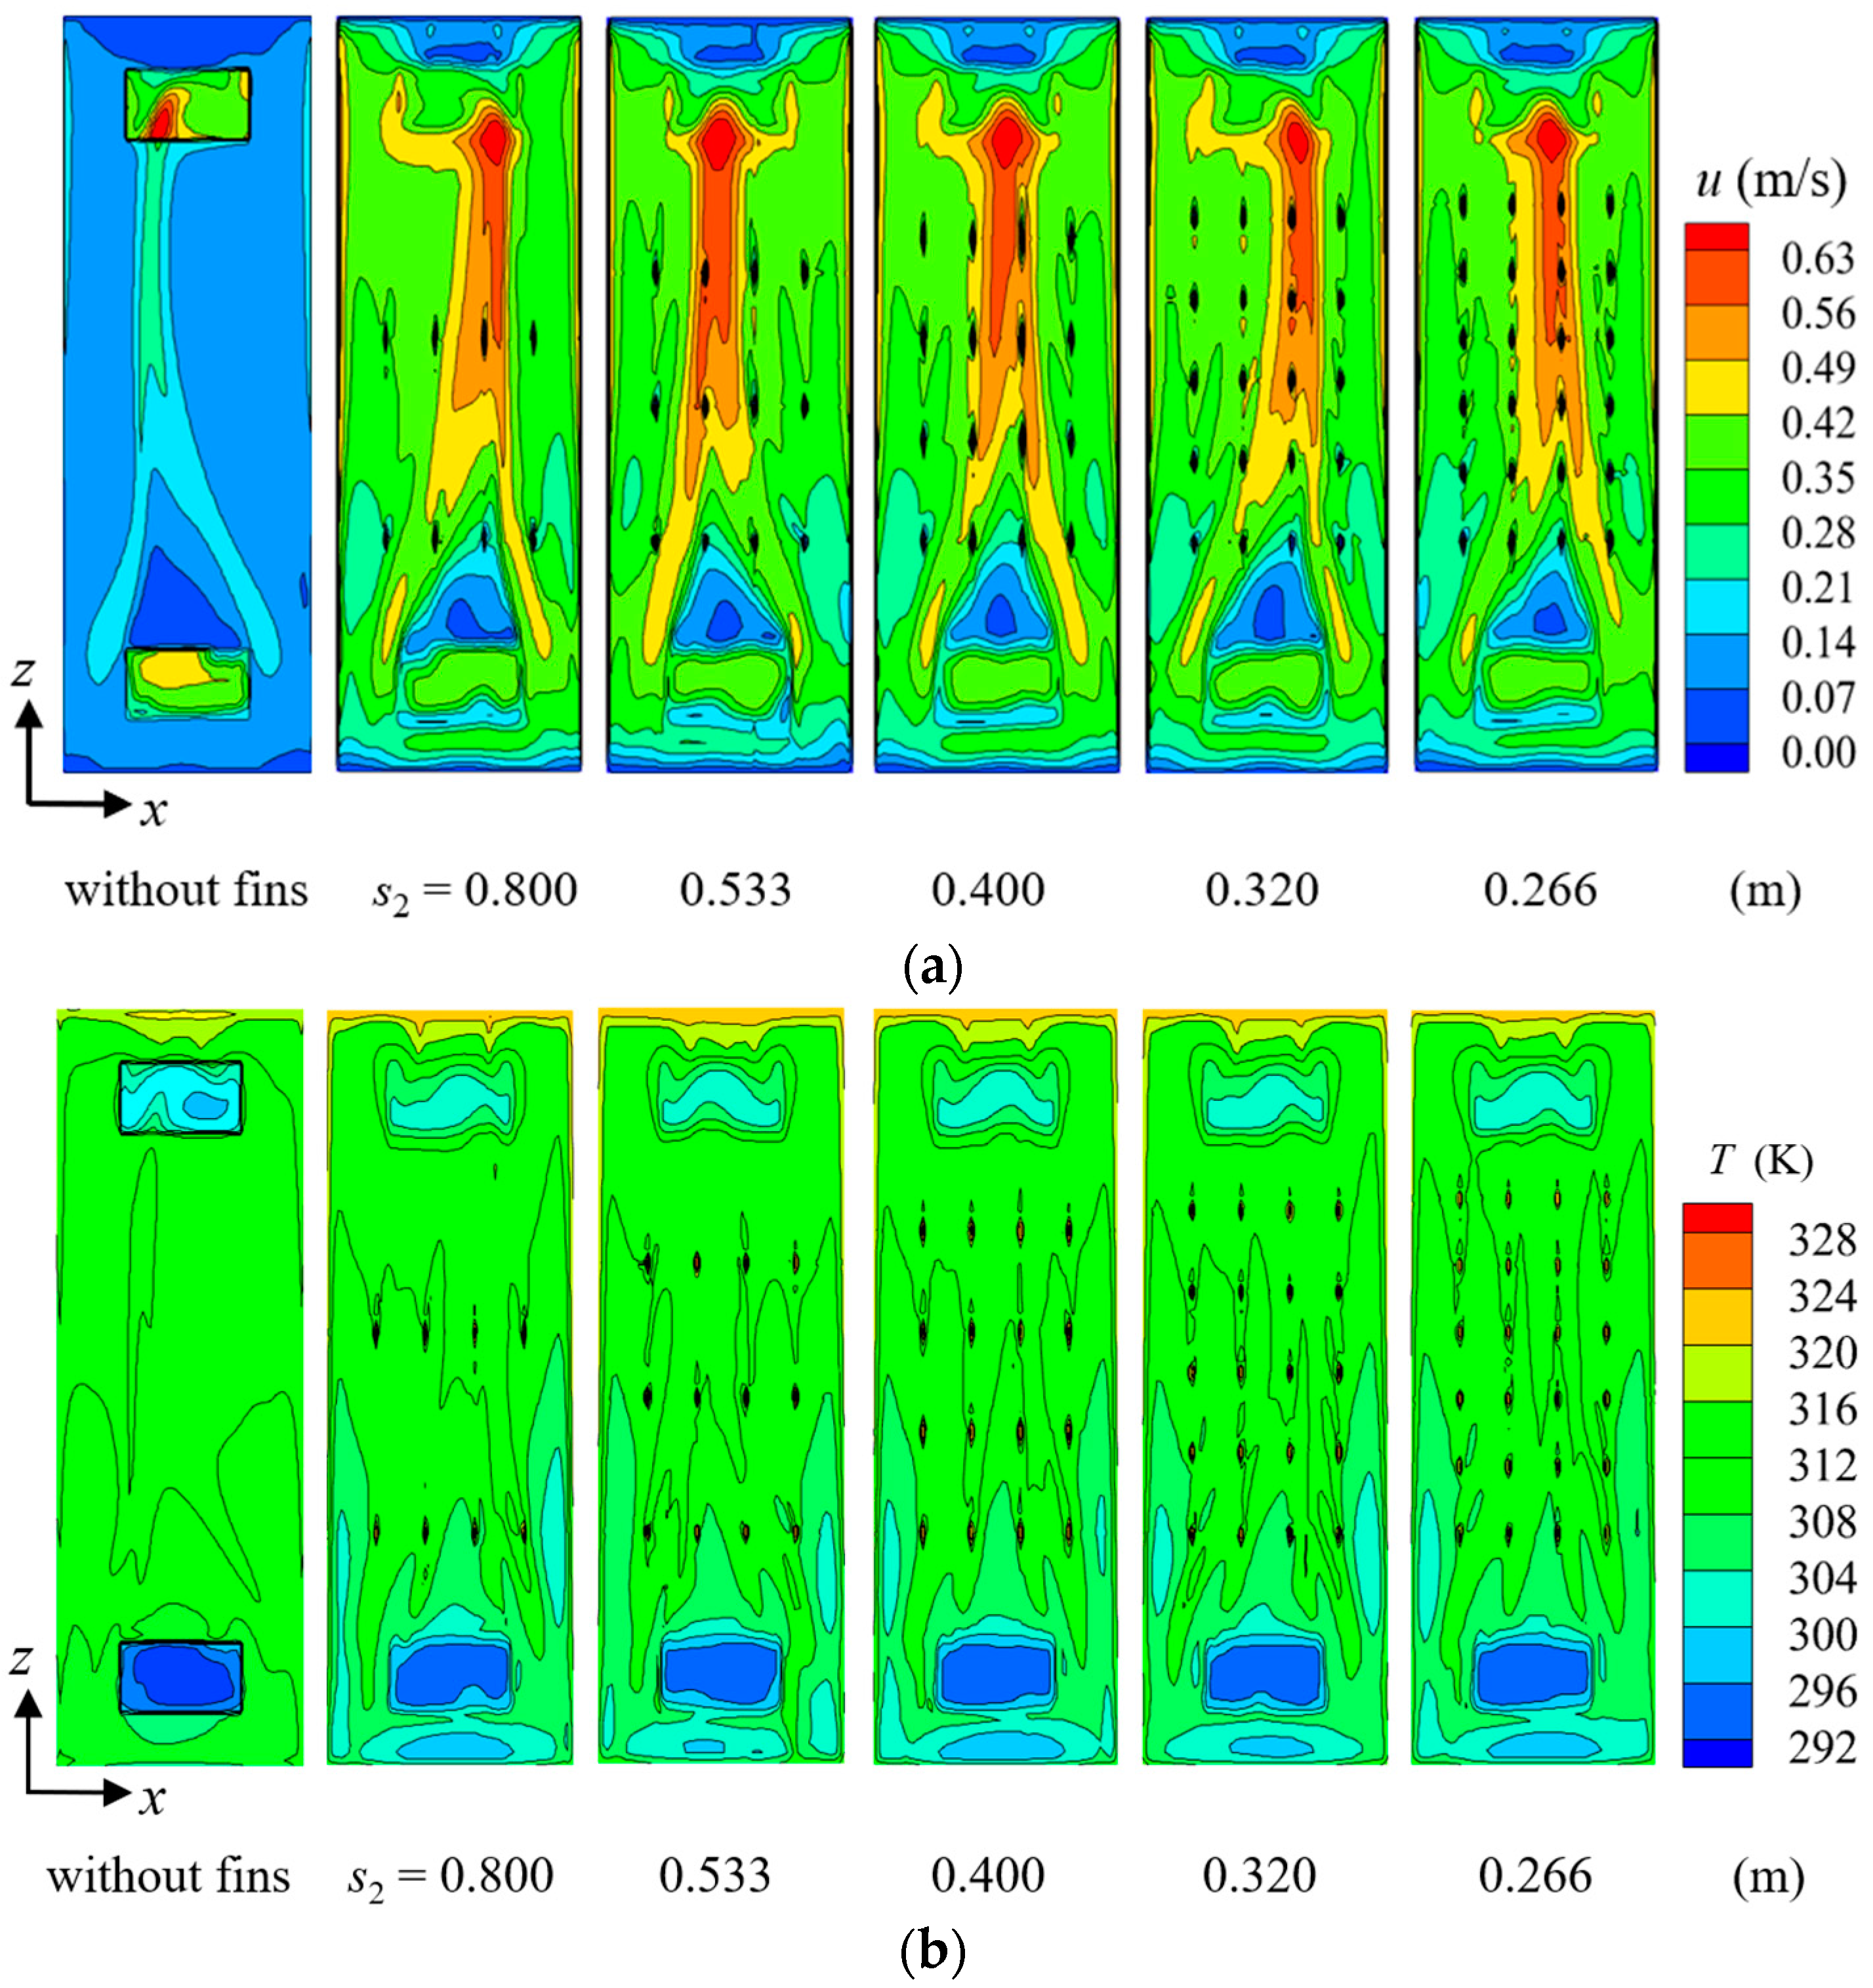
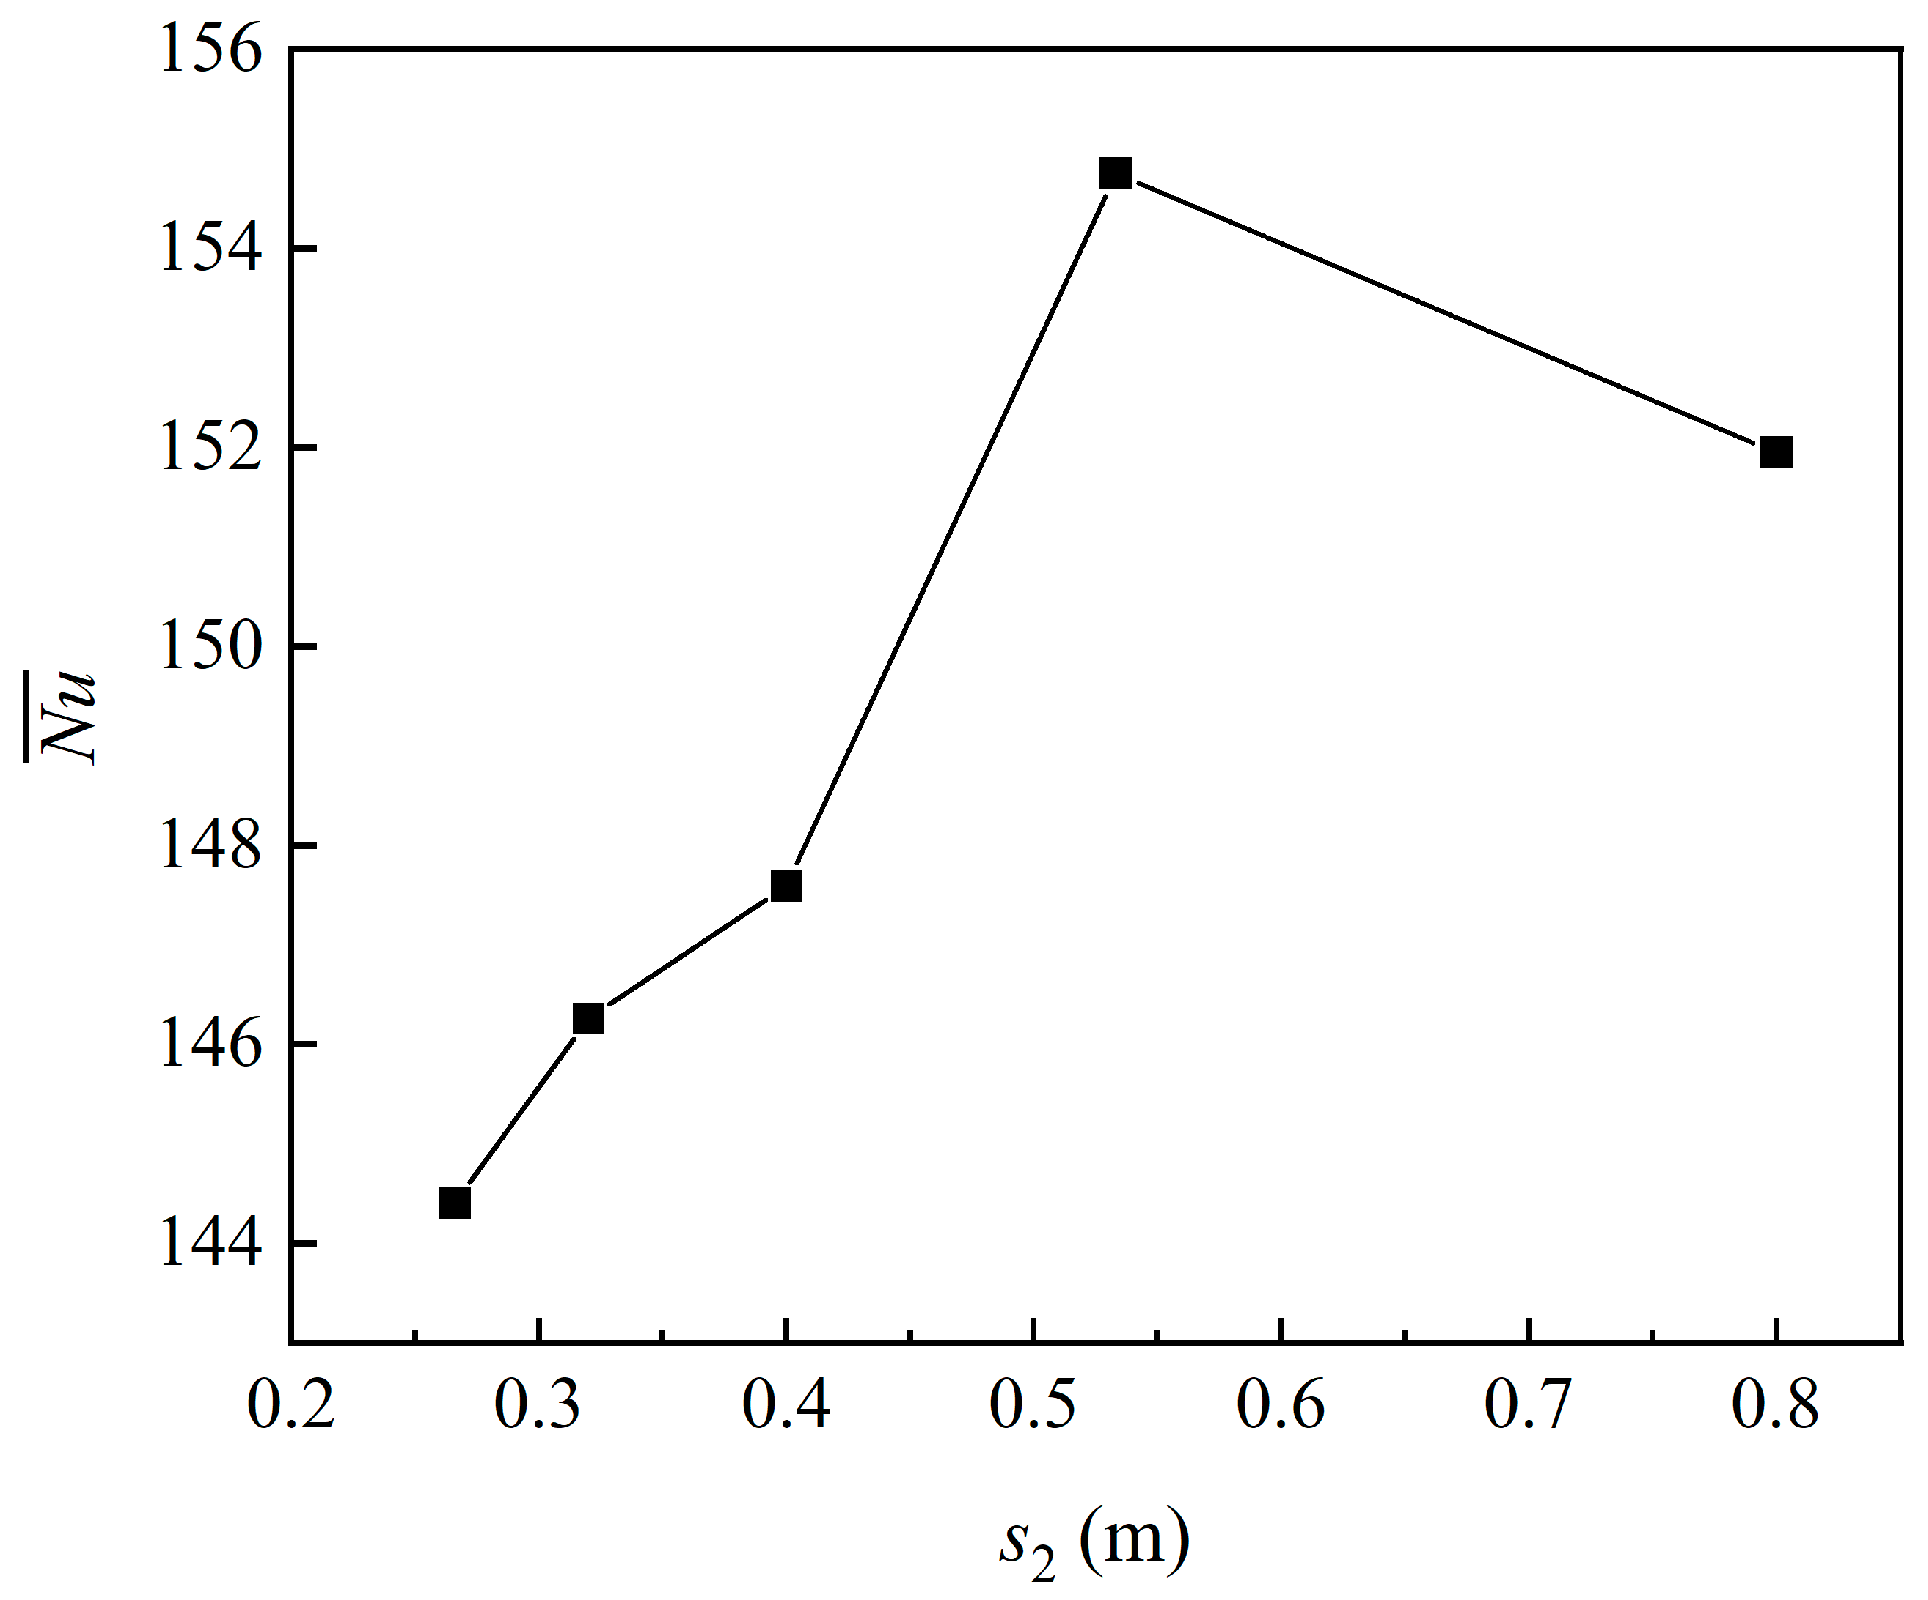
4.1.3. Longitudinal Spacing of Fins

Based on the optimized fin height and transverse spacing of d = 20 mm and s1 = 0.200 m, the effects of fin longitudinal spacing (s2 = 0.800, 0.533, 0.400, 0.320, and 0.266 m) on the HAS’s heat transfer capacity were further researched. Figure 10a,b are the velocity and temperature contours when the fins are arranged on the HAS with different longitudinal spacings.
Figure 10a,b show that the longitudinal vortex forms easily after the arrangement of the fins, which causes great damage to the boundary layer and accelerates the change of fluid state. The air velocity and temperature initially increase and then decrease as the longitudinal spacing of the fins decreases and the number of fins rises. This is because the fins affect the pressure difference and produce resistance at the same time. As the number of fins rises, the resistance becomes greater, affecting the HAS’s heat transfer capacity. As the longitudinal spacing of the fins decreases, multiple vortices appear in the upper part of the lower vent near the boundary. The velocity of the airflow in the central region of the channel changes most significantly, and the heat transfer efficiency also increases to the maximum level. The gradient of velocity and temperature changes becomes smaller and tends to be uniform. When the longitudinal spacing is less than 0.533 m, the number of small vortices rises sharply with the increased number of fins, the development of velocity and temperature is affected, and the heat transfer efficiency begins to decrease gradually.
Figure 11 shows the change curve of the heat absorption surface N u ¯ as the fins are arranged with different longitudinal spacings. The diagram shows that as the fins’ longitudinal spacing increases, the heat absorption surface N u ¯ increases first and then decreases; when the longitudinal spacing is 0.533 m, it reaches a maximum of 154.75, which is 13.32 higher than that of the finless HAS N u ¯ (141.43). At this point, the optimal fin size height is 20 mm, and the lateral spacing and longitudinal spacing become 0.200 m and 0.533 m, respectively.

4.1.4. Fin Arrangement

The impact of fin arrangement on the heat transfer capacity of the TW was examined using the optimized fin size (d = 20 mm, s1 = 0.200 m, and s2 = 0.533 m) as the focal point. The findings are summarized in Table 3.
Table 3 indicates that when the fins are arranged in a line, the ventilation volume and the HAS N u ¯ of the upper vent are higher than those in the staggered arrangement, and the temperature of the upper vent does not change much. When the fins are arranged in a staggered arrangement, the resistance increases, the airflow is hindered, the airflow velocity is reduced, the ventilation volume of the upper vent is reduced, and the thermal performance of the HAS of the TW is less affected.

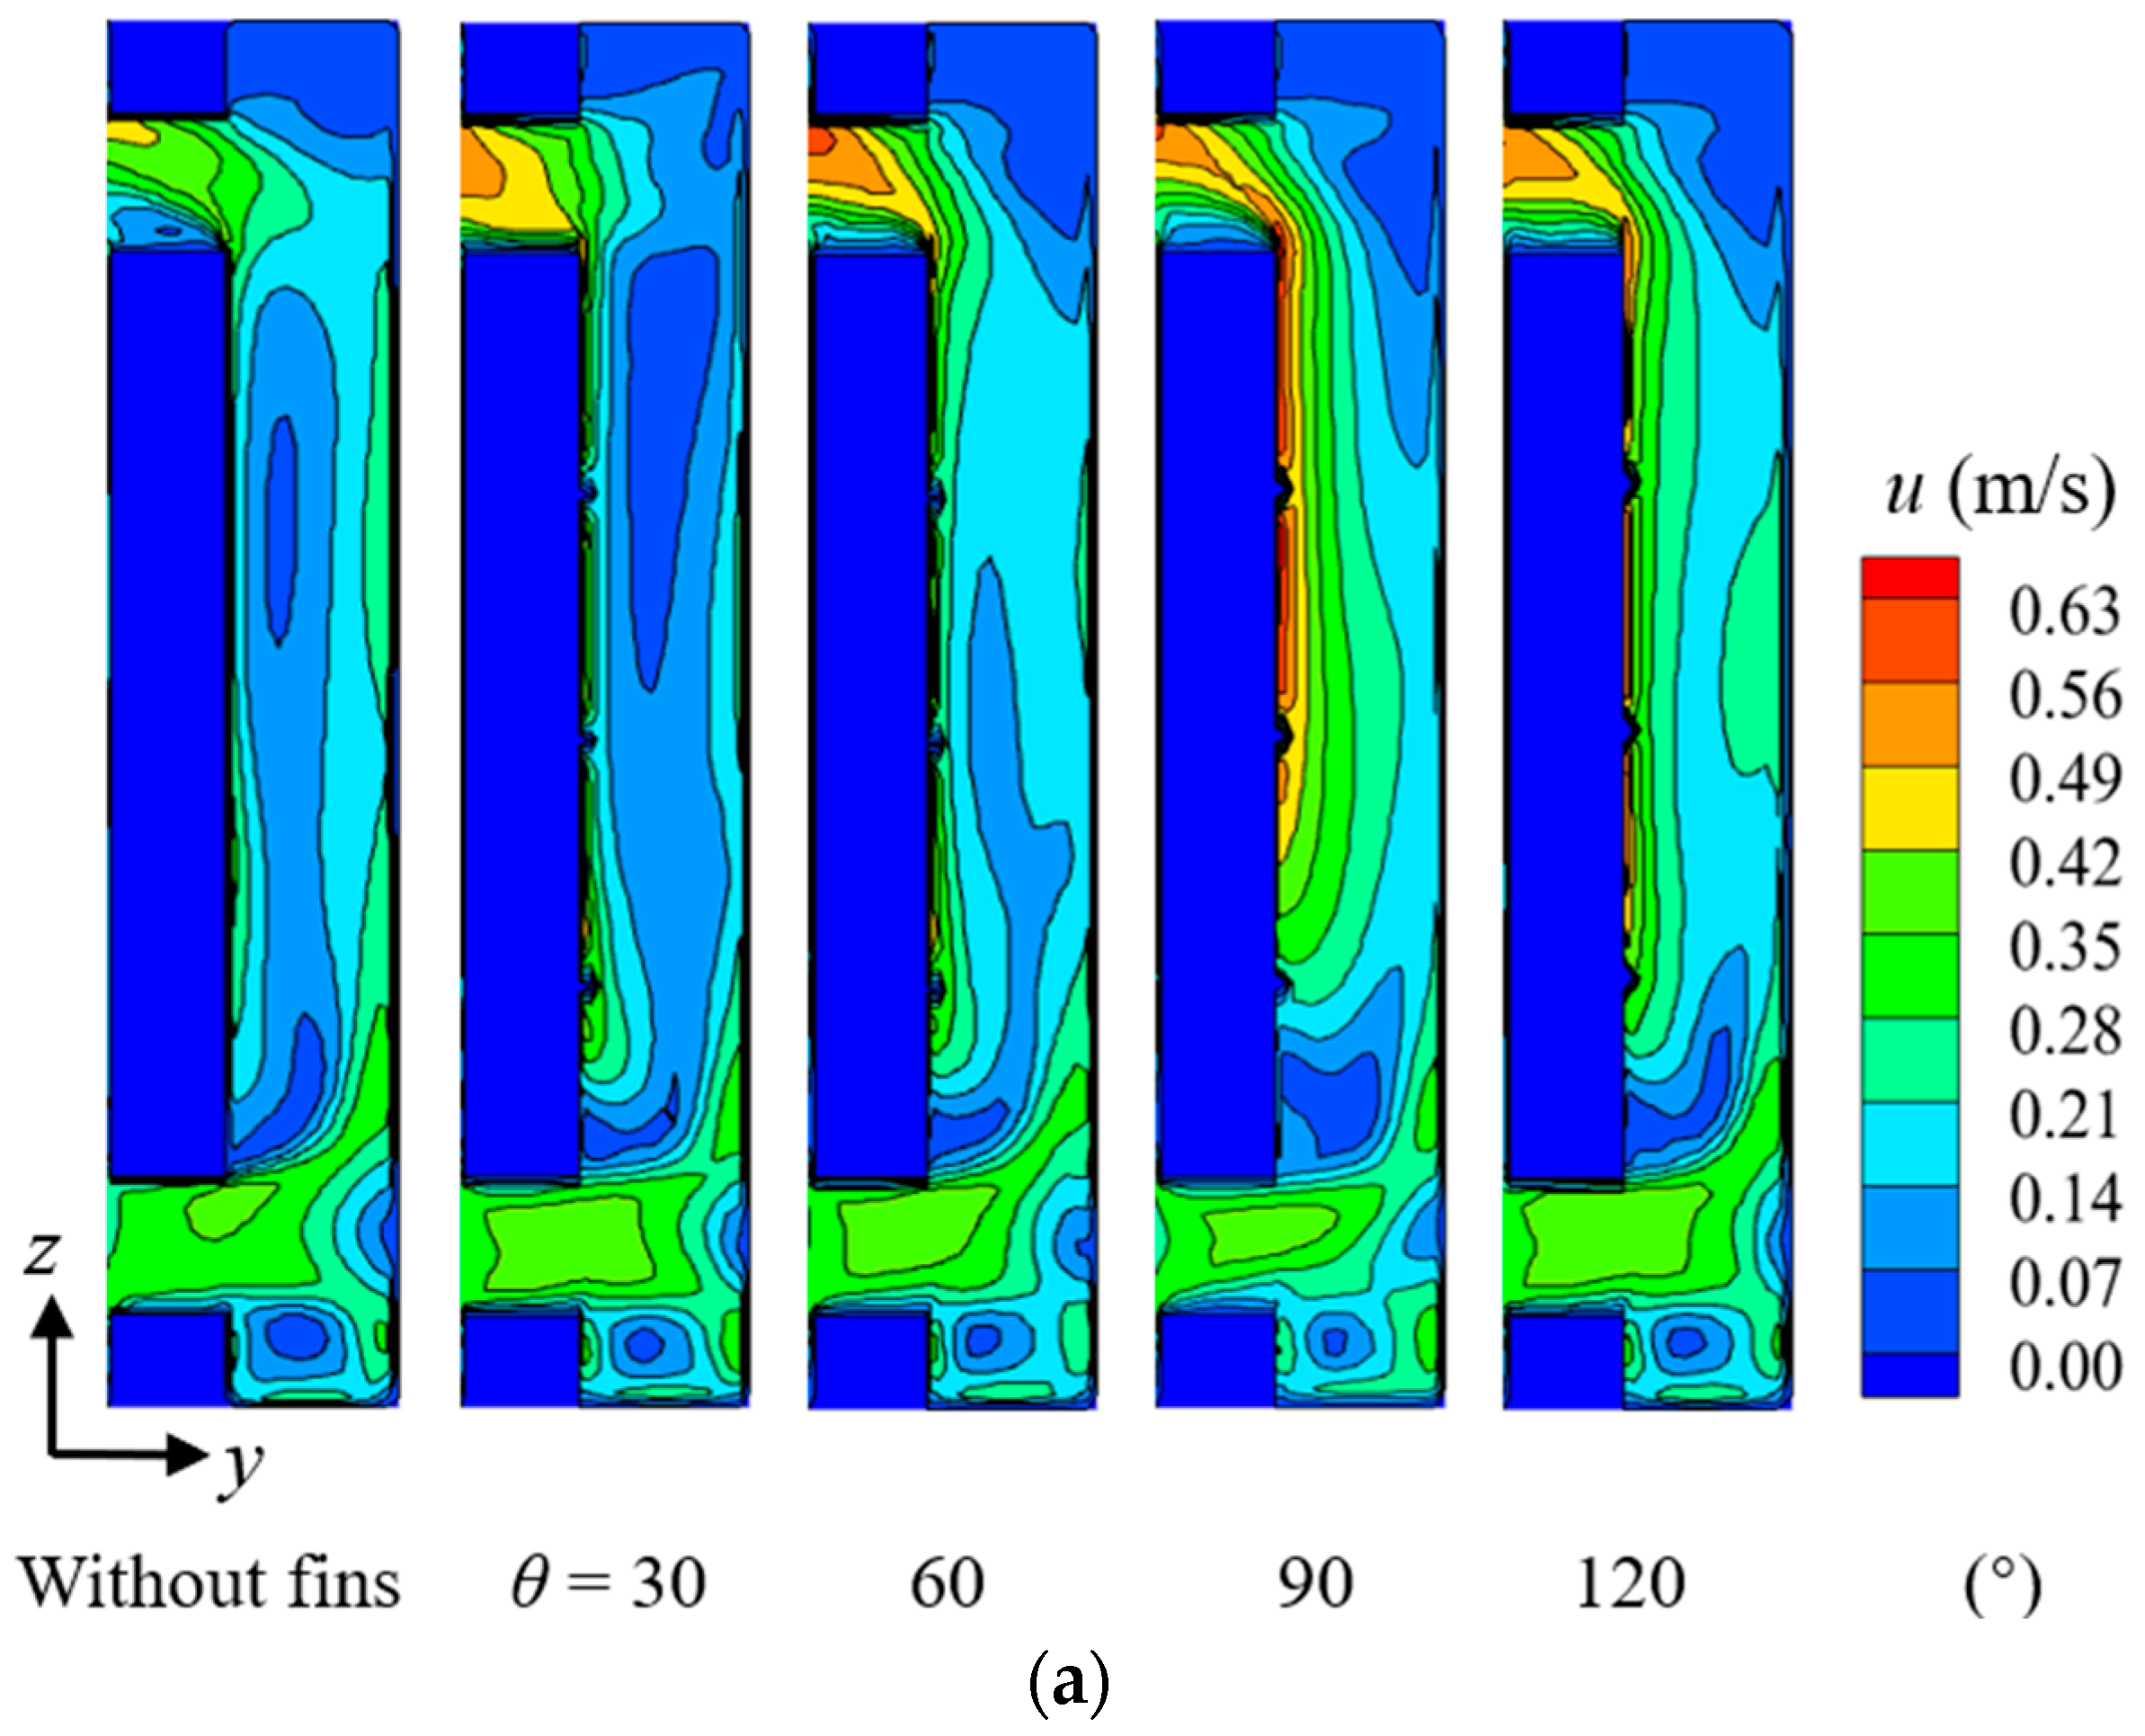
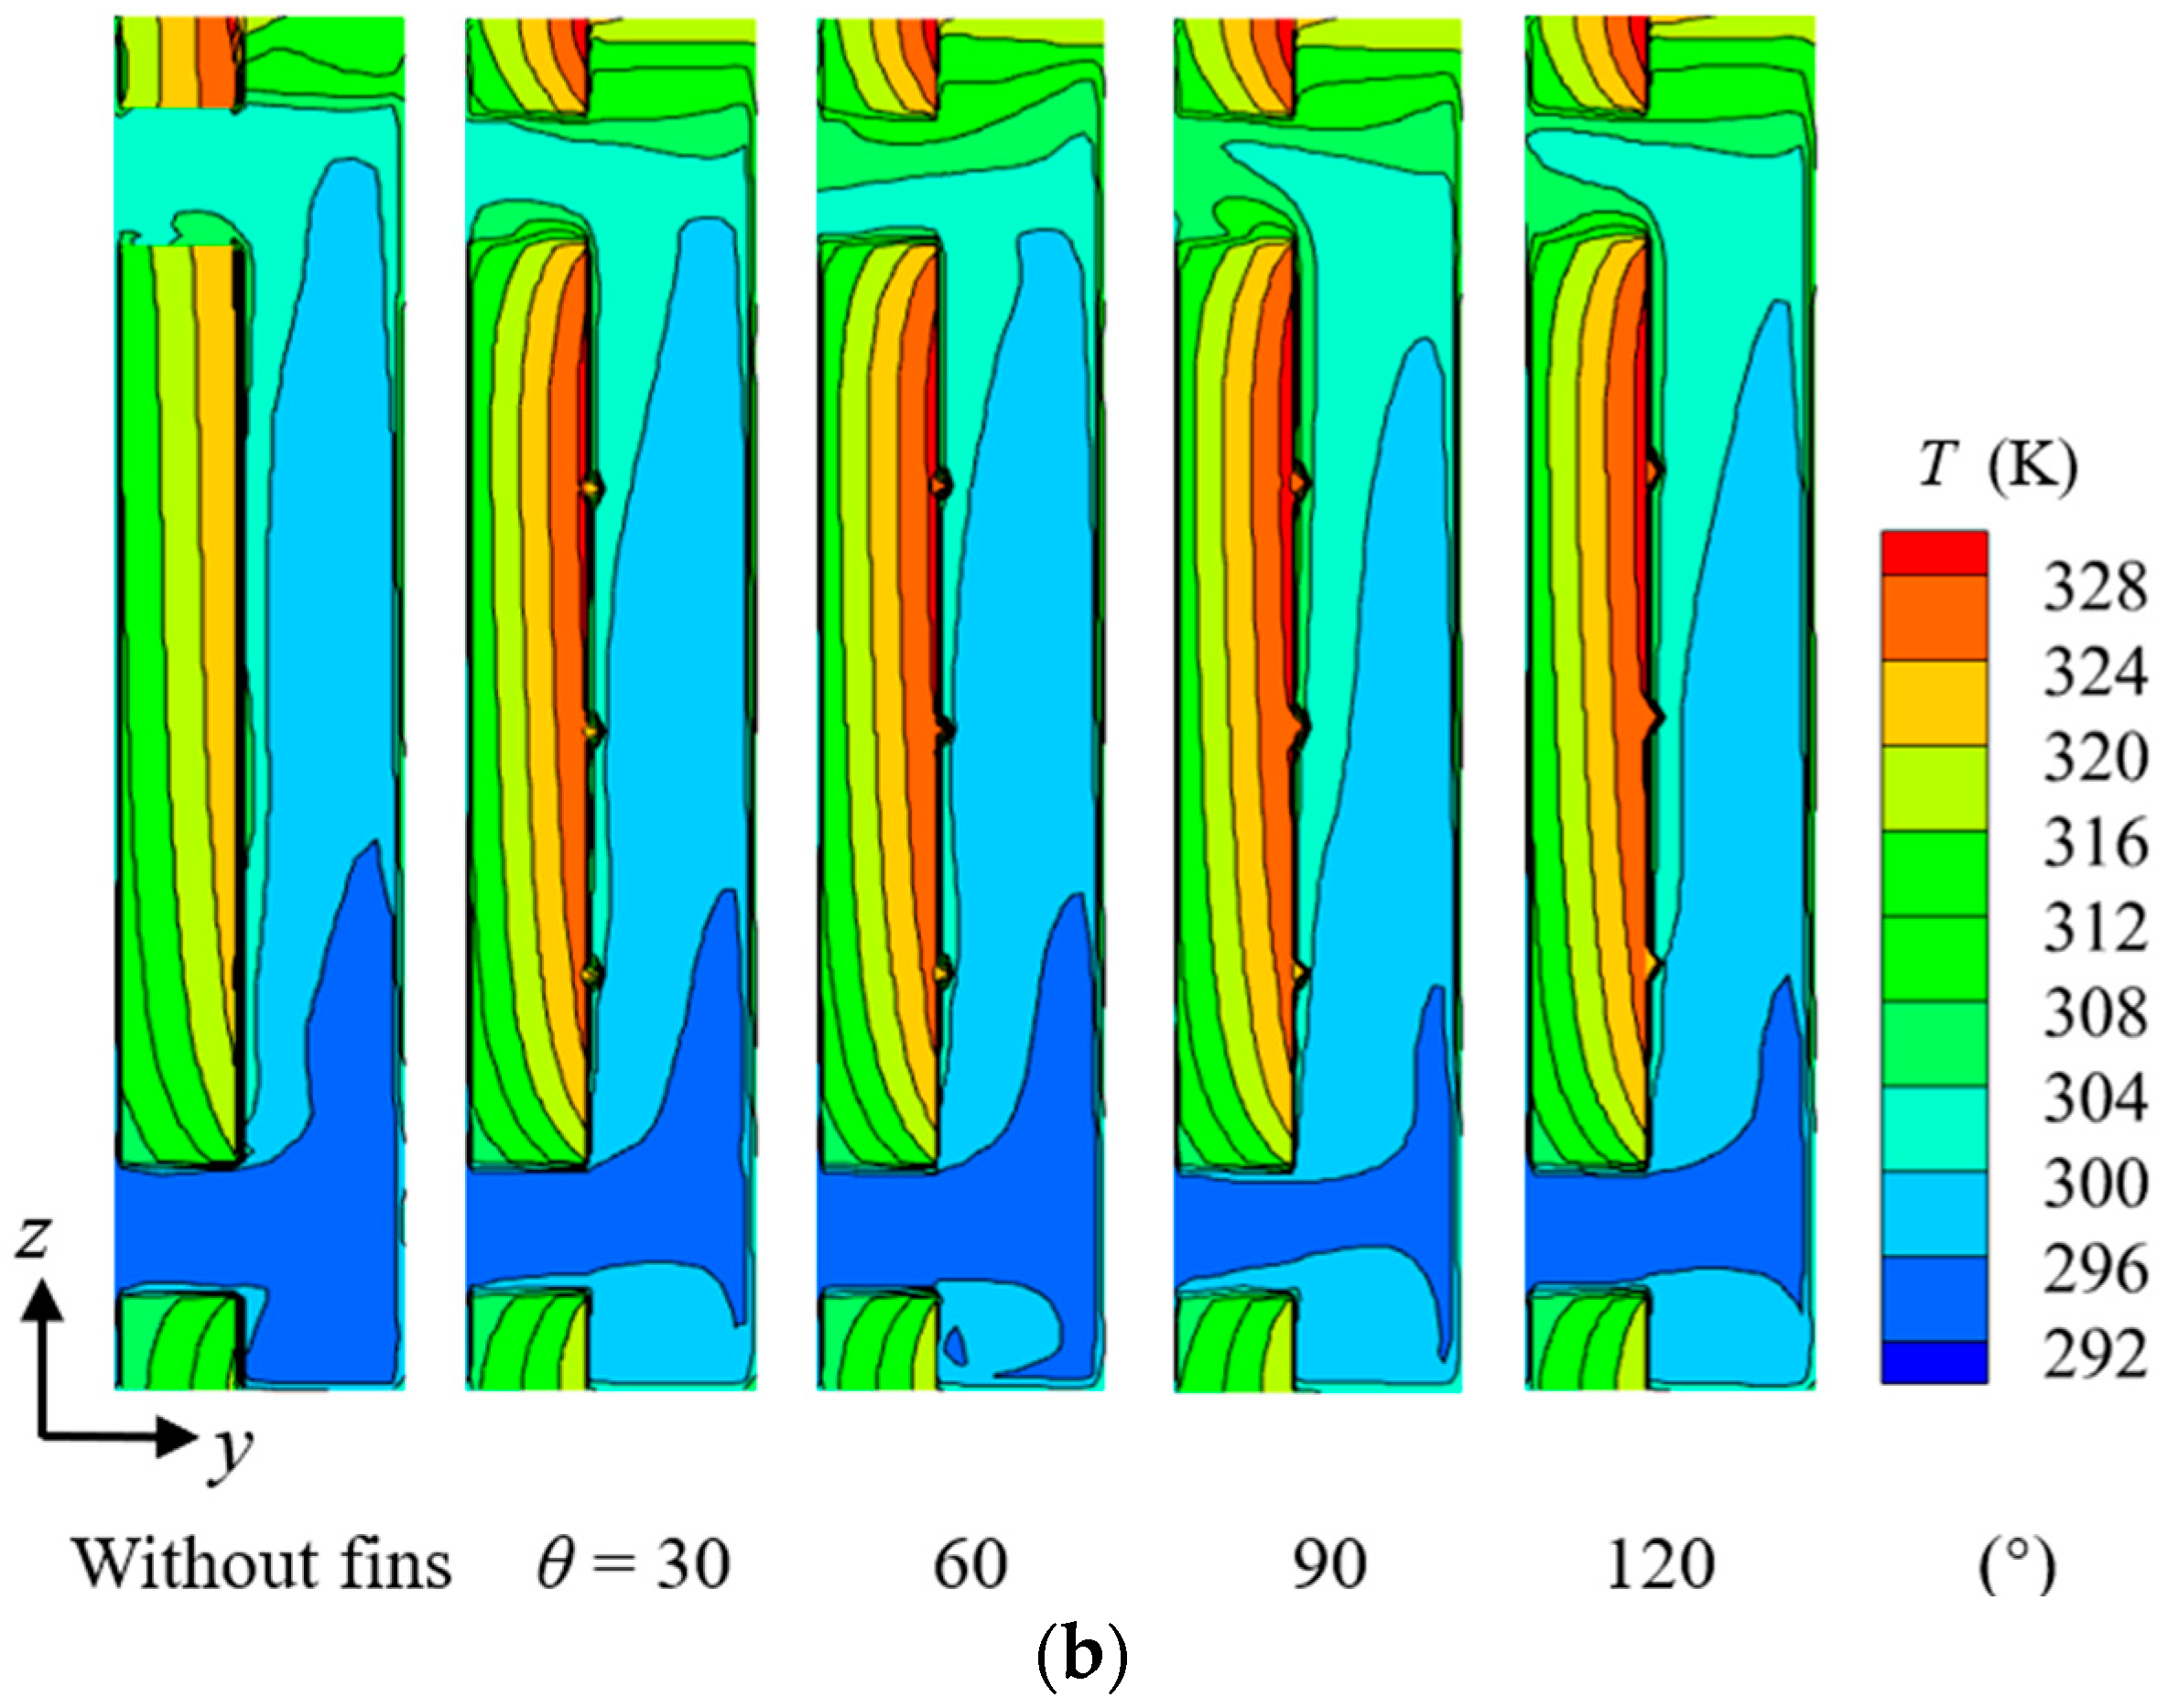
4.1.5. Different Types of Isosceles Triangle Fins

Based on the previous work, in this section, we selected different isosceles triangles for research. The fin height, transverse spacing, longitudinal spacing (d = 20 mm, s1 = 0.200 m, and s2 = 0.533 m), and in-line arrangement were determined. Isosceles triangles with top angles (θ) of 30°, 60°, 90°, and 120° were selected to compare their effects on the TWs’ thermal performance.
Figure 12a,b depict the local velocity cloud map and temperature cloud map corresponding to the addition of different apex fins. It can be seen in Figure 12a,b that compared with the finless Trombe wall, the velocity and temperature of the air interlayer were improved after adding fins with different apex angles on the heat-absorbing surface. With different apex angles, the gradients of velocity and temperature were also different. With the gradual increase in the apex angle, the velocity and temperature increase first and then decrease, and the shapes of the triangular fins corresponding to different apex angles, as well as the influence resistance of different shapes on the sandwich air, become different. When the apex angle reaches 90°, the airflow velocity changes most obviously, and the velocity near the fin shows an overall growth trend. Compared with other vertex angles, the air velocity and temperature of the interlayer corresponding to the 90° vertex angle reach a maximum value, and the heat transfer performance of the Trombe wall’s heat-absorbing surface is the best.
Figure 13 shows the variation curve of Nu on the heat-absorbing surface when the fin apex angles are different. In Figure 13, it can be seen that the Nu of the HAS increases first and then decreases with the increase in the vertex angle. The values of Nu of the HASs with 30°, 60°, 90°, and 120° fins are 148.26, 149.66, 154.75, and 150.39, respectively. Therefore, when the vertex angle is 90°, the fin-type Trombe wall has the best heat transfer performance improvement effect, and the Nu of the HAS is 154.75.

4.2. Thermal Environment Analysis of Fin-Type-Trombe-Wall-Containing Room

By studying the influence of fin structure and fin arrangement on the TW’s thermal performance, the optimal structure of the built-in fin-type TW was obtained: the height of the fin is 20 mm, the transverse spacing of the fin is 0.200 m, and the fin’s longitudinal spacing is 0.533 m. In this configuration, the isosceles triangle fins are arranged in order on the heat absorption surface of the TW. Based on this study’s results, the thermal performance of the fin-type TW and the finless TW during the heating period (8:00~16:00) was comprehensively analyzed, and the studied room’s thermal comfort and heating-energy-saving rate were discussed.

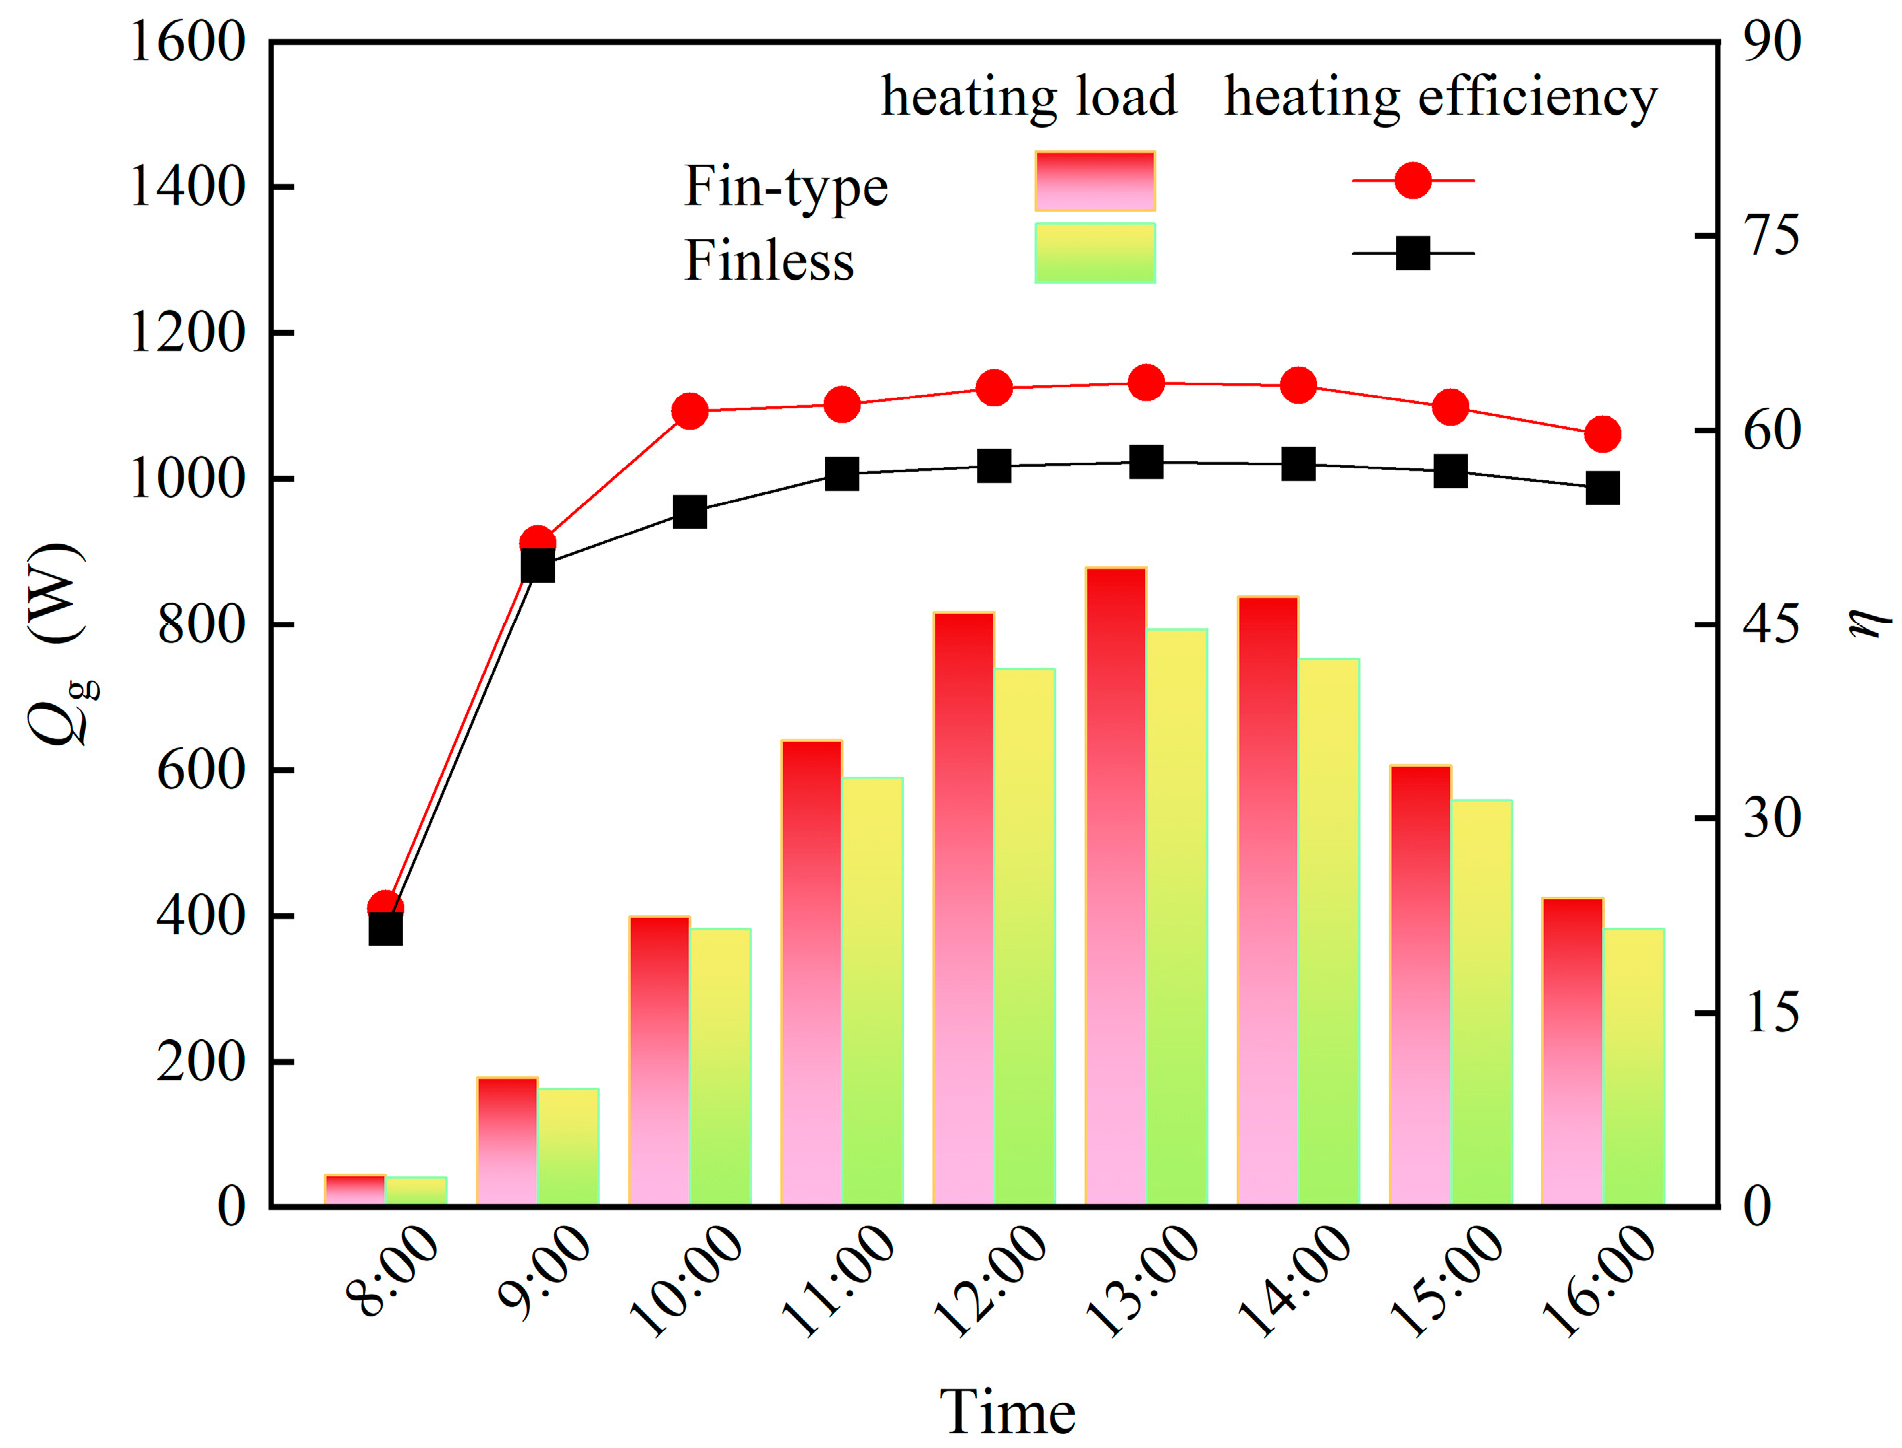
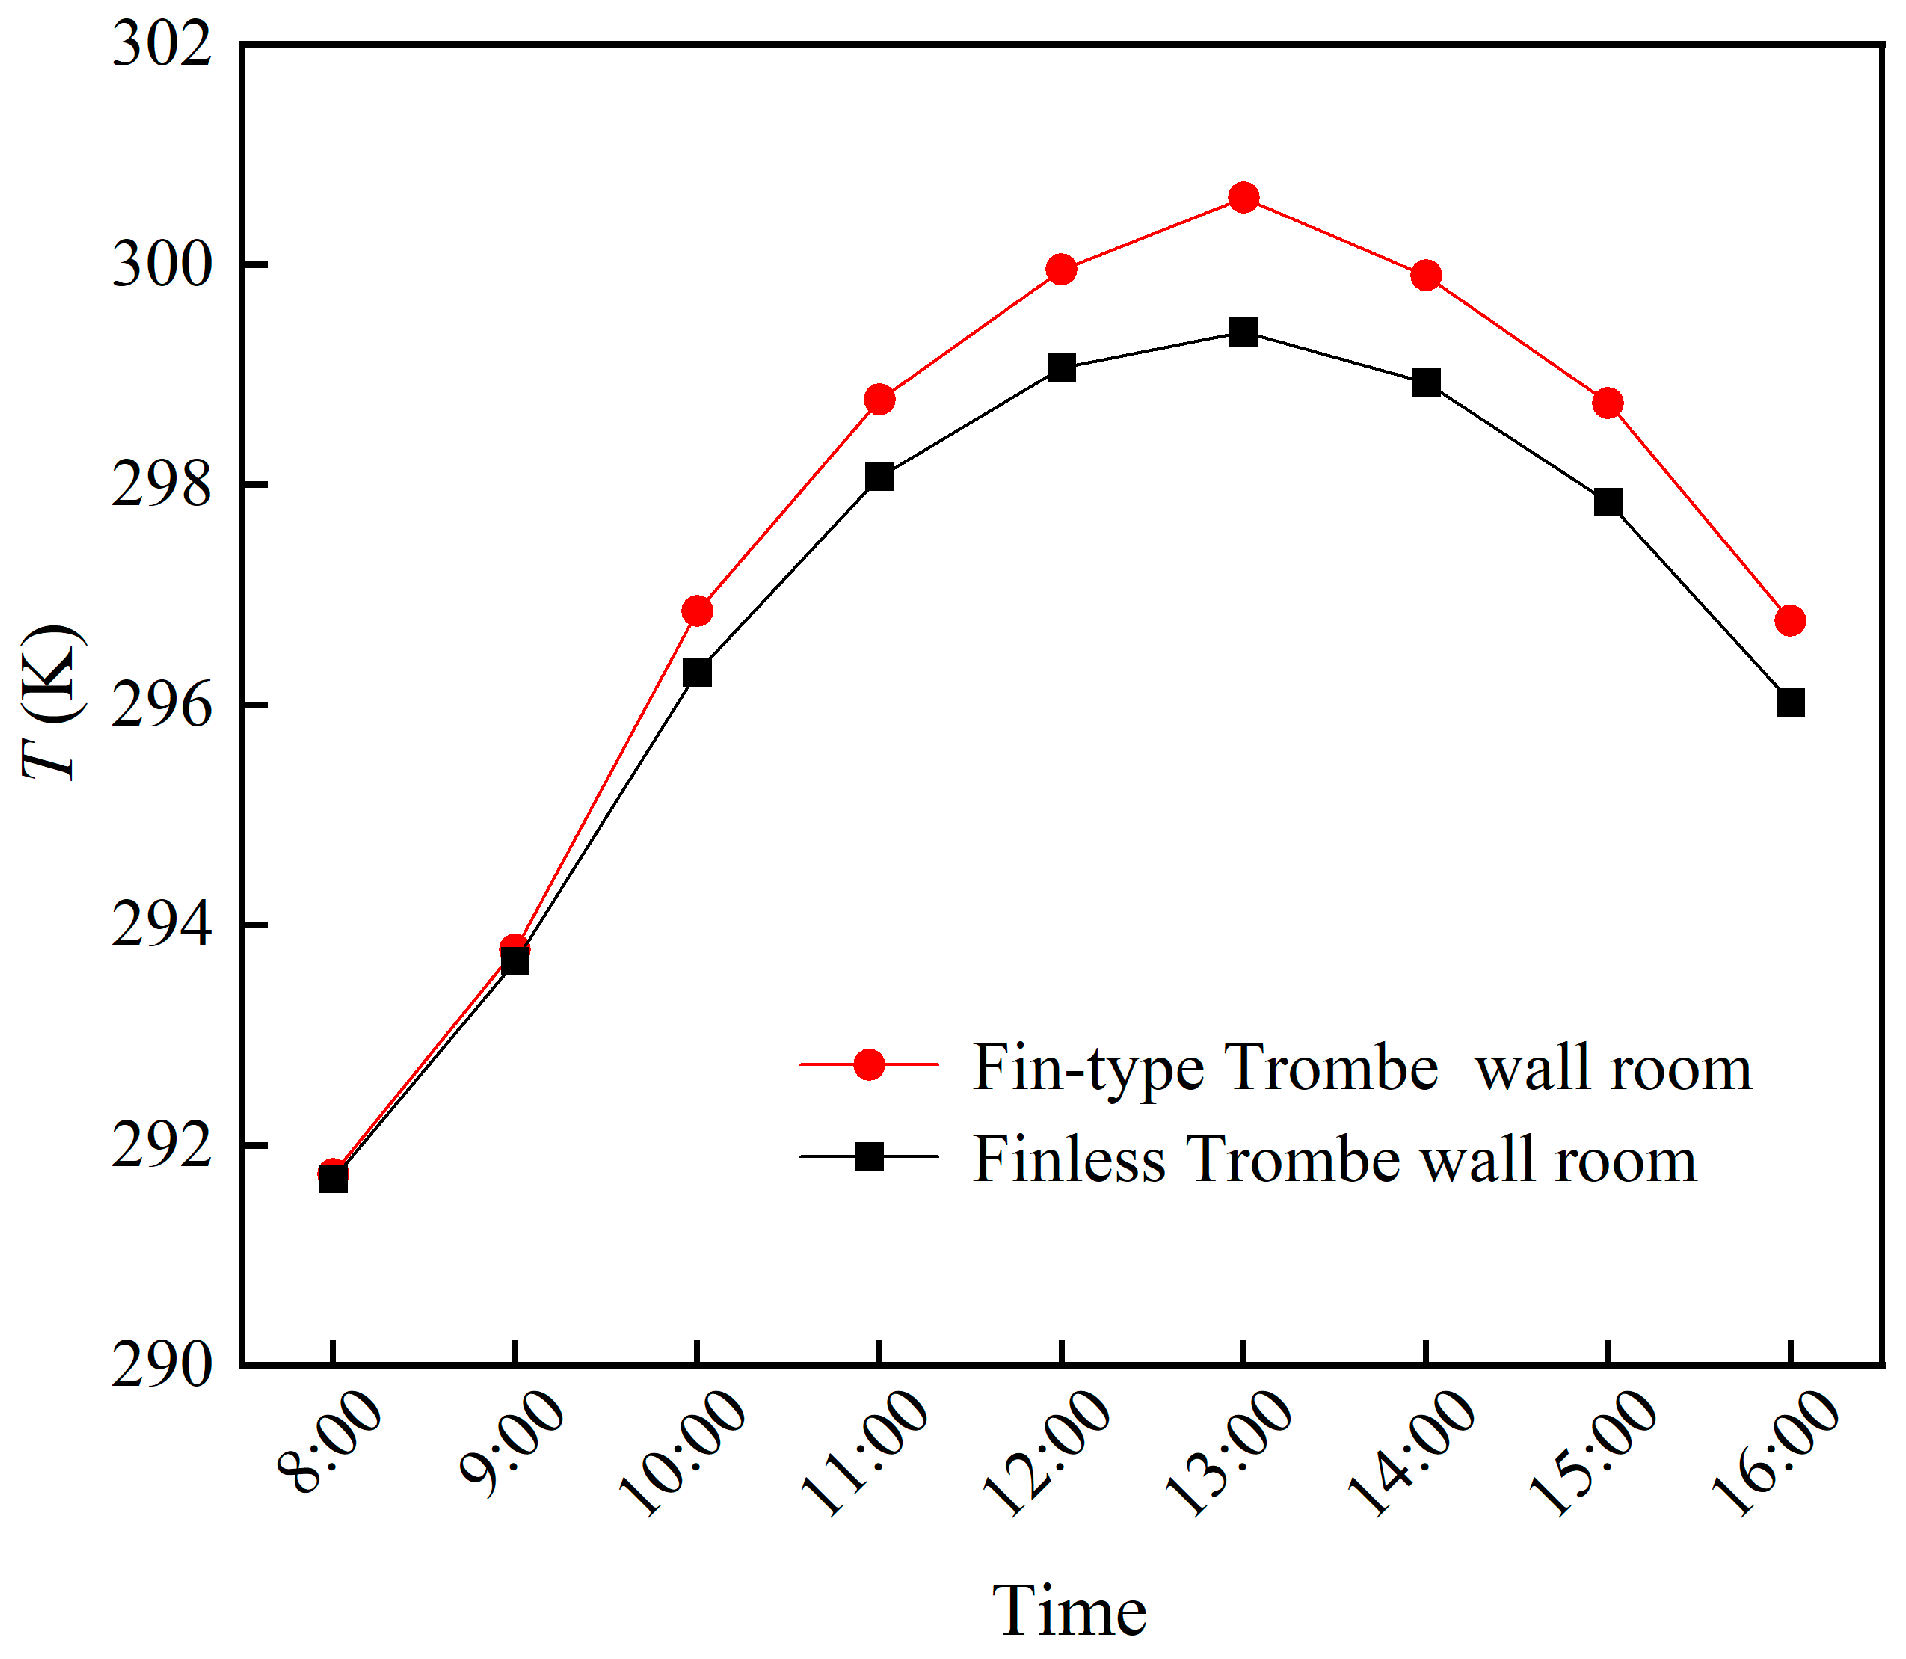
4.2.1. Thermal Performance Analysis

Figure 14 compares the ventilation rate and temperature of the upper vent of the improved TW and the finless TW at different times.
Figure 14 reveals that the changes in ventilation volume and temperature of the vent for the fin-type TW are consistent with those of the finless TW. This trend increases first and then decreases, which aligns with the change in the intensity of solar radiation. The ventilation rates of the vents on the finless TW and the fin-type TW are minimal at 8:00 (87.57 m3/h and 76.31 m3/h, respectively), and the corresponding temperature also reaches its minimum (291.69 K and 291.78 K, respectively). The ventilation rates of the upper vents of both TWs reached their maxima at 13:00 (235.13 m3/h and 213.98 m3/h, respectively), and the corresponding temperatures were maximal (311.81 K and 312.69 K, respectively). During this period, the ventilation rate of the vent on the finless TW surpassed that of the fin-type TW, whereas the temperature of the vent on the finless Trombe wall was lower than that of the fin-type Trombe wall.
Figure 15 and Figure 16 are velocity and temperature maps of the longitudinal section of the finless TW and the fin-type TW rooms at different times (x = 1.90 m), respectively.
At 9:00, the intensity of solar radiation decreases, and the fins have little impact on the TW’s thermal performance. At this point, the air interlayer and indoor temperature of the finless TW and the fin-type TW are the same. However, due to the addition of fins, the structure of the HAS has changed, resulting in resistance and hindering airflow. As a result, there are many areas with low airflow velocity in the finned TW room, and the disturbance velocity gradient of the fins in the air channel is large.
At 11:00–13:00, the solar radiation intensity increases, and the energy absorbed by the TW also increases. Due to the destruction of the boundary layer, the thermal performance between the HAS and the air increases, and the air temperature entering the room through the upper air inlet also increases. At 13:00, the intensity of the solar radiation reached the highest level, the indoor temperature also rose to the highest level, and a high-wind-speed area appeared in the finned TW room. After that, the solar radiation intensity began to weaken, and the wind speed and temperature of the room decreased at 15:00. Due to the inhibition of the fins, the airflow in the channel became slow, hindering the cold air at the lower section of the room from entering the air channel and making it difficult for the high-temperature air at the upper part of the room to sink. At this point, the temperature in the upper part of the finned TW room is higher than that of the non-finned TW room, but the lower-temperature area is greater than that of the non-finned Trombe wall room.
A comparison of the HASs N u ¯ of the finless TW and the fin-type TW at different times is presented in Figure 17. The HAS N u ¯ of the fin-type TW is always larger than that of the finless TW wall, indicating that the additional fins improve the internal capacity of the heat transfer of the air interlayer and play a greater role in indoor auxiliary heating. Between 8:00 and 9:00, owing to the low intensity of solar radiation, the convective heat transfer capacity of the fin with the HAS and the channel air is weak. As the intensity of solar radiation rises, the fin and the HAS receive more energy, which accelerates the convective heat transfer inside the air channel. At 13:00, the solar radiation is greatest, and then with the continuous weakening of solar radiation, the heat transfer effect gradually decreases. The TW with fins is more influenced by solar radiation, and the change range of the HAS N u ¯ is larger than that of the HAS N u ¯ of the TW without fins.
Figure 18 shows the changes in the convective heat supply and convective heat supply efficiency of finless and fin-type Trombe walls at different times. The following is the calculation formula for the convective heat supply and convective heat supply efficiency of the Trombe wall.
Convective heat supply ( Q g ):
Q g = c p m ˙ t u a t d a
m ˙ = ρ d a v d a A d
where A d denotes the cross-sectional location of the upper vent.
Convective heating efficiency (η):
η = Q g I x o A x o
where I x o is the solar radiation intensity absorbed by the HAS in W/m2; A x o is the area of the endothermic surface in m2.
The results show that the convective heat supply and convective heat supply efficiency of finless and fin-type Trombe walls increase first and then decrease with time, which aligns with variations in solar radiation intensity. The solar radiation is very weak at 8:00. At this point, the convective heat supply of the finless and fin-type TWs is the smallest, amounting to 40.01 W and 42.84 W, respectively. The relative convective heat supply efficiency is also the smallest, amounting to 21.49% and 23.02%, respectively. The intensity of solar radiation gradually reaches a maximum at 13:00, which leads to the maximum heat transfer capacity of the TW. At this point, the convective heat supply and convective heat supply efficacy of finless and finned TWs reach maximum levels, which are 792.34 W, 878.52 W, and 57.56%, 63.64%, respectively. From 8:00 to 16:00, the convective heat supply and convective heat supply efficacy of the fin-type TW are higher than those of the finless TW. The convective heat supply and convective heat supply efficiency of the fin-type TW are increased by 87.08 W and 7.77%, respectively, when compared with the finless TW, indicating that the addition of fins is beneficial to the improvement of a TW’s heat transfer capacity.
In [27], the convective heat transfer efficiency of the fin-type TW was up to 6% greater than the convective heat transfer efficiency of the finless TW. In this paper, the convective heat transfer efficiency of the fin-type TW was up to 7.7% greater than that of the finless TW. In this paper, the convective heat transfer efficiency of the finned TW is 1.7% higher than that in [27], which shows that the results of this study are good and meaningful.
Figure 19 shows the change in the average temperature of the room at different times. The average temperature of the finless TW and the fin-type TW room increases first and then decreases with time, and the average temperature of the fin-type TW room is always higher than that of the finless TW. At 13:00, the average temperatures of the two rooms reached the highest levels, i.e., 300.61 K and 299.38 K, respectively. At this time, the difference between the average temperature of the fin-type TW room and the average temperature of the finless TW room was also the largest, reaching 1.23 °C. In the literature [29], the average temperature of the fin-type TW room is 0.16 °C higher than that of the finless TW room. In this paper, the average temperature of the fin-type TW room is 0.68 °C higher than that of the finless TW room. The average temperature of the fin-type TW room studied in this paper is 0.52 °C higher than that reported in the literature [29], indicating that our research method is effective and the research results are meaningful.

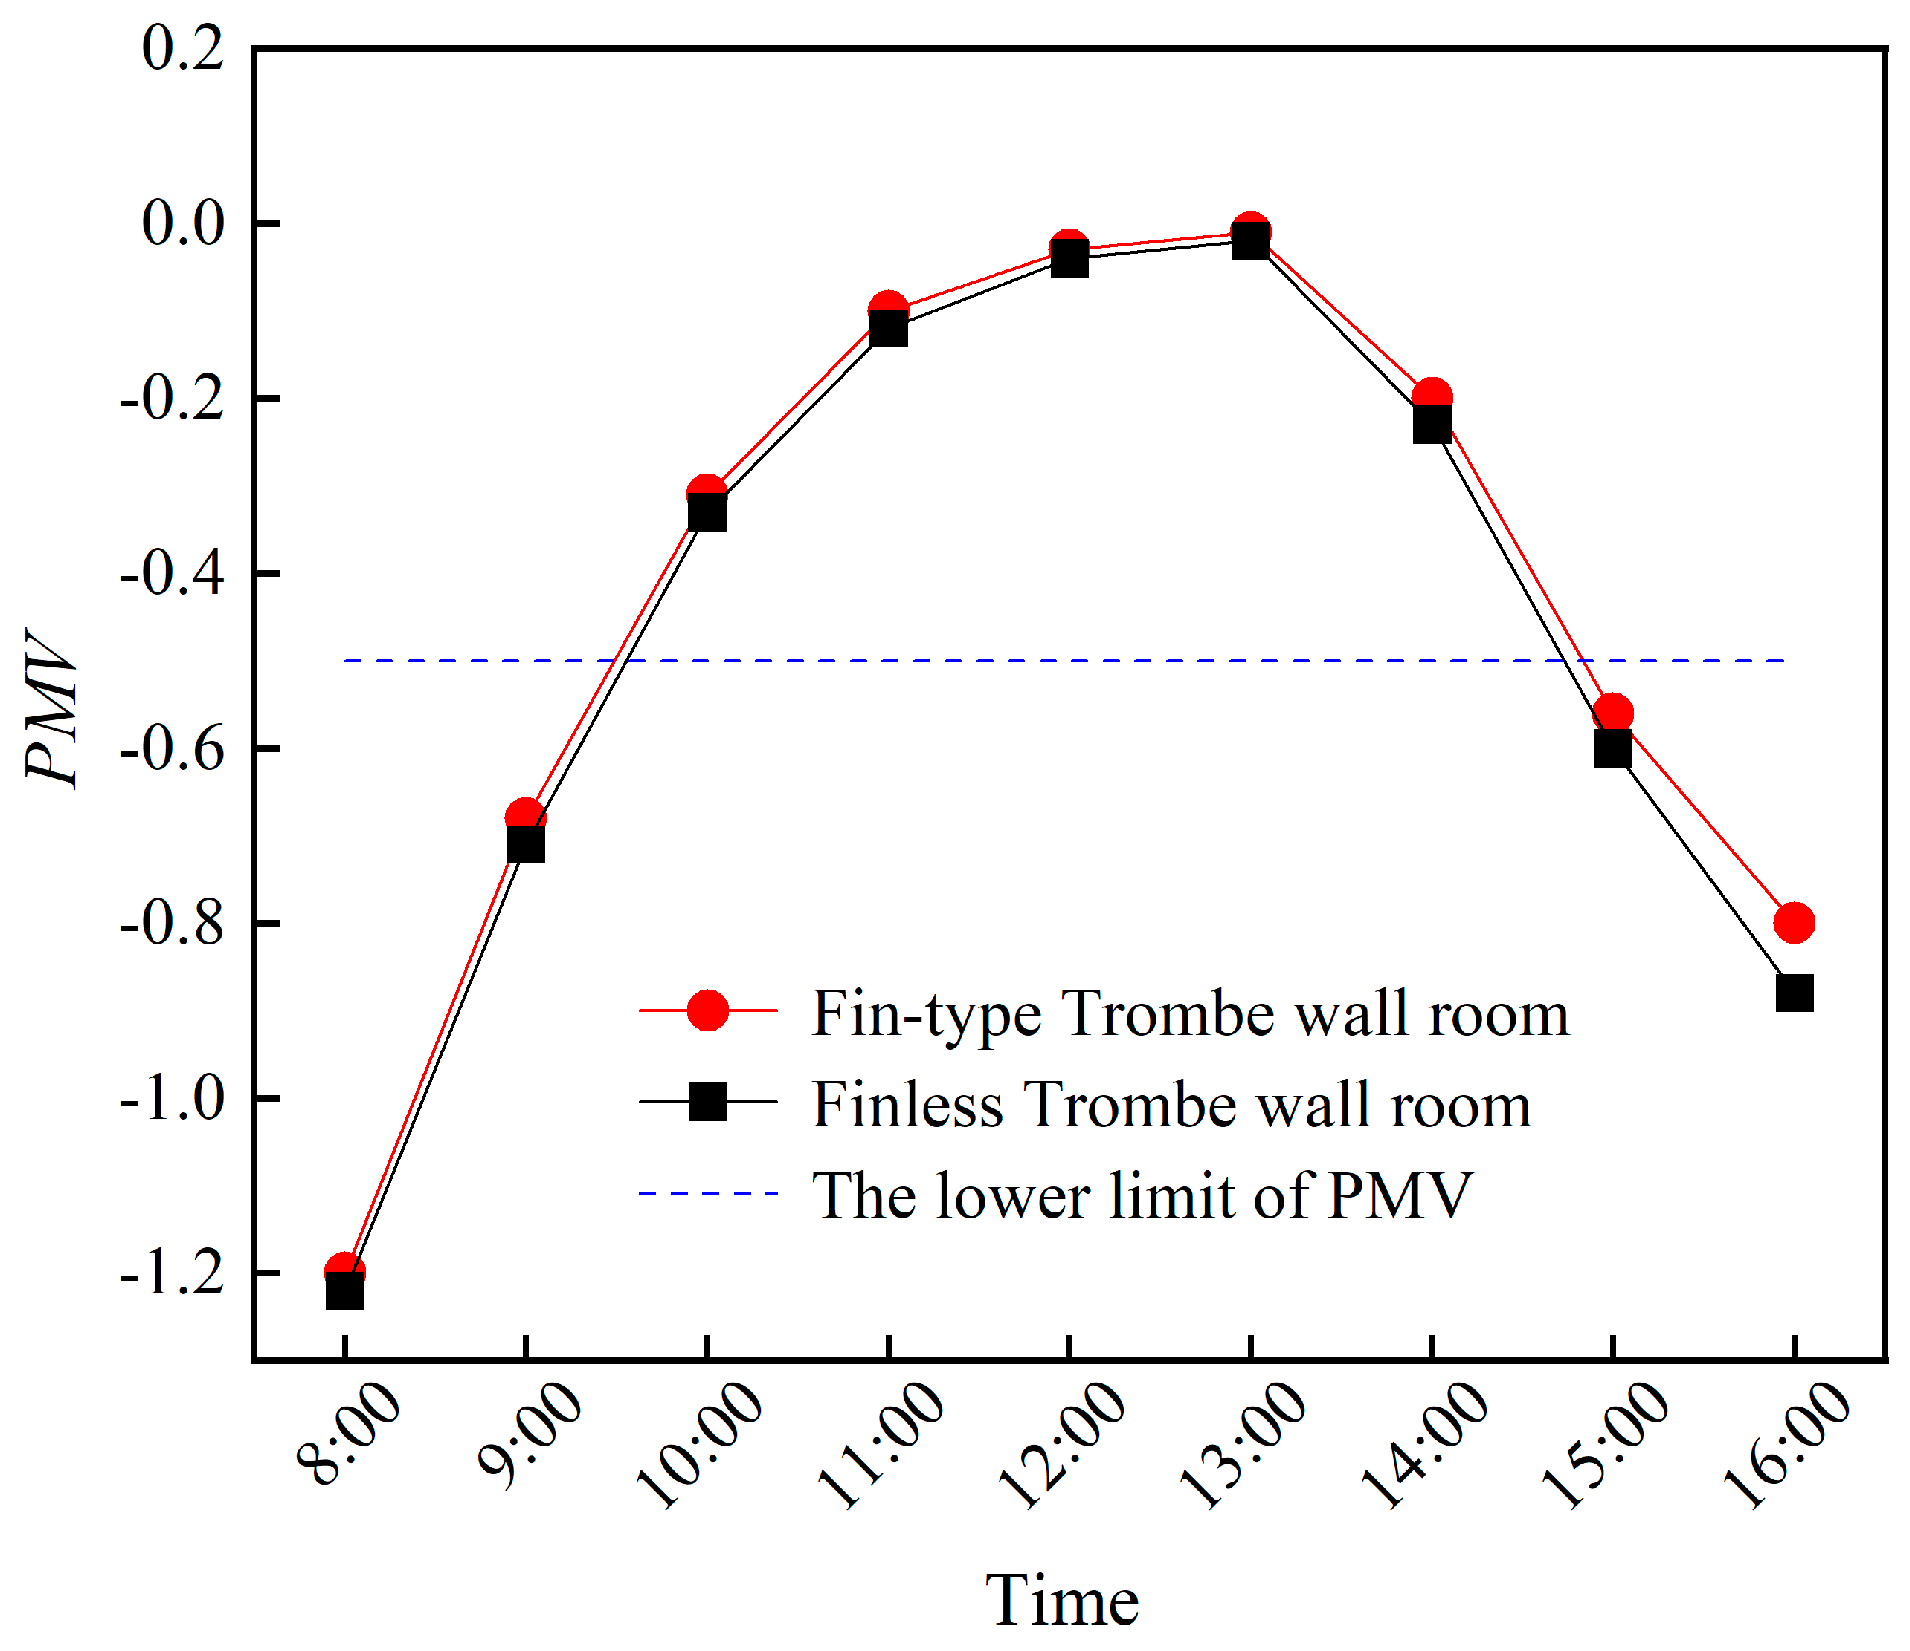
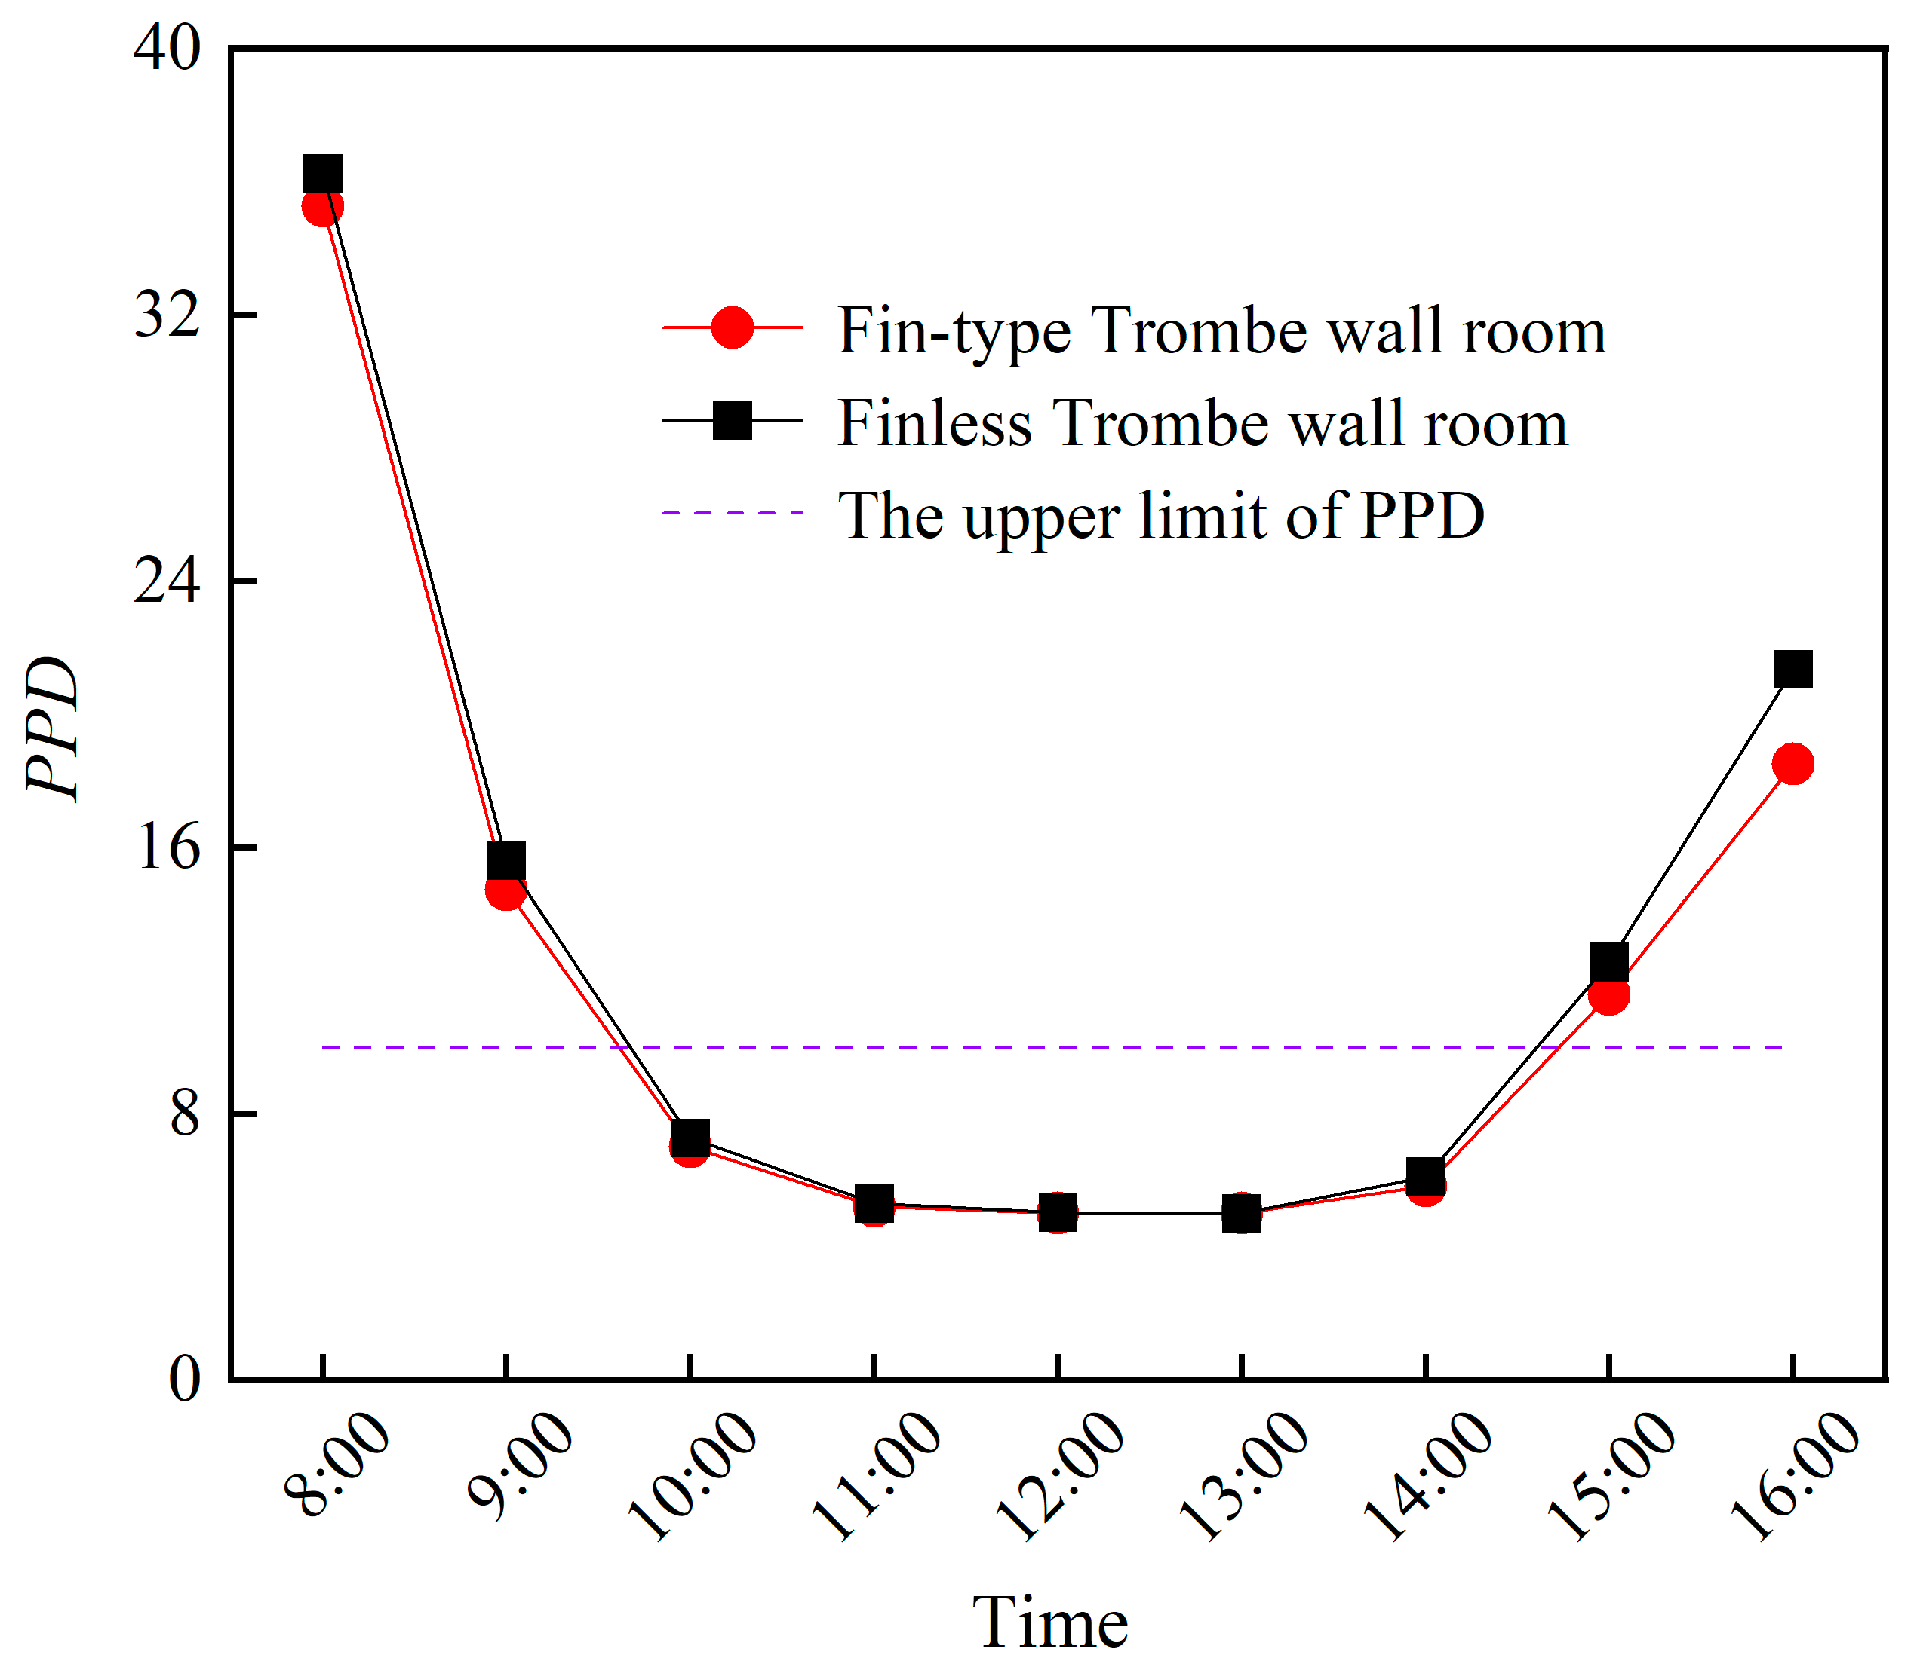
4.2.2. Thermal Comfort Analysis

This section focuses on the indoor TE before and after enhancing the TW based on the PMV-PPD model. The corresponding model includes six factors: clothing thermal resistance, basal metabolic rate, indoor air temperature, average radiation temperature, air flow rate, and water vapor partial pressure. According to the new standardized method for indoor environment evaluation and measurement proposed by the International Organization for Standardization [35], the suggested score of the PMV-PPD index varies between −0.5 and +0.5; that is, 10% of people are allowed to feel dissatisfied.
The predicted average thermal sensation index, PMV, is calculated as follows:
P M V = ( 0.303 e 0.036 M + 0.028 ) { M W 3.05 × 10 3 × 5733 6.99 M W p a 0.42 × M W 58.15 1.7 × 10 5 M 5867 p a 0.0014 M 34 t s 3.96 × 10 8 f c l × t c l + 273 4 t r ¯ + 273 4 f c l h c t c l t s
t c l = 35.7 0.028 M W I c l { 3.96 × 10 8 f c l × t c l + 273 4 t r ¯ + 273 4 + f c l h c ( t c l t s )
h c = 2.38 t c l t s 0.25               2.38 t c l t s 0.25 > 12.1 v a r 12.1 v a r                                             2.38 t c l t s 0.25 < 12.1 v a r
f c l = 1.00 + 1.290 I c l                                         I c l 0.078   ( m 2 · ) / W 1.05 + 0.645 I c l                                         I c l > 0.078   ( m 2 · ) / W
where p a denotes the partial pressure of water vapor around the human body; f c l is the area coefficient of clothing, that is, the ratio of the clothed surface region of the human body to the bare surface region of the human body; and I c l denotes the clothing’s thermal resistance.
In the present study, the PMV index has seven grades, as shown in Table 4:
Figure 20 compares the PMV between the finless TW and the fin-type TW rooms at different times, demonstrating that the PMV increases first and then decreases with time, which aligns with the change in solar radiation intensity during the day, and the PMV of the finned TW room is larger than that of the non-finned TW room at the same time, which is closer to the comfortable state. The PMV of the finless TW and the finned TW rooms is less than −1 at 8:00, so people inside would need to take measures to keep warm. The PMV between 10:00 and 14:00 is greater than −0.5, which fully meets the requirements of thermal comfort during this period, and the temperature at other times should be reasonably arranged according to the needs of the occupants.
The PMV index reflects the sensations of most individuals in each environment and serves to assess the comfort level of the TE. However, individual variances exist among different people, meaning that this index may not capture the sensation of every individual. To this end, it is necessary to calculate the percentage of predicted dissatisfaction (PPD) to understand the percentage of people dissatisfied with the TE. The PPD is calculated using the following formula:
P P D = 100 95 e 0.03353 P M V 4 + 0.2179 P M V 2
Figure 21 shows a comparison of the PPD for the finless TW and the fin-type TW rooms at different times, indicating that the PPD is within 10% between 10:00 and 14:00. The results satisfy the thermal comfort requirements, while the PPD in other periods does not meet the requirements. From 8:00 to 16:00, the PPD of the fin-type TW room is smaller than that of the fin-free TW room, and the time for which this value is within 10% is greater, which indicates that the Trombe wall with fins for structural optimization can significantly enhance a room’s thermal comfort.
The PMV-PPD model addresses the comprehensive indoor TE, yet local conditions also influence human thermal comfort. Extreme temperatures on the floor, whether too high or too low, can lead to discomfort. Likewise, discrepancies in temperature between the head and ankle regions can contribute to discomfort for individuals. LPD3 is a local dissatisfaction rate caused by surface temperature. It is employed to assess the thermal comfort near the ground. LPD3 is calculated in Equation (27).
L P D 3 = 100 94 e 1.387 + 0.118 t f 0.0025 t f 2
where t f represents the mean temperature of the floor surface in °C.
Figure 22 compares the LPD3 in the finless and fin-type TW rooms at different times, demonstrating that the LPD3 of the fin-type TW room is greater than that of the fin-free TW room from 8:00 to 16:00. The difference in LPD3 is greater between 12:00 and 13:00 because the intensity of solar radiation reaches the highest level, increasing the finned Trombe wall’s heat transfer capacity, resulting in the air temperature entering the room being higher and the room’s thermal comfort being better. During the whole period, whether in a finless TW room or a fin-type TW room, the LPD3 is less than 10%, indicating that either room’s thermal comfort is better.
In addition, the temperature difference and wind speed at 0.1 m and 1.2 m from the ground (corresponding to the ankle and head of the human body when sitting) in the room are also of concern.
Figure 23 compares the temperature difference (Δt) between the heads and ankles of people in the non-finned and finned Trombe wall rooms at different times when they are sitting. It can be observed that the head–foot temperature difference rises first and then lowers with time, which aligns with the intensity alteration of the solar radiation during the day. Before 10:00, the solar radiation intensity is small, the amount of energy absorbed by the TW is small, and the temperature fluctuation due to the TW is also small. Therefore, the temperature difference between the finless TW and the fin-type TW is small. Between 12:00 and 14:00, the temperature difference between the head and foot in the finned TW room becomes quite different from that of the non-finned TW room. During this period, the intensity of solar radiation is high. The TW absorbs more energy and enhances the heat transfer capacity, accelerating the heat transfer between the sandwich air and the indoor air, and the indoor temperature fluctuates violently, so the temperature difference between the head and foot becomes large. After 14:00, when the intensity of the solar radiation decreases, the head–foot Δt between the finless TW and the fin-type TW room also decreases. The head–foot Δt of the finned TW room is smaller than that of the non-finned TW room throughout this period, indicating that the finned Trombe wall room is more comfortable.
Figure 24 illustrates the wind speed (v) of the finless TW room and the fin-type TW room at 0.1 m and 1.2 m from the ground at different times, demonstrating that the wind speed of the finless TW and the finned TW rooms at the head/shoulder area is lower than that at the ankle. The wind speed of the fin-shaped TW around the ankle area is lower than that for the finless TW, while the wind speed at the head area is lower than that for the finless TW before 10:00, and the wind speed at the head area is greater than that for the finless Trombe wall after 10:00. Throughout the whole period, whether in a finless Trombe wall room or a fin-type Trombe wall room, the wind speed at the head and ankle is less than 0.12 m/s, the air gust sensation is not strong, and the level of thermal comfort is good.

4.2.3. Energy-Saving Effect Analysis

A standard room’s hourly heat load accumulates from the basic heat consumption of the outer window, the cold air infiltration heat consumption of the outer window, the basic heat consumption of the outer wall, and the basic heat consumption of the floor. A room’s hourly heat load when equipped with a TW was obtained by deducting the heat consumption of the enclosure structure of the same size as the TW from the basic heat consumption of the south-facing exterior wall. The daytime heating energy-saving rate (ESF) of the room was computed by employing Equation (28). Table 5 presents the outcomes.
E S F = Q n o m a l [ Q T r o m b e Q g ] Q n o m a l
where Q n o m a l denotes the heat load of an ordinary room, given in W; Q T r o m b e represents the heat load of a Trombe wall room, given in W; and Q g is the heat that the interlayer air supplies to the room through convection, given in W.
The table indicates that the heat loads of the ordinary room, the finless TW room, and the fin-type TW room are 22.61 MJ, with a heat gain of 0.18 MJ from the south window. Additionally, the convection heat supply for the finless TW room and the fin-type TW room are 8.16 MJ and 10.01 MJ, respectively, while the relevant floor heat supply amounts to 14.27 MJ and 12.42 MJ, respectively. Calculating the energy-saving rates for the finless TW room and the fin-type TW room yielded 36.38% and 44.63%, respectively. That is, compared with the finless Trombe wall, the fin-type Trombe wall can increase the energy-saving rate of a room by 8.25%.

5. Conclusions

In this study, a 3D numerical model of a TW room with built-in fins was constructed, and ANSYS software was employed to explore the influence of fin structure and arrangement on the heat transfer performance and indoor TE of a TW when floor heating and solar radiation are coupled. The primary achievements are presented below.
(1)
This study found that the optimal height of the fins is d = 20 mm, the lateral spacing is s1 = 0.200 m, the longitudinal spacing is s2 = 0.533 m, and the arrangement in line has the greatest impact on the heat transfer performance of the TW, and this effect is optimal. Under these conditions, the HAS N u ¯ reaches its maximum, which is 9.42% higher than that of the finless TW, and the convective heat transfer efficiency is increased by 7.70%.
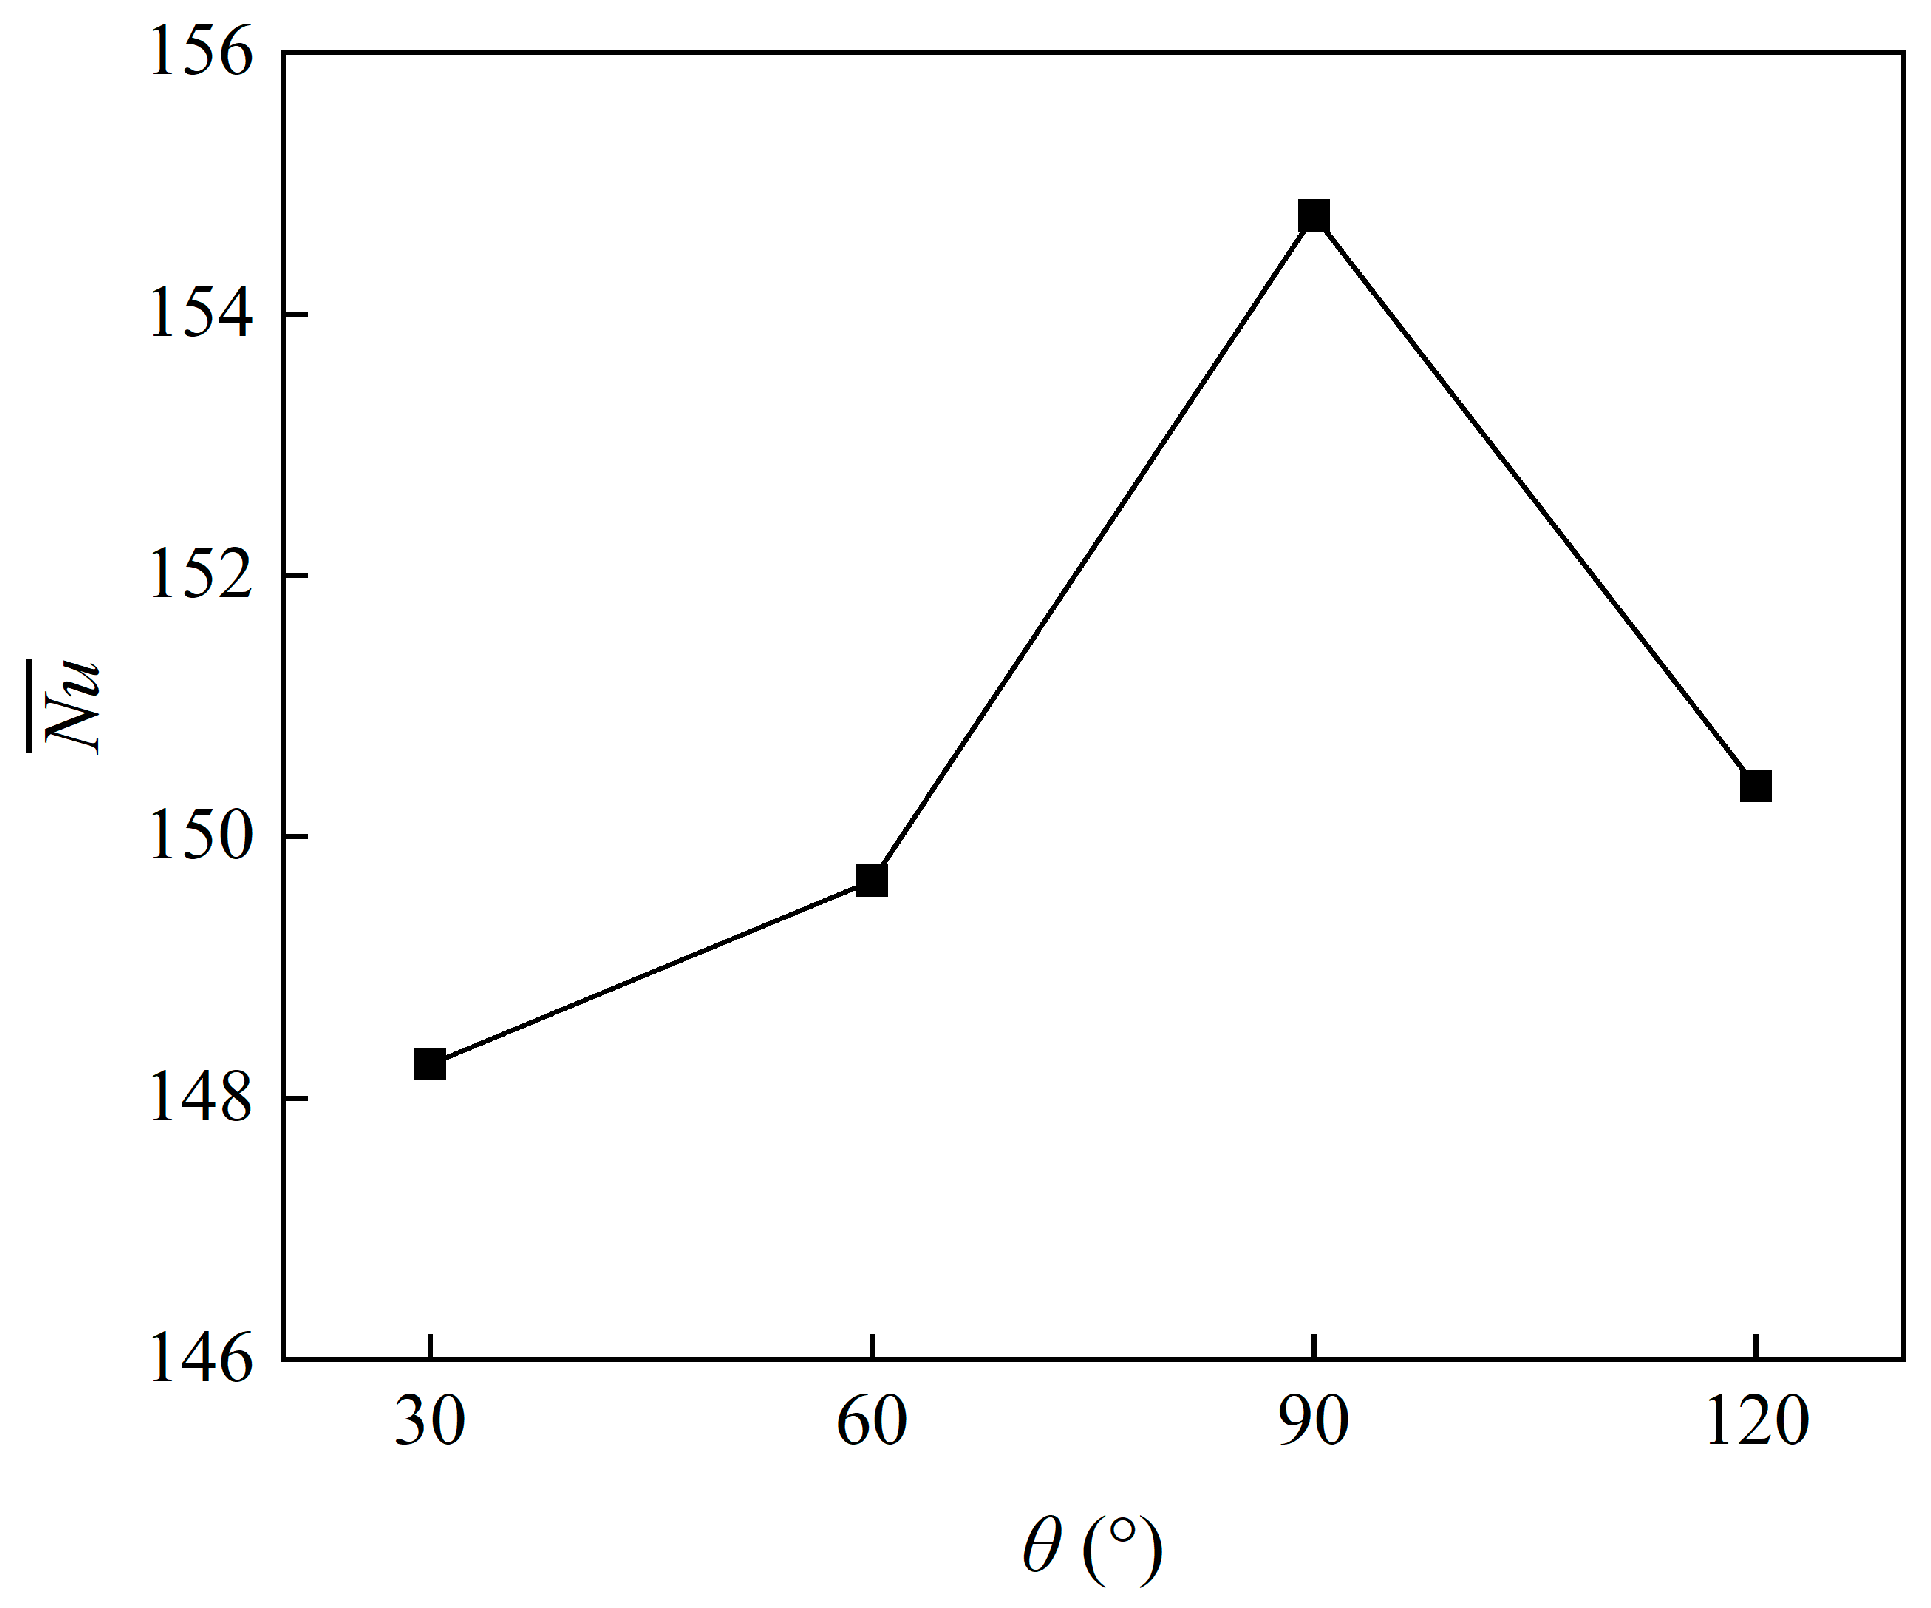
(2)
Based on the simulation calculation of the above parameters, in order to study the influence of different shapes of isosceles triangle fins on the heat transfer performance of a TW, four working conditions with vertex angles of θ = 30°, 60°, 90°, and 120° were selected. It was found that when the HAS was modified with isosceles triangle fins with a vertex angle of 90°, the TW could obtain greater heat transfer capacity. The N u ¯ values of other triangular fin HASs with different vertex angles were 150.39, 148.26, and 148.46, respectively, while the N u ¯ of isosceles triangular fin HAS with vertex angle of 90° was 154.75.
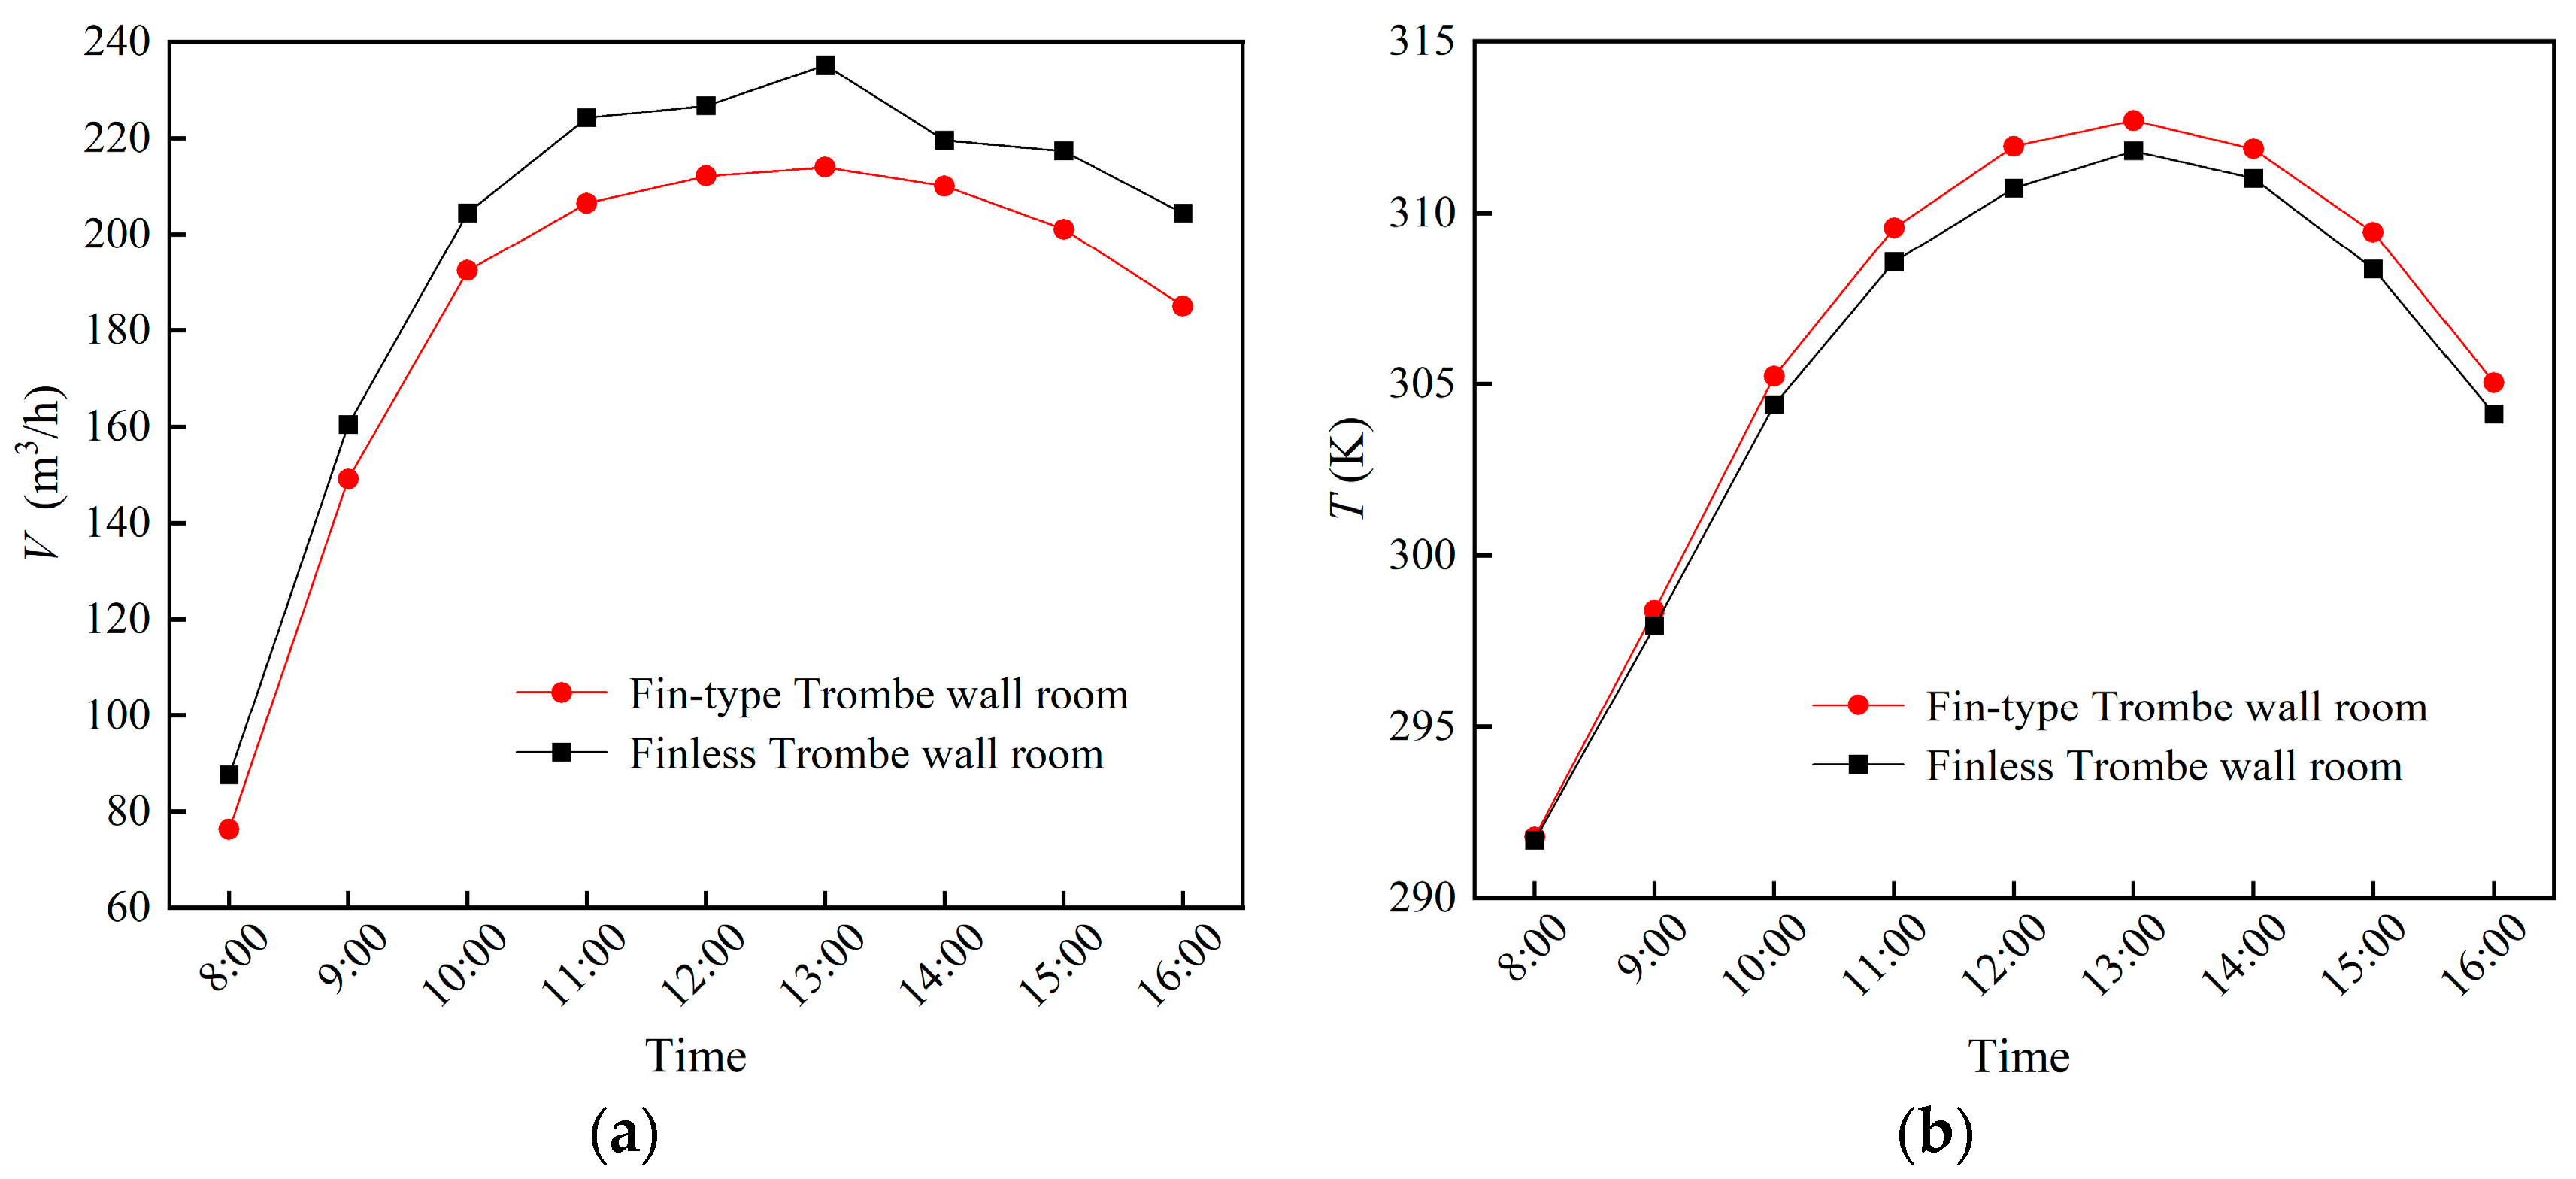
(3)
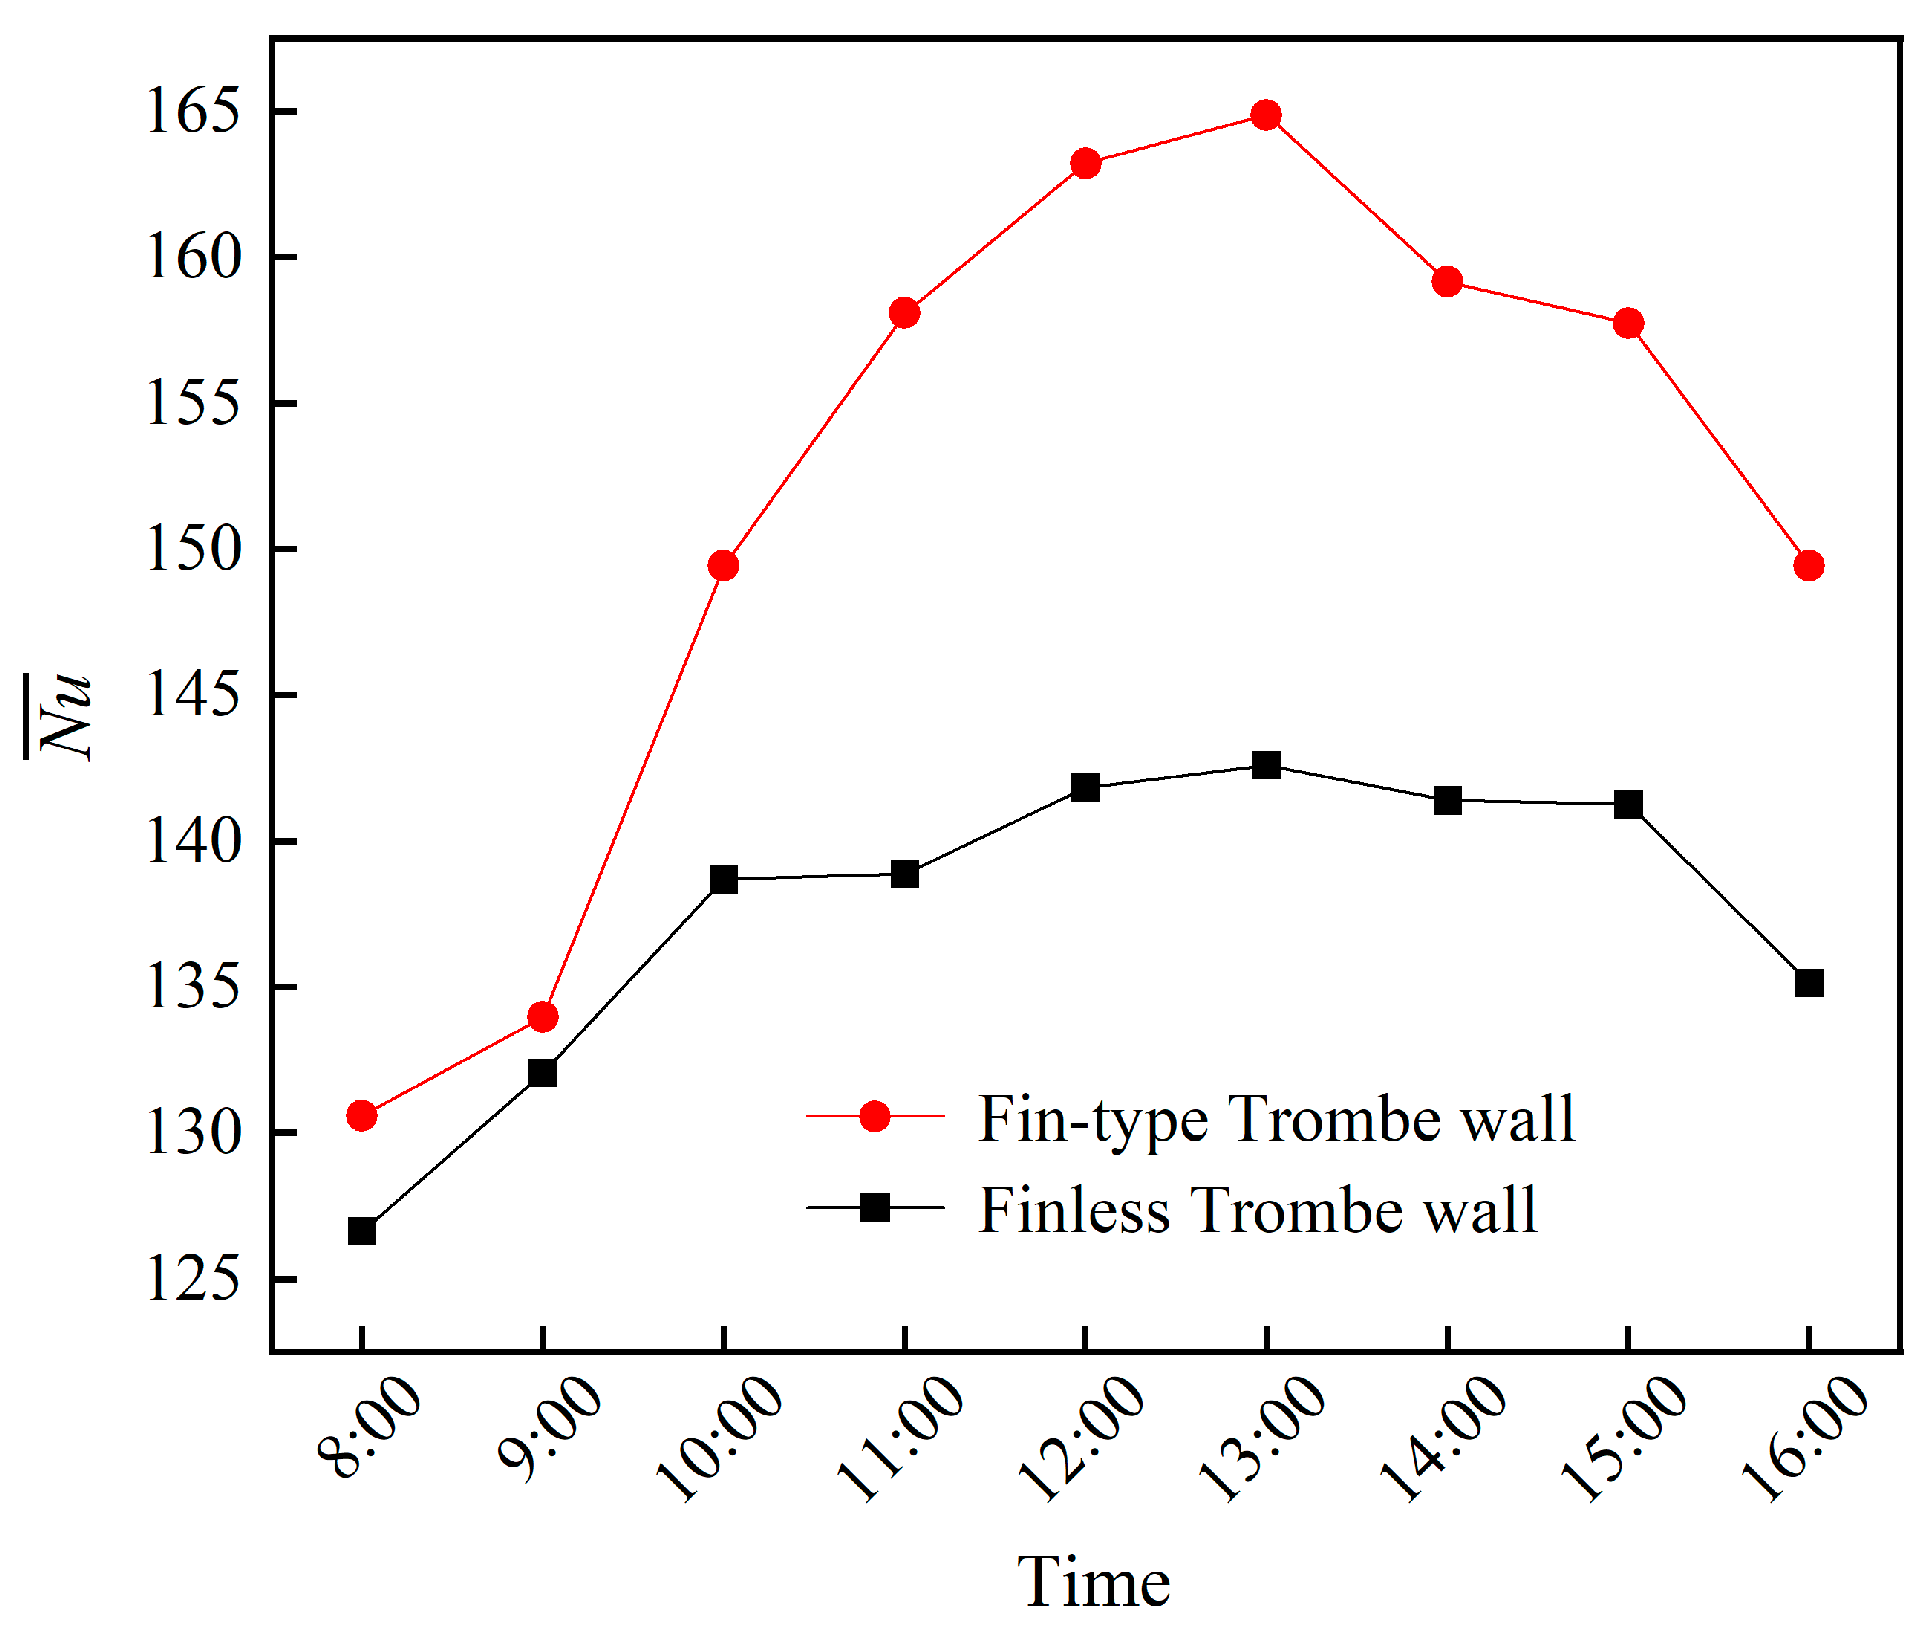
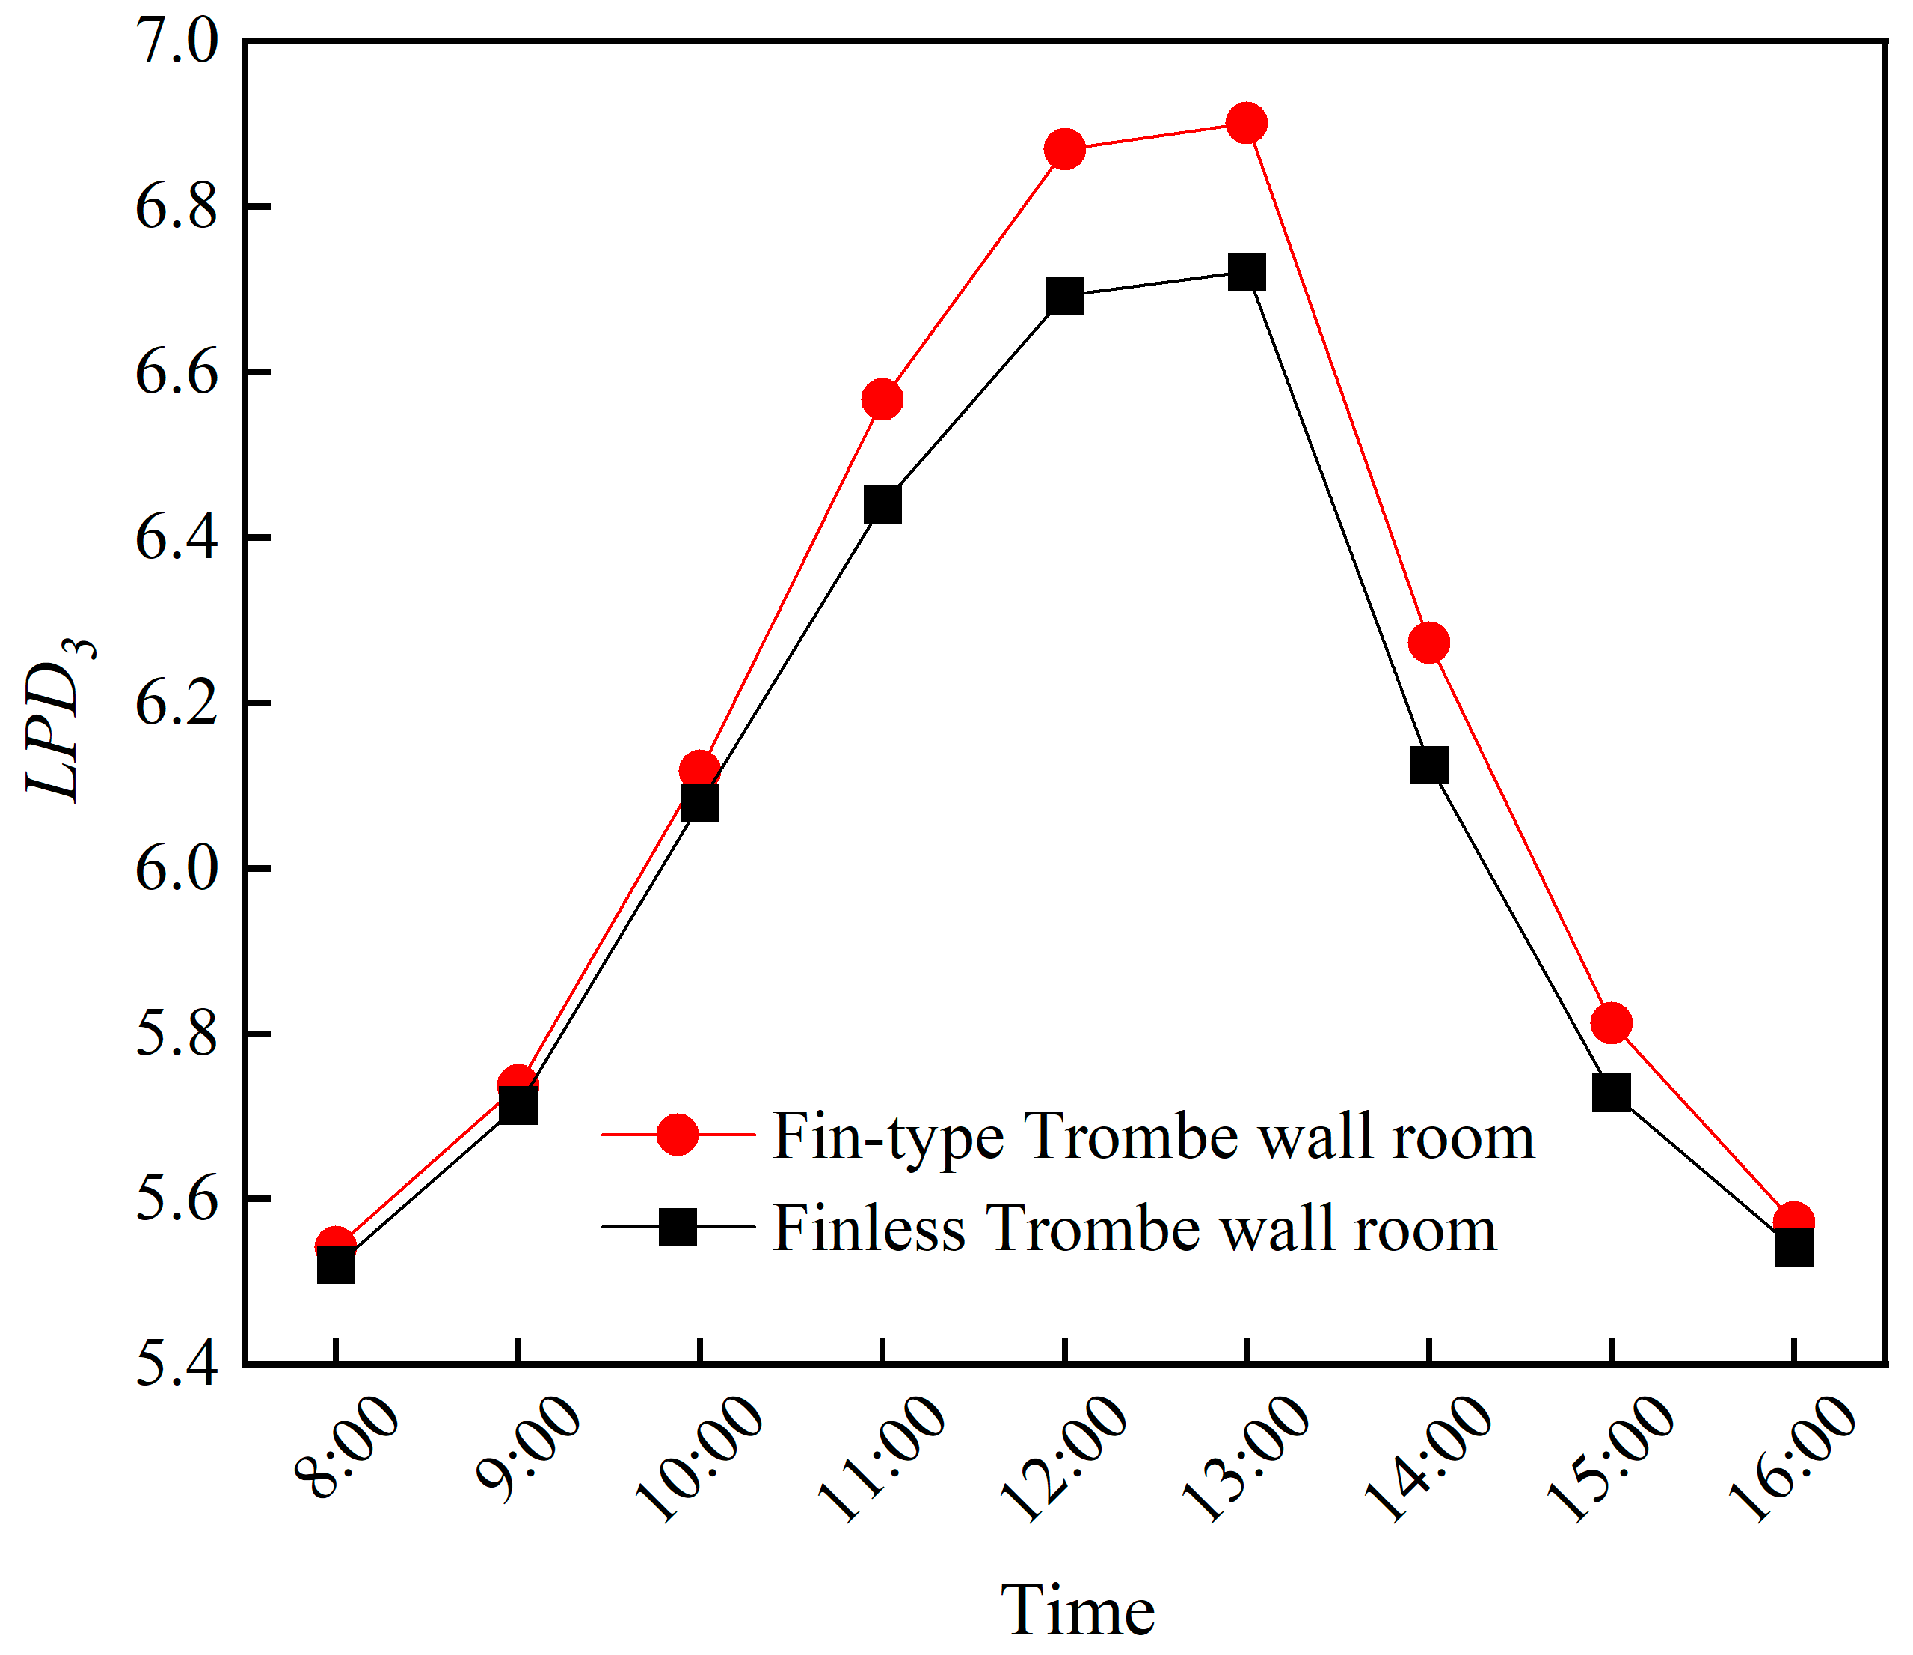
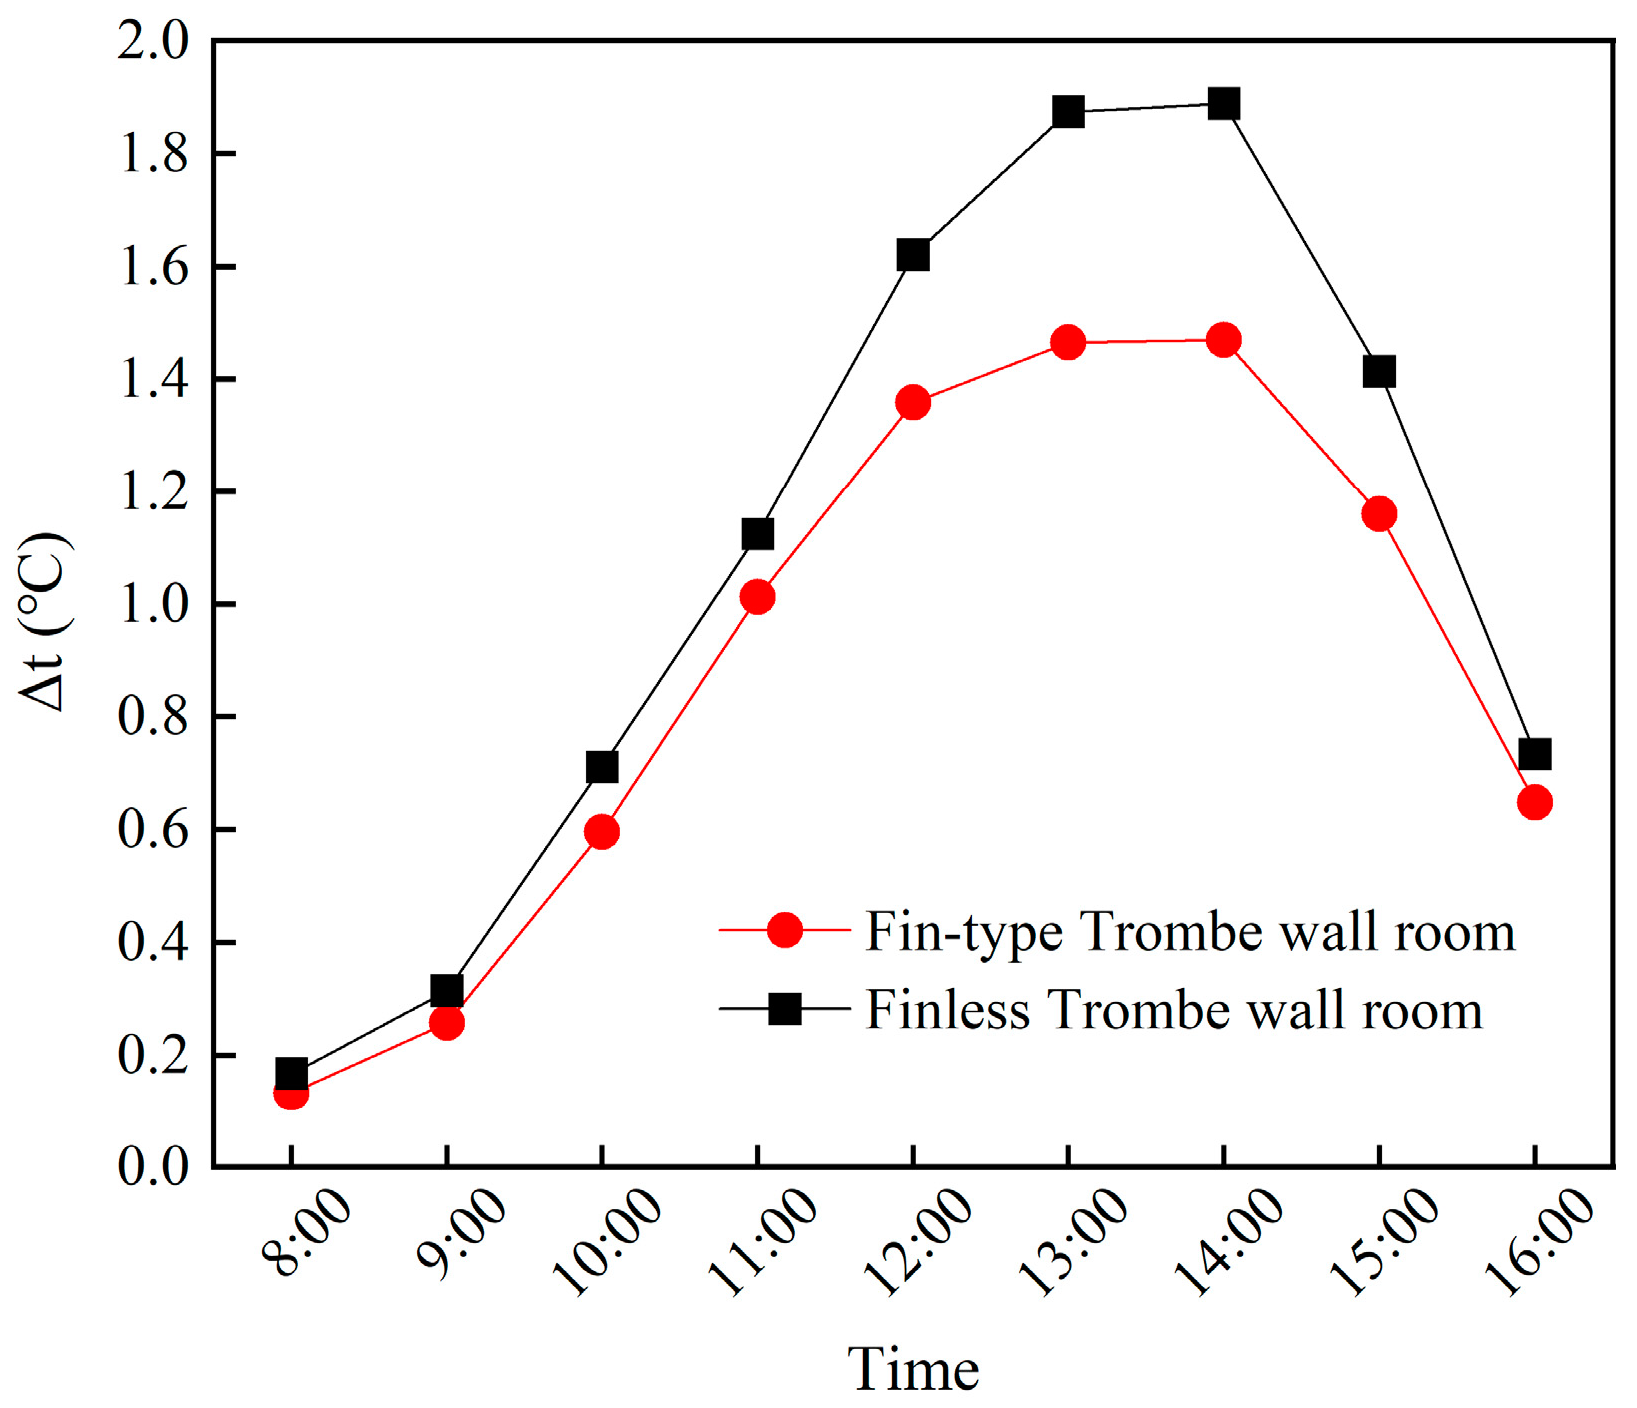
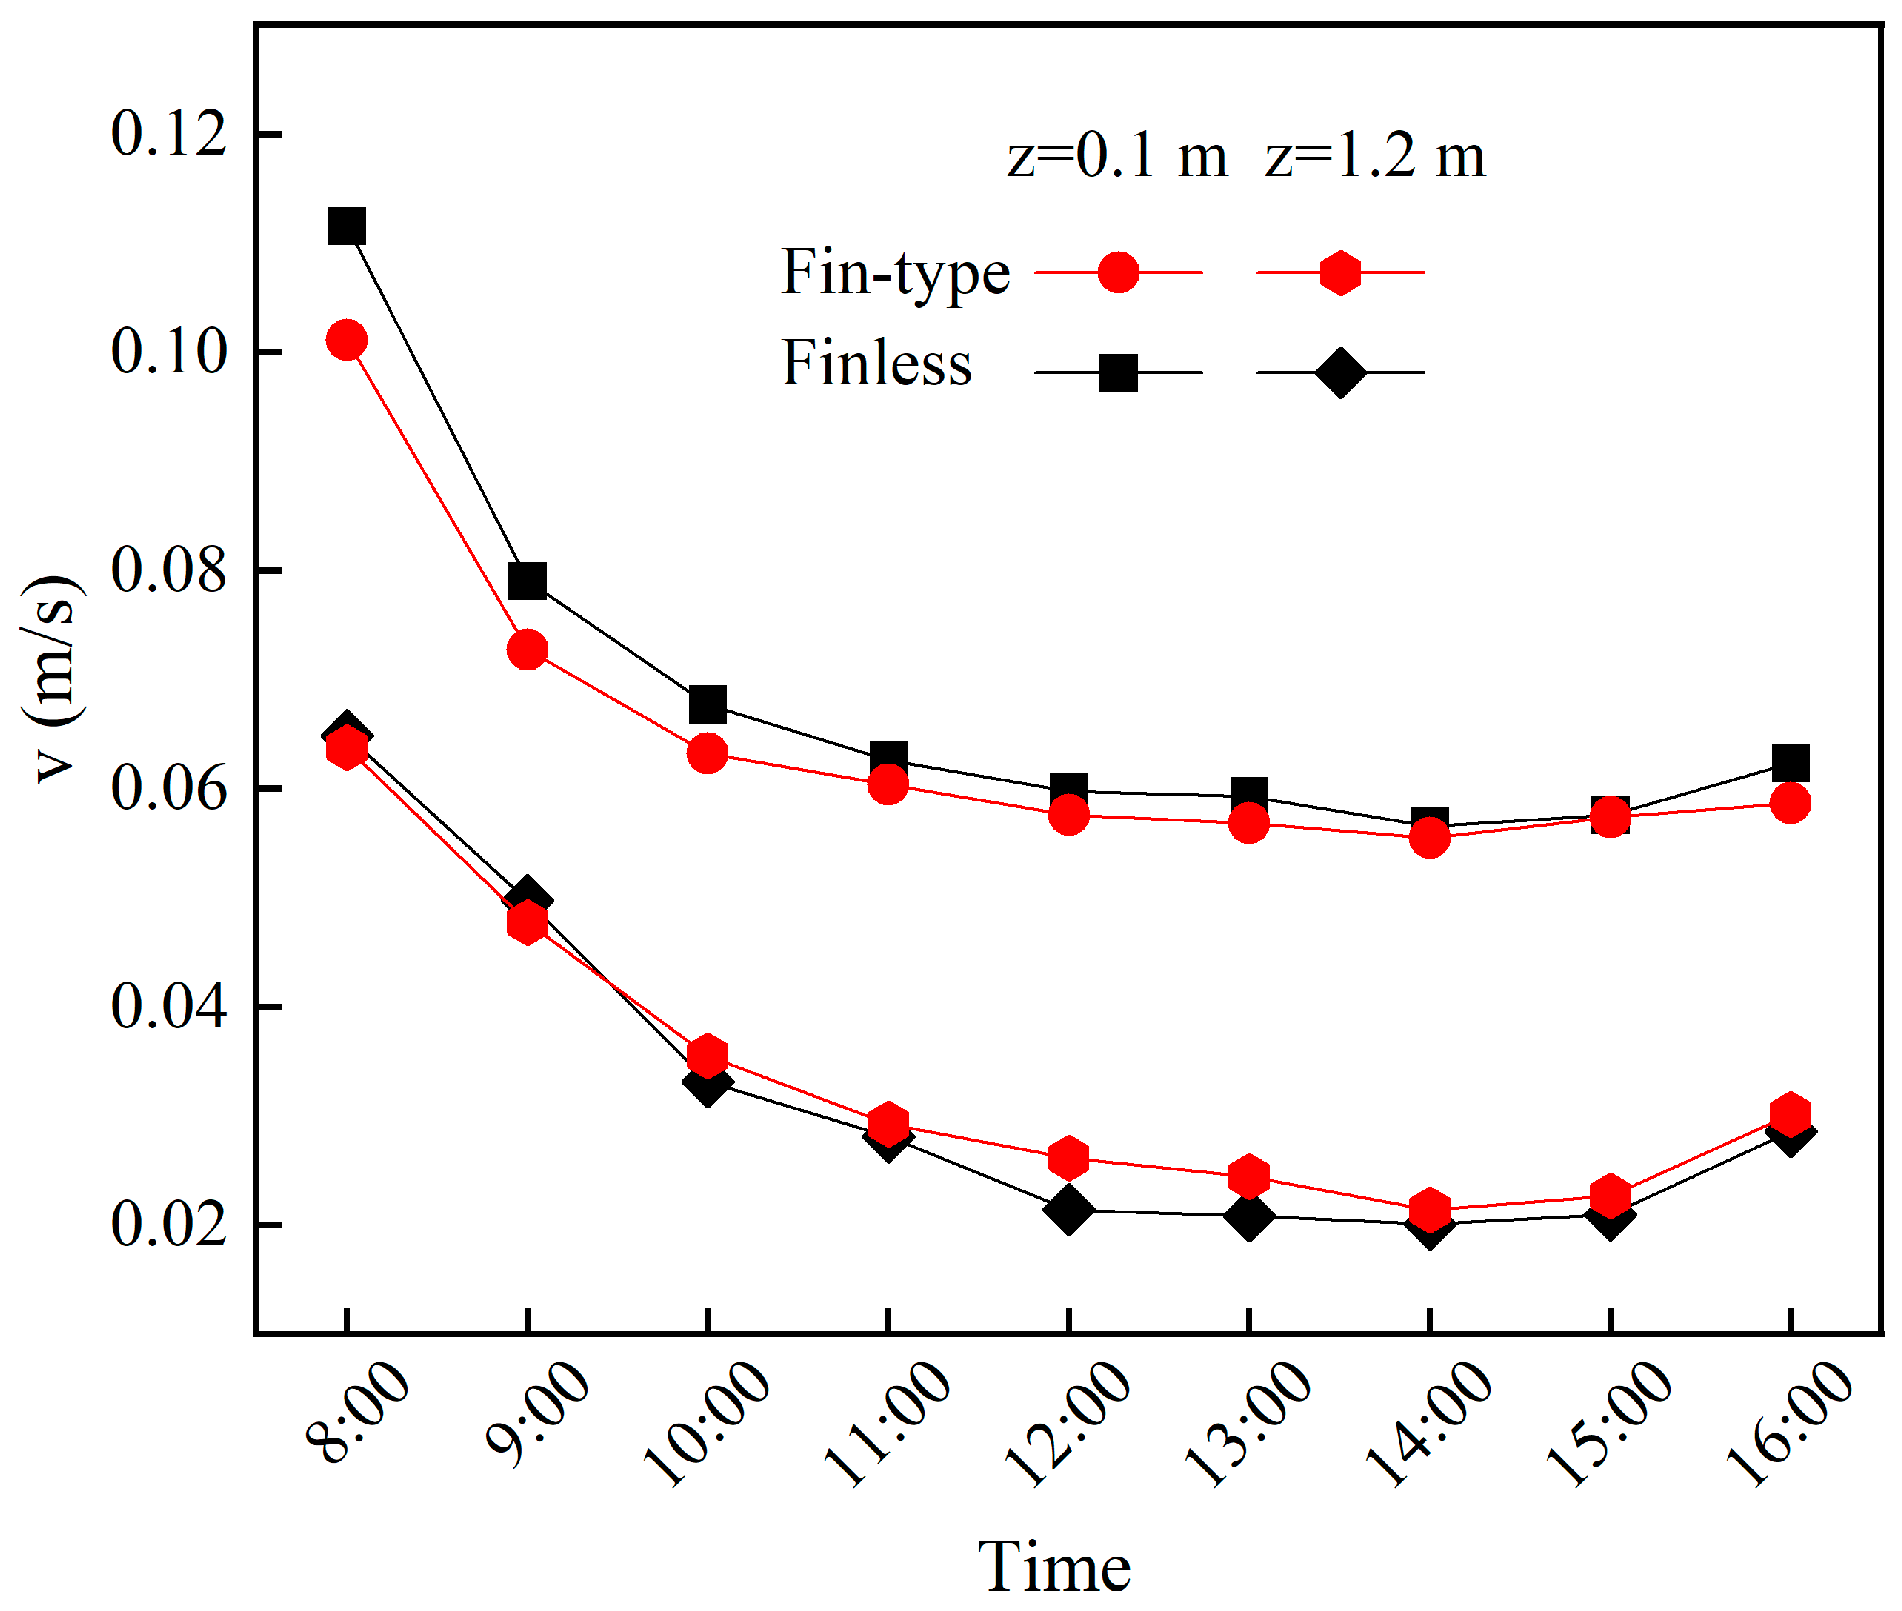
Aiming at obtaining an optimized fin structure and arrangement, the heat transfer performance and room TE of finless and fin-type TWs were simulated from 8:00 to 16:00. It was found that the HAS N u ¯ for the Trombe wall with an isosceles right-angle triangular fin was 3.51% greater than that of the finless TW. Although the PMV-PPD of the fin-type TW room and the non-fin-type TW rooms are not very different, the comfort duration of the fin-type TW room is greater. For the whole period, the LPD3 of the finless TW room and the fin type TW was less than 10%, but the head–foot temperature difference of the fin type TW was less than that of the finless TW room. The wind speed at the head and ankle of the two different-TW-type rooms was less than 0.12 m/s, the air gust sensation was not strong, and the level of thermal comfort was good. This shows that adding fins is beneficial to the improvement of indoor thermal comfort.
(4)
Compared with the ordinary room, the TW room with fins and the TW room without fins had a better energy-saving impact, and the energy-saving rates were 44.63% and 36.38%, respectively. Compared with the energy-saving ratio of the room without a finned TW, the energy savings of the room with a finned TW increased by 8.25%. Adding certain fins can optimize a TW’s heat transfer capacity and improve the indoor TE.
This article can provide guidance for analyzing the integration of solar-powered buildings and achieve the goal of “carbon peak, carbon neutrality”.

Author Contributions

X.Q.: Formal analysis, Methodology, Software, Validation, and Writing—original draft., J.W.: Writing—review and editing. Y.W.: Supervision, Writing—review and editing. All authors have read and agreed to the published version of the manuscript.

Funding

This research was funded by the Natural Science Foundation of Gansu (Grant No. 21JR7RA304), the National Natural Science Foundation of China (Grant No. 51476073 and Grant No. 51266004), Gansu Province Higher Education Industry support plan project (2023CYZC-38) and Fundamental Research Talent Selection Project of Lanzhou Jiaotong University (2022JC48).

Data Availability Statement

The data presented in this study are available on request from the corresponding author. The data are not publicly available due to amount and size of data.

Conflicts of Interest

The authors declare that they have no known competing financial interests or personal relationships that could have appeared to influence the work reported in this paper.

Nomenclature

Aarea, m2
cempirical coefficients
C0blackbody radiative coefficient, W/(m2⋅K4)
Cpspecific heat capacity, kJ/(kg·K)
dfin height, mm
ggravity acceleration, m2/s
Hvertical height, m
hheat transfer coefficient, W/(m2·K)
Isolar radiation intensity, W/m2
kpulsation turbulent kinetic energy
m ˙ mass flow rate, kg/s
NuNusselt number
PrPrandtl number
ppressure, Pa
Qconvective heat supply, W
qheat flux, W/m2
sfront-end distance, m
s1transverse space, mm
s2longitudinal spacing, m
Ttemperature, K
uinterlayer air velocity, m/s
Vambient wind speed, m/s
Greeks
αabsorptivity
βcoefficient of thermal expansion of air, 1/K
εdissipation rate of pulsating kinetic energy
τtransmittance
ηefficiency
θapex angle of fins
λcoefficient of heat conductivity, W/(m⋅K)
νviscosity coefficient, m2/s
ρdensity, kg/m3
Гgeneralized diffusion coefficient
Subscripts
aair
ambambient
bbottom
ddown
ffloor
gglass cover
ththermal
xendothermic surface

References

  1. Dudley, B. BP Statistical Review of World Energy; BP p.l.c.: London, UK, 2022. [Google Scholar]
  2. Navakrishnan, S.; Sivakumar, B.; Senthil, R.; Kumar, R.S. Heating and Cooling Application in Energy Efficient Buildings using Trombe Wall: A Review. J. IOP Conf. Ser. Mater. Sci. Eng. 2021, 1130, 012015. [Google Scholar] [CrossRef]
  3. Yu, B.; He, W.; Li, N.; Wang, L.; Cai, J.; Chen, H.; Ji, J.; Xu, G. Experimental and numerical performance analysis of a TC-Trombe wall. J. Appl. Energy 2017, 206, 70–82. [Google Scholar] [CrossRef]
  4. Yu, B.; Hou, J.; He, W.; Liu, S.; Hu, Z.; Ji, J.; Chen, H.; Xu, G. Study on a high-performance photocatalytic-Trombe wall system for space heating and air purification. J. Appl. Energy 2018, 226, 365–380. [Google Scholar] [CrossRef]
  5. Yu, B.; Yang, J.; He, W.; Qin, M.; Zhao, X.; Chen, H. The performance analysis of a novel hybrid solar gradient utilization photocatalytic-thermal-catalytic-Trombe wall system. J. Energy 2019, 174, 420–435. [Google Scholar] [CrossRef]
  6. Ji, J.; Yi, H.; Pei, G.; Lu, J. Study of PV-Trombe wall installed in a fenestrated room with heat storage. J. Appl. Therm. Eng. 2007, 27, 1507–1515. [Google Scholar] [CrossRef]
  7. Hu, Z.; He, W.; Hu, D.; Lv, S.; Wang, L.; Ji, J.; Chen, H.; Ma, J. Design, construction and performance testing of a PV blind-integrated Trombe wall module. J. Appl. Energy 2017, 203, 643–656. [Google Scholar] [CrossRef]
  8. Lin, Y.; Ji, J.; Zhou, F.; Ma, Y.; Luo, K.; Lu, X. Experimental and numerical study on the performance of a built-middle PV Trombe wall system. J. Build. Energy Effic. 2019, 200, 47–57. [Google Scholar] [CrossRef]
  9. Wu, S.; Xu, L.; Xiao, L. Performance study of a novel multi-functional Trombe wall with air purification, photovoltaic, heating and ventilation. J. Energy Convers. Manag. 2020, 203, 112229. [Google Scholar] [CrossRef]
  10. Long, J.; Yongga, A.; Sun, H. Thermal Insulation Performance of a Trombe Wall Combined with Collector and Reflection Layer in Hot Summer and Cold Winter Zone. J. Energy Build. 2018, 171, 144–154. [Google Scholar] [CrossRef]
  11. Long, J.; Jiang, M.; Lu, J.; Du, A. Vertical temperature distribution characteristics and adjustment methods of a Trombe wall. J. Build. Environ. 2019, 165, 106386. [Google Scholar] [CrossRef]
  12. Stazi, F.; Mastrucci, A.; Perna, C.D. The behaviour of solar walls in residential buildings with different insulation levels: An experimental and numerical study. J. Energy Build. 2012, 47, 217–229. [Google Scholar] [CrossRef]
  13. Kara, Y.A.; Kurnuc, A. Performance of coupled novel triple glass and phase change material wall in the heating season: An experimental study. J. Sol. Energy 2012, 86, 2432–2442. [Google Scholar] [CrossRef]
  14. Pittaluga, M. The electrochromic wall. J. Energy Build. 2013, 66, 49–56. [Google Scholar] [CrossRef]
  15. Zhou, L.; Huo, J.; Zhou, T.; Jin, S. Investigation on the thermal performance of a composite Trombe wall under steady state condition. J. Energy Build. 2020, 214, 109815. [Google Scholar] [CrossRef]
  16. Hu, Z.; Luo, B.; He, W. An experimental investigation of a novel trombe wall with venetian blind structure. J. Energy Procedia 2015, 70, 691–698. [Google Scholar] [CrossRef]
  17. Lei, Y.; Gu, Y.; Song, C.; Wang, F. Performance of solar ventilation wall with built-in grille induced channel. J. Tongji Univ. Nat. Sci. Ed. 2016, 44, 1938–1942+1968. [Google Scholar]
  18. Corasaniti, S.; Manni, L.; Russo, F.; Gori, F. Numerical simulation of modified Trombe-Michel Walls with exergy and energy analysis. J. Int. Commun. Heat Mass 2017, 88, 269–276. [Google Scholar] [CrossRef]
  19. Gracia, A.D.; Navarro, L.; Castell, A.; Pardo, A.R.; Alvarez, S.; Cabeza, L.F. Solar absorption in a ventilated facade with PCM. Experimental results. J. Energy Procedia 2012, 30, 986–994. [Google Scholar] [CrossRef]
  20. Leang, E.; Tittelein, P.; Zalewski, L.; Lassue, S. Numerical study of a composite Trombe solar wall integrating microencapsulated PCM. J. Energy Procedia 2017, 122, 1009–1014. [Google Scholar] [CrossRef]
  21. Duan, S.; Wang, L.; Zhao, Z.; Zhang, C. Experimental study on thermal performance of an integrated PCM Trombe wall. J. Renew. Energy 2021, 163, 1932–1941. [Google Scholar] [CrossRef]
  22. Benkaddour, A.; Faraji, M.; Faraji, H. Numerical study of the thermal energy storage behaviour of a novel composite PCM/Concrete wall integrated solar collector. J. Mater. Today Proc. 2020, 30, 905–908. [Google Scholar] [CrossRef]
  23. Faraji, H.; Yıldız, Ç.; Arshad, A.; Arıcı, M.; Choukairy, K.; El Alami, M. Passive thermal management strategy for cooling multiple portable electronic components: Hybrid nanoparticles enhanced phase change materials as an innovative solution. J. Energy Storage 2023, 70, 108087. [Google Scholar] [CrossRef]
  24. Consuegra, F.M.; Alonso, C.; Perez, G.; Frutos, B.; Guerrero, A.; Oteiza, I. Design, optimization and construction of a prototype for a thermochromic Trombe wall. J. Adv. Build. Energy Res. 2019, 15, 161–178. [Google Scholar] [CrossRef]
  25. Ahmadi, M.; Mostafavi, G.; Bahrami, M. Natural convection from rectangular interrupted fins. Int. J. Therm. Sci. 2014, 82, 62–71. [Google Scholar] [CrossRef]
  26. Hosseini, S.S.; Ramiar, A.; Ranjbar, A.A. Numerical investigation of rectangular fin geometry effect on solar chimney. J. Energy Build. 2017, 155, 296–307. [Google Scholar] [CrossRef]
  27. Rabani, M.; Rabani, M. Heating performance enhancement of a new design trombe wall using rectangular thermal fin arrays: An experimental approach. J. Energy Storage 2019, 24, 100796. [Google Scholar] [CrossRef]
  28. Wu, S.; Yan, R.; Xiao, L. Numerically predicting the effect of fin on solar Trombe wall performance. J. Sustain. Energy Technol. 2022, 52, 102012. [Google Scholar] [CrossRef]
  29. Wang, Y.; Chen, X.; Qi, X.; Zhou, J. Numerical study on the effect of optimizing the Trombe wall structure with built-in fins on improving building energy efficiency in severe cold region. J. Renew. Energy 2024, 222, 119856. [Google Scholar] [CrossRef]
  30. DB62/T 3151-2018; Design Standard for Energy Efficiency (75%) of Residential Buildings in Severe Cold Regions. Local Standards of Gansu Province: Lanzhou, China, 2018.
  31. Liu, J. Building Physics, 4th ed.; China Architecture & Building Press: Beijing, China, 2009. [Google Scholar]
  32. Wang, Y.; He, T.; Hu, J.; Tian, H.; Zhao, X. Influence of built-in fin parameters on the flow and heat transfer performance in enclosed cavity. J. Sci. Technol. Eng. 2022, 22, 11911–11917. [Google Scholar]
  33. Rabani, M.; Vali, K.; Dehghan, A.A.; Faghih, A.K. Experimental study of the heating performance of a Trombe wall with a new design. J. Sol. Energy 2015, 118, 359–374. [Google Scholar] [CrossRef]
  34. CABR. Technical Specification for Floor Radiant Heating; China Architecture & Building Press: Beijing, China, 2004. [Google Scholar]
  35. Zhu, X. Built Environment, 4th ed.; China Architecture & Building Press: Beijing, China, 2016. [Google Scholar]
Figure 1. The room’s configuration, featuring a built-in finned TW: (a) physical model; (b) heat transfer process.
Energies 17 01874 g001aEnergies 17 01874 g001b
Figure 2. Schematic diagram of building envelope.
Energies 17 01874 g002
Figure 3. Diagram of triangular fins arranged on the HAS of the Trombe wall.
Energies 17 01874 g003
Figure 4. Grid independence test.
Energies 17 01874 g004
Figure 5. Comparison of numerical results with experimental results: (a) air channel velocity error bar of TW; (b) upper vent temperature error bar of TW.
Energies 17 01874 g005
Figure 6. Velocity and temperature contours corresponding to different fin heights (x = 1.9 m): (a) velocity contour; (b) temperature contour.
Energies 17 01874 g006
Figure 7. Effect of fin height on N u ¯ of HAS (s1 = 0.250 m, s2 = 0.533 m).
Energies 17 01874 g007
Figure 8. Velocity and temperature contours corresponding to different fin transverse spacings (y = 4.425 m): (a) velocity contour; (b) temperature contour.
Energies 17 01874 g008aEnergies 17 01874 g008b
Figure 9. Effect of fin transverse spacing on N u ¯ of HAS (d = 20 mm, s2 =0.533 m).
Energies 17 01874 g009
Figure 10. Velocity and temperature contours corresponding to different fin longitudinal spacings (y = 4.425 m): (a) velocity contour; (b) temperature contour.
Energies 17 01874 g010
Figure 11. Effect of fin longitudinal spacing on N u ¯ of HAS (d = 20 mm, s1 = 0.200 m).
Energies 17 01874 g011
Figure 12. Local velocity contours and temperature contours correspond to triangular fins with different apex angles (x = 1.9 m): (a) velocity contour; (b) temperature contour.
Energies 17 01874 g012aEnergies 17 01874 g012b
Figure 13. Effect of fin apex angle on N u ¯ of HAS (d = 20 mm, s1 = 0.200 m, and s2 = 0.533 m).
Energies 17 01874 g013
Figure 14. Comparison of upper vent ventilation rate and temperature at different times: (a) the ventilation rate of the upper vent; (b) the temperature of the upper vent.
Energies 17 01874 g014
Figure 15. Velocity (left) and temperature (right) cloud images of the longitudinal section of the finless Trombe wall at different times (x = 1.90 m): (a) 9:00; (b) 11:00; (c) 13:00; (d) 15:00.
Energies 17 01874 g015aEnergies 17 01874 g015b
Figure 16. Velocity (left) and temperature (right) cloud images of the longitudinal section of the fin-type Trombe wall at different times (x = 1.90 m): (a) 9:00; (b) 11:00; (c) 13:00; (d) 15:00.
Energies 17 01874 g016aEnergies 17 01874 g016b
Figure 17. Comparison of N u ¯ changes of the HAS at distinct times.
Energies 17 01874 g017
Figure 18. Convective heat supply and convective heat supply efficiency at different times.
Energies 17 01874 g018
Figure 19. Comparison of the average room temperature at different times.
Energies 17 01874 g019
Figure 20. Comparison of room PMV at different times.
Energies 17 01874 g020
Figure 21. Comparison of room PPD at different times.
Energies 17 01874 g021
Figure 22. Comparison of room LPD3 at different times.
Energies 17 01874 g022
Figure 23. Comparison of head–foot temperature difference while in a sitting posture in the activity area of the rooms at different times.
Energies 17 01874 g023
Figure 24. Comparison of local wind speed in the rooms at different times.
Energies 17 01874 g024
Table 1. Thermal performance parameters of related materials.
Material NamesDensity
ρ (kg/m3)
Specific Heat Capacity
c [kJ/(kg·K)]
Coefficient of Heat Conductivity
λ [W/(m·K)]
Inorganic insulation mortar6001.050.18
Steel-reinforced concrete24000.841.54
Rigid polyurethane foam451.720.025
Glass25000.840.76
Fin89540.384398
Table 2. The building envelope’s thermal boundary conditions.
8:009:0010:0011:0012:0013:0014:0015:0016:00
East wall/(K)289.87289.87289.86289.86289.86289.86289.87289.88289.89
South wall/(K)289.94289.93289.93289.92289.92289.92289.93289.94289.96
West wall/(K)289.88289.87289.87289.86289.86289.86289.86289.86289.87
North wall/(K)289.85289.84289.84289.83289.83289.83289.83289.84289.85
Floor thermal density/(W/m2)39.5237.3032.1126.7523.6824.4623.2722.8623.79
Table 3. The impacts of in-line and staggered arrangements of fins on the TW’s thermal performance.
Research ObjectArrangementVentilation of the Upper Vent (m3/h)Temperature of the Upper Vent (K) N u ¯
Fins on the HAS of Trombe wallIn-line201.33305.87154.75
Staggered186.11305.84147.79
Table 4. PMV thermal sensation scale.
Thermal SensationVery HotHotA Little HotNeutralityA Little ColdColdVery Cold
PMV+3+2+10−1−2−3
Table 5. Comparison of energy saving rates (ESFs) of daytime heat supply in different rooms.
Room TypeThermal Load (MJ)South Window Heat
(MJ)
Convective Heat Supply
(MJ)
Floor Active Heat Supply
(MJ)
ESF
(%)
Ordinary room22.610.18/22.43/
Finless Trombe wall room22.610.188.1614.2736.38
Fin-type Trombe wall room22.610.1810.0112.4244.63
Disclaimer/Publisher’s Note: The statements, opinions and data contained in all publications are solely those of the individual author(s) and contributor(s) and not of MDPI and/or the editor(s). MDPI and/or the editor(s) disclaim responsibility for any injury to people or property resulting from any ideas, methods, instructions or products referred to in the content.

