Article

An Experimental Investigation into the Role of an In Situ Microemulsion for Enhancing Oil Recovery in Tight Formations

1
Engineering Technology Research Institute, Xinjiang Oilfield Company, No. 87, Shengli Road, Karamay 834000, China
2
State Key Laboratory of Petroleum Resources and Prospecting, China University of Petroleum (Beijing), Beijing 102249, China
*
Author to whom correspondence should be addressed.
Energies 2024, 17(8), 1879; https://doi.org/10.3390/en17081879
Submission received: 27 February 2024 / Revised: 31 March 2024 / Accepted: 8 April 2024 / Published: 15 April 2024

Abstract

:
Surfactant huff-n-puff (HnP) has been shown to be an effective protocol to improve oil recovery in tight and ultratight reservoirs. The success of surfactant HnP for enhanced oil recovery (EOR) process depends on the efficiency of the designed chemical formula, as the formation of an in situ microemulsion by surfactant injection is considered to be the most desirable condition for achieving an ultra-low interfacial tension during the HnP process. In this work, we conducted experimental studies on the mechanism of in situ microemulsion EOR in the Mahu tight oil reservoir. Salinity scan experiments were carried out to compare different surfactants with crude oil from the Mahu reservoir, starting with the assessment of surfactant micellar solutions for their ability to form microemulsions with Mahu crude oil and examining the interfacial characteristics. Subsequently, detailed micromodels representing millimeter-scale fractures, micron-scale pores, and nano-scale channels were utilized to study the imbibition and flowback of various surfactant micellar solutions. Observations of the in situ microemulsion system revealed the mechanisms behind the enhanced oil recovery, which was the emulsification’s near-miscibility effect leading to microemulsion formation and its performance under low-interfacial-tension conditions. During the injection process, notable improvements in the micro-scale pore throat heterogeneity were observed, which improved the pore fluid mobility. The flowback phase improved the channeling between the different media, promoting a uniform movement of the oil–water interface and aiding in the recovery of a significant amount of the oil phase permeability.

1. Introduction

The worldwide demand for oil and gas continues to rise, positioning tight oil as a key player in the current economic and technological context. The Mahu tight conglomerate oil field in the Junggar Basin, with its vast reserves estimated at 10 billion tons [1,2,3], is a prime example of this potential. The Baikouquan Formation, acting as the main oil source, utilizes horizontal drilling and hydraulic fracturing to create a complex seepage network of tight matrix, natural, and artificial fractures [4,5,6,7]. Yet, advancing stages of development reveal challenges such as inadequate fracture development, inefficient injection–production dynamics, and water channeling issues in well-fractured reservoirs [8,9,10]. Addressing the unique drainage patterns in tight reservoirs and finding effective oil–water displacement strategies between fractures and matrix are crucial for improving recovery rates in such environments. In situ microemulsion systems significantly boost imbibition efficiency in tight oil reservoirs, outshining traditional surfactant chemical solutions with their superior performance. This method diverges from standard capillary imbibition by utilizing surfactant micelles to achieve low interfacial tension [11]. More and more scholars have been studying the impact of injecting different media on the recovery efficiency of oil reservoirs. Al Mishaal [12] and Tajik [13], respectively, improved the recovery rate of heavy crude oil by synthesizing molybdenum-based catalysts and evaluating the role of ligand structures in the catalysts. Chandio [14] evaluated the effect of nanofluids on enhancing oil recovery under experimental conditions, demonstrating the potential of nanotechnology in improving the recovery efficiency of tight oil reservoirs. Bello [15] focused on how CO2 foam technology enhances reservoir recovery by improving fluid mobility within the reservoir and reducing CO2 channeling. Wang [16] explored, through experimental simulation and field testing, how different profile control materials and thermal recovery techniques (such as steam injection) can significantly enhance reservoir permeability and recovery efficiency. Zhang [17] investigated the EOR effects of different types of surfactants in tight oil reservoirs through imbibition and displacement experiments, emphasizing the importance of selecting appropriate types of surfactants in EOR applications for tight oil reservoirs. Research into this application has been extensive since the 1970s, with notable contributions from scholars such as Zhao [18], who examined surfactants from leading companies like BASF and Shell, developing surfactant systems for microemulsions with specific crude oils. More recently, researchers like Yin et al. [19] and Hou et al. [20] have focused on enhancing oil recovery with these solutions, marking significant progress in the field. Institutions like the Sinopec Shanghai Institute of Chemical Industry and the Exploration Institute of Daqing Oilfield, among others [21], have meticulously developed surfactant solutions for local crude types. These efforts, alongside pilot studies, have been pivotal in advancing this technology. Researchers from UT-Austin [22,23] have notably enhanced the core imbibition efficiency by 30–40% using an ultra-low-interfacial-tension microemulsion system compared to traditional surfactants. Furthermore, Yu et al. [24] introduced a novel visual model for microemulsion imbibition, highlighting gravity’s key role in these systems under ultra-low-interfacial-tension conditions. Li et al. [25] used a triple media micromodel to explore how the microemulsion system aids in drainage, showing that microemulsions formed from surfactant micelle solutions and crude oil significantly lower flow resistance. Despite the advancements, China faces challenges due to limited field testing and unresolved issues. This study focuses on salinity scans to evaluate various surfactants and develop tailored in situ microemulsion systems, incorporating a detailed pore–throat micromodel for Mahu crude oil. Through microfluidic experiments and simulations, this paper aims to explain the in situ microemulsion mechanism, facilitating more effective tight oil reservoir development. A micromodel with a multi-level pore–throat system was created to study the pore–throat structures found in tight oil reservoirs. Microfluidic experiments were conducted involving imbibition, injection, and flowback to evaluate various surfactants and in situ microemulsion formulations suitable for Mahu crude oil. Additionally, simulations were performed to analyze the fluid invasion and flowback processes during the huff-n-puff operation, aiming to reveal the mechanisms of the in situ microemulsion system. Ultimately, this approach led to the efficient development of tight oil reservoirs.

2. Construction of Microemulsion System

2.1. Materials

The oil utilized in these experiments originated from dehydrated crude oil extracted from the Baikouquan Formation of the Mahu tight conglomerate reservoir in Xinjiang. Its viscosity measured approximately 1.1 mPa∙s at the reservoir temperature (86 °C). Among the surfactants employed were internal olefin sulfonate surfactants (S13B) sourced from the Stepan Company. Extended surfactants, specifically C12PO15S, AEO-10PS, AEO-15PS, C13PO10S, and C8P10E5C, were acquired from the Sasol (Nanjing, China) Chemical Company. Inorganic salts and n-butanol were obtained from Sinopharm Chemical Reagent Co., Ltd., Shanghai, China. The experimental water comprised deionized water and simulated stratum water derived from Ma2 Baikouquan. The composition of the stratum water is detailed in Table 1.

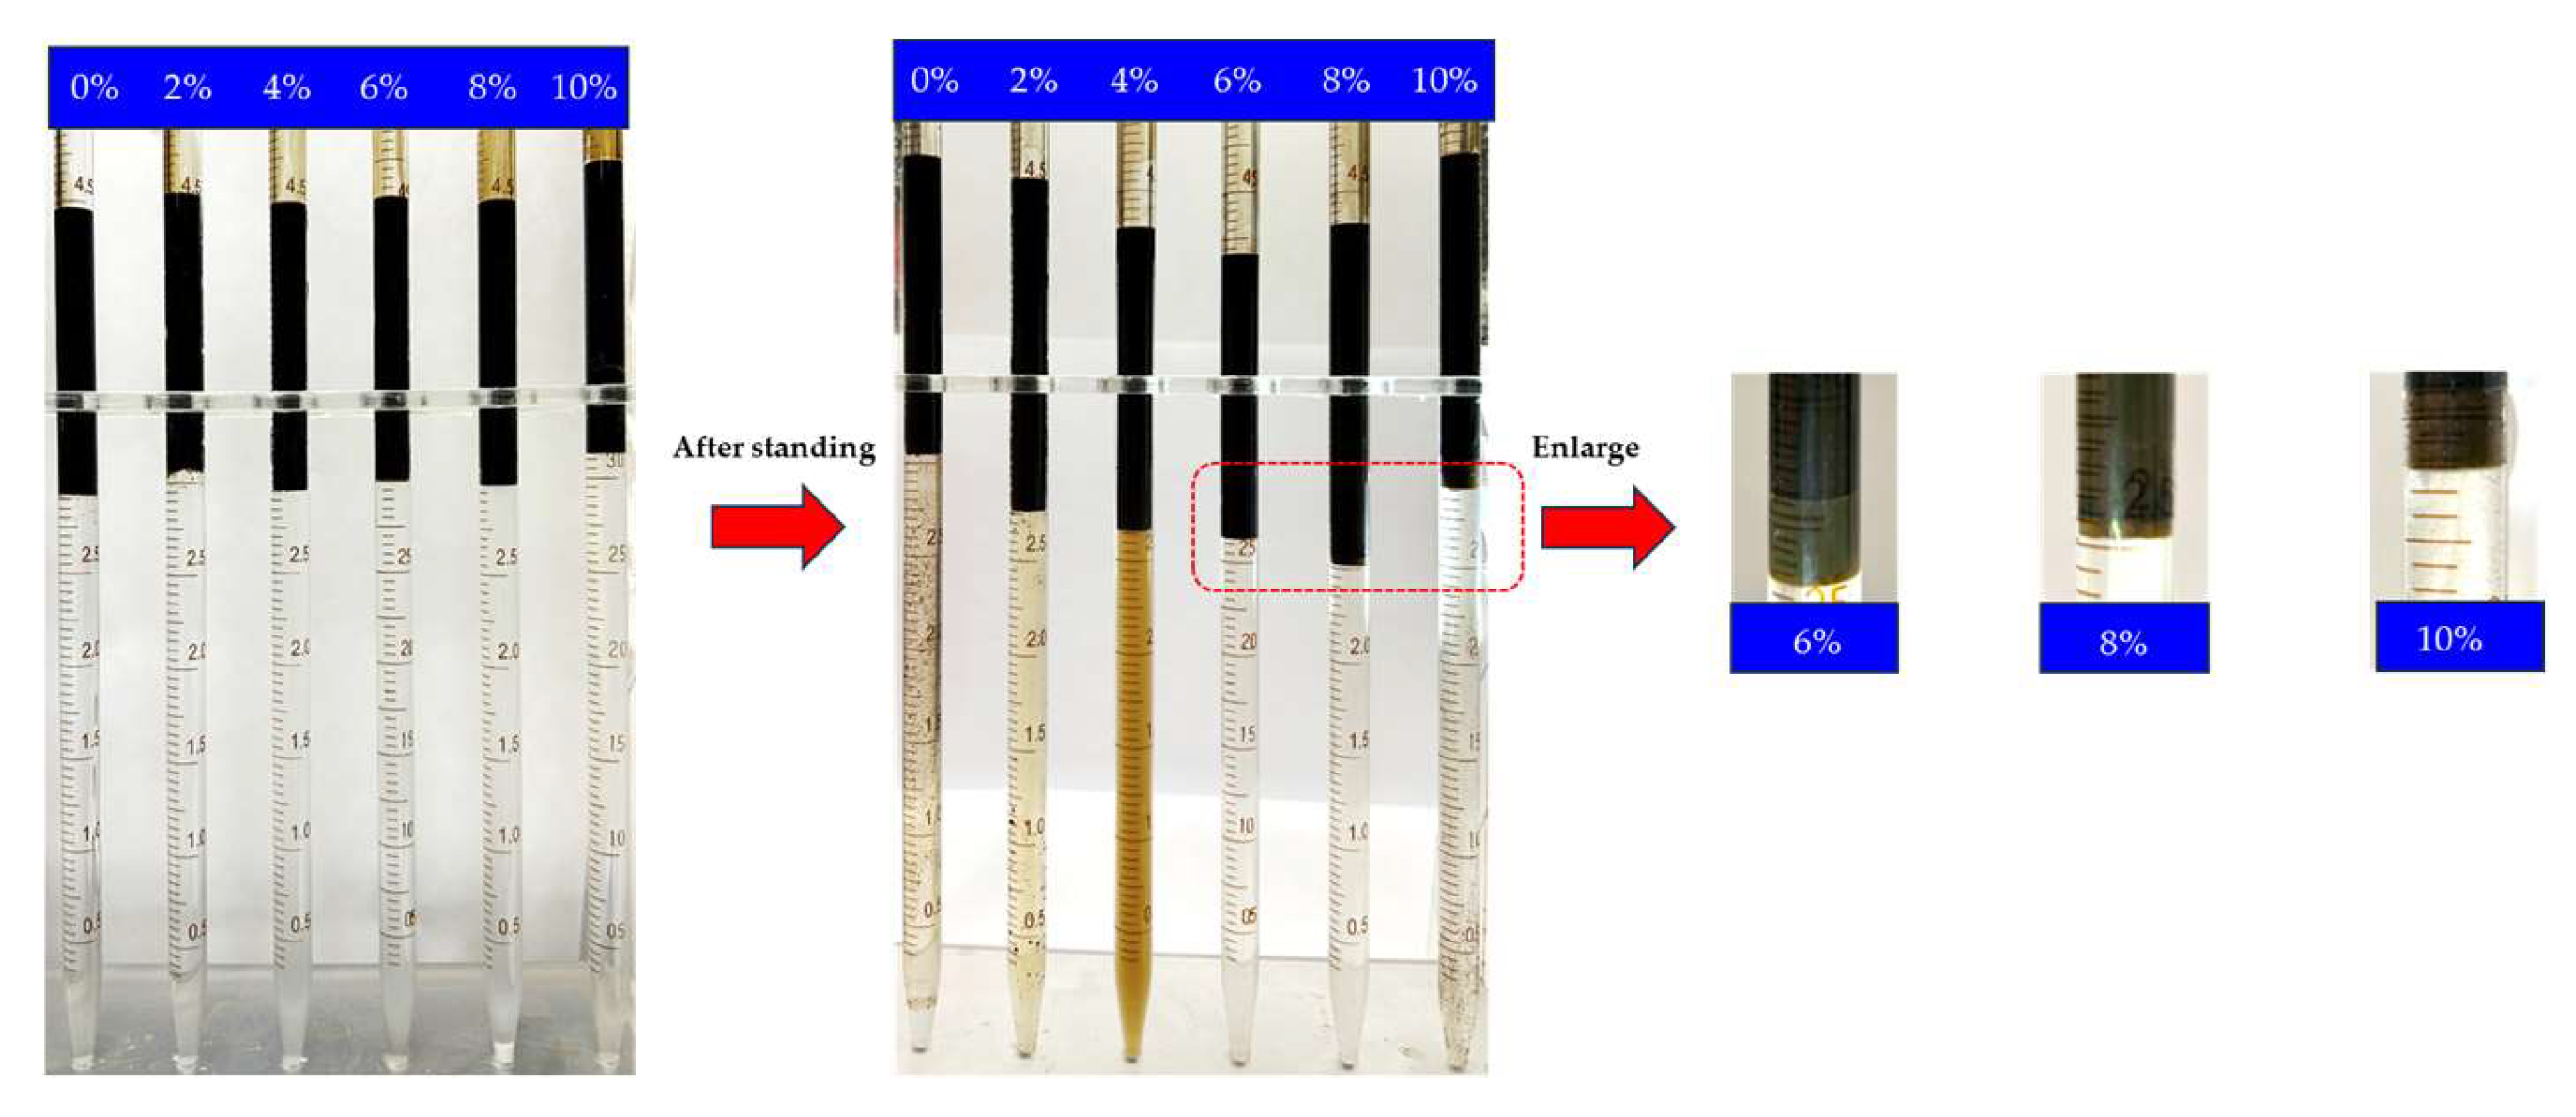
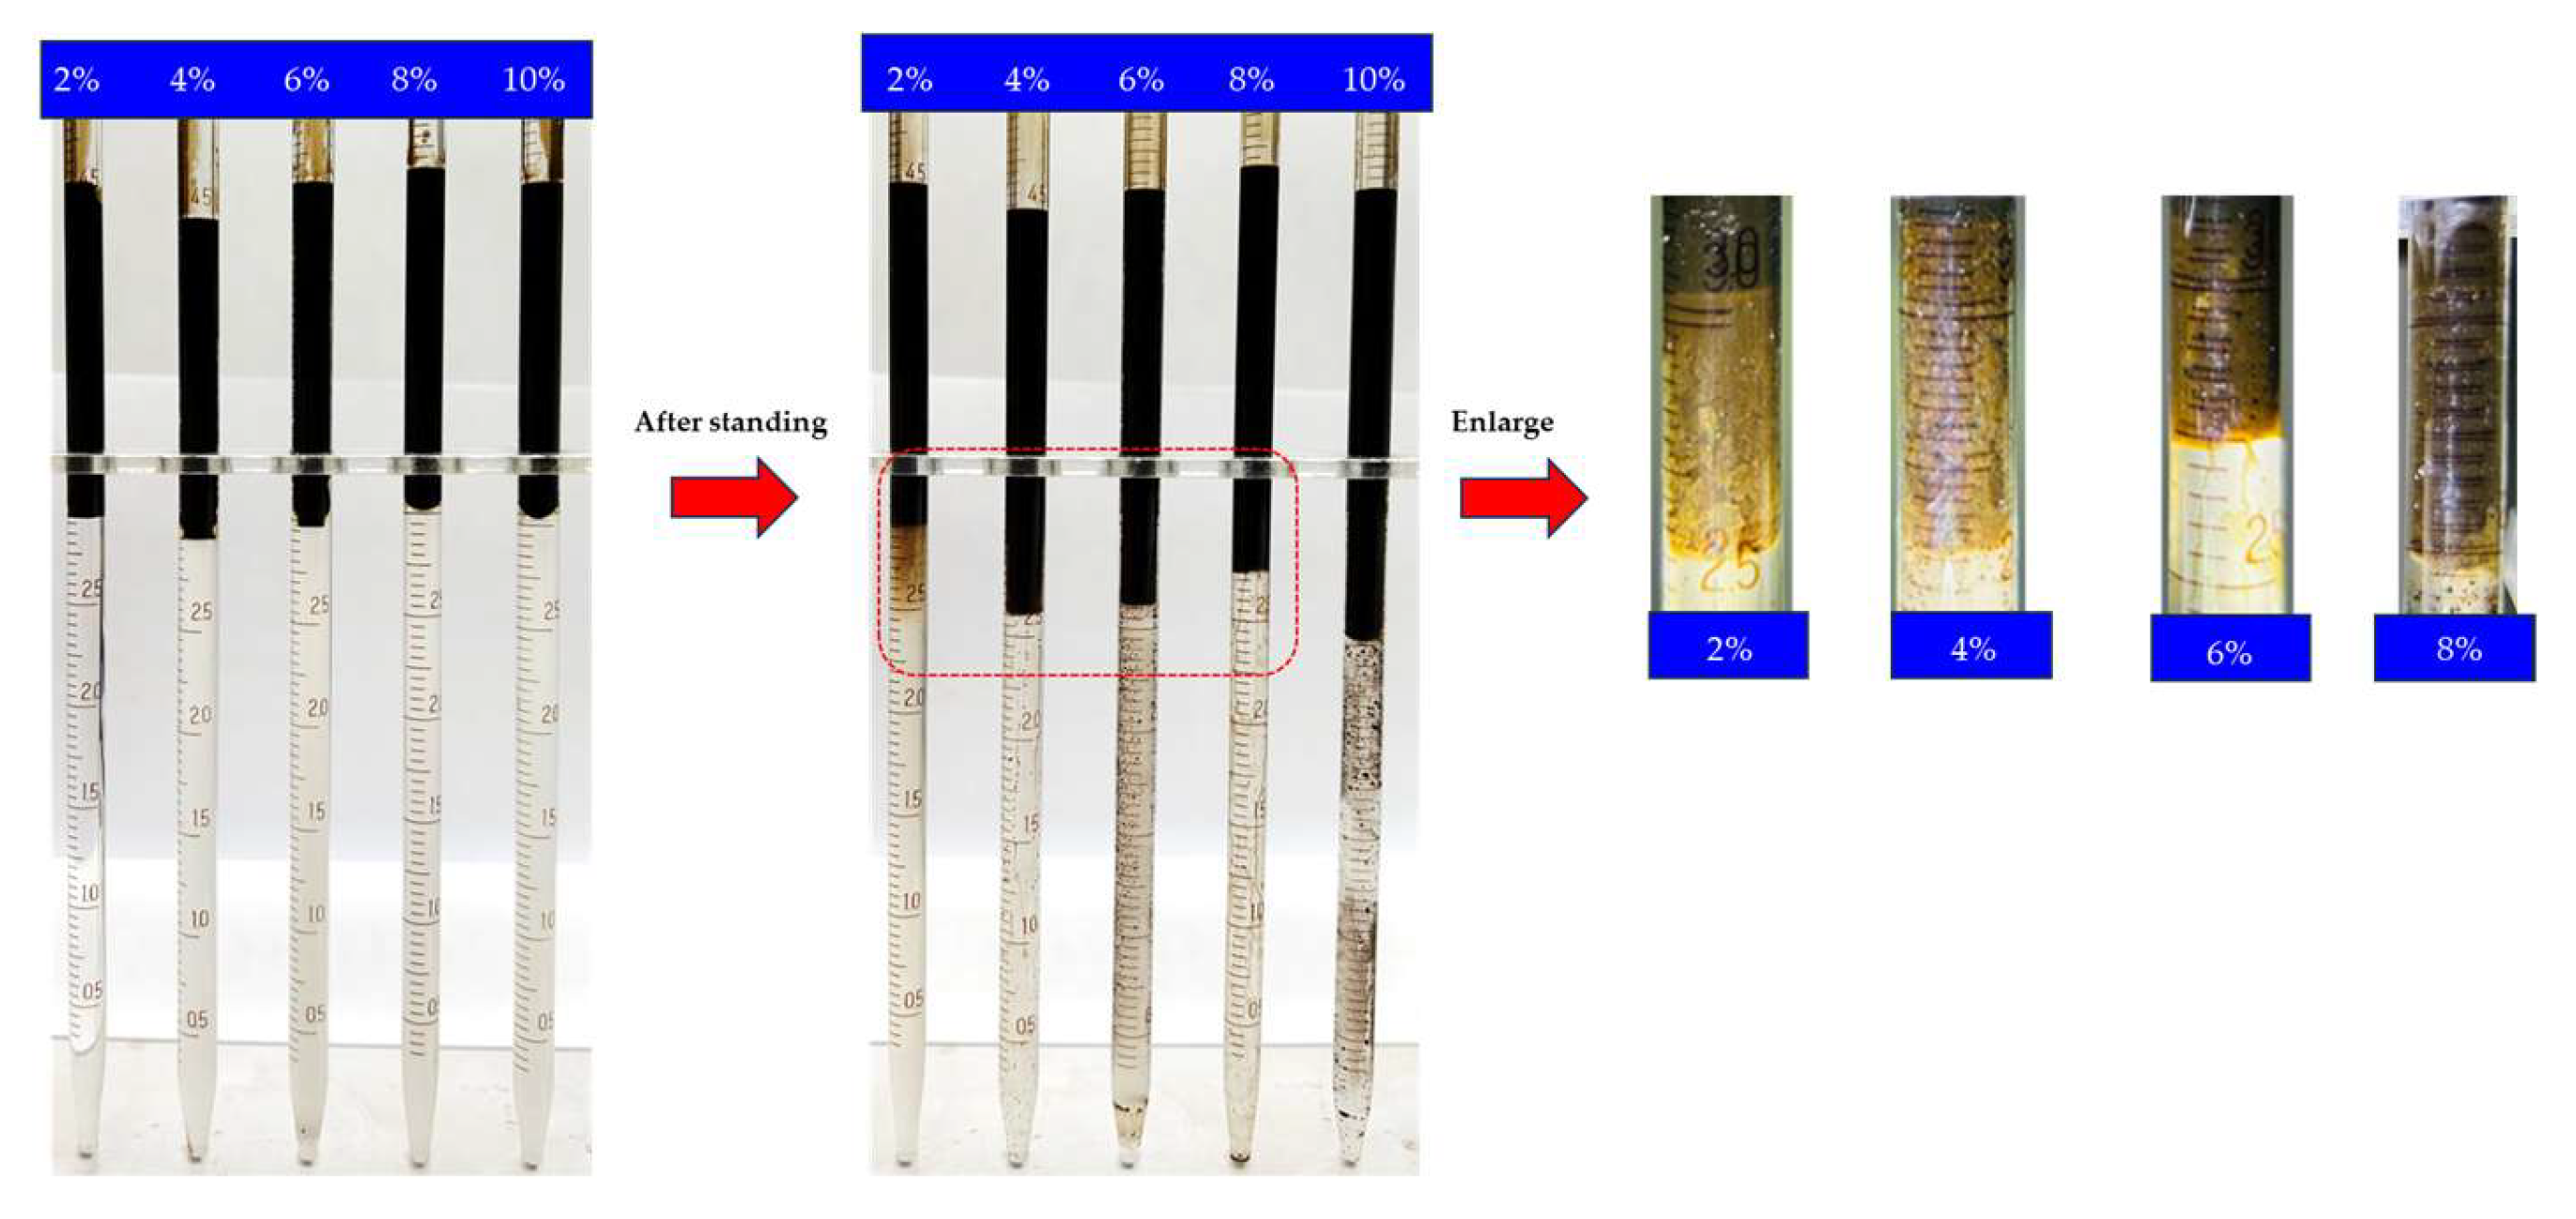
2.2. Salinity Scans Experiment

The preparation of the microemulsion involved the selection of a 5.0 mL glass pipette. Initially, a 1.0% surfactant solution was introduced into the pipette, followed by the addition of the required amount of solid KCl. The pipette’s mouth was securely sealed, and the solution was vigorously agitated until complete dissolution of the KCl particles in the surfactant solution was achieved. Subsequently, a 2% n-butanol solution was introduced into the pipette, followed by the incorporation of the corresponding volume of crude oil, which was recorded as the initial moment. The glass pipette was then immersed in a water bath maintained at 86 °C equipped with a constant-temperature oscillator for a 12 h aging process. After the aging period, the solution within the pipette was shaken, and it was allowed to stand for phase separation. Photographic documentation was captured, and observations were recorded when the microemulsion reached a stable state with no further changes in its composition.

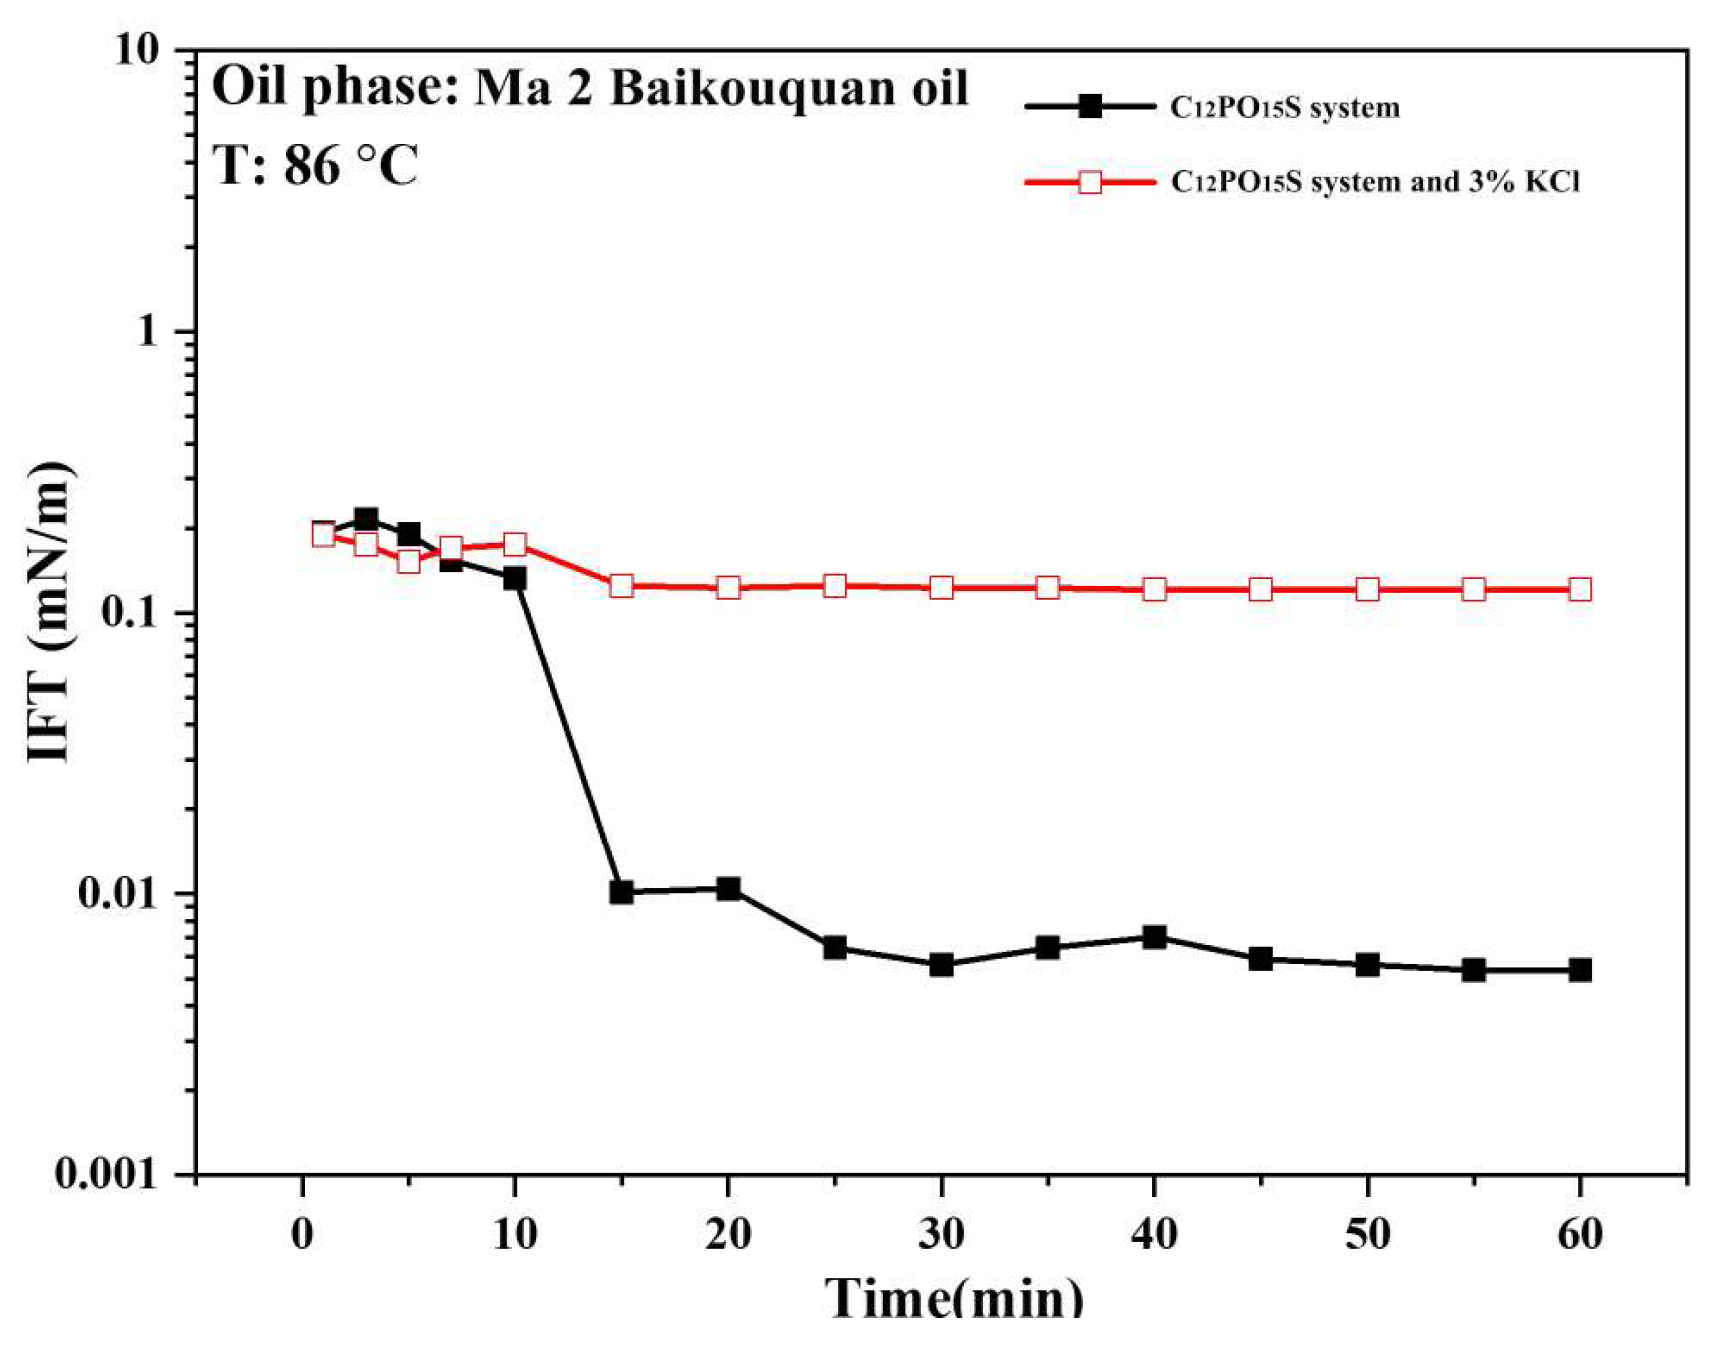
2.3. Interfacial Tension Measurement

Following the salinity scans experiment, further investigation was conducted to examine the impact of salinity on the interfacial tension of the in situ microemulsion system. The measurements were carried out at 86 °C and 6000 rpm using an SDT spin drop tensiometer to determine the interfacial tension between the crude oil and surfactant solution at various salinity levels.

2.4. Results and Discussion

2.4.1. Construction of In Situ Microemulsion System

The outcomes of the surfactant screening experiments are detailed in Table 2. Among the tested surfactants, only S13B and C12PO15S demonstrated the ability to create a middle-phase microemulsion when combined with Ma2 Baikouquan crude oil. The visual representations shown in Figure 1 and Figure 2 highlight the variations in the oil dissolution rate, which can be attributed to the different surfactant types. Consequently, these variations are evident from the distinct colors and volumes observed within the middle-phase microemulsions formed by each respective surfactant.

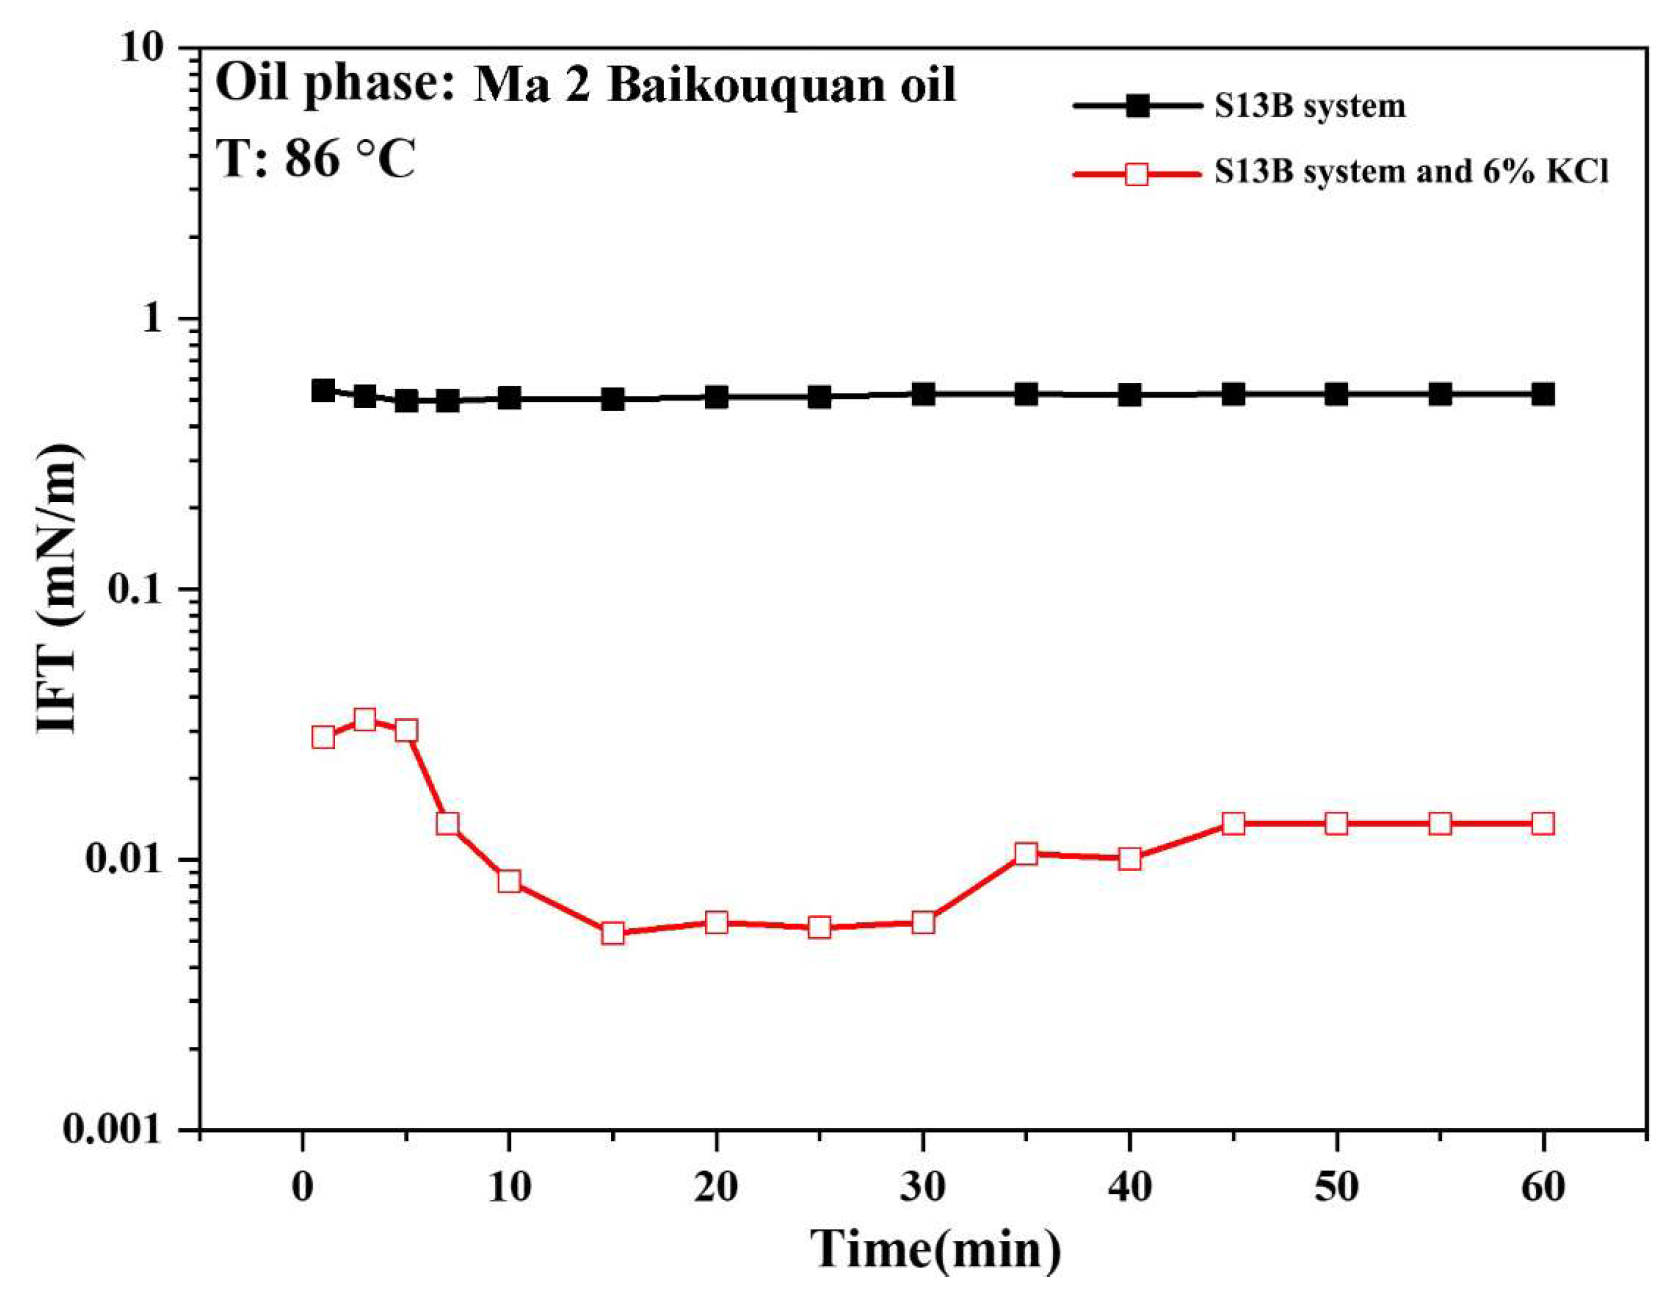
2.4.2. Interfacial Tension Measurement Results

The results are visually represented in Figure 3 and Figure 4. As depicted in these figures, the variation in the interfacial tension in the S13B system followed the typical pattern of salinity’s influence on the interfacial tension between anionic surfactants and crude oil. Upon the addition of 6% KCl, the interfacial tension of the system decreased significantly, dropping from 0.5 mN/m to an exceptionally low level of 0.01 mN/m or less. Conversely, under the influence of KCl, the interfacial tension of the C12PO15S system between the surfactant solution and crude oil increased from approximately 0.01 mN/m to around 0.1 mN/m.

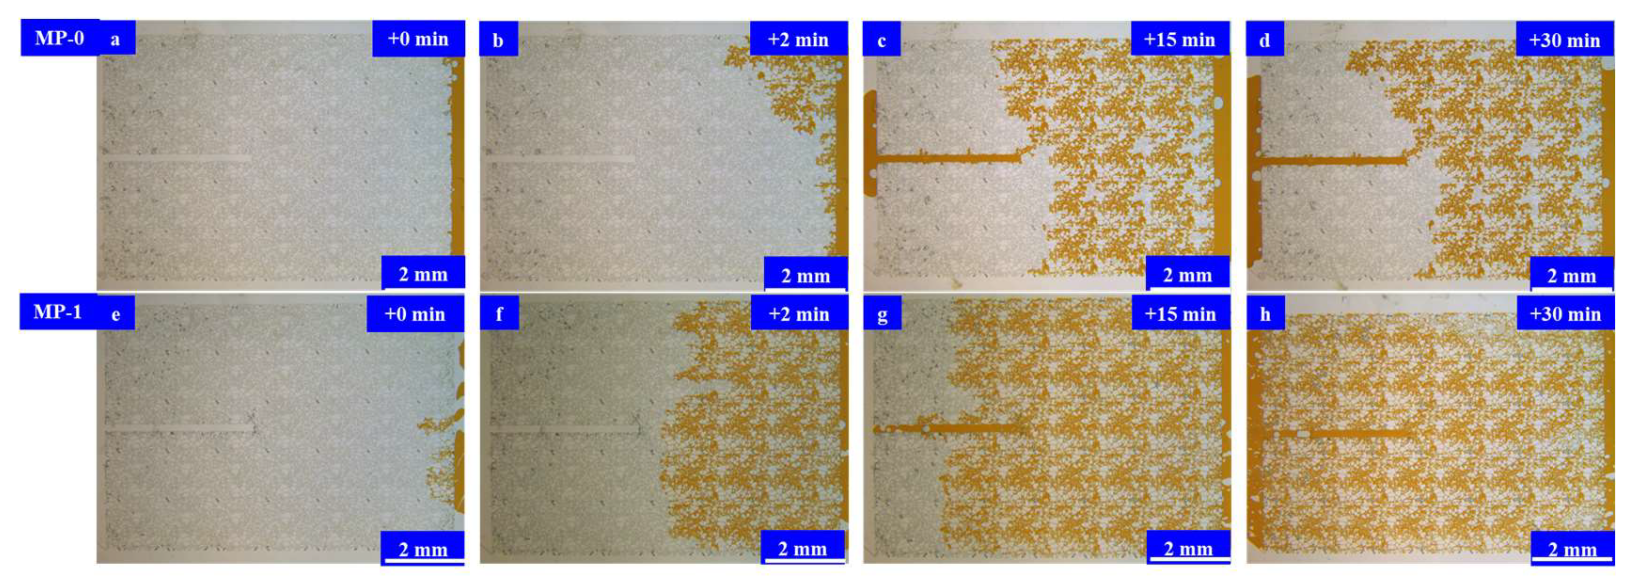
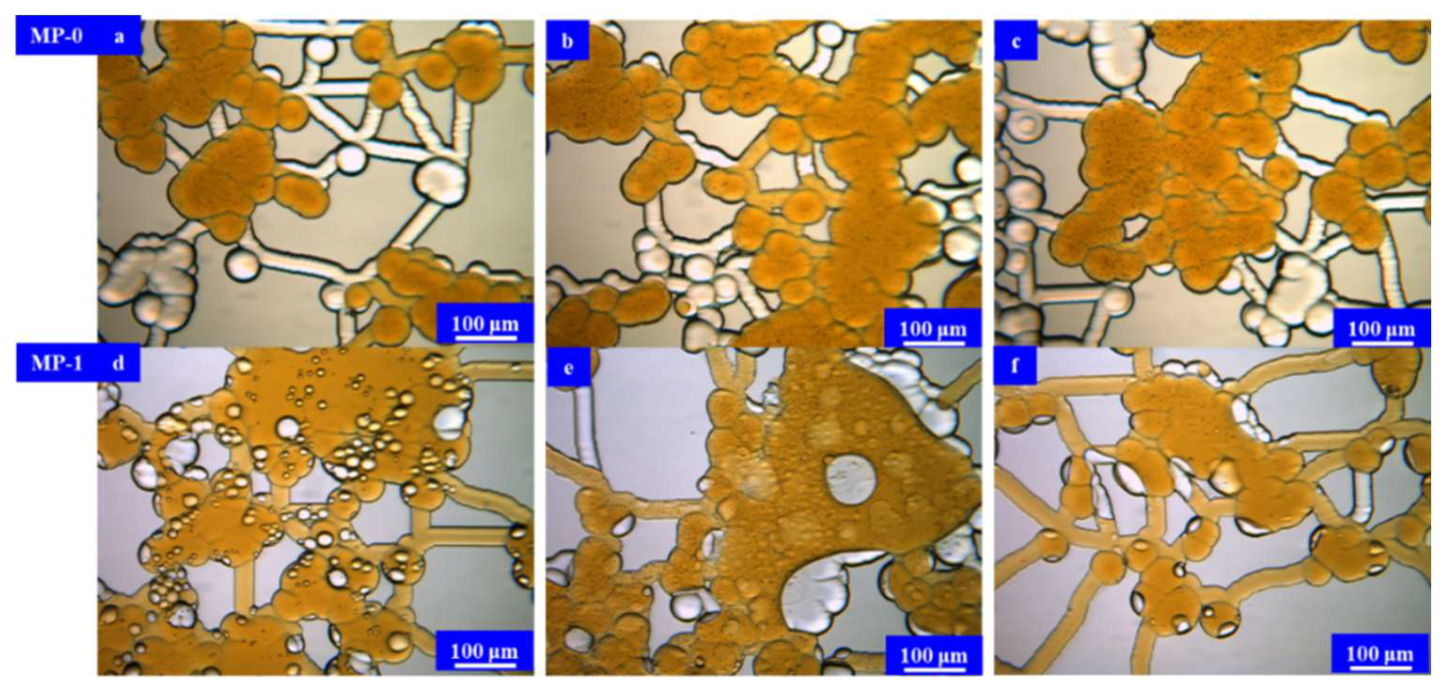
3. Imbibition Behavior of In Situ Microemulsion System

An investigation was conducted by creating a three-dimensional micromodel that includes millimeter-scale fractures, micron-scale pores, and nano-scale throats. This research aims to delve into the mechanisms of various microemulsion systems to enhance the efficiency of imbibition in tight reservoirs.

3.1. Materials

The crude oil and chemical agents used remained consistent with the specifications provided in Section 2.1. All the surfactants were prepared using simulated stratum water. Building upon the findings from the salinity scan experiments, three specific formulations, as described in Table 3, were developed for the subsequent research on the imbibition experiments.
The experimental setup consisted of various pieces of equipment, including a Leica fluorescence stereomicroscope (M165FC), a Leica camera (DFC450, 100 fps, 2560 × 1920), an MFCS-EZ Fluigent constant pressure pump, and a PHD ULTRATM Harvard constant current syringe pump, among others. Figure 5 provides a visual representation of the constructed model. In this model, the fracture area had a depth of approximately 50 µm, while the average width of the pore body measured approximately 30 µm with an average depth of around 15 µm. Additionally, the average width of the throat was roughly 4 µm, with a depth extending to approximately 800 nm.

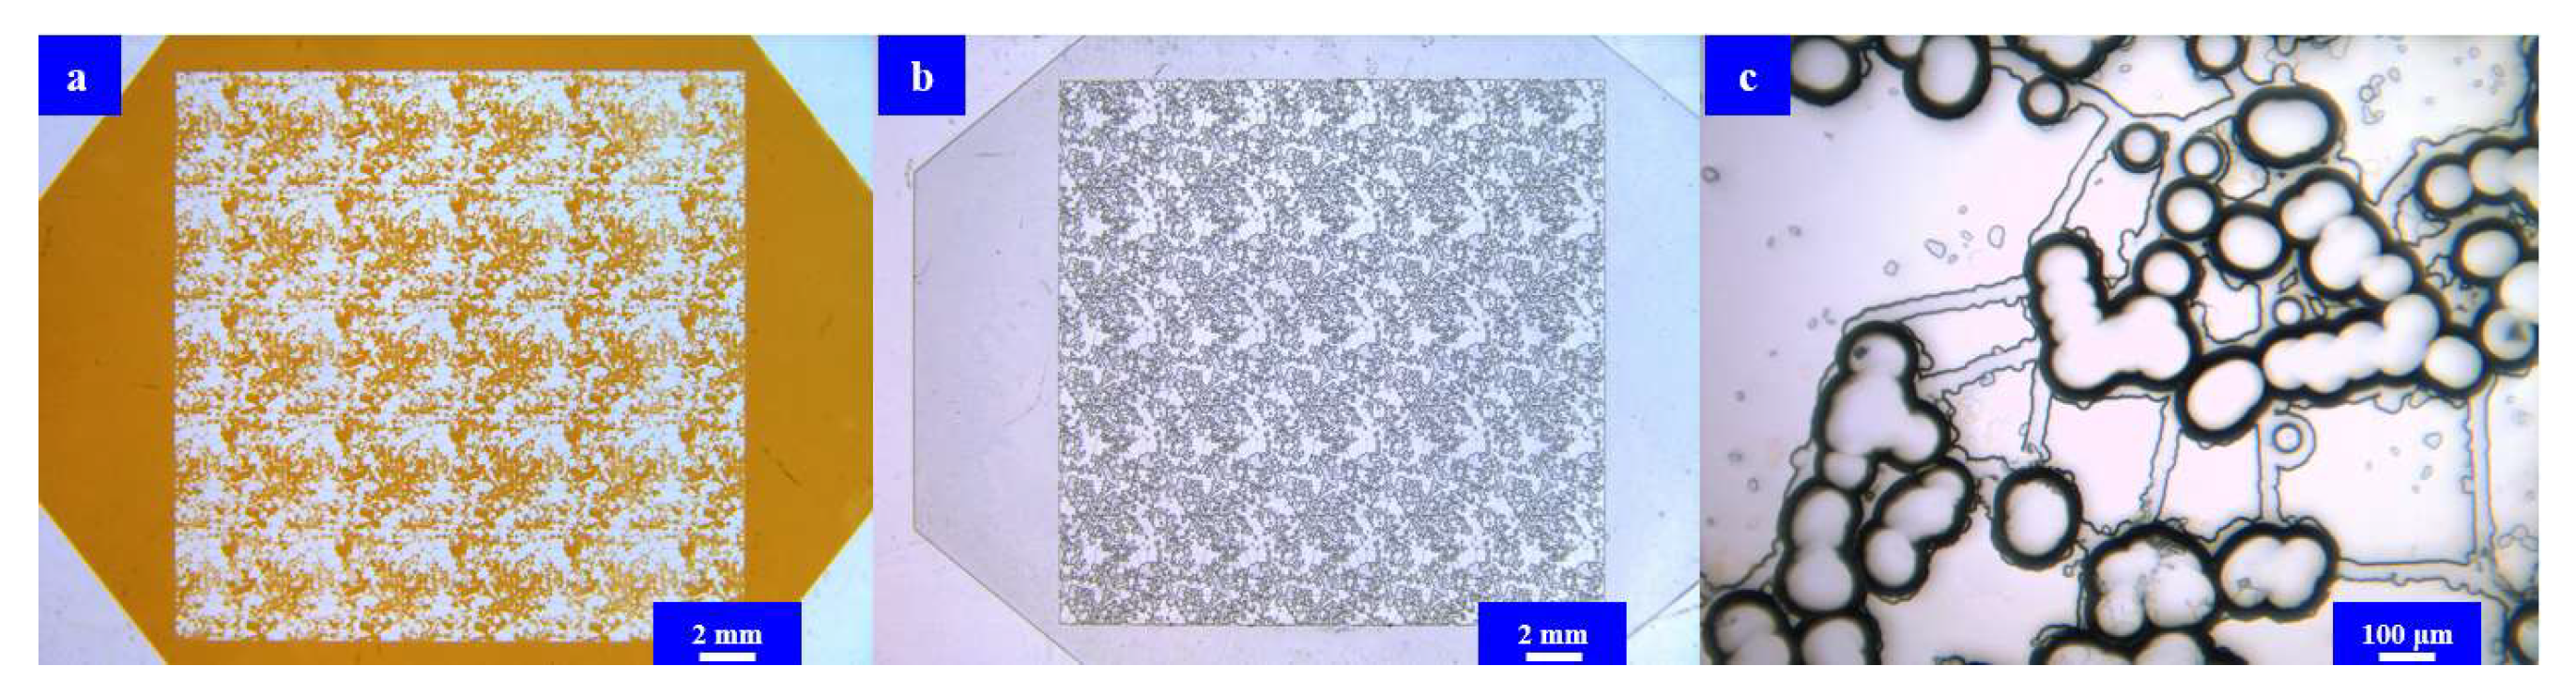
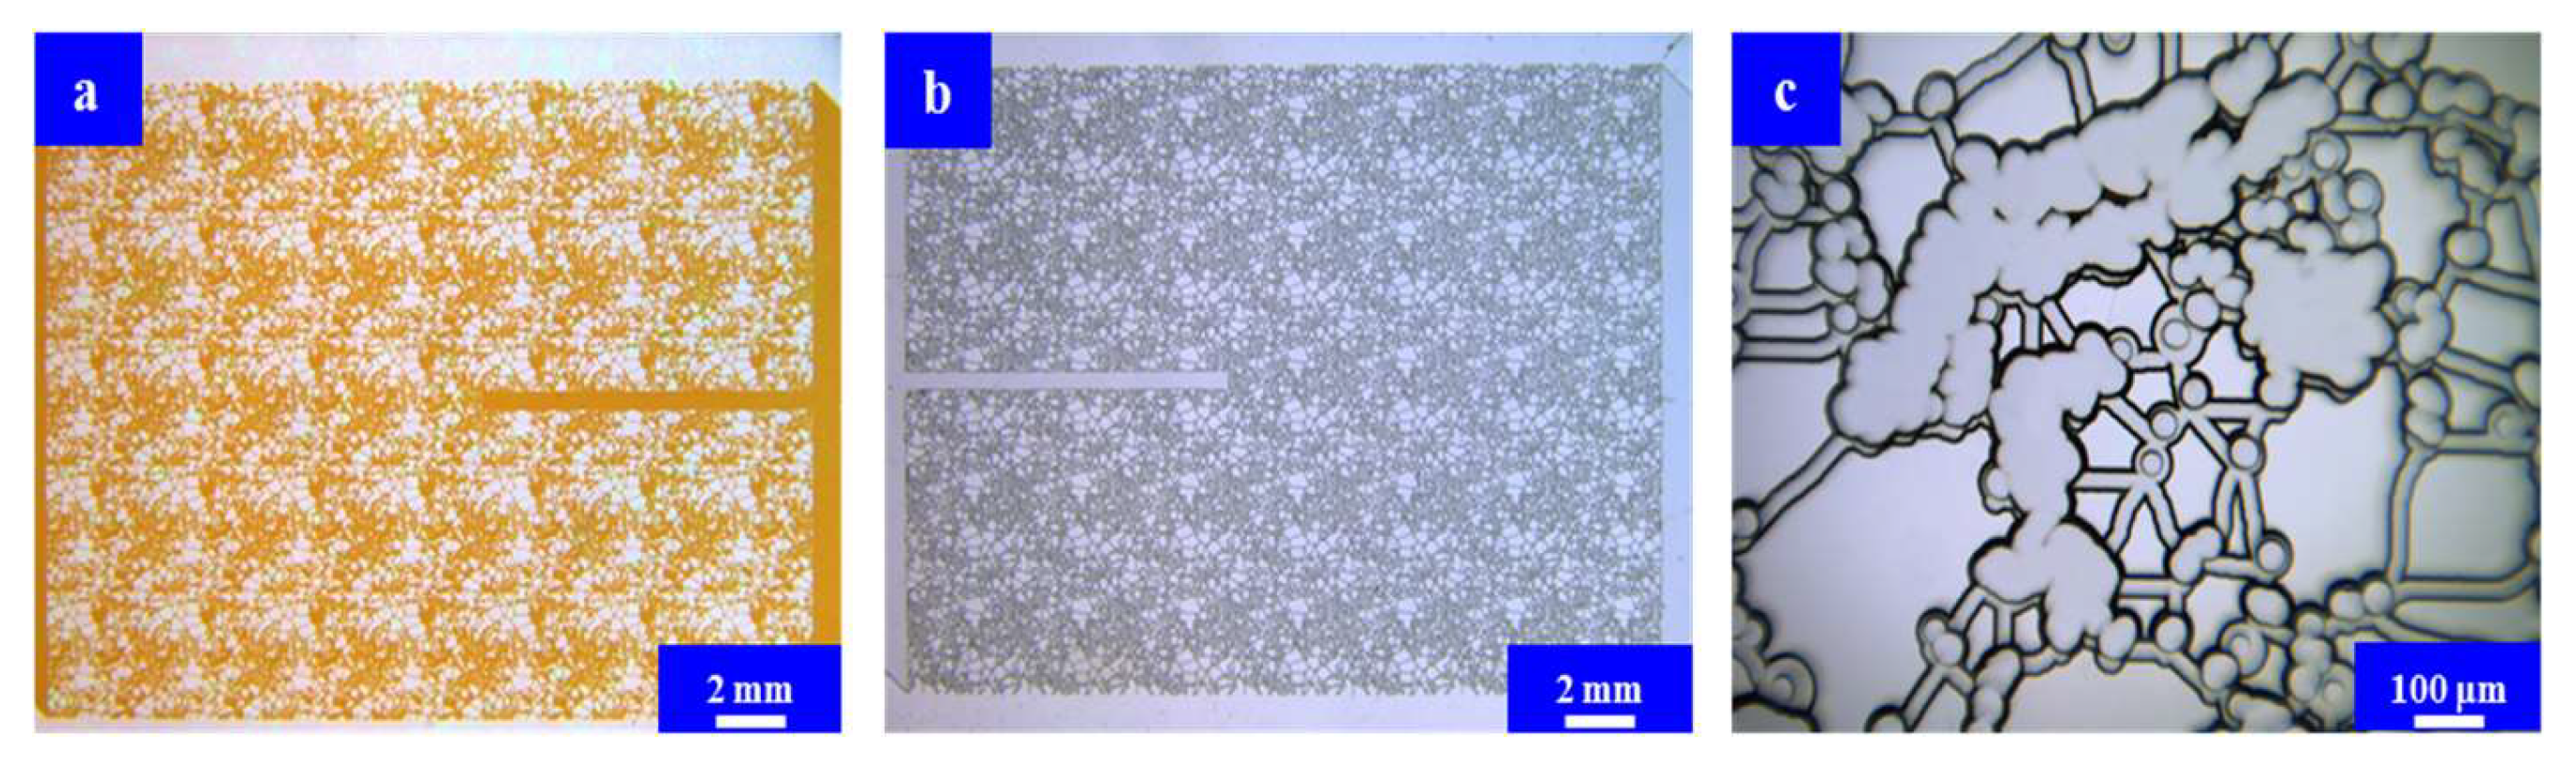
3.2. Microfluidic Imbibition Experiment

(1)
The experimental procedure commenced by employing a constant-pressure pump to inject crude oil into the micromodel at a pressure of 3000 mbar. Once the crude oil had completely discharged from the model outlet, the injection pressure was increased to 5000 mbar to eliminate any residual bubbles within the model. Subsequently, the model was saturated with oil and immersed in crude oil, undergoing aging at a temperature of 86 °C for a duration of 48 h.
(2)
A constant-speed pump was employed to introduce fluid through the injection port, ensuring a controlled injection rate of 0.1 µL/min. Injection was ceased after displacing 10 pore volumes (PV).
(3)
The model was placed in a vertical position within a designated chemical system while maintaining a consistent temperature of 86 °C for the imbibition phase. The model was periodically removed for systematic observation of the imbibition dynamics, and images and videos were captured to document the process.

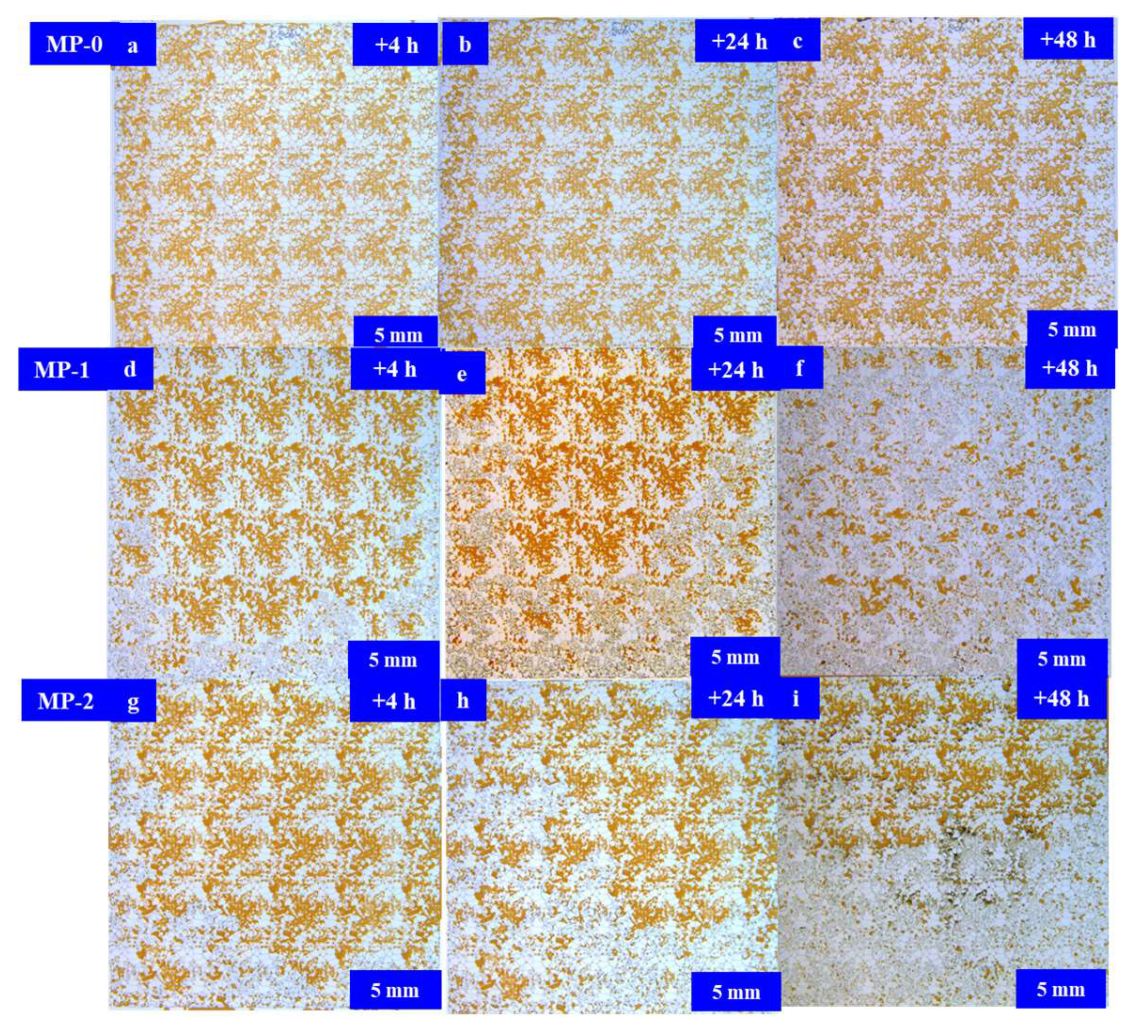
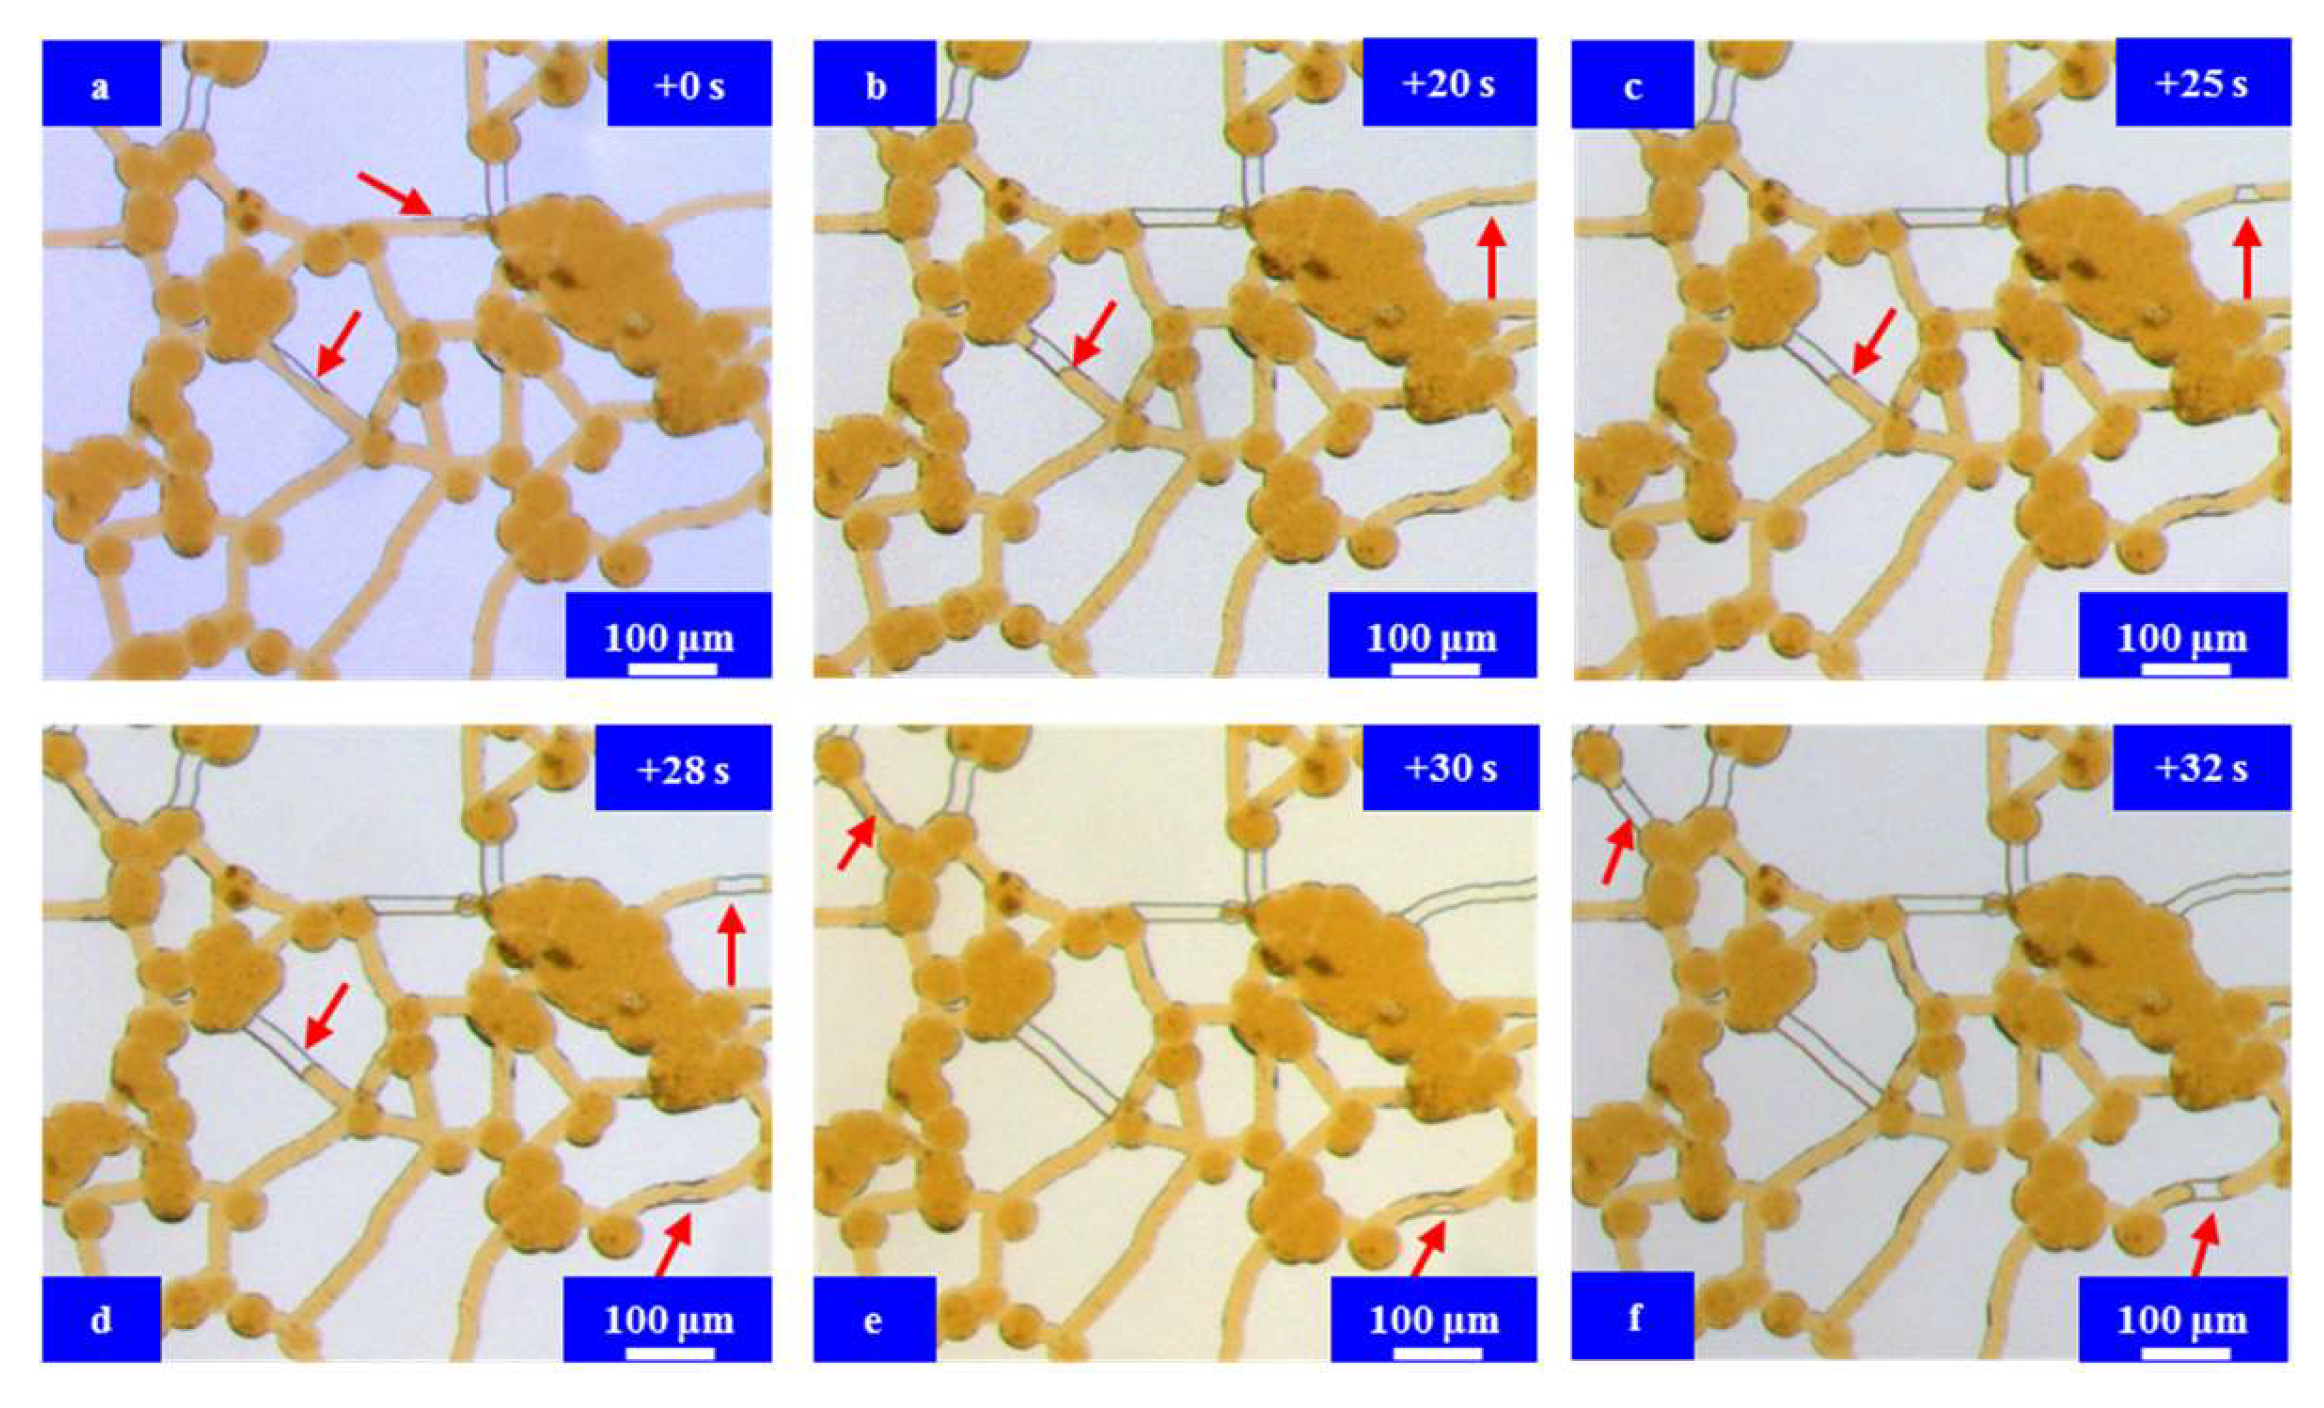
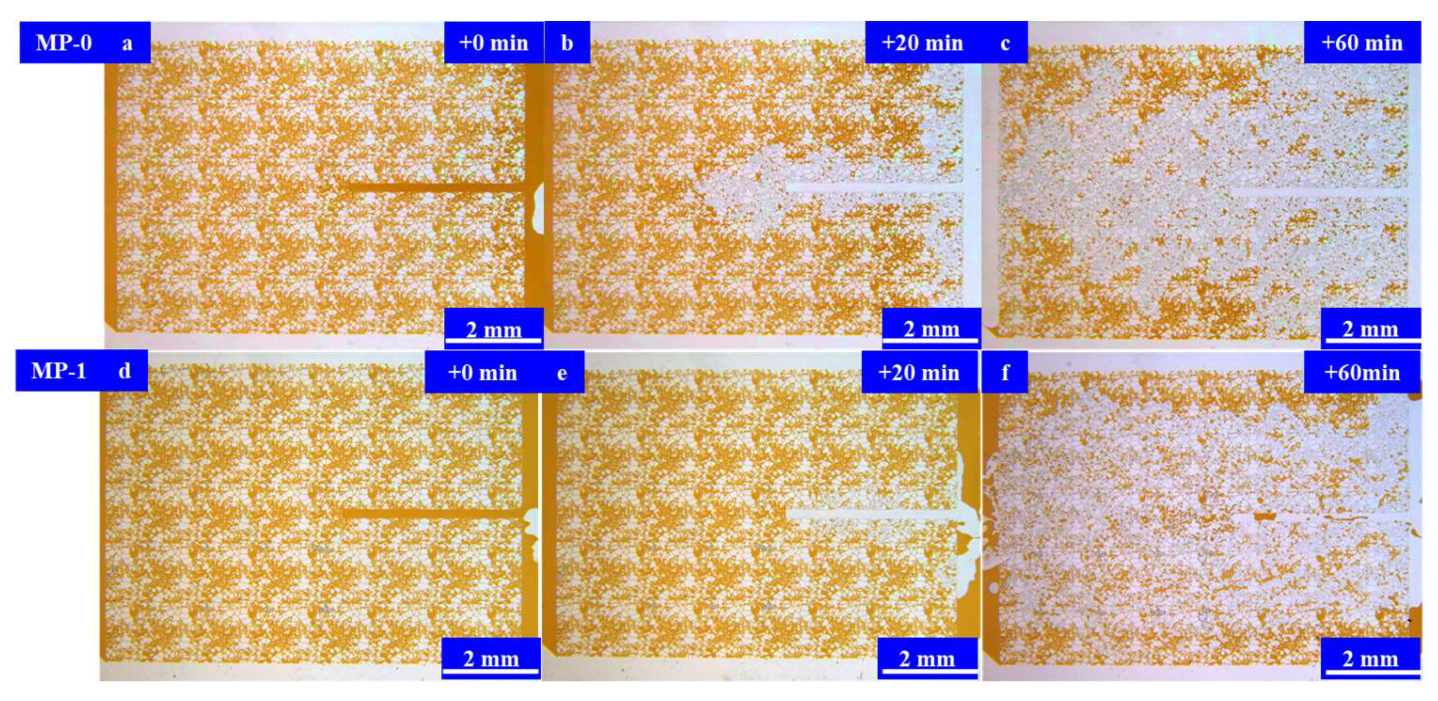
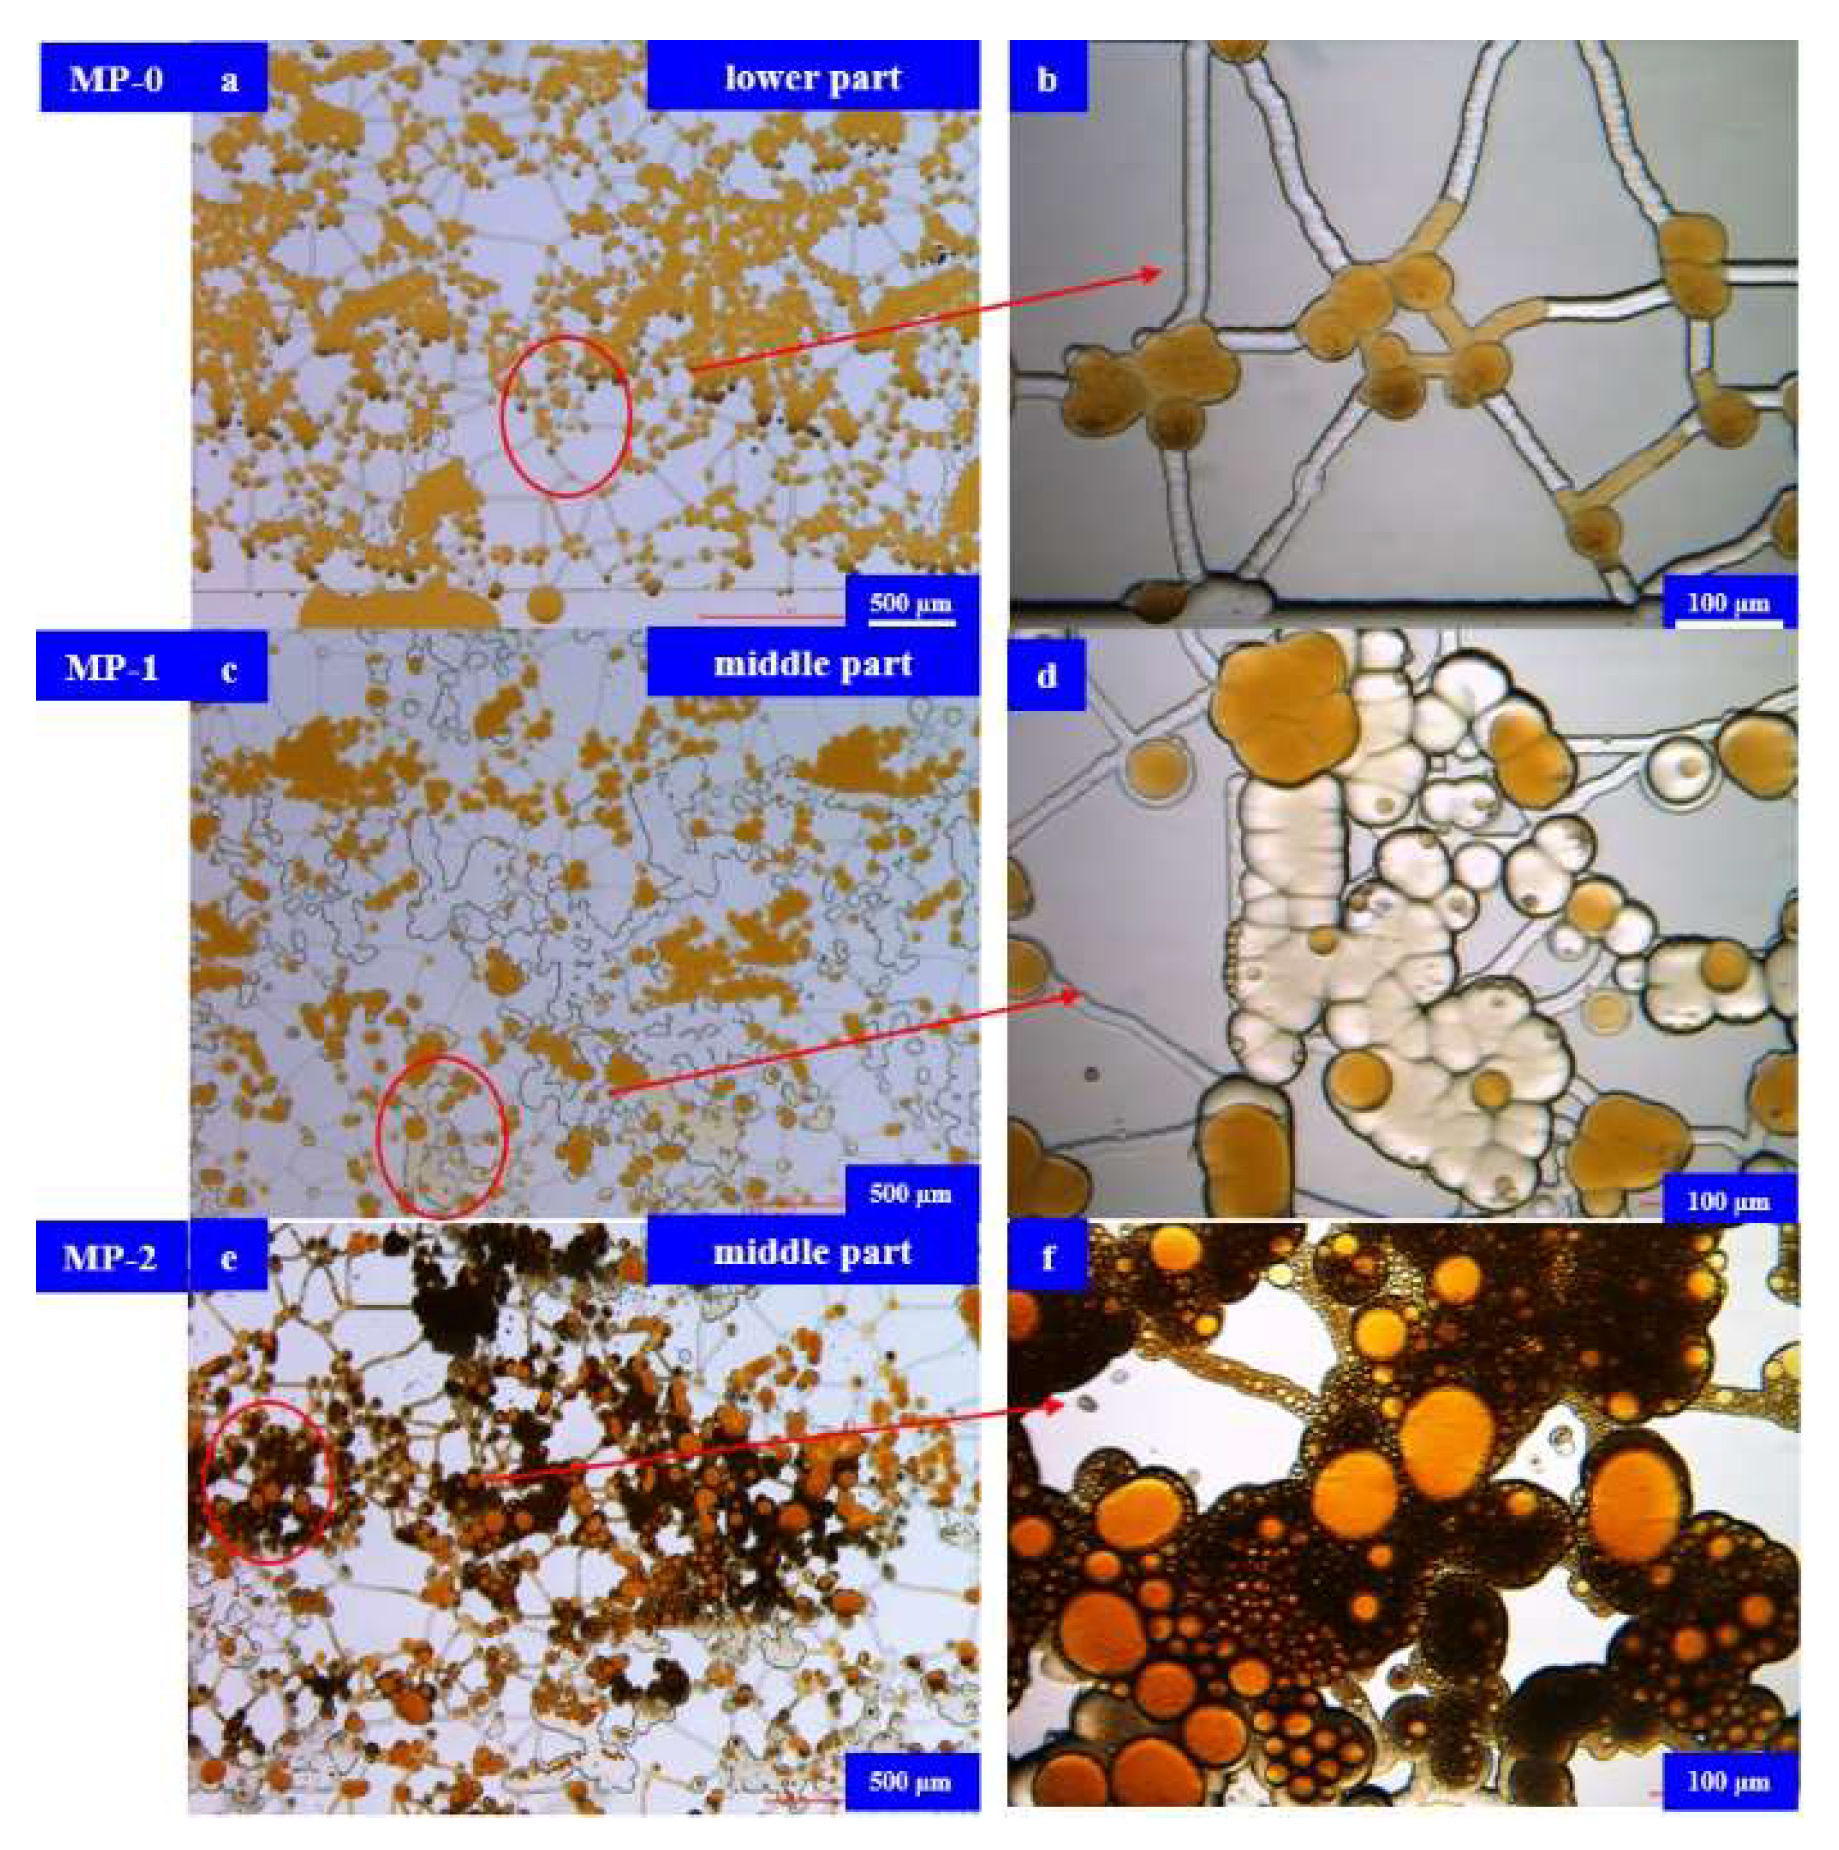
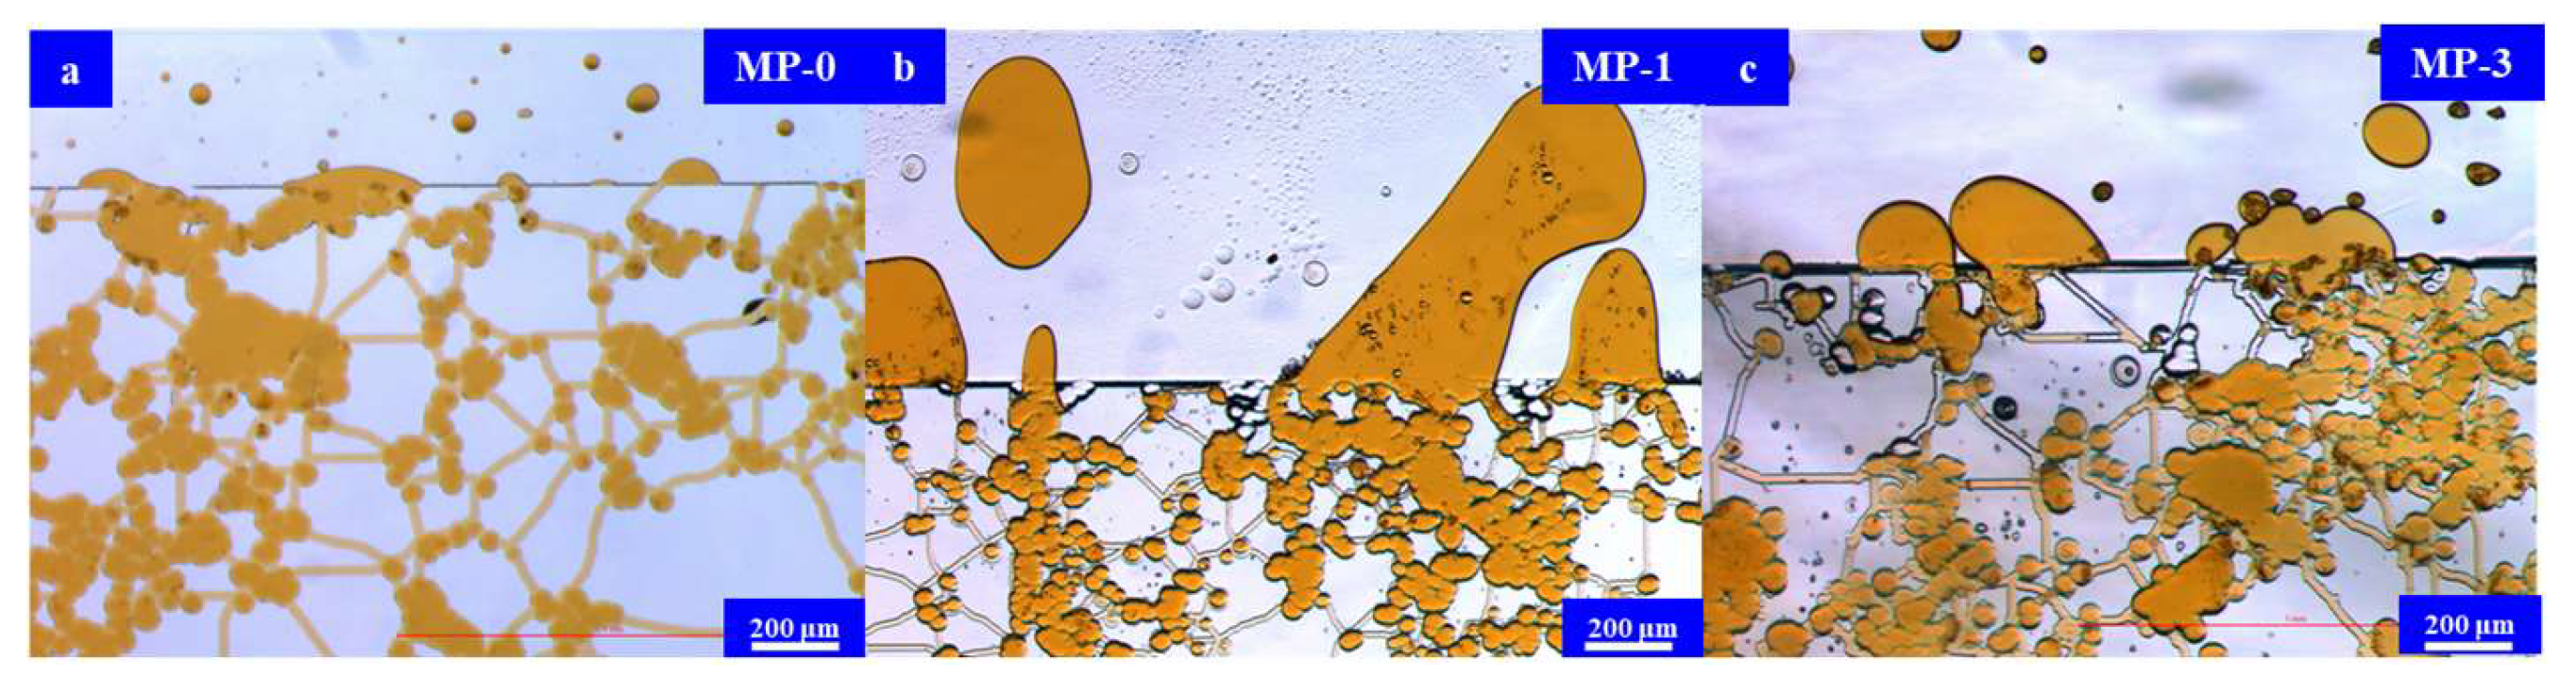
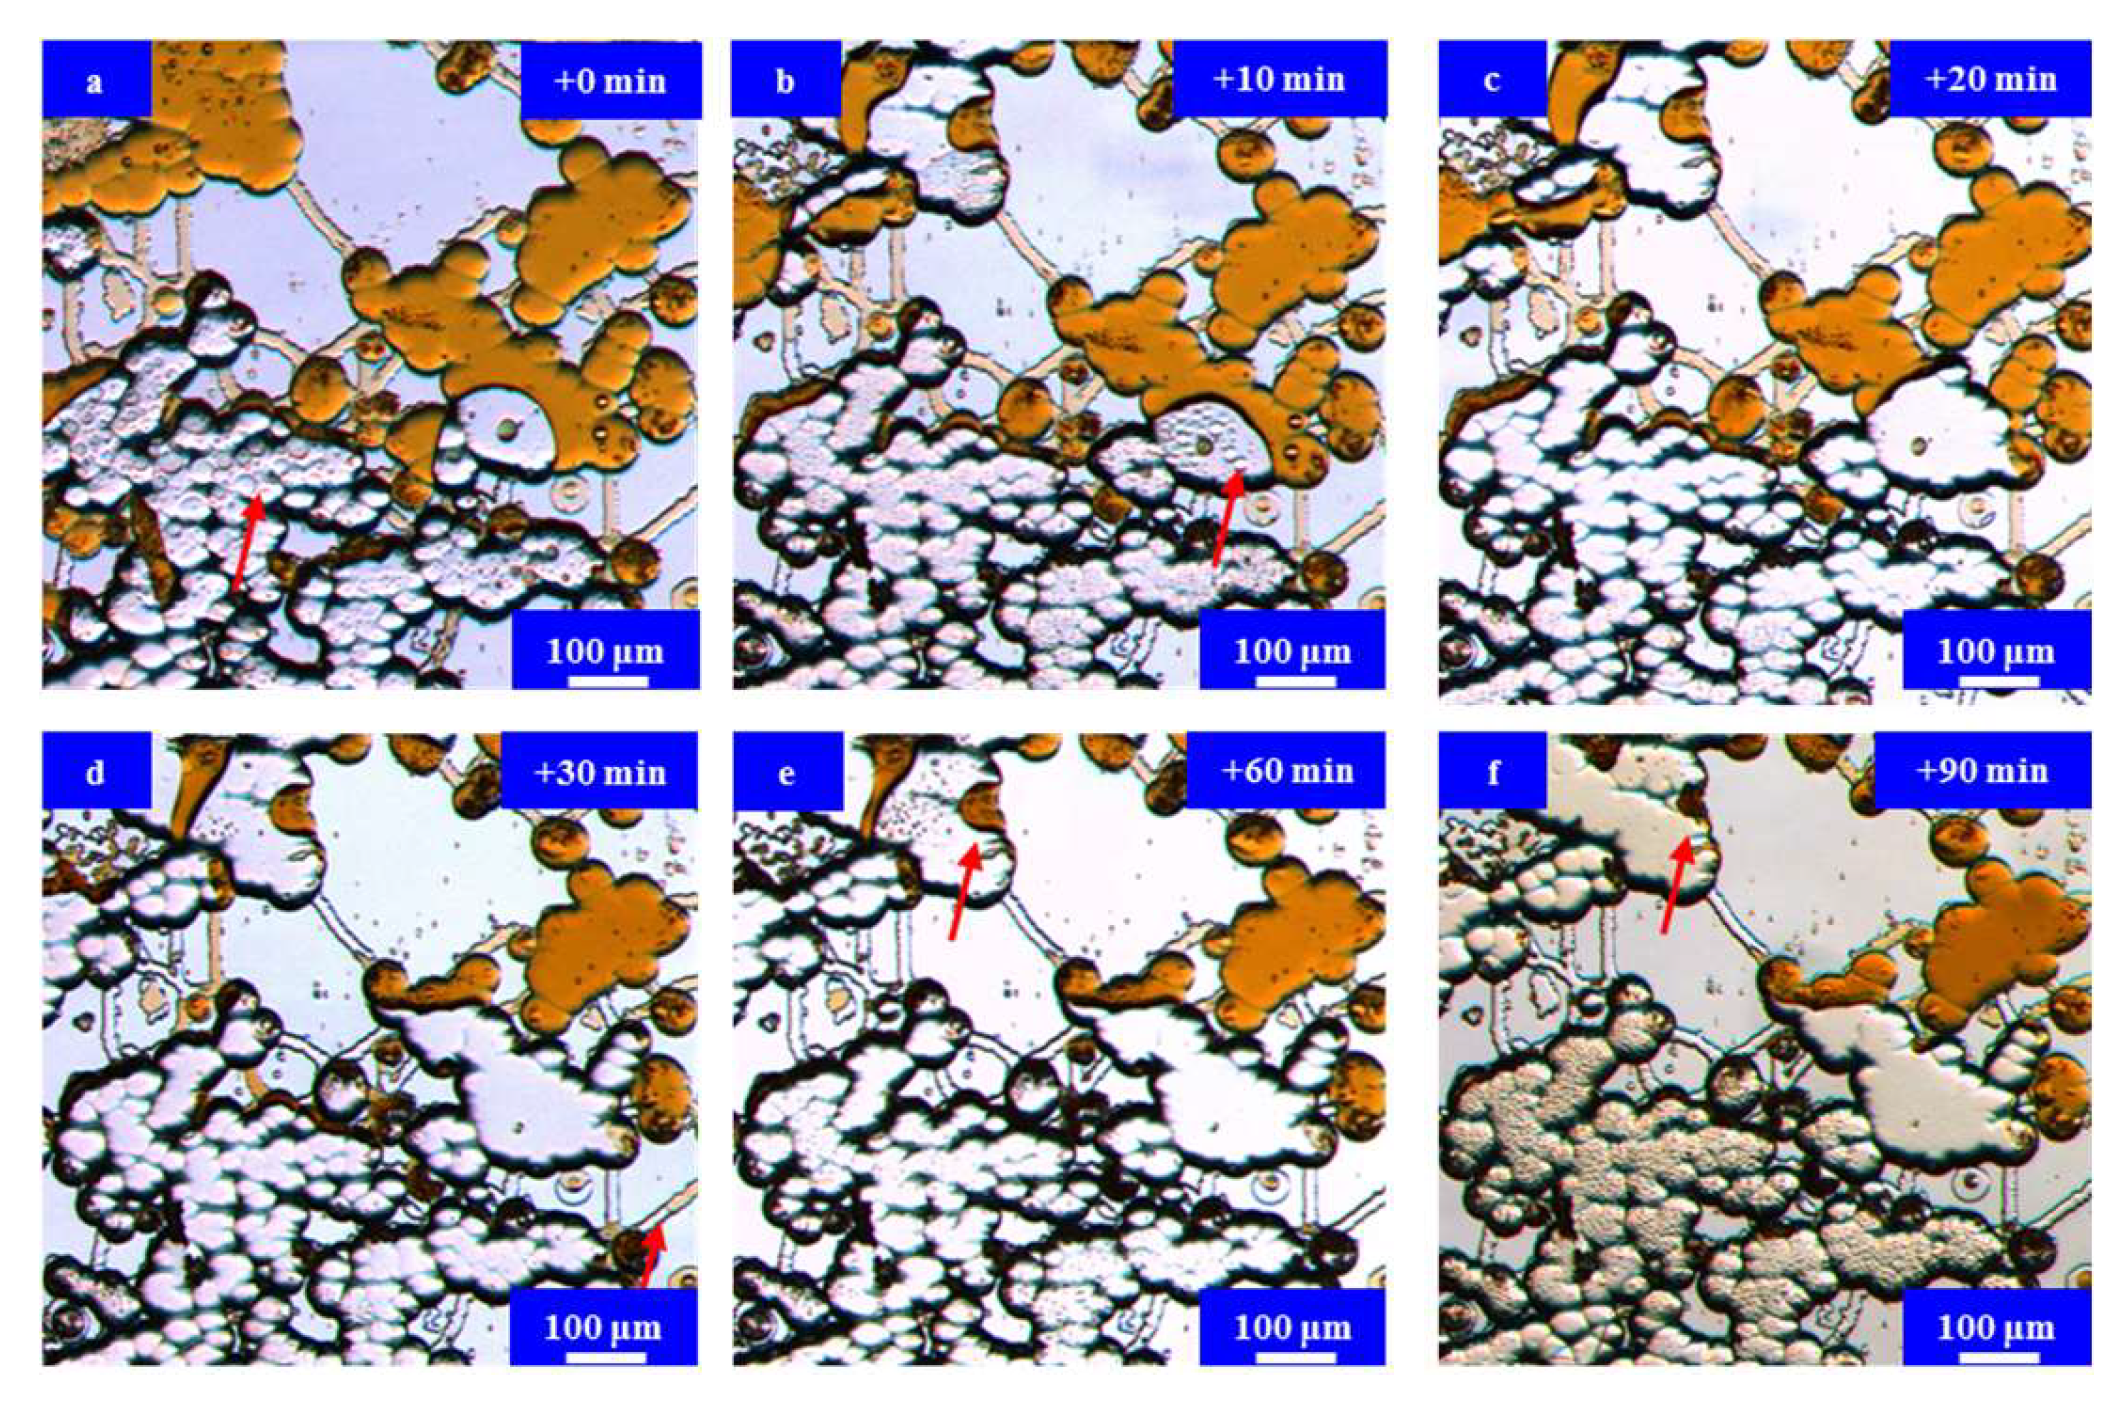
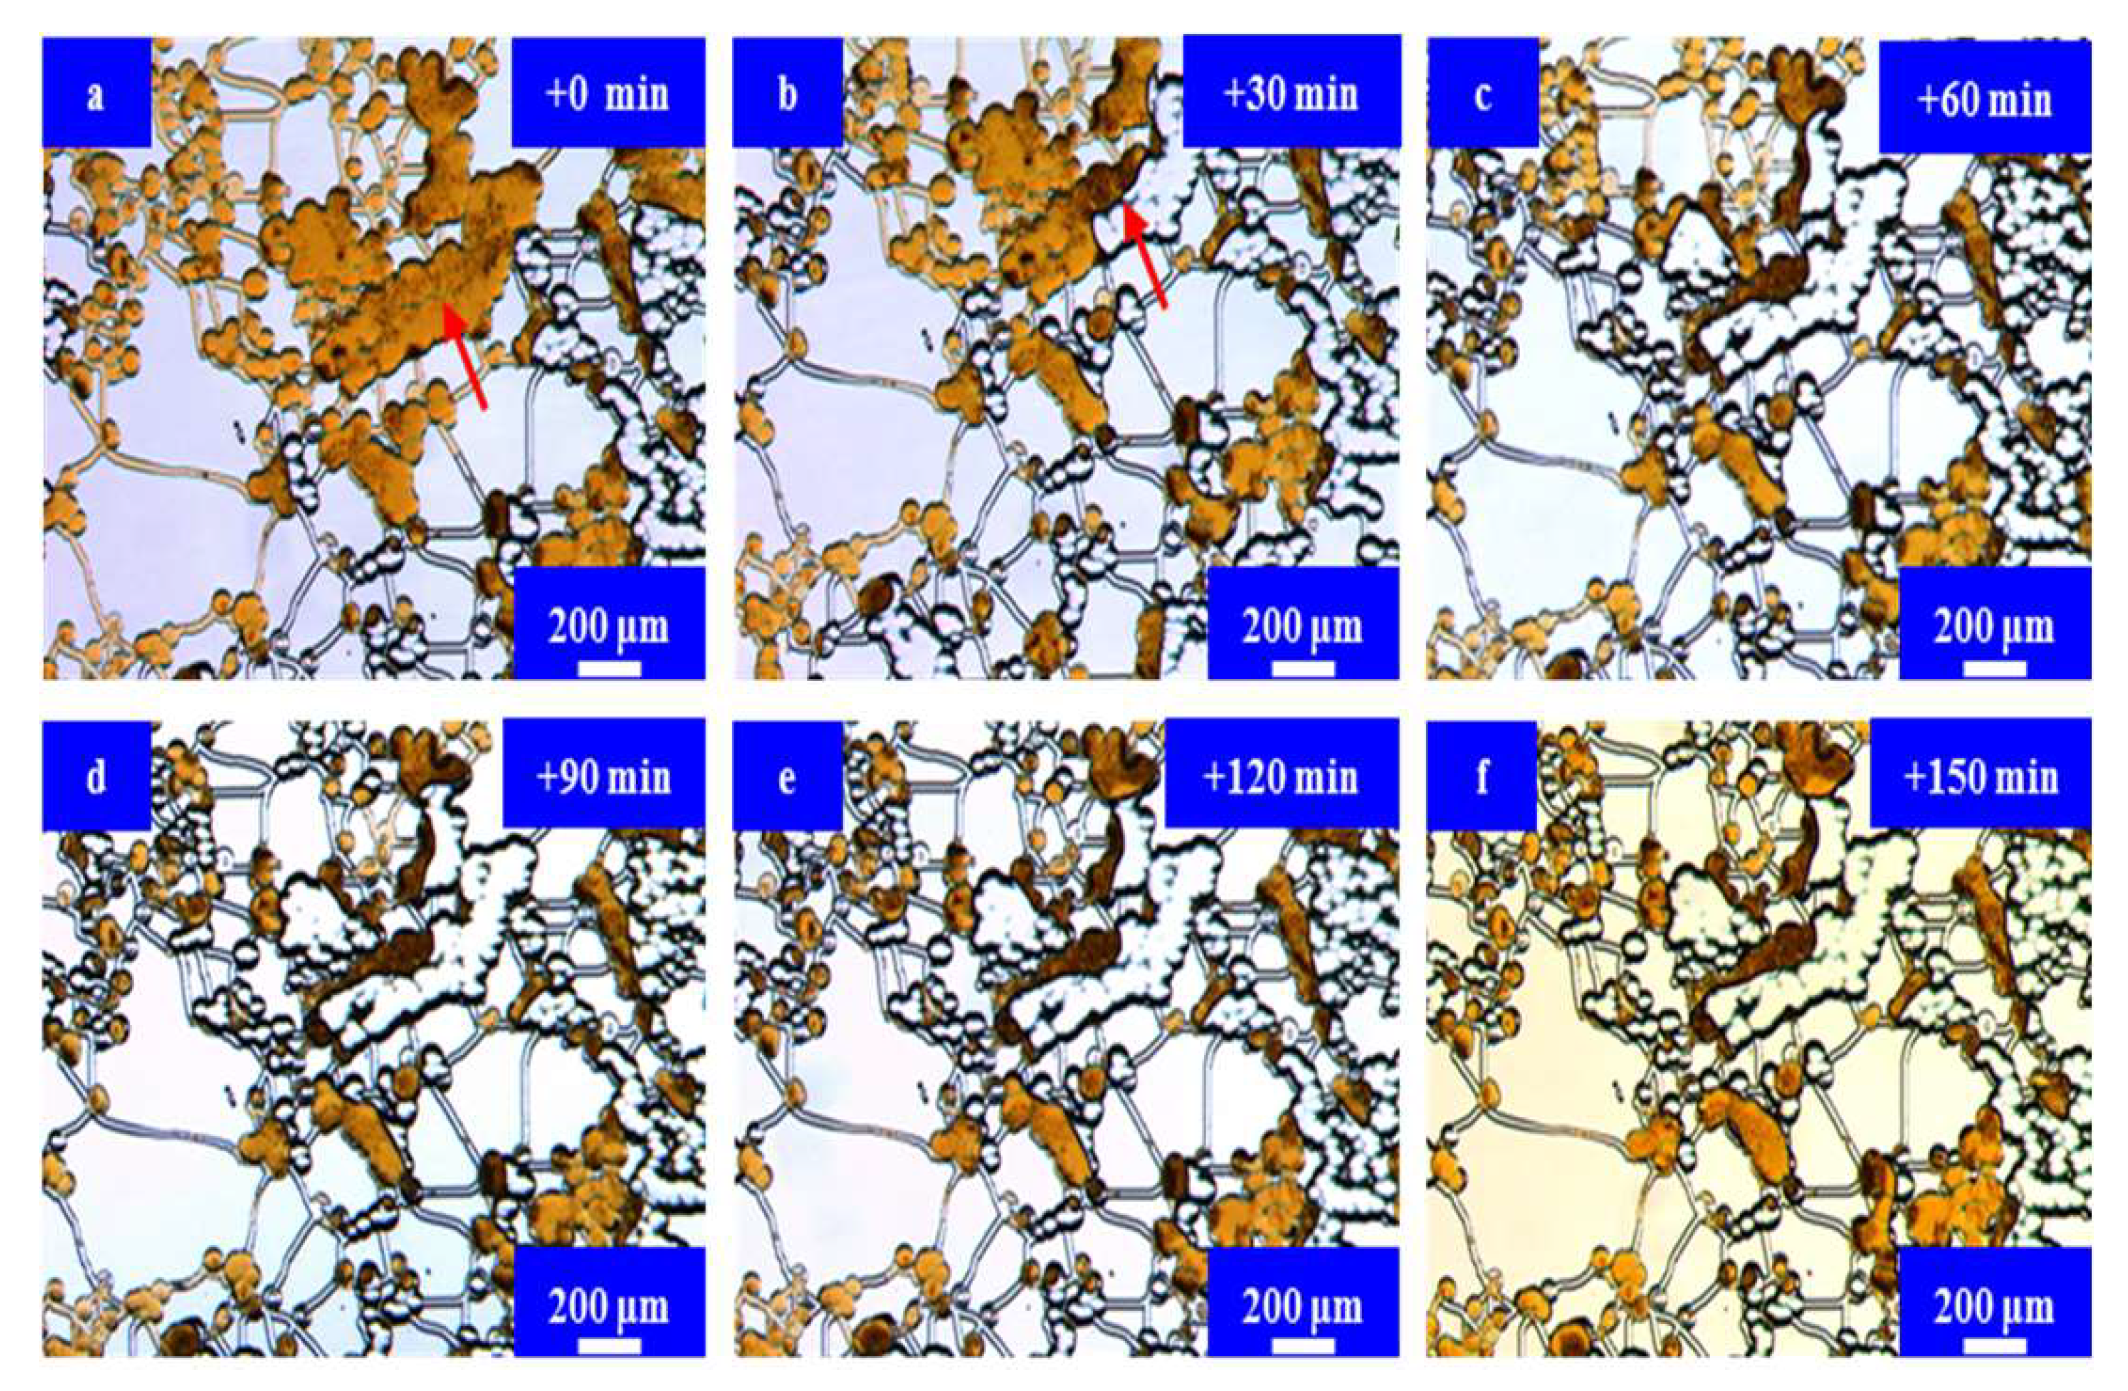
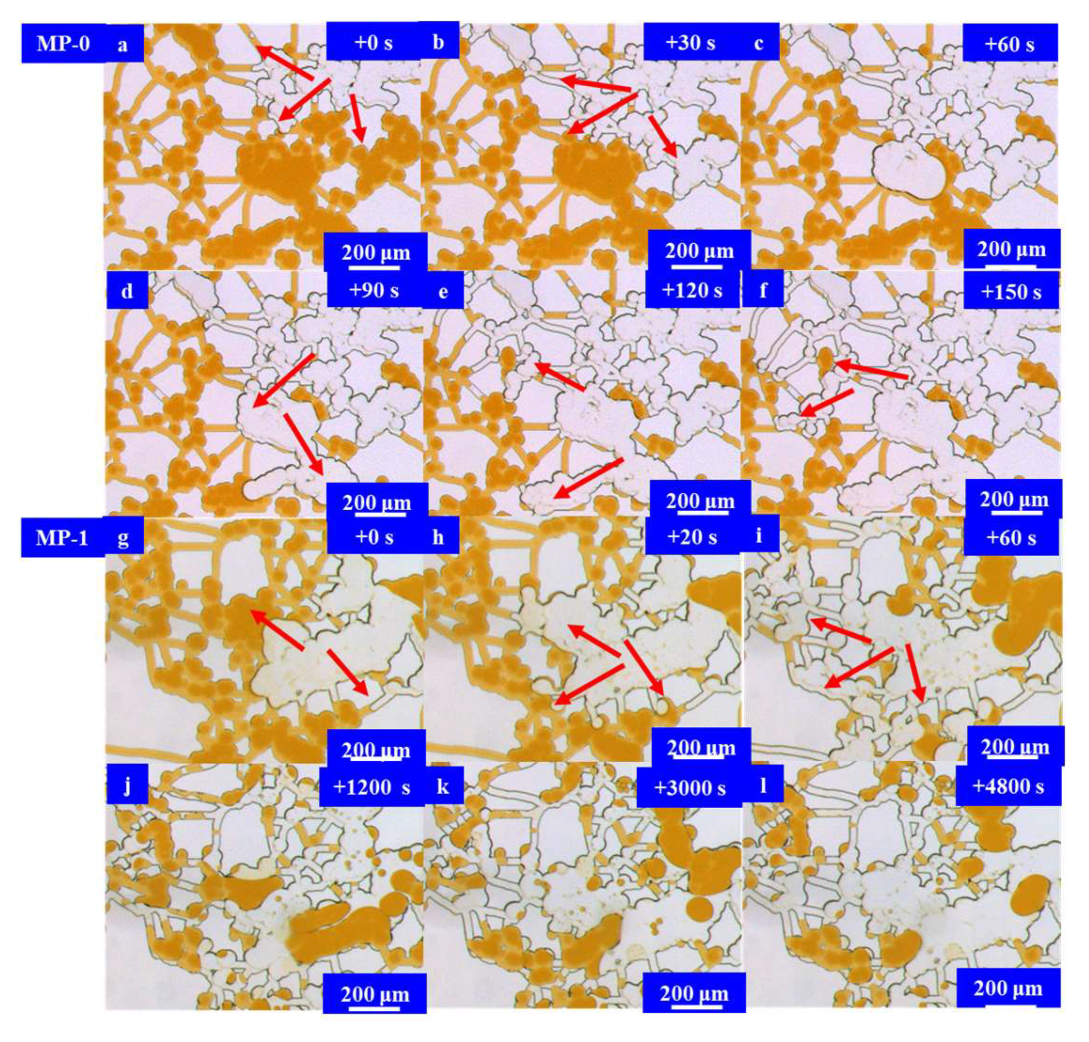
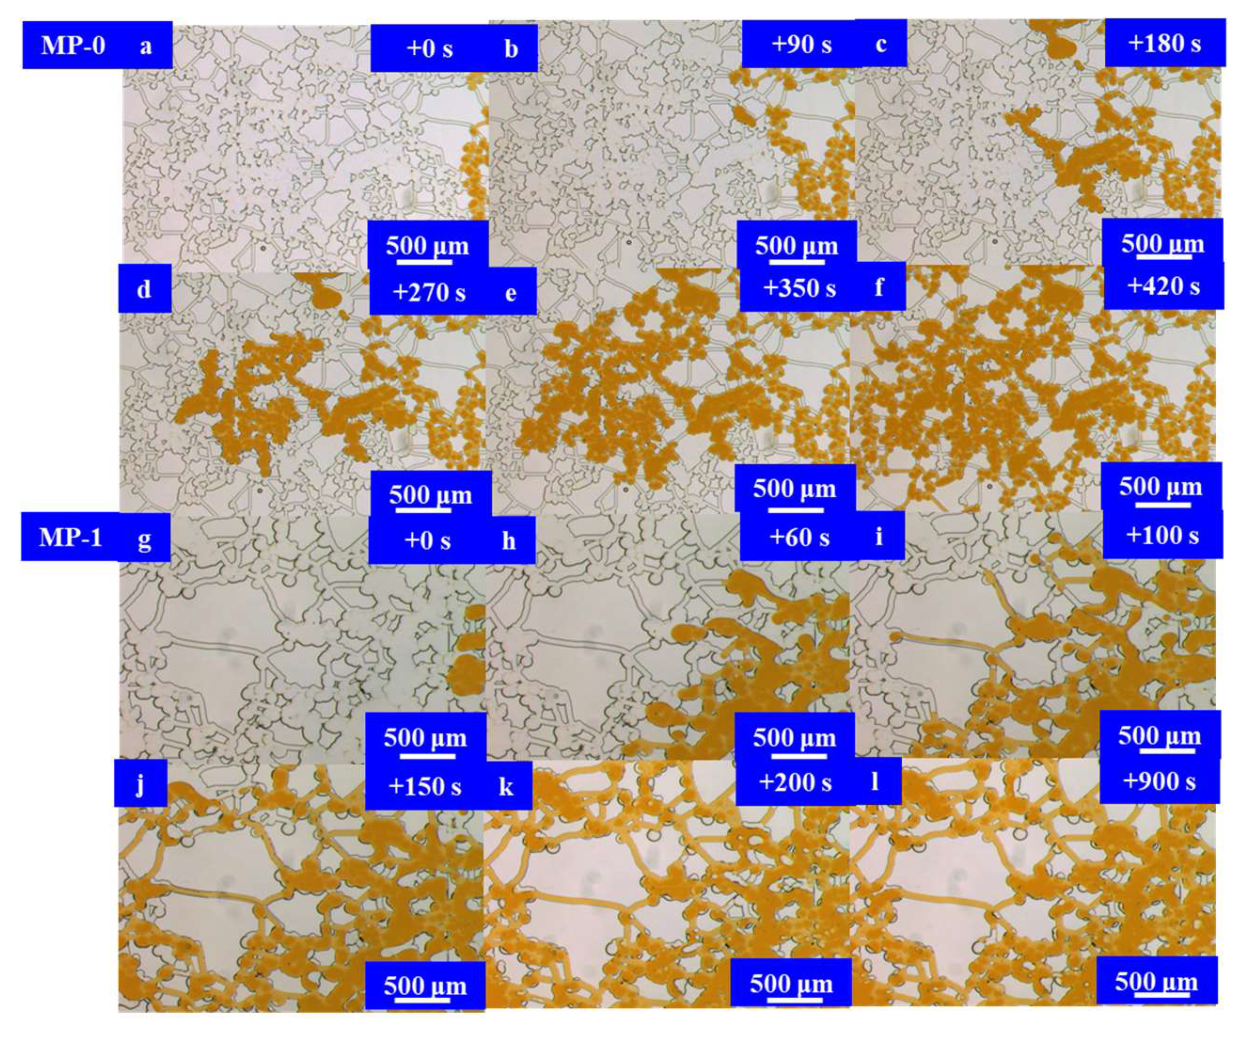
3.3. Results and Discussion

Microfluidic Imbibition Mechanism

Figure 6 offers a comprehensive view of the imbibition experimental images of the model under different formulations. Analyzing the experimental results presented in the figure, it was observed that the imbibition process with stratum water followed a reverse imbibition mode, progressing from the model’s surroundings towards its interior. The primary driving force in this case was capillary force, with a utilization rate of less than 3%. In contrast, the imbibition process with the microemulsion system operated in a positive imbibition mode, moving from the bottom to the top of the model, where the principal driving force was gravity. The entire matrix area was sequentially utilized from the bottom to the top, resulting in a decreasing degree of utilization. The overall recovery degree of MP-1 reached approximately 87%, significantly surpassing that of MP-2, which recorded a rate of 49%.
Figure 7 provides further insight into the effects of the stratum water, revealing that the entire matrix area experienced a relatively uniform mobilization. While the oil within the pores remained largely immobile, oil within the throats was predominantly produced through imbibition. In the presence of the MP-1 solution, a light yellow microemulsion was visible within the model. However, due to the limited quantity of microemulsion and the short imbibition duration, some residual oil remained in the micromodel, primarily in the form of oil droplets. In contrast, when exposed to the MP-2 solution, no noticeable middle-phase microemulsion was observed. This was primarily attributed to the low oil solubility rate of the surfactant micellar solution. A significant number of dispersed small oil droplets were visible in the model. These small oil droplets tended to aggregate and block the pore throats, thus slowing down the imbibition process.
Figure 8 displays images of the crude oil discharge from the model’s edge when subjected to different formula solutions. Visual observations revealed that when discharged with stratum water, crude oil converged into larger oil droplets at each channel mouth, resembling the production pattern seen in core imbibition experiments. The absence of flow field disturbance made it challenging for these oil droplets to detach from the wall, thus hindering subsequent crude oil discharge.
In the presence of the microemulsion system solution, the discharged crude oil also accumulated at the channel openings. However, due to the reduced interfacial tension conditions, the adhesion of oil droplets to the wall was reduced, making it easier for them to be produced and enter the fracture channel. Nevertheless, due to the limited oil-soluble capacity of the surfactant micelle solution, crude oil could not be extracted in the form of a microemulsion.
Figure 9 reveals that when a substantial difference existed in the pore–throat ratio, the water phase accumulated predominantly within the throats, driven by capillary forces. This accumulation displaced the crude oil from the throats into the pores as a wetting phase. While the imbibition speed was rapid, the overall utilization degree remained relatively low.
As illustrated in Figure 10, when subjected to the MP-1 solution, both the oil phase within the pores and throats experienced consistent mobilization. The oil–water interface progressed uniformly due to the influence of gravity, leading to a higher recovery degree. Furthermore, as highlighted by the red arrow in the figure, the residual oil trapped in the pores also became miscible with the surfactant micelle solution, forming a middle-phase microemulsion that was progressively extracted.
Referring to the microscopic dynamic image presented in Figure 11, it becomes apparent that the oil–water interface progressed unevenly. Additionally, the initial utilization of the oil phase in the throats led to the entry of some surfactant micelle solution droplets into the oil phase, creating a water-in-oil emulsion with a darker color and reduced flowability. Consequently, this diminished the overall degree of imbibition recovery.
In conclusion, the imbibition recovery rates of the three fluids, ranked from highest to lowest, were the MP-1 solution, MP-2 solution, and stratum water. It is noteworthy that the imbibition behavior of the in situ microemulsion system followed a bottom-up forward imbibition pattern. The low interfacial tension enhanced the utilization of crude oil in the throats. The variation in the recovery degree primarily arose from the differing amounts of crude oil produced in the pores by the various fluids.

4. Investigation into the Injection and Flowback Mechanism of the Microemulsion System

In the context of developing huff-n-puff fracturing horizontal wells, the imbibition recovery degree serves as a key indicator of the oil and water displacement capabilities upon entering the fracture. Additionally, it is crucial to assess the challenges associated with entering the matrix and the subsequent flowback process. Consequently, this section delves into the injection and flowback performance of the surfactant micelle solution, building on the insights derived from the imbibition experiments.

4.1. Materials

The experimental materials and equipment were the same as Section 3.1, and the experimental plan is shown in Table 4.
Figure 12 presents the physical model with dimensions measuring 1.5 cm by 2 cm. This model included semi-open cracks, each measuring 1 cm by 200 µm by 50 µm. Additionally, the model featured pores with an average width of approximately 30 µm and an average depth of about 15 µm. The average throat width was approximately 4 µm, with a depth of around 800 nm.

4.2. Microscopic Injection Experiment

The injection experiment procedure was as follows:
(1)
Saturated oil. Initially, a constant-pressure pump was used to introduce crude oil into the previously dried model, starting at an initial pressure of 0.3 MPa. The injection pressure was gradually increased to 0.7 MPa until all the air bubbles within the model were expelled.
(2)
Injection. A constant-speed pump was utilized to inject either stratum water or the respective chemical system through the inlet at a controlled injection rate of 0.1 µL/min. The injection was ceased once 2 PV were displaced. Images and videos were periodically captured throughout this injection phase for subsequent analysis.

4.3. Microscopic Flowback Experiment

The flowback experiment process was as follows:
(1)
Saturated fluid. A constant-pressure pump was used to inject different types of fluids into the dried model at a pressure of 0.3 MPa, and the injection pressure was gradually increased to 0.7 MPa until all the bubbles in the model were discharged.
(2)
Crude oil flowback. A constant-speed pump was used to inject crude oil from the outlet at an injection rate of 0.1 µL/min. The injection was stopped after displacing 2 PV, and images and videos were collected regularly during this period.

4.4. Results and Discussion

4.4.1. Experimental Study on Injection

Figure 13 presents the process images of the injection of different formulations. As depicted in the figure, the injected system tended to follow the fracture. Following the breakthrough of the semi-open fracture, the flow gradually extended to the surrounding areas, resulting in a significant accumulation of remaining oil at the model boundary.
Examining the microscopic dynamic image presented in Figure 14, it becomes apparent that when the stratum water entered the matrix, it efficiently utilized nearly all the crude oil within the pore body. The residual oil primarily consisted of the oil phase in the unswept area, residual oil within the pore body, and oil retained due to the Jamin effect in the throat.
The fluid flow after injecting into the microemulsion system followed a more intricate flow pattern, including piston flow at the displacement front, along with the movement of microemulsion and oil droplets within the affected area. In this scenario, the remaining oil primarily included the oil phase within the pore body in the unaffected area as well as the oil phase adhering to the walls and oil droplets retained within the pore body.

4.4.2. Experimental Study on Flowback

Figure 15 presents a series of images depicting the process of crude oil flowback after saturation with different formulations. As evident from the figure, in the absence of fractures within the matrix area, the injected stratum water advanced uniformly due to the low viscosity of the crude oil and the minimal difference in oil and water mobility. Conversely, in the presence of fractures, crude oil predominantly flowed back along these fractures. When semi-open fractures were encountered, the crude oil flowed directly to the outlet without significantly affecting other areas of the matrix. The occupancy rate of crude oil was approximately 47%.
In the case of saturation with the MP-1 solution, the oil–water interface progressed evenly throughout the process, resulting in an increased occupancy rate of approximately 94% after crude oil flowback. Importantly, the presence of fractures did not lead to the formation of crossflow channels, indicating that the variation in pore–throat size had minimal impact on the flowback of crude oil.
Referring to the microscopic dynamic image presented in Figure 16, during the flowback process of injected stratum water, the crude oil, being a nonwetting phase, tended to preferentially flow through the throats with the least resistance. As a result, most of the throats remained devoid of crude oil entry, allowing a significant portion of the affected areas, particularly the pores, to be refilled with crude oil. In contrast, when the MP-1 solution was employed, it exhibited the ability to mitigate the impact of throats on the flowback process, ensuring that a greater number of throats and pores were influenced by the presence of crude oil.
Upon closer examination of the partial enlargement in Figure 17 following crude oil flowback, when saturated with stratum water, the crude oil primarily occupied the central regions of the pores. This resulted in a significant presence of continuous bound water within the channels. In this oil–water occurrence mode, a substantial amount of bound water remained trapped in the throats, leading to a notable reduction in the flow channels available for the oil phase. Consequently, there was a substantial decrease in the relative permeability of the oil.
Following saturation with the MP-2 solution, bound water mainly existed in the form of very small droplets within the pores, and water droplets adhered to the walls during the flowback process. In this oil–water occurrence mode, the water had a minimal impact on the crude oil flow channels, allowing for the restoration of a significant portion of the relative permeability of the oil.

5. Conclusions

In addressing the challenge of enhancing oil recovery in the Mahu tight oil reservoir, a comprehensive screening and assessment of the in situ microemulsion system was conducted. This work involved the creation of a microfluidic model featuring a multi-level pore–throat system. The experimental investigation focused on the imbibition and flowback processes using micellar solutions containing various surfactants. The key research findings can be summarized as follows:
(1)
The results from the salinity scan experiments revealed that only two surfactants, namely, S13B and C12PO15S, possessed the capability of generating a substantial middle-phase microemulsion when combined with Mahu crude oil.
(2)
A micromodel was constructed, incorporating a multi-level pore–throat system that encompassed millimeter-scale fractures, micron-scale pores, and nano-scale throats to elucidate the imbibition dynamics of the in situ microemulsion system. The imbibition recovery rates, ranked from highest to lowest, followed the order of the MP-1 solution, the MP-2 solution, and stratum water. The microemulsion system solutions exhibited bottom-up forward imbibition modes facilitated by low interfacial tension. The primary factor contributing to the disparity in the recovery rates lay in the varying degrees of crude oil utilization within the pores. The reduction in interfacial tension within the microemulsion system and the miscibility of the microemulsion formed through emulsification were the principal mechanisms responsible for enhancing the imbibition efficiency.
(3)
Experimental investigations were conducted on the injection and flowback within a micromodel representing a multi-stage pore–throat system. This elucidated the pressure reduction, injection mechanism, and flowback dynamics of the microemulsion system. In comparison to stratum water, the microemulsion system displayed more intricate seepage dynamics during injection. It encompassed not only piston flow at the displacement front but also laminar flow involving the microemulsion, crude oil, and water within the affected area. Additionally, free oil droplets were observed in the flow. This unique flow pattern is crucial for achieving depressurization and enhanced injection. The microemulsion system solution effectively mitigated micro-pore throat heterogeneity during the injection process, avoiding crossflow along the throats and enhancing the utilization of the oil phase within the pore body. Within the matrix areas invaded by stratum water, crude oil primarily occupied the central regions of the pores after flowback, with numerous throats containing bound water. This led to a notable reduction in the flow channels available for the oil phase, resulting in a significant decrease in the oil’s relative permeability. However, the microemulsion system effectively addressed the channeling issues caused by disparities in size among the fractures, pores, and throats. It achieved a uniform progression of the oil–water interface during the crude oil flowback process. Bound water primarily existed in the form of small droplets within the pores and water droplets adhering to the walls. Water had minimal impact on the crude oil flow channels, allowing for the restoration of a substantial portion of the oil’s relative permeability.

Author Contributions

Investigation, writing—original draft, and data curation, M.Z.; writing—review and editing and resources, C.Z.; writing—original draft preparation, J.L. (Ji Li) and X.M.; writing—review and editing, J.L. (Junjian Li); project administration, investigation, and validation R.W.; formal analysis and conceptualization, H.L. All authors have read and agreed to the published version of the manuscript.

Funding

This research received no external funding.

Data Availability Statement

The data presented in this study are available upon request from the corresponding authors.

Acknowledgments

We would like to express our appreciation to the other members of the laboratory for help provided in experiments and language editing.

Conflicts of Interest

Authors Meiting Zeng, Chuanzhen Zang, Jie Li, Rui Wang and Haifu Li, were employed by the Xinjiang Oilfield Company. The authors declare that the research was conducted in the absence of any commercial or financial relationships that could be construed as a potential conflict of interest.

Abbreviations

The following abbreviations are used in this manuscript:
HnPHuff-n-puff
EOREnhanced oil recovery
PHHydrogen ion concentration
rpmRevolutions per minute
PVPore volume

References

  1. Dou, H.; Ma, S. Lessons learned from oil production of tight oil reservoirs in Bakken play. J. Oil Drill. Prod. Technol. 2012, 34, 120–124. [Google Scholar]
  2. Capuano, L. Annual Energy Outlook 2019; US Energy Information Administration: Washington, DC, USA, 2019. [Google Scholar]
  3. Zheng, Z.; Li, D.; Wang, Z.; Jia, J.; Gao, X.; Liu, Z.; Zan, X.; Guo, J. Assessment of the potential of tight oil and gas in major basins in China. J. China Min. Mag. 2017, 26, 22–29. [Google Scholar]
  4. Wan, T.; Tan, J.; Zhang, J. Practices of Zipper Fracturing for Tight Reservoir Development with Small Well Spacing. Xinjiang Oil Gas 2022, 18, 26–32. [Google Scholar] [CrossRef]
  5. Wang, M.; Fan, Z.; Luo, W.; Ding, J.; Tian, Q.; Yao, M.; Bu, X. Feasibility Analysis of Water Flooding with Multi-fractured Horizontal Wells in Ultra-low Permeability Reservoirs. J. Geosci. 2016, 30, 1361–1369. [Google Scholar]
  6. Cui, C.; Chen, H.; Guo, Y.; Wang, Q.; Zhang, S. Reasonable Water-injecting Development Methods of Multiple-fracturing Horizontal Well in Ultra-Low Permeability Glutenite Reservoir. J. Geosci. 2018, 32, 198–204. [Google Scholar]
  7. Zhu, W.; Yue, M.; Liu, Y.; Liu, K.; Song, Z. Research progress on tight oil exploration in China. J. Chin. J. Eng. 2019, 41, 1103–1114. [Google Scholar]
  8. Liu, X.; Gu, W. Status and prospect of water injection in the development of oil reservoirs with extra/ultra-low permeability. J. Petrochem. Ind. Appl. 2017, 36, 4–8. [Google Scholar]
  9. Pu, C.; Jing, C.; He, Y.; Gu, X.; Zhang, Z.; Wei, J. Multistage interwell chemical tracing for step-by-step profile control of water channeling and flooding of fractured ultra-low permeability reservoirs. J. Pet. Explor. Dev. 2016, 43, 621–629. [Google Scholar] [CrossRef]
  10. Li, E.; Li, T.; Yu, W.; Downhole Operation company of XDEC. Analysis of Fracturing Technology in Ma2 Well Area of Mabei Oilfield. J. Xinjiang Oil Gas 2015, 11, 80–84. [Google Scholar]
  11. Zheng, C.; Zhang, L.; Xu, J.; Zeng, M.; Fu, G.; Fu, Y. Construction and Performance Evaluation of Nano Microemulsion Oil Displacement System. J. Xinjiang Oil Gas 2023, 19, 89–94. [Google Scholar]
  12. Al-Mishaal, O.F.; Suwaid, M.A.; Al-Muntaser, A.A.; Khelkhal, M.A.; Varfolomeev, M.A.; Djimasbe, R.; Zairov, R.R.; Saeed, S.A.; Vorotnikova, N.A.; Shestopalov, M.A.; et al. Octahedral Cluster Complex of Molybdenum as Oil-Soluble Catalyst for Improving In Situ Upgrading of Heavy Crude Oil: Synthesis and Application. Catalysts 2022, 12, 1125. [Google Scholar] [CrossRef]
  13. Tajik, A.; Farhadian, A.; Khelkhal, M.A.; Rezaeisadat, M.; Petrov, S.M.; Eskin, A.A.; Vakhin, A.V.; Babapour Golafshani, M.; Lapuk, S.E.; Buzurov, A.E.; et al. Sunflower oil as renewable biomass source to develop highly effective oil-soluble catalysts for in-situ combustion of heavy oil. Chem. Eng. J. 2023, 453, 139813. [Google Scholar] [CrossRef]
  14. Chandio, T.A.; Manan, M.A.; Memon, K.R.; Abbas, G.; Abbasi, G.R. Enhanced Oil Recovery by Hydrophilic Silica Nanofluid: Experimental Evaluation of the Impact of Parameters and Mechanisms on Recovery Potential. Energies 2021, 14, 5767. [Google Scholar] [CrossRef]
  15. Bello, A.; Ivanova, A.; Cheremisin, A. A Comprehensive Review of the Role of CO2 Foam EOR in the Reduction of Carbon Footprint in the Petroleum Industry. Energies 2023, 16, 1167. [Google Scholar] [CrossRef]
  16. Wang, Q.; Zheng, W.; Liu, J.; Cao, B.; Hao, J.; Lu, X.; Zheng, K.; Cui, L.; Cui, T.; Sun, H. Integration of Profile Control and Thermal Recovery to Enhance Heavy Oil Recovery. Energies 2022, 15, 7346. [Google Scholar] [CrossRef]
  17. Zhang, S.; Zhu, F.; Xu, J.; Liu, P.; Chen, S.; Wang, Y. Spontaneous Imbibition and Core Flooding Experiments of Enhanced Oil Recovery in Tight Reservoirs with Surfactants. Energies 2023, 16, 1815. [Google Scholar] [CrossRef]
  18. Zhao, P.; Jackson, A.C.; Britton, C.; Kim, D.H.; Britton, L.N.; Levitt, D.B.; Pope, G.A. Development of High-Performance Surfactants for Difficult Oil. In Proceedings of the SPE Symposium on Improved Oil Recovery, Tulsa, OK, USA, 20–23 April 2008; p. SPE-113432-MS. [Google Scholar]
  19. Yin, D.; Xu, W.; Zhou, Y. Optimization and Performance Research of Microemulsion Applied on Low Permeability Reservoir. J. Petrochem. Univ. 2017, 30, 20–25. [Google Scholar]
  20. Xiao, L.; Hou, J.; Wen, Y.; Qu, M.; Wang, W.; Wu, W.; Liang, T. Imbibition mechanisms of high temperature resistant microemulsion system in ultra-low permeability and tight reservoirs. J. Pet. Explor. Dev. 2022, 49, 1398–1410. [Google Scholar] [CrossRef]
  21. Wang, W.; Li, Y.; Xu, Y.; Zang, W.; Zhu, J.; Bao, X. Development of in-situ microemulsion surfactant system and its application in pressure decrease and injection increase. J. Pet. Geol. Oilfield Dev. Daqing 2021, 40, 116–122. [Google Scholar]
  22. Kathel, P.; Mohanty, K.K. Wettability Alteration in a Tight Oil Reservoir. J. Energy Fuels 2013, 27, 6460–6468. [Google Scholar] [CrossRef]
  23. Chen, P.; Mohanty, K.K. Surfactant-Mediated Spontaneous Imbibition in Carbonate Rocks at Harsh Reservoir Conditions. J. SPE J. 2013, 18, 124–133. [Google Scholar] [CrossRef]
  24. Yu, F.; Jiang, H.; Ma, M.; Xu, F.; Su, H.; Jia, J. Visualization the Surfactant Imbibition at Pore Scale by Using of Fractured Micromodels. In Proceedings of the SPE Improved Oil Recovery Conference, Virtual, 31 August–4 September 2020; p. SPE-200349-MS. [Google Scholar]
  25. Li, J.; Liu, B.; Guo, C.; Hang, S.; Yu, F.; Ma, M.; Wang, L.; Jiang, H. Mechanisms of water block removal by surfactant micellar solutions in low permeability reservoirs. J. Pet. Explor. Dev. 2022, 49, 348–357. [Google Scholar] [CrossRef]
Figure 1. Experimental ME-1 salinity scans image.
Energies 17 01879 g001
Figure 2. Experimental ME-2 salinity scans image.
Energies 17 01879 g002
Figure 3. Test results of interfacial tension between S13B system and Mahu crude oil.
Energies 17 01879 g003
Figure 4. Test results of interfacial tension between C12PO15S system and Mahu crude oil.
Energies 17 01879 g004
Figure 5. Microscopic model for imbibition experiment. (a) Saturated oil. (b) Unsaturated oil. (c) Microscopic porous structure.
Energies 17 01879 g005
Figure 6. Imbibition process in micromodel using different formulations: (a) stratum water imbibition 4 h; (b) stratum water imbibition 24 h; (c) stratum water imbibition 48 h; (d) S13B solution imbibition 4 h; (e) S13B solution imbibition 24 h; (f) S13B solution imbibition 48 h; (g) C12PO15S solution imbibition 4 h; (h) C12PO15S solution imbibition 24 h; (i) C12PO15S solution imbibition 48 h.
Energies 17 01879 g006
Figure 7. Enlarged image of the micromodel after imbibition using different formula solutions: (a) global image of stratum water imbibition; (b) enlarge image of stratum water imbibition; (c) global image of S13B solution imbibition; (d) enlarge image of S13B solution imbibition; (e) global image of C12PO15S solution imbibition; (f) enlarge image of C12PO15S solution imbibition.
Energies 17 01879 g007
Figure 8. Enlarged image of crude oil being extracted from the top during the imbibition process of a micromodel with different formulas: (a) stratum water; (b) S13B solution; (c) C12PO15S solution.
Energies 17 01879 g008
Figure 9. Imbibition process in micromodel with synthetic formation brine: (a) Initial moment; (b) 20 s later; (c) 25 s later; (d) 28 s later; (e) 30 s later; (f) 32 s later; arrows indicate the direction of crude oil flow during imbibition.
Energies 17 01879 g009
Figure 10. The imbibition process of the micromodel with MP-1 solution: (a) Initial moment; (b) 10 min later; (c) 20 min later; (d) 30 min later; (e) 60 min later; (f) 90 min later; arrows indicate the direction of crude oil flow during imbibition.
Energies 17 01879 g010
Figure 11. The imbibition process of the micromodel with MP-2 solution: (a) Initial moment; (b) 30 min later; (c) 60 min later; (d) 90 min later; (e) 120 min later; (f) 150 min later; arrows indicate the direction of crude oil flow during imbibition.
Energies 17 01879 g011
Figure 12. Real picture of microscopic imbibition models. (a) Saturated oil. (b) Unsaturated oil. (c) Microstructure.
Energies 17 01879 g012
Figure 13. Microscopic global images during the injection process of different formulas: (a) initial state; (b) inject stratum water for 10 min; (c) inject stratum water for 60 min; (d) initial state; (e) inject S13B solution for 10 min; (f) inject S13B solution for 60 min.
Energies 17 01879 g013
Figure 14. Local dynamic images during the injection process under different formulas: (a) initial state; (b) inject stratum water for 30 s; (c) inject stratum water for 60 s; (d) inject stratum water for 90 s; (e) inject stratum water for 120 s; (f) inject stratum water for 150 s; (g) initial state; (h) inject S13B solution for 20 s; (i) inject S13B solution for 60 s; (j) inject S13B solution for 1200 s; (k) inject S13B solution for 3000 s; (l) inject S13B solution for 4800 s; arrows indicate the direction of crude oil flow during imbibition.
Energies 17 01879 g014
Figure 15. Global images of microscopic models during different formulas flowback processes: (a) initial stage of stratum water flowback; (b) stratum water flowback for 2 min; (c) stratum water flowback for 15 min; (d) stratum water flowback for 30 min; (e) initial stage of S13B solution flowback; (f) S13B solution flowback for 2 min; (g) S13B solution flowback for 15 min; (h) S13B solution flowback for 30 min.
Energies 17 01879 g015
Figure 16. Global image of crude oil flowback process in different formula microscopic models: (a) initial stage of stratum water flowback; (b) stratum water flowback for 90 s; (c) stratum water flowback for 180 s; (d) stratum water flowback for 270 s; (e) stratum water flowback for 350 s; (f) stratum water flowback for 420 s; (g) initial stage of S13B solution flowback; (h) S13B solution flowback for 60 s; (i) S13B solution flowback for 100 s; (j) S13B solution flowback for 150 s; (k) S13B solution flowback for 200 s; (l) S13B solution flowback for 900 s.
Energies 17 01879 g016
Figure 17. Enlarged images of microscopic model of saturated different formula solution after crude oil flowback: (ac) saturated stratum water (df) saturated S13B solution.
Energies 17 01879 g017
Table 1. Formation brine properties.
Density
g/cm3
HCO3
mg/L
Cl
mg/L
SO42−
mg/L
Ca2+
mg/L
Mineralization
mg/L
pH
1.01283043.074188.24249.78446.499848.146.1
Table 2. Results of surfactant screening experiments.
No.Surfactant TypeSurfactant ConcentrationN-Butanol ConcentrationSaltWhether Intermediate Phase Appeared
ME-1S13B1%2%KCl
ME-2C12PO15S1%2%KCl
ME-3AEO-10PS1%2%KCl×
ME-4AEO-15PS1%2%KCl×
ME-5C13PO10S1%2%KCl×
ME-6C8P10E5C1%2%KCl×
Table 3. Formula design of microemulsion system.
FormulaSurfactant TypeSurfactant ConcentrationN-Butanol ConcentrationSalinity
MP-0///stratum water
MP-1S13B1%2%6% KCl
MP-2C12PO15S1%2%0.4% KCl
Table 4. Injection and flowback experimental plan table.
FormulaSurfactant TypeSurfactant ConcentrationN-Butanol ConcentrationSalinity
MP-0///stratum water
MP-1S13B1%2%6% KCl
Disclaimer/Publisher’s Note: The statements, opinions and data contained in all publications are solely those of the individual author(s) and contributor(s) and not of MDPI and/or the editor(s). MDPI and/or the editor(s) disclaim responsibility for any injury to people or property resulting from any ideas, methods, instructions or products referred to in the content.

