1. Introduction
The occurrence of electrodynamic forces in high-current circuits during the flow of a short-circuit current is a common phenomenon. Nevertheless, determining the exact electrodynamic load capacity for single- and multi-strand copper current paths in switchgear is a real challenge even for an experienced constructor. In general, the obtained analytical results are burdened with a certain amount of approximation through the use of calculation simplifications. For each calculation for individual current circuits, the calculation is based on knowledge of the permissible values of bending stress for the material from which the considered section of the current circuit is made. In order to determine the moments and electrodynamic forces affecting the current paths, the equations of Biot Savart, Lorentz, or Maxwell are used. Maxwell’s equations are used to calculate the electrodynamic forces in current path systems for which analytical expressions of inductance are known. The Lorentz and Biot Savart equations are generally used to calculate the electrodynamic moments and forces that act on the rectilinear parts of the current paths. When designing current circuits of switchgears, attention should be paid to, and necessary calculations should be related to the following (
Figure 1):
Stresses arising in the current circuits at the time of the flow of short-circuit currents;
Reaction forces acting on the fastening elements and other brackets with which the current paths are fixed; this allows the selection of an appropriate insulator of the required strength and number of these elements;
Moments acting on moving parts, i.e., moving contacts of switches, in the closed state and at the moment of switching on short-circuit currents (shown in
Figure 1 below);
Forces acting on the electric arc.
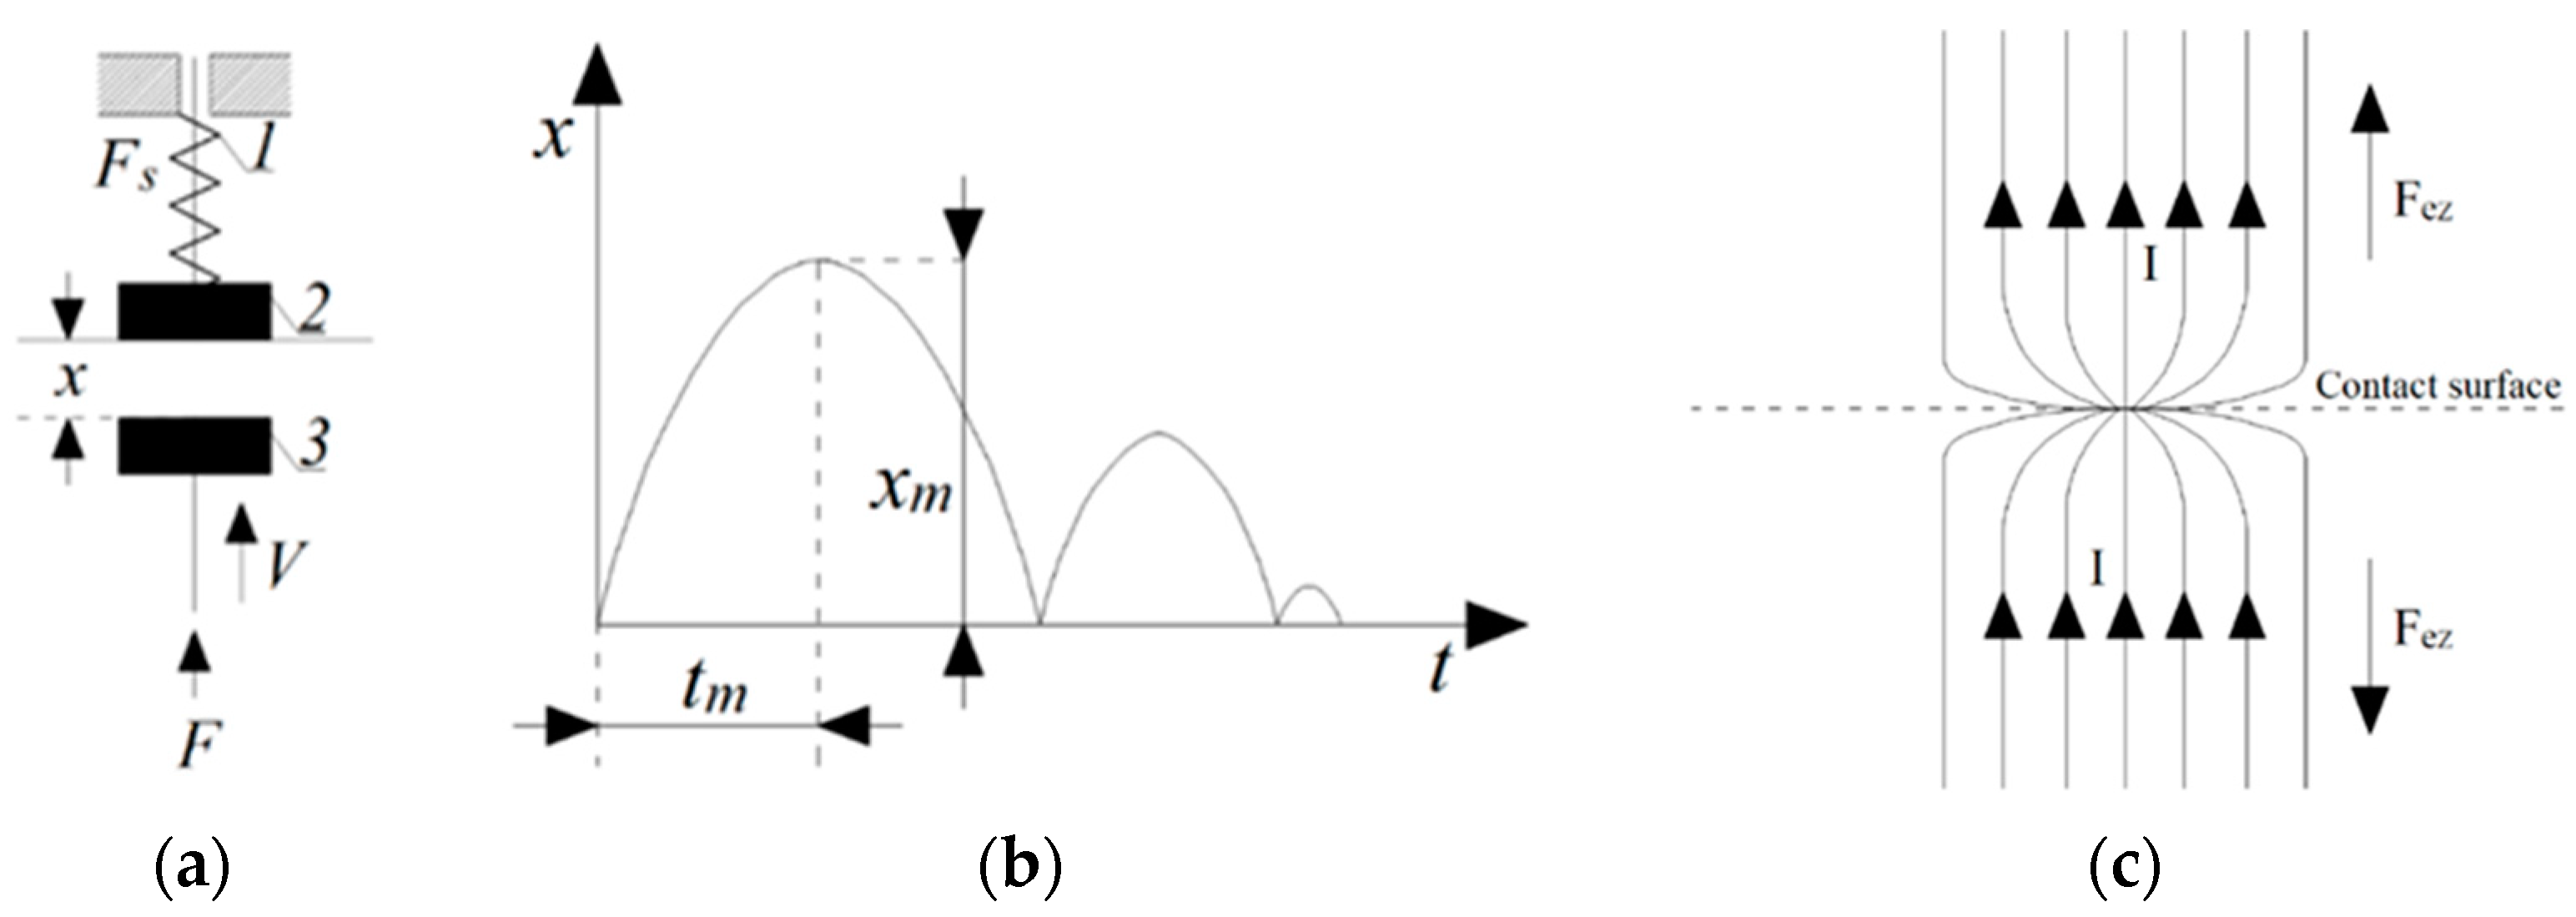
Figure 1.
Spring bounces of contacts during flow of current and currentless conditions: (a) arrangement of contacts in currentless conditions: 1—spring contact, 2—fixed contact, 3—movable contact, V—contact velocity, F—movable contact force, Fs—spring force; (b) diagram of the relative motion of the contacts, tm—contact movement time, Xm—travelled distance by movable contact; (c) electrodynamic interactions during flow of current through electrical contacts layout, Fez—electrodynamic repulsion force, I—current flow.
Performing this type of calculation poses significant difficulty, and it is easy to insert a calculation error that will make the result useless. During analytical calculations, the constructor must determine such parameters as the following:
Electrodynamic stress distribution along the current path;
The resultant force acting on the considered current path;
Moment of resultant force;
Point of application of the resultant force.
Analytical methods do not allow precise calculations concerning complex switchgear systems, such as the main low- or medium-voltage switchgears. Currently, calculation results are obtained through the use of FEA (finite element analysis) methods with the use of a structural model with 3D technology, which allows very accurate mapping of the analyzed structure and the performance of accurate calculations of the electrodynamic forces in the virtually considered element of the switchgear structure, both of low and medium voltages. In this work, authors focused on confirming the thesis that the use of FEA numerical analysis employing the ANSYS software 2023 provides accurate calculation results regarding the determination of electrodynamic forces in low-voltage switchgears.
2. State of the Art
In the literature, it is possible to find research dealing with the interactions of electrodynamic forces in overhead lines. The authors of [
1] conducted tests of short-circuit stresses in 145 kV busbar systems with flexible conductors. The influence of various parameters, such as span length, sag, cable type, cable spacing, and the spring effect in poles was tested. RMS currents of 20–50 kA and short-circuit times of 0.1–0.5 s were tested analytically and numerically. Dynamic short-circuit stresses in HV (high-voltage) substations with flexible conductors are also presented in [
2]. Tensile forces, stresses, and cable displacements were tested for short-circuit currents of 20–40 kA (RMS) in test systems representing stressed cables of typical 123 kV and 420 kV substations over a span of 40 m. A simple calculation method was developed based on the approach from IEC 865 and DIN publications VDE 0103, but taking into account the short-circuit duration, leading to reduced forces and displacements in the event of short-term current flow.
In [
3], the author considers the calculation of the axial electromagnetic forces on the windings of a step-up transformer in unbalanced MMFs (modal properties in multimode fibers) of the same phase using finite element code. The unbalance between FRPs (fluctuation—relaxation paths) of the same phase, which can be on the order of the nominal FRP, is due to the high saturation of the iron core that occurs during the transient due to the improper paralleling of the transformer with the very low-impedance network. These FRPs are assessed using a non-linear circuit model of a three-phase transformer. At MMF peaks, the magnetic field in the transformer window is calculated using a two-dimensional non-linear model and then the Lorentz forces acting on the windings are evaluated. The result of the calculation is expressed as the ratio of the axial forces with and without the unexpressed MMF as a function of the impedance of the out of parallel network. The paper presents a comparison of the axial force acting on the concentric windings of a step-up transformer with and without MMF, during false parallelism with a phase error of 180 degrees. The analysis showed that the axial force acting on the outer winding with an unbalanced FRP can be much greater—2 to 10 times—for the two power transformers under consideration than assessed without MMF unbalance of the same phase, as is usually completed to verify the mechanical strength of transformers at the design stage. The authors point out, therefore, that designers should be aware of the importance of magnetic-circuit saturation during certain short-circuit transients that cause MMF asymmetry between windings of the same phase.
In item [
4], the author extended the model from item [
3] with a field interpretation. The use of a magnetostatic three-dimensional non-linear finite element model for the calculation of axial forces acting on the windings of a high-power autotransformer caused by short-circuit currents is described. The analyzed autotransformer with a five-arm core has an internal delta-connected tertiary winding. A comparison was made of the axial forces caused by the peak currents of both a time-varying fault and two conventional faults—a two-phase earth fault and a three-phase earth fault. The obtained results show that the time-varying fault causes greater axial forces than conventional faults, especially on the internal delta-connected tertiary winding.
One of the most pressing problems is the phenomenon of the flow of large currents during internal short circuits caused by failures of semiconductor elements [
5,
6]. This situation may result in damage to the device housing and other damage caused by the destructive effects of electrodynamic forces. The proposal to eliminate fast-acting fuses, commonly used as short-circuit protection, requires the determination of the strength characteristics of the device (peak value of the current that destroys the housing as a function of time). In such a case, the load level of the converter should be designed so that the current of the device does not exceed the permissible value before the AC power switch is tripped. The article analyzes overcurrent protection methods. Some experiences and research results in this field are given. Mechanisms of destruction of semiconductor power devices under the influence of very high short-circuit currents are discussed. The summary provides guidelines for the design of power electronic devices without fast overcurrent protection with a semiconductor fuse.
In publication [
7], during the conditioning pulse, the toroidal field in RFX machines is connected to a capacitor bank, conditioning the oscillating current, and protecting the winding from an event by short-circuiting the winding with a pry bar, created from a set of end igniters. The efficiency of this pry bar is highly dependent on its application, which is associated with a device that can be held level and placed when applied to the winding. On the other hand, the additional current in the crowbar must be low enough to withstand one more ignition to avoid an accident in the event of it starting. A compromise on the value of the crowbar was obtained based on the analysis of electrodynamic forces and stresses in the toroidal field coils during the operation of the crowbar. The operation of the model also includes functions that are available in the stress values in the calculations, which are triggered by the stress from the crowbar.
In works [
8,
9,
10], a three-phase busbar system with straight, rigid conductors carrying short-circuit currents was developed. Calculations were completed with an alternating current mains voltage with a peak value equal to the peak value of the short-circuit current. This assumption is used in the IEC 865/92 standards. In this article, the work force and electric current are calculated by numerically solving the electromagnetic field diffusion equations using finite elements. Results were compared to calculation results with the IEC 865/86 standards and the revision manual of the IEC 865/92 standards. The comparison concerns parallel cross-sections in indoor basic and control AC installations. The calculated value in the case of multiple subconductors was larger than the value calculated using the standards. Using the older standards, the calculations reach fifty percent, while using the amendment there is a problem. They are likely to be removed from proximity. The authors analyzed a three-phase definite current and short-circuit current busbar, controlled using FEA, which was previously commissioned for rotating machines. The bus consists of aluminum conductors, three switches for each phase, in aluminum channels. This following technique is required: it includes distributions of individual phase currents between wires and conductors, which are not marked in advance. In the application of the calculation results, these are determined in terms of the frequency and unsteady state (in time).
The authors of [
11] investigated the arrangement of three-phase copper busbars in a low-voltage network. Each main phase conductor consisted of one to four bars of rectangular cross sections. It has been pointed out that a short circuit can introduce large, destructive forces. In order to ensure safe operation of the busbars and the power system, the dynamic stability of the short circuit must be verified. Three methods of calculating short-circuit electrodynamic forces of busbars are presented and analyzed. Valuable analytic expressions are proposed. For example, three methods with calculations were compared.
In publication [
12], the electromagnetic forces affected by the short-circuit current in a three-phase busbar in a vertical and horizontal arrangement were calculated. The short-circuit current densities are calculated mathematically. Calculations are made assuming that the steady-state AC peak value is equal to the short-circuit current peak value. The electromagnetic forces caused by the short-circuit current are calculated according to the equation introduced by the IEC 865/1993 standards. The electromagnetic force generated in the vertical arrangement is compared with the level of the busbar. The result showed that the busbar layout in the vertical arrangement has about twice the electromagnetic force compared to the horizontal arrangement. The arrangement of the busbars obviously affects the electromagnetic force caused by the short-circuit current. In addition, the electromagnetic force obtained from the vertical finite element simulation was consistent with the calculations obtained using the IEC 865/1993 standards.
Manuscript [
13] deals with EDFs (electrodynamic forces) research and development for the ERDF in the field of energy efficiency, focusing on amorphous metal distribution transformers (AMDT). Many prototypes built on Metglas 2605SA1, rated from 250 to 630 kVA from various manufacturers, were tested under short-circuit conditions according to IEC and ERDF standards. Some prototypes exceeded the acceptable value of 4% change in impedance after the short-circuit test. Rectangular windings provide poor resistance to short-circuit stresses. At the bottom of the tank, small particles of metal were found, detached from the amorphous core. In this case, the dielectric strength is not sufficient. The results show that the active part should be strong enough to withstand the high electrodynamic forces generated during the short-circuit test.
Knowledge of electromagnetic forces in various winding topologies provides designers and researchers [
2,
14] with a good basis to meet some of the requirements for new-generation transformers. The location of the control coil in the transformer determines the influence of electrodynamic forces on the behavior of the transformer. The article presents the principles of designing the control coil in transformers and presents the electrodynamic forces by comparing the analytical results with the results of the finite element analysis (FEM). The article analyzes the electrodynamics and the magnetic force dissipation field of 25 MVA power transformers in the conditions of short-circuiting high-voltage windings. The electrodynamic forces generated during short circuits must be well characterized [
15] in power grid applications because those can threaten the integrity of grid systems, in particular power transformers, but also inductive superconducting fault current limiters (SFCLs). These stresses can damage the windings, causing equipment failures, and affecting the operation of the power grid. The article presents an analysis of electrodynamic forces arising in an inductive SFCL of the transformer type in such extreme conditions based on the finite element method (FEM). The secondary of the planned devices is made of conductors coated with high-temperature superconductors (HTS), and various configurations (radial and axially arranged windings) are analyzed to determine the most suitable one for minimizing electromagnetic forces. FEM results for the developed radial and axial forces are evaluated and compared, as well as the current distribution and normal magnetic induction in each winding [
15].
The article [
16] presents numerical models obtained in the QuickField program for the analysis of three-phase rectangular busbar systems of low or medium voltage, in the steady state and in the short-circuit state. Using a magnetic harmonic model coupled with a fixed thermal model, the distribution of the thermal field for the rated current is determined. By combining the steady-state thermal model for the rated current and the magnetic model for the short-circuit current with the thermal model in the transient state, the time evolution of the temperature distribution in the short-circuit regime (not developed in this paper) can be determined. The transient magnetic model is used to determine the electrodynamic forces. Various types of busbar systems are being studied, with one or more conductors per phase in a balanced arrangement [
16].
Paper [
17] presents a coupled electrical, magnetic, thermal, and mechanical analysis of busbar systems under the influence of short-circuit currents. The analysis is executed using the finite element method, which allows accurate modeling of bidirectional interactions between separate continuum physicists. Unlike previous work, which only considered the peak value of the short-circuit current, this method evaluates the magnetic force, temperature rise, mechanical displacement, and their interactions over the simulation time of interest. Mechanical displacements are obtained using three-dimensional analysis. It was found that the type of busbar support can significantly affect the displacement of the conductor during the flow of short-circuit current. It was found that the increase in temperature caused by the flow of short-circuit current has little effect on the displacement of the busbar conductors.
In the publication [
18], it was noted that in the current carrying parts of electrical apparatus, under certain conditions, large currents are transferred, which also define large electrodynamic forces tending to distort the current contours. The most severe is the short-circuit regime in which the electrodynamic forces are proportional to the square of the short-circuit-breaking current. As a result of their operation, the temperature of the elements increases, the mechanical strength decreases and a very large regime of mechanical loads arises. This also places increased demands on materials for conductive busbars. From a practical point of view, the question of how a given coating affects the magnitude of the electrodynamic force is interesting. The use of protective coatings on heterogeneous materials can result in both a modification of the surface layer material that improves the performance properties of the workpiece, and the creation of some new composite materials with both high strength and sufficient ductility, as well as increased resistance to wear and corrosion. This leads to the improvement of some operating parameters in the contact area of current carrying busbars. It is also important to assess the influence of coatings on the magnitude of the electrodynamic force, which is also the subject of this study.
In [
19], the electrodynamic forces generated in transformers during a short circuit in power systems can be dangerous for the windings; therefore, transformers must be designed with certainty that the windings will withstand these forces. The article presents a computational model of a transformer made for calculations of electrodynamic forces in windings in the Comsol Multiphysics modeling environment.
Arrangement of the busbars obviously affects the electromagnetic force caused by the short-circuit current. In addition, the electromagnetic force obtained from the vertical finite element simulation was consistent with the calculations obtained using the IEC 865/1993 standards.
In [
19], the electrodynamic forces generated in transformers during a short circuit can be dangerous for the windings; therefore, transformers must be designed with the certainty that the windings will withstand these forces. The article presents a computational model of a transformer made for calculations of electrodynamic forces in windings in the Comsol Multiphysics modeling environment.
The two most dangerous operating modes of transformers in terms of electrodynamic force are discussed. The first mode of operation is a short circuit, and the second is the process of switching the transformer to the non-load state at the moment of the voltage passing through zero. The distribution of the magnetic field near the magnetic core, currents, voltages, and electrodynamic forces for the high- and low-voltage windings are calculated. The results for these two modes are compared. This article can be used as a basis for the creation of similar models by engineers. These models can be used to check the electrodynamic strength of new transformers in order to reduce the total costs of field tests [
20].
In publication [
21], the authors consider the issue of transformer resistance to wind from a point of view that has not been mentioned before. The authors compare the forces in the wind between short-circuit and non-load switching modes. The risk of winding damage caused by the inrush current occurring during the no-load state switching process was assessed. The inrush current and short-circuit current values were calculated for the ORTS417000/750/24/24 transformer. Conclusions were drawn as to the possibility of reaching a value close to the short-circuit current by inrush currents in specific situations. Calculations of magnetic fields and electrodynamic forces in the transformer for these operating modes were performed. Conclusions were drawn regarding the influence of the transformer operating mode on the value and place of application of electrodynamic forces. It was found that when checking the electrodynamic wind brace of transformers, the process of turning on the idle state should be taken into account.
The article [
4,
9,
22,
23,
24,
25] focused on finding the short-circuit duration for the calculation of dynamic effects in HV distribution substations with flexible conductors using the probabilistic method. To determine the short-circuit duration for selected substation points, a risk criterion was adopted, which is the expected annual frequency of exceeding the calculated values of dynamic forces. A dedicated simulation model based on the Monte Carlo method was used to analyze the dynamic effects of short-circuit current flow in the substation during short circuits within and in its vicinity. The fault duration model is a key part of the simulation model. As a result of discussing the influence of selected factors on the estimated short-circuit duration, guidelines were formulated to help determine its value and examples for 220 kV switchgear were provided.
A lot of interesting and valuable research is presented above. It should be noted that the presented models refer to standards that treat a three-phase short-circuit current as two-phase from an analytical point of view. This applies to the electrodynamic standards. The result of this approach is the finding that time-consuming and labor-intensive tests are difficult to procure in short-circuit laboratories. The results of these tests are usually burdened by large discrepancies between the proposed prototype and the final product. There is also the aspect of test system to consider [
26]. There are not many systems dedicated to testing electrodynamic forces in design or in accredited laboratories. Therefore, the authors of this publication focused on the analysis of physical phenomena related to the flow of a short-circuit current. Only the phenomenon of electrodynamic forces was selected. Real waveforms obtained from the short-circuit laboratory were used for the simulation. The whole waveforms were made for the actual runs, for the prototype of the low-voltage switchgear, which was proposed by the authors along with the arrangement of current paths within.
3. Electrodynamic Forces in FEM Simulations
The purpose of the publication was not to test the mechanical and electromechanical strength of electrotechnical equipment. Model validation was executed for critical states without any short-circuit-protection device. Manufacturer and equipment quality were not assessed. The conducted tests were not the type of tests used for the associated equipment. It is also worth mentioning that the research was critical to determining the value of the flowing current. The quality of the casing and insulators was not analyzed, and this has not been researched. The purpose of the research is clearly indicated at the beginning of the publication. The authors focused on interactions and phenomena in current paths.
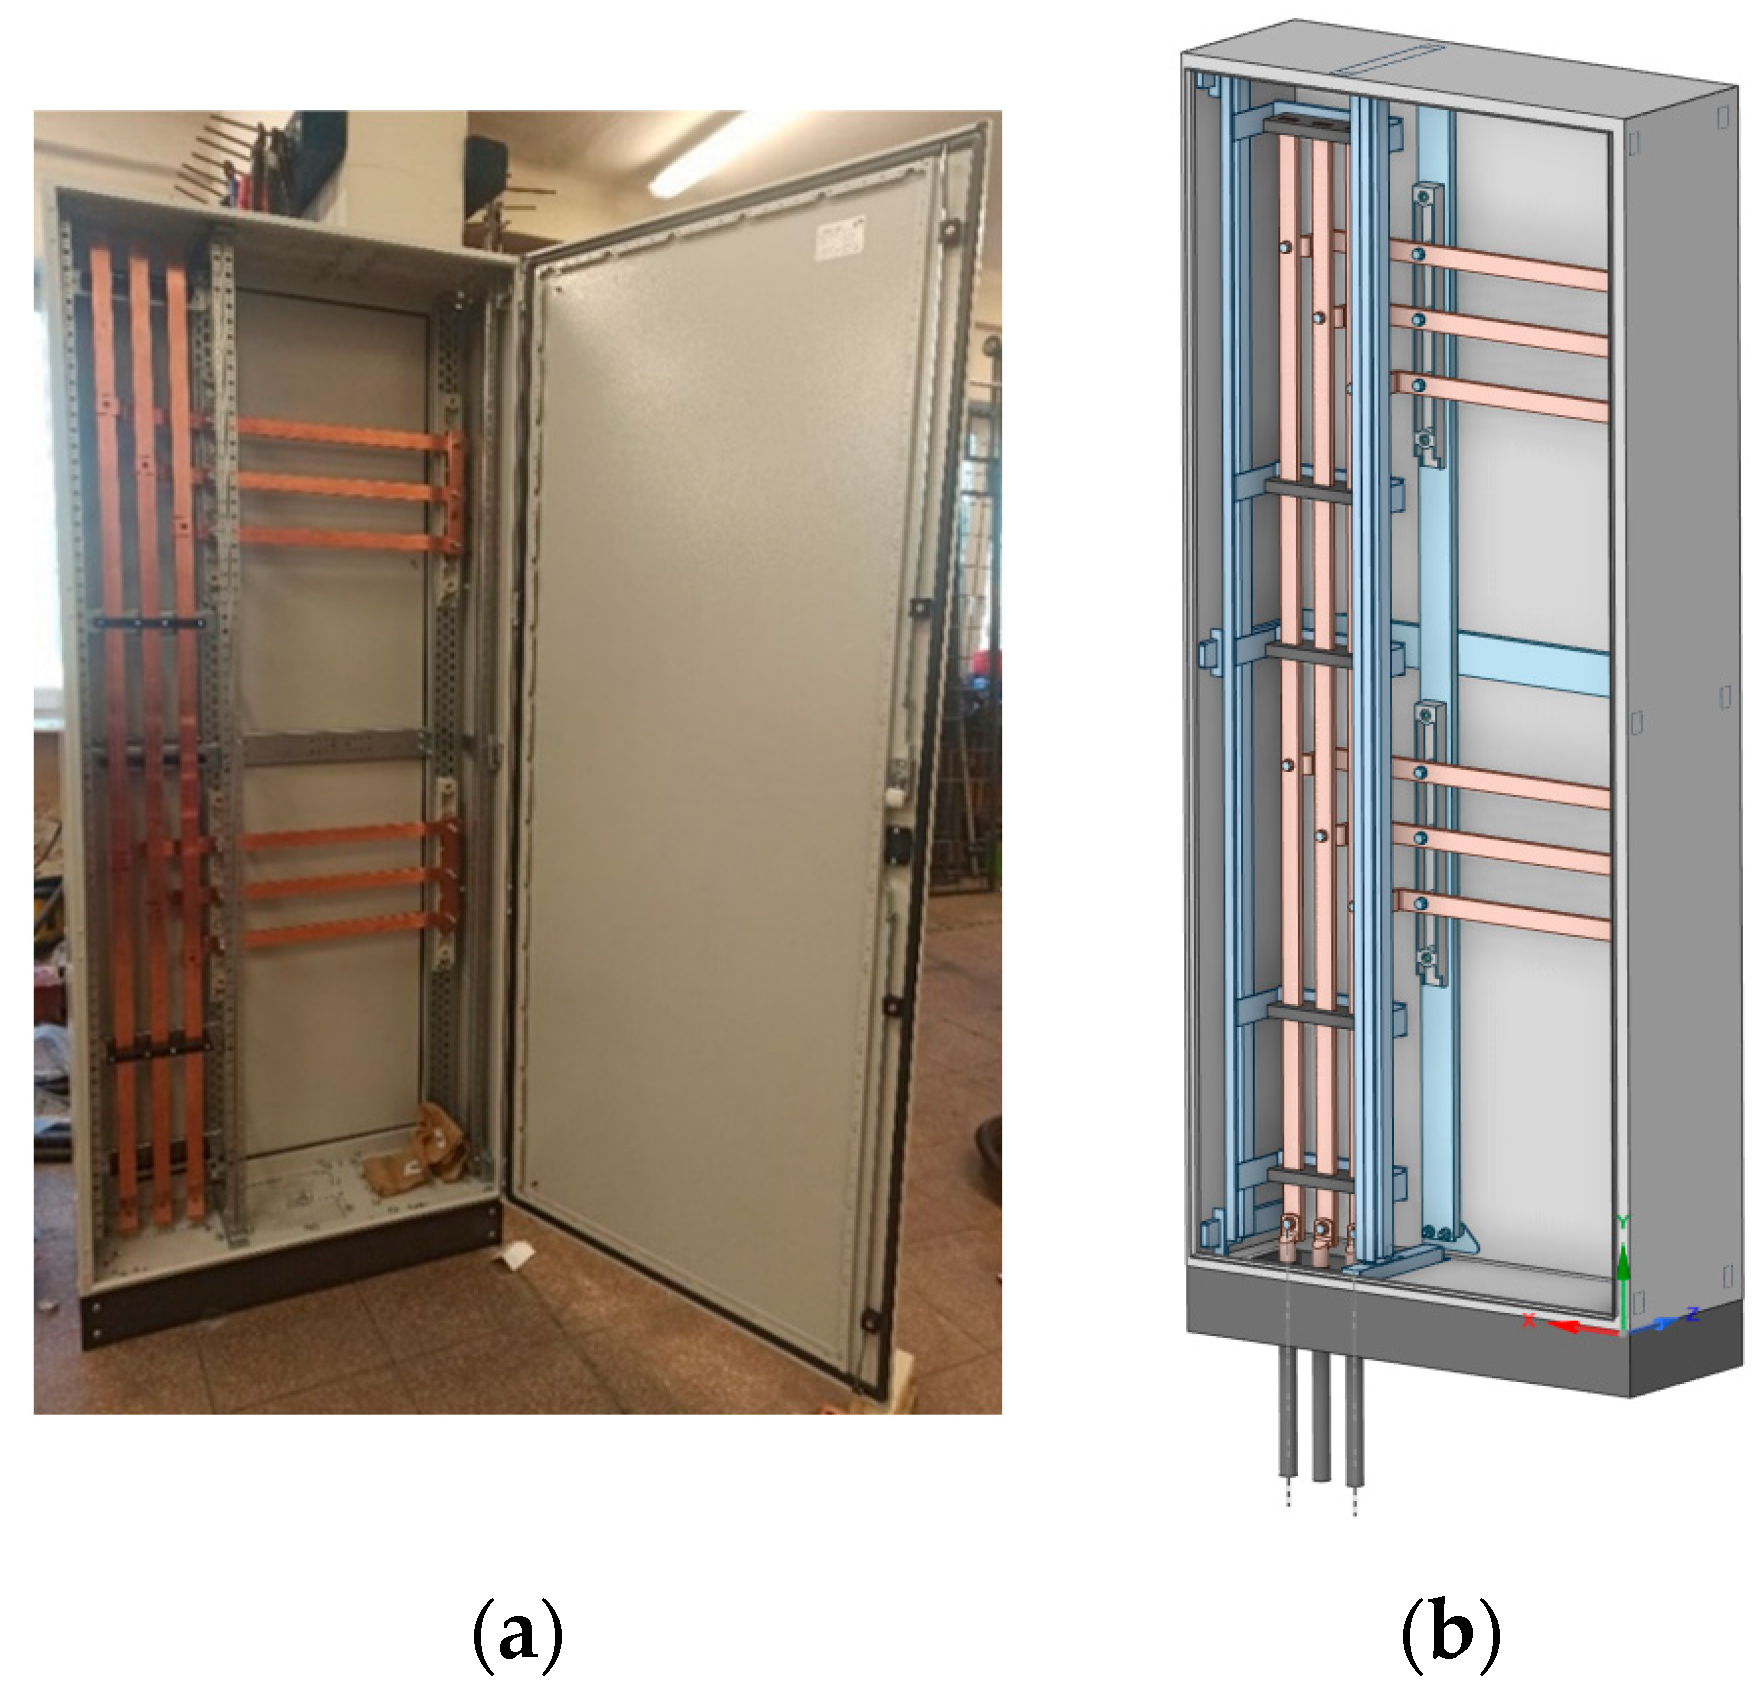
Low-voltage switchgears are constructed of materials that are able to withstand mechanical, thermal, and dynamic exposure from short-circuit currents. Requirements as to mechanical strength are imposed not only on enclosures, but also on all partitions, brackets, hinges, and locks, which should have adequate mechanical endurance to withstand the stresses arising during short circuits in the low-voltage switchgear. The real object prepared for experiments and its 3D model are shown in
Figure 2 below.
During the flow of the short-circuit current through the current paths and switchgear wires, electrodynamic forces are generated, which generate stresses on the support insulators of the current paths and cable fastenings, mainly between the following:
Current paths;
Current wires;
Ferromagnetic materials, conductors, and busbars;
Boundary surfaces of materials with different magnetic permeability.
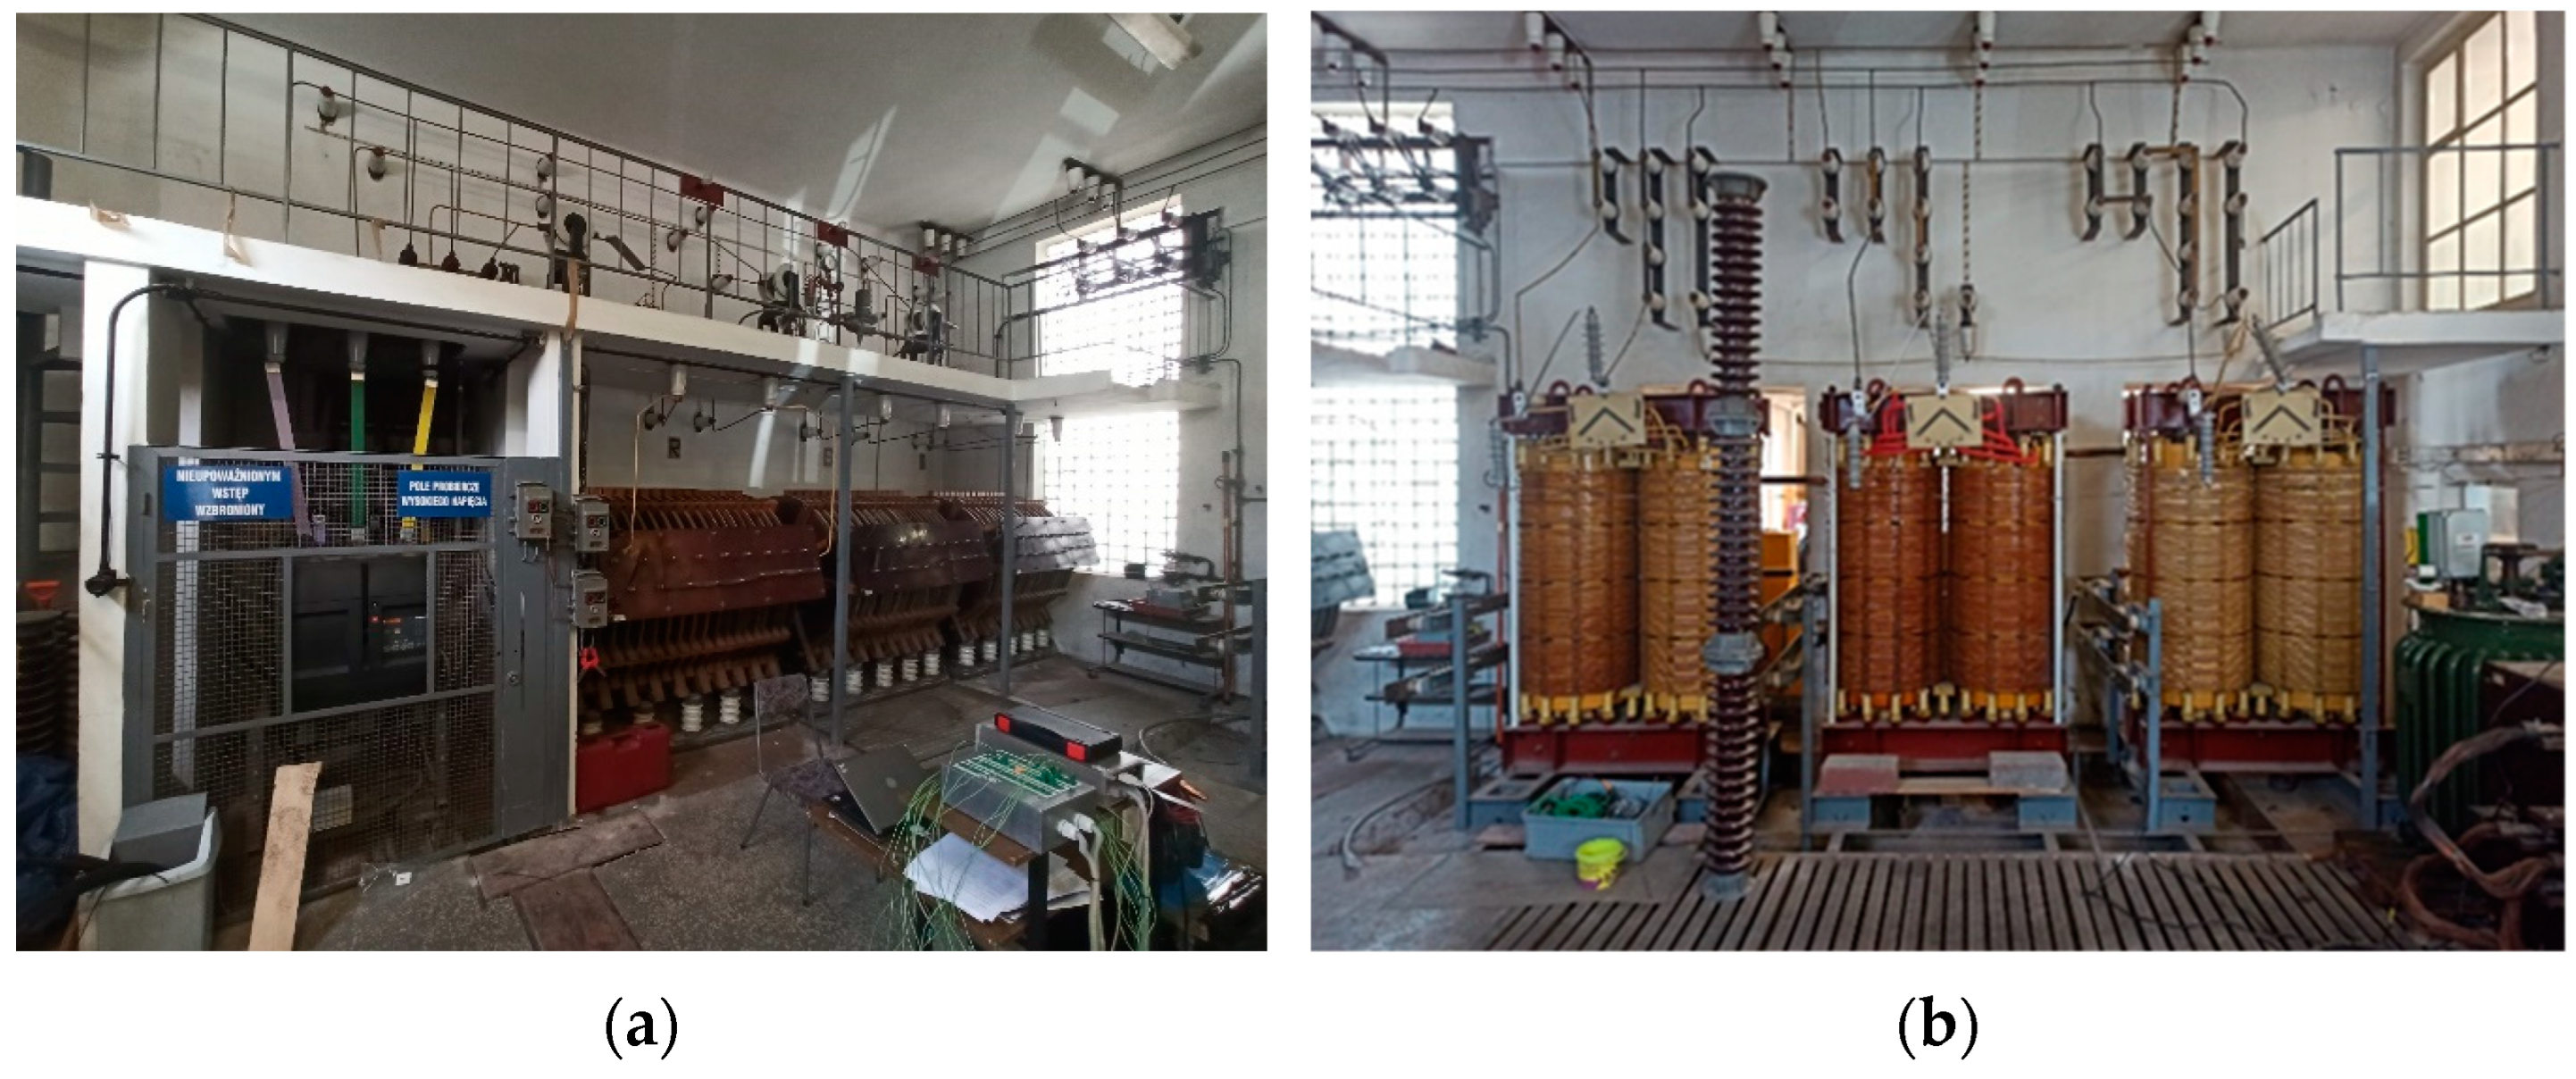
Based on the real object, low-voltage switchgear, a precise 3D model of the analyzed switchgear was created in the ANSYS SpaceClaim environment. The prepared real test object was transported to the Distribution Equipment Laboratory at the Institute of Power Engineering in Warsaw. There, it was carefully checked and prepared for short-circuit tests. The short-circuit system in the Distribution Equipment Laboratory the Institute of Power Engineering in Warsaw is powered from the medium-voltage network, protected by a main power switch. Short-circuit current values are set using appropriate MV shunt reactors connected directly to short-circuit transformers, from which the outputs of secondary windings are connected to the tested object. By using current transformers and appropriate recorders, it was possible to record the exact values of short-circuit current waveforms. The short-circuit system is shown in
Figure 3 below.
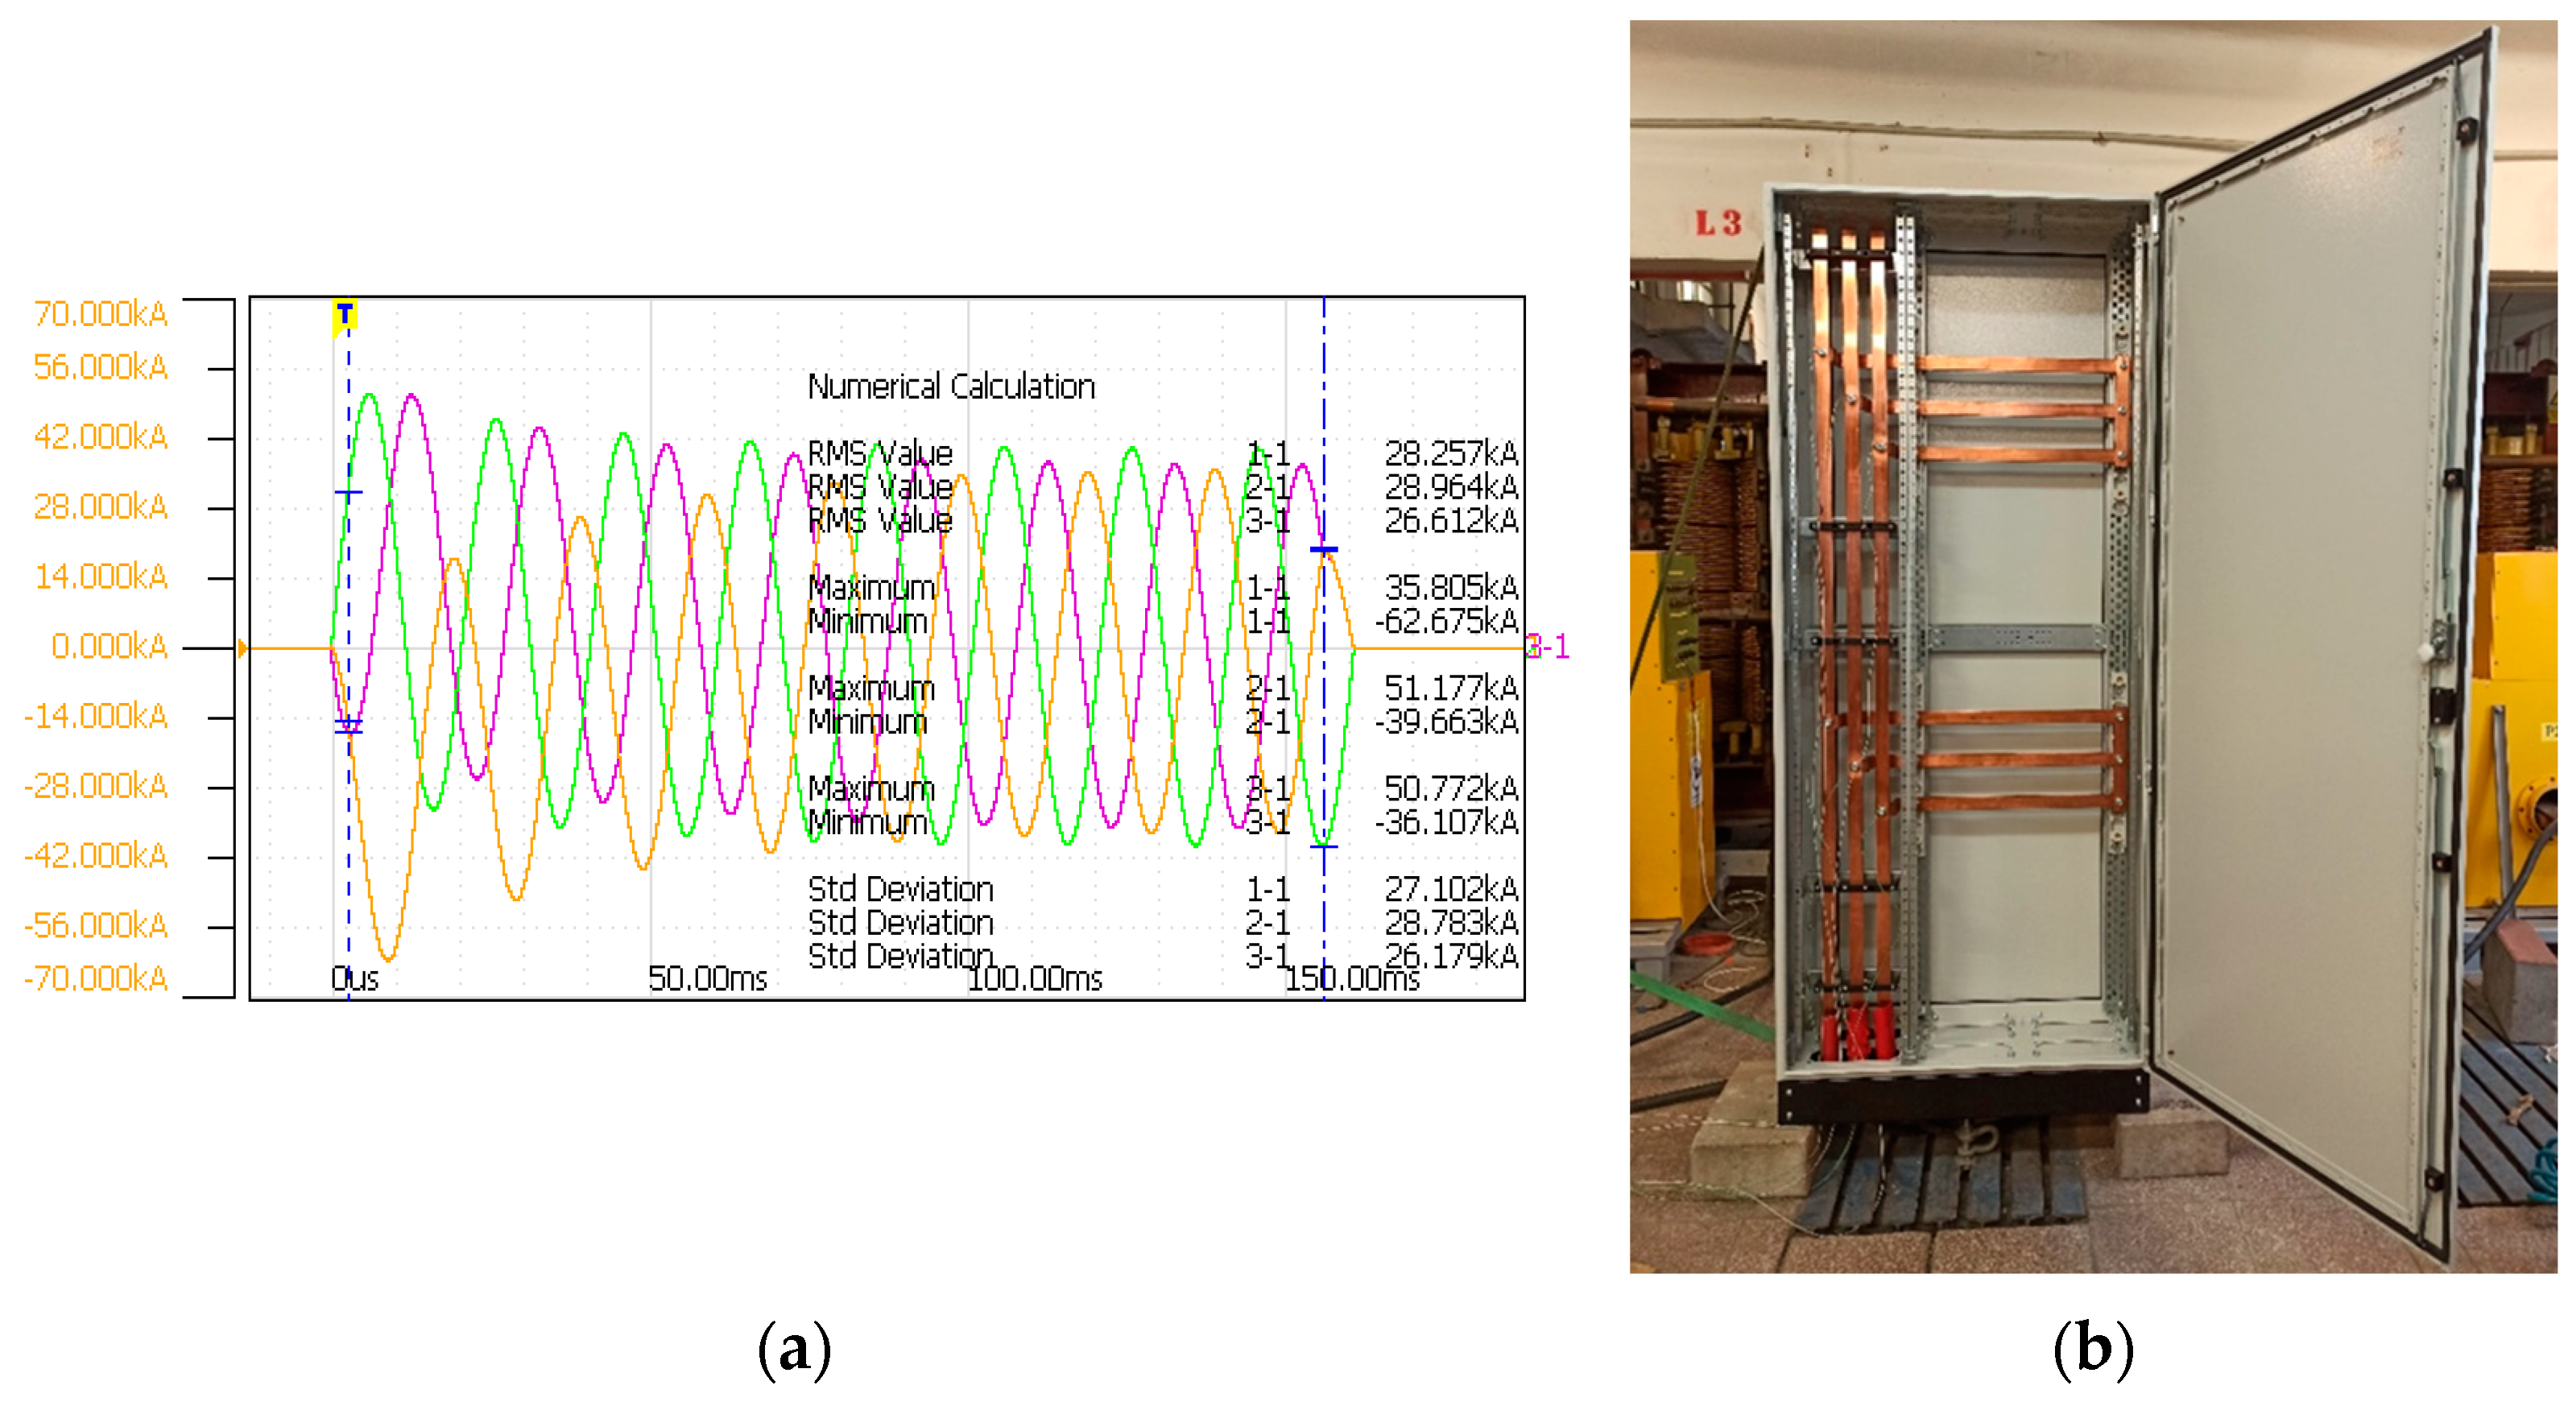
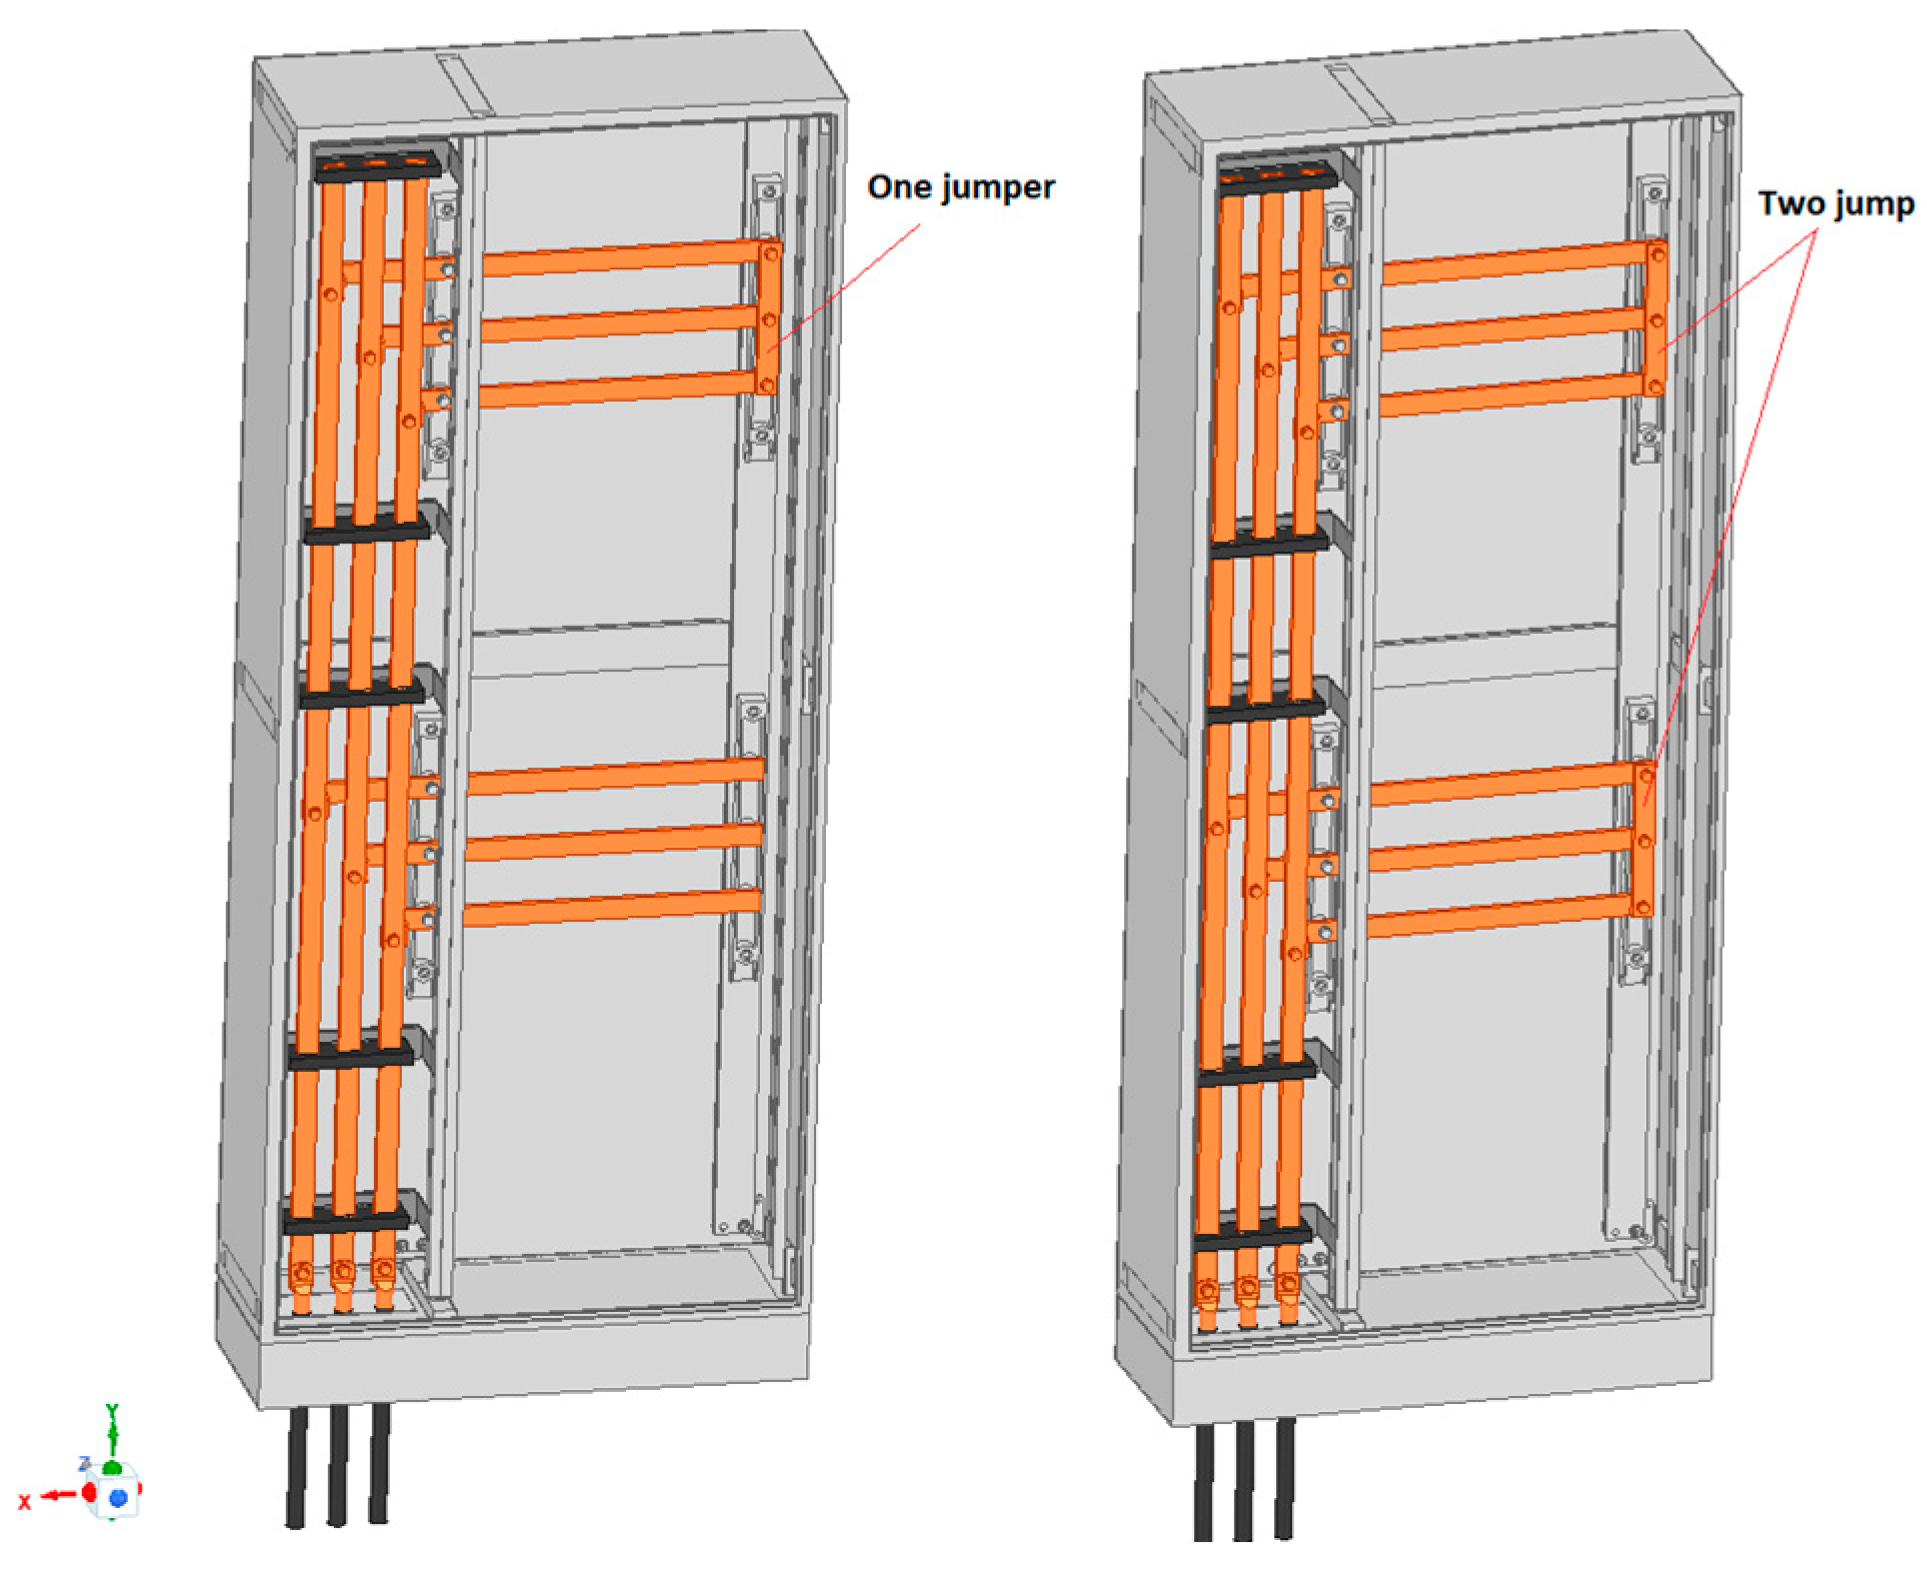
After preparing the test object and the short-circuit test station, it was possible to perform short-circuit tests. In the performed test formula, it was assumed that the trials would be performed for two and for one jumper of a horizontal rail bridges. This made it possible to analyze the distribution of the short-circuit current in the current path in both cases. Tests for both one and two armatures were performed for different values of three-phase short-circuit currents with a time of 150 ms, steadily increasing the value: 5 kA, 15 kA, 20 kA, and 30 kA RMS (root mean square). After each test, insulators and brackets were analyzed and checked for damage. If necessary, insulators and support elements were replaced when they showed any signs of damage. The first considered case was the performance of a short-circuit test for two jumpers installed on both horizontal current paths (
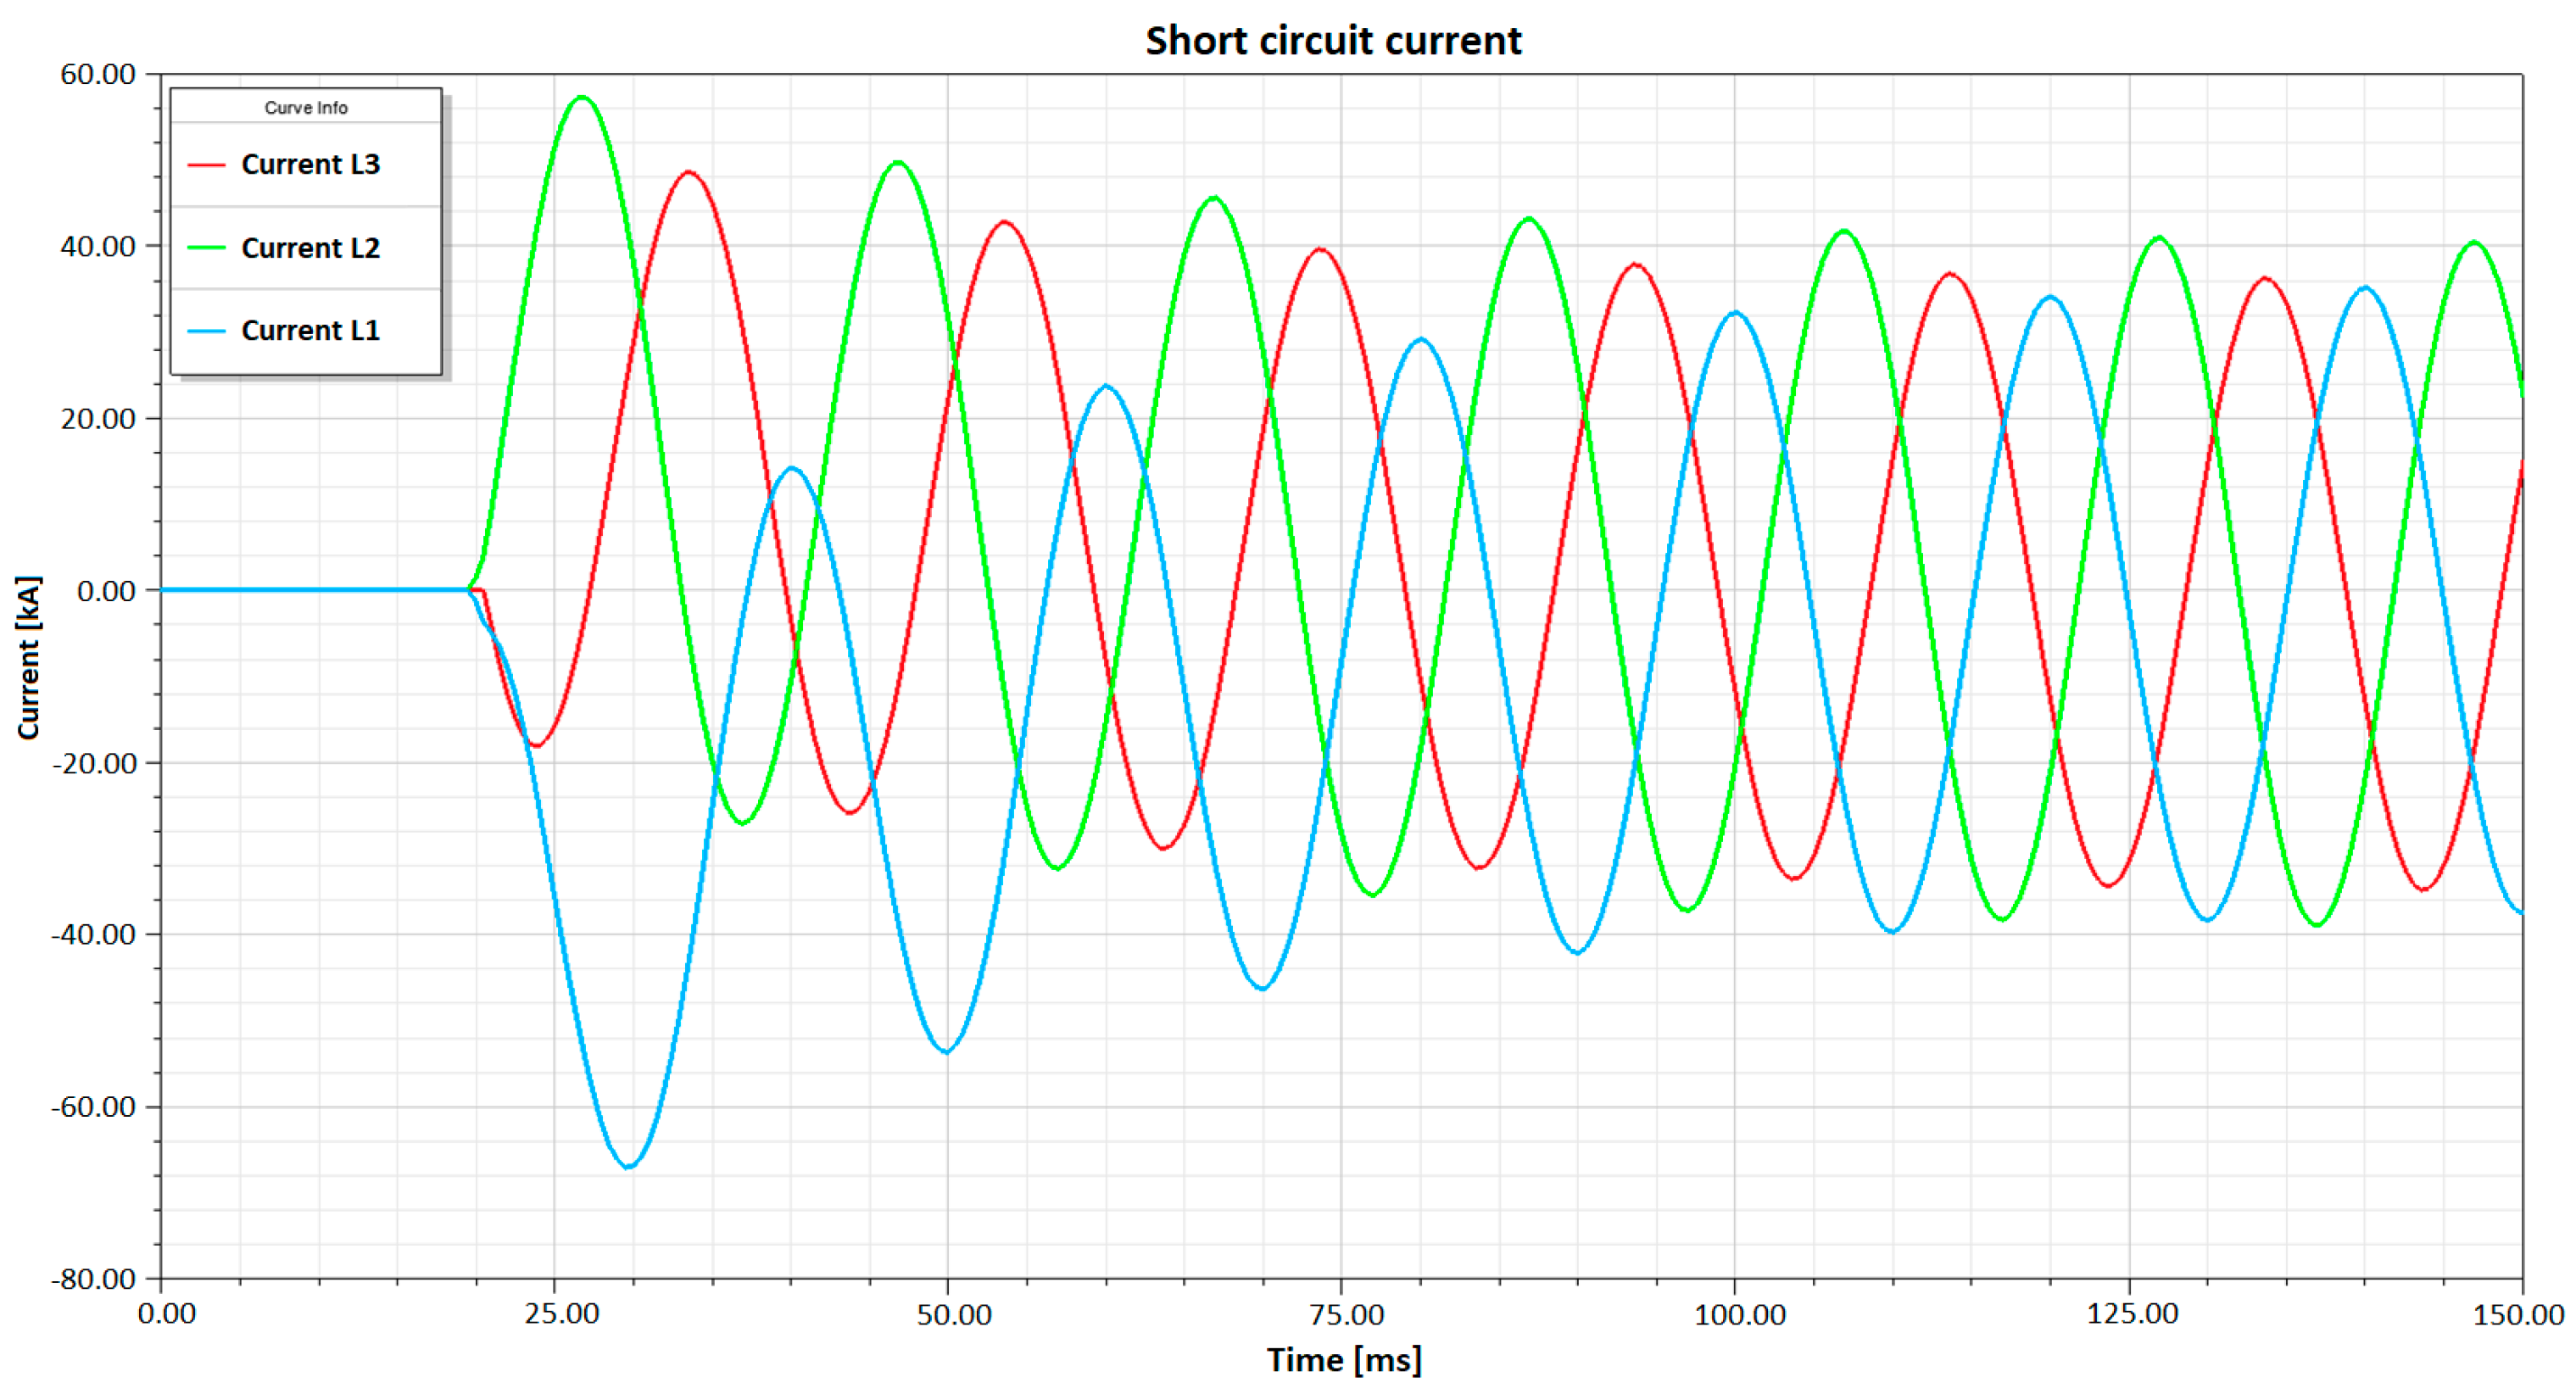
Figure 4 below). All performed short-circuit tests for the values of 5 kA, 15 kA, and 20 kA did not cause any damage to the insulators or plastic deformations of the supporting structures (metal brackets and holders). The last test for the value of 30 kA RMS caused damage to the first two lower insulators of the current path. The peak current value in the L1 phase busbar was over 67 kA, in the L2 phase busbar over 57 kA, and in the L3 phase busbar, the peak value was over 48 kA. As it turned out, these values were destructive for the lower insulators of the switchgear, because the short-circuit current was closed by the lower horizontal current path, which did not cause destructive stresses in the upper insulators of the vertical current path. An example of a short-circuit current waveform from the tests is shown in
Figure 4 below. The damage caused is shown in
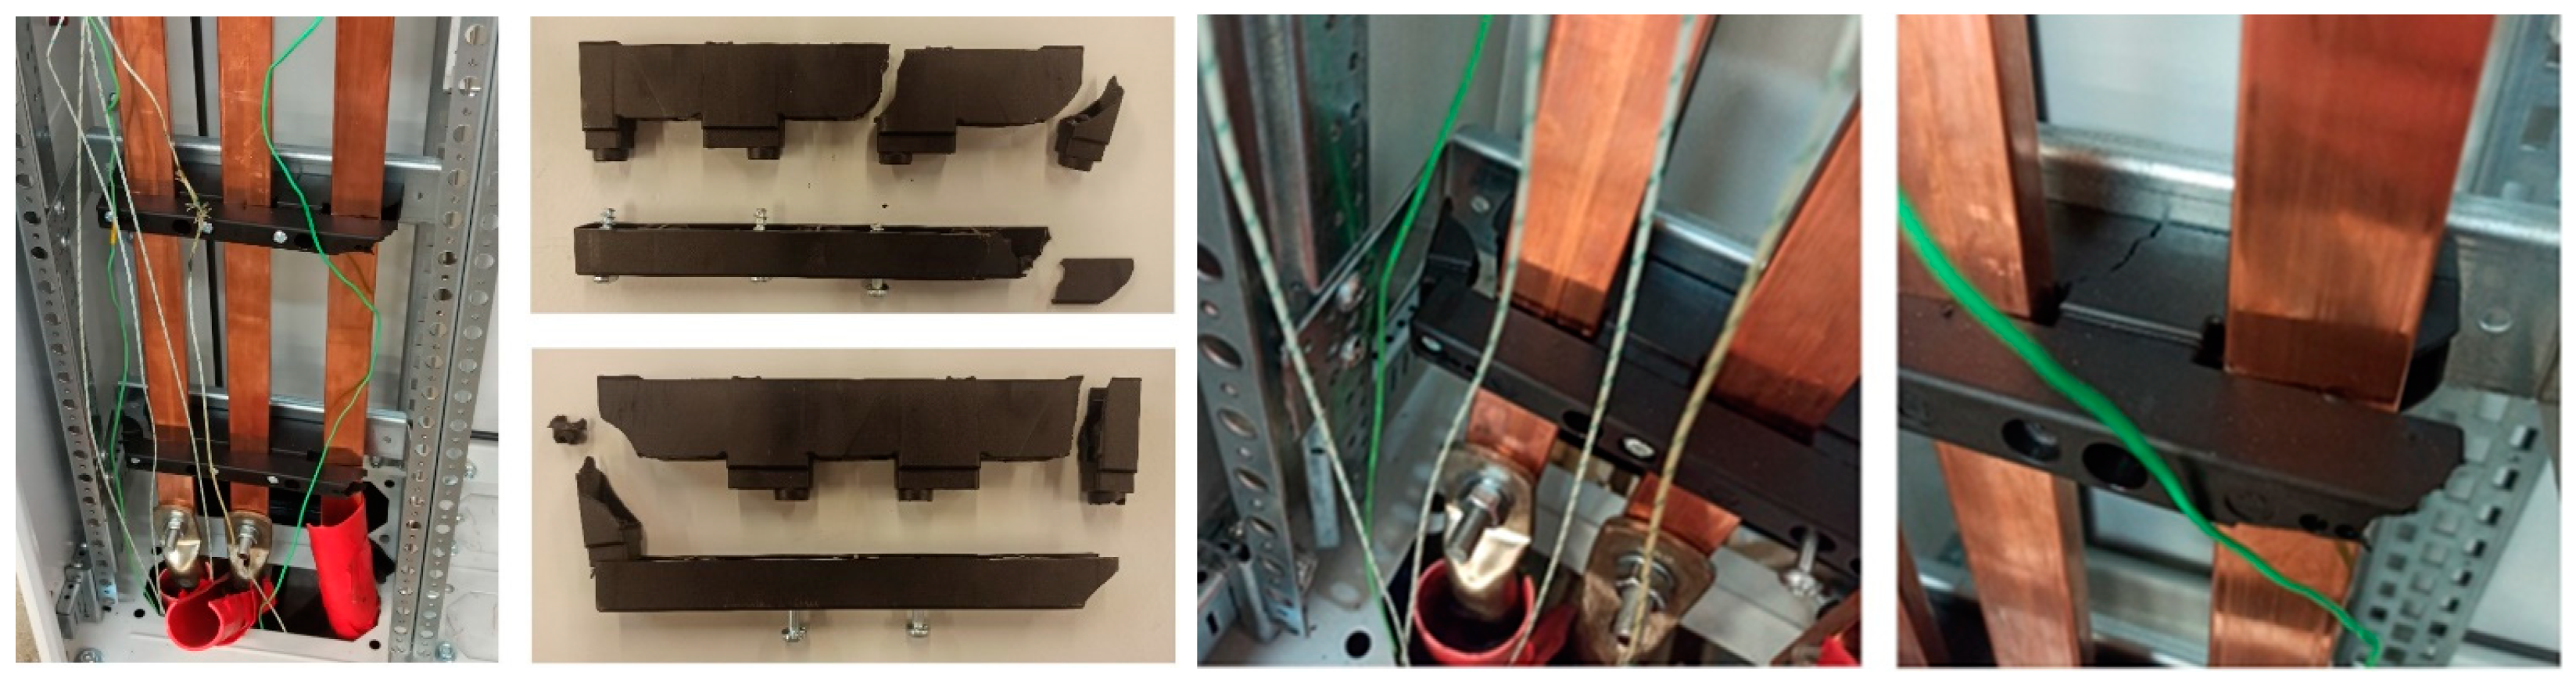
Figure 5 below.
Photos of the dismantled insulators are shown in
Figure 5 below; as it is possible to see, after the short-circuit test, the insulators were unusable, and they were completely destroyed. The moment of arcing was shown in
Figure 6 below. For the test object with two jumpers, no more tests were performed in the laboratory. All damaged insulators and one deformed insulator bracket was replaced. The tested object was restored to its original state in order to perform subsequent short-circuit tests.
Figure 4.
Short-circuit test preparation: (a) example of short-circuit current waveform; (b) test object mounted and prepared in short-circuit station—two jumpers.
Figure 4.
Short-circuit test preparation: (a) example of short-circuit current waveform; (b) test object mounted and prepared in short-circuit station—two jumpers.
Figure 5.
Short-circuit test results with two jumpers mounted—damaged support insulators, before dismounting and after dismounting.
Figure 5.
Short-circuit test results with two jumpers mounted—damaged support insulators, before dismounting and after dismounting.
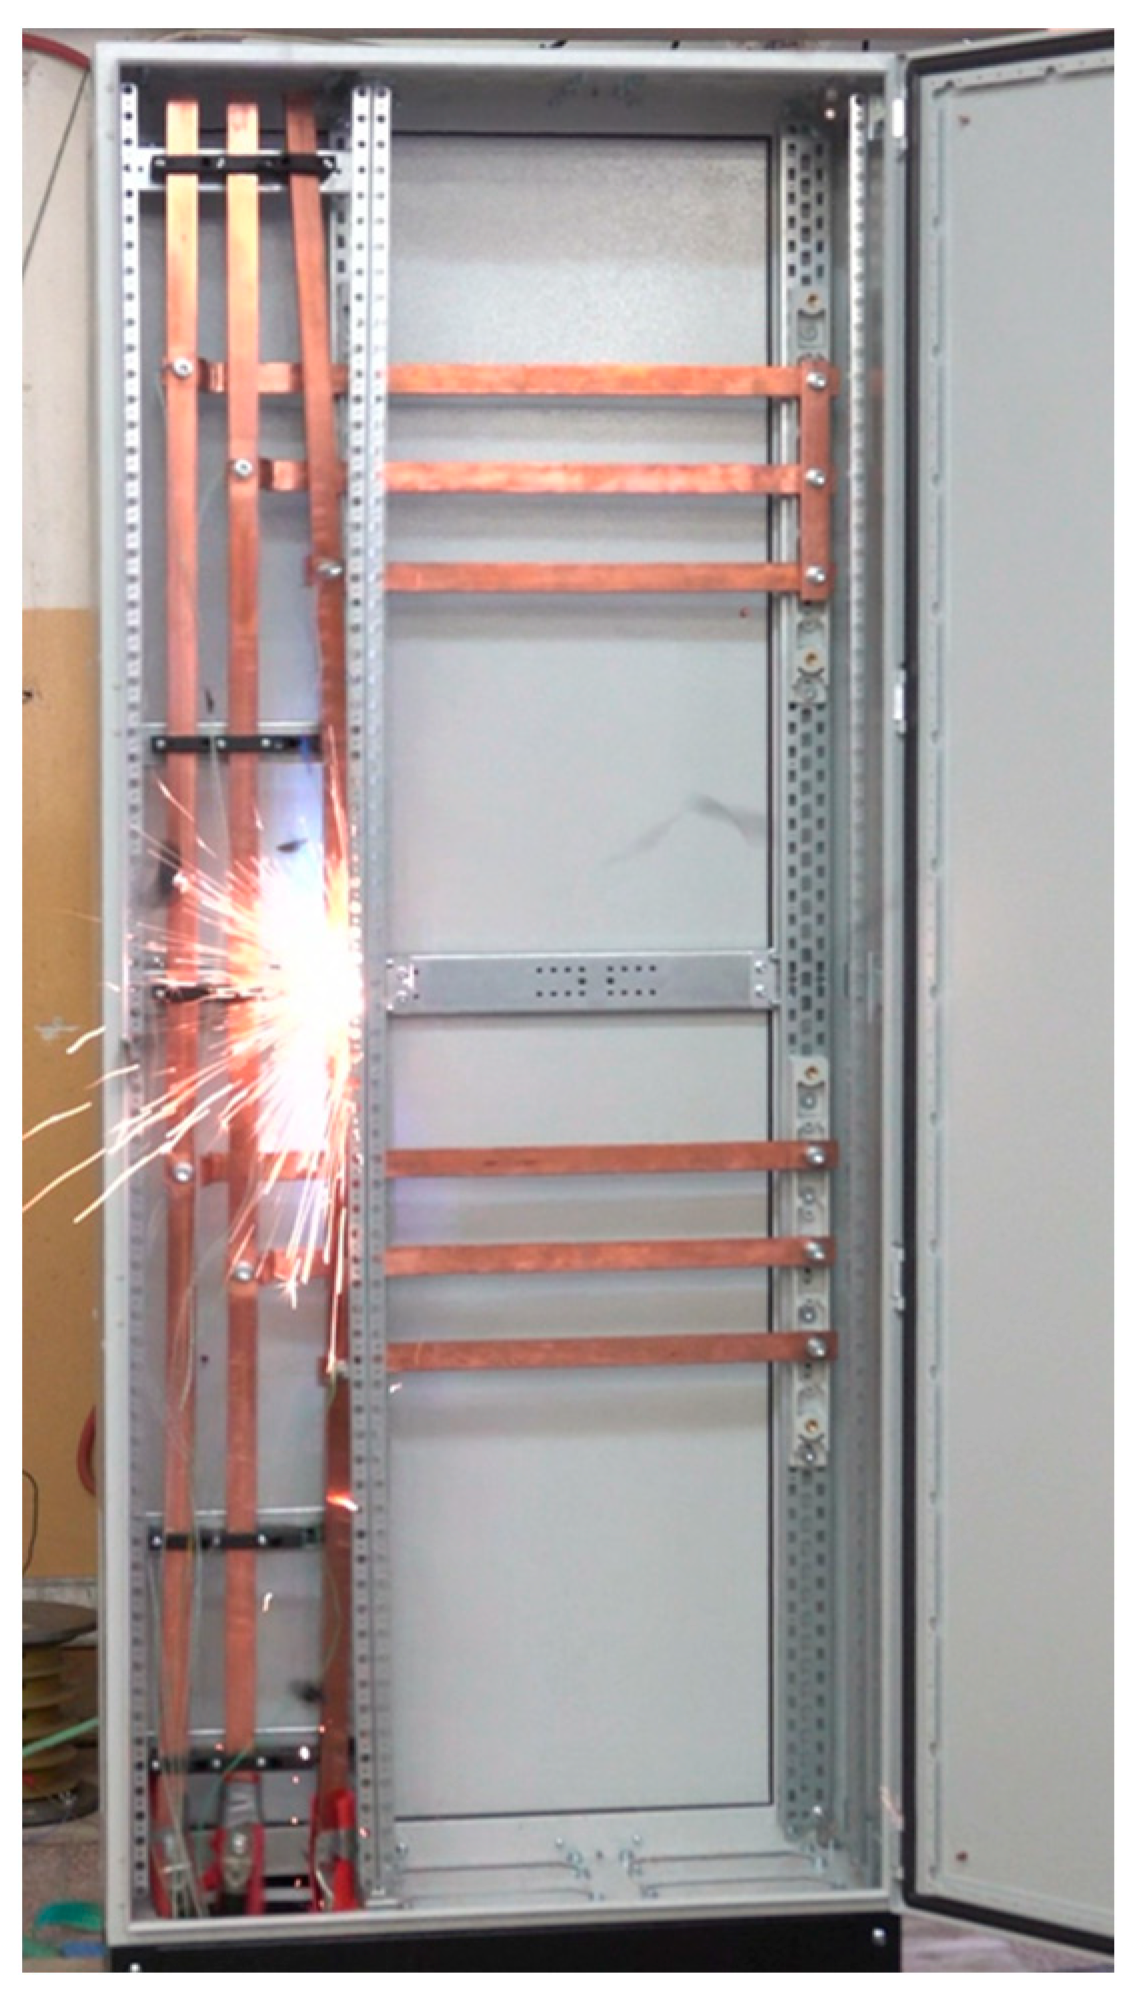
Figure 6.
Short circuit tests results with two jumpers mounted—30 kA RMS: moment of recorded arcing and displacement of the busbar.
Figure 6.
Short circuit tests results with two jumpers mounted—30 kA RMS: moment of recorded arcing and displacement of the busbar.
The recorded waveforms of the surge current were imported to the 3D model of the tested LV switchgear during short-circuit calculations using the Ansys Maxwell 3D software 2023.
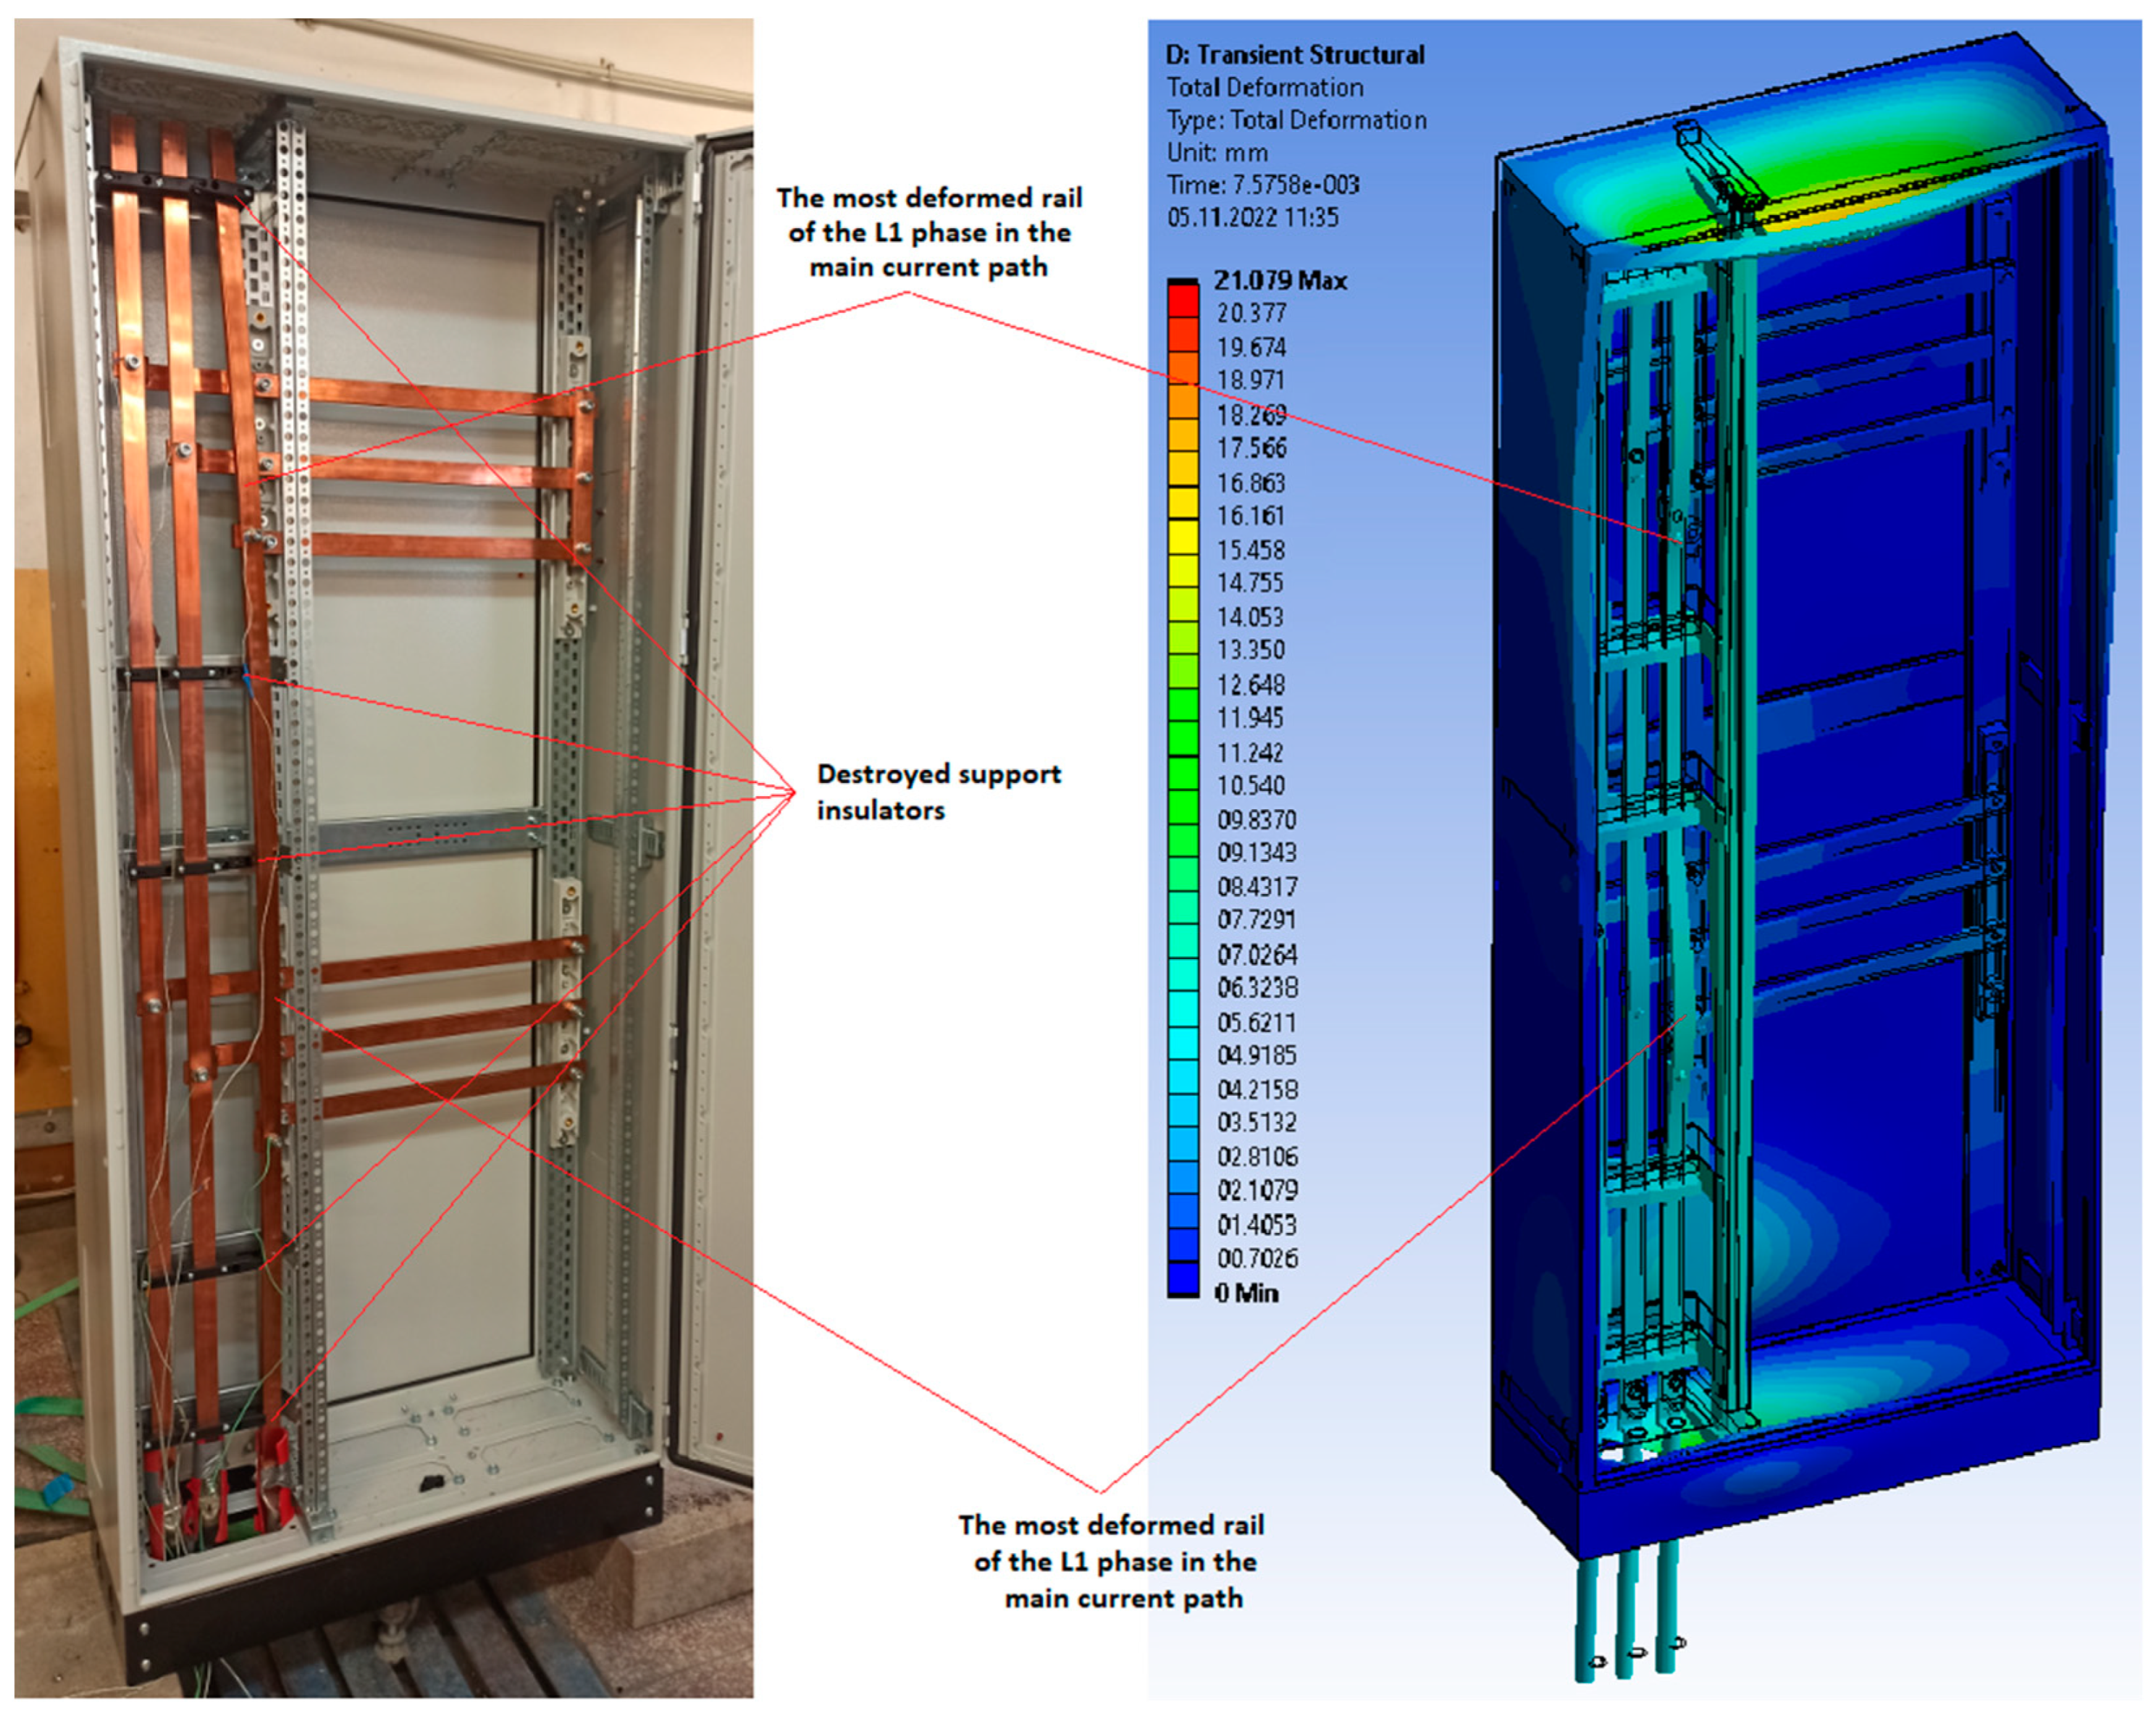
The next stage of the short-circuit tests was to execute tests for the system of current paths with one copper jumper at the end of the horizontal upper current path. It was assumed that in this way the path of the short-circuit current flowing to the fault point in the current path will become longer. For this purpose, the lower armature was dismantled and the test object was prepared for short-circuit tests. The tests were performed for the same values of three-phase short-circuit currents as in the previous tests: 5 kA, 15 kA, 20 kA, and 30 kA RMS. After each test, the insulators and brackets were analyzed and checked for damage. If necessary, insulators and support elements were replaced when they showed any signs of damage. As was the case in previous tests, for the values of three-phase RMS short-circuit currents, 5 kA, 15 kA, and 20 kA, they did not cause any damage to the insulators or plastic deformation of the supporting structure (metal brackets and holders). The only phenomenon that could be seen was the “tightening” of the busbars and the cable as a result of electrodynamic interactions caused by the flow of the short-circuit current. It can be said that the results were similar to those obtained in previous short-circuit tests. The extent of damage in the low-voltage switchgear was different for the three-phase short-circuit current of RMS 30 kA. Due to electrodynamic impacts, the entire vertical current path with a rail spacing of 60 mm was damaged, in which practically all supporting insulators were broken. The horizontal bridges were not affected due to the use of stronger insulators with rail spacing of 100 mm. Examples of damage to support insulators are shown in
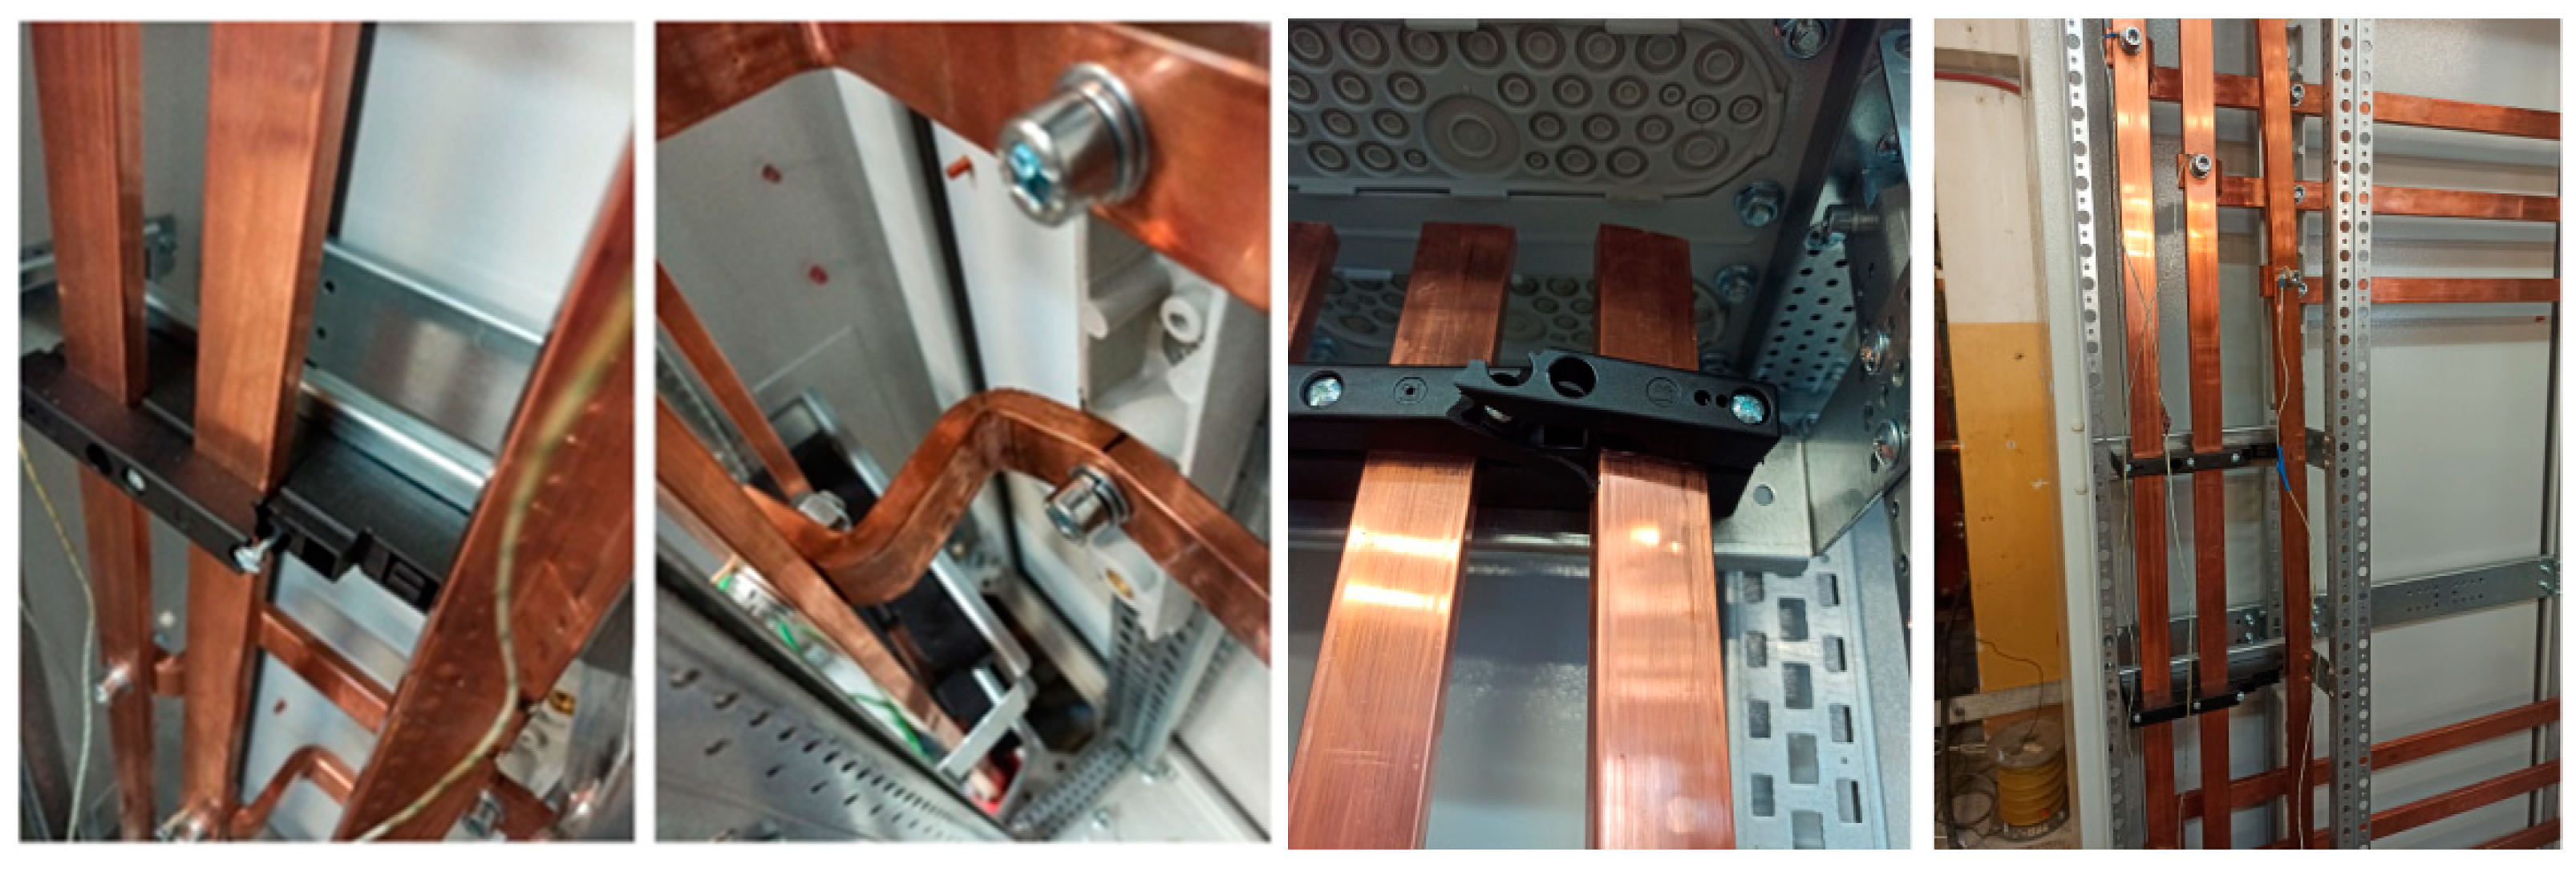
Figure 7 below. In order to illustrate the moment of damage to the support insulators, the short-circuit test was recorded with a high-speed camera, and the recorded frame is shown in
Figure 7 and
Figure 8 below. It is noticeable that the copper conductor rail was torn out of the insulators and caused a metallic short circuit with the metal supporting elements of the switchgear. Two insulators of the vertical rail bridge were damaged. For the test object with two jumpers, no more tests were performed in the laboratory.
4. FEM Simulations Assumptions
In order to perform simulation work for this manuscript, a coupled finite element method analysis was executed. Coupled FEM analysis is a technique that allows us to study the interactions of various physical phenomena, including structural, mechanical, and electromagnetic phenomena. It is carried out by corelating various nodes of a numerical program in order to fulfil specific conditions and recreate physical phenomena in a digital environment that can be witnessed before concluding the experiment. Coupled FEM analysis is based on the transformation of conjugate partial differential equations in a set of unrelated ordinary differential equations using the modal decomposition technique. It follows that the system is represented by a linear combination of its modes, which are the characteristic patterns of vibration or oscillation of each domain. Modal decomposition is a solution to solve complex numerical problems in the most direct way. The modal coefficients can then be used to reproduce the application in each domain. Coupled analysis offers several advantages over other methods of solving coupled problems using the FEM, such as the ability to deal with non-linearities and varying material properties, taking into account mechanical interactions, energy dissipation, and inter-domain energy transfer, gaining insight into the physical mechanisms and dominant modes of the system, and reducing computational costs and memory requirements. Below are the most important equations that were inserted into a module solver during calculations.
Gauss law for electricity:
Gauss law for magnetism:
where
—electric induction [C/m
2];
—magnetic induction [T];
—electric field intensity [V/m];
—magnetic field intensity [A/m];
—current density [A/m
2]; ρ—electric charge density [C/m
3]; ∇—divergence operator [1/m]; ∇x—rotation operator [1/m].
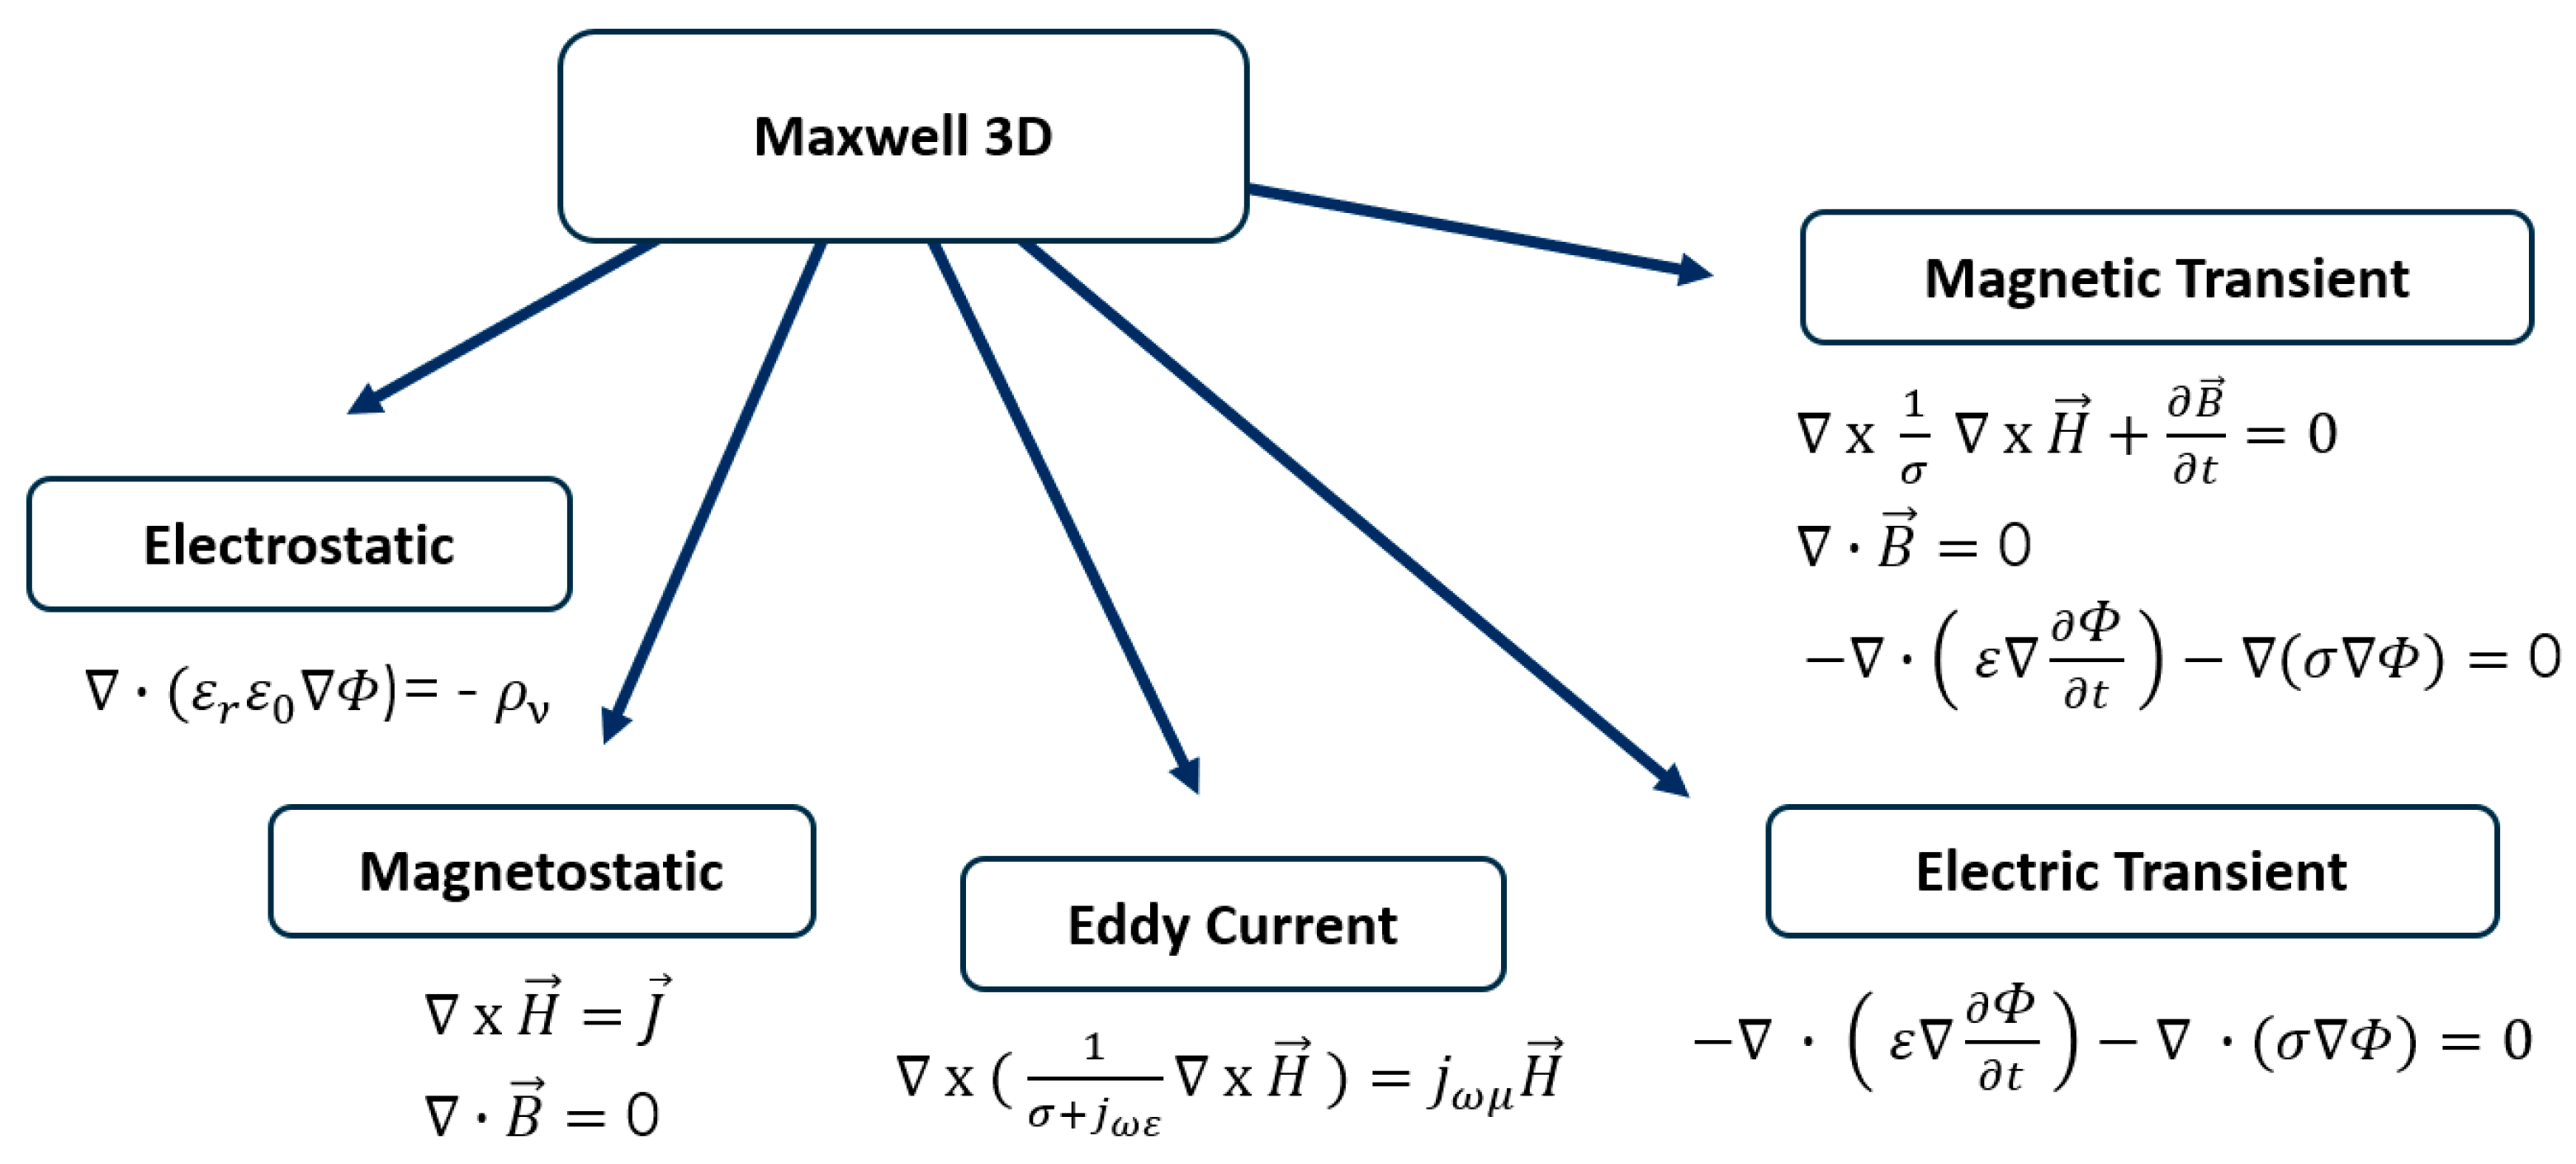
In
Figure 9 below, functions of the module are presented alongside the governing equations behind them.
Deformations of busbar during simulations were described by Lorentz as a force that can be expressed using the equation below:
Thermal interactions were not taken into consideration during the numerical analysis as the given simulation time was too short—150 ms. Moreover, taking into account the thermal interactions would made simulations much more complex and lead to results without physical meaning.
Boundary conditions used at least one of the following sources for their magnetic field:
Outer boundary conditions were defined as follows:
The default boundary conditions;
An odd symmetry boundary;
An even symmetry boundary.
5. Simulations Results
Following the short-circuit tests that were executed in the Distribution Equipment Laboratory at the Institute of Power Engineering in Warsaw, simulation analyses were performed to compare to the obtained experimental results. In order to perform numerical analyses, it was necessary to prepare a detailed 3D model for the tested switchgear structure. The model was developed in the ANSYS SpaceClaim software 2023, where all elements of the switchgear structure were accurately reproduced with some simplifications, such as housing, support brackets, insulators, or a single-strip three-phase busbar bridge with a vertical/horizontal arrangement. The model was prepared analogically to the short-circuit tests of the switchgear for one and two jumpers at the ends of horizontal busbar bridges. The geometries prepared in this way were imported into the ANSYS Maxwell 3D environment, as shown in
Figure 10 below.
In both cases, after importing the 3D models into the ANSYS Maxwell 3D software 2023, the real material properties were provided. Boundary conditions corresponding to those prevailing during the short-circuit tests in the Distribution Equipment Laboratory were provided, such as temperature, and the ambient environment in this case was air. In the next stage, the most important operation was to load into the model the short-circuit current waveforms previously recorded during short-circuit tests for individual phases. For this purpose, a file in the .csv format was used, from which data in the form of tables were downloaded to the Maxwell 3D module. The short-circuit current values prepared in this way for each phase were assigned to individual busbars in the current path of the switchgear, as was the case during the actual short-circuit tests. The imported short-circuit currents for individual phases are shown in the waveform generated from the Maxwell 3D software 2023 in
Figure 11 below. At a later stage of simulation preparation, it was necessary to create an appropriate mesh, which required additional densification in places most exposed to electrodynamic forces: current path busbars, insulators, or support brackets.
For the case of the model with one armature, the mesh size consisted of 687,264 tetrahedral elements. However, for the model with two armatures, the mesh had more tetrahedral elements, with 698,629 elements. In the next step, the simulation time was defined, and, due to the fact that the imported short-circuit current was for 150 ms, the simulation time was assumed to be the same. The same settings were adopted for both analyzed cases. The main purpose of the simulation analyses performed was to determine the values of the resulting electrodynamic forces on individual elements of the switchgear structure. In addition, deformations and stresses that arose at the time of occurrence of electrodynamic forces were analyzed. In the analysis, special attention was paid to comparing the actual deformations with the deformations obtained during the performed numerical analyses.
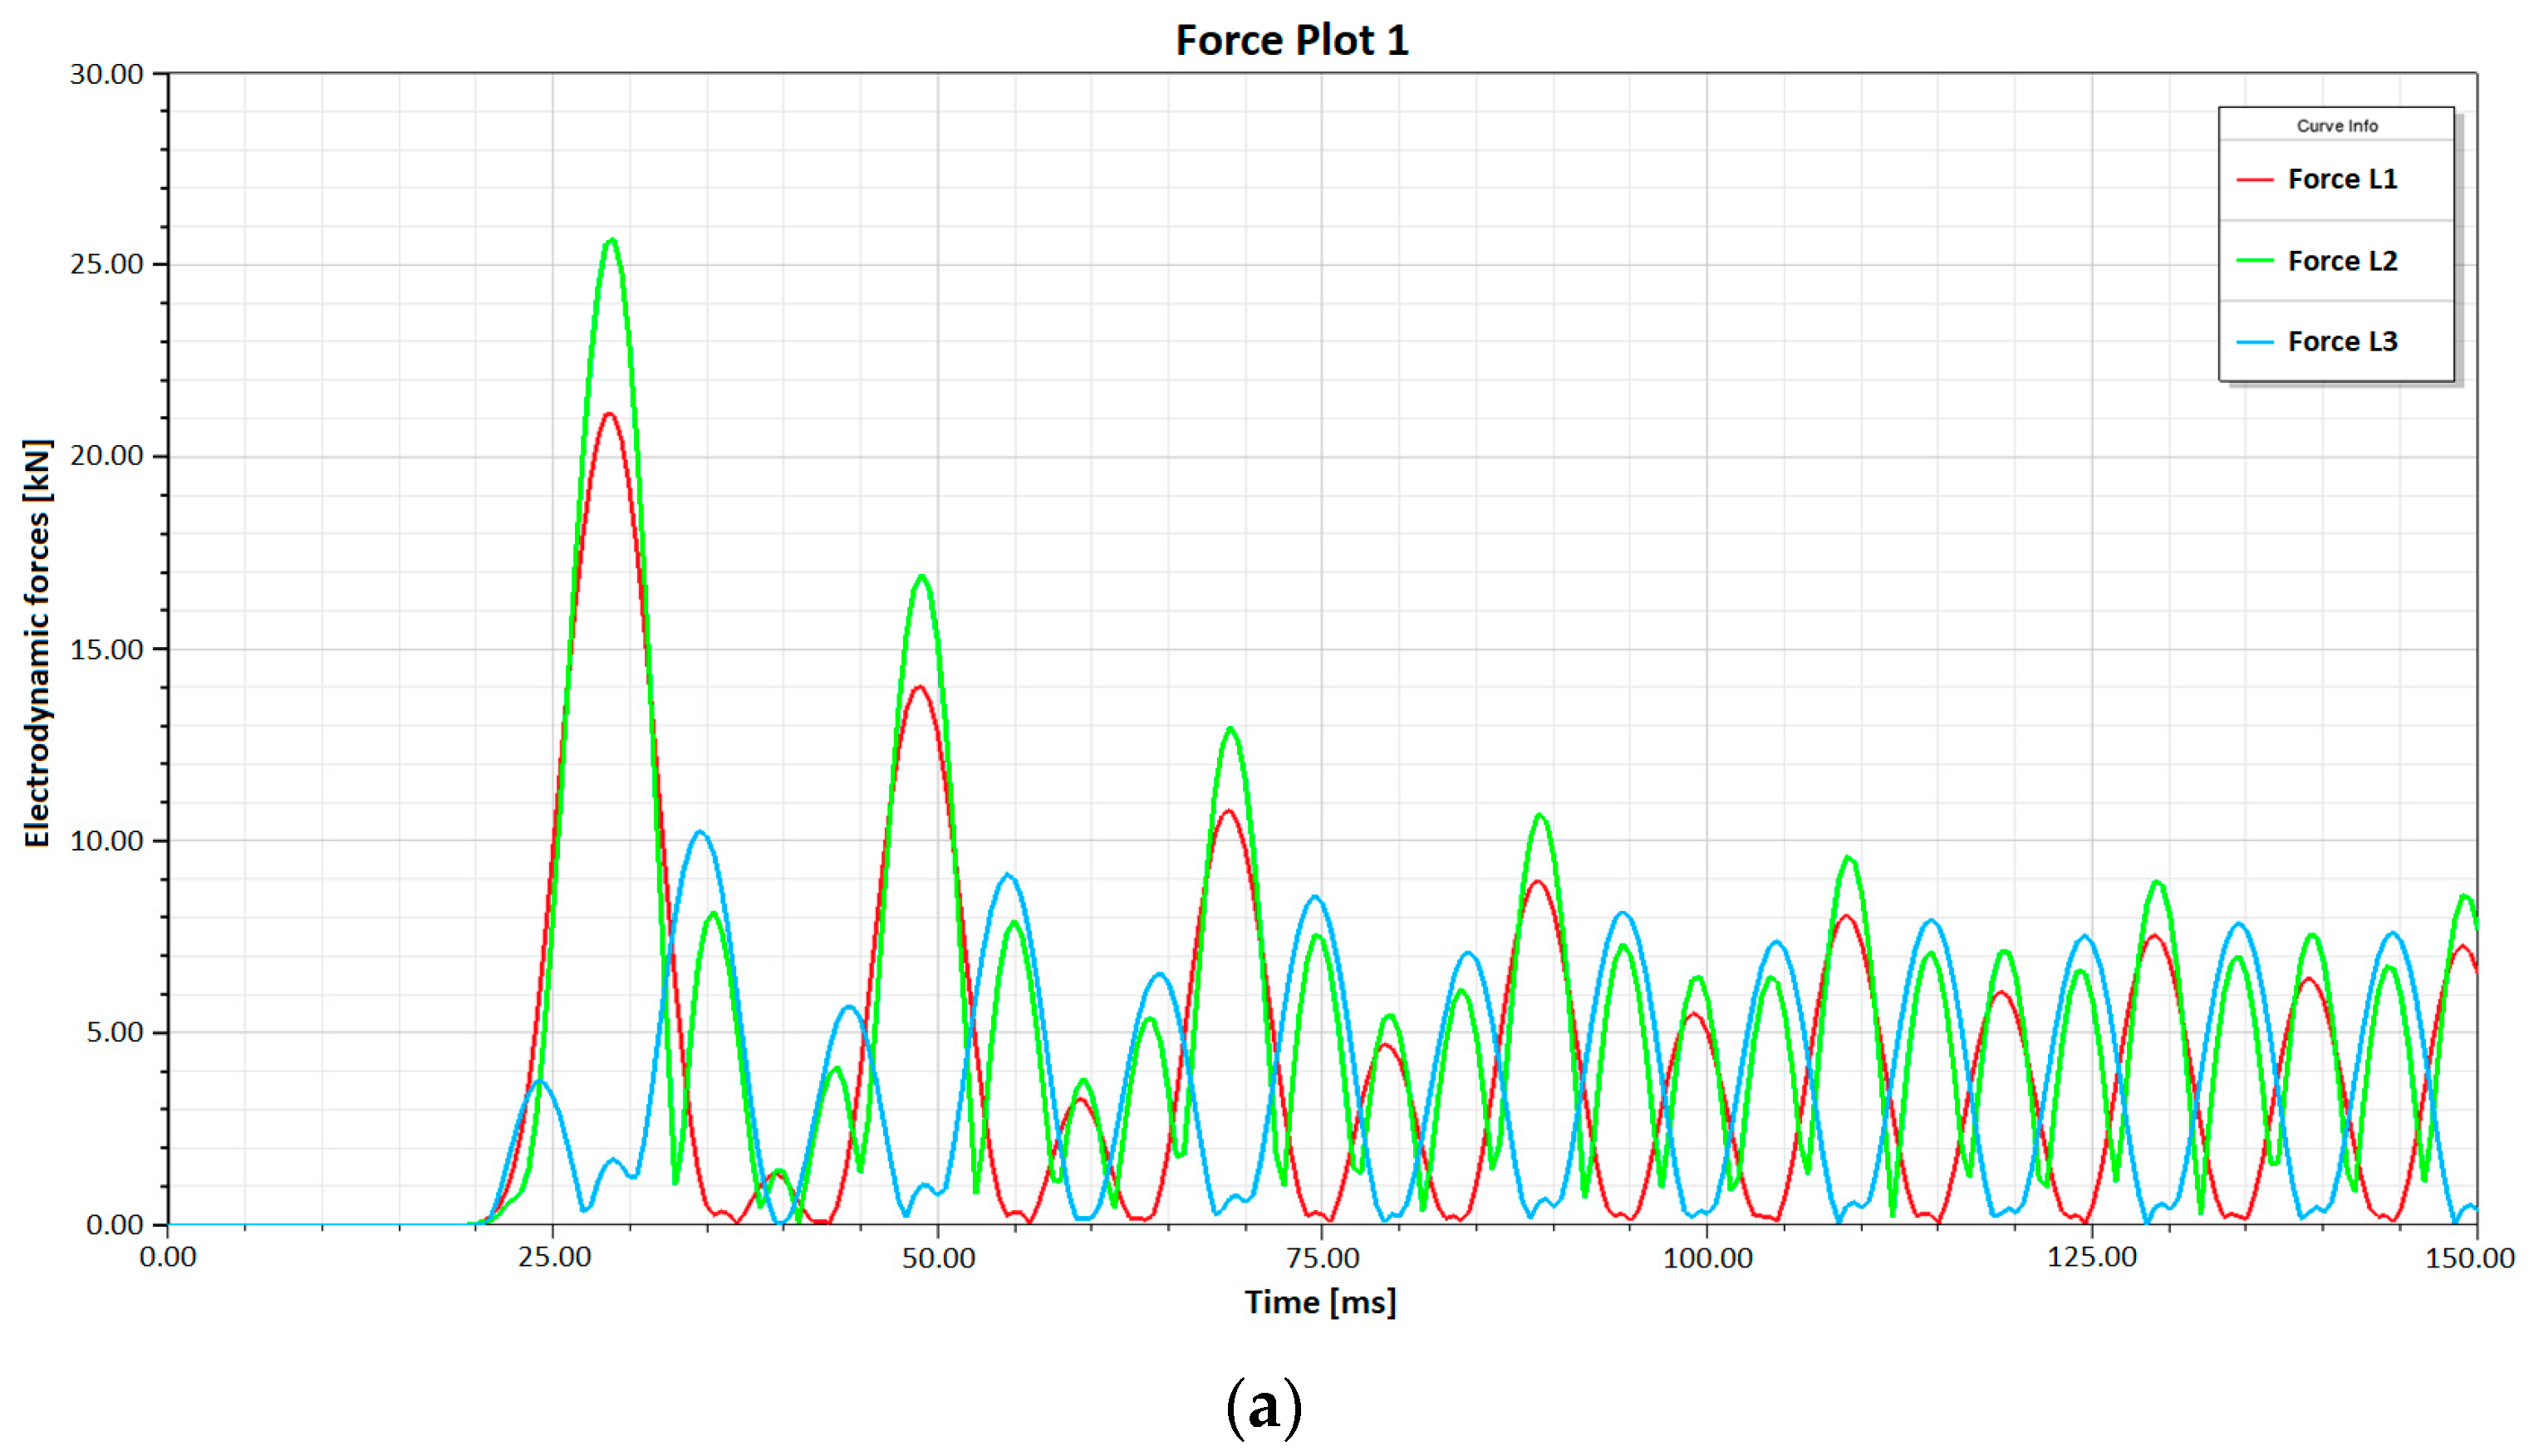
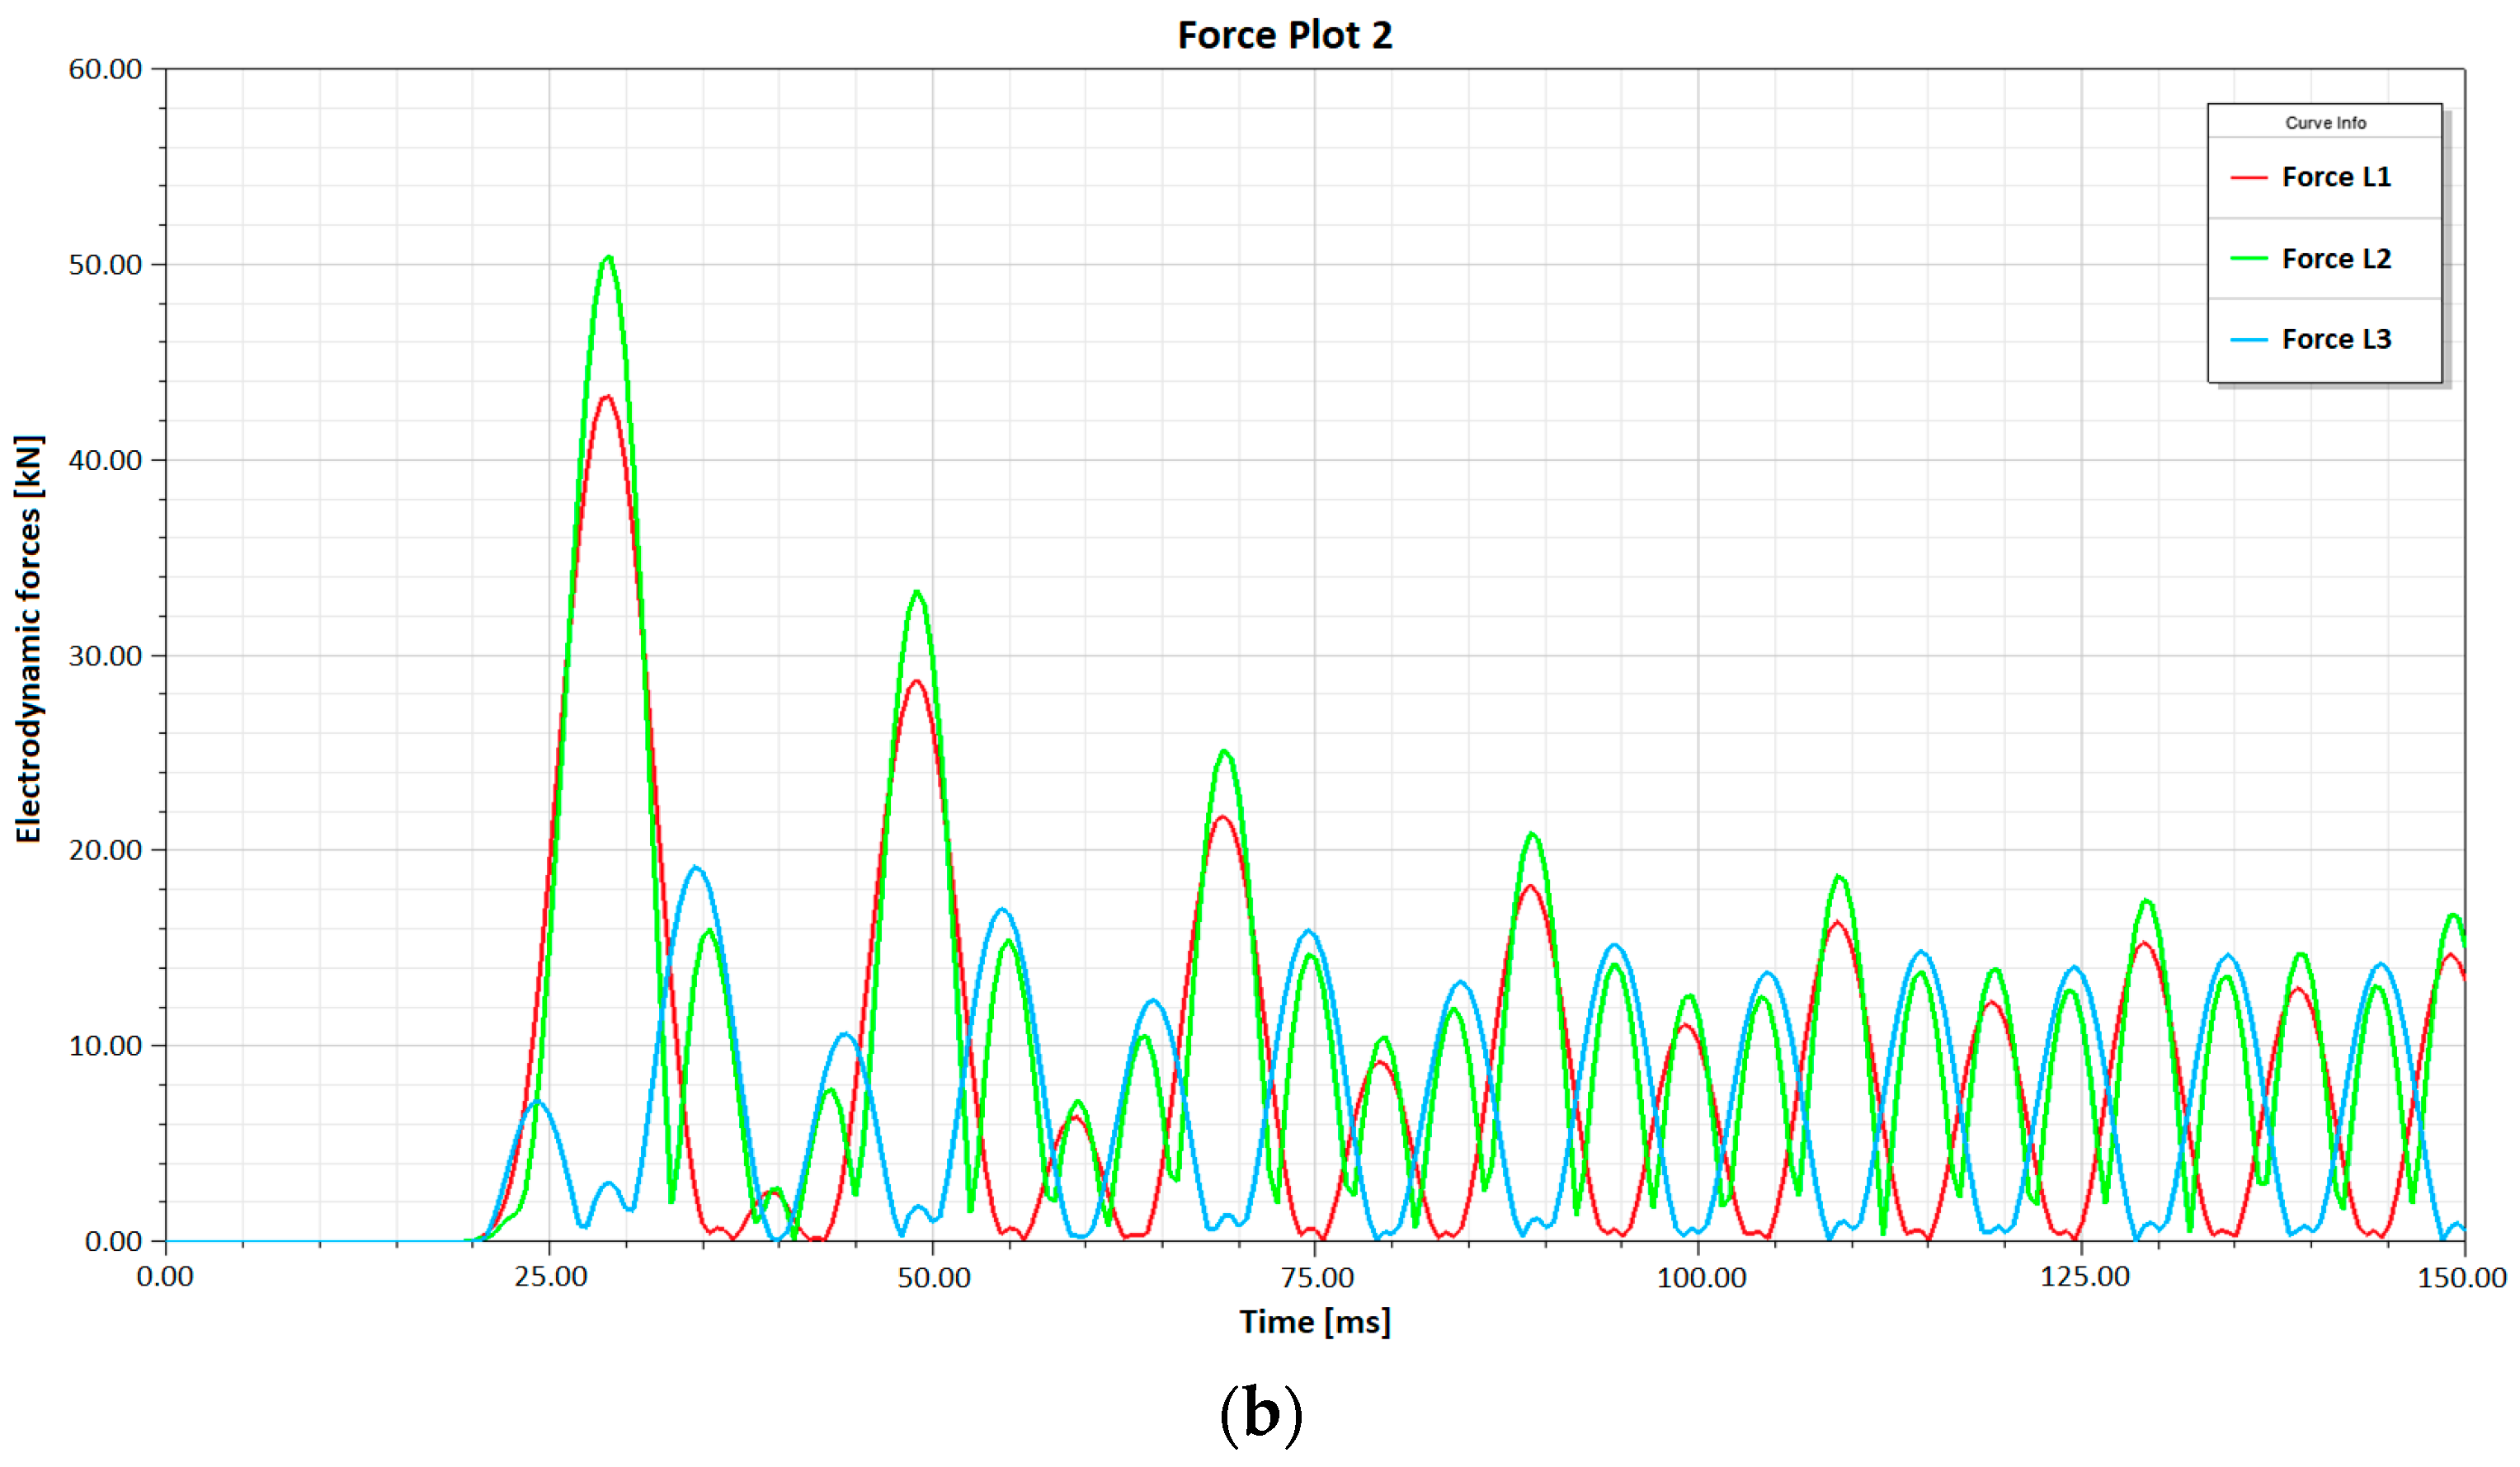
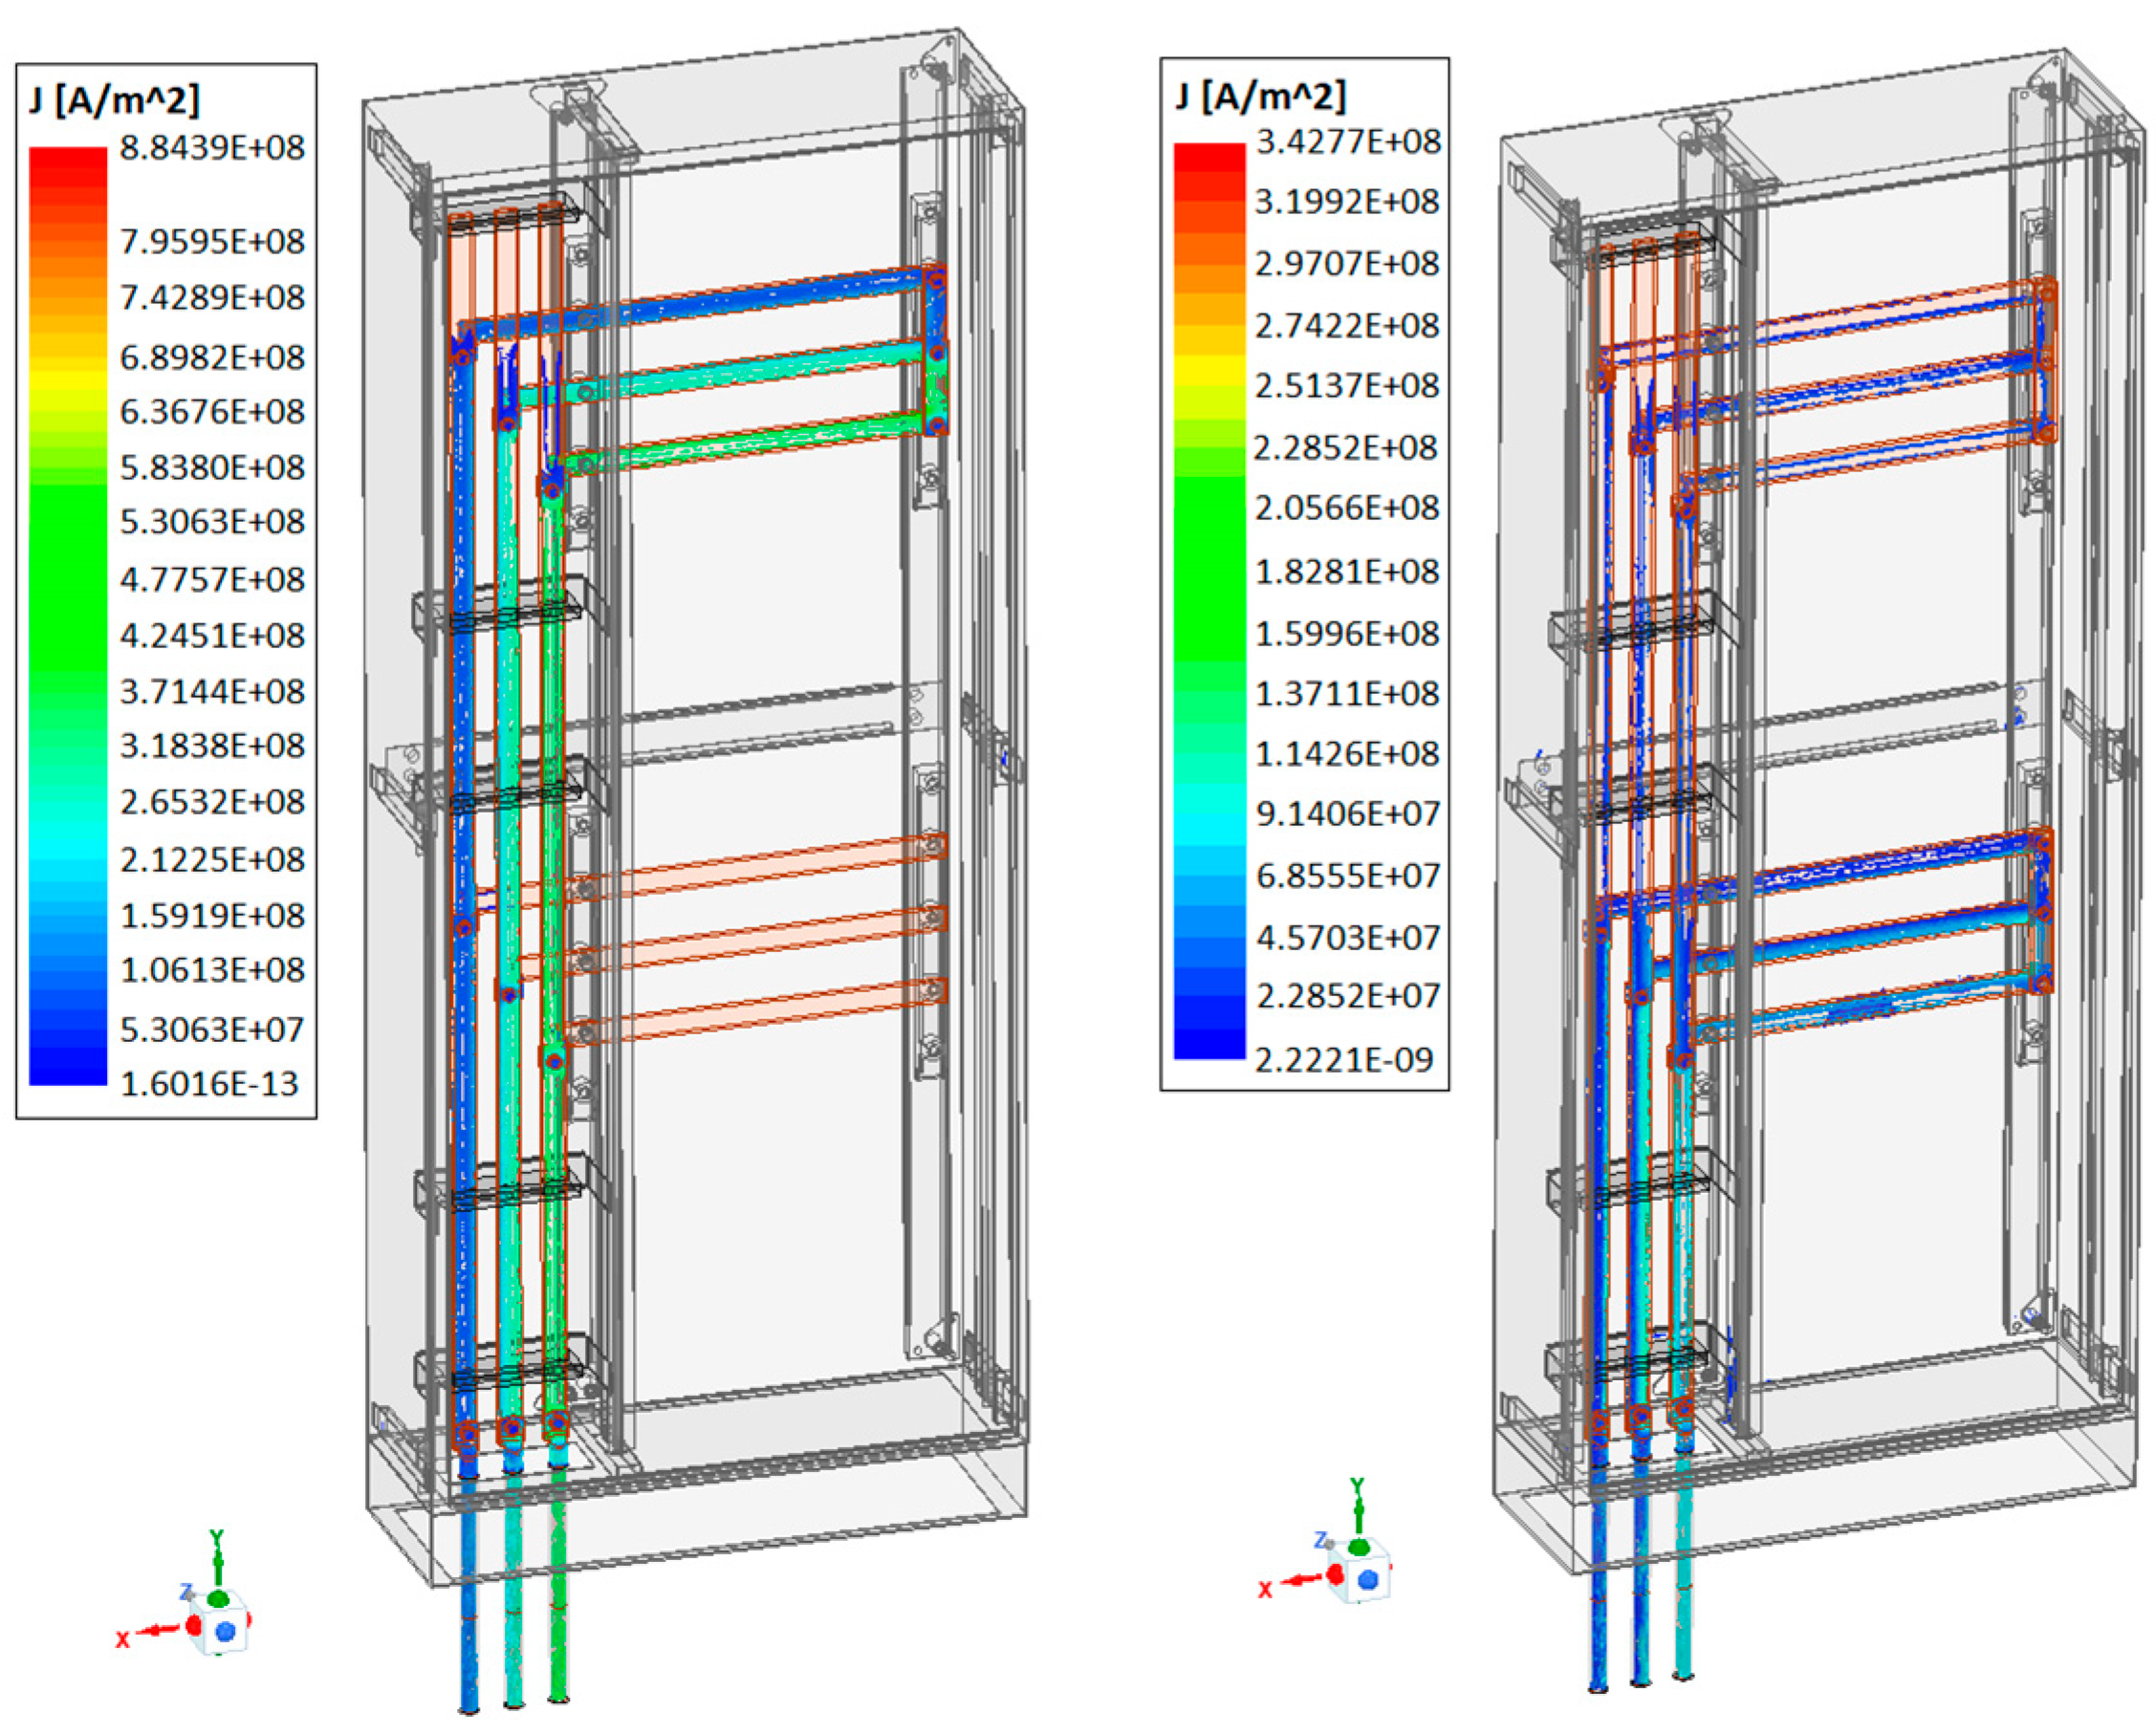
After performing the simulation calculations in the Maxwell 3D module, it was possible to generate waveforms of the obtained values of electrodynamic forces for selected points. The maximum values of electrodynamic forces were obtained on the vertical part of the current track, due to the smaller rail spacing (60 mm) compared to the horizontal parts of the current paths, where the spacing was 100 mm between each busbar. The obtained maximum values of electrodynamic forces for the analyzed cases are presented in the graphs below (
Figure 12). The maximum values of electrodynamic forces in the current path differ for both analyzed cases. For switchgear with two jumpers, the maximum obtained values of electrodynamic forces are lower by half compared to the case for one jumper in the upper part of the horizontal current path, though the current path closes at a different point for both cases, which is clearly shown in
Figure 13 below.
Other fault locations, as can be seen from simulations and experimental tests, are of great importance to the strength of insulators and the supporting structure of the switchgear under the influence of electrodynamic interactions. For the model, for one armature, it is possible to observe very high values of electrodynamic forces in the vertical current path. During the experimental tests, as is known, all support insulators in the vertical part of the current circuit with a rail spacing of 60 mm were damaged. For the system with two jumpers, much less damage to the switchgear can be observed. Electrodynamic forces affect only a part of the vertical current path, which is precisely presented in the analysis performed.
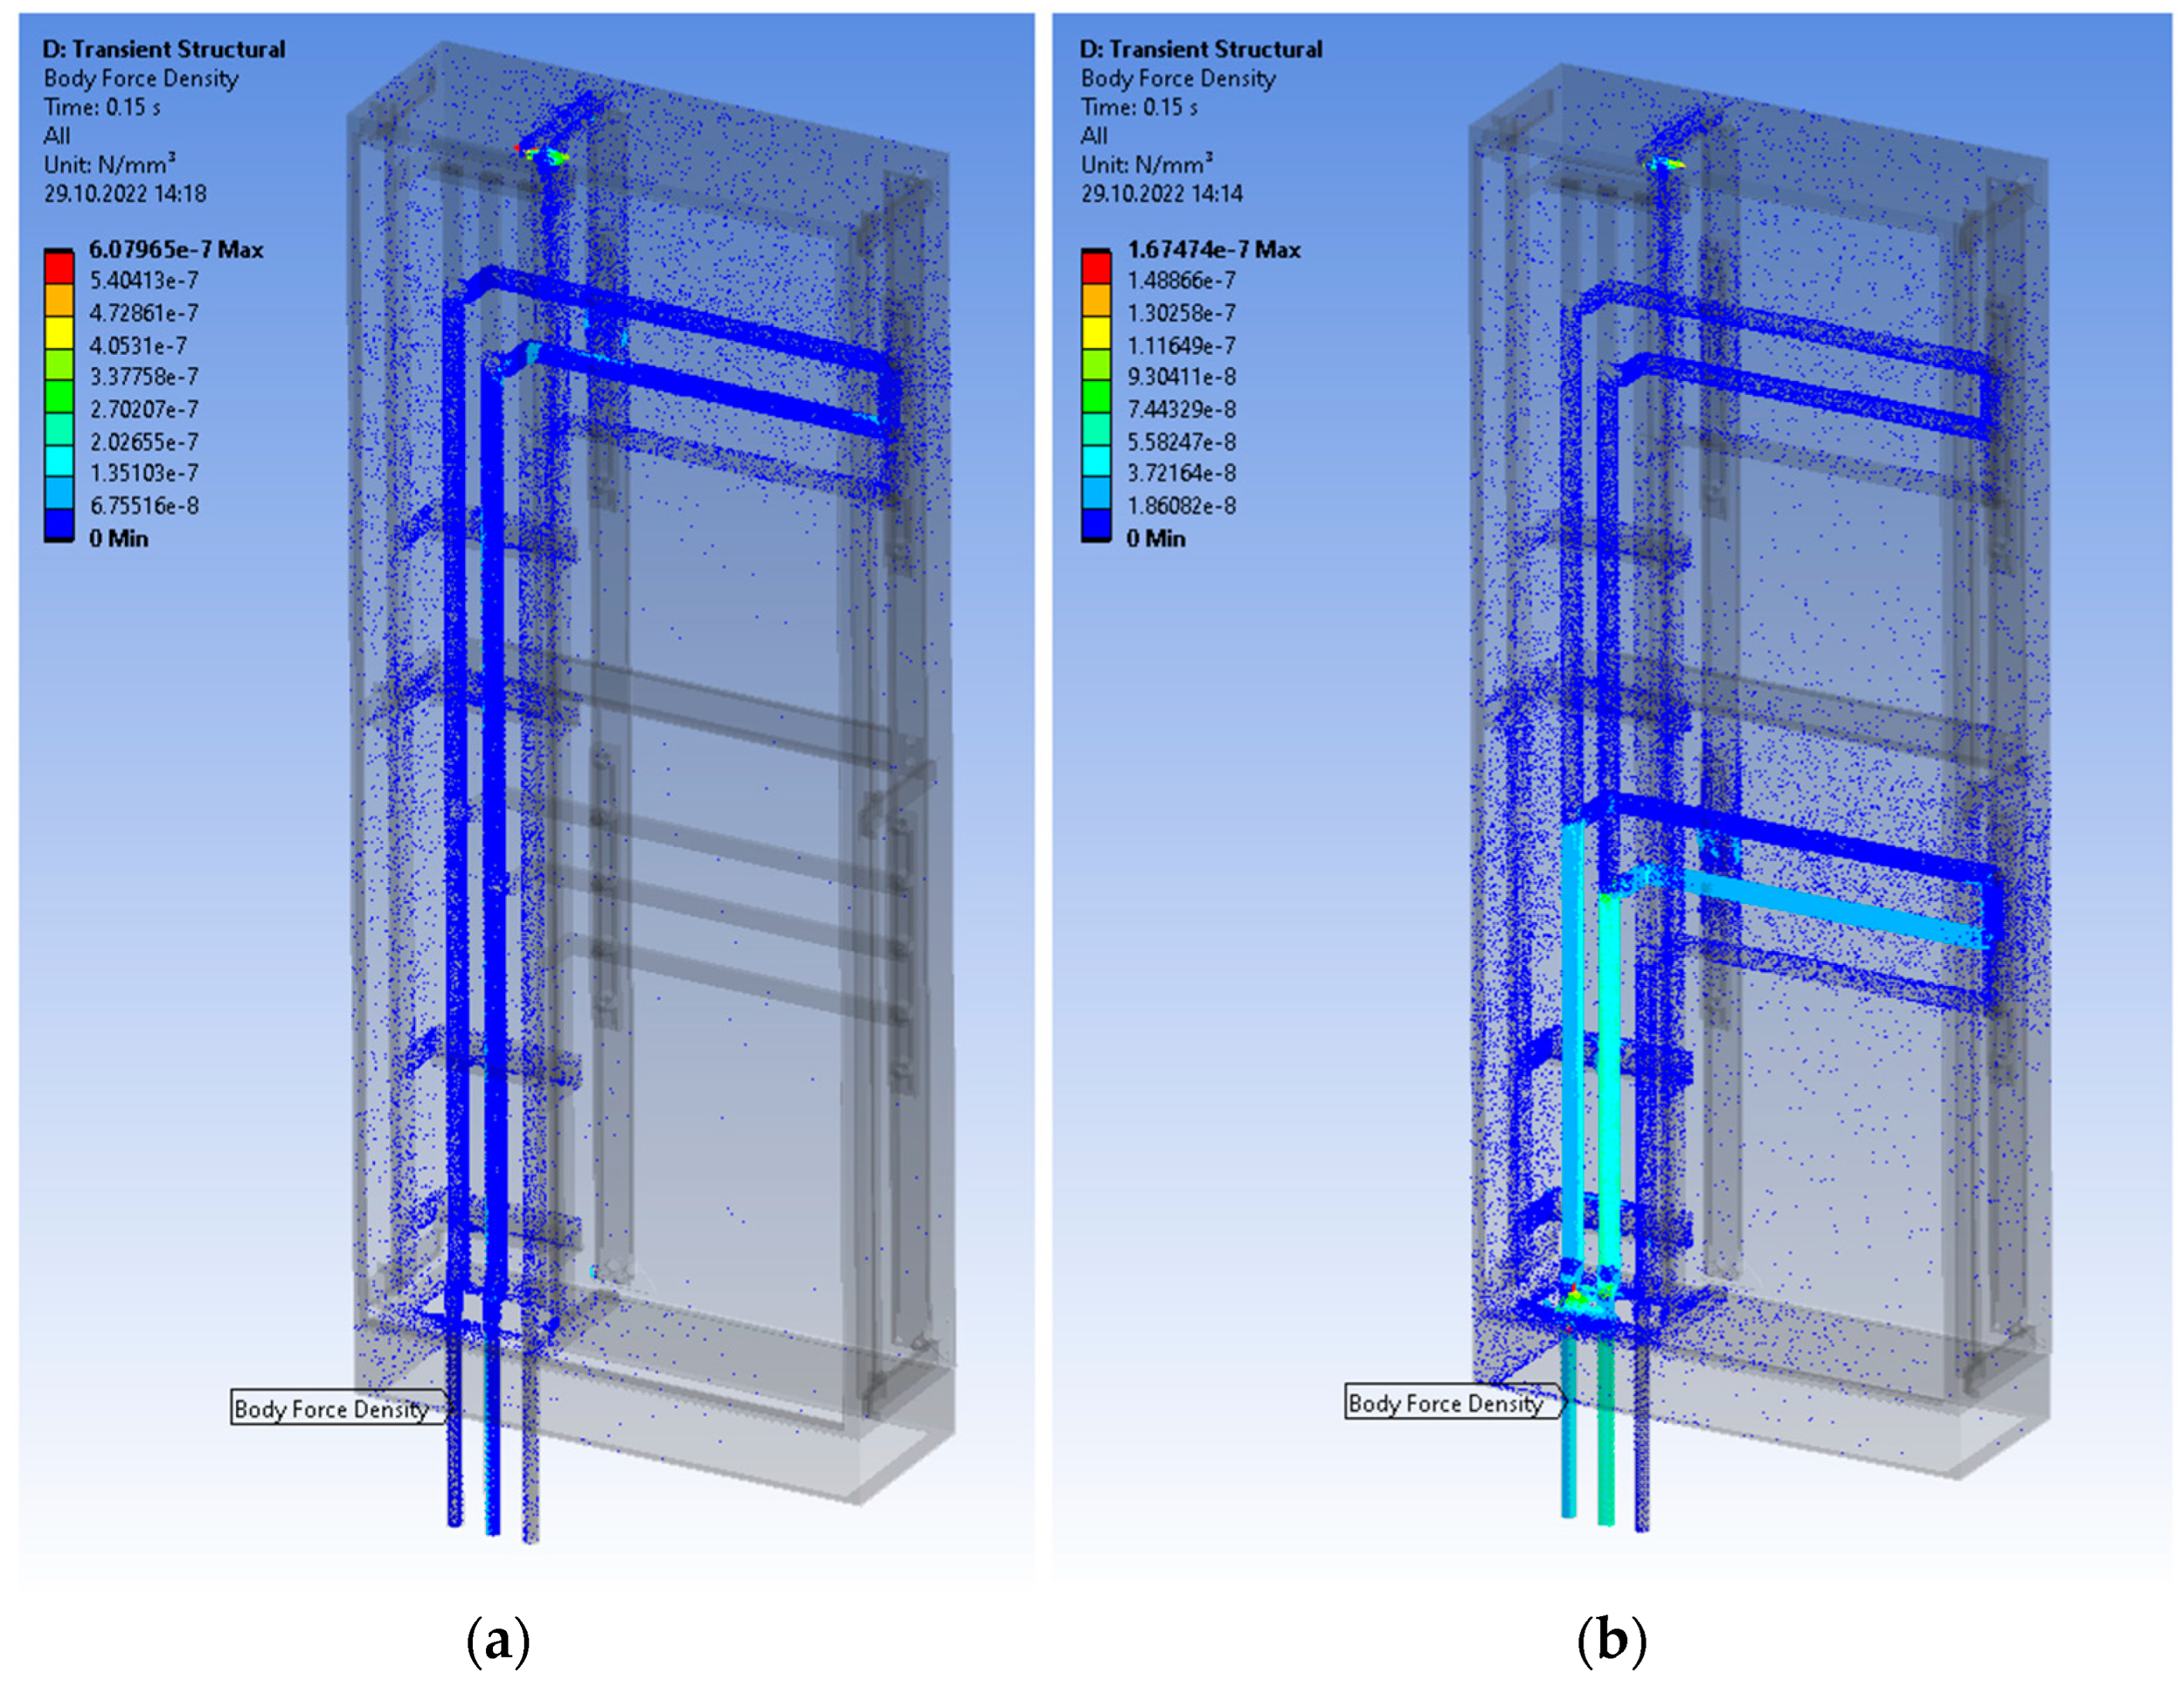
The distribution of stresses on the switchgear supporting the structures for both the considered cases of the same switchgear is completely different. Different stress values can be observed, which is of great importance if we consider the strength of insulators and supporting elements in impacting electrodynamic forces. In order to illustrate how both cases look,
Figure 14a shows the distribution of “Body Force Density” imported from the Maxwell 3D module to Ansys Transient Structural Mechanical. As shown in
Figure 14b below, in the case with two jumpers at the ends of the horizontal parts of the current path, the highest force values expressed in N/m
2 are at the bottom of the vertical current path and the middle busbar of the lower horizontal current path. This is because the flowing fault current follows the shortest possible path to the fault point where there is a lower resistance value. In the case of one armature, the short-circuit current flows only to one short-circuit point, where the electrodynamic forces act along the entire length of the vertical part of the current path and on its upper horizontal part. This causes very high values for electrodynamic forces at the level of 50 kA in the current peak of the analyzed case. Performing additional coupled analysis in Ansys Transient Structural Mechanical allowed us to determine the values of stresses and strains occurring on the insulators and supporting elements of the switchgear. In order to perform this type of analysis in the ANSYS Workbench environment, a module for performing mechanical analyses over time was used. Geometry and calculation results from the ANSYS Maxwell 3D electromagnetic module were imported into this module. In the module for mechanical calculations over time, a new “mesh” had to be additionally generated for this type of calculation. In the case of the analyzed model, for one jumper, the grid amounted to 2,409,405 elements and 4,737,480 computational nodes. For the second case with two jumpers, the grid was more extensive and amounted to 2,519,877 elements and 4,854,431 computational nodes. An example of the density of the mesh computational grid to illustrate the scale is shown in
Figure 15 below.
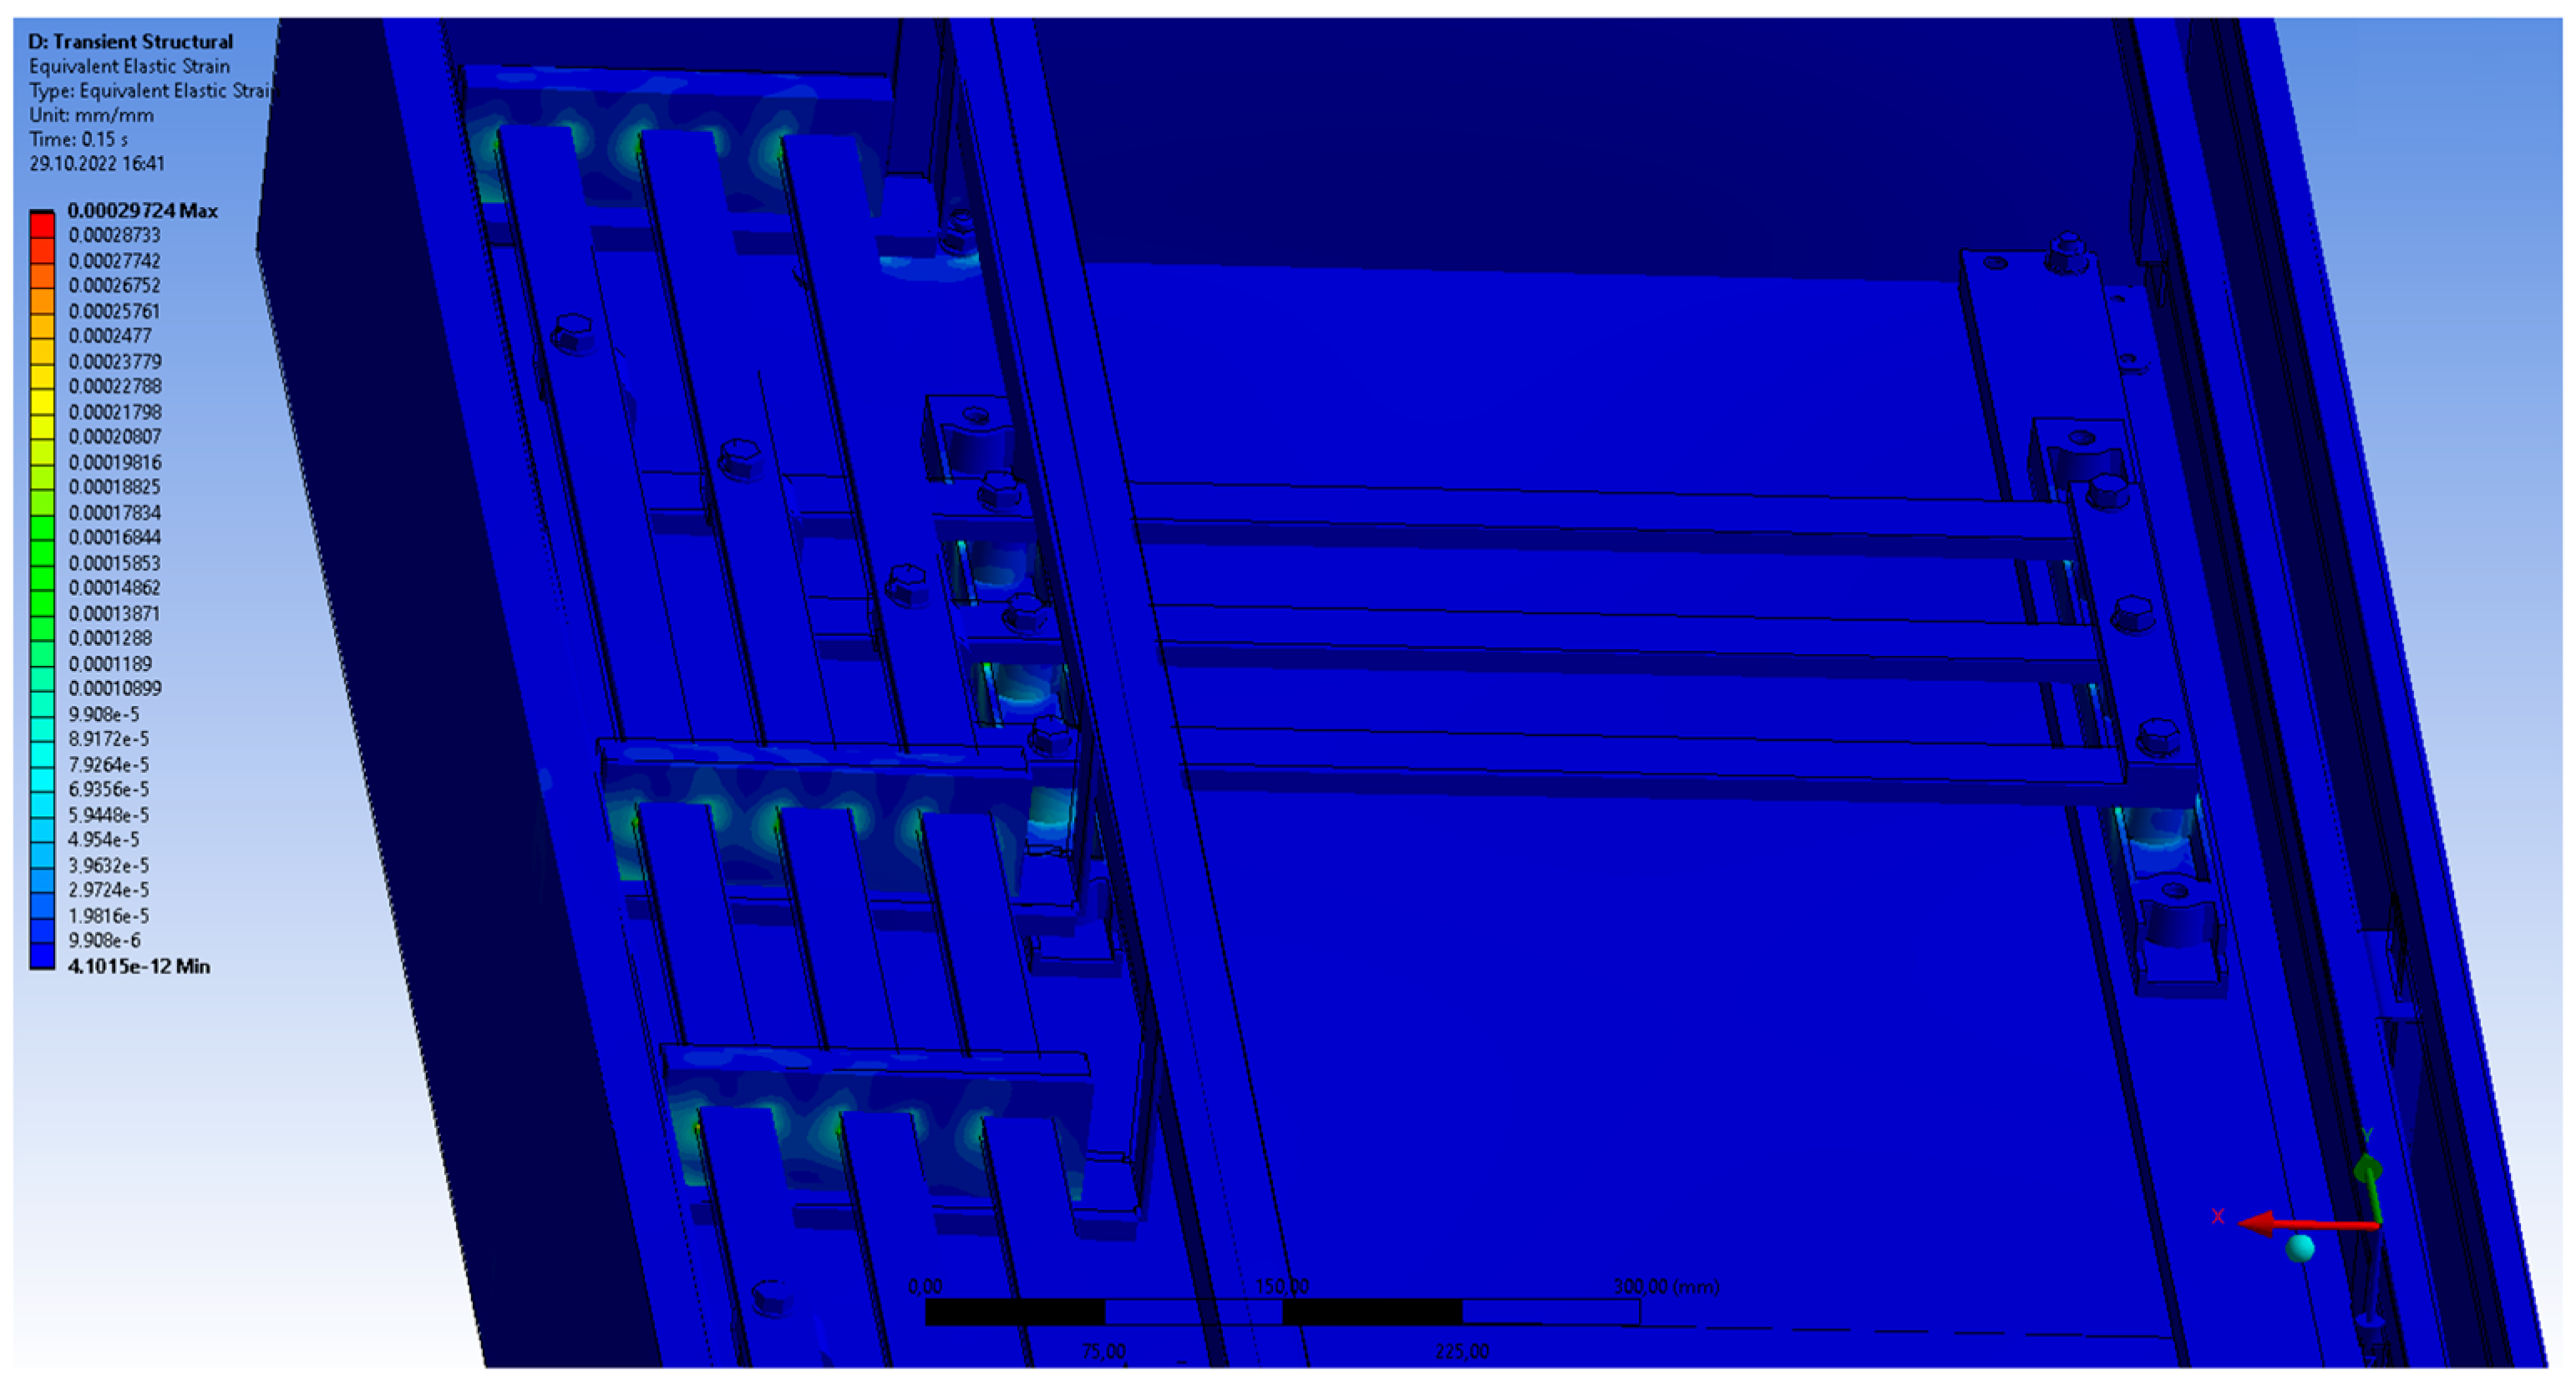
After setting the simulation time to 150 ms, it was possible to perform computational analyses for both analyzed cases. As a result of the obtained results, it was possible to analyze stresses and strains in the tested switchgear models. For this purpose, the “Equivalent Elastic Strain” option was used to generate the places most exposed to stress in the support insulators; an example for a selected time point for a system with one armature is shown in
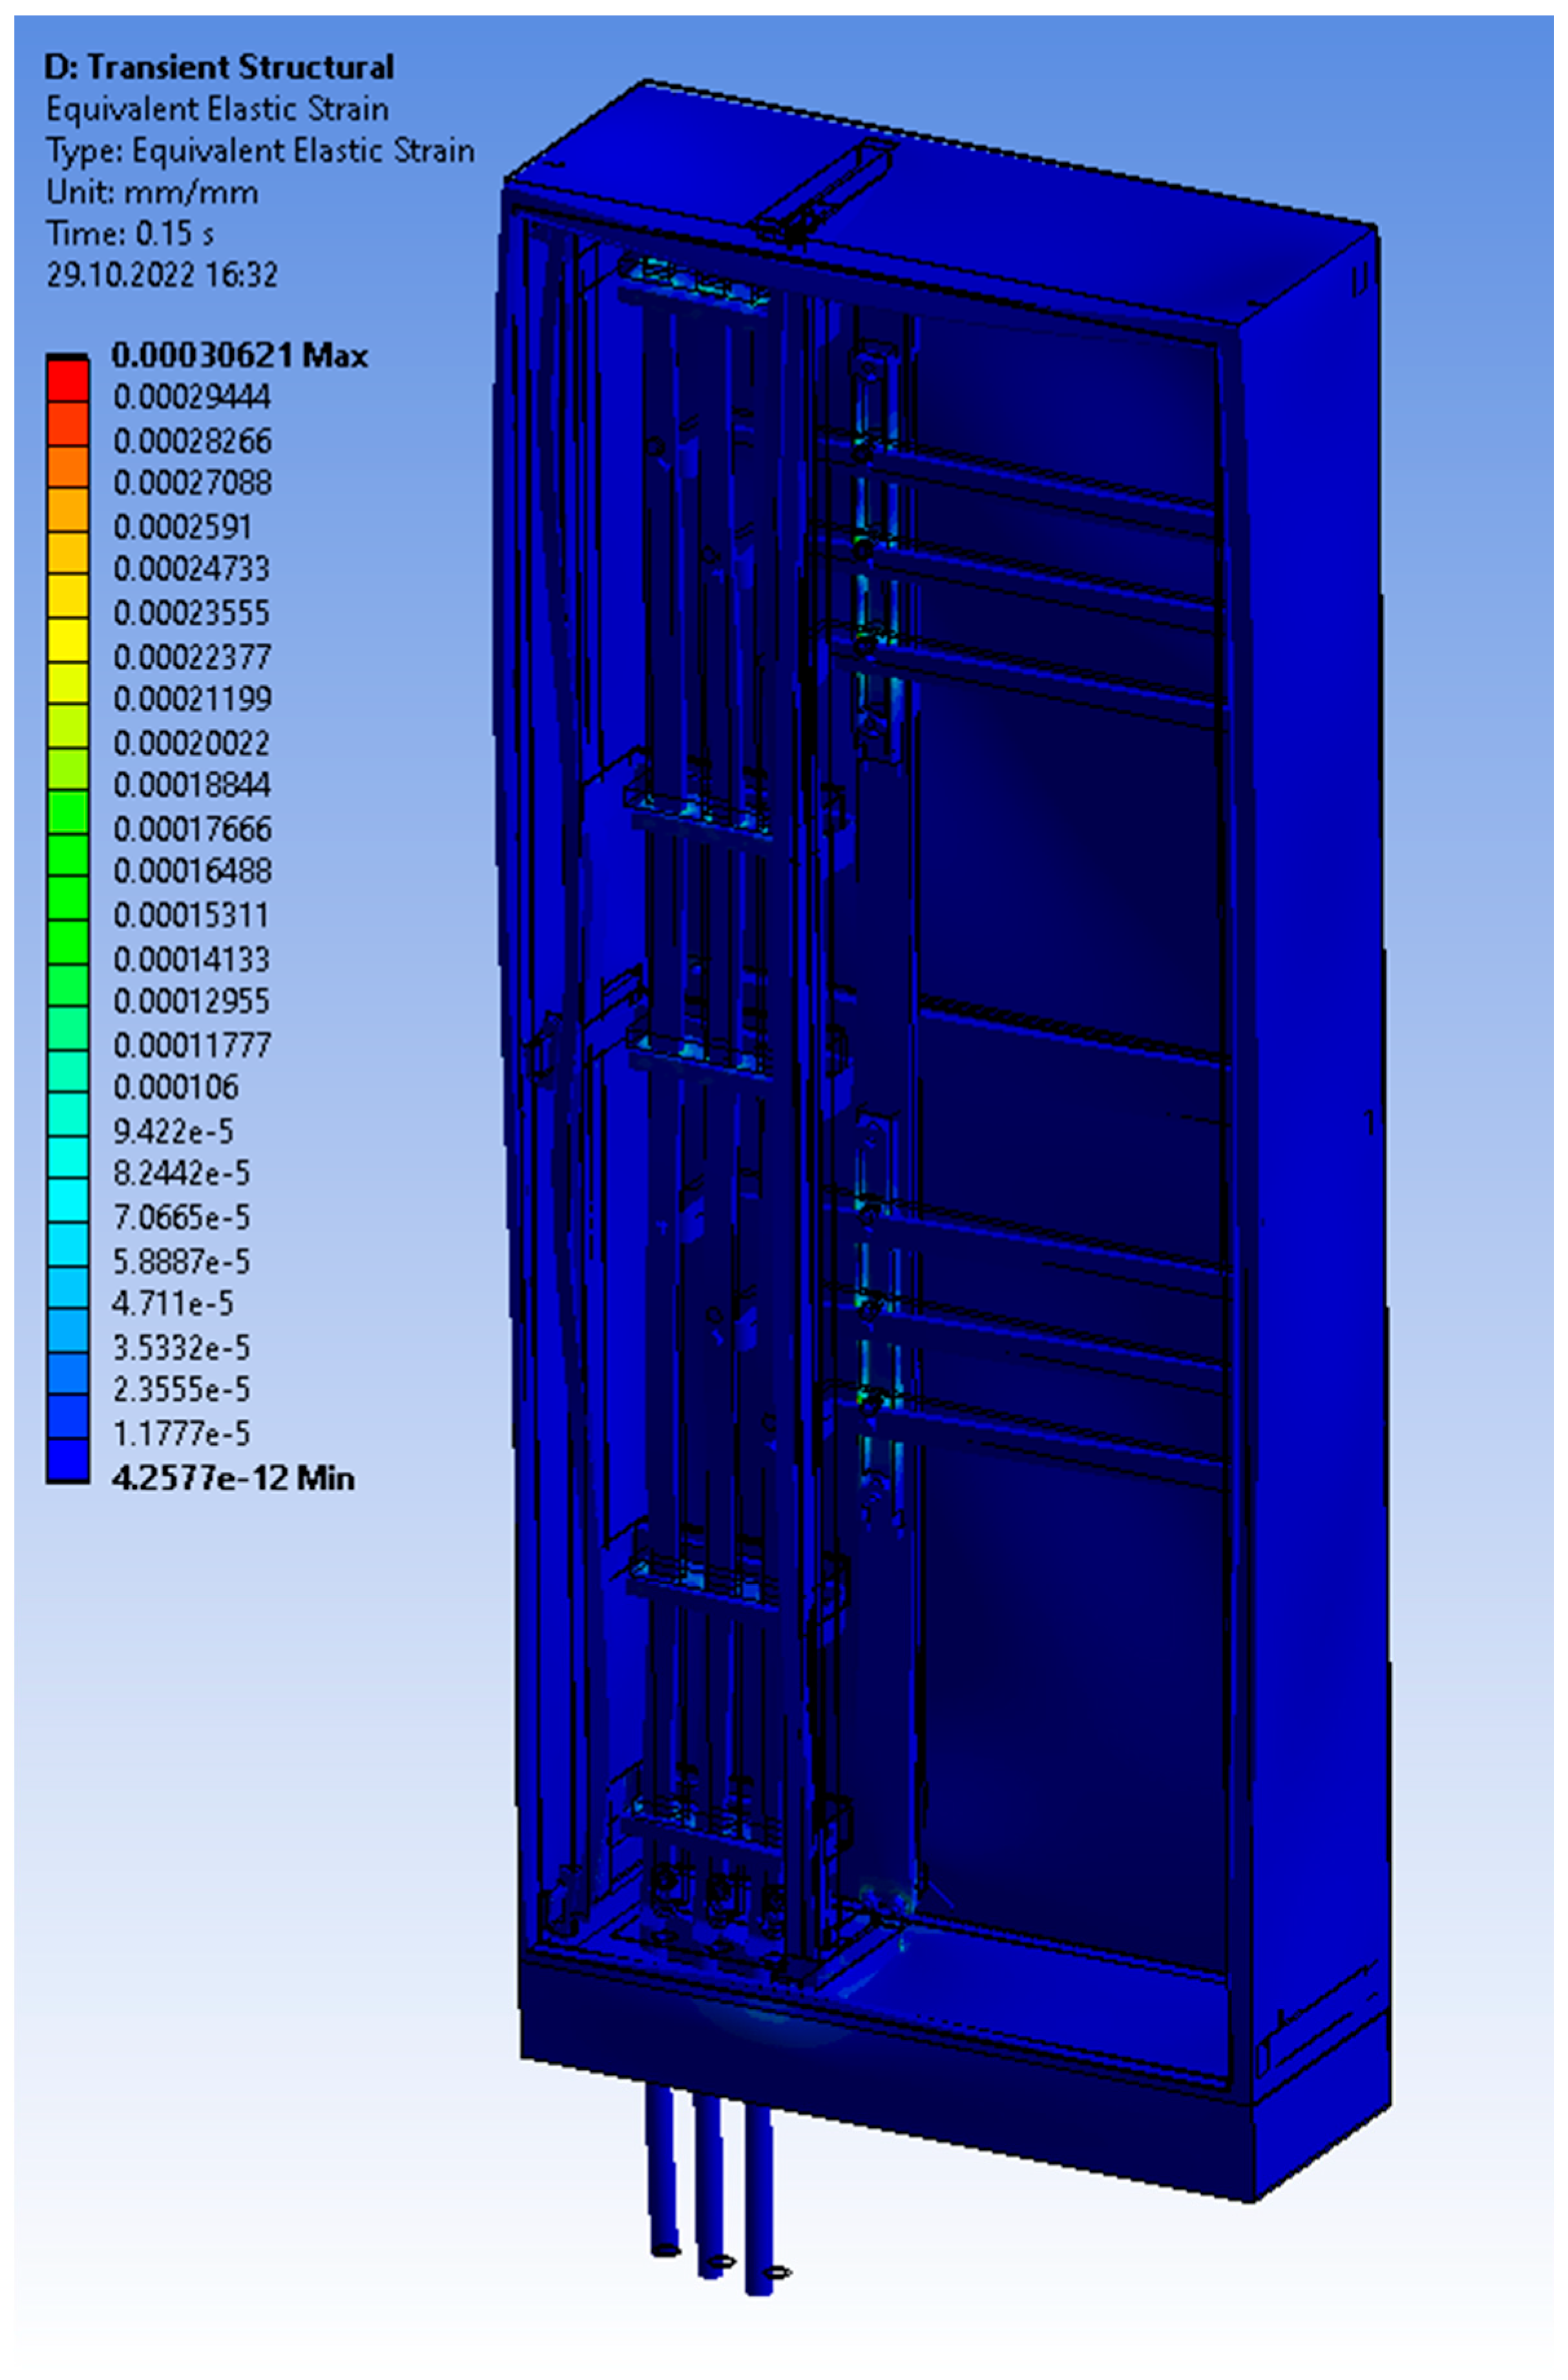
Figure 15 below. For the system with two jumpers, it looks analogous, and the highest stress values arise in the places where the busbars are fastened in the insulators to which they are screwed; an example for this system is shown in
Figure 16 below.
Figure 15.
Stress distribution on support insulators for a selected time point of 28 ms during the short-circuit current flow for a system with one jumper in the upper horizontal current path.
Figure 15.
Stress distribution on support insulators for a selected time point of 28 ms during the short-circuit current flow for a system with one jumper in the upper horizontal current path.
Another dependence confirming that the obtained simulation and experimental results have a high level of convergence is the deformation of the current rail of the lower horizontal busbar bridge. This relationship is shown in
Figure 17 below.
The experimental and simulation studies conducted in the Distribution Equipment Laboratory at the Institute of Power Engineering in Warsaw, presented the possibility of using coupled analyses to determine the value of electrodynamic forces in low-voltage switchgears. Using a real object and a virtual 3D model for research, a very high level of convergence and accuracy of the obtained results was proven. The results of deformations during the analysis showed high levels of convergence and correctness of the proposed methodology for determining the exact values of electrodynamic forces in low-voltage switchgears. The results obtained from non-standard and expensive research at an accredited research institute were used to verify the correctness of the assumptions made in this work. The presented methodology allows for the analysis of the values of generated electrodynamic forces in each millisecond of the duration of the flowing short-circuit current, in each element, and at each point of the structure of the analyzed low-voltage switchgear.
This type of methodology with the use of accurate, structural 3D models of the designed low-voltage switchgears can be successfully used in R&D departments. Each modification and change of the structure can be quickly validated and allows you to quickly obtain information on the generated electrodynamic exposures in the designed current circuits of low-voltage switchgears. At the same time, each change in the structure in the 3D construction model of the switchgear can be quickly validated through simulation, which, in the process of creating a prototype of current circuits or selection of a supporting structure, is extremely important in terms of cost reduction and time reduction or the number of necessary prototypes before performing type tests in accredited laboratories during the certification of the manufactured product.
The switchgear and insulators under normal conditions and their rated parameters would not be damaged. Additionally, damaging them was not the purpose or aim of this publication. The electrodynamics tests were carried out during abnormal conditions without switchgear or any main circuit breaker that interrupts short-circuit currents.


 ,
, 


