
Weakening of Ledinegg Instability and Maldistribution of Boiling Flow in Parallel Microchannels by Entry Effects

Abstract
:1. Introduction
2. Models and Methods
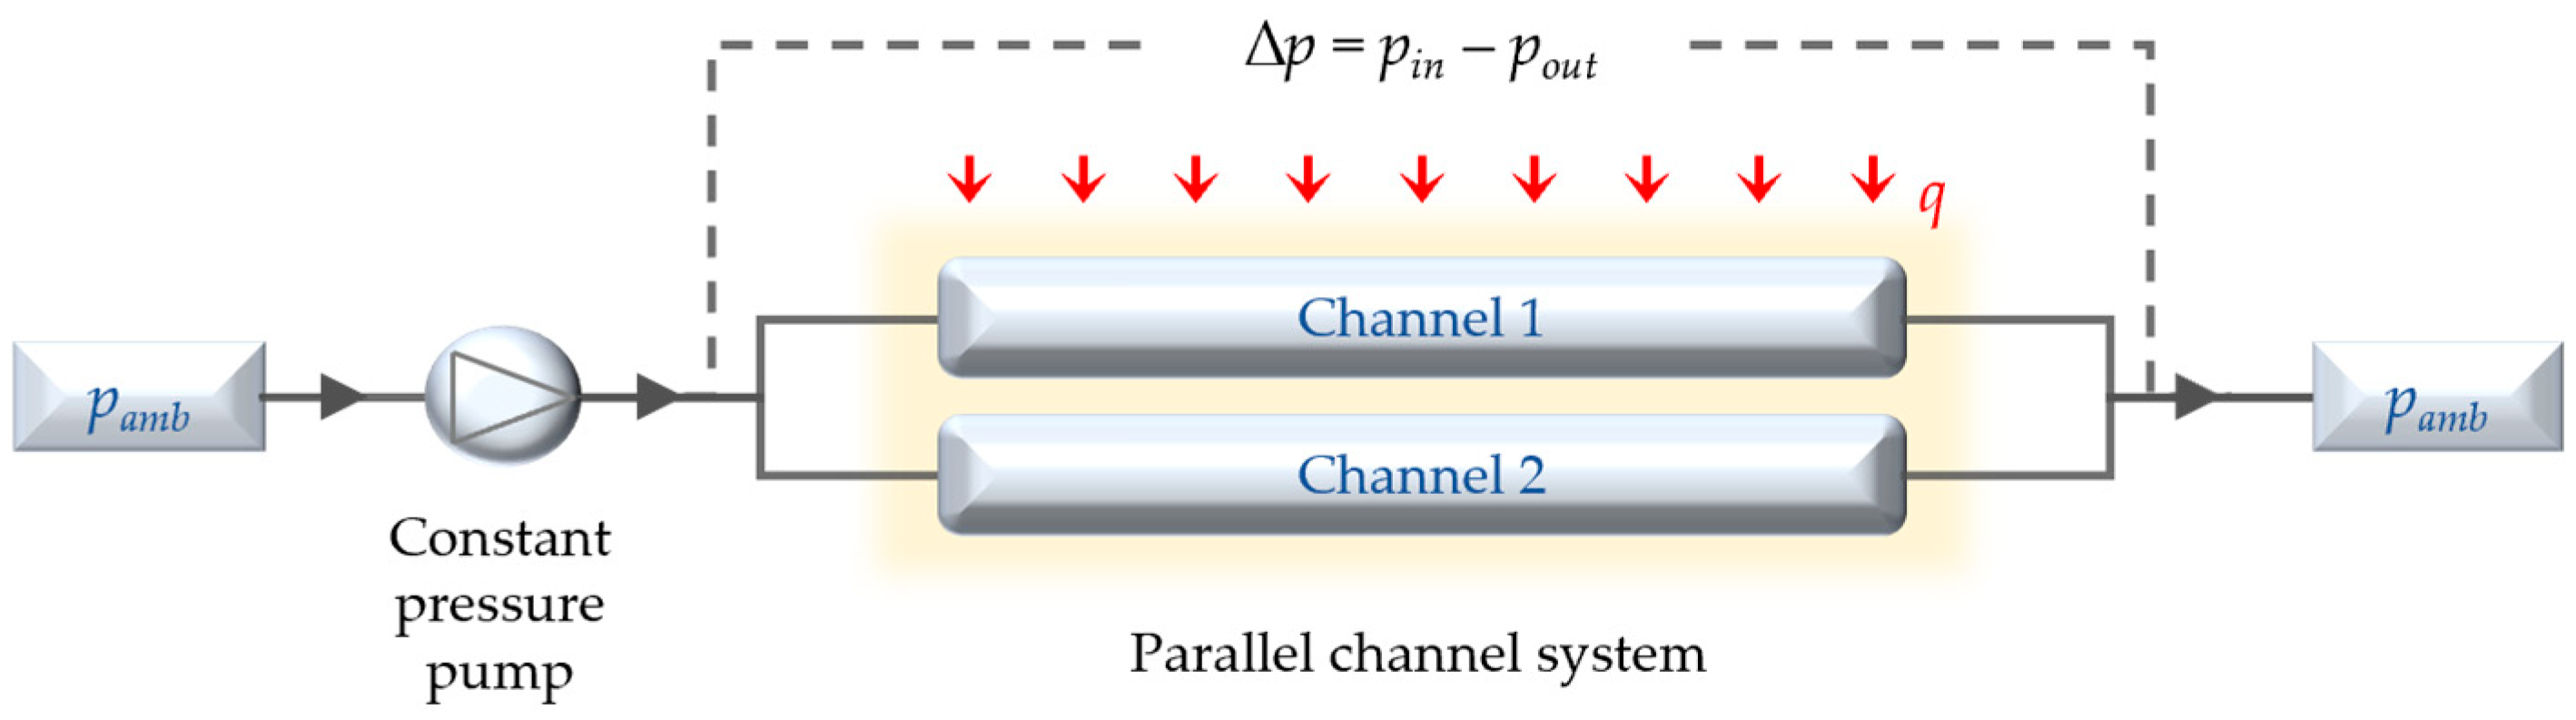
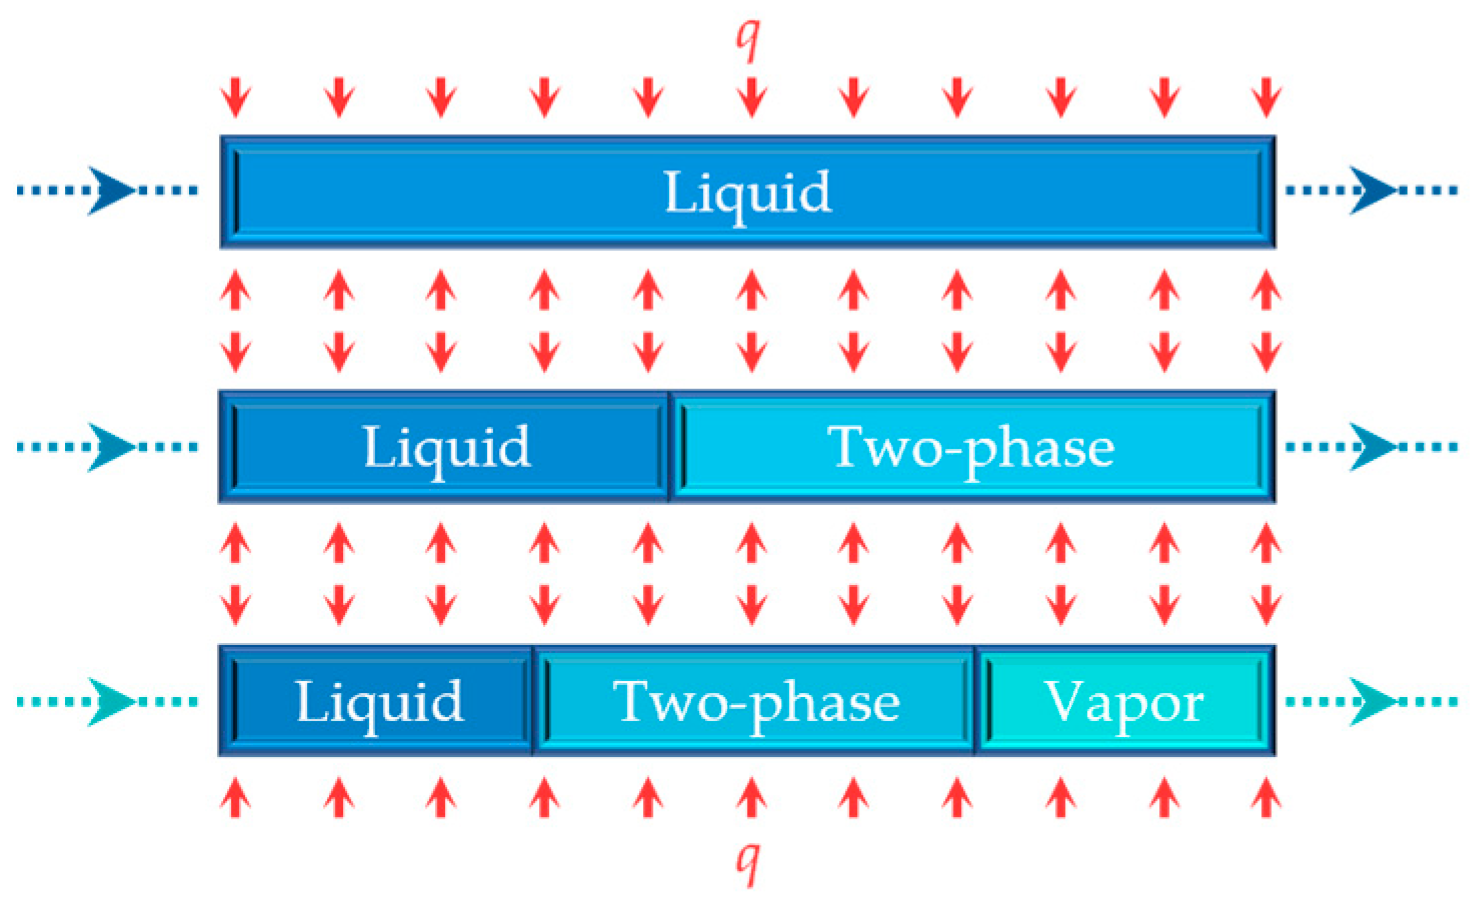
2.1. Problem Description
2.2. Model Derivation
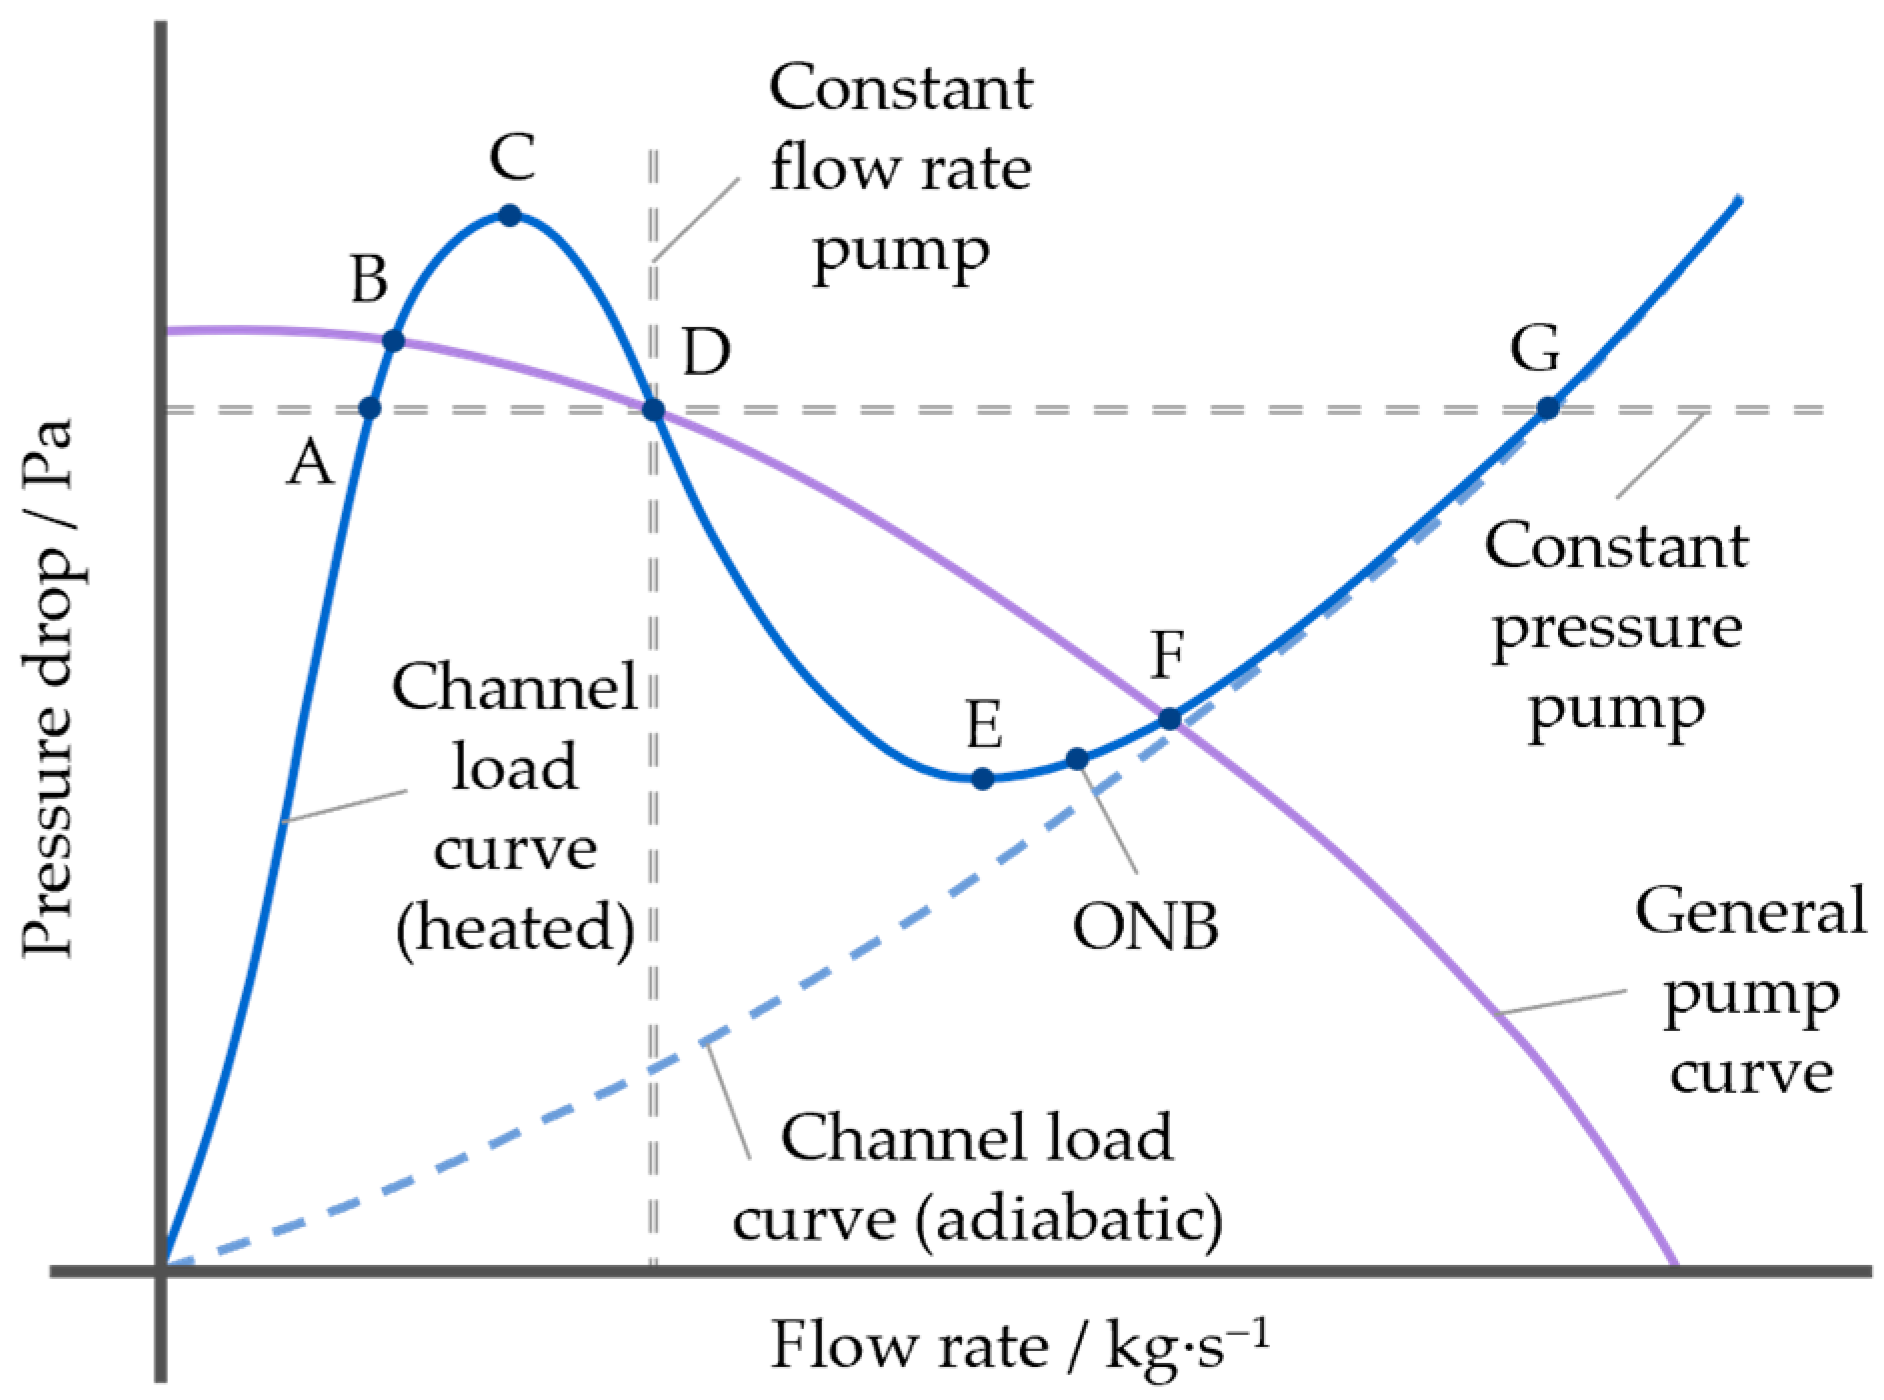
2.3. Flow Instability Criterion
2.4. Model Validation
3. Results and Discussion
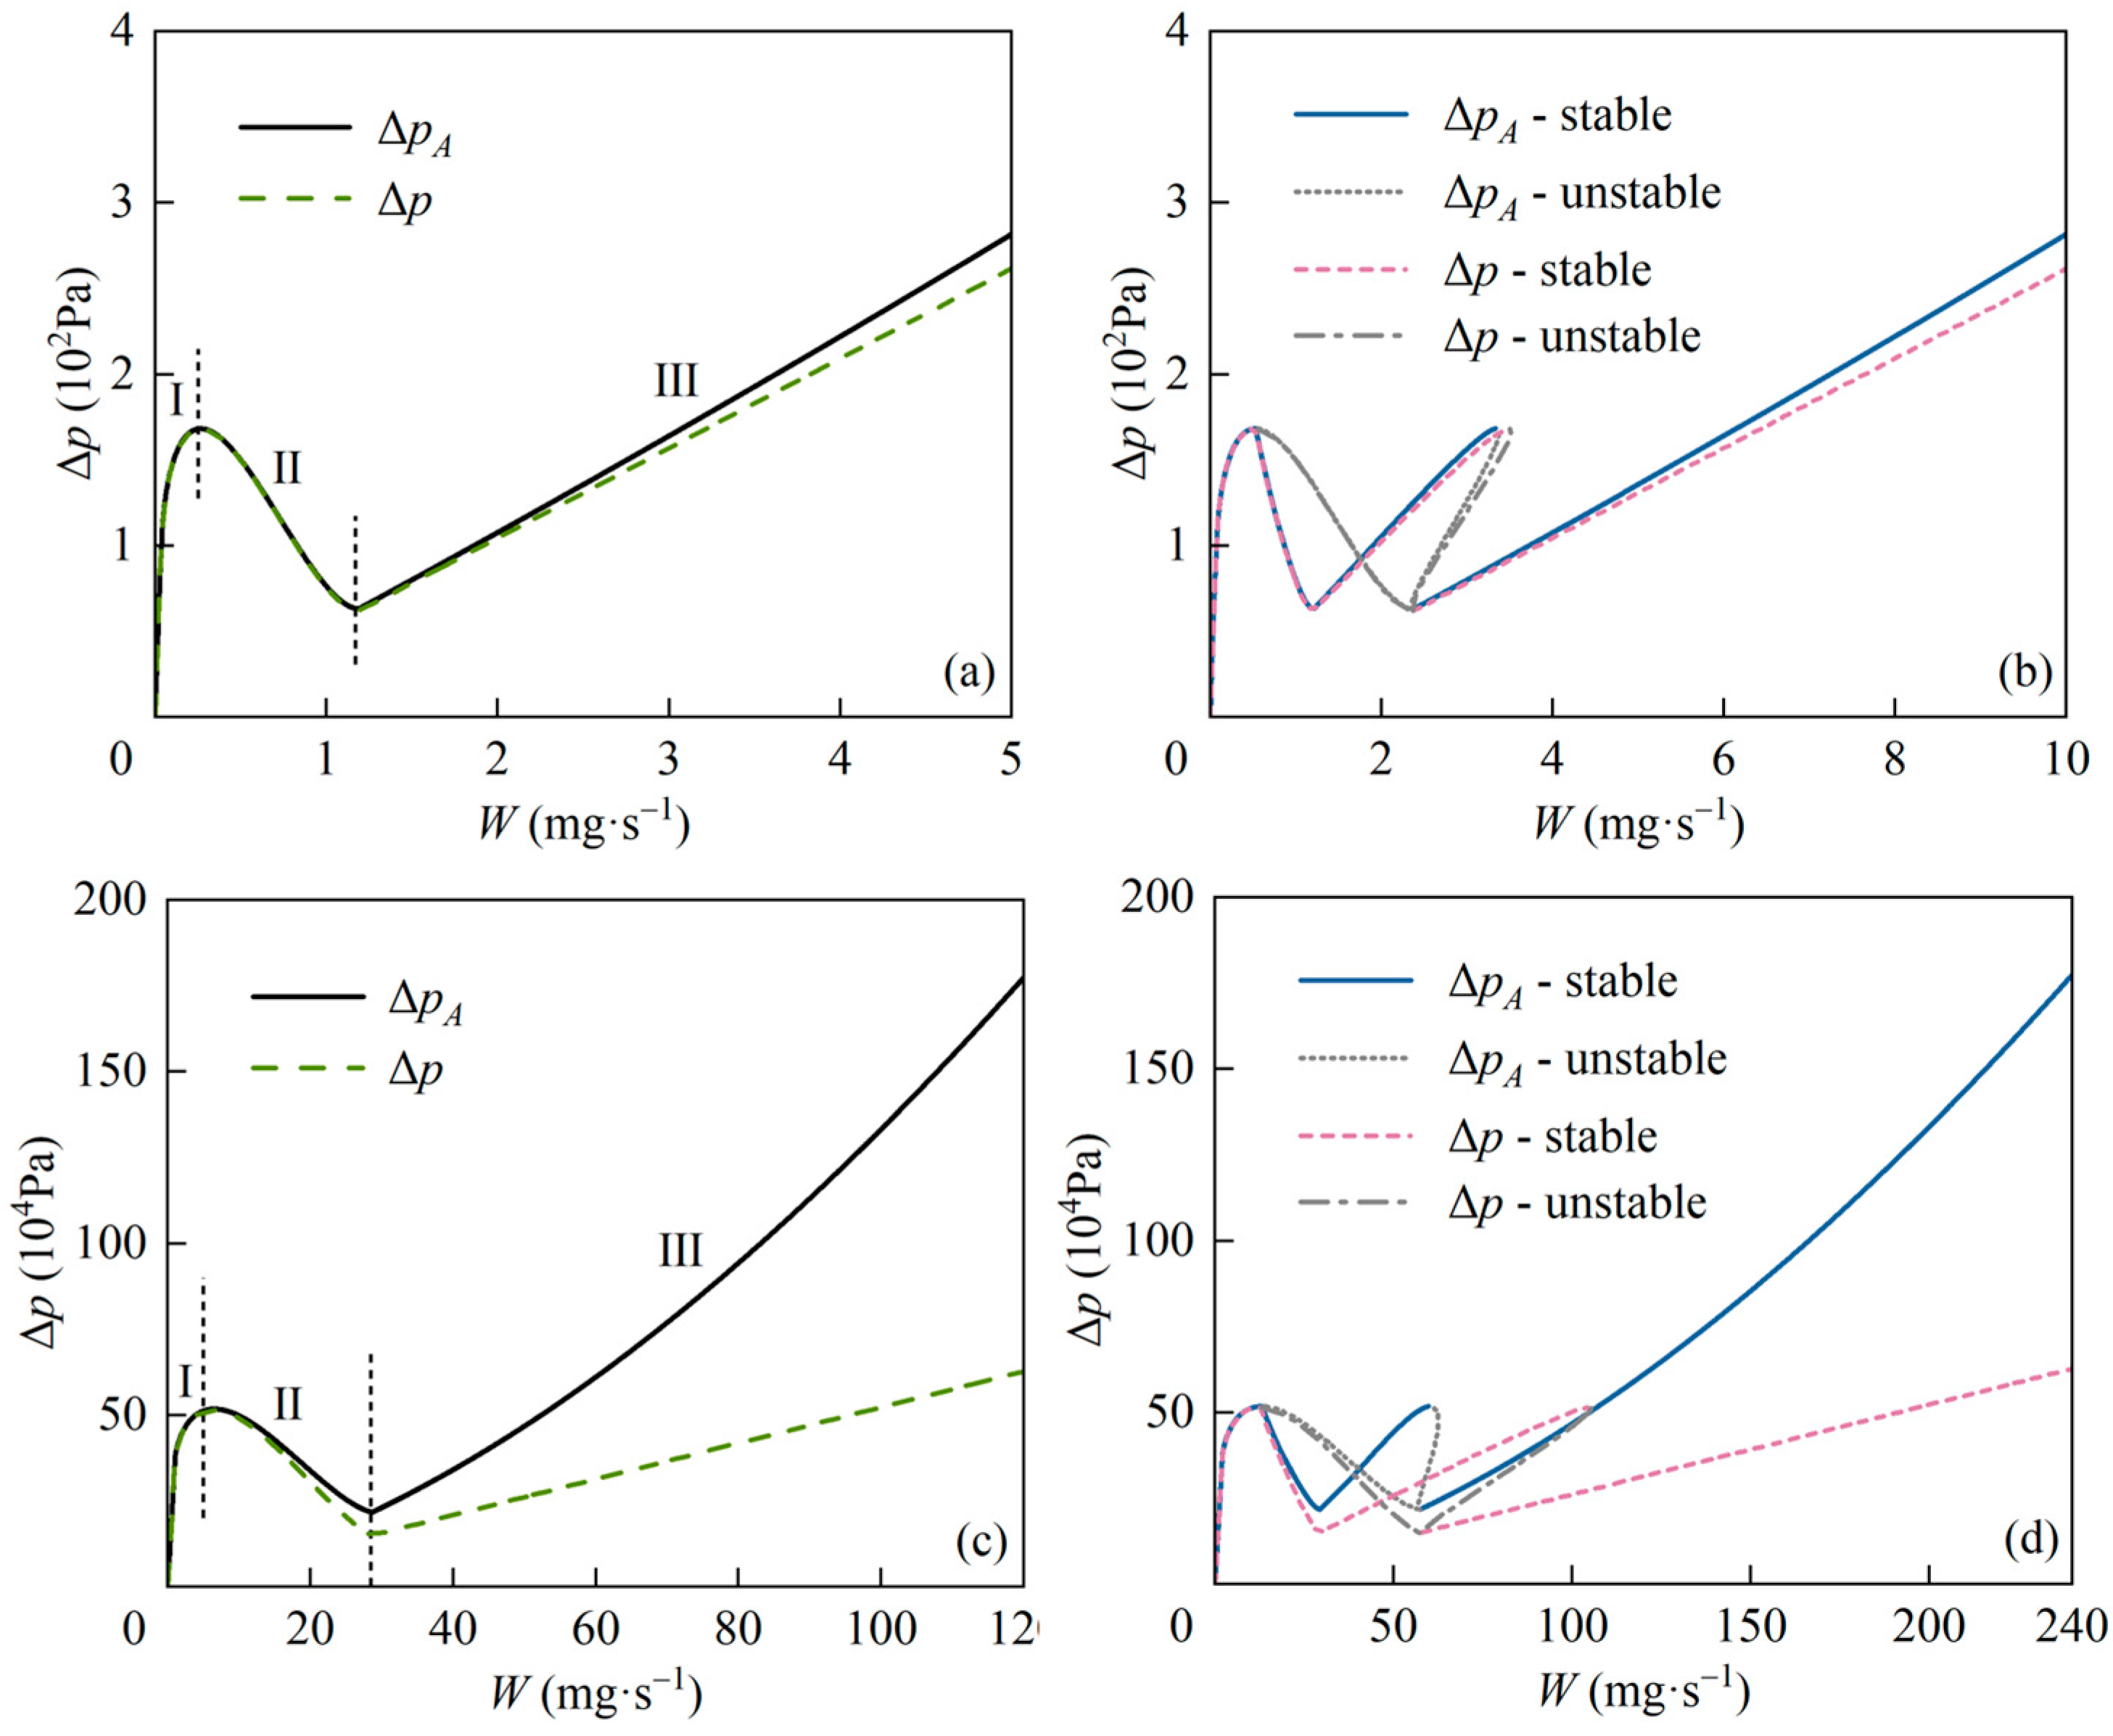
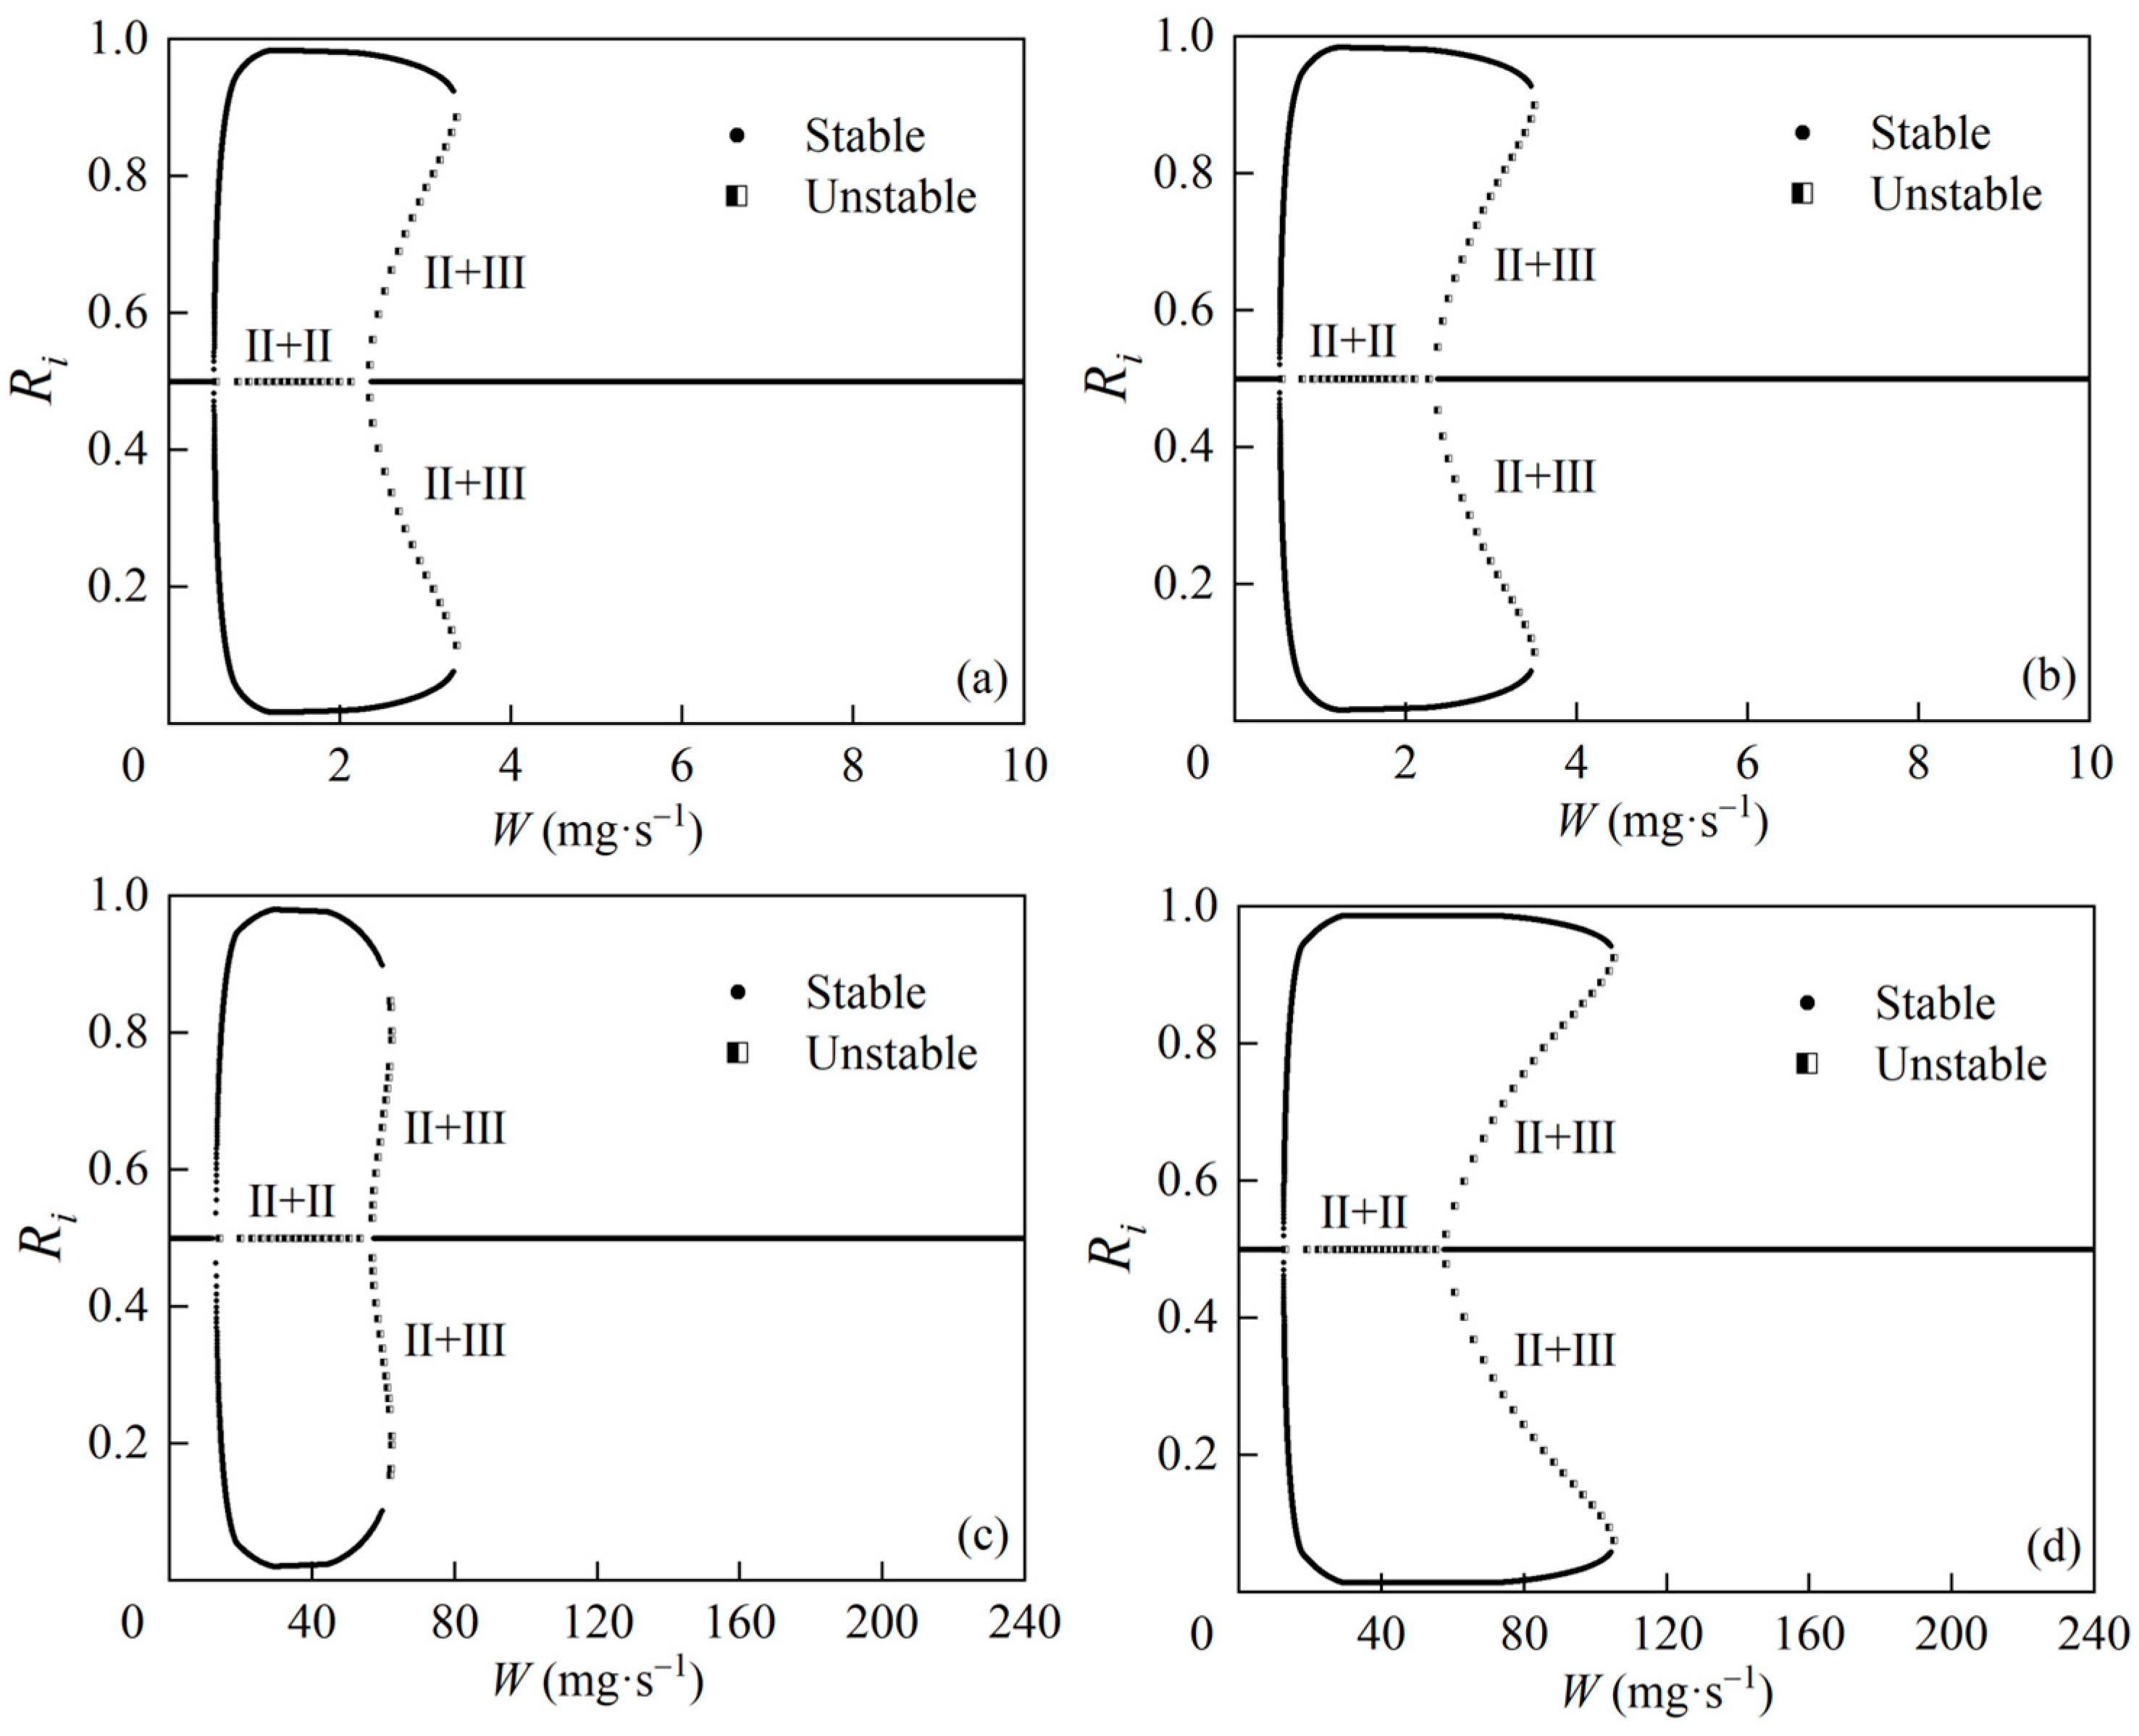
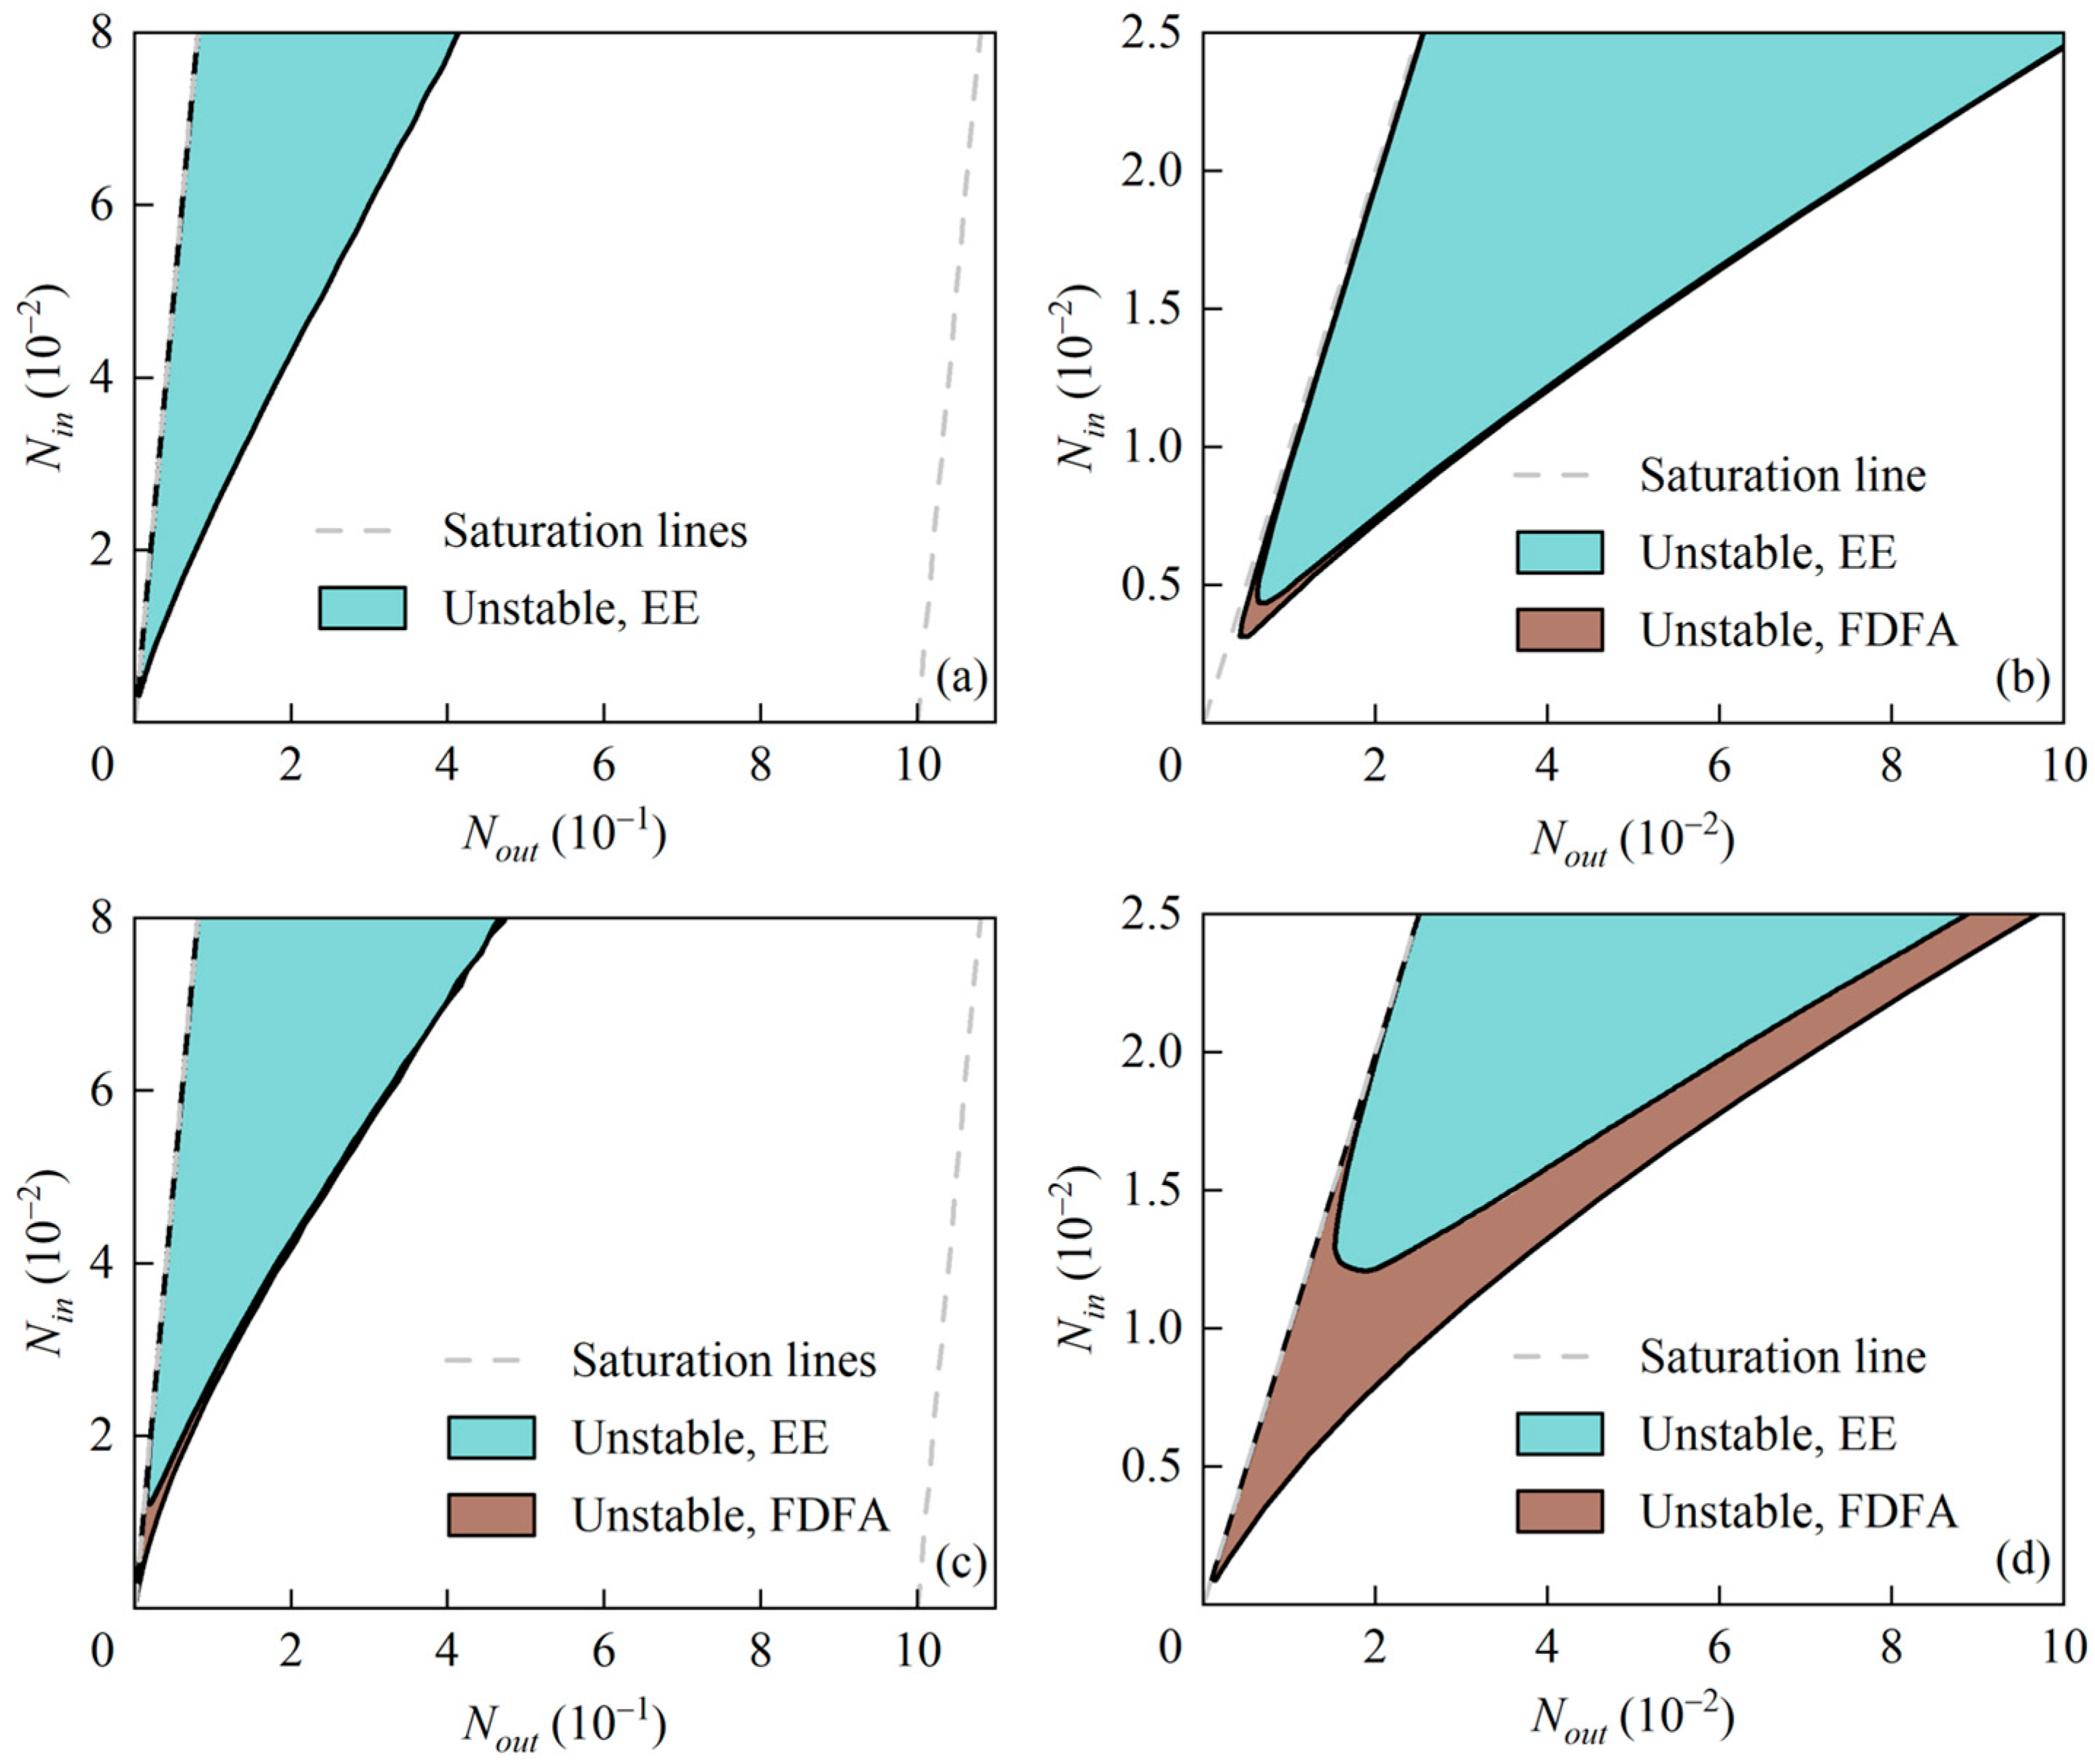
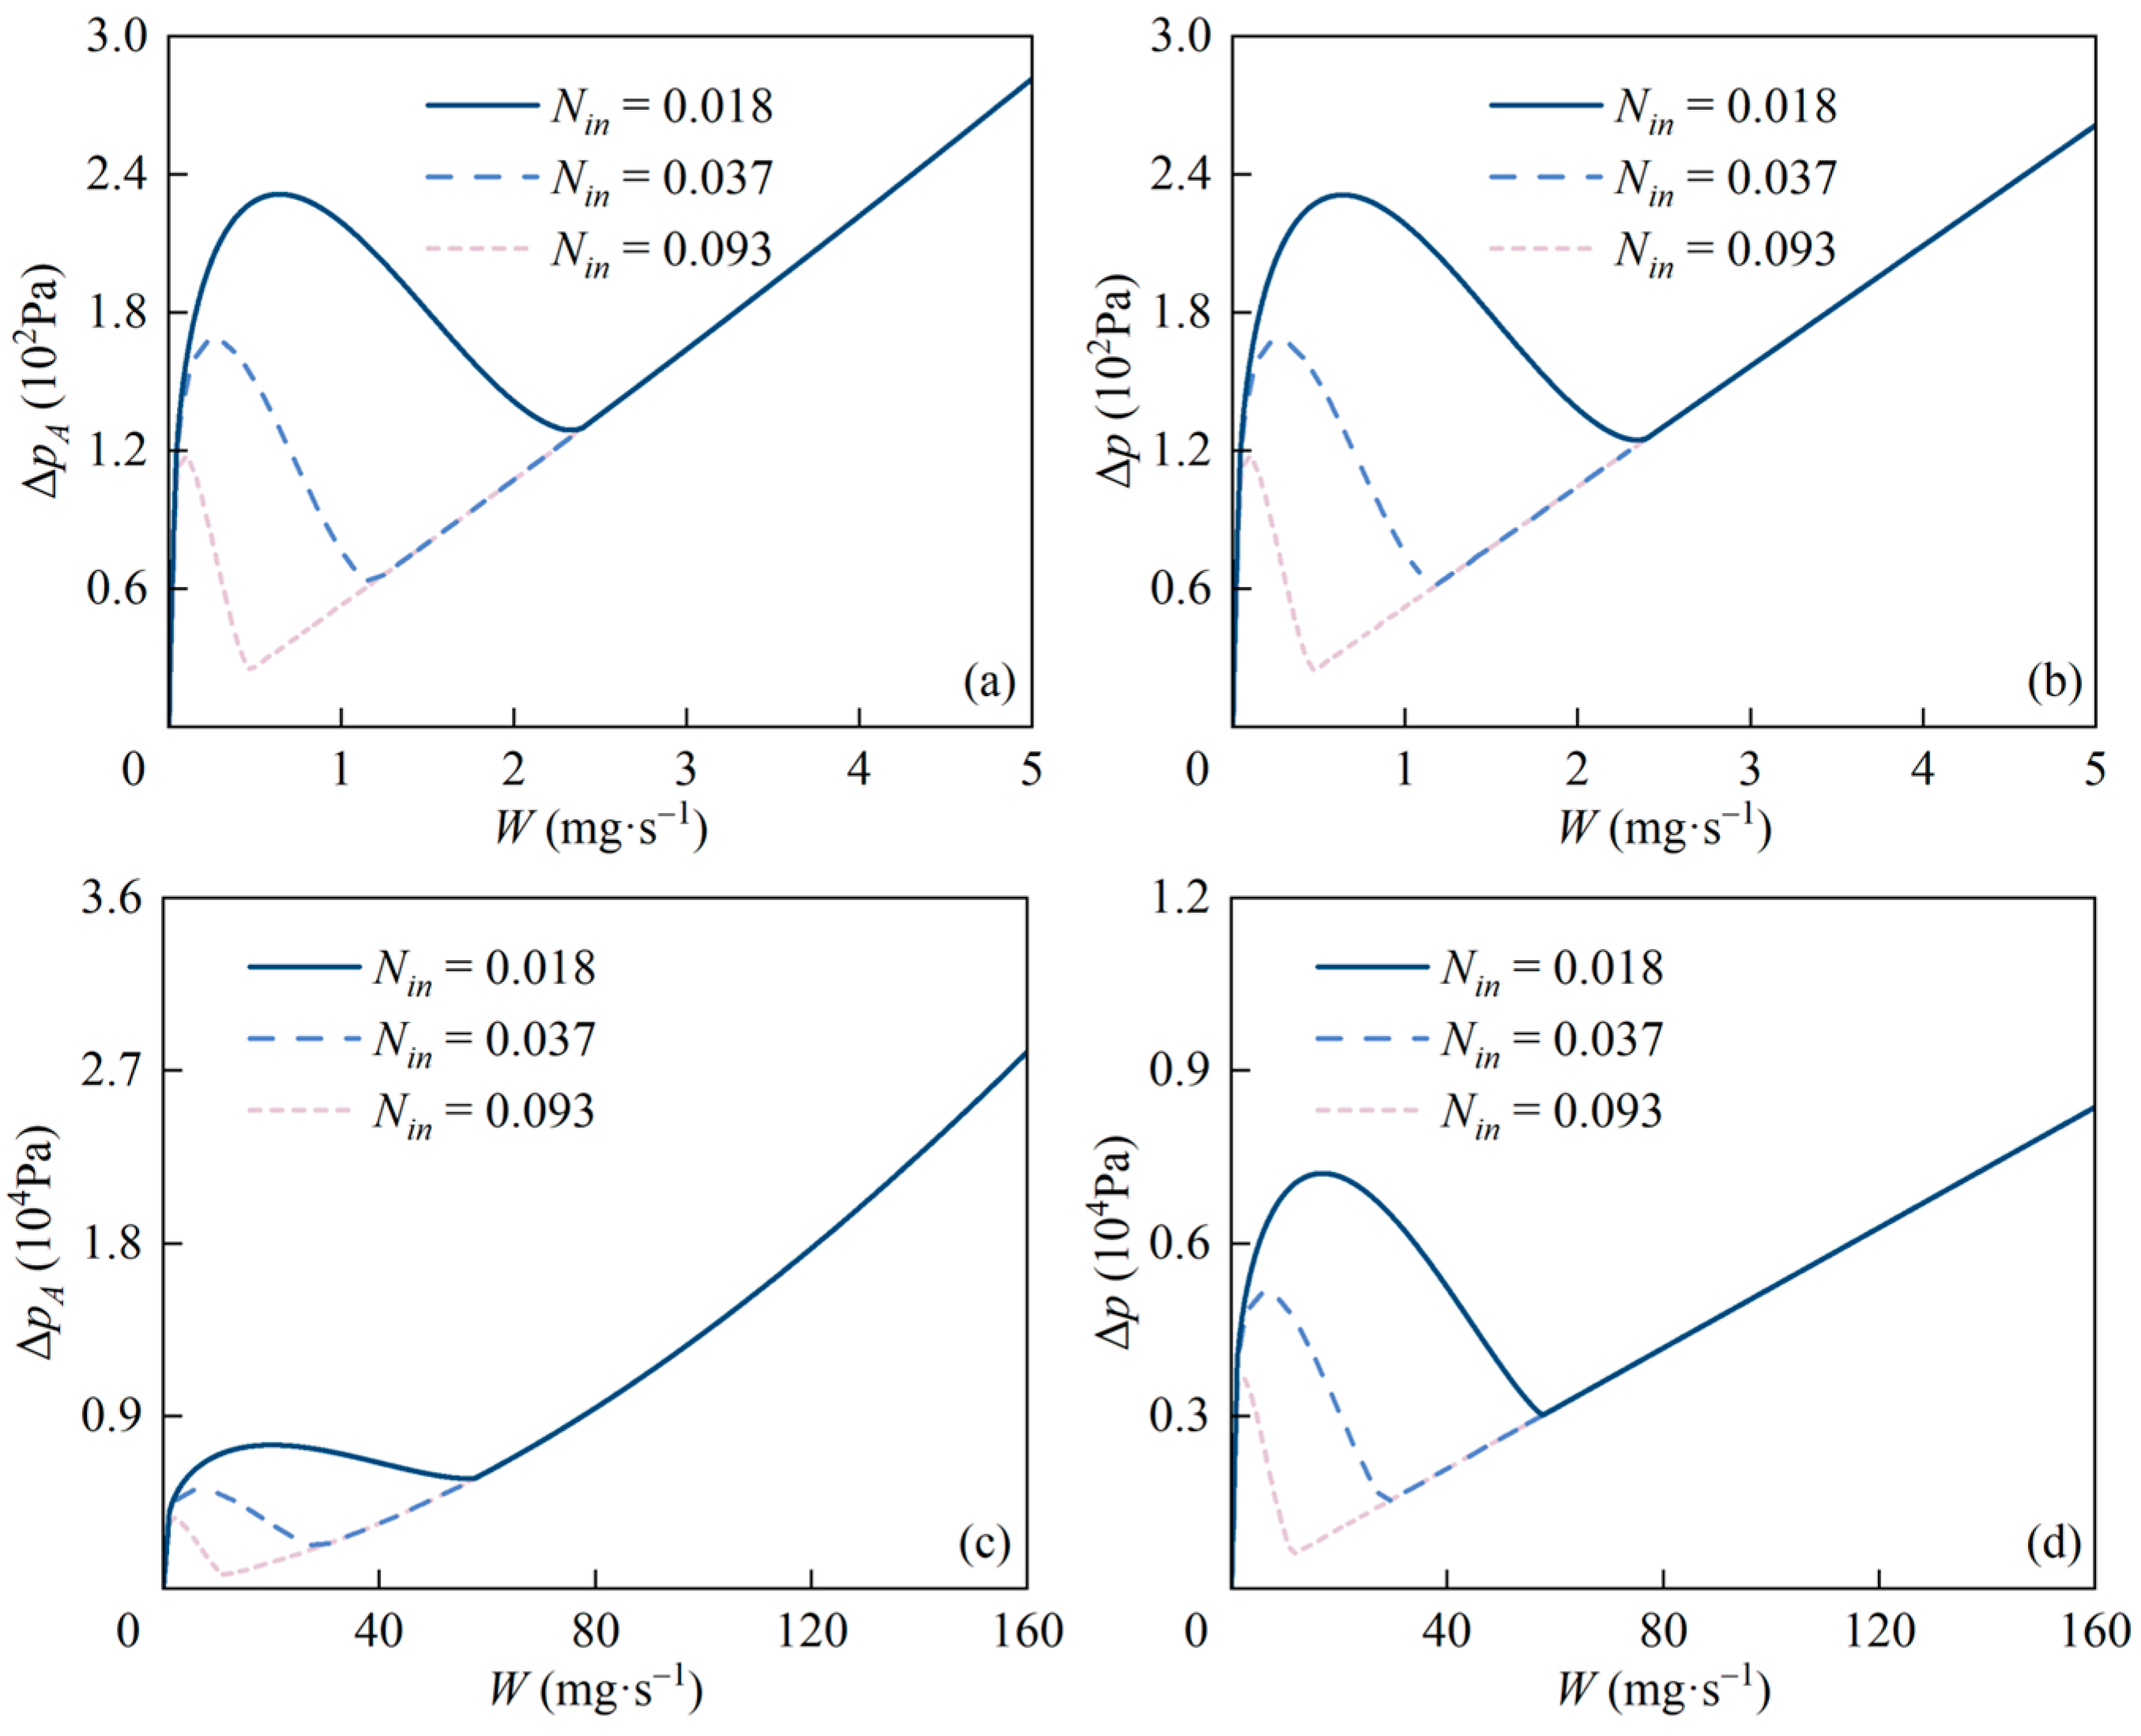
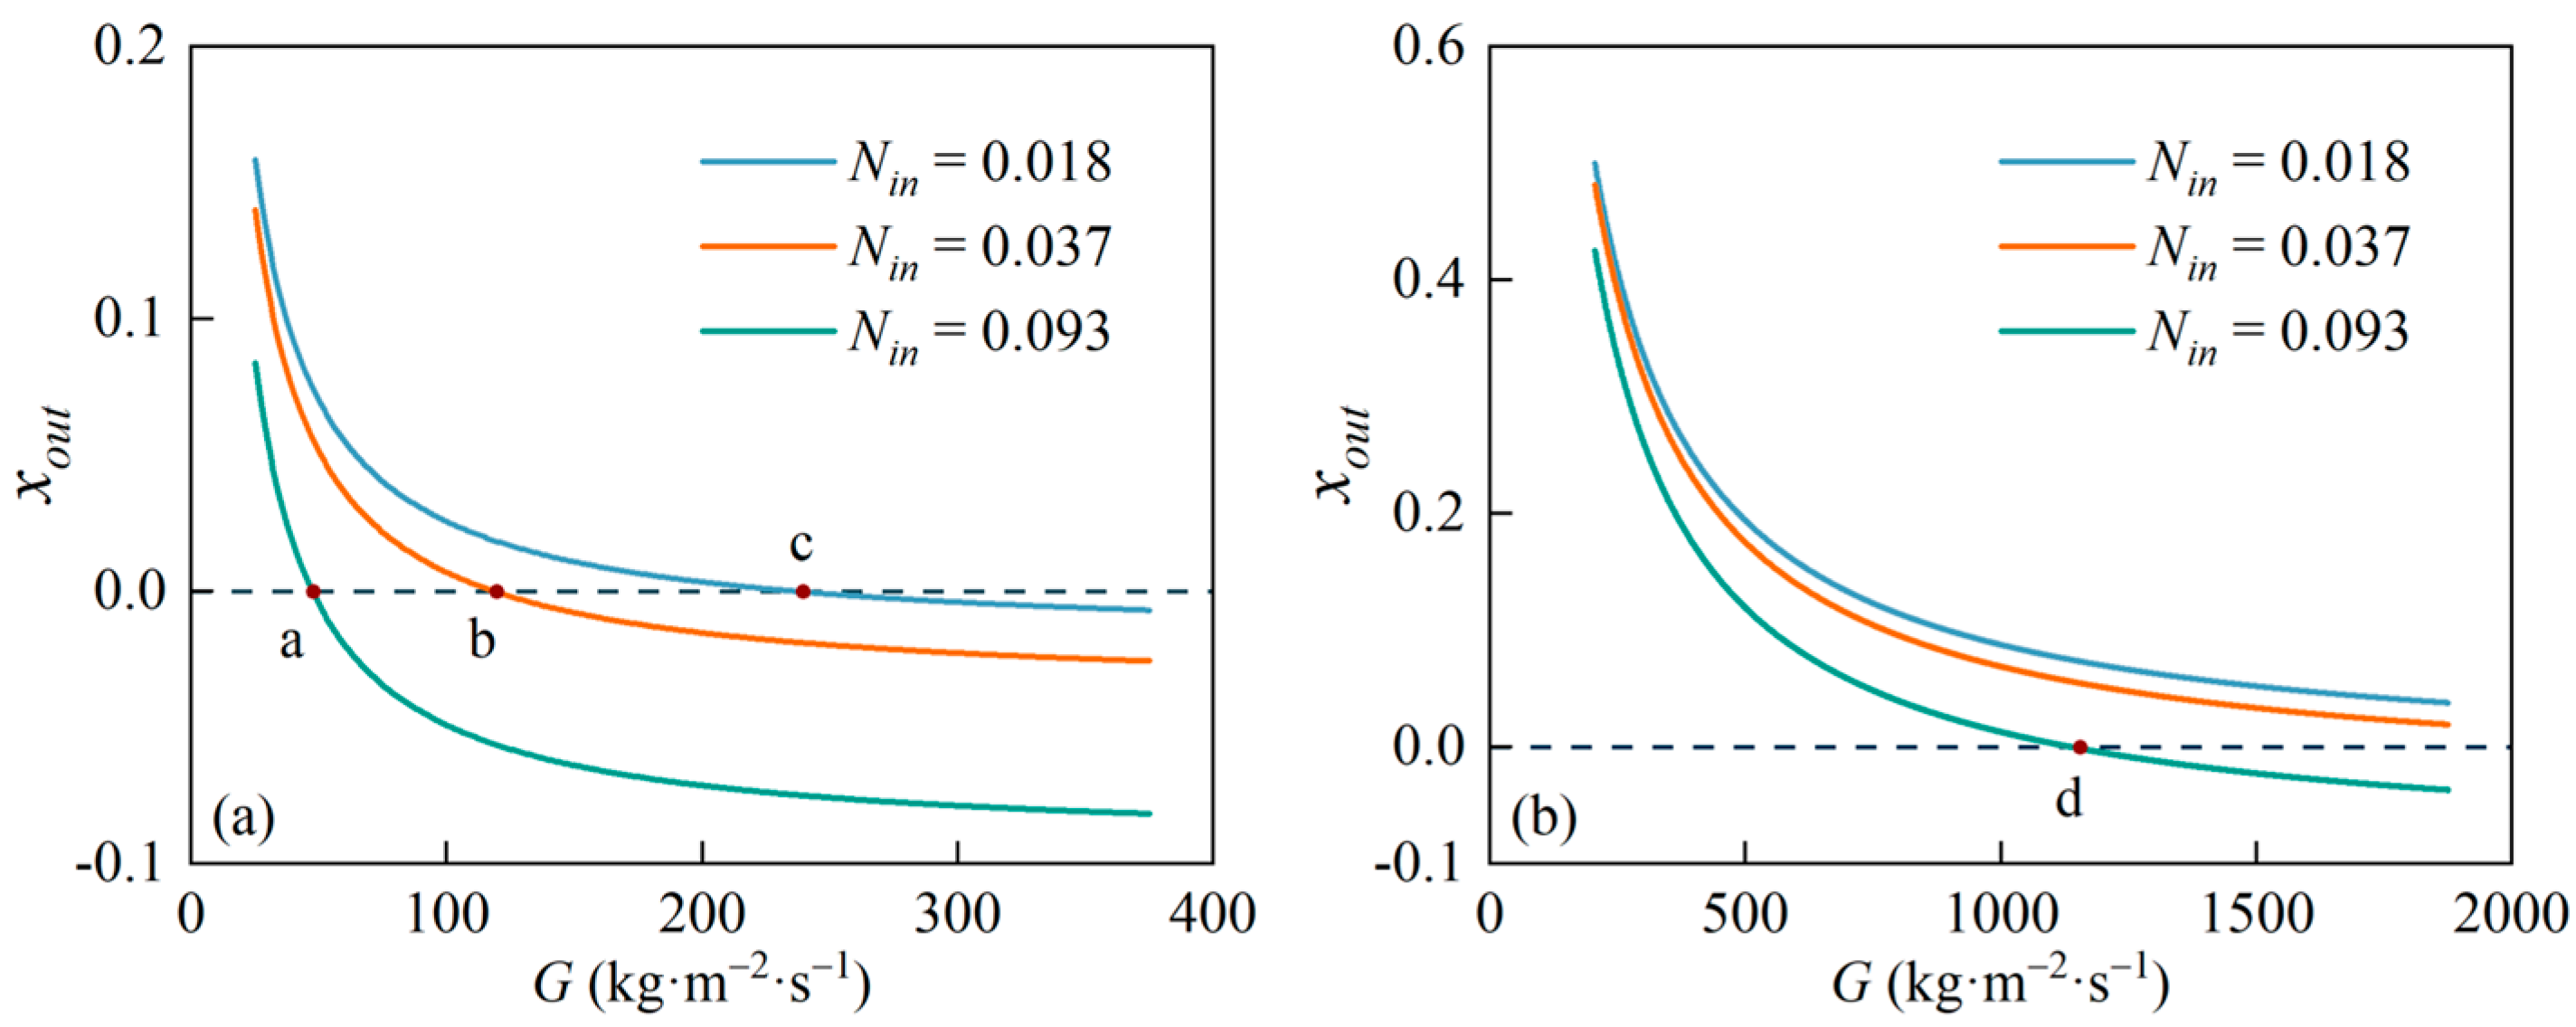
3.1. Impact of Entry Effects on Flow Instability and Maldistribution
3.2. Impact of Entry Effects on Hazardous Boundary and Critical Subcooling
4. Conclusions
Author Contributions
Funding
Data Availability Statement
Conflicts of Interest
Nomenclature
| A | cross-section area, m2 | Greek symbols | |
| C | empirical constant for fA | α | vapor volume fraction |
| cp | heat capacity, J/(kg·K) | β | channel aspect ratio |
| D | hydraulic diameter, m | ε | partial derivative |
| Fw | frictional pressure gradient | λ | eigenvalue |
| f | friction factor | ν | eigenvector |
| G | mass flux (W/A), kg/(m2·s) | ρ | density, kg/m3 |
| Hc | channel height, m | σ | vapor quality |
| h | specific enthalpy, J/kg | τw | wall shear stress, Pa |
| hfg | latent heat of vaporization, J/kg | ||
| K | additional dimensionless pressure drop | ||
| k | stability criterion | ||
| L | channel length, m | Subscript | |
| m | inertia coefficient | A | apparent |
| N | dimensionless number | apx | approximate |
| P | pressure head/drop, Pa | e | entrance region |
| P* | dimensionless pressure drop | f | liquid |
| PT | power input, W | g | vapor |
| p | pressure, Pa | i | channel number |
| Q | volume flow rate, ml/min | in | inlet |
| q’ | heat input per unit length, W/m | out | outlet |
| q | heat flux, W/m2 | p | pump |
| R | flow rate fraction | pch | phase change |
| Re | Reynolds number | sub | subcooling |
| S | slip ratio | tp | two-phase flow |
| T | temperature, K | ||
| t | time coordinate | ||
| u | velocity, m/s | ||
| v | specific volume, m3/kg | ||
| W | mass flow rate, mg/s | ||
| Wc | channel width, m | ||
| x | axial position, m | ||
| xout | thermodynamic quality | ||
| x* | channel length-to-diameter ratio | ||
| x+ | dimensionless hydrodynamic length | ||
References
- Yu, H.; Li, T.; Zeng, X.; He, T.; Mao, N. A Critical Review on Geometric Improvements for Heat Transfer Augmentation of Microchannels. Energies 2022, 15, 9474. [Google Scholar] [CrossRef]
- ElFaham, M.; Tang, C.C. A Comparative Analysis of Two-Phase Flow Boiling Heat Transfer Coefficient and Correlations for Hydrocarbons and Ethanol. Energies 2023, 16, 5931. [Google Scholar] [CrossRef]
- Jiang, Z.; Song, M.; Shen, J.; Zhang, L.; Zhang, X.; Lin, S. Experimental Investigation on the Flow Boiling of Two Microchannel Heat Sinks Connected in Parallel and Series for Cooling of Multiple Heat Sources. Micromachines 2023, 14, 1580. [Google Scholar] [CrossRef] [PubMed]
- O’Neill, L.E.; Mudawar, I. Review of two-phase flow instabilities in macro- and micro-channel systems. Int. J. Heat Mass Transf. 2020, 157, 119738. [Google Scholar] [CrossRef]
- Ledinegg, M. Instability of flow during natural and forced circulation. Die Wärme 1938, 61, 891–898. [Google Scholar]
- Kakac, S.; Bon, B. A Review of two-phase flow dynamic instabilities in tube boiling systems. Int. J. Heat Mass Transf. 2008, 51, 399–433. [Google Scholar] [CrossRef]
- Akagawa, K.; Kono, M.; Sakaguchi, T.; Nishimura, M. Study on Distribution of Flow Rates and Flow Stabilities in Parallel Long Evaporators. Bull. JSME 1971, 14, 837–848. [Google Scholar] [CrossRef]
- Manavela Chiapero, E.; Doder, D.; Fernandino, M.; Dorao, C.A. Experimental parametric study of the pressure drop characteristic curve in a horizontal boiling channel. Exp. Therm. Fluid Sci. 2014, 52, 318–327. [Google Scholar] [CrossRef]
- Oh, C.H.; Chapman, J.C. Two-phase flow instability for low-flow boiling in vertical uniformly heated thin rectangular channels. Nucl. Technol. 1996, 113, 327–337. [Google Scholar] [CrossRef]
- Aritomi, M.; Aoki, S.; Inoue, A. Instabilities in parallel channel of forced-convection boiling upflow system, (II) Experimental results. J. Nucl. Sci. Technol. 1977, 14, 88–96. [Google Scholar] [CrossRef]
- Guo, Y.; Xia, G.; Zeng, H.; Hu, M. Instability in Parallel Channel System. In Proceedings of the ASME 2010 3rd Joint US-European Fluids Engineering Summer Meeting Collocated with 8th International Conference on Nanochannels, Microchannels, and Minichannels, Montreal, QC, Canada, 1–5 August 2010; pp. 1945–1949. [Google Scholar]
- Zhang, T.; Tong, T.; Chang, J.-Y.; Peles, Y.; Prasher, R.; Jensen, M.K.; Wen, J.T.; Phelan, P. Ledinegg instability in microchannels. Int. J. Heat Mass Transf. 2009, 52, 5661–5674. [Google Scholar] [CrossRef]
- Thiagarajan, N. Experimental Investigation of Thermo-Hydraulic Characteristics of Two-Phase Flow of FC72 in Microchannel Heat Sinks. Master’s Thesis, Auburn University, Auburn, AL, USA, 2009. [Google Scholar]
- Ding, Y. Experimental Investigation of Two-Phase Flow Phenomena in Horizontal Convective In-Tube Boiling System. Ph.D. Thesis, University of Miami, Miami, FL, USA, 1994. [Google Scholar]
- Maulbetsch, J.S.; Griffith, P. A Study of System-Induced Instabilities in Forced-Convection Flows with Subcooled Boiling; Massachusetts Institute of Technology: Cambridge, MA, USA, 1965. [Google Scholar]
- Martinelli, R.C.; Nelson, D.B. Prediction of Pressure Drop During Forced-Circulation Boiling of Water. Trans. Am. Soc. Mech. Eng. 1948, 70, 695–702. [Google Scholar] [CrossRef]
- Lockhart, W.R. Proposed Correlation of Data for Isothermal Two-Phase, Two-Component Flow in Pipes. Chem. Eng. Prog. 1949, 45, 39–48. [Google Scholar]
- Mishima, K.; Hibiki, T. Some characteristics of air-water two-phase flow in small diameter vertical tubes. Int. J. Multiph. Flow 1996, 22, 703–712. [Google Scholar] [CrossRef]
- Muzychka, Y.S.; Awad, M.M. Asymptotic Generalizations of the Lockhart–Martinelli Method for Two Phase Flows. J. Fluids Eng. 2010, 132, 031302. [Google Scholar] [CrossRef]
- Mekheimer, K.S.; Shankar, B.M.; Ramadan, S.F.; Mallik, H.E.; Mohamed, M.S. On the Stability of Convection in a Non-Newtonian Vertical Fluid Layer in the Presence of Gold Nanoparticles: Drug Agent for Thermotherapy. Mathematics 2021, 9, 1302. [Google Scholar] [CrossRef]
- Mekheimer, K.S.; Shankar, B.M.; Abo-Elkhair, R.E. Effects of Hall current and permeability on the stability of peristaltic flow. SN Appl. Sci. 2019, 1, 1610. [Google Scholar] [CrossRef]
- Hasan, A.A.; Mekheimer, K.S.; Tantawy, B.E. Self-gravitating stability of resistive streaming triple superposed of fluids layers under the influence of oblique magnetic fields. Int. J. Appl. Electromagn. Mech. 2020, 63, 409–419. [Google Scholar] [CrossRef]
- Reich, S. On the local qualitative behavior of differential-algebraic equations. Circuits Syst. Signal Process. 1995, 14, 427–443. [Google Scholar] [CrossRef]
- Van Oevelen, T.; Weibel, J.A.; Garimella, S.V. Predicting two-phase flow distribution and stability in systems with many parallel heated channels. Int. J. Heat Mass Transf. 2017, 107, 557–571. [Google Scholar] [CrossRef]
- Rosa, P.; Karayiannis, T.G.; Collins, M.W. Single-phase heat transfer in microchannels: The importance of scaling effects. Appl. Therm. Eng. 2009, 29, 3447–3468. [Google Scholar] [CrossRef]
- Zivi, S.M. Estimation of Steady-State Steam Void-Fraction by Means of the Principle of Minimum Entropy Production. J. Heat Transf. 1964, 86, 247–251. [Google Scholar] [CrossRef]
- Acrivos, A.; Babcock, B.D.; Pigford, R.L. Flow distributions in manifolds. Chem. Eng. Sci. 1959, 10, 112–124. [Google Scholar] [CrossRef]
- Shah, R.K.; London, A.L. Chapter VII—Rectangular Ducts. In Laminar Flow Forced Convection in Ducts; Academic Press: New York, NY, USA, 1978; pp. 196–222. [Google Scholar]
- Shah, R.K. A Correlation for Laminar Hydrodynamic Entry Length Solutions for Circular and Noncircular Ducts. J. Fluids Eng. 1978, 100, 177–179. [Google Scholar] [CrossRef]
- Shapiro, A.H.; Siegel, R.; Kline, S.J. Friction factor in the laminar entry region of a smooth tube. J. Appl. Mech. Trans. ASME 1954, 21, 289. [Google Scholar]
- Bender, E. Druckverlust bei laminarer Strömung im Rohreinlauf. Chem. Ing. Tech. 1969, 41, 682–686. [Google Scholar] [CrossRef]
- Curr, R.M.; Sharma, D.; Tatchell, D.G. Numerical predictions of some three-dimensional boundary layers in ducts. Comput. Methods Appl. Mech. Eng. 1972, 1, 143–158. [Google Scholar] [CrossRef]
- Duan, Z.; Ma, H. Chapter Four—Pressure drop and heat transfer in the entrance region of microchannels. In Advances in Heat Transfer; Abraham, J.P., Gorman, J.M., Minkowycz, W.J., Eds.; Elsevier: Amsterdam, The Netherlands, 2020; Volume 52, pp. 249–333. [Google Scholar]
- Junemo, K.; Clement, K. Liquid flow in microchannels: Experimental observations and computational analyses of microfluidics effects. J. Micromech. Microeng. 2003, 13, 568. [Google Scholar] [CrossRef]
- Miglani, A.; Weibel, J.A.; Garimella, S.V. Measurement of flow maldistribution induced by the Ledinegg instability during boiling in thermally isolated parallel microchannels. Int. J. Multiph. Flow 2021, 139, 103644. [Google Scholar] [CrossRef]
- Mirmanto, M.; Kenning, D.; Lewis, J.; Karayiannis, T. Pressure drop and heat transfer characteristics for single-phase developing flow of water in rectangular microchannels. J. Phys. Conf. Ser. 2012, 395, 2085. [Google Scholar] [CrossRef]
- Chiapero, E.M.; Fernandino, M.; Dorao, C. Parametric study of the pressure characteristic curve in a boiling channel. Comput. Therm. Sci. 2011, 3, 157–168. [Google Scholar] [CrossRef]


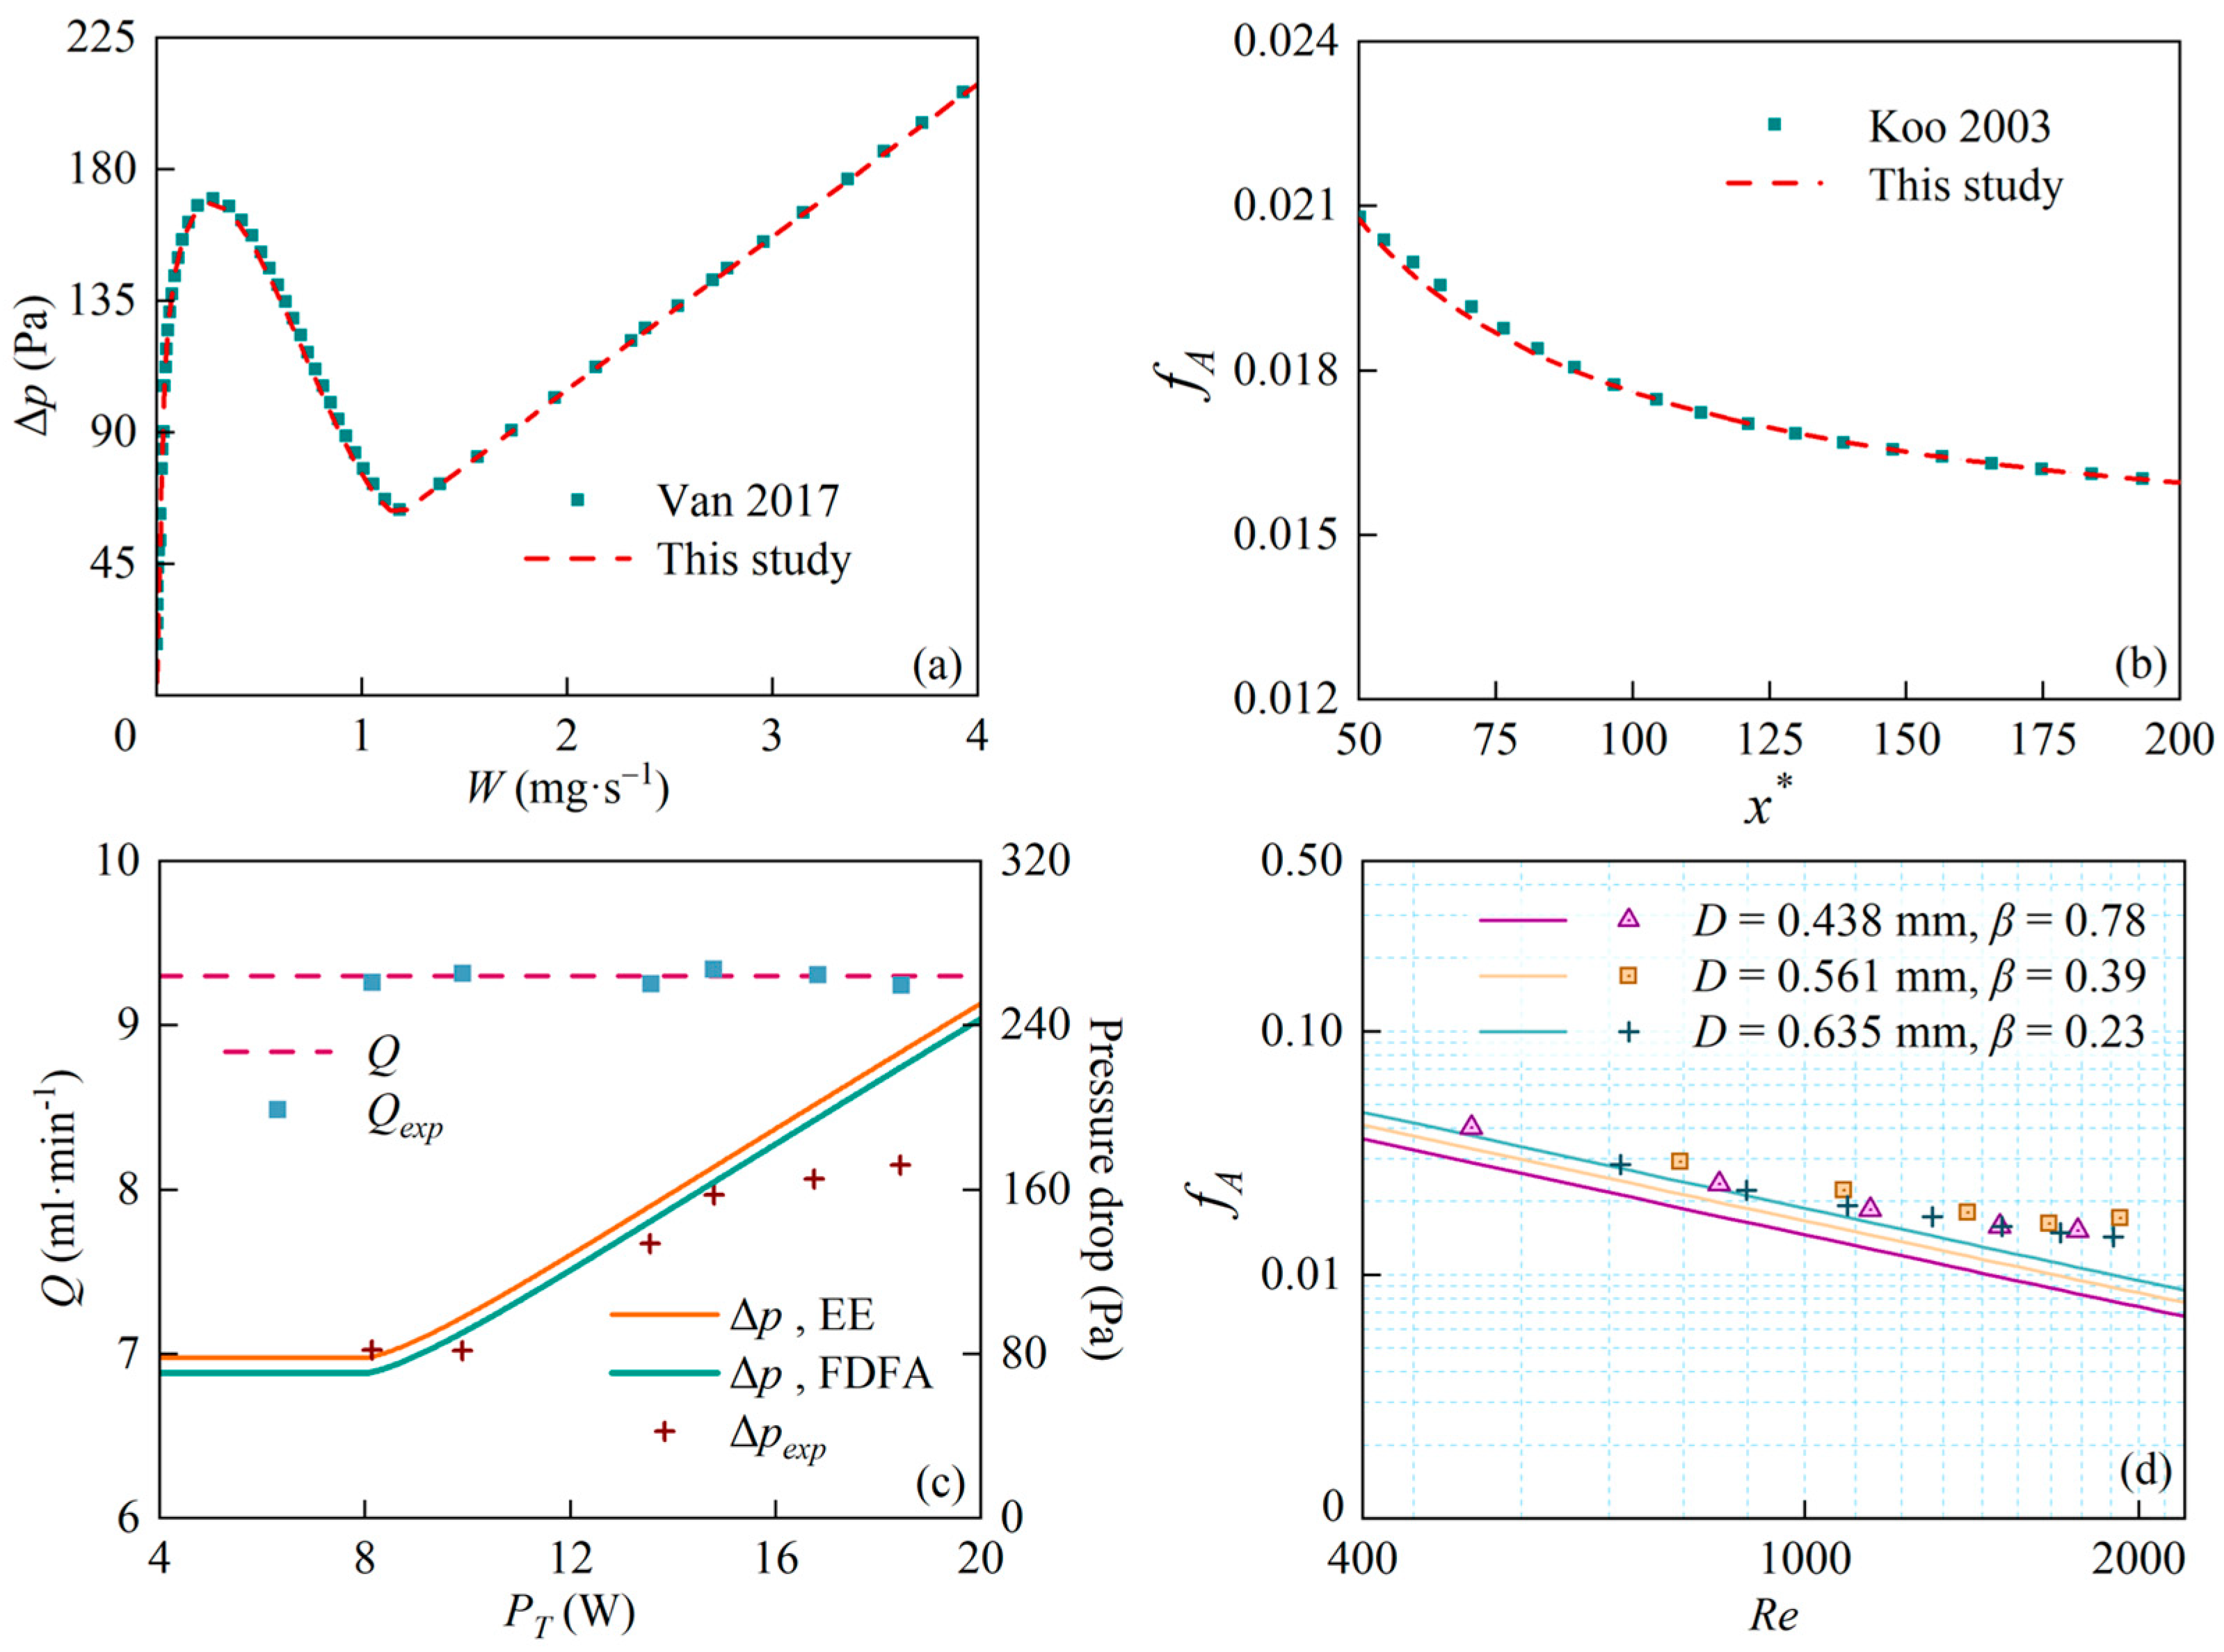
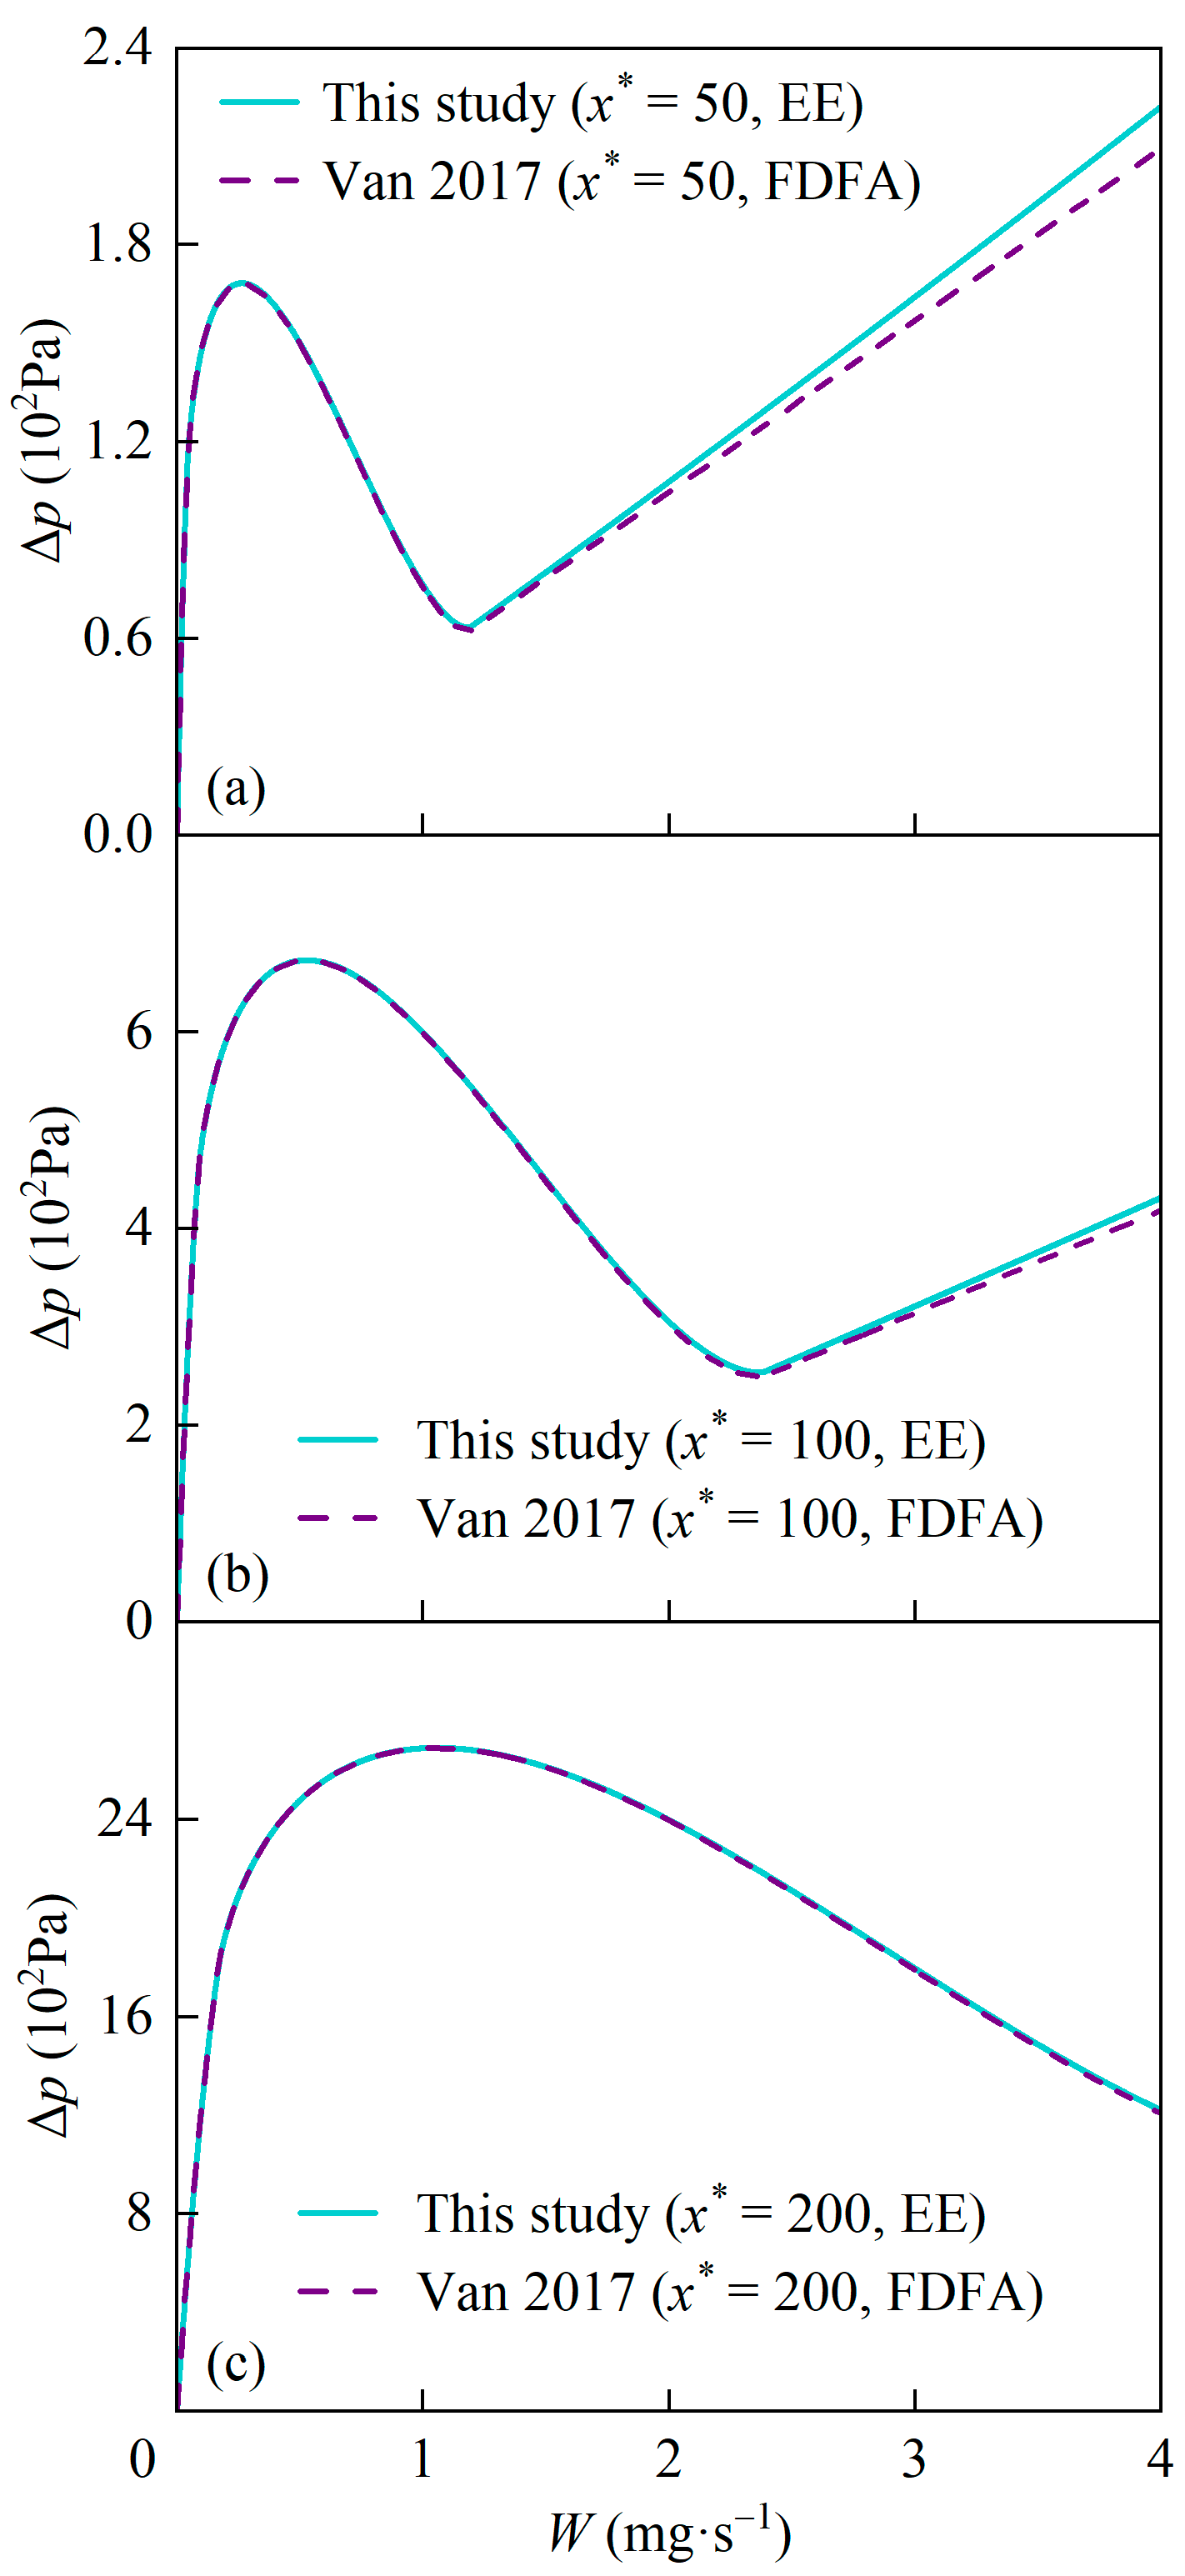
| Figure | Ref | Δp/fA | N 2/E 3 | Length | D/mm | β | Heat Load | Flow Rate | Tin/K |
|---|---|---|---|---|---|---|---|---|---|
| Figure 4a | Ref. [24] | Δp | N | L: 0.01 m | 0.2 | 1 | 5 W/cm2 | W: 0~4 mg/s | 353.15 |
| Figure 4b | Ref. [34] | fA | N | x*: 50~200 | / | 1 | / | Re: 1000 | / |
| Figure 4c | Ref. [35] 1 | Δp | E | L: 0.11 m | 1 | 1 | 4~20 W | Q: 9.3 mL/min | 361.65 |
| Figure 4d | Ref. [36] | fA | E | L: 0.062 m | 0.438 | 0.78 | / | Re: 400~2200 | / |
| 0.561 | 0.69 | ||||||||
| 0.635 | 0.23 | ||||||||
| Figure 5a | Ref. [24] | Δp | N | x*: 50 | 0.2 | 1 | 5 W/cm2 | W: 0~4 mg/s | 353.15 |
| Figure 5b | Ref. [24] | Δp | N | x*: 100 | 0.2 | 1 | 5 W/cm2 | W: 0~4 mg/s | 353.15 |
| Figure 5c | Ref. [24] | Δp | N | x*: 200 | 0.2 | 1 | 5 W/cm2 | W: 0~4 mg/s | 353.15 |
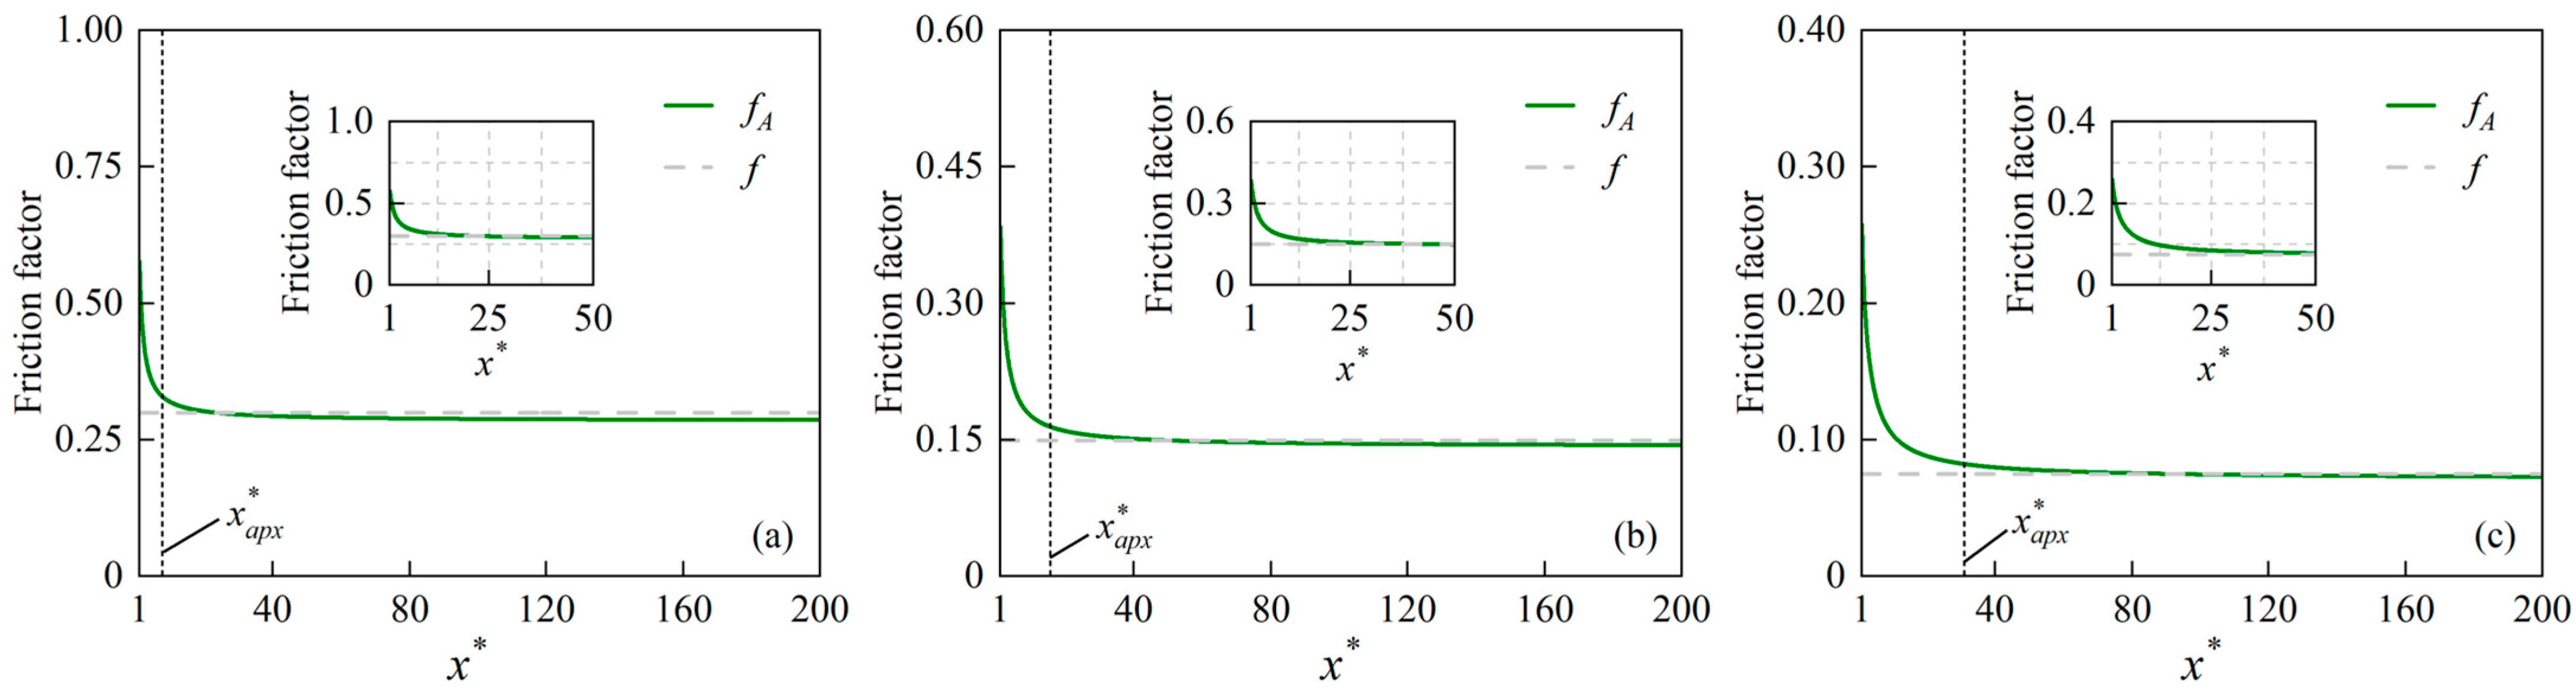
| Re | x*apx |
|---|---|
| 50 | 7.75 |
| 100 | 15.5 |
| 200 | 31 |
| Unstable Region (mg/s) | Reduction Proportion | Unstable Region (mg/s) | Reduction Proportion | ||
|---|---|---|---|---|---|
| q = 5 W/cm2 | EE 1 | 0.55~3.37 | 4.73% | 0.53~3.37 | 4.70% |
| FDFA 2 | 0.55~3.51 | 0.53~3.51 | |||
| q = 120 W/cm2 | EE | 14.06~62.46 | 47.52% | 13.09~62.46 | 46.75% |
| FDFA | 13.09~105.31 | 12.59~105.31 |
| q = 5 W·cm−2 | q = 120 W·cm−2 | |||
|---|---|---|---|---|
| EE 1 | FDFA 2 | EE | FDFA | |
| Critical Nin | 0.0044 | 0.0031 | 0.0121 | 0.0009 |
| Critical ΔTsub (K) | 2.5 | 1.8 | 6.6 | 0.6 |
| Expanding proportion | 38.89% | 1000% | ||
Disclaimer/Publisher’s Note: The statements, opinions and data contained in all publications are solely those of the individual author(s) and contributor(s) and not of MDPI and/or the editor(s). MDPI and/or the editor(s) disclaim responsibility for any injury to people or property resulting from any ideas, methods, instructions or products referred to in the content. |
© 2024 by the authors. Licensee MDPI, Basel, Switzerland. This article is an open access article distributed under the terms and conditions of the Creative Commons Attribution (CC BY) license (https://creativecommons.org/licenses/by/4.0/).
Share and Cite
Jiang, J.; Chen, C.; Huang, H.; Pan, Z. Weakening of Ledinegg Instability and Maldistribution of Boiling Flow in Parallel Microchannels by Entry Effects. Energies 2024, 17, 1901. https://doi.org/10.3390/en17081901
Jiang J, Chen C, Huang H, Pan Z. Weakening of Ledinegg Instability and Maldistribution of Boiling Flow in Parallel Microchannels by Entry Effects. Energies. 2024; 17(8):1901. https://doi.org/10.3390/en17081901
Chicago/Turabian StyleJiang, Jieyan, Changxu Chen, Haoxiang Huang, and Zhenhai Pan. 2024. "Weakening of Ledinegg Instability and Maldistribution of Boiling Flow in Parallel Microchannels by Entry Effects" Energies 17, no. 8: 1901. https://doi.org/10.3390/en17081901