Abstract
In the context of carbon neutrality and carbon peaking, in order to achieve low carbon emissions and promote the efficient utilization of wind energy, hydrogen energy as an important energy carrier is proposed to mix hydrogen and natural gas to form hydrogen-enriched compressed natural gas (HCNG). It is also injected into the natural gas pipeline network to achieve the transmission and utilization of hydrogen energy. At the same time, the participation of demand response is considered, the load’s peak and trough periods are adjusted, and the large-scale consumption of renewable energy and the reduction in carbon emissions are achieved. First of all, a fine model of hydrogen production and hydrogen use equipment is established to analyze the impact of adding hydrogen mixing on the economy and the low-carbon property of the system. With green certificates and demand response, the utilization rate of hydrogen energy is improved to further explore the energy utilization rate and emission reduction capacity of the system. Secondly, on the basis of modeling, the optimal scheduling strategy is proposed with the sum of energy purchase cost, equipment operation cost, carbon emission cost, wind curtailment cost, and green certificate income as the lowest objective function. Considering the constraints such as hydrogen blending ratio and flexible load ratio of the pipeline network, a low-carbon economic scheduling model of hydrogen mixed natural gas was established. The model was linearized and solved by using MATLAB 2021a and CPLEX solver. By comparing different scenarios, the superiority of the model and the effectiveness of the strategy are verified.
1. Introduction
Since the beginning of the industrial revolution, fossil fuels have been extensively developed and utilized, resulting in serious air pollution and an increase in climate warming. The energy industry ranks at the forefront of carbon emissions. As an indispensable form of energy for human beings, thermal power is the main source of electricity supply and produces a large amount of carbon dioxide [1]. In response to the call of the national “carbon peak, carbon neutral” goal, China has been actively promoting the low-carbon transformation of the energy system, promoting the development of renewable energy, and promoting the grid connection of new energy. With the continuous advancement of energy system reform and energy conservation and emission reduction requirements, the integrated energy system has become an effective way to achieve carbon emission reduction with its multi-energy flow complementary advantages [2]. With the large-scale grid connection of wind power, the problem of wind abandonment caused by its randomness and intermittency is also exposed. How to achieve a highly efficient wind power consumption along with a low-carbon economic operation has become a new hot issue.
Hydrogen energy is widely recognized as a clean energy source with significant development potential in the 21st century. As a crucial secondary energy to support the low-carbon transformation of the energy system, hydrogen energy possesses the advantage of zero carbon emissions and serves as an important catalyst for China’s energy system transition [3,4]. Hydrogen energy operates within an integrated energy system framework, representing a novel mode of utilizing renewable resources. Currently, extensive research is being conducted both domestically and internationally on integrating hydrogen energy into optimized scheduling models for integrated energy systems. Power-to-gas technology has gained widespread adoption due to its ability to absorb excess renewable electricity generation [5]. In references [6,7], power-to-gas technology was introduced into traditional electrical coupling systems, resulting in the construction of an optimized model aimed at minimizing overall economic costs. Reference [8] explored a combination of two-stage electric–gas conversion and hydrogen storage tank equipment while verifying the system’s capacity for consuming renewable energies and promoting low-carbon properties. Diverging from the conventional P2G technology, this approach utilizes hydrogen to produce methane after completing the electric hydrogen production stage. Reference [9] conducted a segmented study on the two-stage electric–gas conversion technology. After the electric hydrogen production stage, hydrogen energy is transported to the hydrogen fuel cell equipment to complete the coupling of hydrogen energy with electric energy and heat energy, to achieve the fine utilization of hydrogen energy. Reference [10] constructed an electric hot gas hydrogen integrated energy system and analyzed the feasibility of achieving the optimal scheduling of the system after adding hydrogen equipment for hydrogen production to the traditional integrated energy system. Reference [11] focused on the uncertainty of hydrogen demand to build a mobile hydrogen energy system, and deeply considered the impact of user-side hydrogen energy demand on the system but did not consider the uncertainty of renewable energy supply at the source side and paid little attention to the hydrogen energy supply.
The above literature basically only considers the feasibility of hydrogen energy integration into the traditional electric integrated energy system and the feasibility of electric hydrogen production technology to absorb new energy such as wind, but with the large-scale grid connection of new energy, cost has become the most important factor limiting the hydrogen production and hydrogen energy utilization of renewable energy. In 2019, hydrogen energy was written into the Government Work Report for the first time [12]. Therefore, it is necessary to fully combine demand response technology and green energy use policy, actively exert the coupling scheduling potential of hydrogen energy, and promote the low-carbon transformation of the integrated energy system under the context of ensuring high economic benefits. Because the basic equipment for hydrogen distribution is not perfect, hydrogen-enriched compressed natural gas (HCNG) came into being. After hydrogen is mixed with natural gas to form hydrogen-doped natural gas, it can be transmitted directly using natural gas pipelines currently in operation [13]. Reference [14] introduced gas hydrogen mixing technology into the integrated energy multi-microgrid and compared the economic benefits under different percentages of hydrogen incorporation but did not consider the impact of dynamic changes in the hydrogen mixing ratio on the system. Reference [15] combined the gas hydrogen blending technology and the carbon trading mechanism to analyze the impact of gas hydrogen blending technology on the low-carbon property of the system, but it did not fully utilize the potential of hydrogen energy scheduling and did not combine the load response ability. For new energy power generation and carbon emission reduction, China has introduced the green power certificate policy trading mode. Reference [16] introduced the joint trading mechanism of carbon trade green certificate market, which improved the proportion of green electricity in the system during the dispatch cycle and promoted the consumption of new energy power. Reference [17] optimizes the load matching degree through demand response to optimize equipment operating costs and carbon emissions.
To solve these problems, a comprehensive energy system model considering hydrogen blending and demand response is proposed. First, considering the production and utilization of hydrogen energy, the electrolytic hydrogen production equipment and hydrogen fuel cell were finely modeled, the electrohydrogen coupling model was constructed, and the promotion effect of green certificate income on hydrogen energy utilization was comprehensively considered. Secondly, considering the output of the gas unit and the electric–hydrogen coupling equipment, the demand response mechanism is introduced to optimize the output of the equipment, and a comprehensive energy system optimization method considering the demand response and hydrogen mixing of gas is proposed to establish the low-carbon economy optimization goal with the lowest comprehensive operating cost of the system. Finally, the influence of hydrogen energy utilization on system optimization is analyzed by setting different scenarios, and the economic issues of hydrogen energy utilization under green certificate and demand response policies are discussed. The innovations and main points of this paper are as follows:
- In order to achieve a large-scale grid connection of new energy, a comprehensive energy optimization dispatching system is built with gas hydrogen generation technology as the core, and the absorption capacity of renewable energy is improved.
- Under the premise of considering the economic benefits of the system, the optimization of the output of the system equipment is achieved in full combination with China’s energy policy.
- In the integrated energy system, the influence of the change in the hydrogen incorporation ratio on the equipment output and economy of the system is analyzed, and the economy of the system operation is further improved.
2. Materials and Methods
2.1. Considering the IES Structure Block Diagram Containing Hydrogen
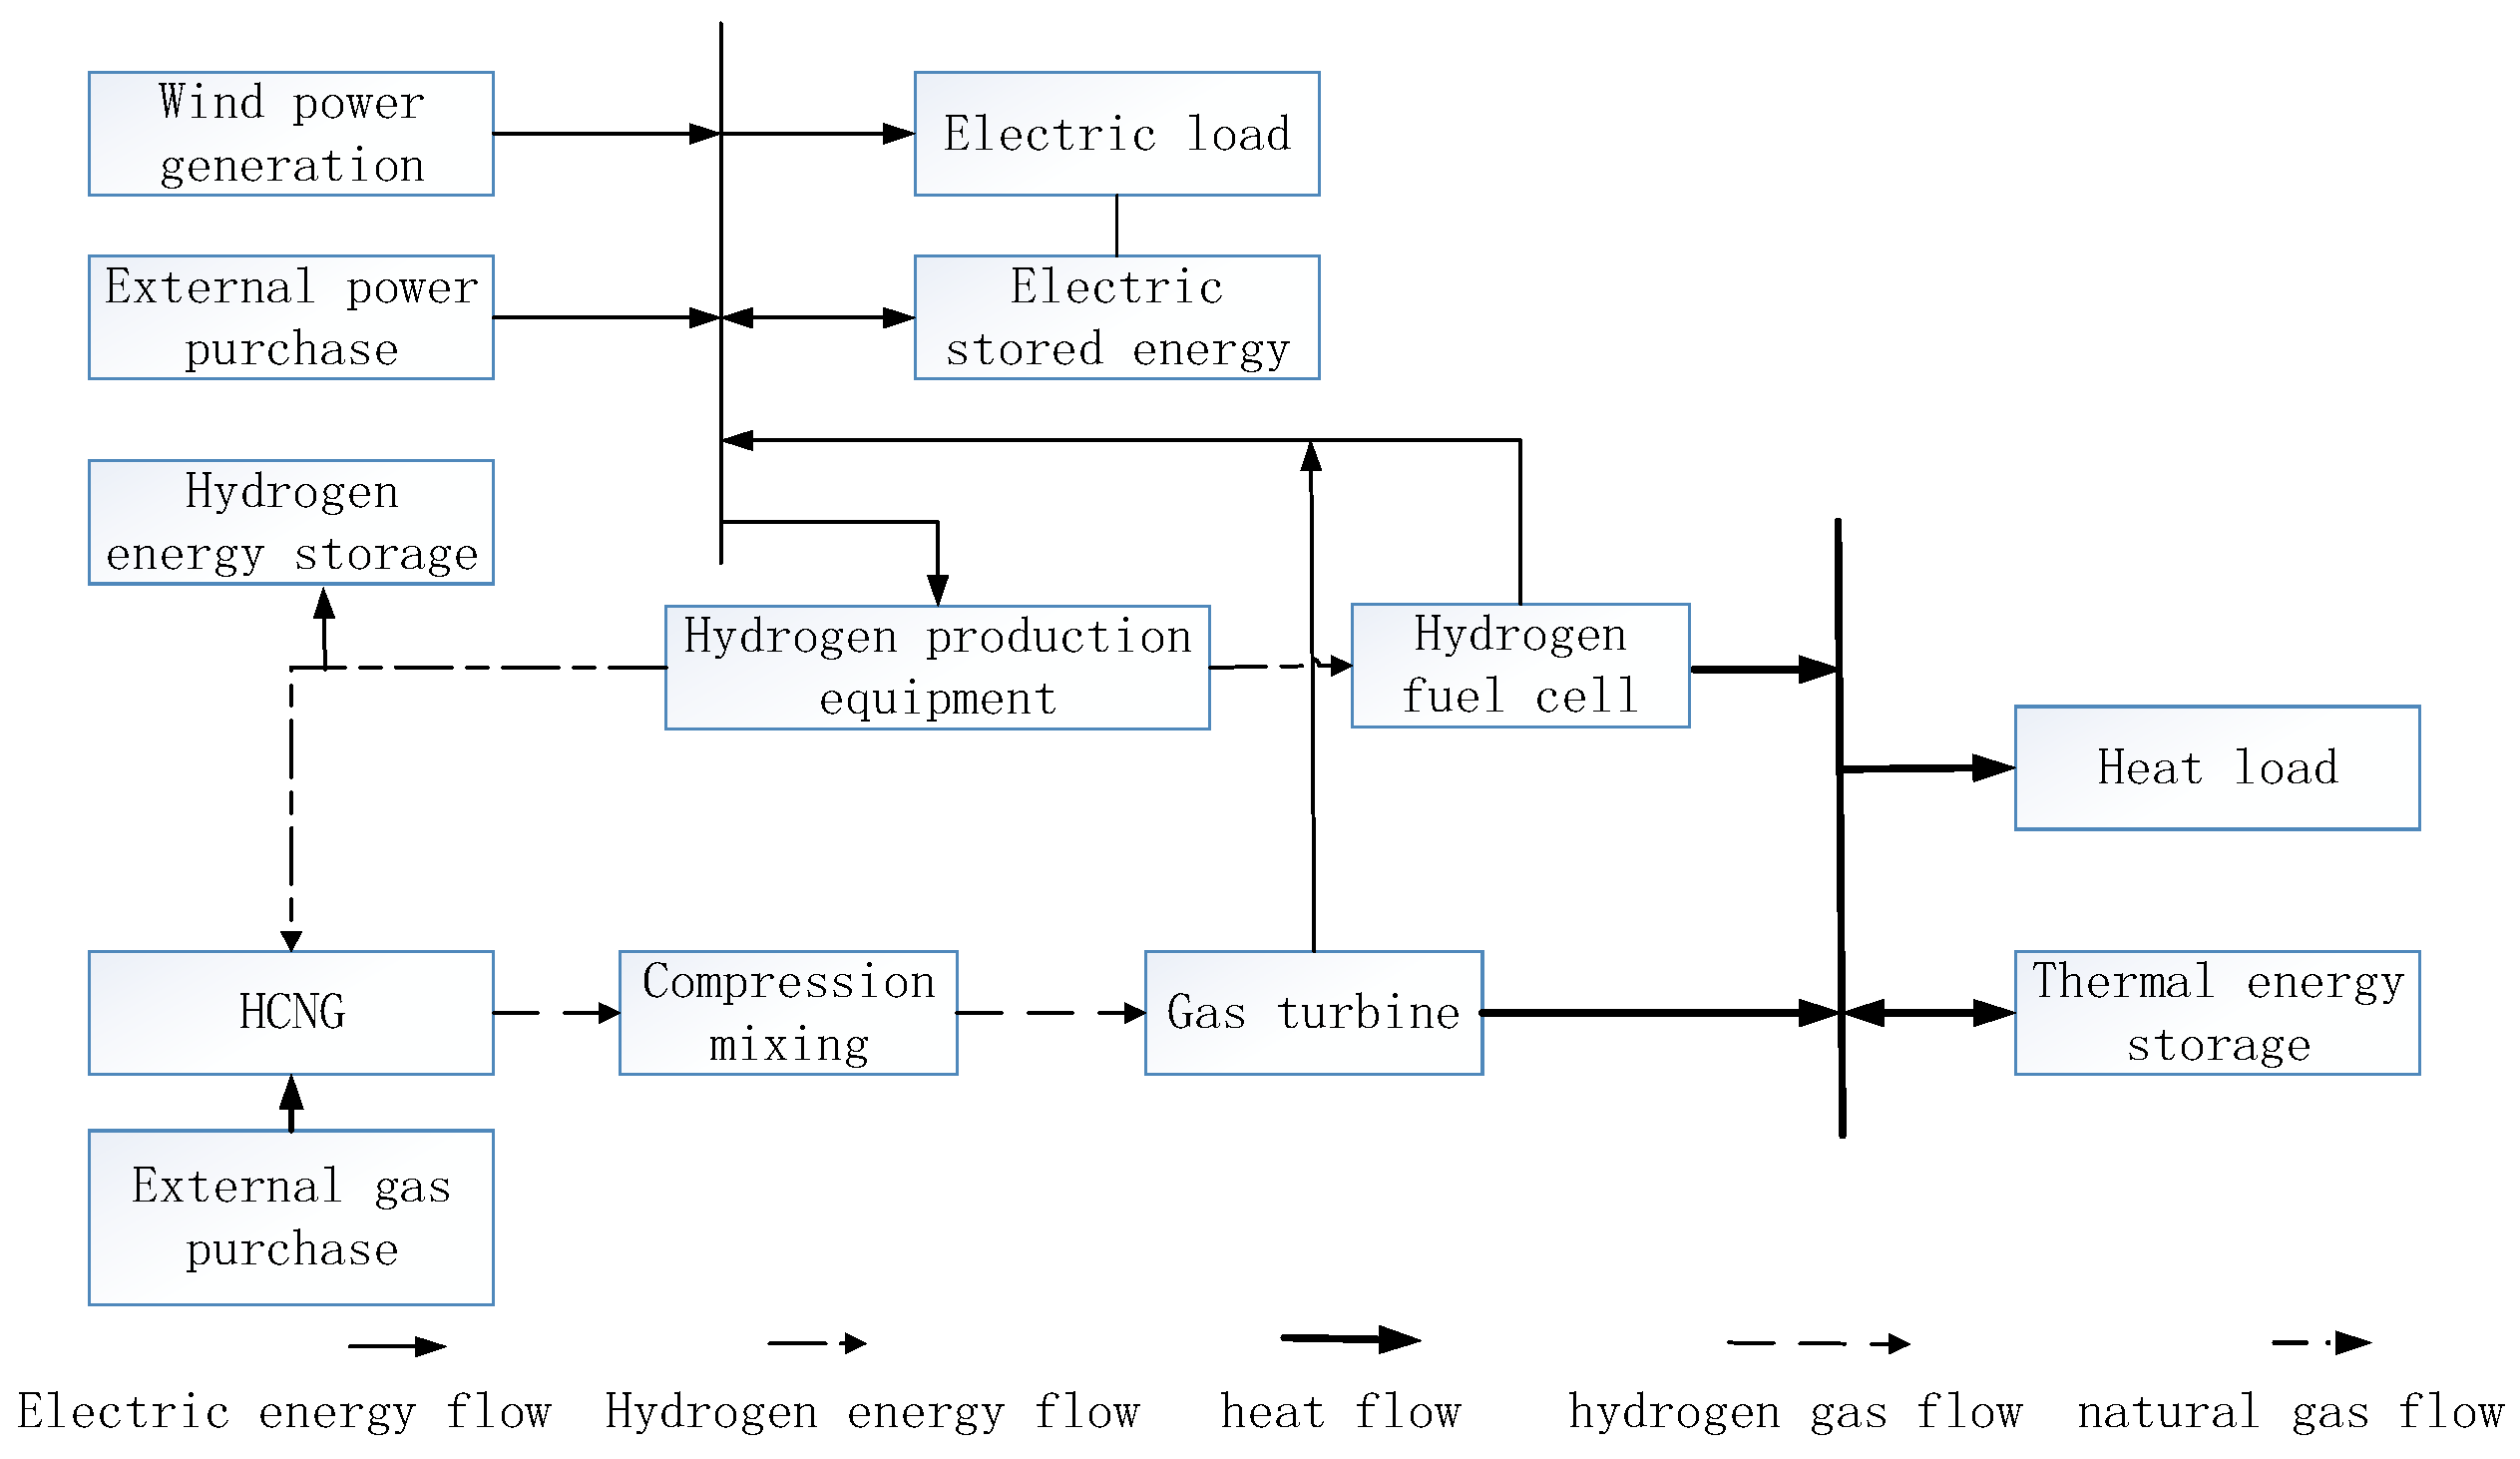
The hydrogen-doped natural gas integrated energy system studied in this paper is shown in Figure 1 below. The system is mainly powered by the power supply system and the gas supply system, in which the electricity is mainly considered for wind power generation and external electricity purchase. The electric–thermos–hydrogen coupling of the system is mainly completed by electrolytic hydrogen production equipment, hydrogen fuel cell, and gas turbine equipment. The natural gas purchased outside and the hydrogen produced by the electrolyzer are mixed and pressurized to form hydrogen-doped natural gas for the use of gas equipment, providing electric energy and heat energy for the park. The electrolyzer achieves the coupling between electric energy and hydrogen energy, the gas turbine achieves the coupling of hydrogen-doped natural gas with electric energy and heat energy, and the hydrogen fuel cell achieves the coupling of hydrogen energy with electric energy and heat energy.
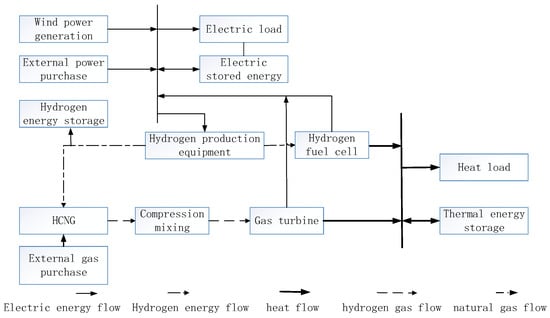
Figure 1.
Operational structure of the integrated energy system.
2.2. Mathematical Model of Hydrogen Energy Comprehensive Production and Utilization Unit
As a relatively pure and efficient new energy, hydrogen energy has a high utilization and development potential in many fields such as industry, transportation, and civil use. The comprehensive hydrogen energy production and utilization link mainly includes green hydrogen production link, hydrogen production electric heating link, gas network hydrogen mixing link and HCNG production electric heating link. In order to reflect the energy conversion characteristics and energy supply characteristics of each hydrogen energy utilization link, fine modeling is carried out for each link.
2.2.1. Green Hydrogen Production Link
The P2G technology is currently recognized as the simplest and most energy-saving power-to-gas technology, which is generally divided into two stages, namely, the electrolytic water reaction and the catalytic reaction of hydrogen to produce methane. However, due to the low overall conversion efficiency of the two-stage P2G, this paper only selects the P2H stage for hydrogen manufacturing to meet the energy requirements of gas turbines and hydrogen fuel cells. The basic principles are as follows:
The chemical formula of electrolytic water reaction is as follows:
The specific mathematical model is as follows:
where is the electrolytic hydrogen production power at time t, MW; is the amount of electric power consumed at time t, MW; is the conversion efficiency of the hydrogen production equipment by electrolytic water; and and are the upper limit and lower limit of power consumption of electric hydrogen production equipment, respectively, MW.
2.2.2. Hydrogen Heating Process
Since fuel cells can perform the function of energy coupling between hydrogen energy, electric energy, and heat energy, hydrogen fuel cells are selected in this paper to improve the collaboration between different forms of energy in the system. During the operation of a hydrogen fuel cell, hydrogen energy is converted into electricity and heat energy, and there is no carbon dioxide emission of conventional thermal power units, improving the low-carbon performance of system operation. Its operating model is as follows:
where is the hydrogen energy value supplied to the hydrogen fuel cell, MW; and are the electrical energy value and the thermal energy value output of the hydrogen fuel cell at time t, respectively, MW; and are the electricity generation efficiency and the heat generation efficiency of the hydrogen fuel cell, respectively; and are the upper and the lower limit of energy consumption of the hydrogen fuel cell, respectively, MW; and and are the upper and the lower limit of climbing slope of the hydrogen fuel cell, respectively, MW.
2.2.3. Hydrogen Mixing Link of Gas Network
The HCNG unit injected the hydrogen obtained from the electrolytic hydrogen production equipment into the natural gas pipeline and blended it with natural gas to form hydrogen-doped natural gas. Since there are two kinds of gases in the natural gas pipeline at the same time, in order to ensure the safety of system operation, it is necessary to limit the proportion of hydrogen in HCNG, based on common domestic and foreign projects. In the United Kingdom, the hydrogen blending ratio of natural gas pipeline network in the HYDEPLOY project reached 20% [18], and in the domestic test of Yinchuan Ningdong natural gas blending pipeline project in Ningxia, the hydrogen blending ratio of natural gas reached 24% [19]. In this paper, the upper limit of hydrogen mixing ratio is selected as 20%. The hydrogen mixing volume (Molar) ratio is set to Y, and then, the following equation is obtained:
In the formula, and are the molar masses of natural gas and hydrogen, respectively, kg/mol; and are the densities of natural gas and hydrogen, respectively, kg/m3; and are the power consumed by natural gas and hydrogen, respectively, kW; and are the calorific values of natural gas and hydrogen, respectively, kJ.
2.2.4. HCNG Heating Process
As a traditional cogeneration equipment, gas turbine plays a major role in energy supply in conventional integrated energy system. However, while it provides a large amount of energy, it also causes a great deal of pollution and carbon dioxide emissions.
In this paper, hydrogen-doped natural gas is injected into the gas turbine for electricity and heat production, which not only reduces the emission of pollutants, but also increases the energy supply value due to the high calorific value of hydrogen energy.
The mathematical model of the gas turbine is as follows:
where and are the electrical power and the thermal power output of the gas turbine at time t, respectively, MW; and are the volume values of natural gas and hydrogen consumed by the gas turbine at time t, respectively, m3; and are the upper and lower limits of the gas volume of the input gas turbine, respectively, m3; and are the upper and lower limits of the hydrogen volume of the input gas turbine, respectively, m3; and are the energy utilization rate and the waste heat recovery rate of the gas turbine, respectively; K is the heat production coefficient set at two; is the volume proportion of hydrogen at time t. and and and are the upper and lower climbing limits of electric energy and heat production of gas turbines, respectively, MW.
2.3. IES System Economic Optimization Model
2.3.1. Objective Function
The system optimizes the output of each device with the objective function of minimizing the cost of running the system. The objective function is to minimize the sum of the cost of purchased energy, the cost of equipment operation, the cost of carbon trading, the cost of wind abandonment, and the benefit of green certificates, and its specific mathematical model is shown in Equation (6):
In the formula, is the total cost, including five parts, i.e., energy purchase cost, equipment operation cost, wind abandonment penalty cost, green certificate income, and carbon emission cost, and the units are all in CNY.
The specific expressions for each part are as follows:
Energy purchase cost, :
where is the unit natural gas price, CNY/m3; is the power corresponding to the natural gas purchase at time t, m3; and is the electricity price at time t, CNY/kWh.
Equipment operating cost, :
where is the operating power of device i at time t, KW; and is the unit operating price of device I, kW/CNY;
Curtailment penalties cost, :
where is the penalty cost per unit of abandoned air volume, kW/CNY, and is the abandoned air volume at time t, kW.
Carbon emission cost, :
where is the carbon emissions generated by electricity consumption, t; is the carbon emissions generated by gas units, t; and is the carbon emission price, t/CNY.
Green certificate income, :
stands for the selling price of the green card, in CNY.
2.3.2. Construction of the System Operation Model
The system includes three energy flows of electrothermal hydrogen. In order to ensure the supply and demand balance between the system and the load, the power constraints of this part are as follows:
In the formula, and represent the electrical and thermal load demands of the system, respectively; , , and represent the charging energy of the electrical, thermal, and hydrogen energy storage systems, respectively; , , and represent the discharge energy of the electrical, thermal, and hydrogen energy storage systems, respectively; , , , and represent the power supply of wind power, gas turbine, power purchase, and hydrogen fuel cell, respectively; represents the power consumption of the electrolytic water device. and are the heat energy supplied by the gas turbine and the hydrogen fuel cell, respectively, is the hydrogen supplied by the water electrolytic device, and and are the hydrogen consumed by the gas turbine and the hydrogen fuel cell, respectively.
The output constraint of wind power fluctuates greatly under the influence of wind direction and weather, and its operation constraint conditions are as follows:
where is the value of wind power generation, is the actual wind power consumption, and is the actual curbed wind power.
For the system, in order to improve the flexible operation capacity of the system and promote the consumption of renewable energy, we should pay attention to the energy storage capacity of the system while considering the balance of energy supply and demand of the system, and the operation constraints of the energy storage equipment are as follows:
In the formula, and are the maximum and small storage capacities of the storage device, and are the charging and discharging states of the device, and are the maximum charging and discharging power of the system, and and are the beginning and end states of the storage device. The operation constraint settings of the heat storage equipment and the hydrogen storage equipment are similar to that of the electric storage equipment.
In order to ensure the reliability of energy supply of the system, while using renewable energy to generate electricity, the interaction between the system and the grid gas network should be considered. The constraints of system energy purchase are as follows:
and are the upper and lower limits of the interactive power between the system and the grid, and are the upper and lower limits of the interactive power between the system and the natural gas network, and and represent the system purchased electricity and the system purchased gas, respectively.
2.3.3. Solution of the Linearized Model
The model established in this paper is a mixed integer nonlinear model, so it needs to be linearized. The YALMIP toolkit in MATLAB is used for programming, and the CPLEX solver is invoked to solve the model.
3. Results
In this section, by setting different scenarios, the results of system operation are compared and analyzed from the perspective of economy and low carbon, and the utilization rate of renewable energy in the system is considered, reflecting the superiority of hydrogen energy addition to the system. See Appendix A for specific load parameters and equipment parameters.
3.1. Economic Analysis of System Operation
In order to reflect the superiority of hydrogen transportation in a natural gas network, three different operation scenarios are set up, and the carbon trading mechanism is unified by unit price.
- Scenario 1 is the traditional integrated energy system that does not consider the electrolytic equipment and hydrogen fuel cells;
- Scenario 2 is a comprehensive energy system that considers hydrogen energy utilization and considers a fixed value of hydrogen mixing ratio of 10%;
- Scenario 3 is an integrated energy system that considers the utilization of hydrogen energy, and the hydrogen mixing ratio of the pipeline network is considered to vary between 2 and 20%.
The load scheduling results in different scenarios are shown in Figure 2 and Figure 3, and the wind power consumption is shown in Figure 4.

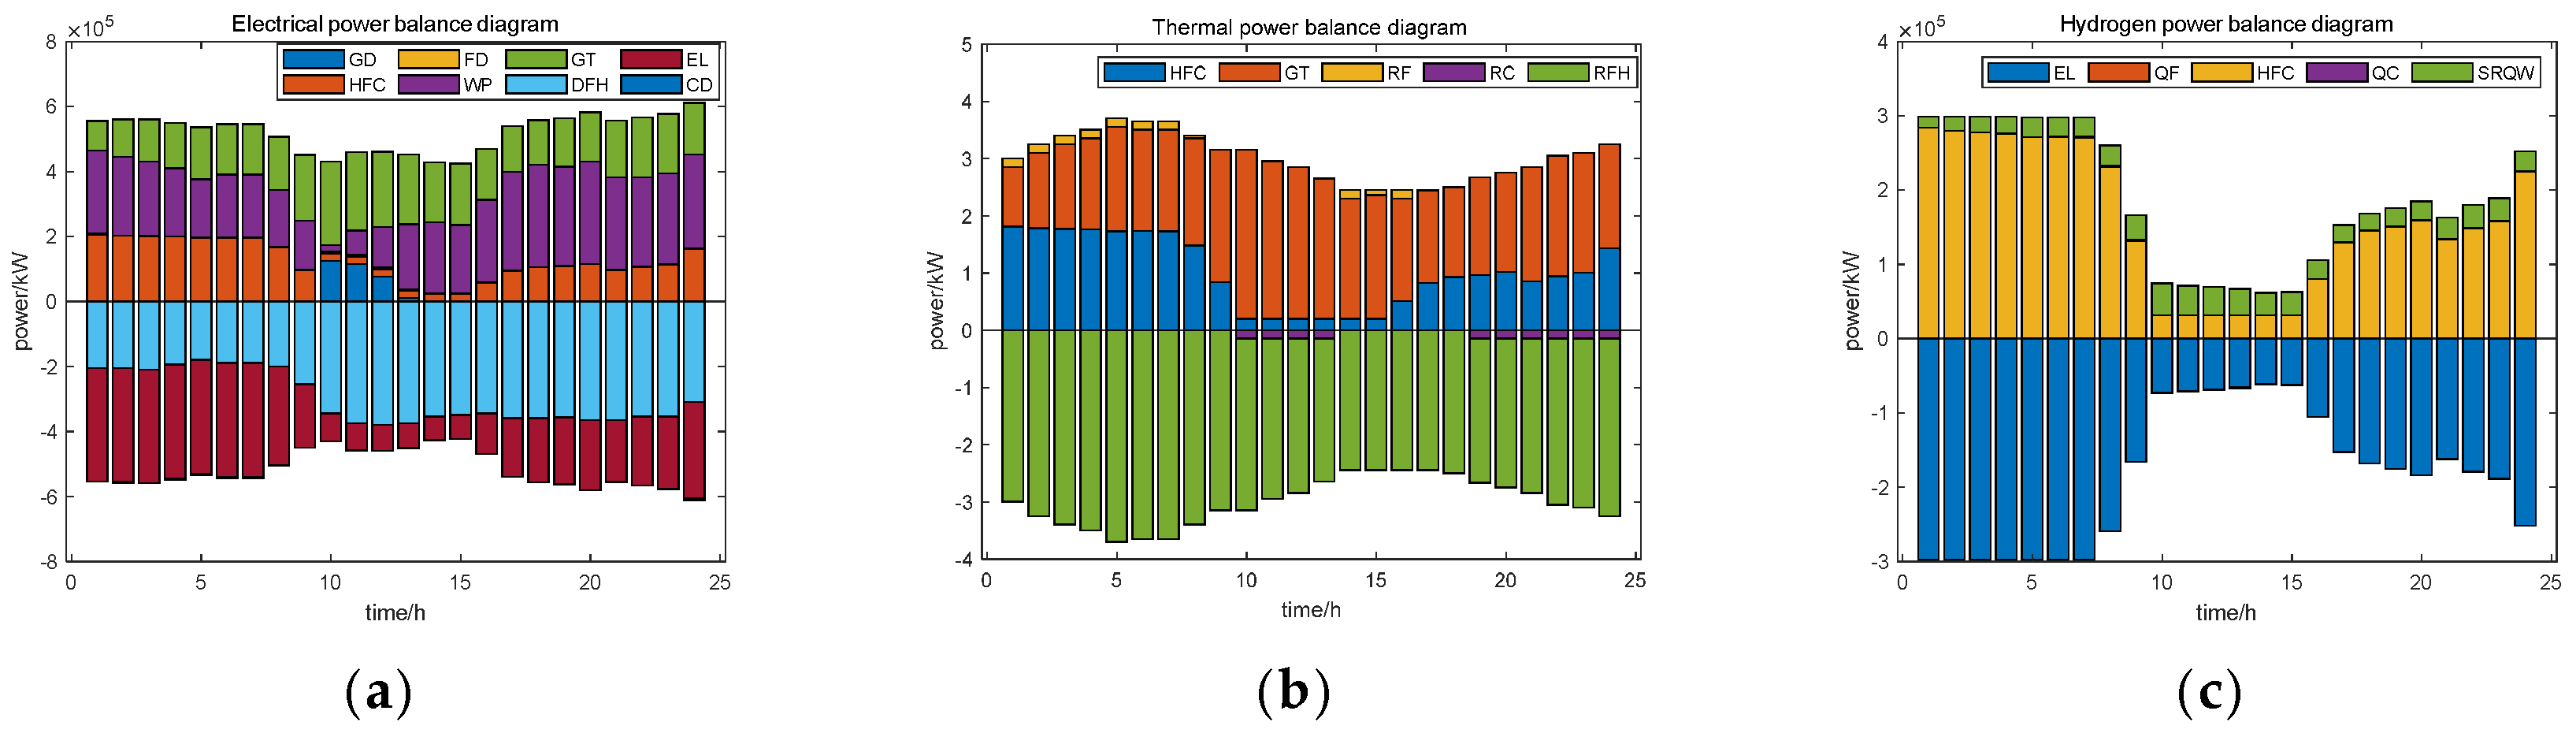
Figure 2.
Energy balance plot in Scenario 2: (a) electrical power balance in scenario 2, (b) thermal power balance in Scenario 2, and (c) hydrogen power balance in Scenario 2.
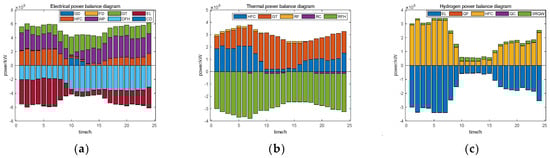
Figure 3.
Energy balance plot under Scenario 3: (a) electrical power balance in Scenario 3, (b) thermal power balance in Scenario 3, and (c) hydrogen power balance diagram in Scenario 3.

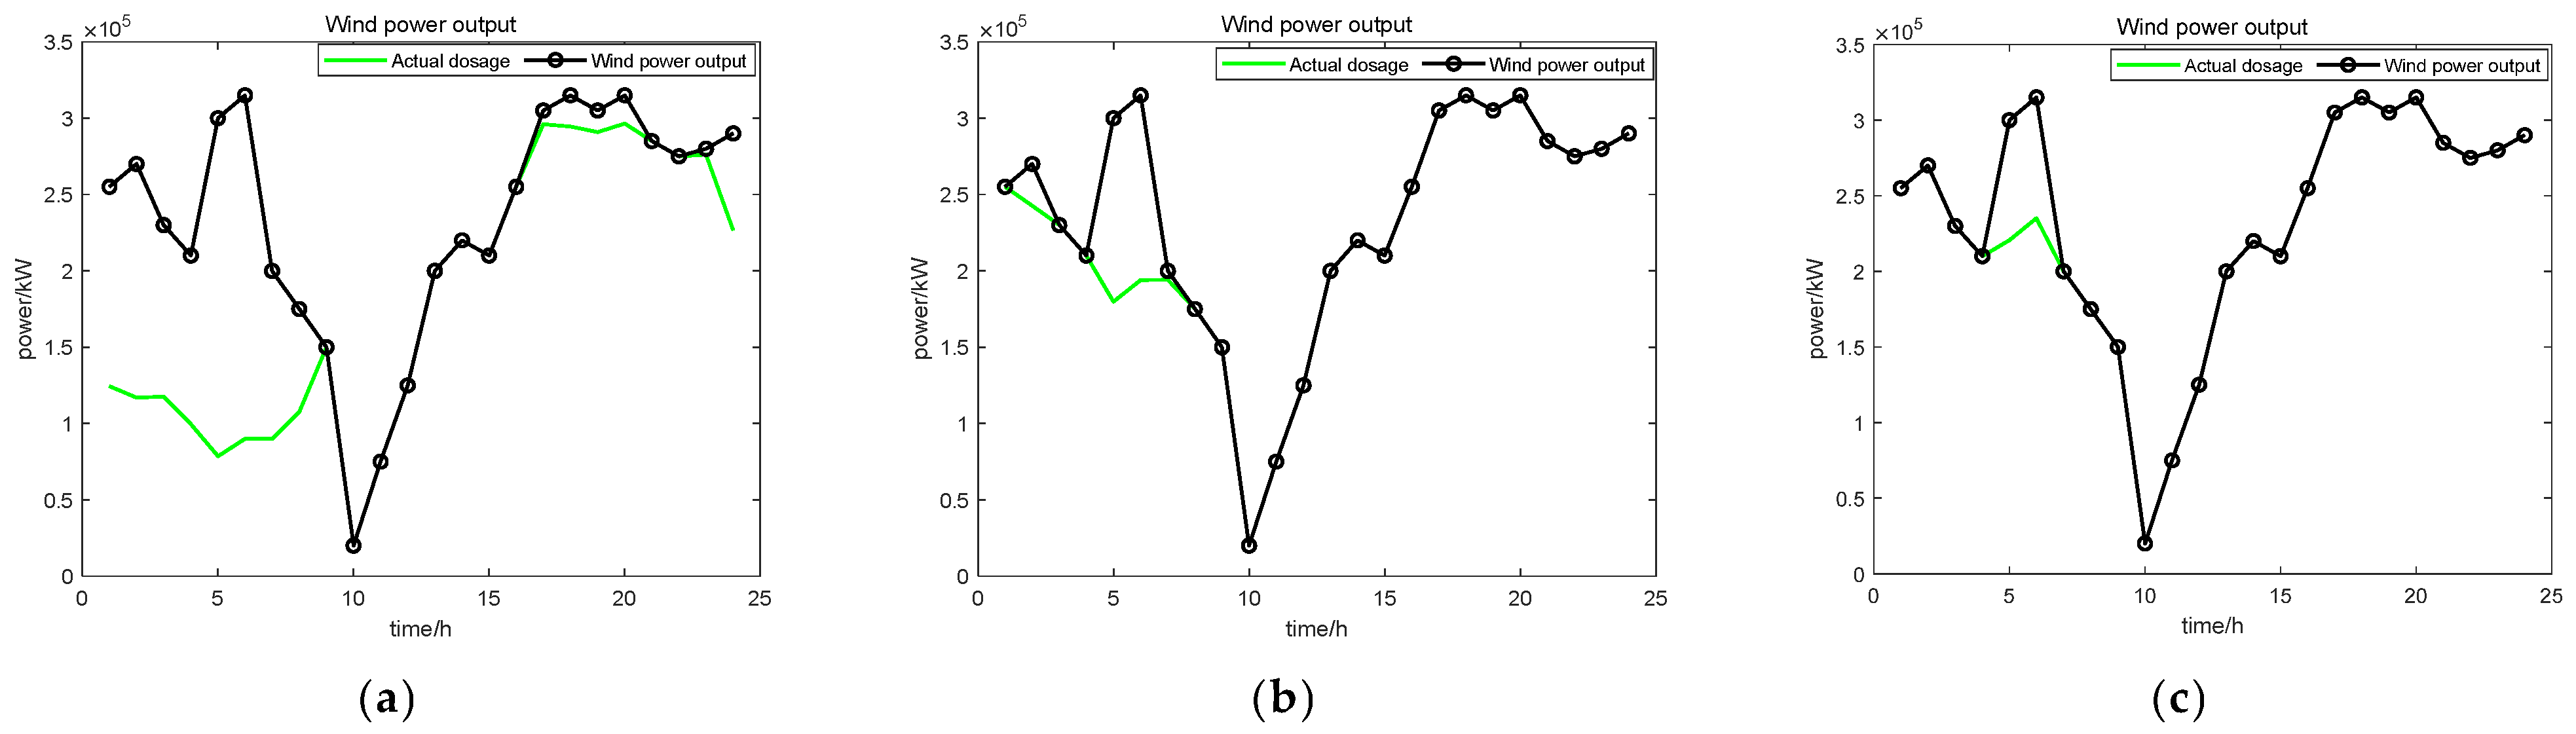
Figure 4.
Wind power output and energy consumption in different scenarios: (a) Scenario 1: electrical absorption of stroke; (b) Scenario 2: electrical absorption of stroke; and (c) Scenario 3: electrical absorption of stroke.
In Figure 2, the integrated Figure 2a–c can be obtained in the time period from 0:00 to 7:00 and the night time period from 20:00 to 24:00. Due to the high output of wind power and the low demand of electric load in this time period, the electrolytic cell has a higher output and absorbs the excess wind power. The low output of wind power and the high demand of electric load lead to the decrease in the electrolytic cell output. In the period when the electrolytic cell is at high capacity, the hydrogen output is high, resulting in a high HFC force in this period. As shown in Figure 3, Figure 4 and Figure 5, HFC provides the main energy equipment for the system in the early morning and at night, and the gas turbine output is low in this period. In the noon period (10:00~16:00), due to the lack of hydrogen supply in HFC, gas turbines are used as the main energy supply equipment to meet the system load demand.
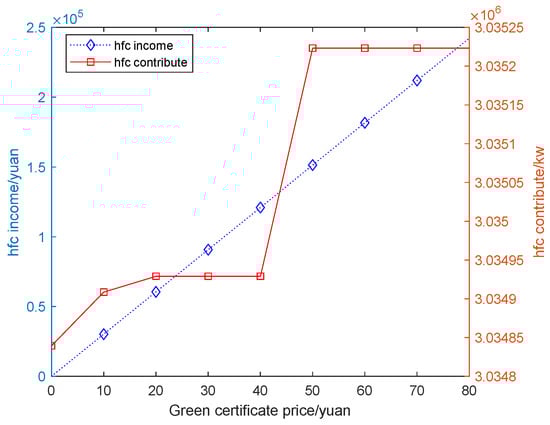
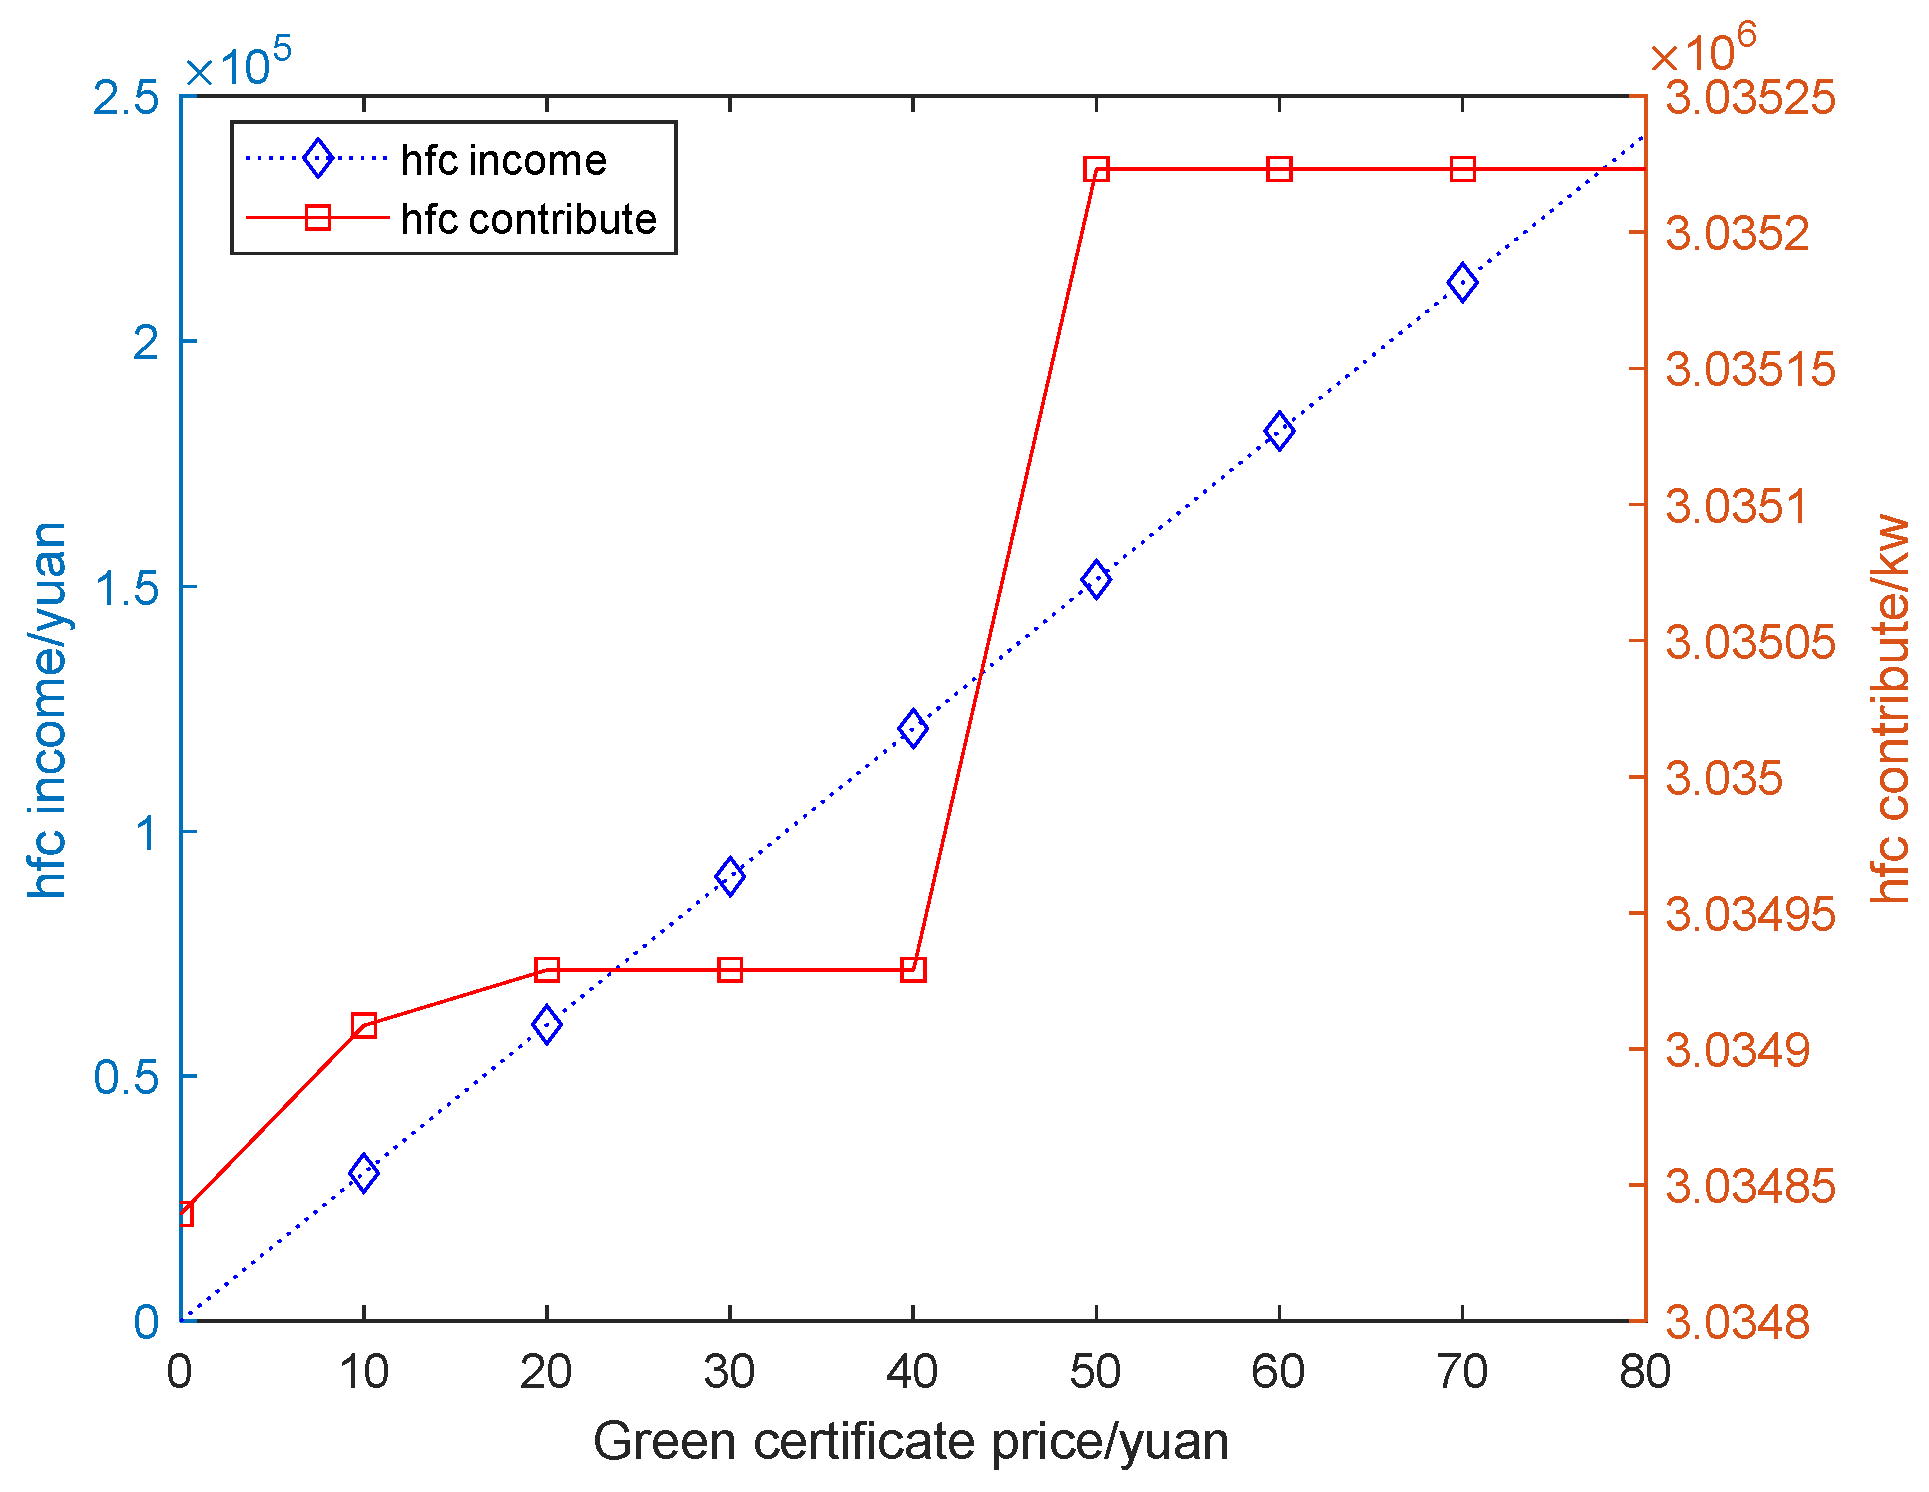
Figure 5.
HFC operation under different green certificate prices.
In Figure 3, it can be seen from Figure 3a–c that the maximum output value of EL increases in the morning because the proportion of hydrogen is not incorporated into the restricted gas network, and it is obvious that the hydrogen content of the output gas network decreases in the noon period when compared with Figure 2c. The output of HFC and GT in Figure 3a is more flexible. Power is better allocated according to the system load demand. From 8:00, the demand for electric heating load of the system changes with the output trend of wind power. Compared with Figure 2, the difference between the outputs of HFC and GT change more significantly, and more hydrogen is injected into GT to adjust the energy supply state of the equipment.
The system operating costs in different scenarios are shown in Table 1. Compared to Scenario 1, in Scenario 2 and Scenario 3, due to the addition of electrical–hydrogen coupling equipment in the system, the operating cost of system equipment is increased. However, compared to Scenario 1, due to the addition of hydrogen production and hydrogen use equipment, the utilization rate of wind power is increased by 17.68% and 19.73%, respectively, the wind power abandonment cost is reduced, and the unit output is increased. In Scenario 2, Scenario 3 considers the variation in the hydrogen blending ratio in hydrogen-doped natural gas, and the equipment operation cost is the highest among the three scenarios. However, due to the enhanced system flexibility and better unit output, the system wind abandonment penalty, carbon emission cost, and energy purchasing cost are all lower than in Scenario 2.

Table 1.
Parameter comparison of different scenarios.
3.1.1. Analysis of System Wind Absorption
The output of wind power under different scenarios is shown below in Figure 4. Since Scenario 1 only considers the supply load demand of wind power generation, there are few utilization ways of wind power, and there is a lack of wind curtailment and absorption equipment, and a large number of wind power curtailment phenomena occur as wind power output fluctuations. After considering the electric hydrogen production equipment, the system’s electricity utilization path increases, and the wind power consumption capacity of Scenario 2 and Scenario 3 is significantly improved. In Scenario 2, the wind power utilization rate is increased by 17.68%. In the high wind power output period from 0:00 to 7:00, due to the fixed hydrogen mixing ratio of the system, the output of the electric hydrogen production equipment is limited. There is still an obvious wind abandonment phenomenon at 2:00 and 5:00, and the wind power utilization rate is insufficient compared to Scenario 3. In Scenario 3, due to the relatively flexible hydrogen mixing ratio, the hydrogen energy demand of hydrogen equipment further promotes the system to absorb wind power and produce hydrogen energy during the high-power period of wind power from 0:00 to 6:00; thus, the wind power utilization rate is improved compared to Scenario 2.
3.1.2. Analysis of System Carbon Emission
Compared with Scenario 1, the system carbon emission cost of Scenario 2 and Scenario 3 are decreased by CNY 28,100 and CNY 122,400, respectively. In Scenario 2, the total carbon emissions generated by the operation and purchase of all equipment in the system are 2,823,070.90 tons, while in Scenario 3, the total carbon emissions of the system are only 2,635,986.97 tons. In Scenario 2 and Scenario 3, hydrogen energy utilization equipment is added. Due to the cleanliness of hydrogen energy, carbon emission is not considered in the operation process of hydrogen equipment, thus reducing the carbon emission of the system. Moreover, the coupling of hydrogen electricity and hydrogen heat achieved by hydrogen fuel cells reduces the output of the gas unit in the system, reduces the carbon emission of the gas unit, and reduces the power purchase and gas purchase of the system as well as reduces the carbon emissions produced by the purchase and achieves the low carbon scheduling of the system. Due to the variability in the hydrogen mixing ratio in Scenario 3, the output of the hydrogen production equipment in Figure 3c during the period from 10:00 to 13:00 is lower than that in Figure 2c. However, considering the whole day, the output of the hydrogen equipment in Scenario 3 is higher than that in Scenario 2; thus, the overall low-carbon performance is better than that in Scenario 2.
In summary, compared to the traditional power-to-gas integrated energy system, it has a more far-reaching significance in improving the absorption capacity of wind energy, promoting the development of hydrogen energy, and completing the transformation of the system toward the low-carbon direction.
3.2. Analysis of the Influence of Green Certificate Price on the Output of Hydrogen Equipment
The technical cost of hydrogen energy in transportation, storage, and other aspects is higher than that of other energy sources, but with the development of skills, the reduction in hydrogen energy utilization cost, the improvement in operation efficiency, and the support of national policies, the economy of hydrogen energy is constantly improving.
Referring to the price fluctuation range of each green certificate in recent years, the price of the unit green certificate is in the range of CNY 0–80. Green certificate income and output of hydrogen fuel cells under different green certificate prices are considered, and their variations are shown in Figure 5.
In this paper, gas turbine and hydrogen fuel cell are used as energy supply equipment. However, due to the relatively higher cost of hydrogen fuel cell, the HFC cannot work at full capacity when the price of green certificate is low because of the poor economic efficiency of hydrogen fuel cell. However, with the increase in green certificate price, the green certificate income obtained by hydrogen fuel cell output increases, and the output state of hydrogen fuel cell is also slowly improving.
3.3. Analysis of the Influence of Hydrogen Mixing Ratio on the System
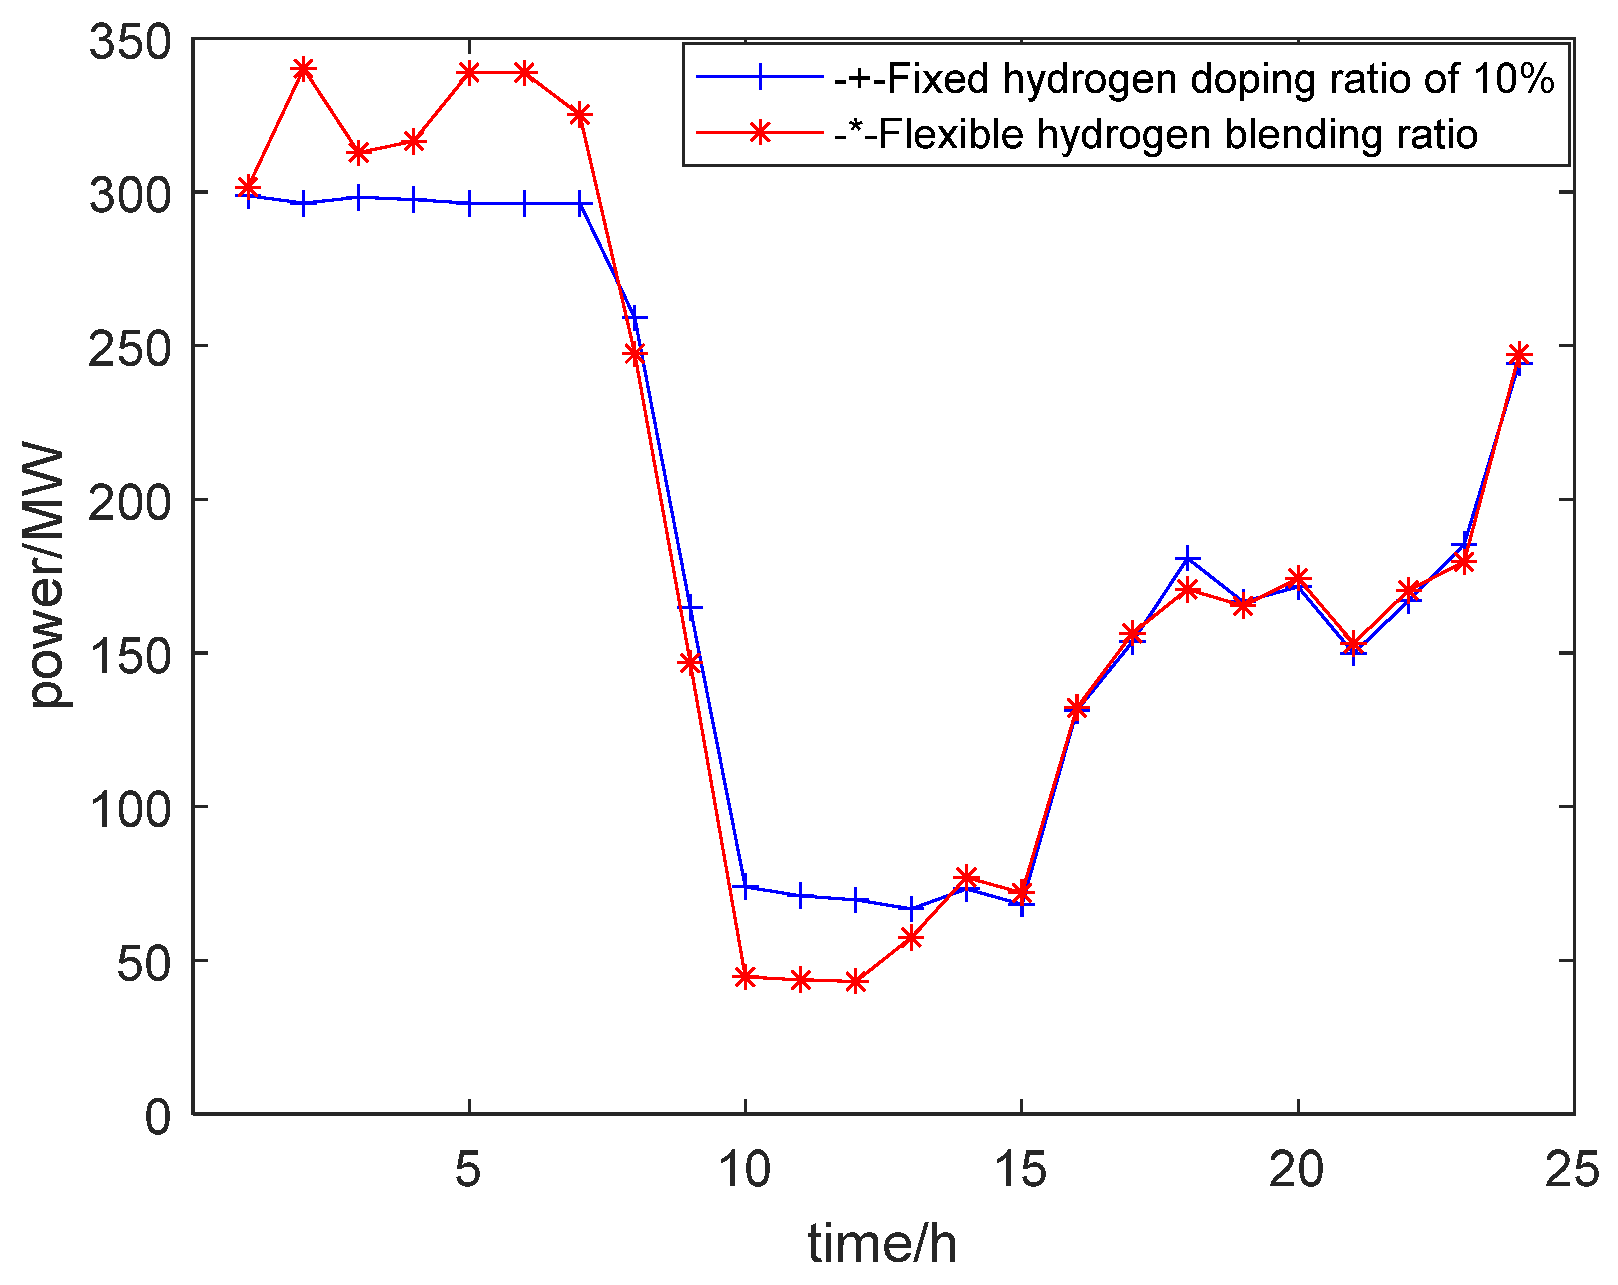
In this paper, after the use of abandoned wind for hydrogen production and storage, two modes of hydrogen use, i.e., the hydrogen fuel cell and hydrogen mixed with gas, are considered. Due to the cleanliness of hydrogen energy and the absence of carbon emissions, the carbon emissions during the working process of the hydrogen fuel cell are 0 MW. As can be seen from Figure 6, the output of the hydrogen fuel cell reaches 3035.25 MW, and hydrogen energy utilization is an effective way to absorb wind power.
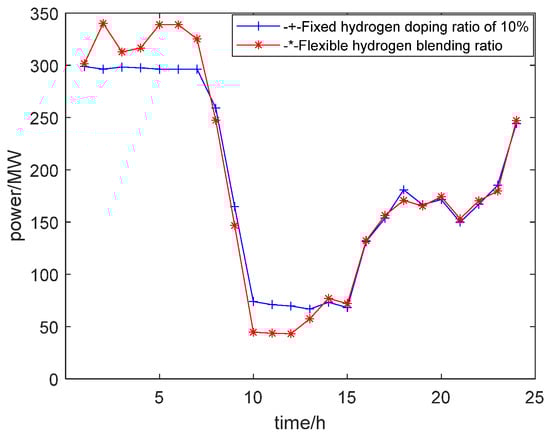
Figure 6.
Hydrogen energy consumption under different hydrogen blending scenarios.
In Scenario 2 and Scenario 3, due to the different restrictions on the proportion of hydrogen in the hydrogen mixed natural gas, device output flexibility varies in different scenarios. Under the scenario of a fixed hydrogen blending ratio, the proportion of hydrogen consumed by gas turbines remains unchanged at 10%, which is not affected by energy price and wind power output and lacks flexibility. However, in the scenario of a variable hydrogen mixing ratio, when the electricity price or electricity load demand is high, the system reduces the hydrogen mixing amount of the hydrogen mixing device and reduces the output of the electric hydrogen production equipment, to reduce the consumption of electric energy. As can be seen from Figure 2a and Figure 3a, in the night period, wind power is used more for electrolytic hydrogen production due to the high output of wind power and the low demand for electric load at this time. In Scenario 2, electrolytic hydrogen production equipment consumes 5269 MW of wind power, and in Scenario 3, it consumes 5382 MW. The hydrogen reserve is abundant; thus, in Scenario 3, the hydrogen mixing ratio of the system’s hydrogen mixed natural gas is higher than that in Scenario 2 from 0:00 to 6:00. During the period from 10:00 to 13:00, due to a low wind power output and a high electricity price, the system reduces the amount of hydrogen incorporation in the gas turbine under the scenario of a variable hydrogen blending ratio; while under the scenario of a fixed hydrogen blending ratio, due to the system’s restriction on the amount of hydrogen in the hydrogen mixing natural gas, the system still needs to force hydrogen production to meet the requirements of hydrogen consumption. In this period, the turbine hydrogen energy consumption in Scenario 3 is 39.69%, which is lower than that in Scenario 2. Compared to Table 1, it can be seen that under the scenario of reasonable control of the hydrogen blending ratio of the gas unit, the system has better emission reduction and economy.
3.4. Analysis of User Energy Optimization Scheduling Results
In order to analyze the demand response of user units of the model proposed in this paper, two scenarios are set for analysis and comparison:
- Scenario 4, the user unit does not consider demand response;
- Scenario 5, the user unit considers demand response.
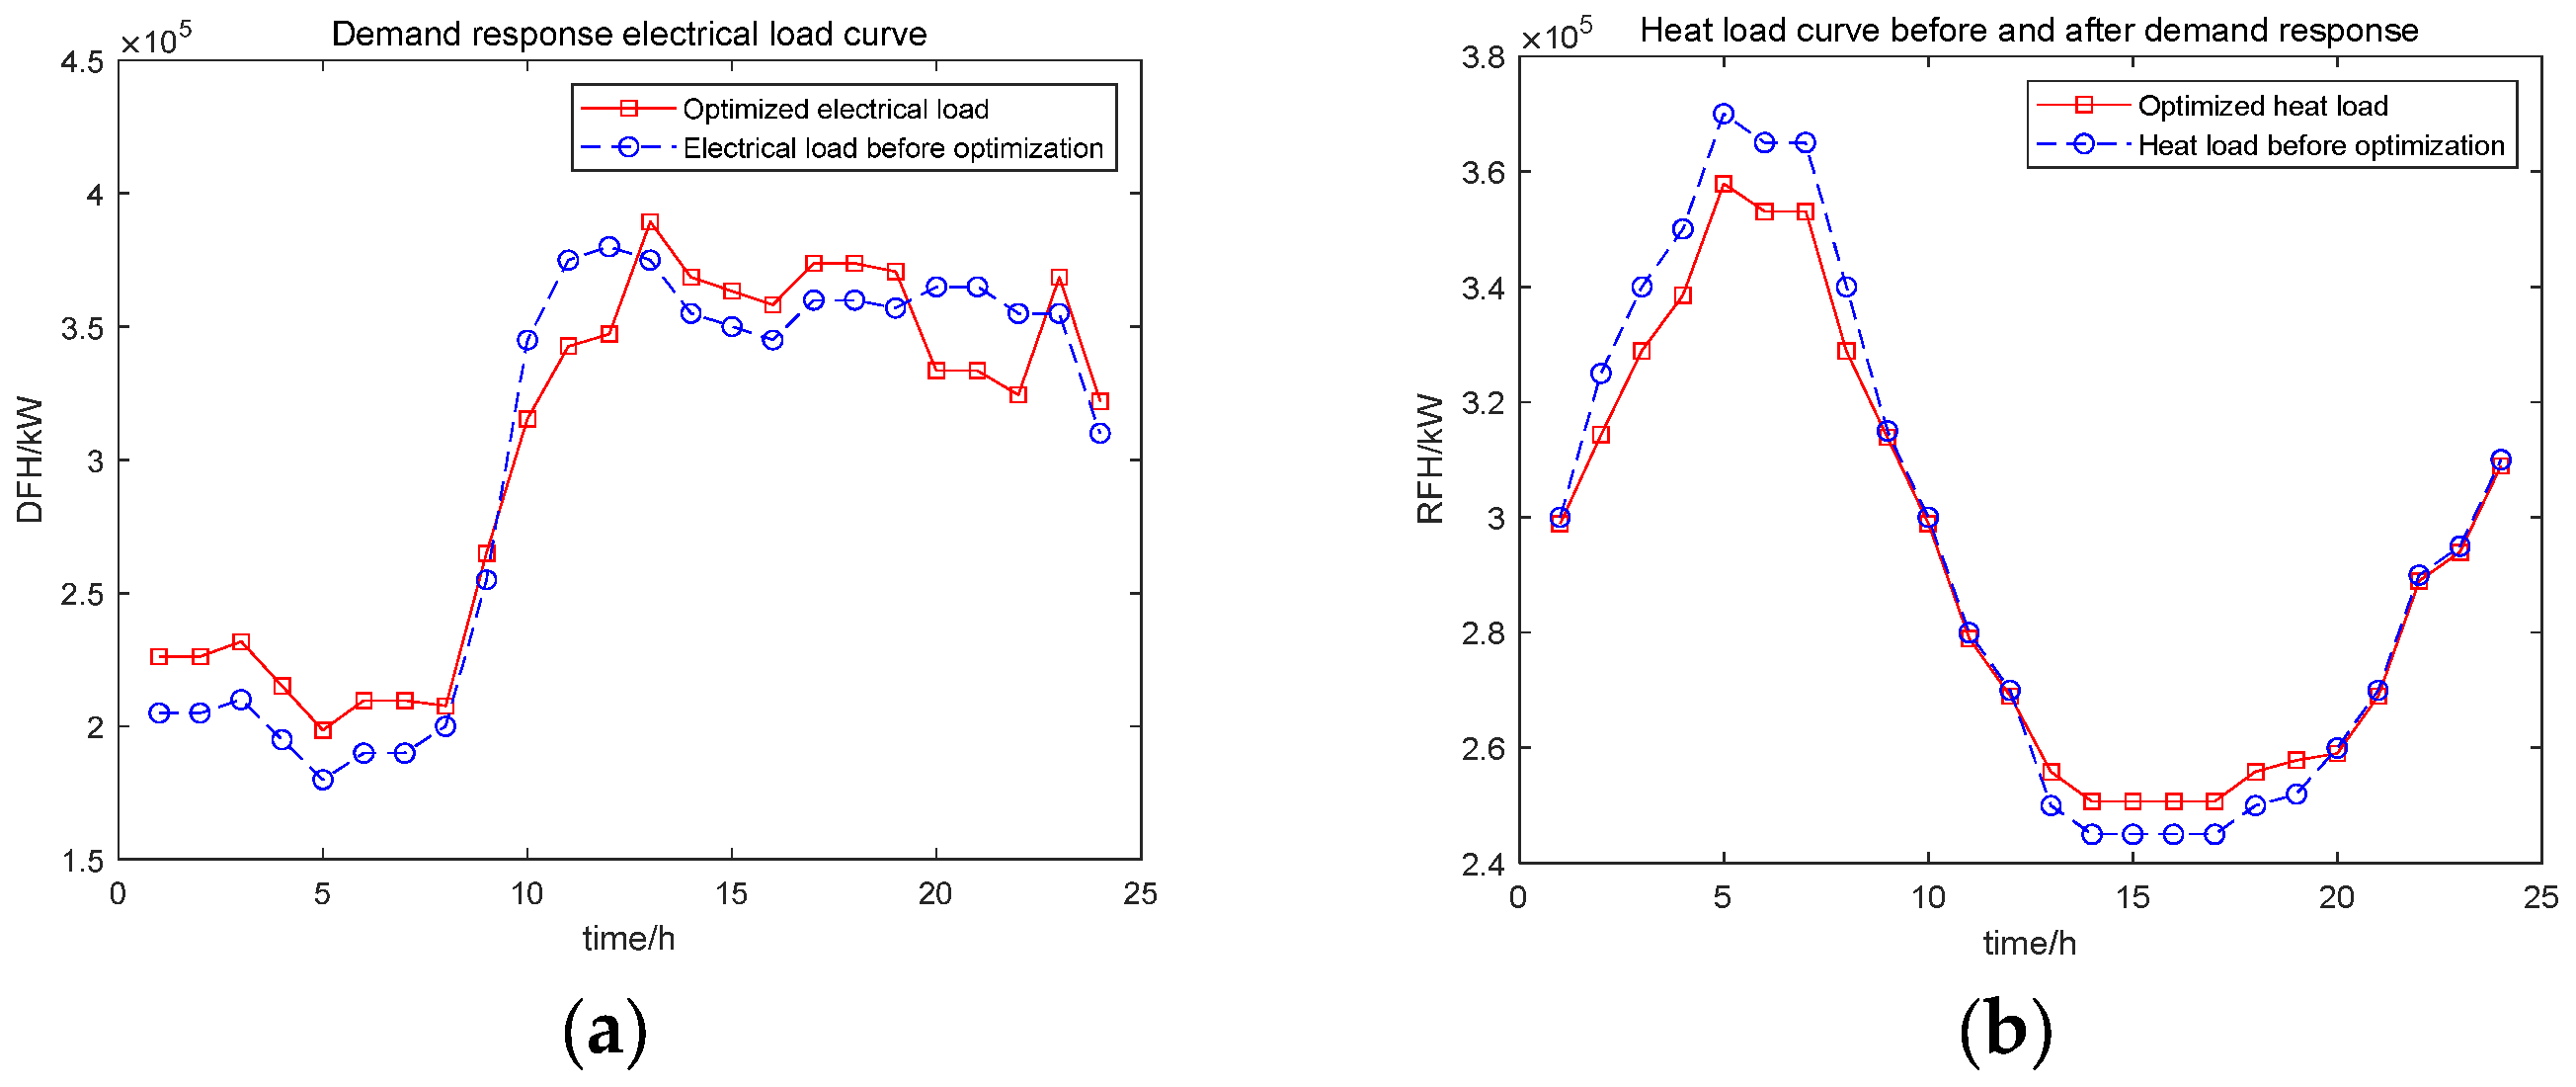
As shown above, the user unit performs flexible load reduction and transfer during the peak energy consumption period. According to the load optimization curve of the system, under the proposed model, the user unit participates in the demand response according to the changes in price signals, thus achieving load reduction and transfer during peak hours and the smoothing of the load curve. It plays an obvious role in peak cutting and valley filling, and the load peak and valley have been significantly improved. Compared to Figure 5 and Figure 7, due to the role of demand response, the optimized electricity load demand is closer to the output fluctuation of wind power, which helps to reduce the system air generation volume and optimize the output of hydrogen production equipment.
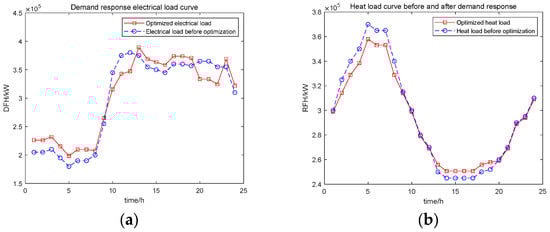
Figure 7.
Load change status before and after demand response: (a) electrical load status before and after demand response and (b) heat load status before and after demand response.
4. Discussion
Firstly, this paper considers the refined utilization mode of hydrogen energy, establishes a comprehensive energy system model, and analyzes the changes in flexibility, economy, and the cleanliness of the system under the new energy utilization mode compared with the traditional comprehensive energy system.
Secondly, in the simulation operation, considering the energy supply and demand balance of the system and the operation constraints of the equipment, ensuring the safe operation of the system in many aspects and accurately achieving the coordinated planning of supply and demand in the system are conducive for achieving the economic optimality of the system.
Finally, by setting different scenarios and analyzing the equipment output status during the system operation, the economic and environmental benefits in the system operation cycle are achieved, and the scheme plan for the future development of the power system is provided as a reference.
Based on the design of this paper, the research and analysis of China’s current energy policy are conducted. The calculation shows that, with the addition of hydrogen energy utilization, the operating cost of the system equipment increases, but the economic benefit also improves. As the country attaches importance to environmental benefits, in the future power system planning, the proportion of clean energy such as hydrogen energy will continue to increase, and with the development of hydrogen energy utilization technology, the energy cost of hydrogen energy will continue to decline.
5. Conclusions
In order to improve the low-carbon economic benefits of the power system, this paper constructs a comprehensive energy system optimization model of hydrogen mixed with gas and hydrogen fuel cells, fully complying with the green certificate policy and the demand response mechanism. The carbon emissions of the system under different hydrogen mixing ratios were analyzed considering hydrogen production and hydrogen use equipment. The following conclusions can be drawn from the settings of the different scenarios:
- Hydrogen production equipment is added to the system to optimize the peak and trough periods of the system load through demand response. In the low period of system power load, wind power hydrogen production is used to improve the system wind power consumption capacity, so that the system wind power consumption capacity is increased to more than 95%.
- The electric–hydrogen coupling unit in the system partially replaces and assumes the functions of thermal power units and natural gas sources for power supply and heating using technical means such as electrolytic hydrogen production, hydrogen fuel cell power generation, and hydrogen blending, reducing the carbon emissions of the system and improving the flexibility and economy of the system.
- Compared with the traditional electric integrated energy system, hydrogen storage equipment, and hydrogen equipment, the operation cost is very high. However, combined with the green certificate policy, the optimized model described in this paper has significant advantages in improving the system’s wind power consumption capacity and reducing the system’s carbon emissions.
Author Contributions
Conceptualization, Z.Z.; methodology, Z.Z. and X.A; software, Z.Z.; validation, Z.Z. and Y.S.; formal analysis, Z.Z. and Y.S.; investigation, Z.Z.; resources, Z.Z. data curation, Z.Z.; writing—original draft preparation, Z.Z. and Y.S.; writing—review and editing, Z.Z.; supervision, A.X.; project administration, A.X. and Z.Z.; funding acquisition, Z.Z. All authors have read and agreed to the published version of the manuscript.
Funding
This paper is supported by the Natural Science Foundation of Xinjiang Uygur Autonomous Region (project no. 2022D01C664).
Data Availability Statement
Data are contained within paper.
Conflicts of Interest
The authors declare no conflicts of interest.
Abbreviations
The abbreviations or symbols used in this text are detailed below:
| T,t | Time state change collection |
| Pt | Battery change state set |
| Qt | Collection of gas energy state changes |
| Ht | Collection of thermal energy state changes |
| GD | Purchase electricity from the grid |
| C | Collection of states of economic change |
| Nc, Nd | Energy storage and release of system energy storage equipment |
| GT | Gas turbine |
| FD | Store and discharge electricity |
| CD | Charge amount of storage device |
| GD | The system buys power from the grid |
| RC | Heat storage devices store energy |
| RF | The heat storage device releases energy |
| QC | Hydrogen storage devices store energy |
| QF | Hydrogen storage devices release energy |
| EL | Electrolytic device power consumption |
| HFC | Hydrogen fuel cell |
| WP | Wind power generation |
| DFH | Electric load |
| RFH | Heat load |
| SRQW | Hydrogen power input to the gas grid |
Appendix A
Table A1.
Running parameters of device.
Table A1.
Running parameters of device.
| Equipment | Argument | Numerical Value |
|---|---|---|
| EL | Maximum/minimum power consumption (MW) | 400/0 |
| Unit climbing rate (MW/h) | 100 | |
| HFC | Maximum and minimum output (MW) | 350/0 |
| Unit climbing rate (MW/h) | 100 | |
| Power generation and heat efficiency | 85%/75% | |
| GT | Maximum and minimum output (MW) | 350/0 |
| Unit climbing rate (MW/h) | 50 | |
| Power generation and heat efficiency | 35%/40% | |
| Stored energy | Upper and lower limits of storage capacity (MW) | 500/50 |
| Maximum charge and discharge power (MW) | 100 | |
| Charge and discharge efficiency | 90% | |
| Initial capacity (MW) | 50 |
Table A2.
Time-of-use electricity prices.
Table A2.
Time-of-use electricity prices.
| Time Frame | Electricity Price/[CNY/KW·h] |
|---|---|
| 0:00–7:00 | 0.35 |
| 8:00–9:00, 13:00–19:00, 23:00–24:00 | 0.68 |
| 10:00–12:00, 20:00–22:00 | 1.09 |
Table A3.
Time-sharing gas prices.
Table A3.
Time-sharing gas prices.
| Time Frame | Electricity Price/[CNY/m3] |
|---|---|
| 0:00–1:00, 9:00–12:00, 20:00–24:00 | 3.25 |
| 2:00–8:00, 18:00–19:00 | 3.65 |
| 13:00–17:00 | 2.65 |
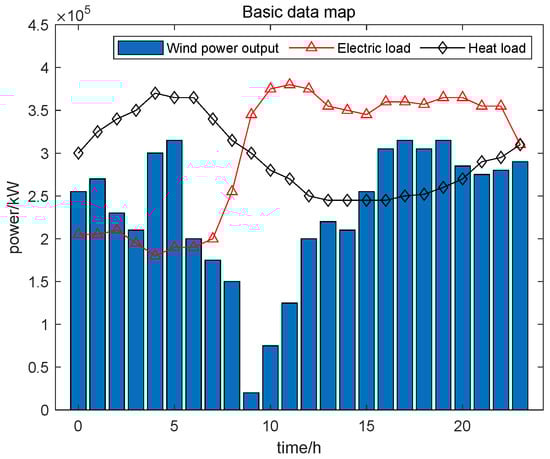
Figure A1.
Load and wind power output.
Figure A1.
Load and wind power output.

Table A4.
Time-sharing gas prices.
Table A4.
Time-sharing gas prices.
| Time | 1 | 2 | 3 | 4 | 5 | 6 | 7 | 8 | 9 | 10 | 11 | 12 | |
|---|---|---|---|---|---|---|---|---|---|---|---|---|---|
| Type of Load | |||||||||||||
| Electric load | 205 | 205 | 210 | 195 | 180 | 190 | 190 | 200 | 255 | 345 | 375 | 380 | |
| Heat load | 300 | 325 | 340 | 350 | 370 | 365 | 365 | 340 | 315 | 300 | 280 | 270 | |
| Time | 13 | 14 | 15 | 16 | 17 | 18 | 19 | 20 | 21 | 22 | 23 | 24 | |
| Type of Load | |||||||||||||
| Electric load | 375 | 355 | 350 | 345 | 360 | 360 | 357 | 365 | 365 | 355 | 355 | 310 | |
| Heat load | 250 | 245 | 245 | 245 | 245 | 250 | 252 | 260 | 270 | 290 | 295 | 310 | |
References
- Huang, L. Analysis and control strategy of low-carbon transformation of next-generation power system under the goal of carbon neutrality. Mod. Ind. Econ. Informatiz 2023, 13, 181–183. [Google Scholar]
- Feng, Y.; Xu, Y.; Zhang, J. Application status and prospect of integrated energy system planning and design platform. Energy Conserv. Environ. Prot. 2021, 12, 41–43. [Google Scholar]
- Xue, D. Application prospect of “green hydrogen” in integrated energy system. Contemp. Chem. Ind. Res. 2022, 4, 60–62. [Google Scholar]
- Sun, Y.; Hu, Z.; Qin, A.; Teng, F. Analysis of strategy and technology situation on global hydrogen industry. World Sci. Tech. R D 2020, 42, 455–465. [Google Scholar]
- Xiong, J.; Jiao, Y.; Wang, M. Optimal scheduling of regional integrated energy system considering power-to-gas. Mod. Electr. Power 2022, 39, 554–561. [Google Scholar]
- Zhang, C.; Bai, S.; Zhao, G. Multi-objective Optimal Scheduling of Combined Cooling, Heating and Power Microgrid with Electricity-to-Gas. Jilin Electr. Power 2021, 49, 28–32. [Google Scholar]
- Zhou, B.; Hua, W.; Zhang, Y. P2G Plant and Station Optimization Planning for Electricity-Gas Coupling and Low Carbon. J. Electr. Power Syst. Autom. 2022, 34, 9–17+24. [Google Scholar]
- Gao, Y.; Yuan, C.; Kong, F. Optimization of Integrated Energy System Coupled with Electric-to-Gas and Carbon Capture Equipment under Demand Response Excitation. China Electr. Power 2023, 1–9. [Google Scholar]
- Chen, Y.; Liu, D.; Gao, F. Optimal scheduling of regional integrated energy system considering the refined utilization of hydrogen energy in the power-to-gas link. Power Supply 2021, 38, 59–67. [Google Scholar]
- Deng, Y.; Li, C.; Shao, C. Stochastic Optimal Scheduling of Electric, Heat, Gas and Hydrogen Integrated Energy System. Acta Sol. 2023, 44, 522–529. [Google Scholar]
- Ding, T.; Jia, W.; Huang, Y. Collaborative Optimization of Hydrogen Production, Storage, and Transportation in Mobile Hydrogen Energy System Based on Distributed Robust Opportunistic Constraints. Power Syst. Autom. 2023, 47, 1–11. [Google Scholar]
- Wu, X.; Tan, L.; Zheng, Y. Economic Prospect of Hydrogen and Economic Analysis of Water Electrolysis Technology for Hydrogen Production. Chem. Ind. Eng. 2023, 41, 131–140. [Google Scholar] [CrossRef]
- Wang, X. Development Trends of Hydrogen-Mixed Natural Gas and HCNG. Nat. Gas Chem. Ind. 2018, 43, 23. [Google Scholar]
- Wang, K.; Liang, Y.; Jia, R. Two-stage Optimal Scheduling of Multi-microgrid for Integrated Energy with Hydrogen-doped Gas Based on Nash Negotiation in Uncertain Environment. Power Syst. Technol. 2023, 47, 3141–3159. [Google Scholar]
- Cui, Y.; Shen, Z.; Wang, Z. Green Dispatch of Regional Integrated Energy System Considering the Interaction Mechanism of Green Certificate-Carbon Emission Equivalence. Proc. CSEE 2023, 43, 4508–4517. [Google Scholar]
- Fan, H.; Yang, Z.; Xia, S. Low-carbon economic operation of hydrogen-blended natural gas integrated energy system considering stepped carbon trading mechanism. J. Shanghai Jiao Tong Univ. 2023, 1–21. [Google Scholar] [CrossRef]
- Liang, Y.; Wang, Y.; Liu, H.; Wang, P.; Jing, Y.; Li, J. Optimal Operation of Integrated Energy System Considering Demand Response. J. Phys. Conf. Ser. 2021, 2087. [Google Scholar] [CrossRef]
- Isaac, T. HyDeploy: The UK’s first hydrogen blending deployment project. Clean Energy 2019, 3, 114–125. [Google Scholar] [CrossRef]
- Hydrogen Blending Ratio Reaches 24%! China Has Made a Breakthrough in This Technology! [EB/OL]. Available online: https://tv.cctv.com/2023/04/16/VIDEp897LRcopua0f57onRXI230416.shtml (accessed on 22 August 2023).

Disclaimer/Publisher’s Note: The statements, opinions and data contained in all publications are solely those of the individual author(s) and contributor(s) and not of MDPI and/or the editor(s). MDPI and/or the editor(s) disclaim responsibility for any injury to people or property resulting from any ideas, methods, instructions or products referred to in the content. |
© 2024 by the authors. Licensee MDPI, Basel, Switzerland. This article is an open access article distributed under the terms and conditions of the Creative Commons Attribution (CC BY) license (https://creativecommons.org/licenses/by/4.0/).