1. Introduction
Diesel is a very popular fuel used in compression-ignition engines, mainly powering vehicles of all kinds. Its ubiquity is best demonstrated by consumption. In 2021, 18.191 Mt (million tonnes) of diesel fuel were consumed in Poland, while the consumption of petrol (95 and 98 combined) was nearly four times lower at 4.846 Mt in the same period. Liquefied petroleum gas (LPG) was consumed at 2.441 Mt [
1]. Over the last few years, there has been a noticeable increase in diesel consumption in the European Union [
2], which, given the increasing number of vehicles powered by so-called renewable energy sources, may not be entirely obvious. Diesel and its admixing as well as its refinement are also an ongoing topic in scientific research. Doping with alcohol to increase the cetane number [
3] or improving the efficiency and exhaust emissions of diesel engines through the use of nano-materials in lubricants [
4] are among the many recent papers published. Even the designs of the diesel fuel injection systems themselves, although known for many years, are still being improved, confirming the validity of diesel research [
5].
Diesel engines produced today are considerably more fuel-efficient than their older designs. This is mainly due to modern direct injection systems, which inject a precisely metered dose of diesel fuel, often in two cycles, directly into the combustion chamber. The precision of both the design and operation of the injectors comes at a cost of their sensitivity to contaminants, hence significant progress in reducing diesel consumption by diesel engines would not be possible without a simultaneous increase in fuel quality [
6]. This is borne out by the research on the aforementioned alcohol doping [
4], different diesel/biodiesel ratios [
7], and fuel/air mixture ratios [
8]. Fuel quality is a very broad term. However, there is a set of characteristics that the fuel should exhibit in order to be considered a wholesome and safe product for engines. In the case of diesel, the parameters that fuel must meet to be commercially available are described by the EN 590 standard [
9]. Exactly the same requirements must be met by all diesel types sold, which include summer, transitional, and winter, all of which in addition can be either regular or premium. Among the parameters that must be met in full is the permissible water content. Other equally important factors include: cetane index and cetane number, density, polycyclic aromatic hydrocarbons, sulphur content, flash point, carbon residue, ash content, total contamination, copper strip corrosion, oxidation stability, lubricity, viscosity, distillation recovered at 250 and 350 °C, and fatty acid methyl ester (FAME) content. The EN 590 standard indicates the measurement methods for each of these parameters. However, researchers are relentless in their efforts to improve the quality or speed of these tests and to identify alternative methods that could be better in any respect. Examples of such research are numerous. In addition to the work presented here, one such example could be an alternative method for diesel cetane number testing [
10].
Exceedances of the water content limit are relatively rare according to official data. However, the authors are of the opinion that the real scale of the problem is unknown, as the random surveys carried out by the aforementioned authority are very infrequent and never cover all possible filling stations. This belief is led by the authorised service centres for injection systems, which confirm the recorded cases of water damage. This contradicts official data and clearly indicates the need to increase the number of checks carried out on the quality of fuel sold. Water in excessively high concentrations can have serious consequences; for example, it is capable of damaging modern fuel injection systems, which are very expensive to repair. The repair itself often ends with the replacement of injectors, which, before they are completely damaged, do not work at full capacity. Rather, they dispense the wrong amount of fuel, at the wrong time, and under too low a pressure. Assuming that a measuring system to test the water content of fuel would be relatively cheap, its installation would be cost-effective given the very high cost of repairing a water-damaged engine. This would be particularly the case in situations where tanked fuel, for various reasons, may have been contaminated with water, e.g., condensed from the air during storage. The rare occurrences of the above-mentioned exceedances are described in official reports of random surveys. However, if the number of inspections were increased, the number of irregularities detected would certainly also be higher. Damage to fuel injection systems need not be immediately apparent. If contaminated fuel has been tanked intermittently, it may take a long time before any symptoms are noticed. It is then difficult to link an existing problem with the injection system to its true cause. A new, low-cost, easy-to-use method of measuring the water content of diesel could contribute to a significant increase in the number of inspections and thus the protection of modern diesel engines.
The presence of water in petroleum products is commonly regarded as a contaminant, which can be a major impediment to further operation. Its frequent occurrence within the oil and gas industry can be attributed to various factors, such as improper storage, transportation, distribution practices, or condensation of atmospheric moisture. The presence of water results in a reduction in the quality of the oil, a reduction in the rate of production of final petroleum products, corrosion of the transport system, and a larger drop in pressure, resulting in increased operating costs [
11]. During the combustion process, the presence of water can negatively impact engine stability, hinder the efficiency of combustion itself, and impede the proper heating of oil [
12]. The presence of water in any fuel source leads to a significant decrease in both exhaust temperature and heat release rate. Additionally, it can introduce challenges to the ignition and combustion processes, ultimately resulting in diminished engine performance or a reduction in torque output [
13,
14]. In general, the extent to which the water contained in the product is harmful depends on the type of oil and the conditions under which it is used, the sensitivity of the system (e.g., lubricated), and the form of the water itself (e.g., droplets forming a suspension, ice, or free water forming a separate phase).
A variety of methodologies exist for quantifying the water content within oil products. Chemical determination techniques can detect water content ranging from several parts per million (ppm) to tens of ppm in fuels. Notably, the EN 590 standard governing commercially available diesel fuel within the European Union permits a water content limit of 200 mg/kg. Common methods employed for water quantification in petroleum products include the Karl Fischer titration, centrifugation, distillation, and spectrophotometry.
The EN 590 standard specifically recommends the Karl Fischer method, which facilitates the determination of water content from 0.0005% to 0.5% through potentiometric titration. During this process, isolated water reacts with Fischer reagents, and the resulting solution’s potential is monitored voltametrically with a two-headed platinum electrode [
15,
16]. The Karl Fischer method can be further categorised based on the titration technique employed. In coulometric Karl Fischer titration, iodine is electrochemically generated at the generator electrode within a glass titration cell. This electrode resides near the measuring electrode, a two-headed platinum electrode. The measuring electrode’s role is to continuously monitor the sample solution’s potential throughout the ongoing coulometric titration. Additionally, an anolyte solution, facilitating the oxidation process, resides within the anode chamber, while a catholyte solution, enabling the complete electrochemical reaction, resides within the cathode chamber. Conversely, the centrifuge method measures the total combined content of impurities and water present in petroleum products. Finally, the spectrophotometric method relies on analysing the absorbance spectra of samples to determine their water content [
17].
Impedance spectroscopy (IS) can be an alternative to the methods mentioned above. It can be a non-destructive way of investigating all kinds of matter and is notable for its relatively simple mechanism and possible low-cost implementation. In the vast majority of cases, it involves measuring the value and phase of the current flowing through the substance being measured, as a result of applying a sinusoidal voltage to it. Such measurement is carried out at a selected, usually wide frequency range. The amplitude of the excitation signal should be sufficiently low that no additional phenomena occurring in the matter being tested are induced.
Investigating the water content of diesel fuel using impedance spectroscopy is not a popular research topic. In the sparse literature dealing with this and similar fields, one can find authors’ preliminary attempts to estimate the water content of one particular type of diesel [
18], the water content of one specially prepared biodiesel [
19], the moisture of mineral oil [
20], or the biodiesel content of diesel [
21]. The novelty of this paper lies in the experimental examination of commercially available diesel oils in Poland using the IS method. The properties of the oils tested cannot be known a priori, which results in a number of difficulties in the research. The authors believe that their studies and the presented results will contribute to the development of the field because there is certainly still much to accomplish or improve in this area. The subject itself seems to be both timely and economically important.
Despite the low solubility of water in diesel and the number of procedures developed and required by the standards, the water content of fuel can still exceed the permissible value. In Poland, reports from the Office of Competition and Consumer Protection on fuel quality inspections between 2013 and 2023 showed up to several exceedances per year in diesel alone. Fewer than 1000 samples taken from various locations and entities, such as fuel and plant stations, entrepreneurs engaged in fuel production and storage, and fuel wholesalers, were tested each time. Remarkably, exceedances of the permissible water content in ON occurred even at fuel wholesalers.
An increased number of random diesel quality checks would have a great chance of being translated into an improvement in the performance of the available fuel. However, this is currently a time- and cost-intensive process. A novel method based on impedance spectroscopy could meet the demand for the ability to control the water content of diesel at the point of distribution. Measuring the electrical properties of the material being tested could be a relatively simple and straightforward operation that would not require a laboratory technician/specialist to perform. In addition, impedance spectroscopy could underlie the operation of a measurement system that need not be very expensive to produce and maintain. The present work is an attempt to verify the feasibility of using impedance spectroscopy to measure the water content of diesel fuels as a preliminary method to the one currently used. Even if the obtained water content measurement results do not match the precision of laboratory methods, this would not exclude the possibility of using the proposed method as a preliminary test, often performed with the aim of recommending oil samples for further, more accurate analysis.
In a situation where a completely known substance is tested by impedance spectroscopy, taking a single measurement may be sufficient to obtain the information sought about it. In the case of diesel with an unknown exact chemical composition, it is not possible to theoretically determine the expected impedance characteristics of the test material. It is then possible to base tests on predetermined calibration curves and use impedance spectroscopy as a comparative method. Calibration curves relate measurable changes in the impedance spectrum of the test substance as a result of the parameter of interest. From the spectra, it is possible to determine the electrical equivalent circuit (EEC) parameters of the test substance. These curves can then be based, for example, on the value of the calculated resistance or capacitance of the electrical equivalent circuit.
The main research presented in this paper aimed to prove that it is possible to detect exceedances of the permissible water content in diesel fuel using impedance spectroscopy. The test plan therefore involved sampling the largest possible number of available fuel types, checking their initial water content, doping the samples with known amounts of water, and measuring the impedance spectrum of all prepared samples. Then, on the basis of experimental measurement data, we determined the electrical equivalent circuit of a diesel with different water content and identified the parameter that changed its value most significantly as a function of water content. The experiments carried out in this manner are followed by a proposed methodology for investigating the water content of diesel using impedance spectroscopy.
2. Materials and Methods
2.1. Diesel Samples
Given the impossibility of knowing the exact chemical composition of commercially available diesel fuels and its lack of reproducibility, the research would have to cover all available types. It is not possible to test samples from absolutely all filling stations, hence the selection was limited to the five most significant retail chains in Poland. The study material consisted of samples of commercially available diesel: summer, transitional, winter, as well as regular and premium types. On each occasion, diesel was taken from distributors located at the same fuel stations belonging to the five largest networks in the country. It should be noted, however, that the producer of the fuel obtained could have been, at the time of the study, a refinery belonging to one of the two Polish fuel producers. Nonetheless, the composition of the fuels and their properties could have been different at each of the stations, as the networks distributing the fuel may have commissioned the producer to, among other things, admix the fuel with other additives.
Fuel in volumes of 10 L was dispensed into plastic canisters at retail fuel stations. Regular, premium, summer, transitional, and winter diesel were taken from each of the five suppliers, for a total of 25 samples. In addition, to check the reproducibility of fuel properties, material was sampled three more times from each supplier during the summer and winter fuel sales period.
Diesel oils are regarded as dielectrics due to their properties [
21,
22,
23,
24]. The reduction in the permissible sulphur content of diesel oils over recent years has led to an increasing production and consumption of ultra-low sulfur diesel (ULSD), which is currently the only type of diesel commercially available in the European Union. This, in turn, has necessitated the doping of ULSD with additives that increase its conductivity to safe values for fuel transport, i.e., ≥50 pS/m. This value is the absolute minimum, while the upper limit of diesel conductivity is not regulated. Hence, there is no conductivity value common to all diesel fuels, and it can vary in each batch of fuel produced.
2.2. Sample Preparation
A small portion of each sample—a volume of approximately 100 mL—was sent to an external certified laboratory (Oil and Gas Institute—National Research Institute, Kraków, Poland) for measurement of water content using the method of PN-EN ISO 12937:2005 [
25]. This standard addresses the direct determination of water in the range of 0.003 to 0.100% (m/m) in petroleum products with a boiling point below 390 °C by Karl Fischer coulometric titration. In this way, the initial water content of the examined fuel was known. The obtained results ranged from 31 to 65 mg/kg for all tested samples; therefore, they were fully compliant with the EN 590 standard.
In general, mixtures of water in oils are emulsions. They are inherently thermodynamically unstable systems, consisting of two immiscible phases: polar (water) and non-polar (oil). Various types of emulsifiers are used to ensure the stability of emulsions, which ensure the formation of a strong interfacial layer at the water–oil interface. Emulsifiers are mainly surfactants, polymers, and particulates [
11,
26,
27]. For the reasons mentioned earlier, emulsifiers are not used in fuels. Hence, emulsions formed by water in diesel are an undesirable and rather temporary phenomenon. Therefore, in order to be able to obtain quasi-stable mixtures with different known water contents, the samples were mixed before and during the measurements with a magnetic stirrer.
The test samples of 500 mL were poured into glass beakers, which were cleaned with a soap solution and then acetone before the measurements took place. The acetone was intended to clean the glass of any residues that could alter, among other factors, the surface tension of the oil being tested. Purchased oil was used to prepare test samples with predetermined added water contents. Samples without water admixture were also tested. Concentrations of 0.025, 0.05, 0.075, 0.1, 0.125, 0.15, 0.2, 0.3, 0.4, 0.5, and 0.6‰ (v/v) were obtained by adding known measured amounts of distilled water as, respectively: 12.5, 25, 37.5, 50, 62.5, 75, 100, 150, 200, 250, and 300 μL (per 500 mL sample volume tested). A variable capacity HT Optipette OP200 automatic pipette, with a range of 20–200 μL, was used to measure the specified water quantities. Despite adding the same quantities of water, the samples of each batch of diesel contained different total water contents, as the oils already had different water contents at the time of purchase. Because of the relatively small differences in initial water content, it was decided not to modify the added values. This made it possible to assess the effect of exactly the same changes on the different batches of oils. These quantities were deliberately chosen so that water contents within the 200 mg/kg limit could be tested with greater resolution. On the other hand, further increasing the amount of water above about 0.6‰ (v/v) was pointless, because water in such concentrations does not mix at all with the diesel; it forms larger droplets that stick to the walls of the sample vessel or to the electrode immersed in it. Water droplets that are far away from a pair of parallel electrodes do not affect the impedance measurement results, so testing higher concentrations was not possible when using magnetic stirring during measurements.
Stirring the samples during the measurements was necessary to ensure consistency in the test results. Water in diesel fuel has a relatively low solubility limit (about 100 mg/kg in diesel of mineral origin without organic additives). Hence, the extremely weak emulsions formed were very unstable above certain water contents, the instability of which was not investigated and lies outside the scope of this paper. It is noteworthy that, for the vast majority of samples tested up to water contents of about 600 mg/kg, stirring allowed the emulsions to remain quasi-stable, i.e., the impedance of the water-doped samples did not change as a function of time. Turning off the stirring caused the expected changes in the properties of the oils, resulting from the gradual sinking of the water to the bottom of the vessel. This process was not always visible to the naked eye at lower concentrations. In order to maintain uniform measuring conditions, all samples, including those not mixed with water, were stirred in the same way during the tests. In addition, the stirring process started 20 min before the start of the impedance measurements.
The density of the tested fuel oscillated around 830 g/dm3 (±5 g/dm3), so in each case, it was within the 820–845 g/dm3 required by the EN 590 standard. Density measurements were carried out in the Department of Chemical Engineering and Apparatus of the Poznan University of Technology. Knowledge of the density of diesel fuel was necessary in order to be able to relate the water content concentrations created during the tests to the commonly used measure expressed in milligrams per kilogram.
Temperature is an important parameter affecting the results of measurements by many methods, including impedance spectroscopy. This is no different in the case of diesel studies, which, most likely as a result of doping during its production with substances that significantly increase its conductivity, is characterised by a positive temperature coefficient of resistance [
28]. Taking this into account, the research was conducted at a constant ambient temperature of 23.0 ± 0.5 °C, which was continuously monitored.
2.3. Measuring System
Impedance measurements of all samples were performed using a computerised commercial and laboratory electrochemical impedance spectroscopy system from Princeton Applied Research, which included a 263A potentiostat/galvanostat, a 5210 lock-in amplifier phase detector, and PowerSINE 1.0 software. Measurements were performed in the mode of generating a single sinusoidally alternating voltage signal. The amplitude of the measurement voltage was 200 mV. Impedance tests were performed at 25 measurement frequency settings ranging from 0.1 Hz to 1 kHz with a logarithmic step, corresponding to six measurements per decade. Each measurement series started from the highest frequency and lasted for a total of about 17 min.
The Agilent 4284A precision impedance meter with a measuring frequency range of 20 Hz–1 MHz was used for random verification of the measured impedance values. There were no deviations in the measured values beyond the measurement error described by the manufacturers. The verification took place for the entire range of measurement frequencies possible in both instruments, i.e., from 20 Hz to 100 kHz.
To check the repeatability of the test results, a series of 25 impedance measurements was repeated a minimum of three times each time. Discrepancies between series did not exceed the measurement error of the measurement system used. An increase in the accuracy of the individual values was obtained by averaging the results of the three measurements. The PowerSINE software provides such an option, and in practice, this involves measuring the voltage and current for each measurement point three times in the frequency domain and then averaging the results. Prior to the start of each series of measurements, an auto-calibration of the potentiostat and phase detector was performed according to the built-in factory procedures. Each collected series of impedance measurements of a given sample was analysed for the correctness of the measurement data using the Z-HIT method, which is one of the functionalities of the pyZwx 1.1 software [
29].
2.4. Electrodes
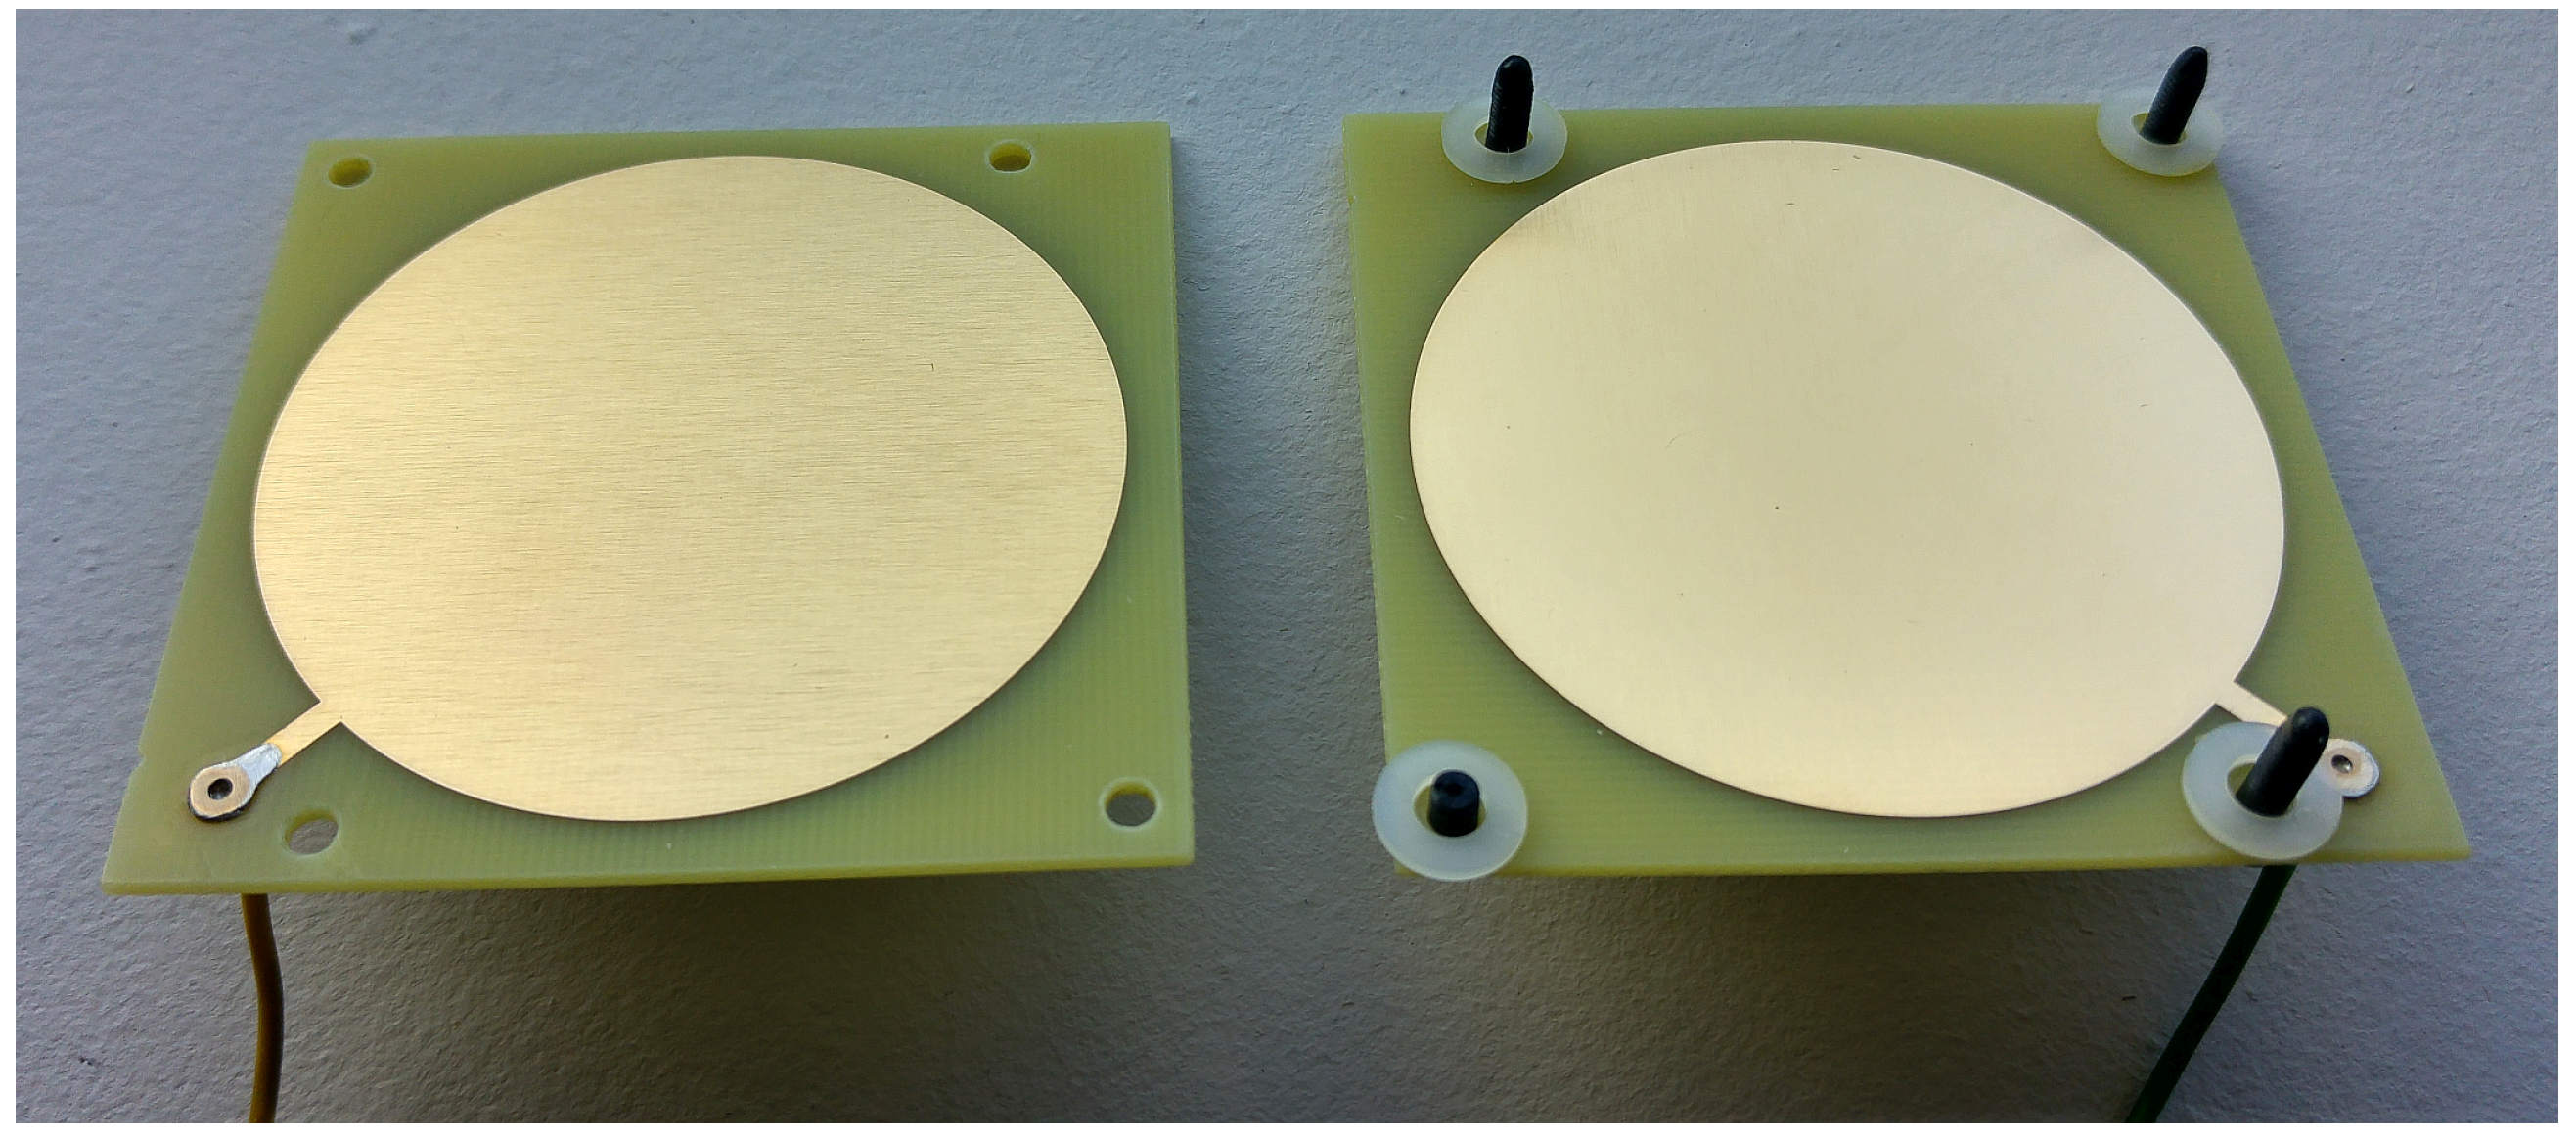
A pair of the authors’ proprietary, symmetrical electrodes, designed for this purpose and fabricated using PCB technology from a laminate coated with a layer of gold-plated copper, shown in
Figure 1, were used for the tests. They were connected as recommended by the manufacturer for a three-electrode potentiostat interface, i.e., with one lead to the working electrode lead and the other to both the counter-electrode and reference electrode leads. The conductive layer, with an area of 25 cm
2, was based on a circular shape to minimise boundary effects. During testing, the electrodes were fully immersed in the sample and spaced 2.5 mm apart. The distance between the electrodes was determined using spacers visible on black screws near the edge of the plates (
Figure 1). Both the spacers and the screws were made of plastic.
Immediately before starting a series of measurements, the stationary potential of the cell was measured so that it would be equal to the measured potential during the tests. The polarisation of the samples was therefore not forced by an arbitrary value of the DC voltage on the electrodes.
There are much better and more durable materials from which electrodes can be made, such as platinum. Nevertheless, the use of a many times cheaper alternative in this study was intentional. It was intended to confirm the thesis that a method of measuring water content in diesel fuel based on impedance spectroscopy can be relatively inexpensive to implement. This therefore also applies to the measuring equipment, which, if very expensive electrodes are chosen, could significantly increase the total cost of the measuring apparatus.
2.5. Impedance Spectroscopy of Diesel with Different Water Contents
After analysing a number of different variants, the most congruent one that resulted in the smallest fitting errors was selected as the electrical equivalent circuit for a diesel with different water content. The selected circuit consisted of a parallel connection of a resistance with a constant phase element (CPE). The resistance R is associated with the charge transfer phenomenon, while the CPE element mimics the behaviour of the double-layer capacitance and adsorption, which could not be delineated without closer knowledge of the composition of the diesel and thus the electrochemical phenomena in it.
In general, impedance can be expressed as the sum of its real and imaginary parts, as in Equation (
1):
The impedance of the constant phase element is described by Equation (
2):
where
Q is a coefficient independent of the
pulsation, and the exponent
can be in the range
. Hence, the impedance of a parallel connection of the CPE with a resistor is expressed by Equation (
3):
3. Results and Discussion
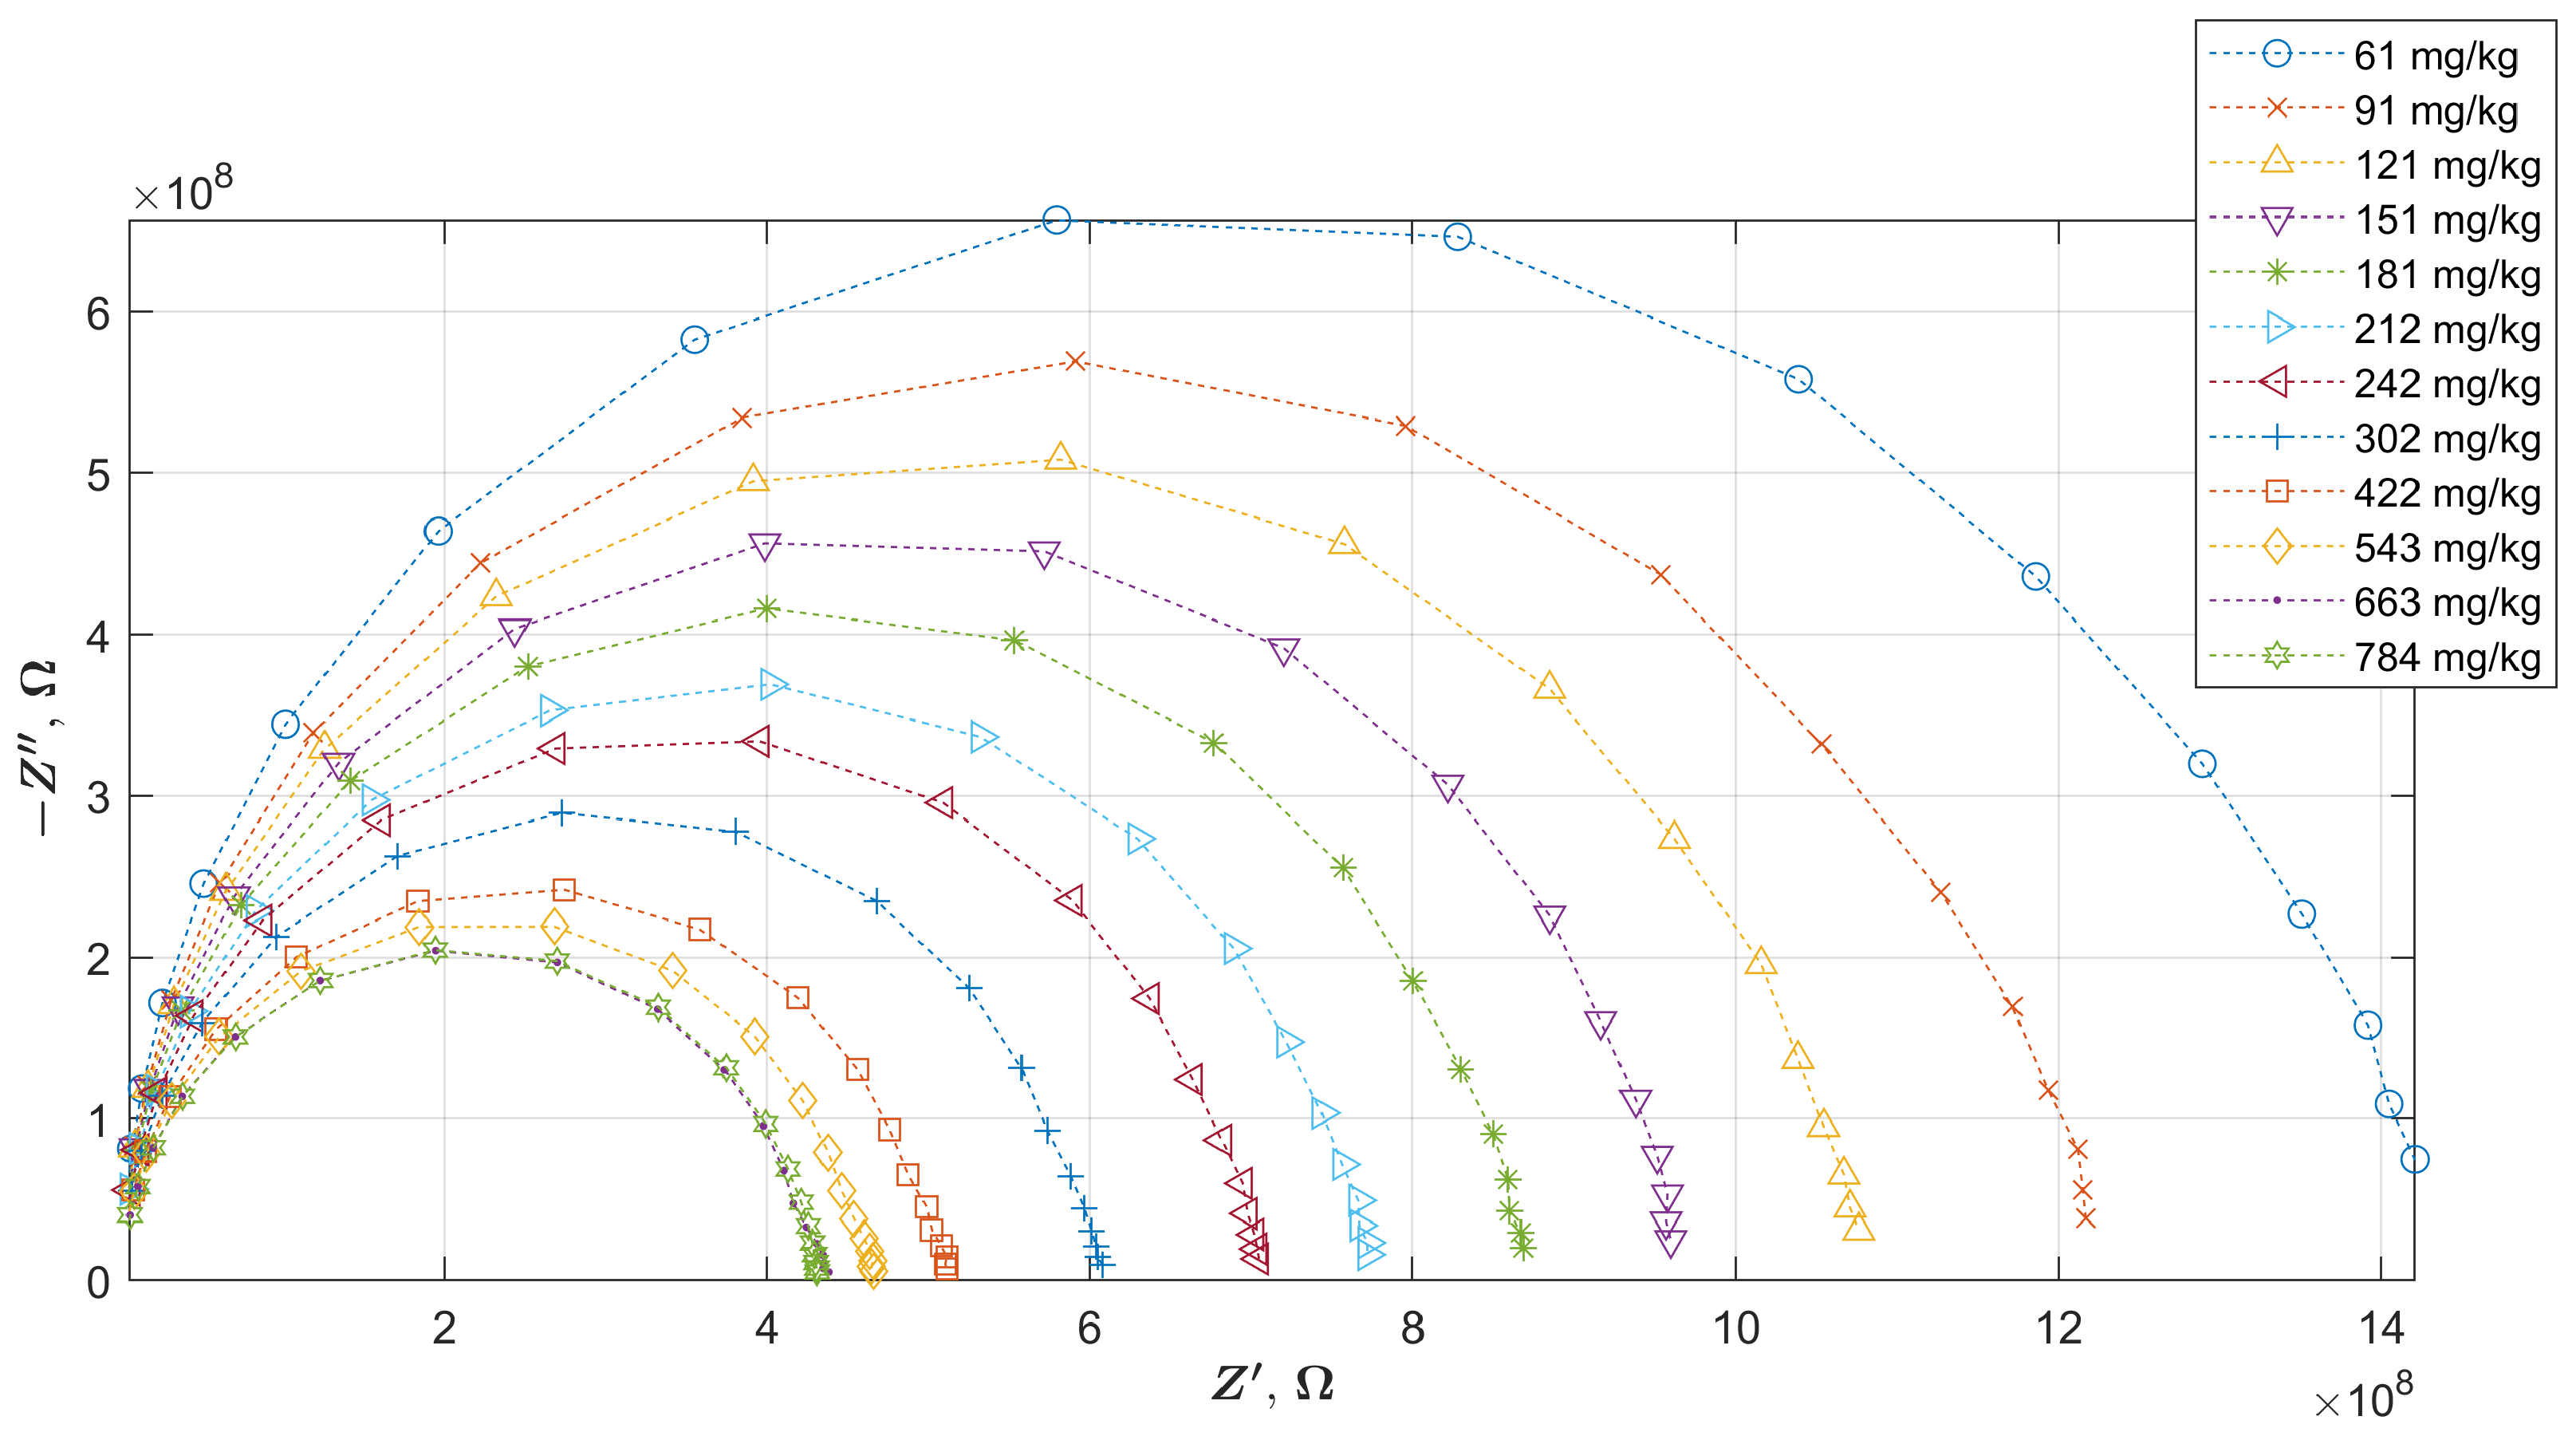
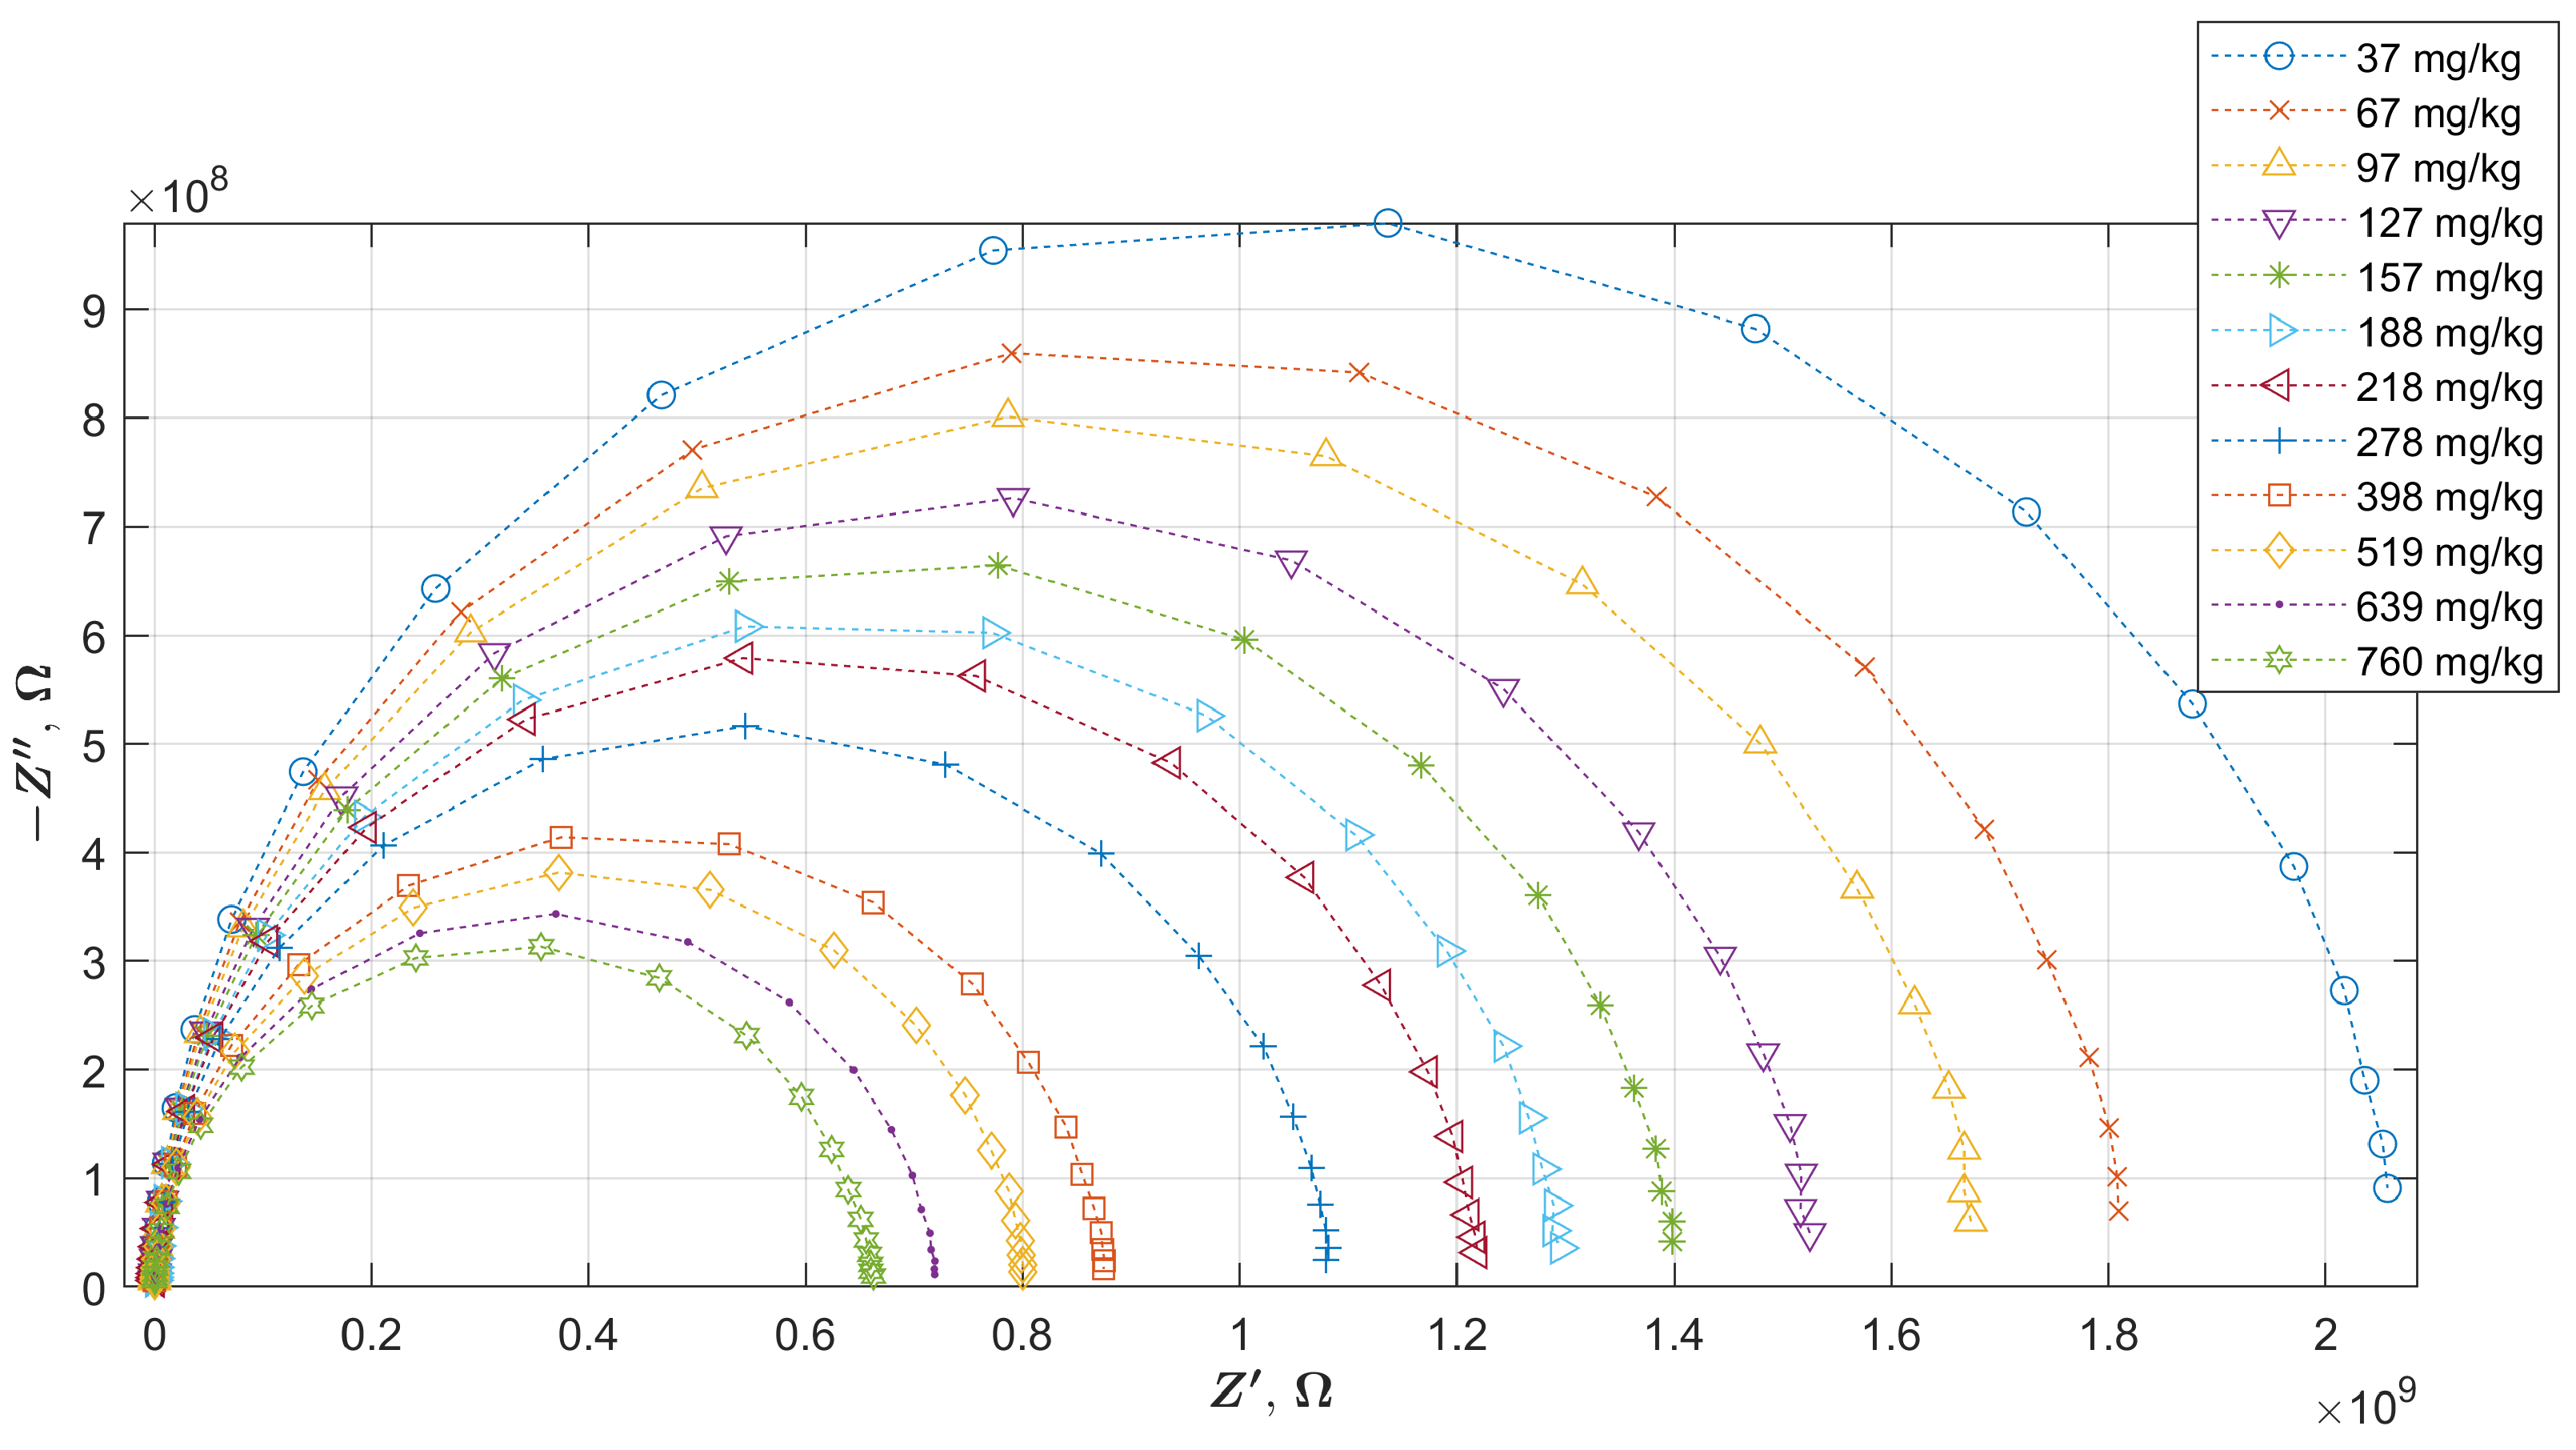
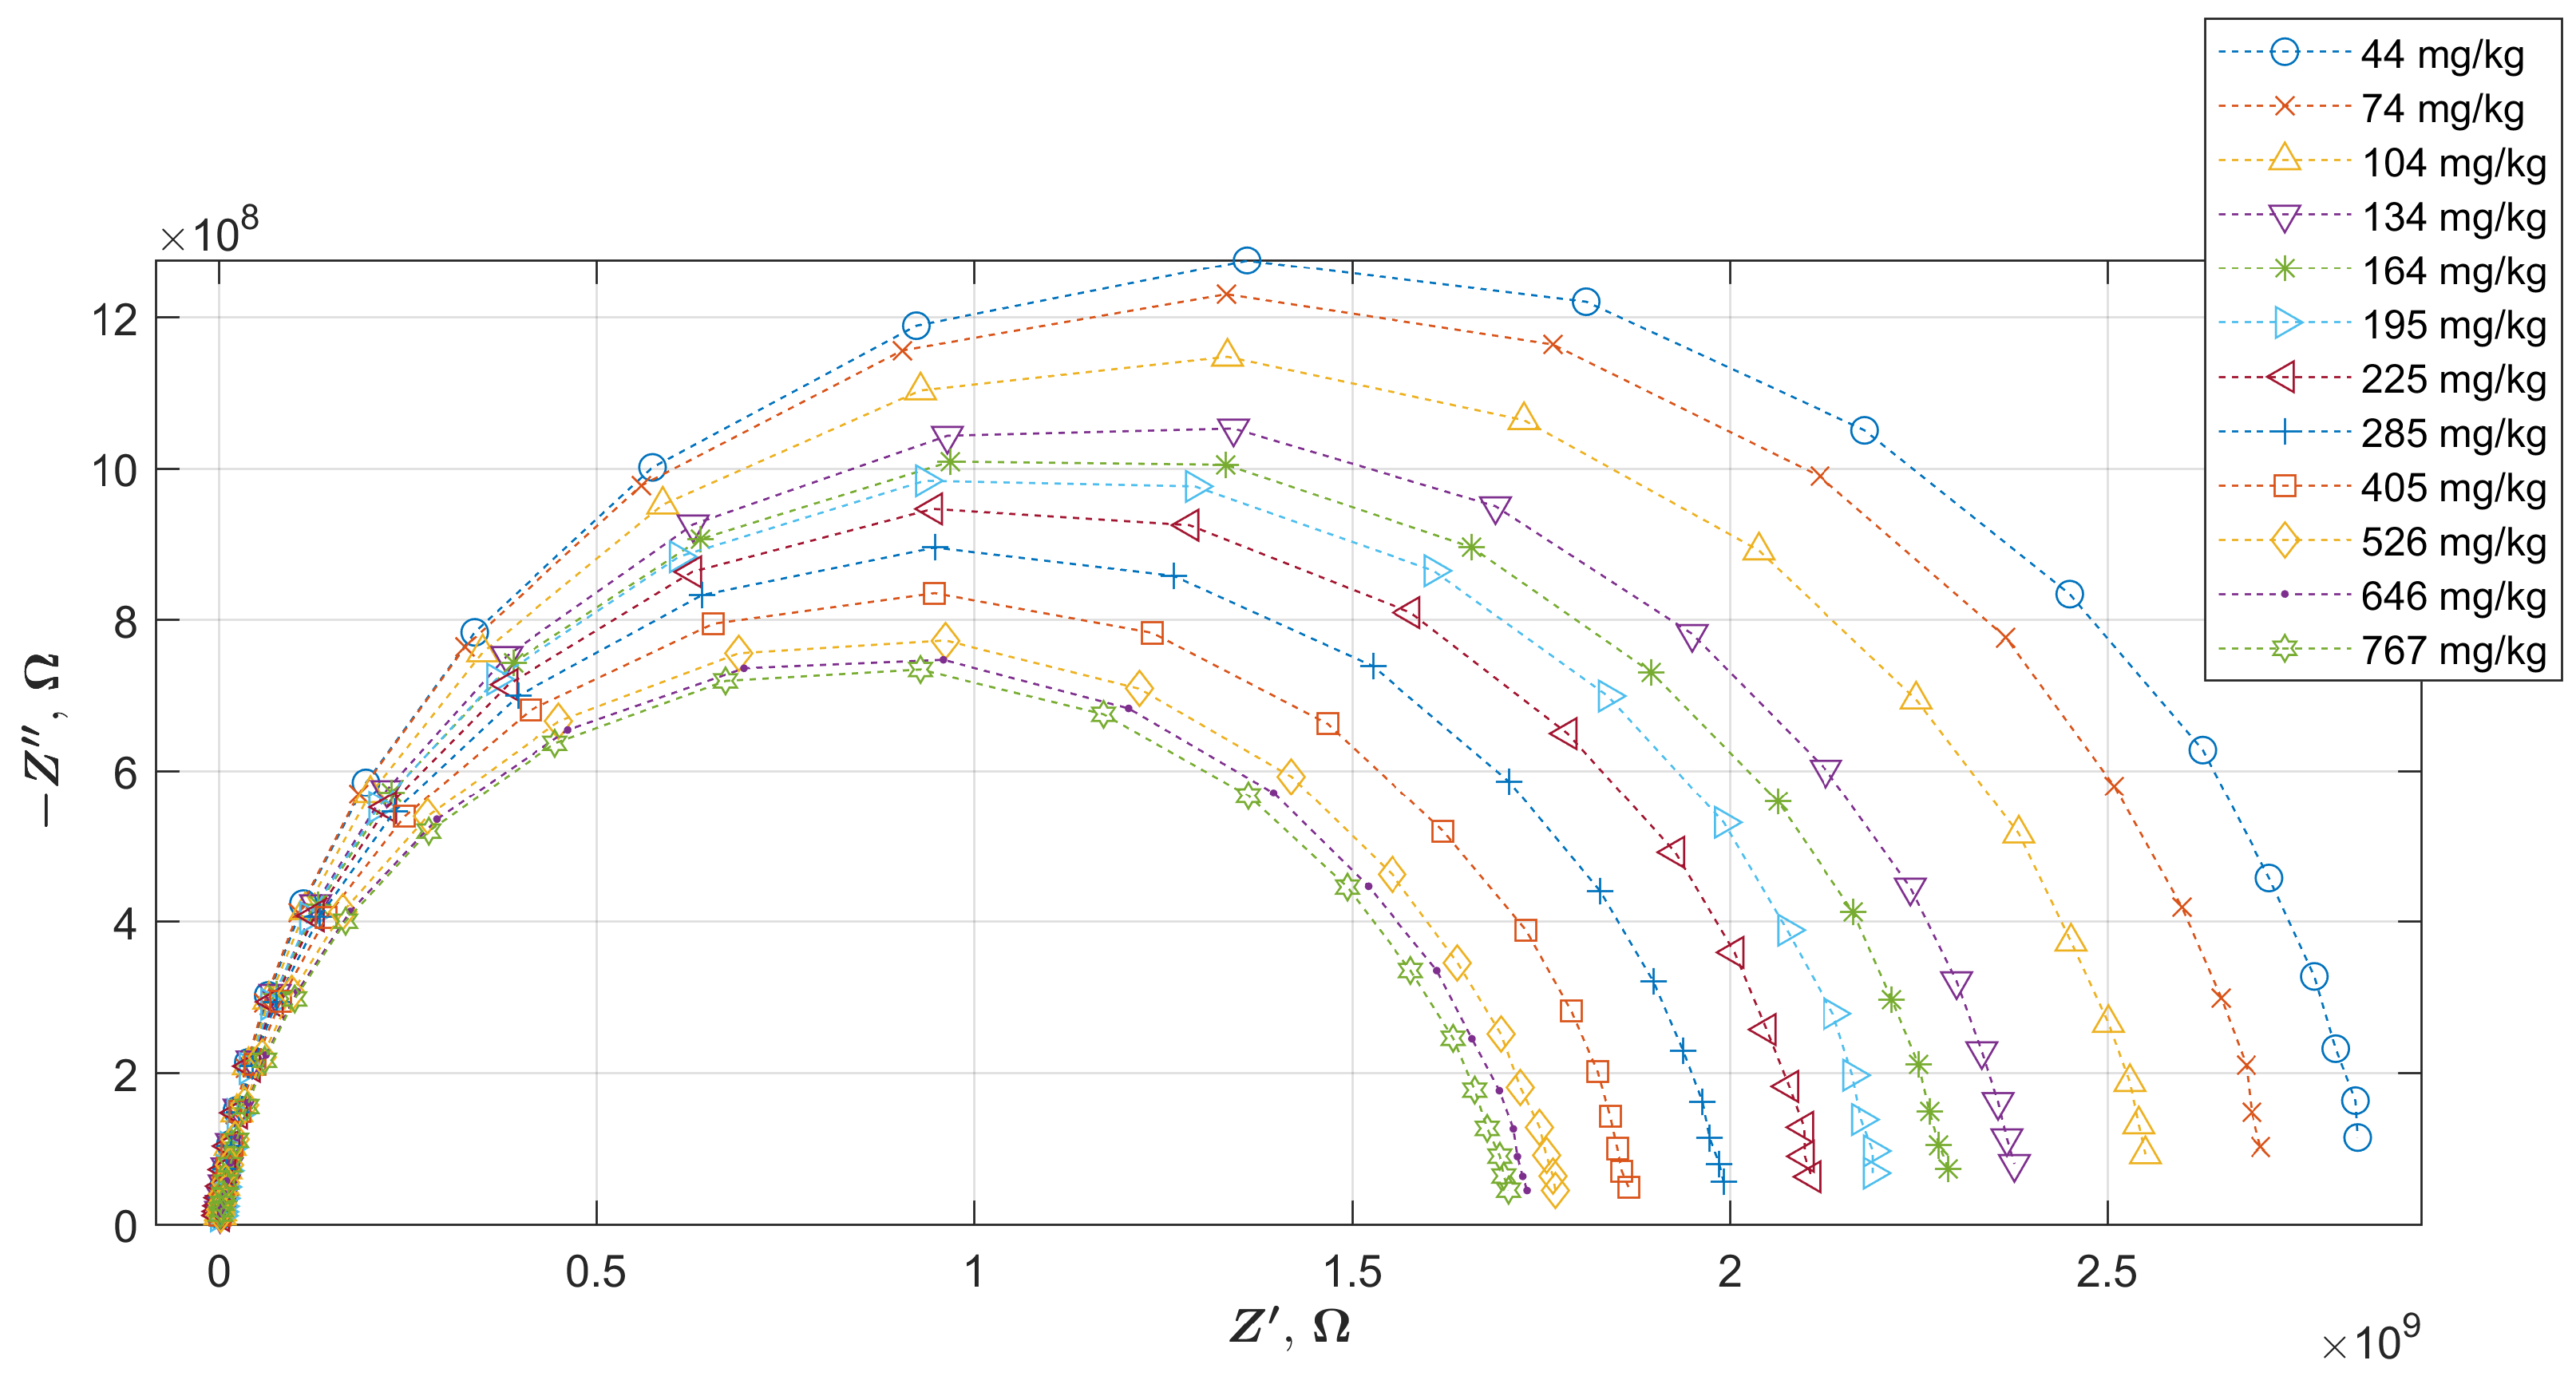
Numerous tests were carried out on diesel fuels doped with varying amounts of water. The results obtained varied but were within a certain range of values for the real and imaginary parts of the impedance. To make the measurements more readable, three impedance characteristics were chosen. These corresponded respectively to the oil with the smallest (sample A), medium (sample B), and largest (sample C) initial impedance modulus. It is worth noting at this point that no correlation was observed between the measured impedance values of diesel fuels and their type (summer, winter, transitional, regular, or premium). The results of impedance spectrum measurements of water-doped oils A, B, and C are shown in
Figure 2,
Figure A1, and
Figure A2, respectively. Figures and tables for B and C oils are shown in Appendices
Appendix A and
Appendix B to enhance the readability of this section.
The changes in the impedance of the samples seen in the graphs consist of a decrease in the diameters of the semicircles as the water content of the diesel increases. This behaviour was applicable for each of the diesel fuels tested. It is worth noting, however, that the changes in the impedance modulus are not directly proportional to the change in the resultant relative permittivity of the mixture thus formed.
In the field of electrochemical impedance spectroscopy (EIS), the values assigned to the elements of an equivalent circuit are determined by fitting these elements to the measured impedance values. Since oils generally exhibit dielectric properties, a parallel connection of a resistor and a capacitor is typically employed to model their electrical behaviour. However, this modelling approach leads to significant errors when oils are incorporated into mixtures such as diesel fuel or emulsions. This discrepancy arises primarily because such mixtures deviate from the strong dielectric characteristics that underpin the aforementioned simplistic circuit model. In EIS measurements, this deviation manifests as substantial variations in the measured electrical capacitance across the frequency spectrum, a phenomenon not observed in a genuine parallel resistor–capacitor (RC) circuit. The constant phase element offers a considerably more accurate representation of this variable capacitance behaviour compared to a standard capacitor. Consequently, the CPE is frequently incorporated alongside at least one resistor in studies investigating the electrical properties of oils [
18,
19,
20,
21,
28]. Changes in the electrical capacitance of the test samples as a function of measurement frequency also become apparent in the Nyquist diagrams in the form of reductions in the centres of the visible semicircles. This also confirms that using an EEC in the form of an RC circuit would result in large fitting errors.
Despite the lack of knowledge about the exact chemical composition of diesel in general, it was possible to assume the occurrence of phenomena that should take place in the samples tested, regardless of composition. It can be assumed with certainty that measuring electrodes immersed in diesel with a given water content form three separate phases: electrodes, oil, and water. The obtained impedance measurements of samples with different water contents in the Nyquist diagrams clearly form single semicircles. Given this observed shape of the characteristics, it is difficult to ascertain the values of the double-layer capacitances formed at the individual phase boundaries. With knowledge of the chemical composition, it would be possible to calculate their theoretical expected values. In the absence of knowledge of the composition, such calculations are pointless.
The main assumption that could be made, which does not require precise knowledge of the diesel composition, was that the interfacial zone consists of the processes of adsorption, diffusion, and charge transfer of oil additives used during production and contaminants acquired in the meantime—in this case, water—hence the need for elements in the electrical equivalent circuit that would correspond to these processes.
The electrical equivalent circuit used for the analyses does not contain separate elements corresponding to the phenomena of adsorption and diffusion. This variant, in the absence of a basis for assuming one of the pairs of elements, was not able to be fitted with an acceptable error for the individual elements.
Due to fundamental differences in terms of the water content analysed, the material tested, and the test methodology, the approach of the authors of publications on similar topics concerning the testing of the water content of biodiesel [
19] could not be adapted for the present study. The results obtained by the authors in measuring the impedance of the samples were different from those published primarily due to the lack of addition of a solvent to the diesel fuel, as well as the fact that they were testing an oil that contained a maximum of 7% FAME and was therefore not 30% biodiesel. Hence, any steps taken and shown could not be based on those already published.
Through many trials, the parallel connection of a CPE element with a resistor as EEC was chosen. Parameters describing the elements of the electrical equivalent circuit were fitted using the aforementioned pyZwx software [
29]. Each collected series of measurements was analysed using the Z-HIT method to exclude erroneous measurements due, for example, to the instability of the test mixture. Discrepancies between the measurements and the calculated Hilbert transform values did not exceed the measurement error of the measurement system and were therefore fully acceptable. To assess the quality of the equivalent circuit fit, a reduced weighted coefficient
commonly used for this purpose was employed, with the weight being the measured impedance modulus. The coefficient values obtained were fully satisfactory for each diesel sample tested. Additionally, the fitting error of the individual parameters of the equivalent circuit was at a low level, not exceeding, in the worst case, 3% for the
Q value of the CPE element, which was always subject to the largest error, although still acceptable.
Table 1 shows the values of the fitted circuit parameters for the oil A samples, together with the associated circuit fitting errors, expressed by a value of
.
The largest apparent changes concern the parallel resistance
R in the circuit. The parameters of the CPE element, i.e.,
Q and
, do not seem to change their values as a function of the water content of the diesel. The fit of the circuit for this dataset was very good, as can be seen from the small values of
, which took a value of 0.0001 in the worst case.
Table A1 and
Table A2 summarise the values of the EEC elements for samples B and C, respectively, in which the greatest changes are also seen for resistance
R.
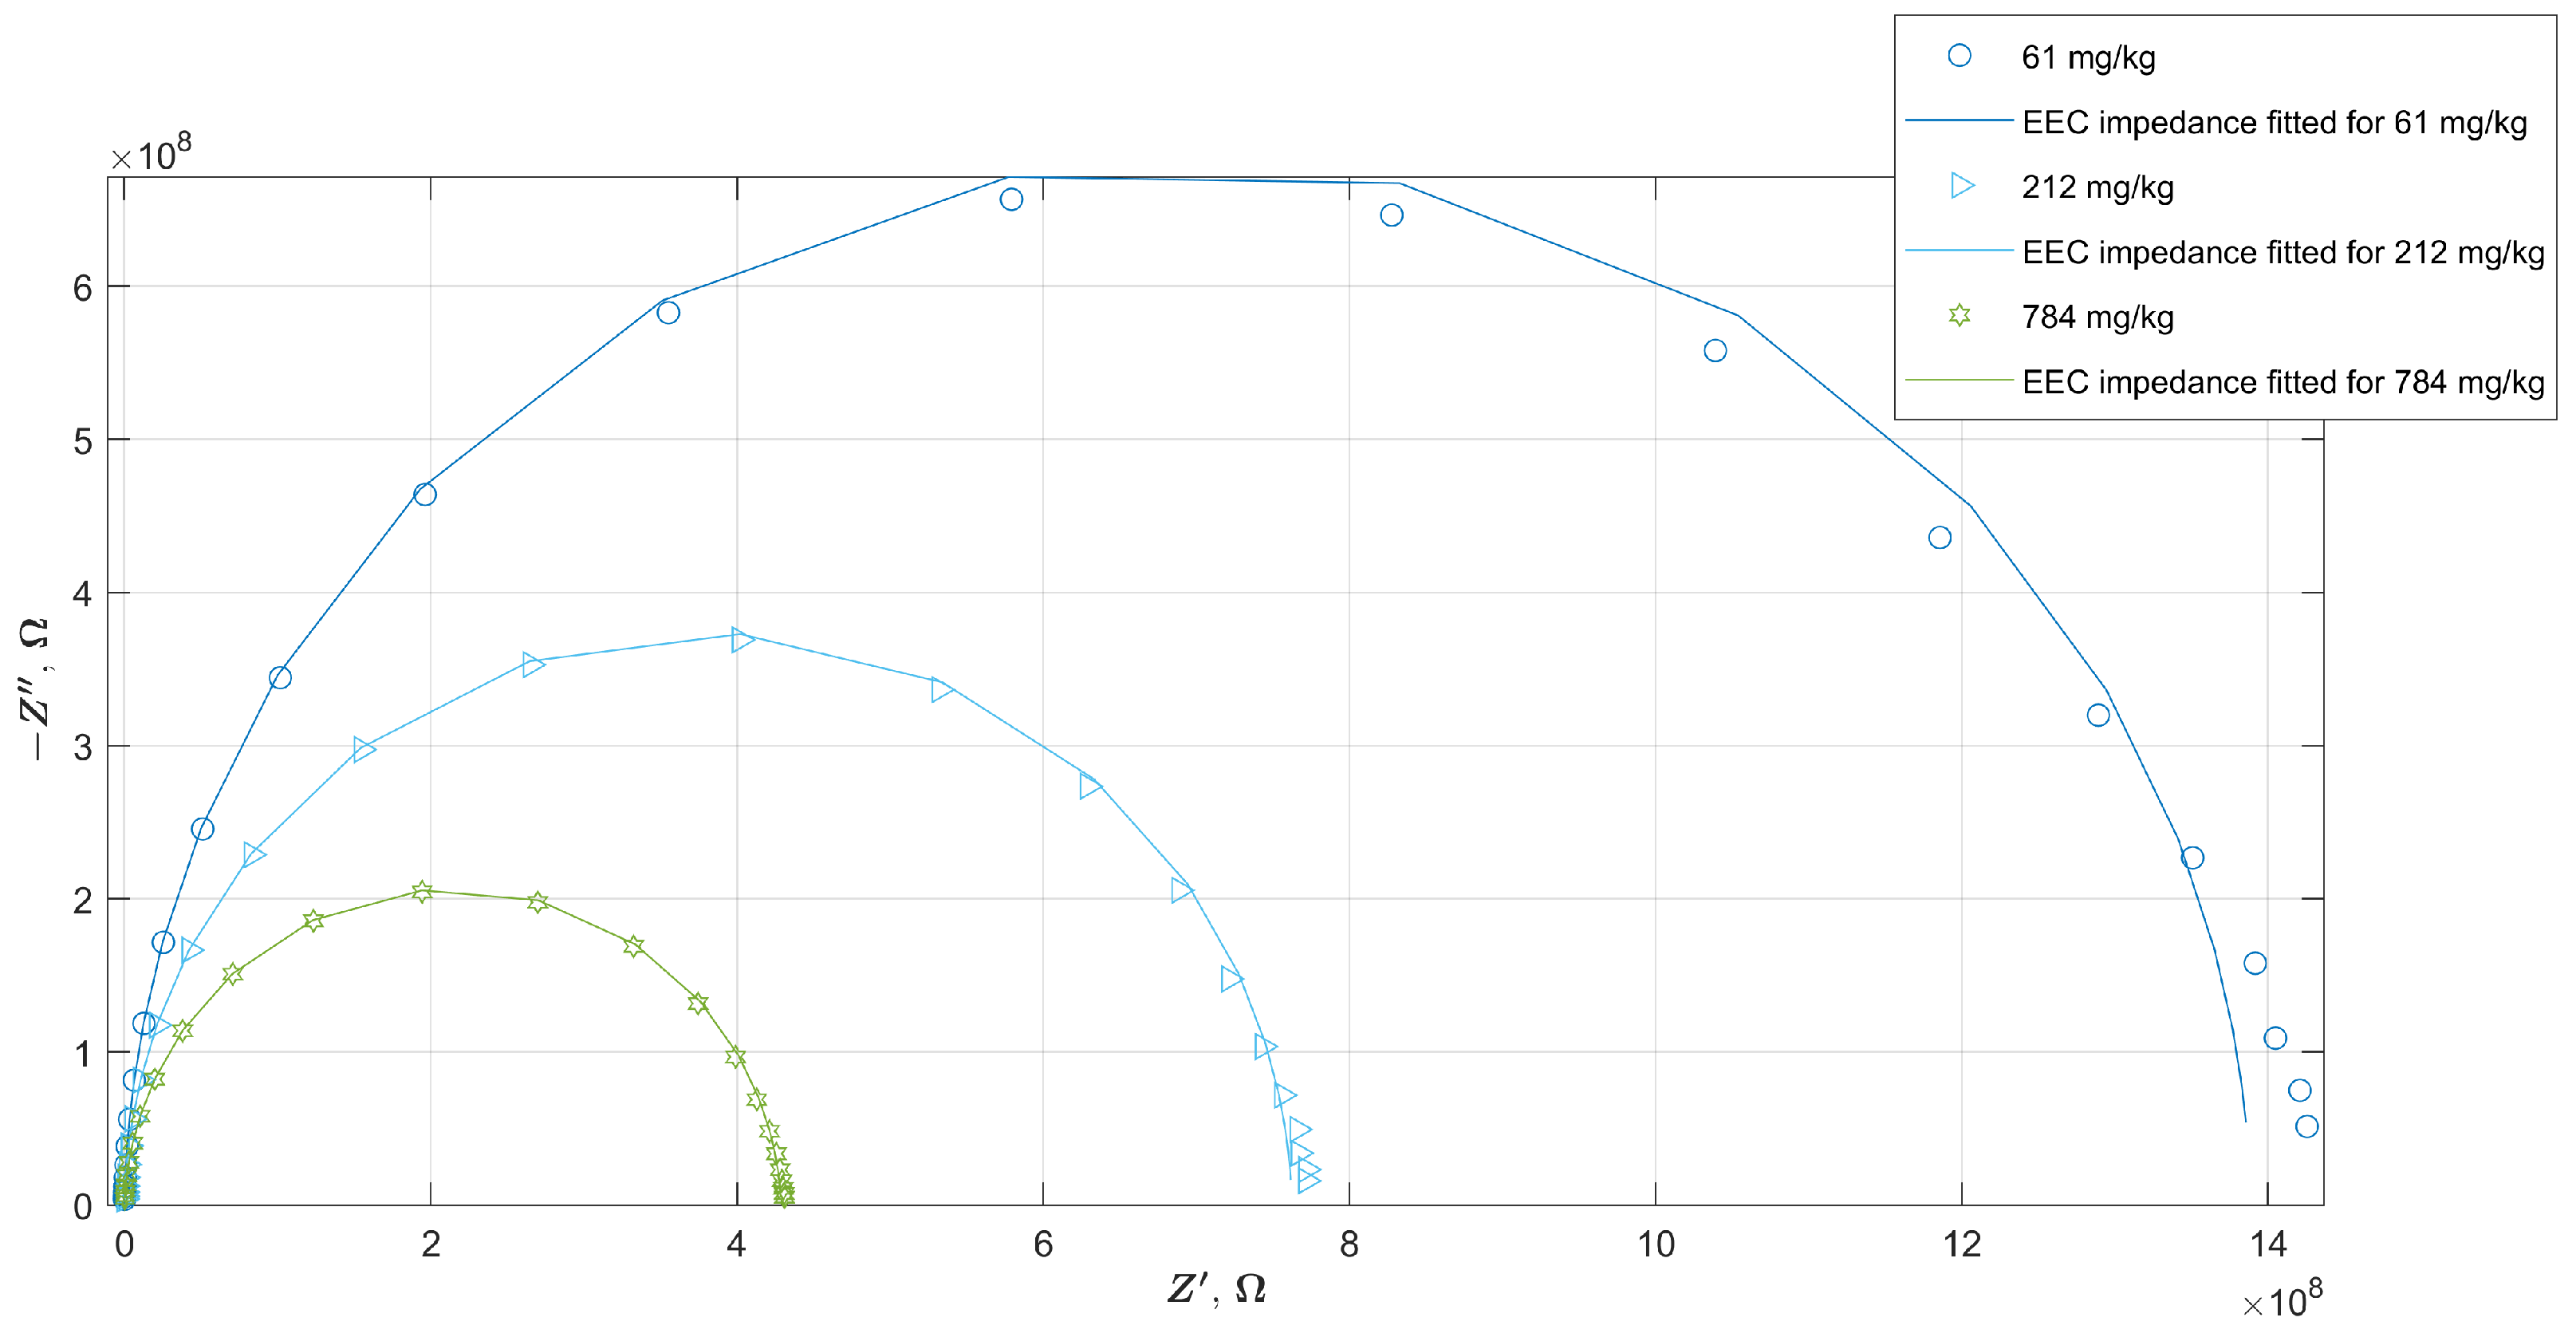
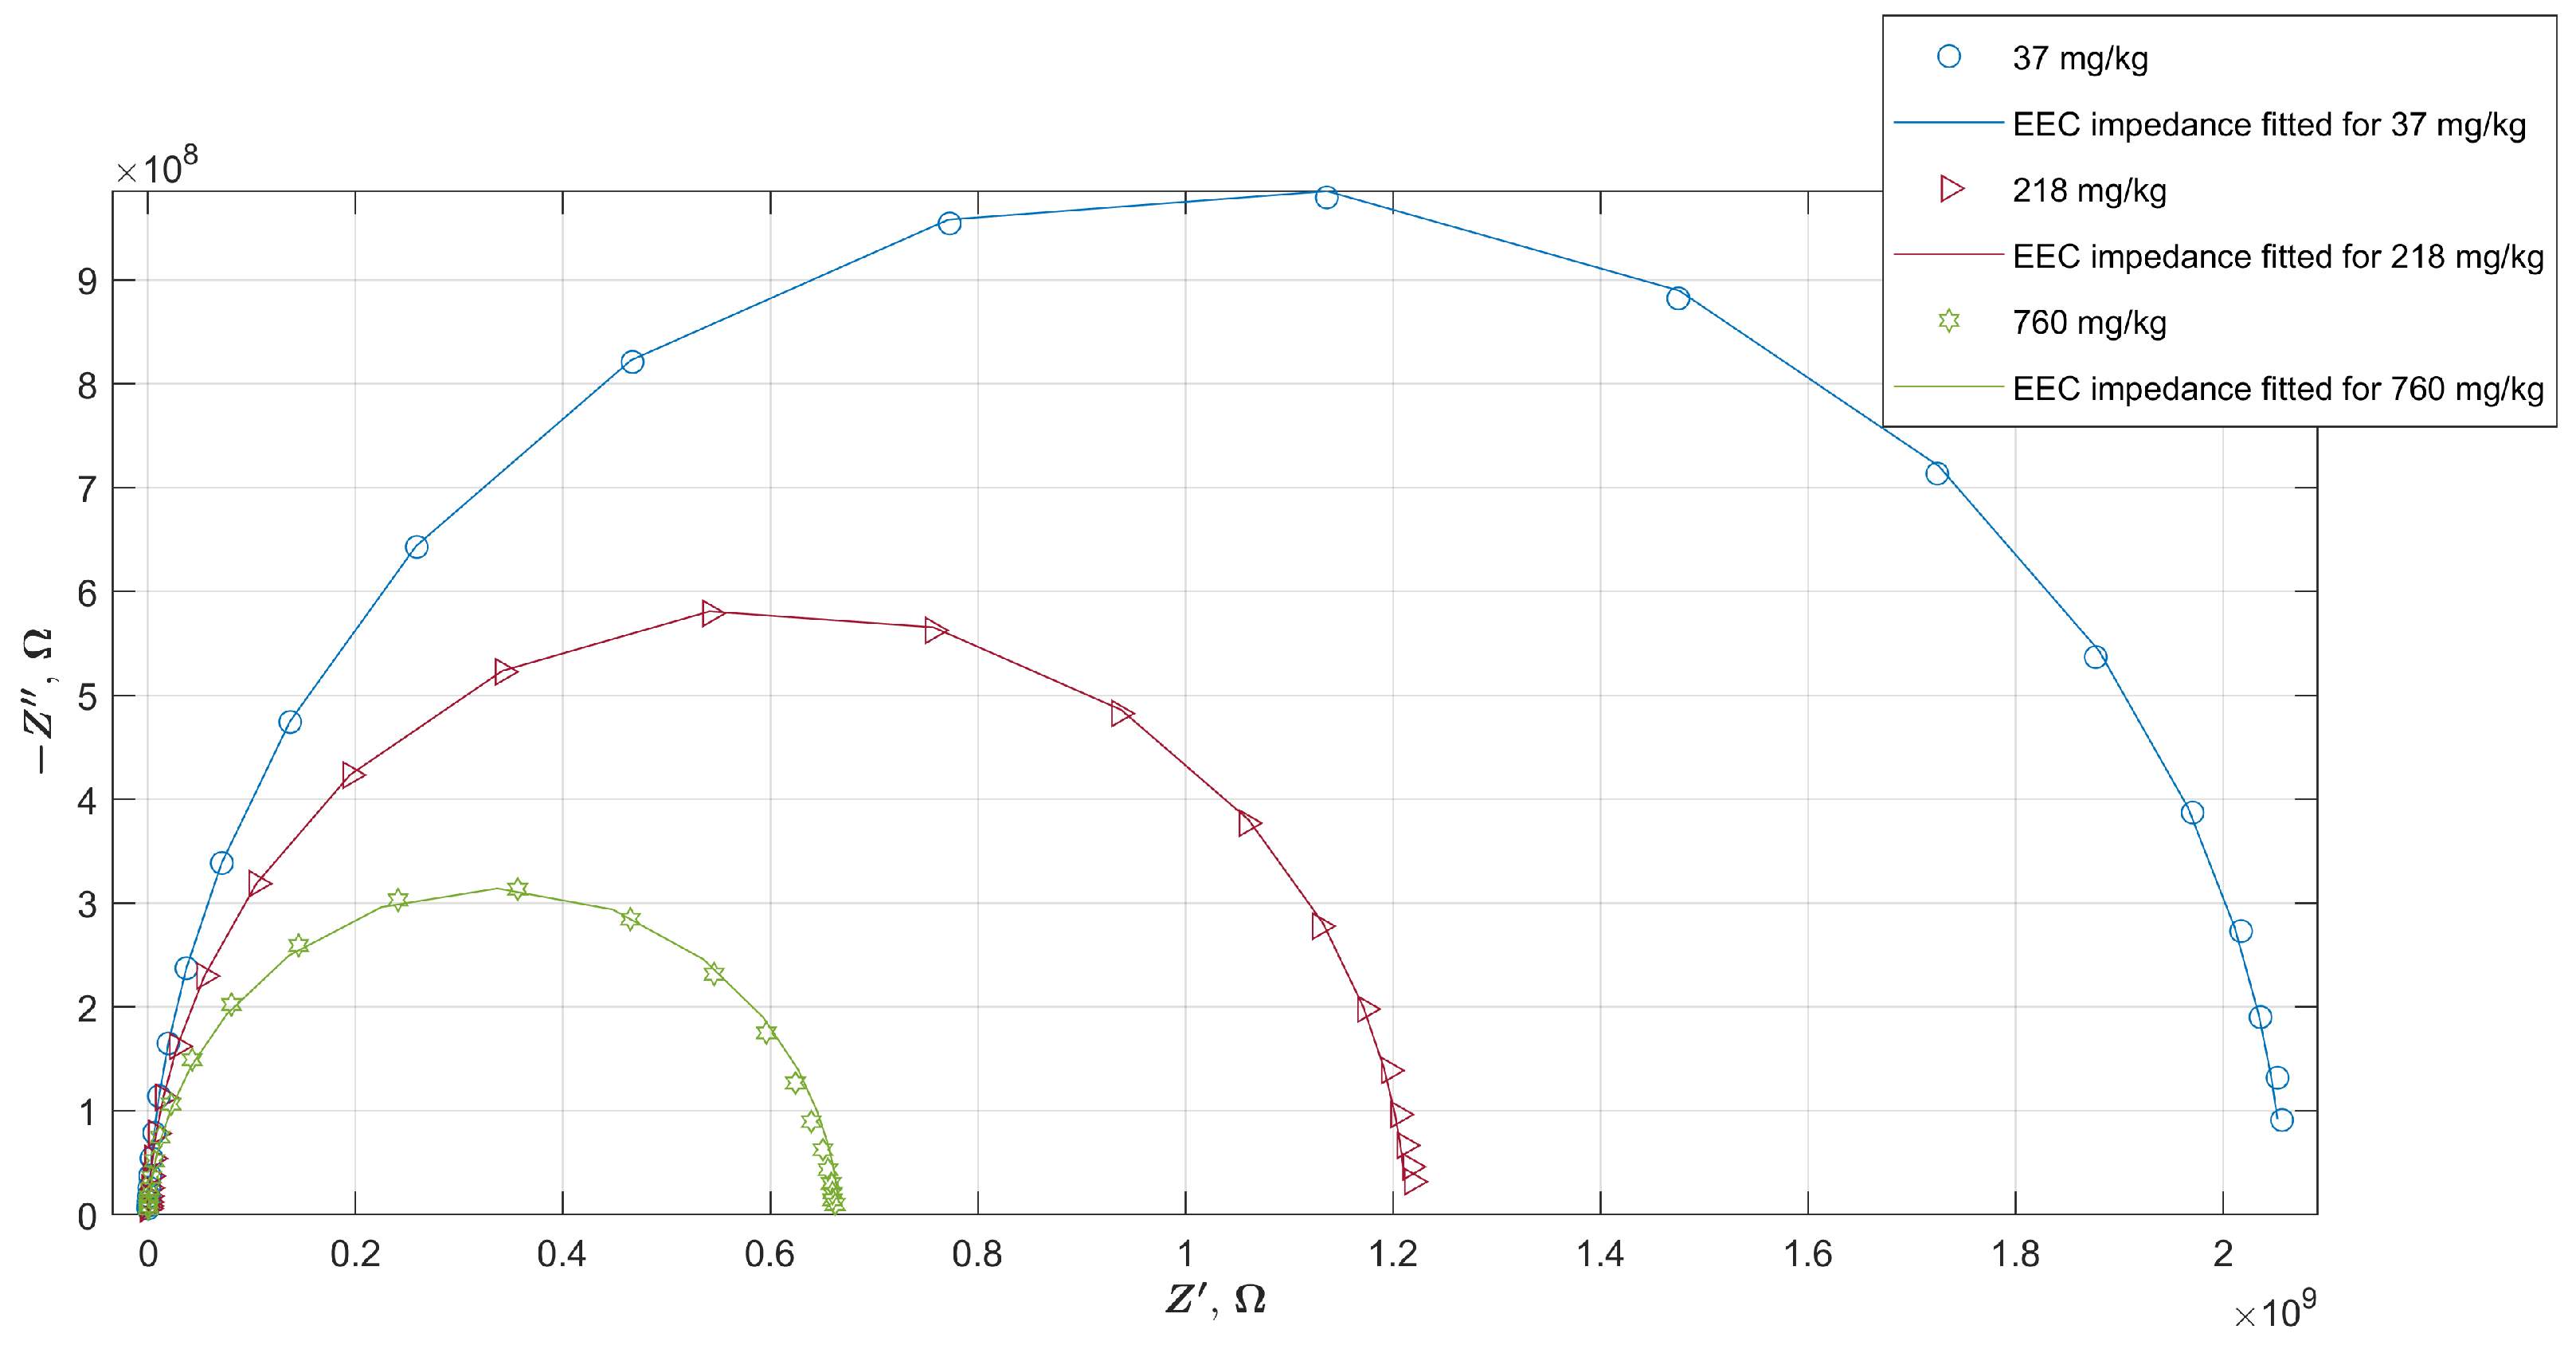
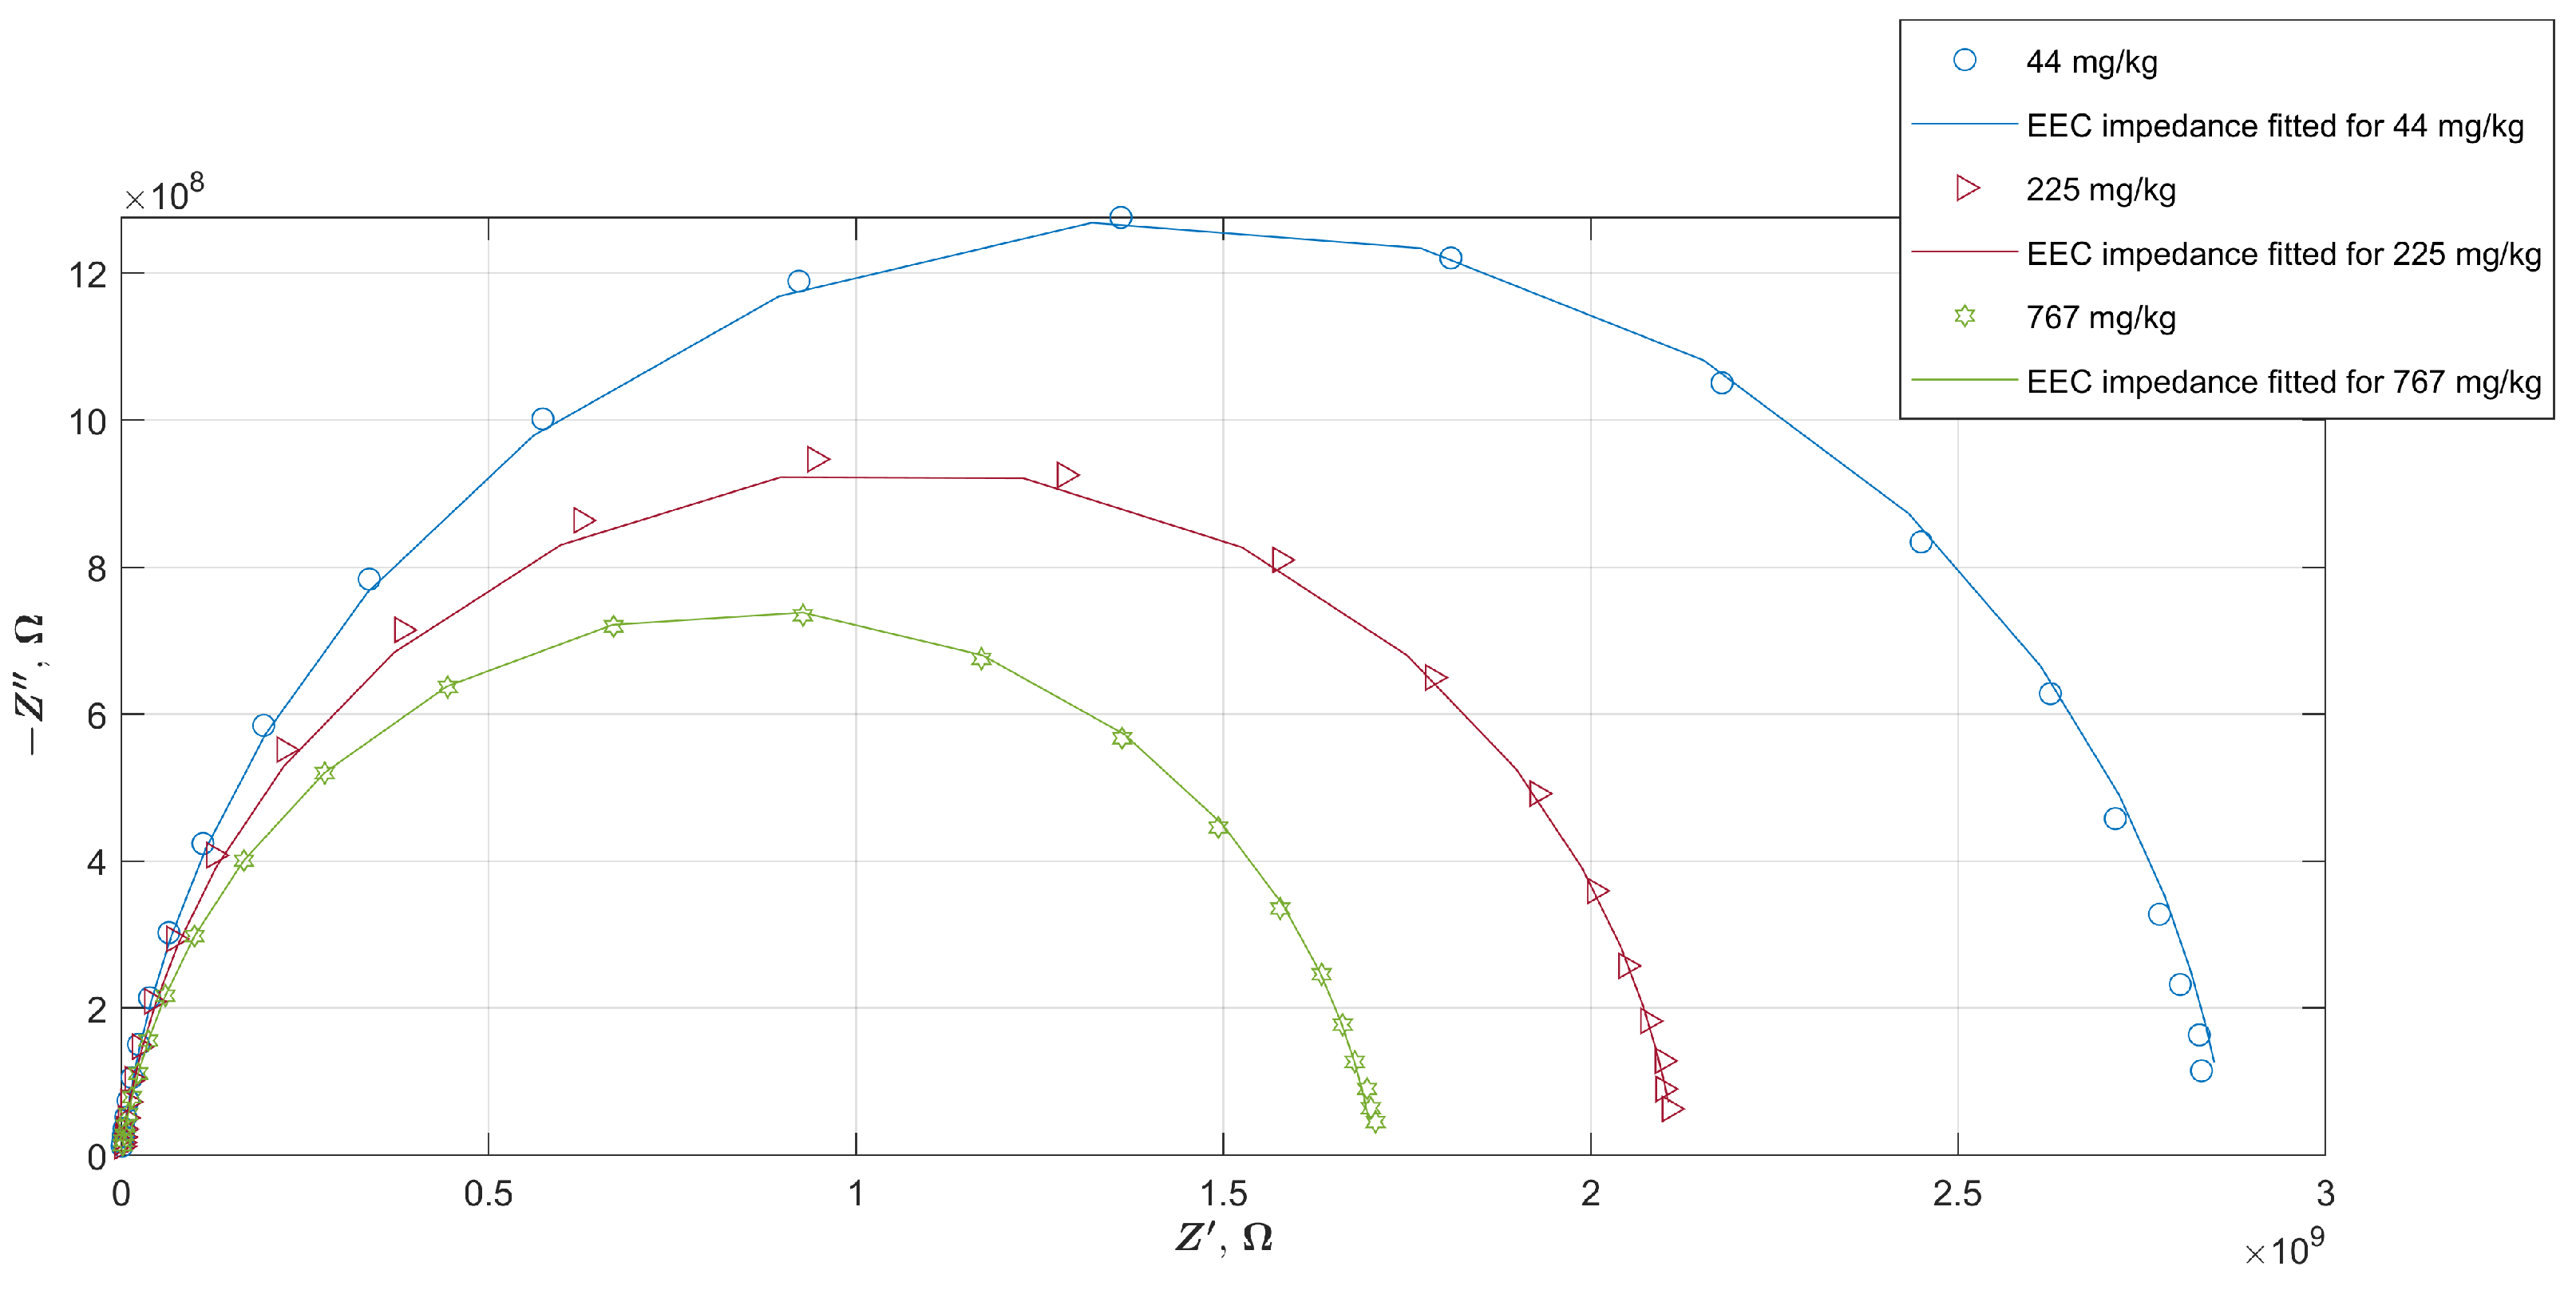
It sometimes happens that, despite the low numerical error of fitting the electrical parameters of the equivalent circuit to the experimental data, the plot of the calculated impedance of such a circuit does not match the measured data. In order to verify the consistency of the fitted results with the obtained measurement results, selected characteristics of the measured impedance values of the samples and the calculated impedance values of the EEC were compared. The selected measured impedance values and the characteristics of the fitted equivalent circuit, which are marked with solid lines, are shown in
Figure 3, in the form of a Nyquist plot. Additional diagrams (
Figure A3 and
Figure A4) show analogous summaries for samples B and C.
It is apparent that the impedance of water-contaminated diesels is very well mimicked by the proposed EEC in both the graphs and the numerical values tabulated. The values do not always lie exactly at the same points on the plane but nevertheless do not exceed the measurement error.
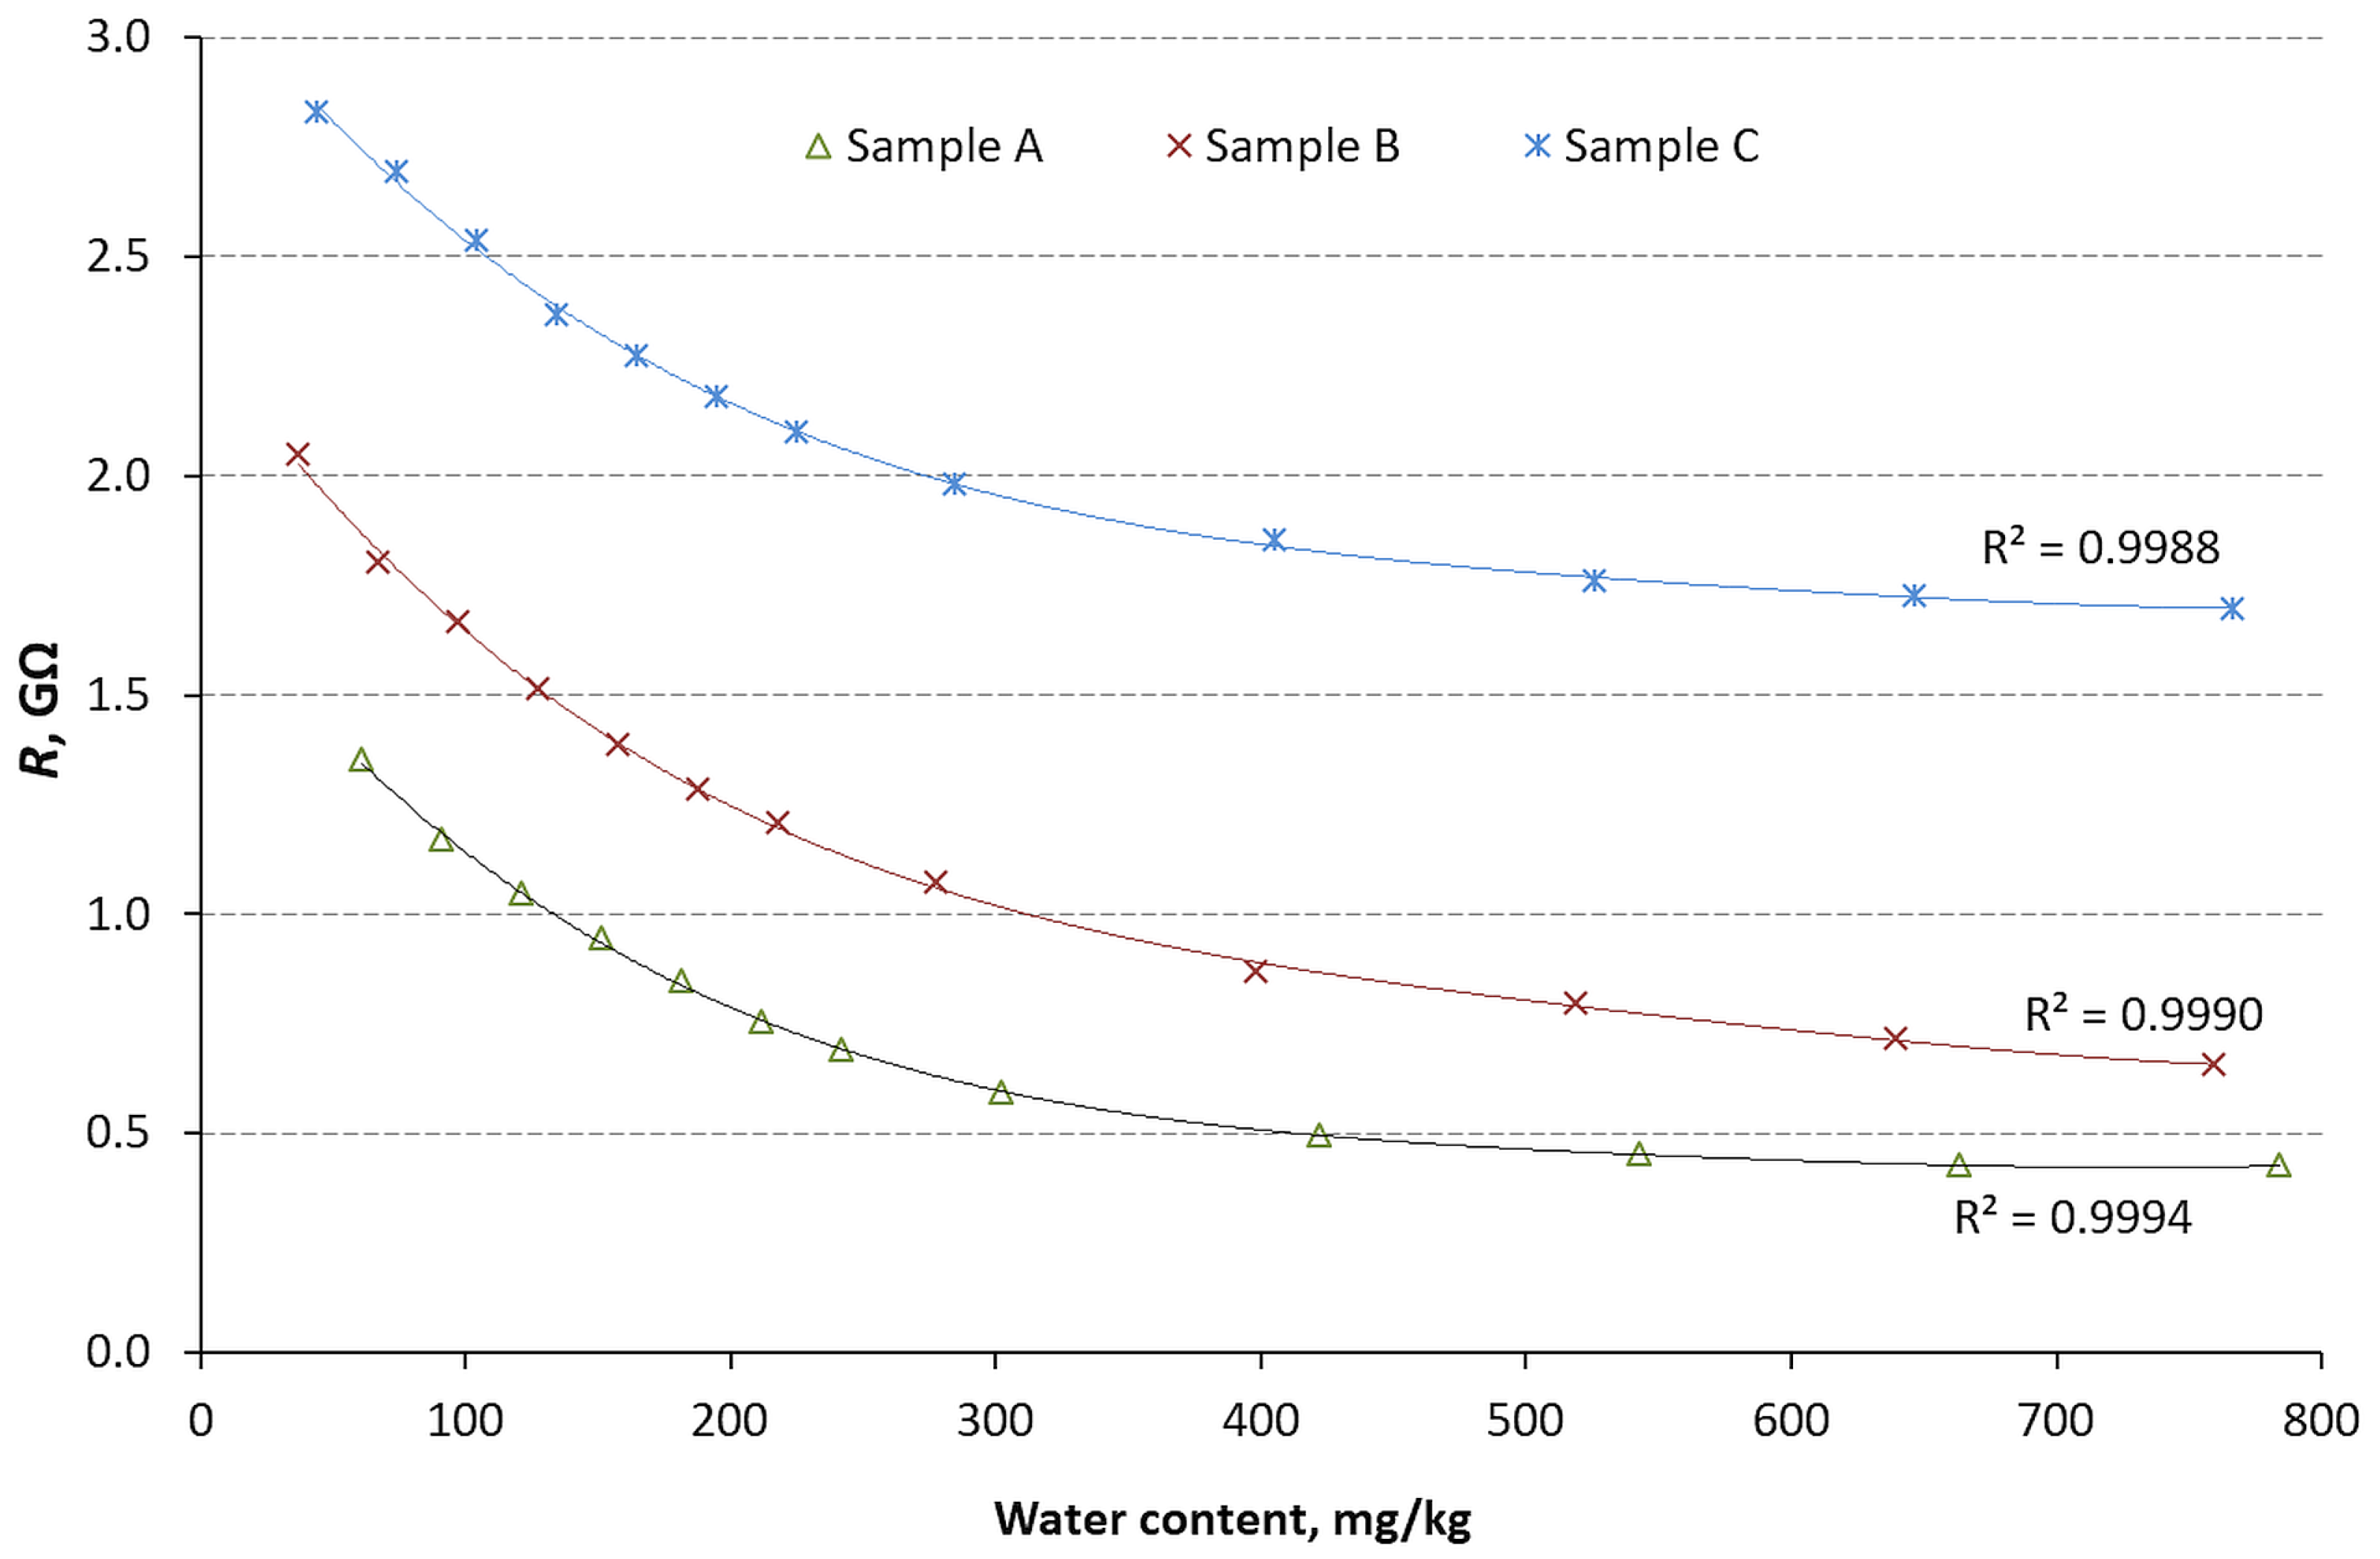
Given the largest recorded variation for resistance
R in the EEC as a function of water content, the calibration curves shown in
Figure 4 were based on this value. It is worth noting that the value of the calculated resistance
R of the equivalent circuit will be different from the measured diesel resistance. This is because of the existence of a CPE element in the EEC, which alters the resultant circuit resistance. In turn, the CPE element itself is a model of the electrochemical phenomena occurring in the diesel under test. Hence, the authors are of the opinion that fuel testing using the IS method better reflects the nature of the phenomena occurring in the sample, even despite the lack of detailed knowledge about these phenomena, because some of them can be assumed.
The curves were obtained by fitting the values of the expressions of a fourth-degree polynomial using the least-squares method. This relatively high degree of the polynomial was most consistent with the fitted values of
R over the range of water content investigated. The values of the expressions of the polynomials expressing
R as a function of water content (in mg/kg) for the individual oils are summarised in
Table 2. It also gives the coefficient of variation values for the individual expressions, which took values ranging from 5.31 to 19.77%. The coefficient of determination
R2 of the curves was very high and for oils A to C and was, respectively, 0.9994, 0.9990, and 0.9988.
As the nature of the changes in the values of the individual expressions of the polynomials is random, the best way to obtain a single, common calibration curve for all the oils under study (including those not shown) is to determine the arithmetic means of the individual expressions. The calculation resulted in the
in Equation (
4):
where the variable
w is the water content of the diesel, expressed in mg/kg, and
is the value of the fitted resistance
R in the electrical equivalent circuit, expressed in
.
Estimating the water content of diesel fuels based on the test results shown so far can take several variants. In the case of a known (already prepared) calibration curve, it is possible to take a single impedance measurement in the specified frequency range, fit the resistance value R of the electrical equivalent circuit, and, based on this, solve the fourth-degree equation to estimate the water content of the test fuel.
In the absence of knowing the calibration curve, the estimation of water content can take place according to the following scenarios:
A first series of impedance measurements of the collected sample is made. A known, measured amount of water (
x) is then added, and a second series of impedance measurements is taken. The results obtained from both series are used to adjust the values of
and
, respectively. It is then possible to solve a system of two fourth-degree equations. This requires the assumption of the values of four of the five values of the expressions of the polynomial (
4);
A series of measurements are taken as above, plus another series after the test oil has been doped with additional water content (y). The results of the series of measurements can be used to adjust the values of , , and successively. Based on these, it is possible to solve a system of three fourth-degree equations, which requires assuming the values of three of the five expressions of the polynomial, and the values of w and two of the expressions of the polynomial are then sought;
A total of four series of impedance measurements of samples with different water contents are performed and, based on the results, a system of four fourth-degree equations is solved, assuming the value of two expressions of the polynomial;
Five series of impedance measurements are taken, and a system of five fourth-order equations is solved, assuming the value of one of the expressions of the polynomial;
Six series of measurements are taken and, based on the results, all the expressions of the polynomial are calculated, as well as the value w, which denotes the sought initial water content of the oil being tested.
The selection of assumed constant values for the expressions of the polynomial can be assisted by their coefficient of variation, as shown in
Table 2. The error in estimating water content using the described scenario depends on the divergence of the calibration curve of the oil being tested from that assumed to be a single, common curve (in this case described by Equation (
4)).
In the range up to 200 mg/kg initial water content and with three measurements of the impedance characteristics of the samples, the expected measurement error with the proposed method does not exceed the value of 60 mg/kg in the tested diesels. This is a far from the precision of measurement in the Karl Fischer coulometric titration method, where the peak of precision is reached in the range of 50–100 mg/kg, at which it is ±0.3 mg/kg. Considering the relatively difficult measurement conditions in the form of lack of preliminary knowledge of the properties of the samples, the authors are of the opinion that the achieved precision for the determination of water content in diesel fuels by the proposed method is sufficient for its development. At the same time, they demonstrate that the impedance spectroscopy method can be used to detect excess water content in unknown diesel fuel. Samples suspected of exceeding the water content could then be sent for further testing, using a reference method. The proposed method could therefore be used for preliminary and low-cost diesel quality analysis. This examination could take place at the filling station if a suitable portable IS measurement system were developed.
The method proposed in the study had an estimation error of 60 mg/kg. Smaller values (42 mg/kg) were only possible with selected oils, when performing four measurement runs and determining the equation coefficients from a system of four equations. However, due to the multitude of factors influencing the estimation error of water content, an assessment of the measurement uncertainty with the proposed method, including statistical and metrological analyses, were beyond the scope of this study. They constitute a separate research topic planned for the near future. The precision of the determination of the water content of unknown diesel is influenced by a great many factors, among which are the degree of the polynomial of the adopted calibration curve and the volume of water to be added to the fuel being tested. These are areas where further optimisation studies are certainly possible and necessary. Narrowing the tests to oils with more similar electrical properties would also have a great impact on the precision of the assessment obtained. This, however, would be difficult due to the lack of a priori knowledge of their properties. For example, the preparation of calibration curves ending with lower water contents than the 0.6‰ (v/v) tested could prove to be more beneficial to the measurement precision obtained. This could be due to other, simpler polynomials describing the curves. In the study presented here, such a large value was chosen because the authors’ preliminary tests showed that it was possible to mix it momentarily with the fuel during the operation of the fuel pump. This is therefore certainly one of the aspects that can be optimised. The authors plan to develop a prototype of a portable device that, based on the method described in the paper, would enable the measurement of the water content of diesel at filling stations. Such a device can be based on one of the commercially available integrated impedance converters, as well as a proprietary development of a phase-sensitive voltage measurement system.
The impedance values of the test fuel shown in the paper are closely related to the electrodes used for the study. The electrode geometry used could also be optimised to, for example, reduce the measured impedance modulus and thus reduce the metrological requirements of the target measurement system.
The test results presented should not be associated with any attempt by the authors to assess the quality of the fuels tested. Each of the samples tested met the requirements of EN 590 and were therefore equally fit for use. There is no evidence whatsoever that the impedance of the diesel is related to its performance. It was beyond the scope of this study to relate these two aspects.


