


The Applications of WFEM in the Exploration of Medium-Depth Geothermal Resources

 ,
,
Abstract
1. Introduction
2. Analysis of the Detection Capability of WFEM for Medium and Deep Targets
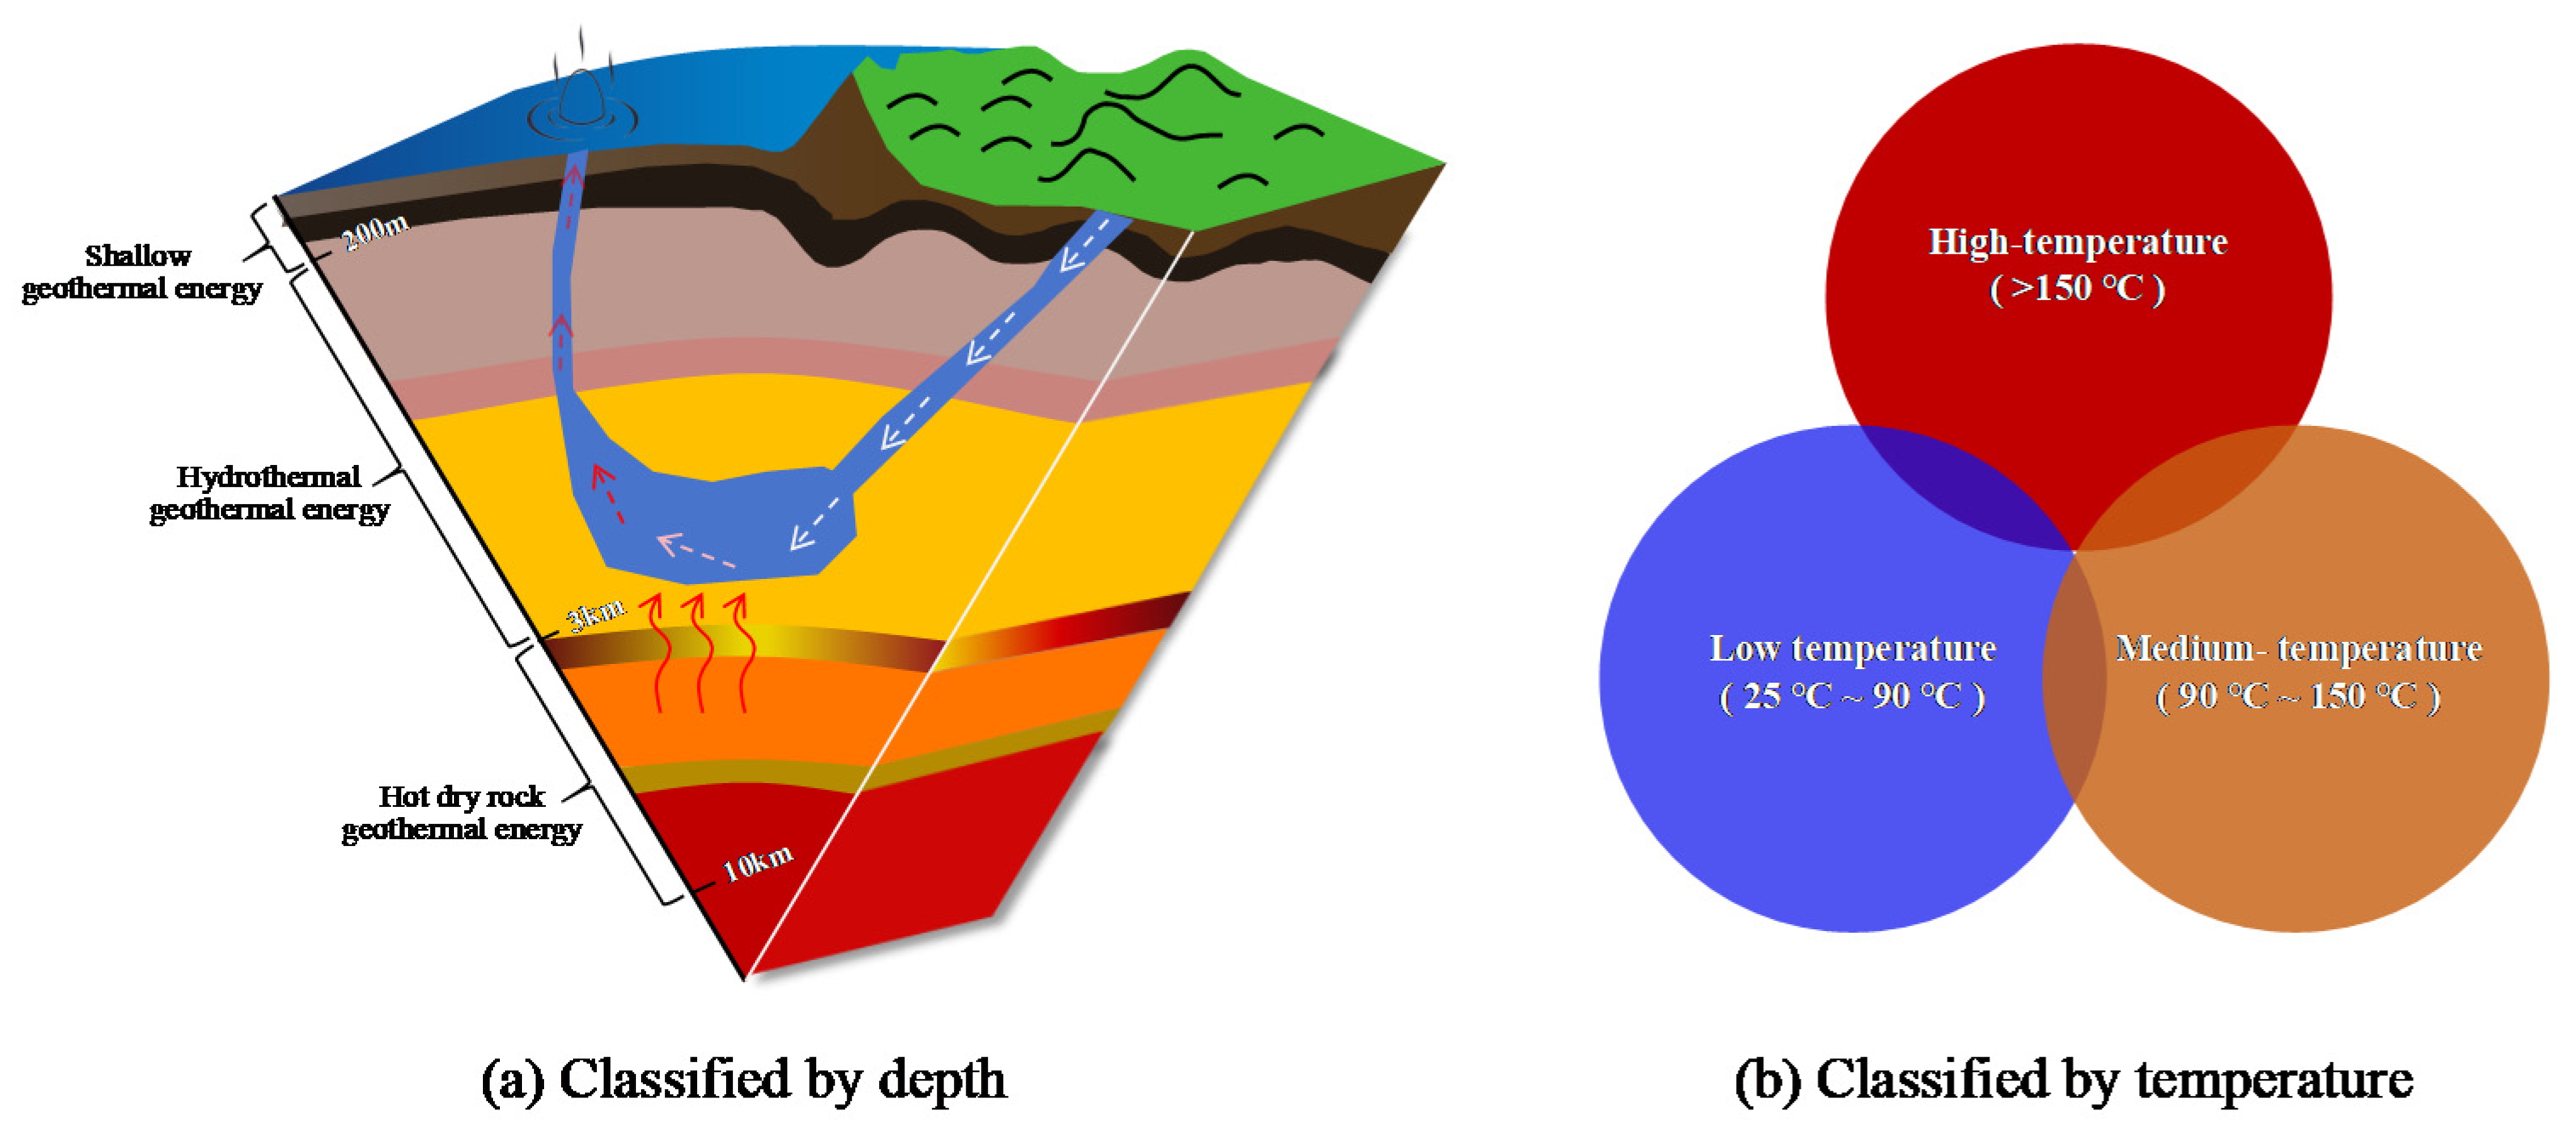
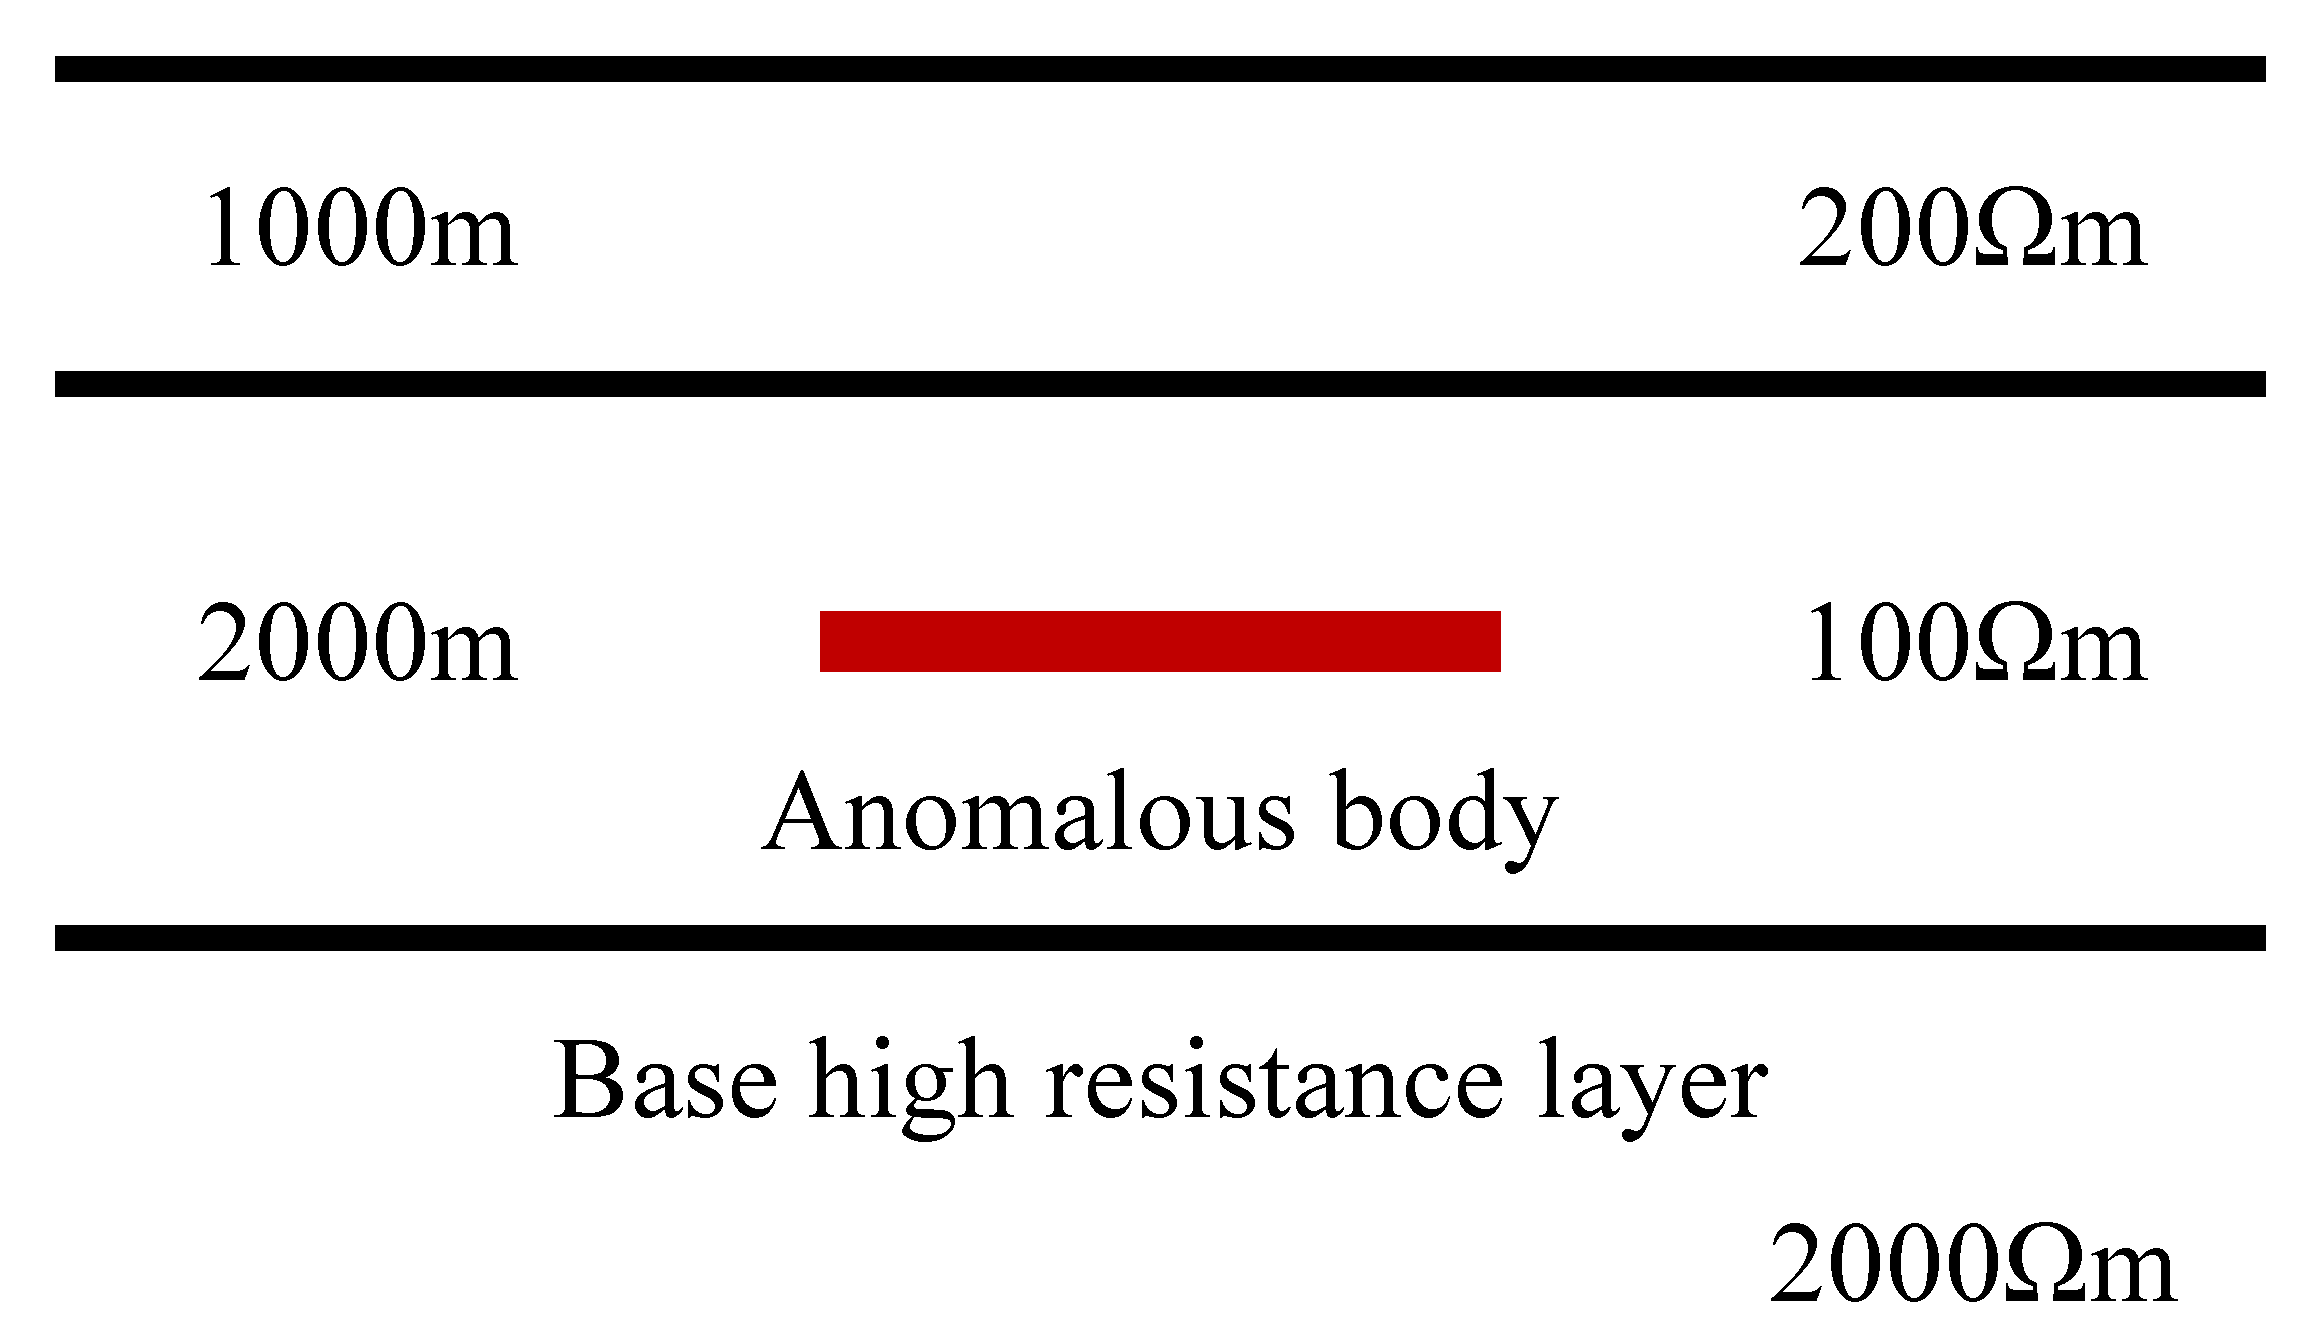
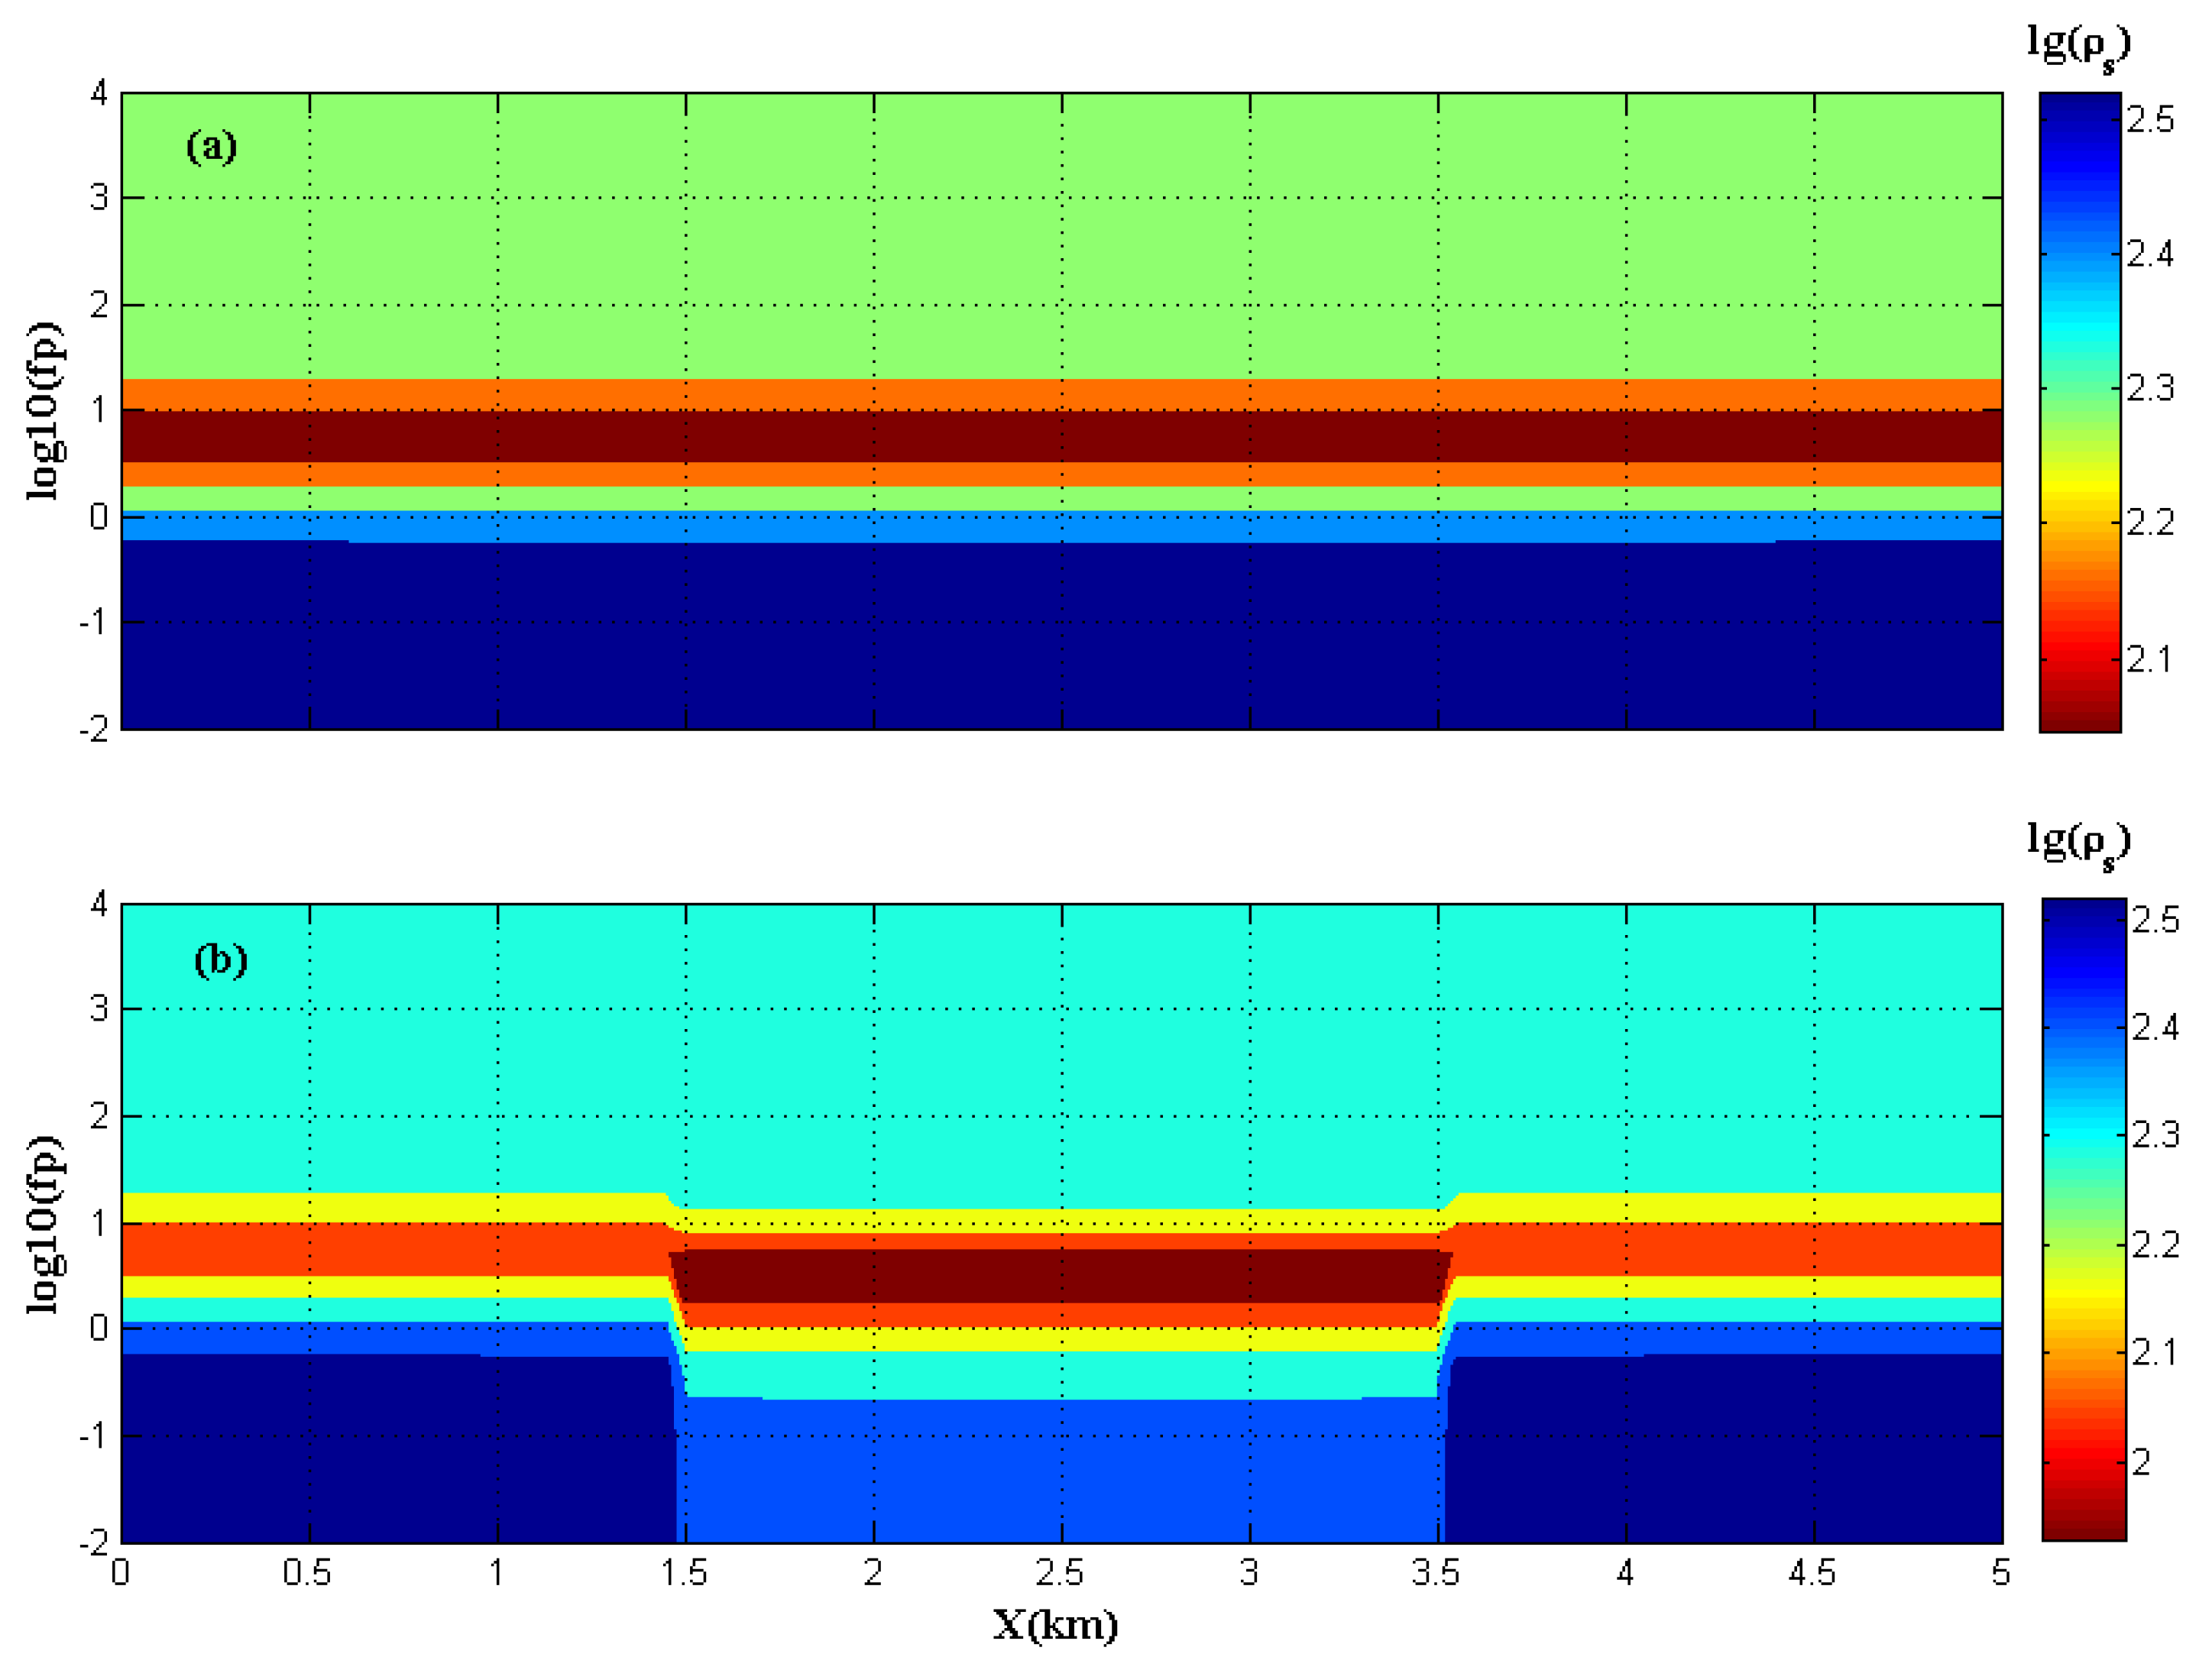
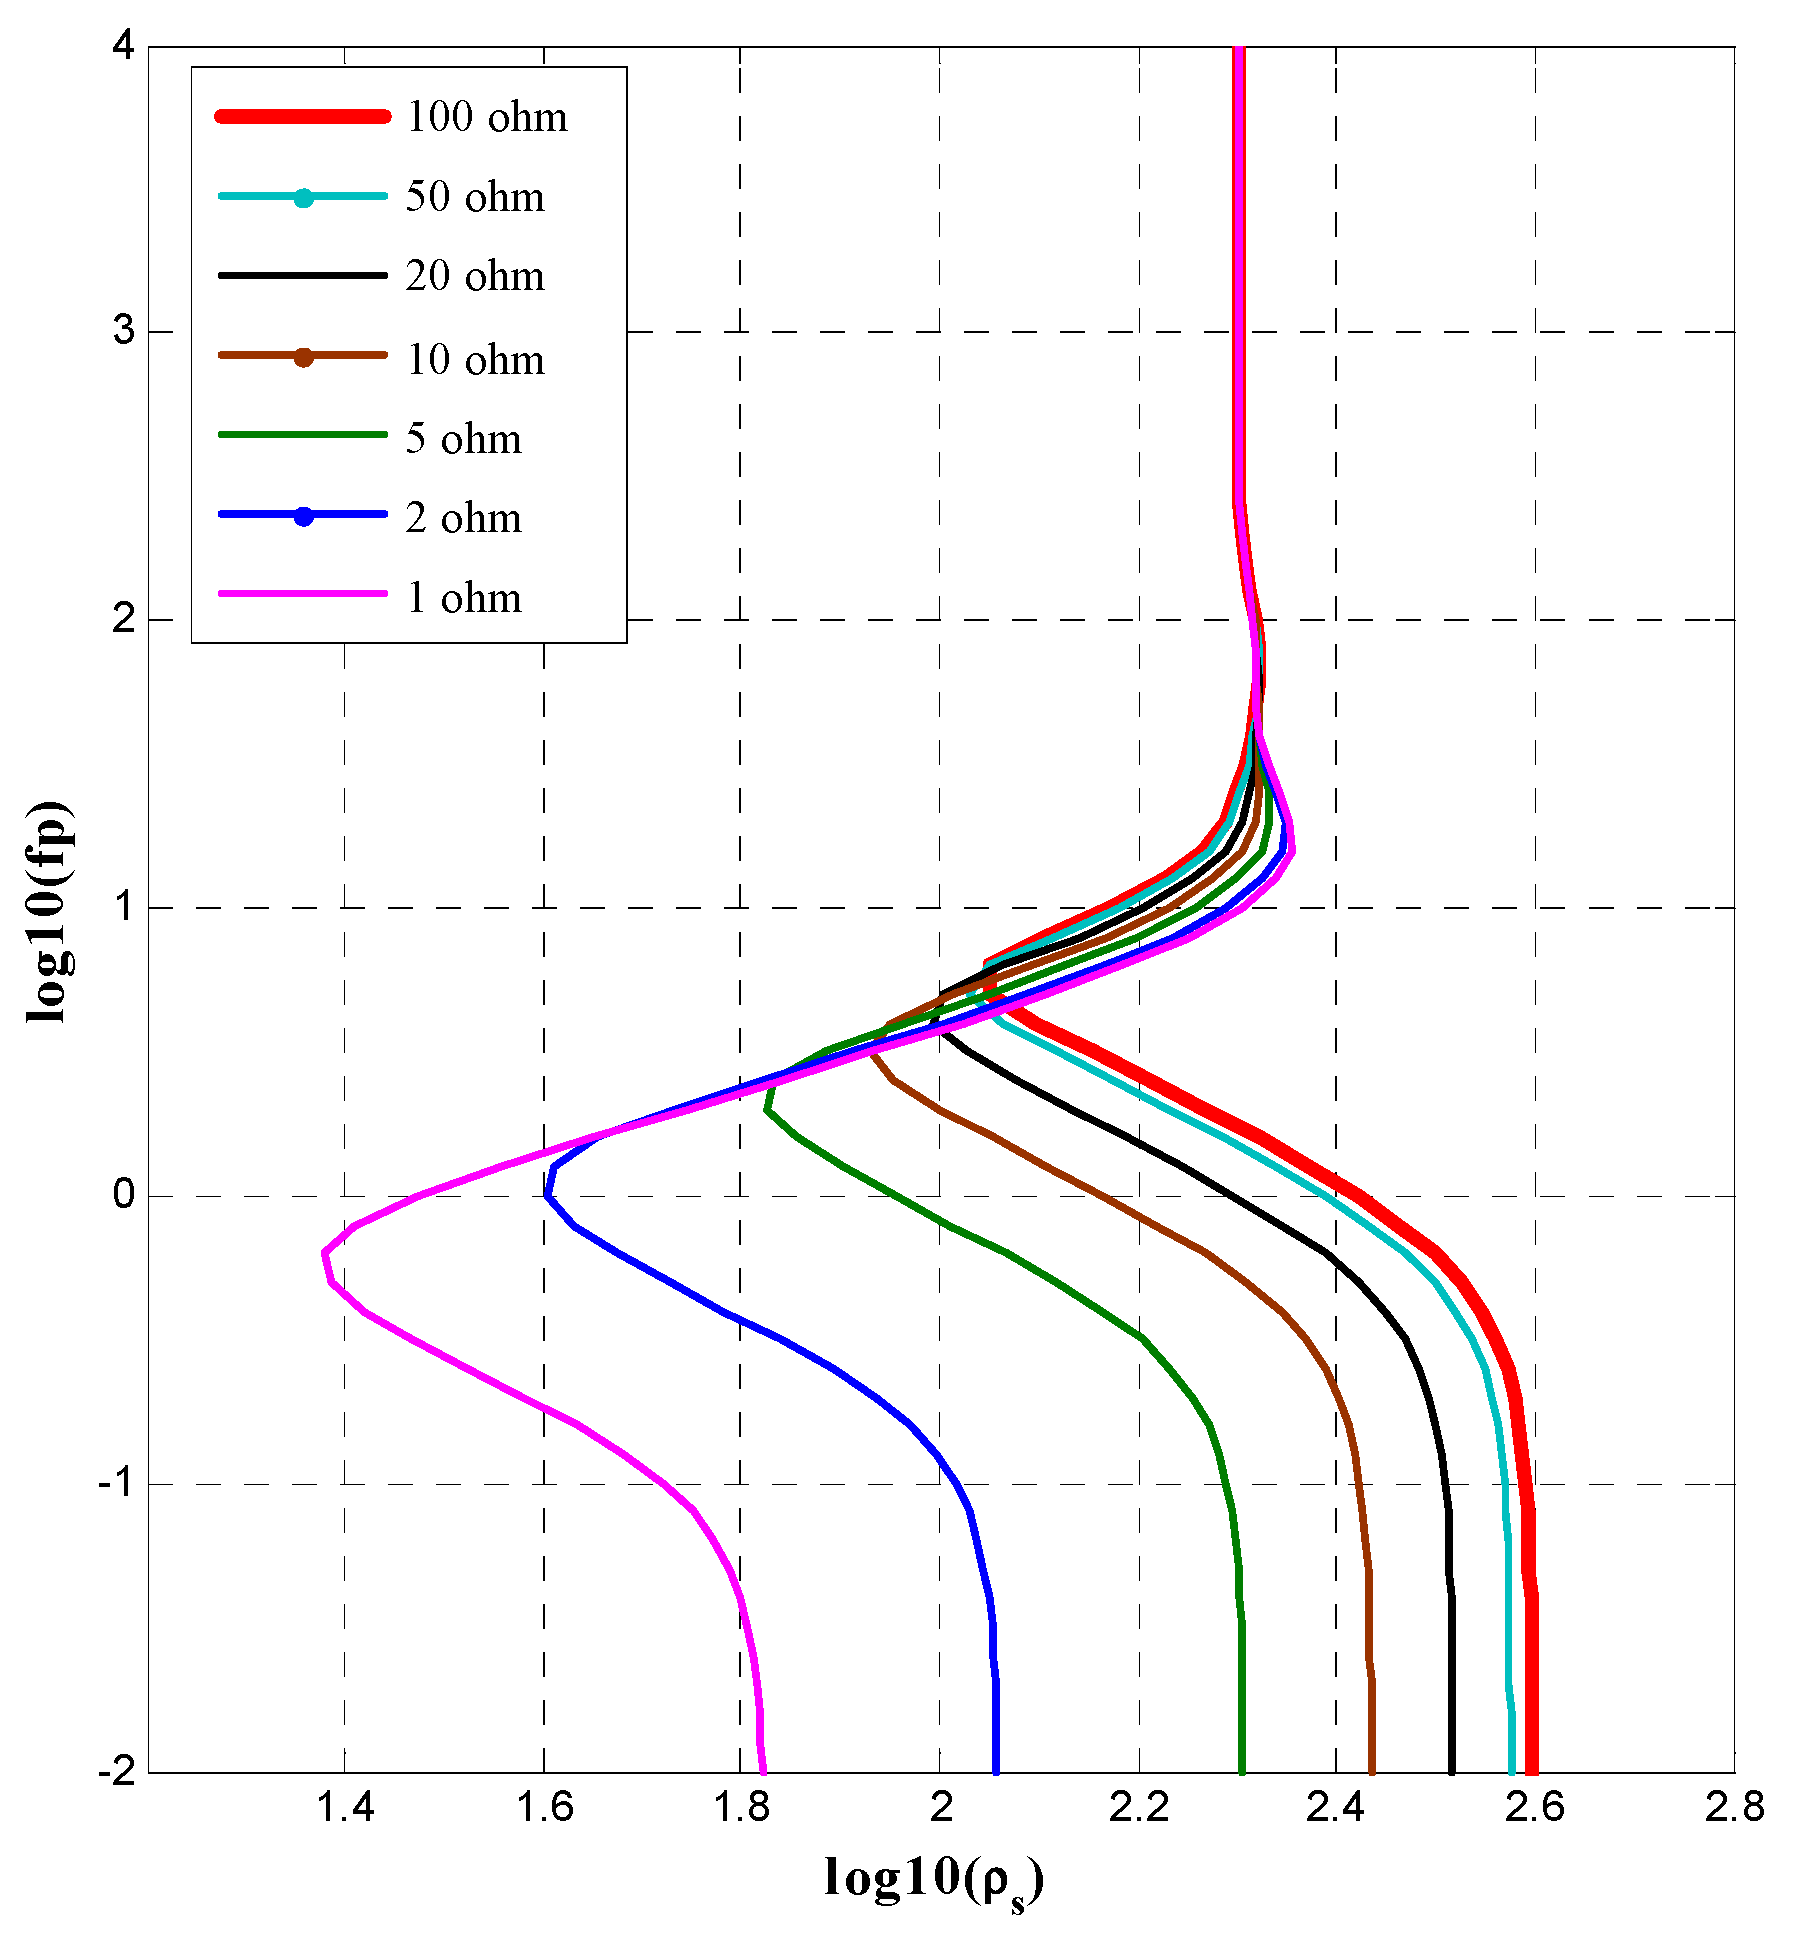
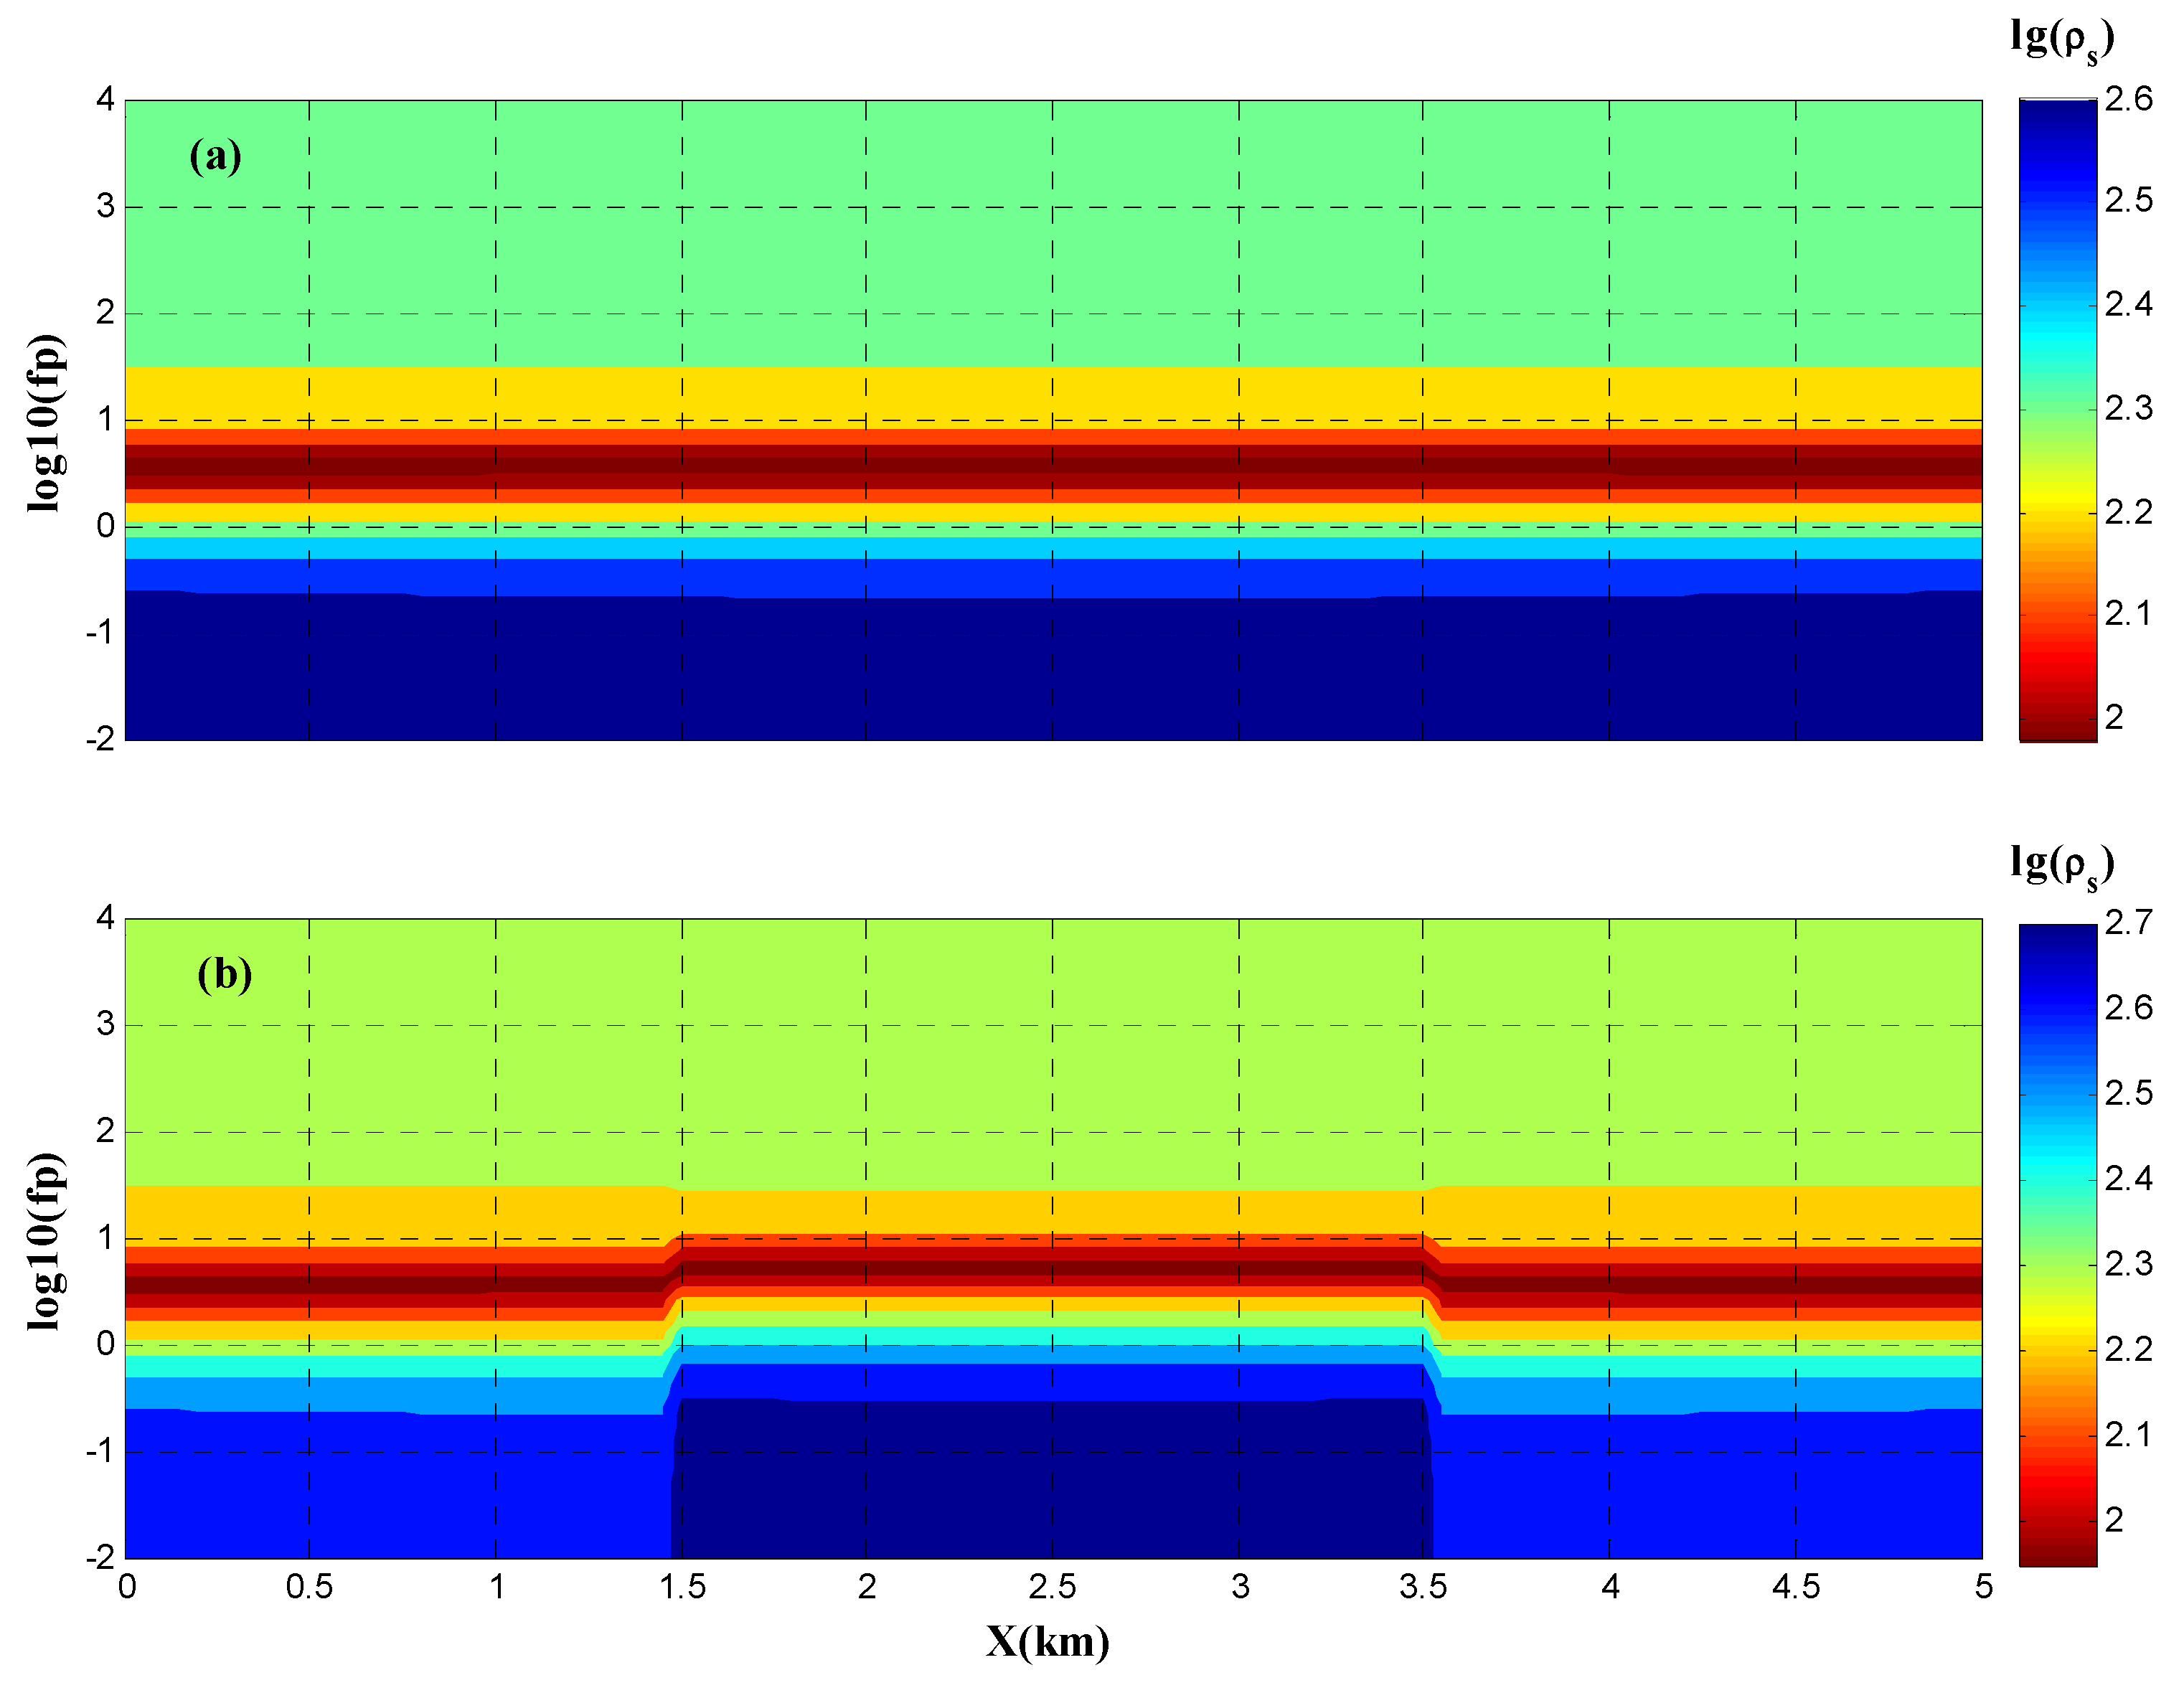
2.1. Analysis of the Detection Capabilities of Hydrothermal Geothermal Resources
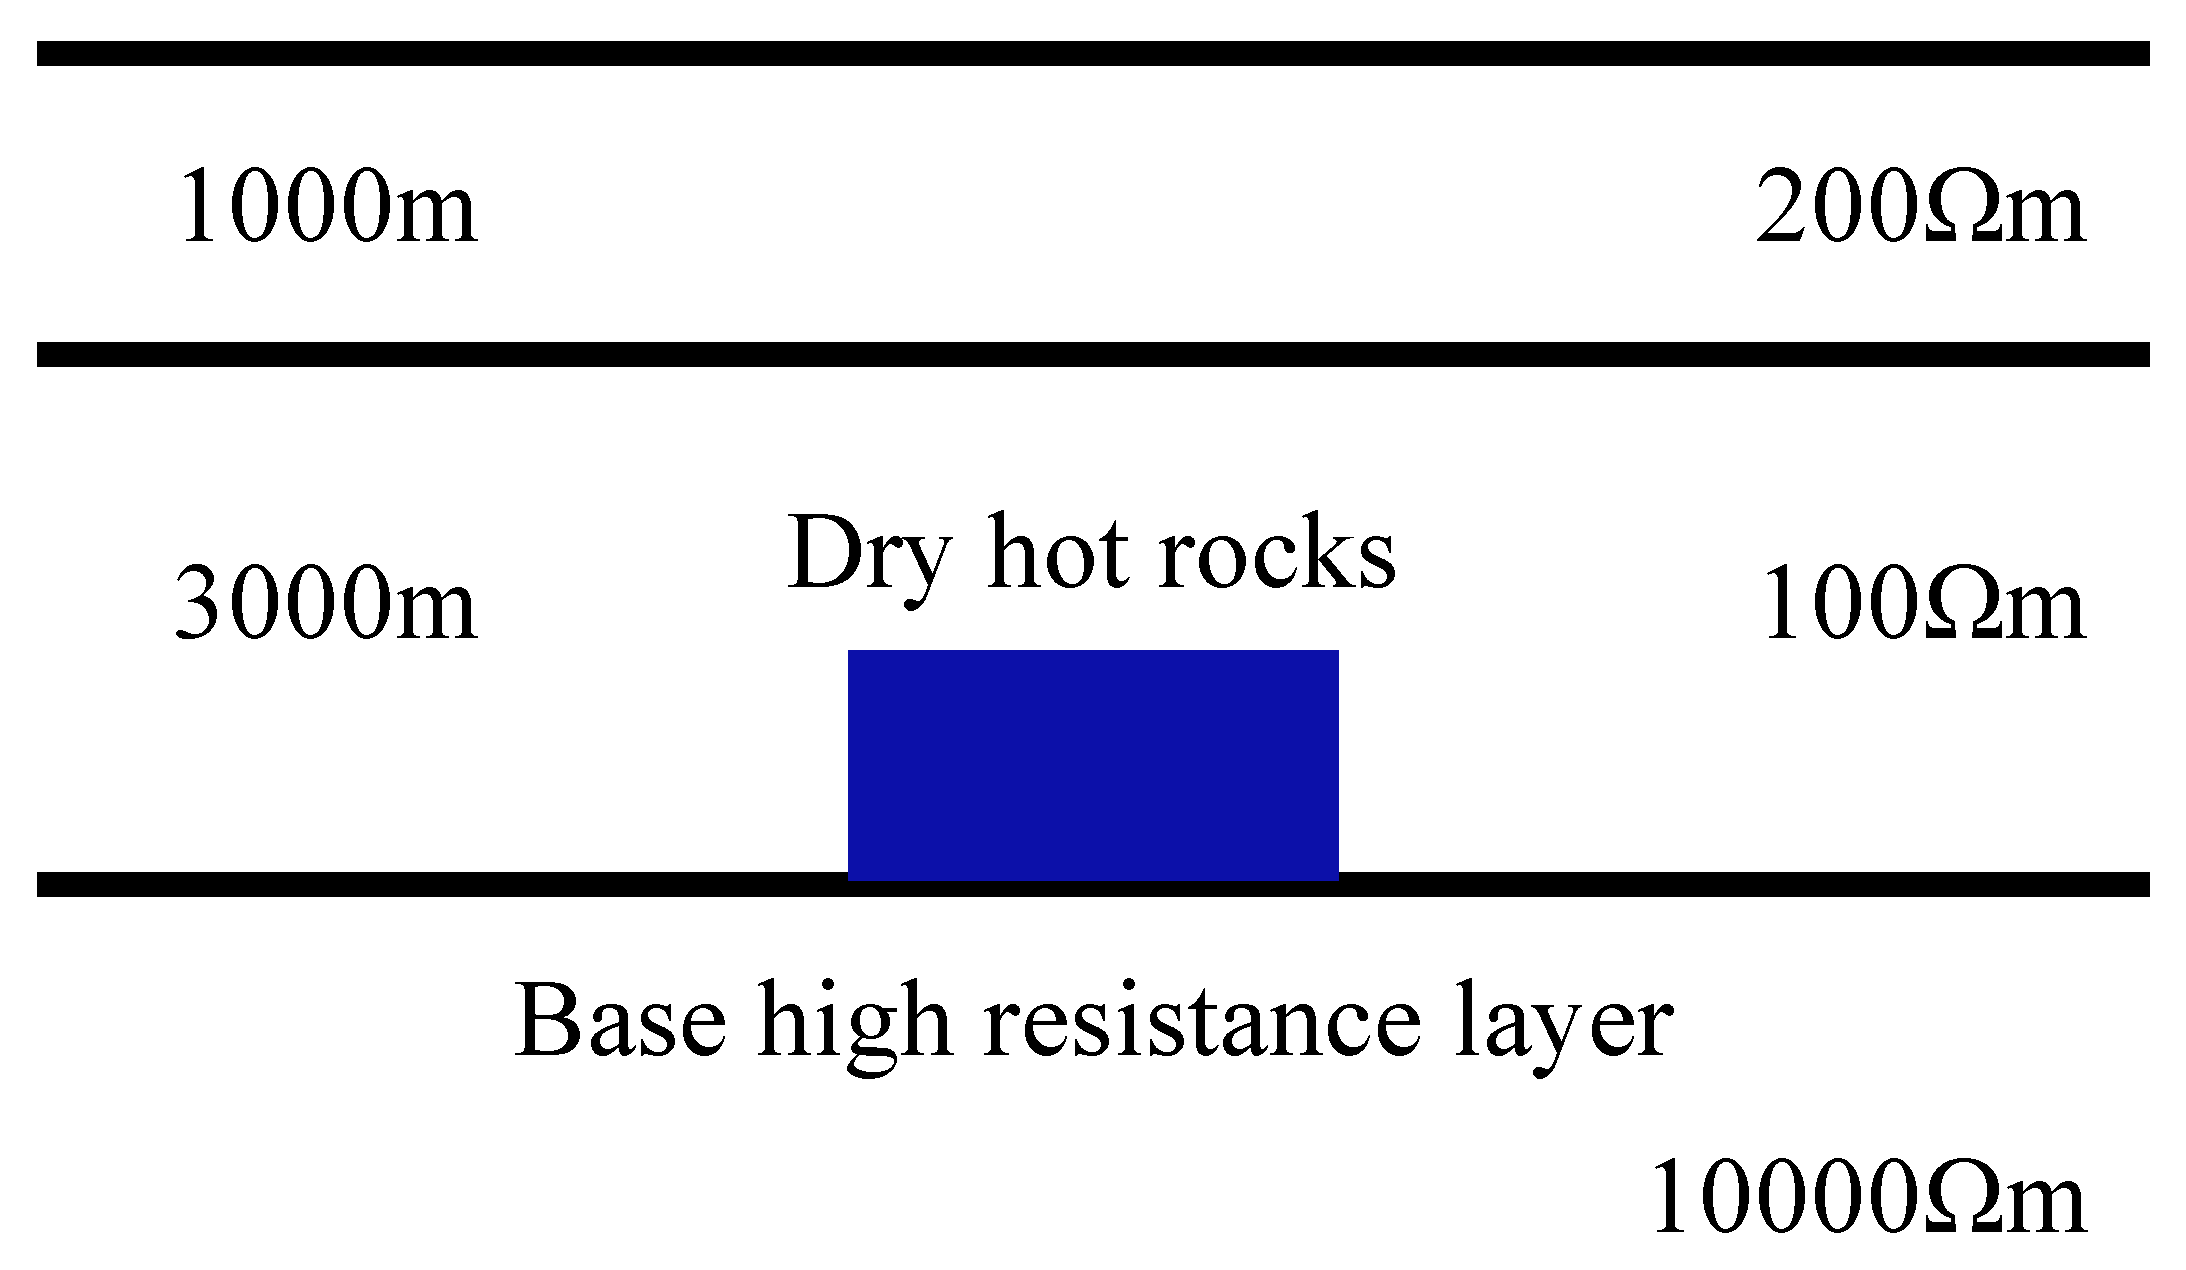
2.2. Analysis of the Detection Capabilities of Hot Dry Rock Geothermal Resources
3. Study of the Key Issues of WFEM in Detection of the Mid-Deep Geothermal Energy
3.1. Factors Affecting the Accuracy of Wide Field Electromagnetic Detection
3.1.1. Observation Data Error
- (1)
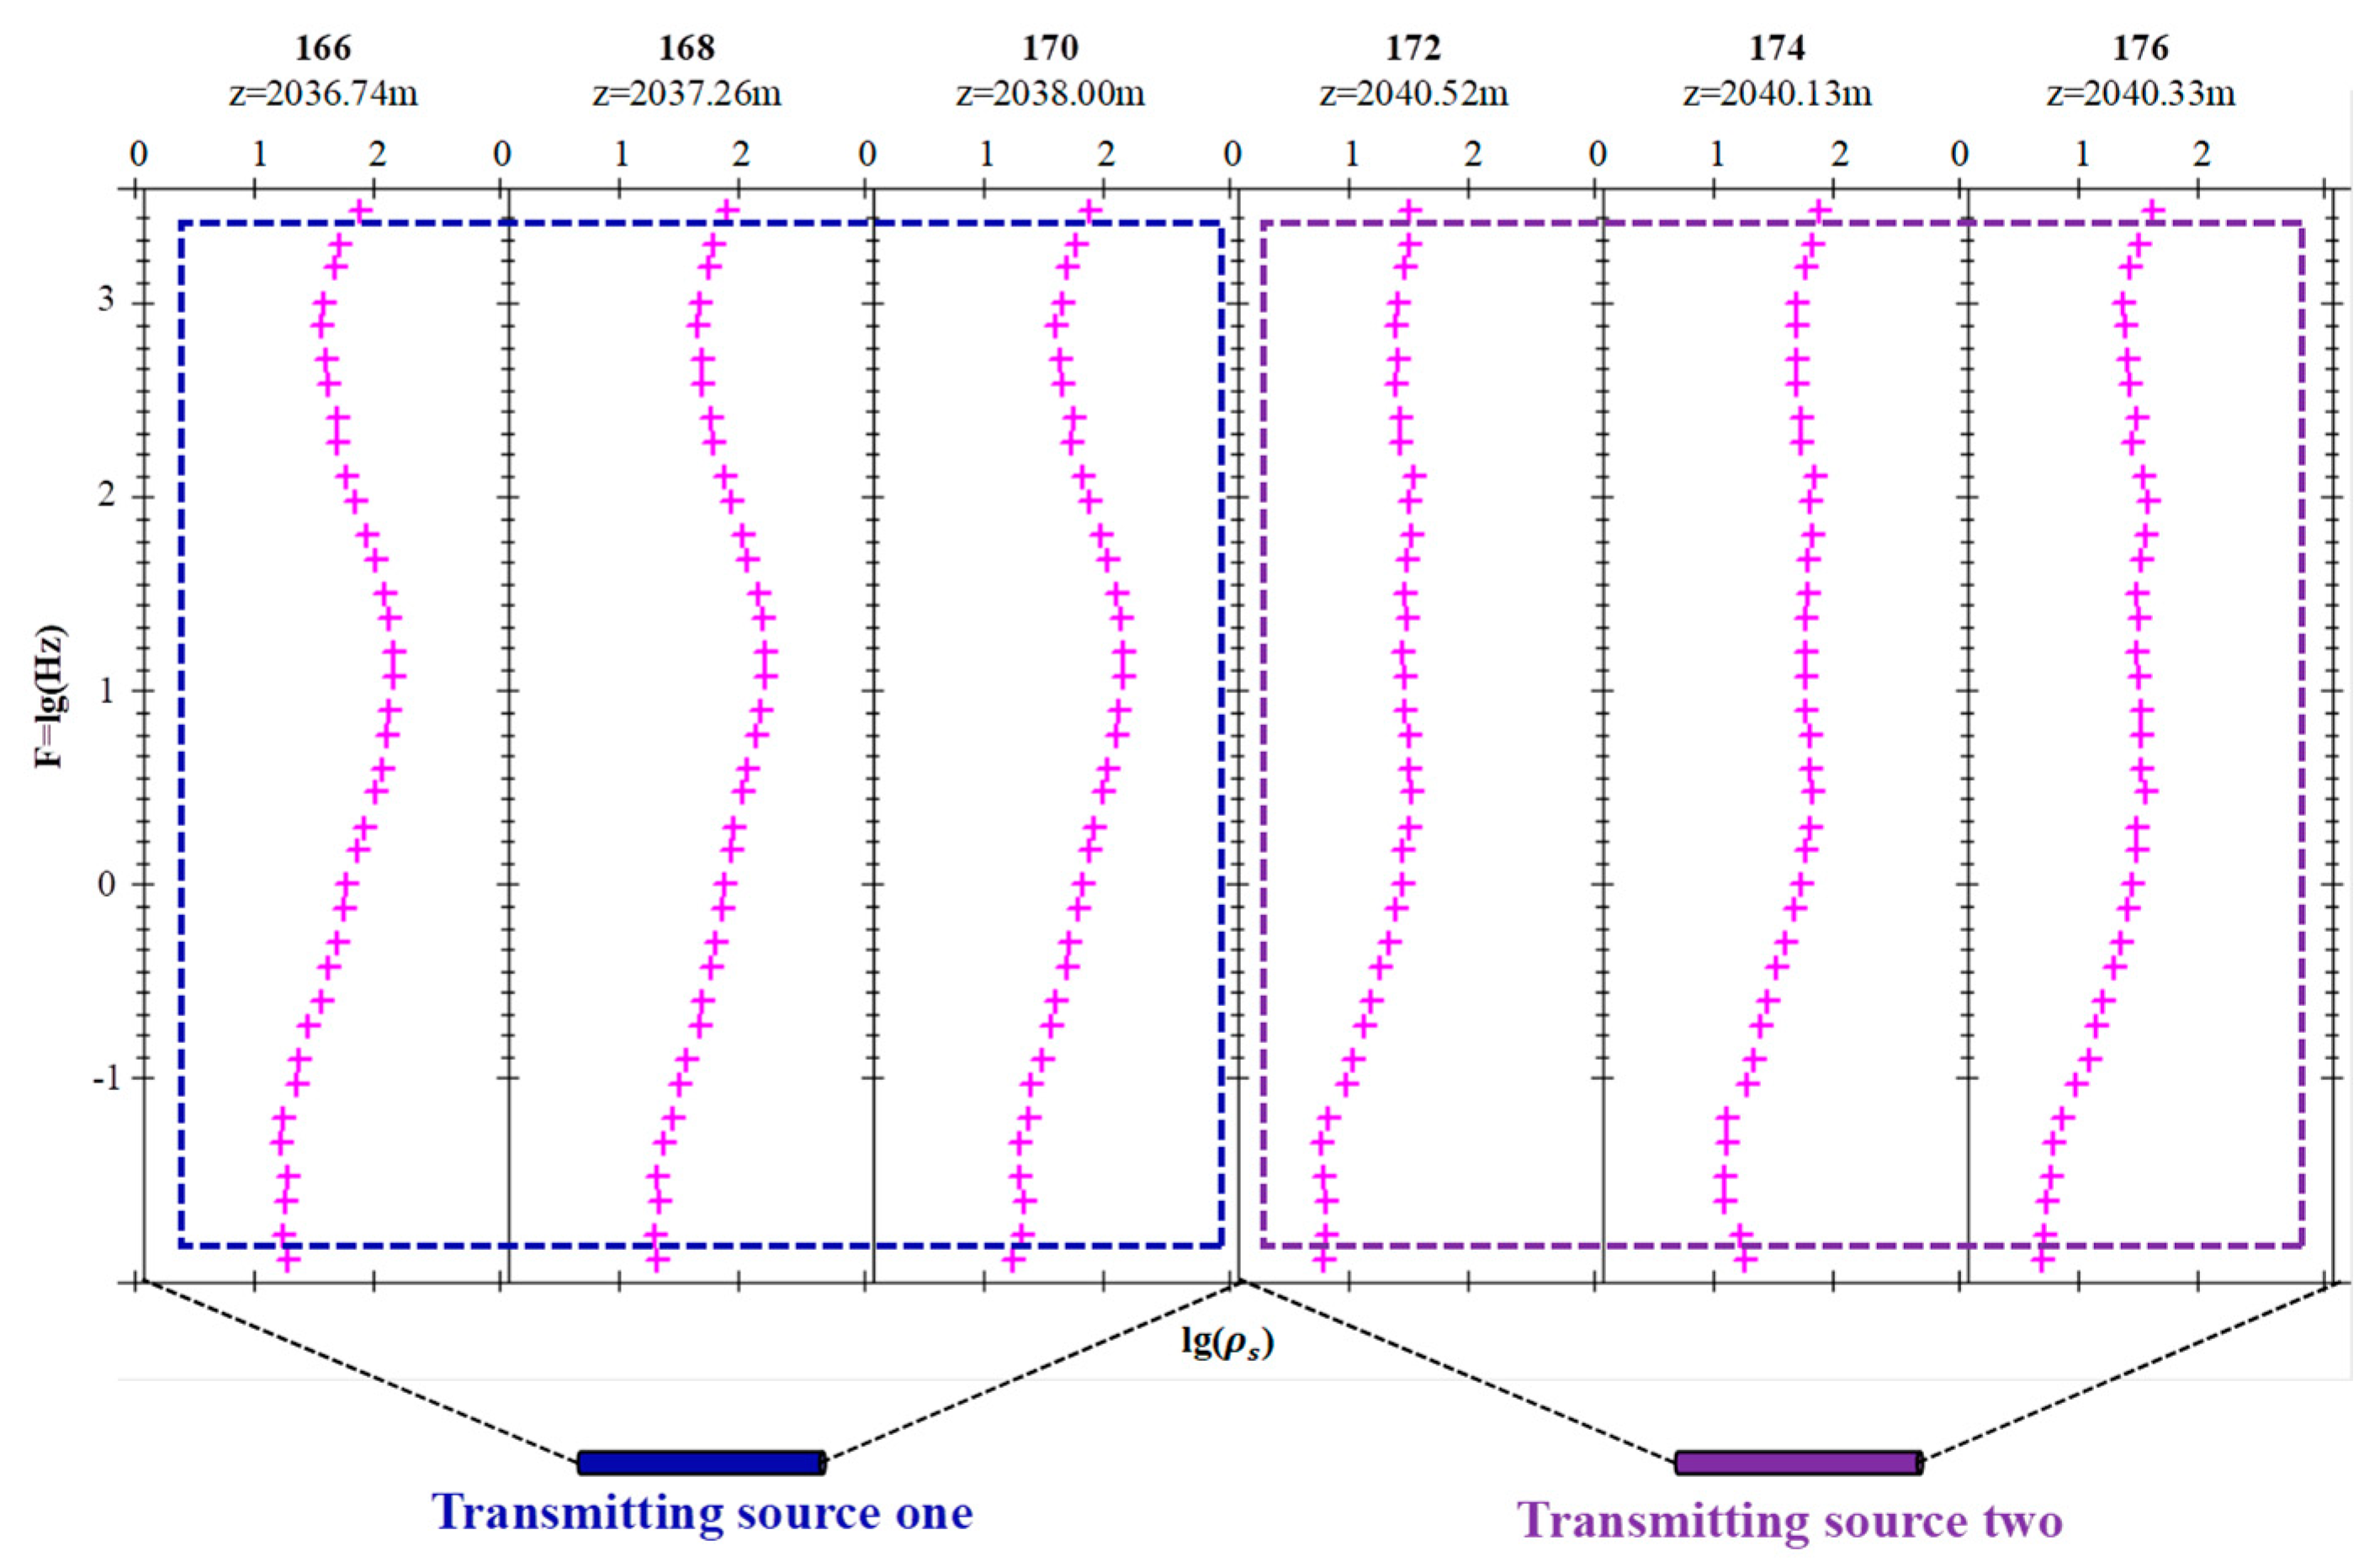
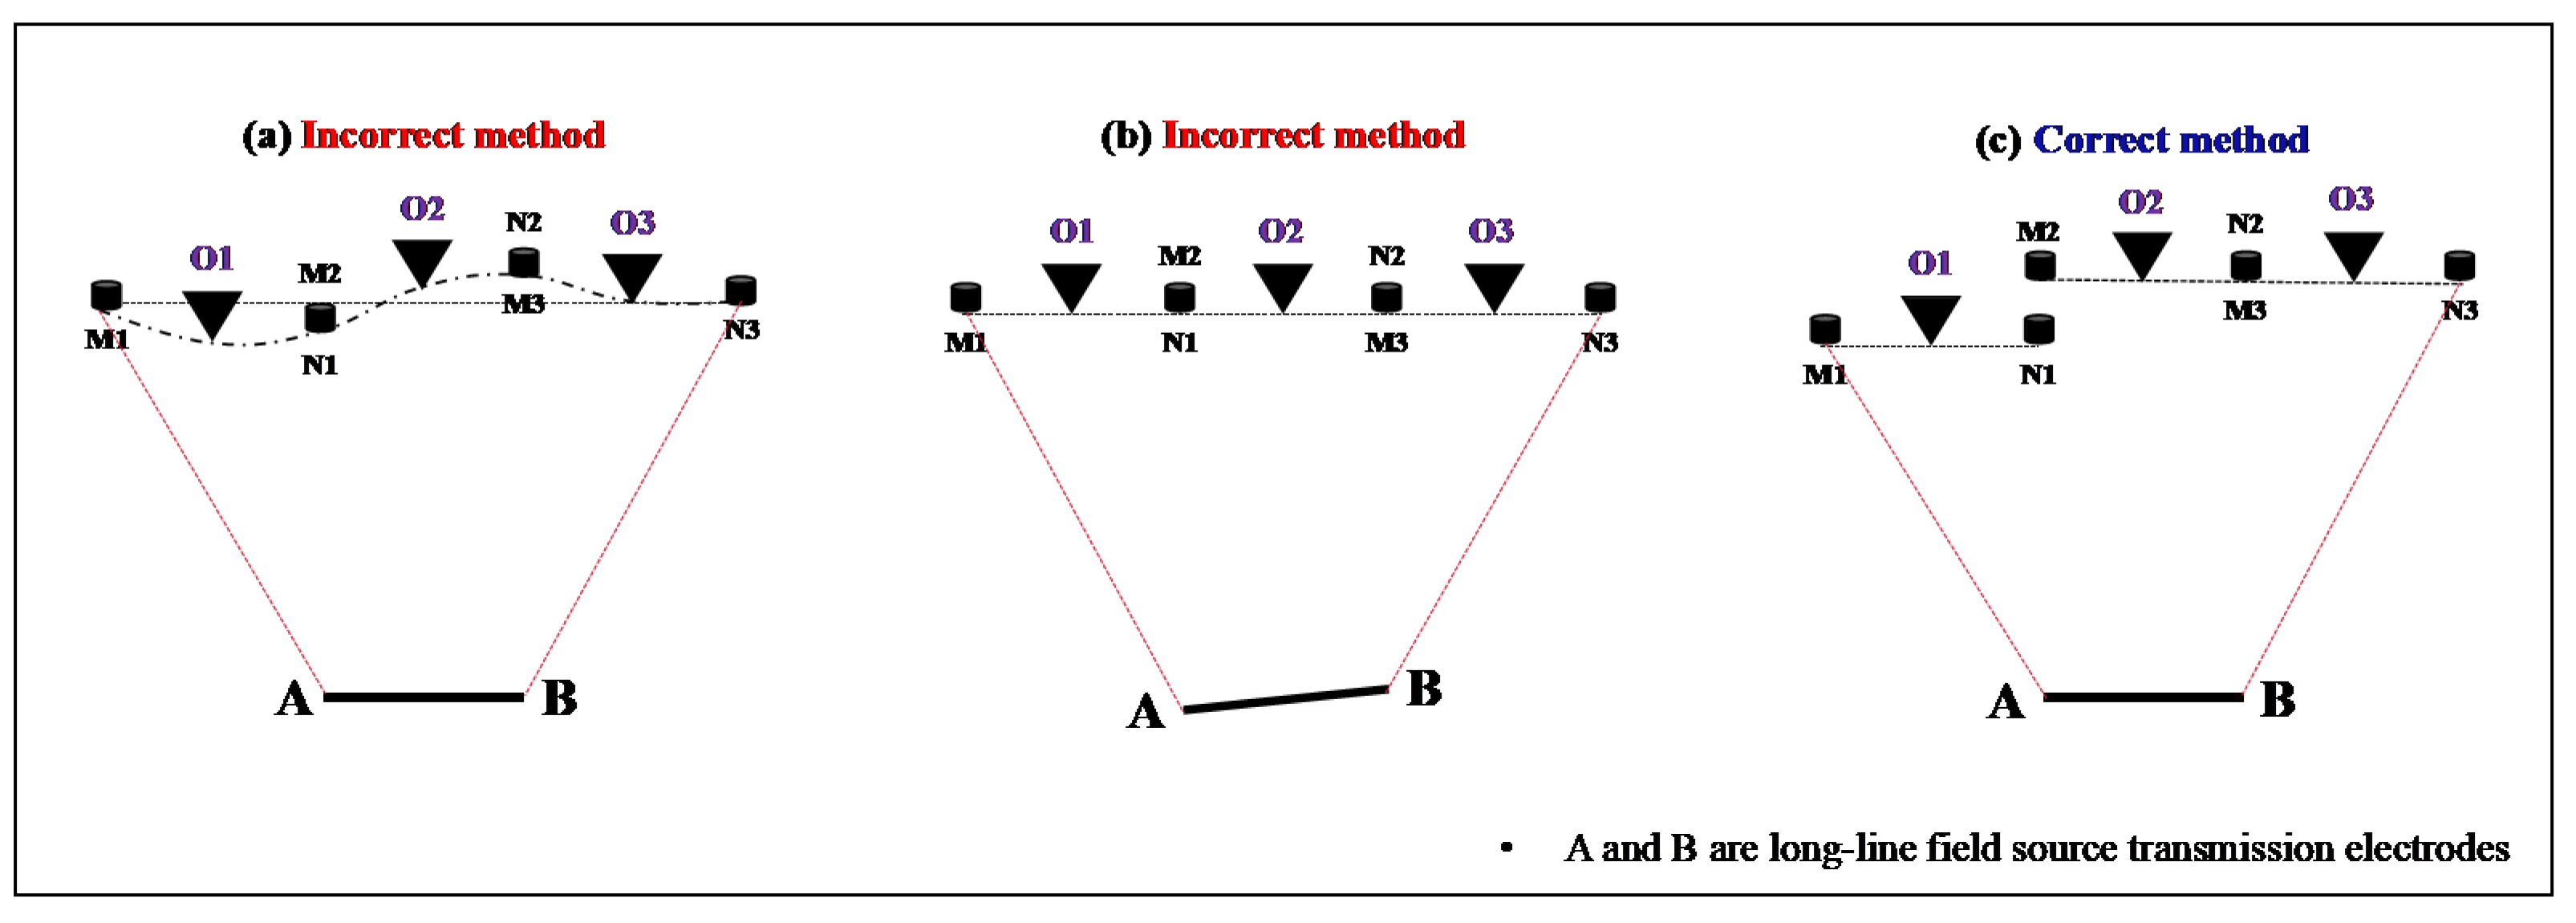
- Field source deployment factors
- (2)
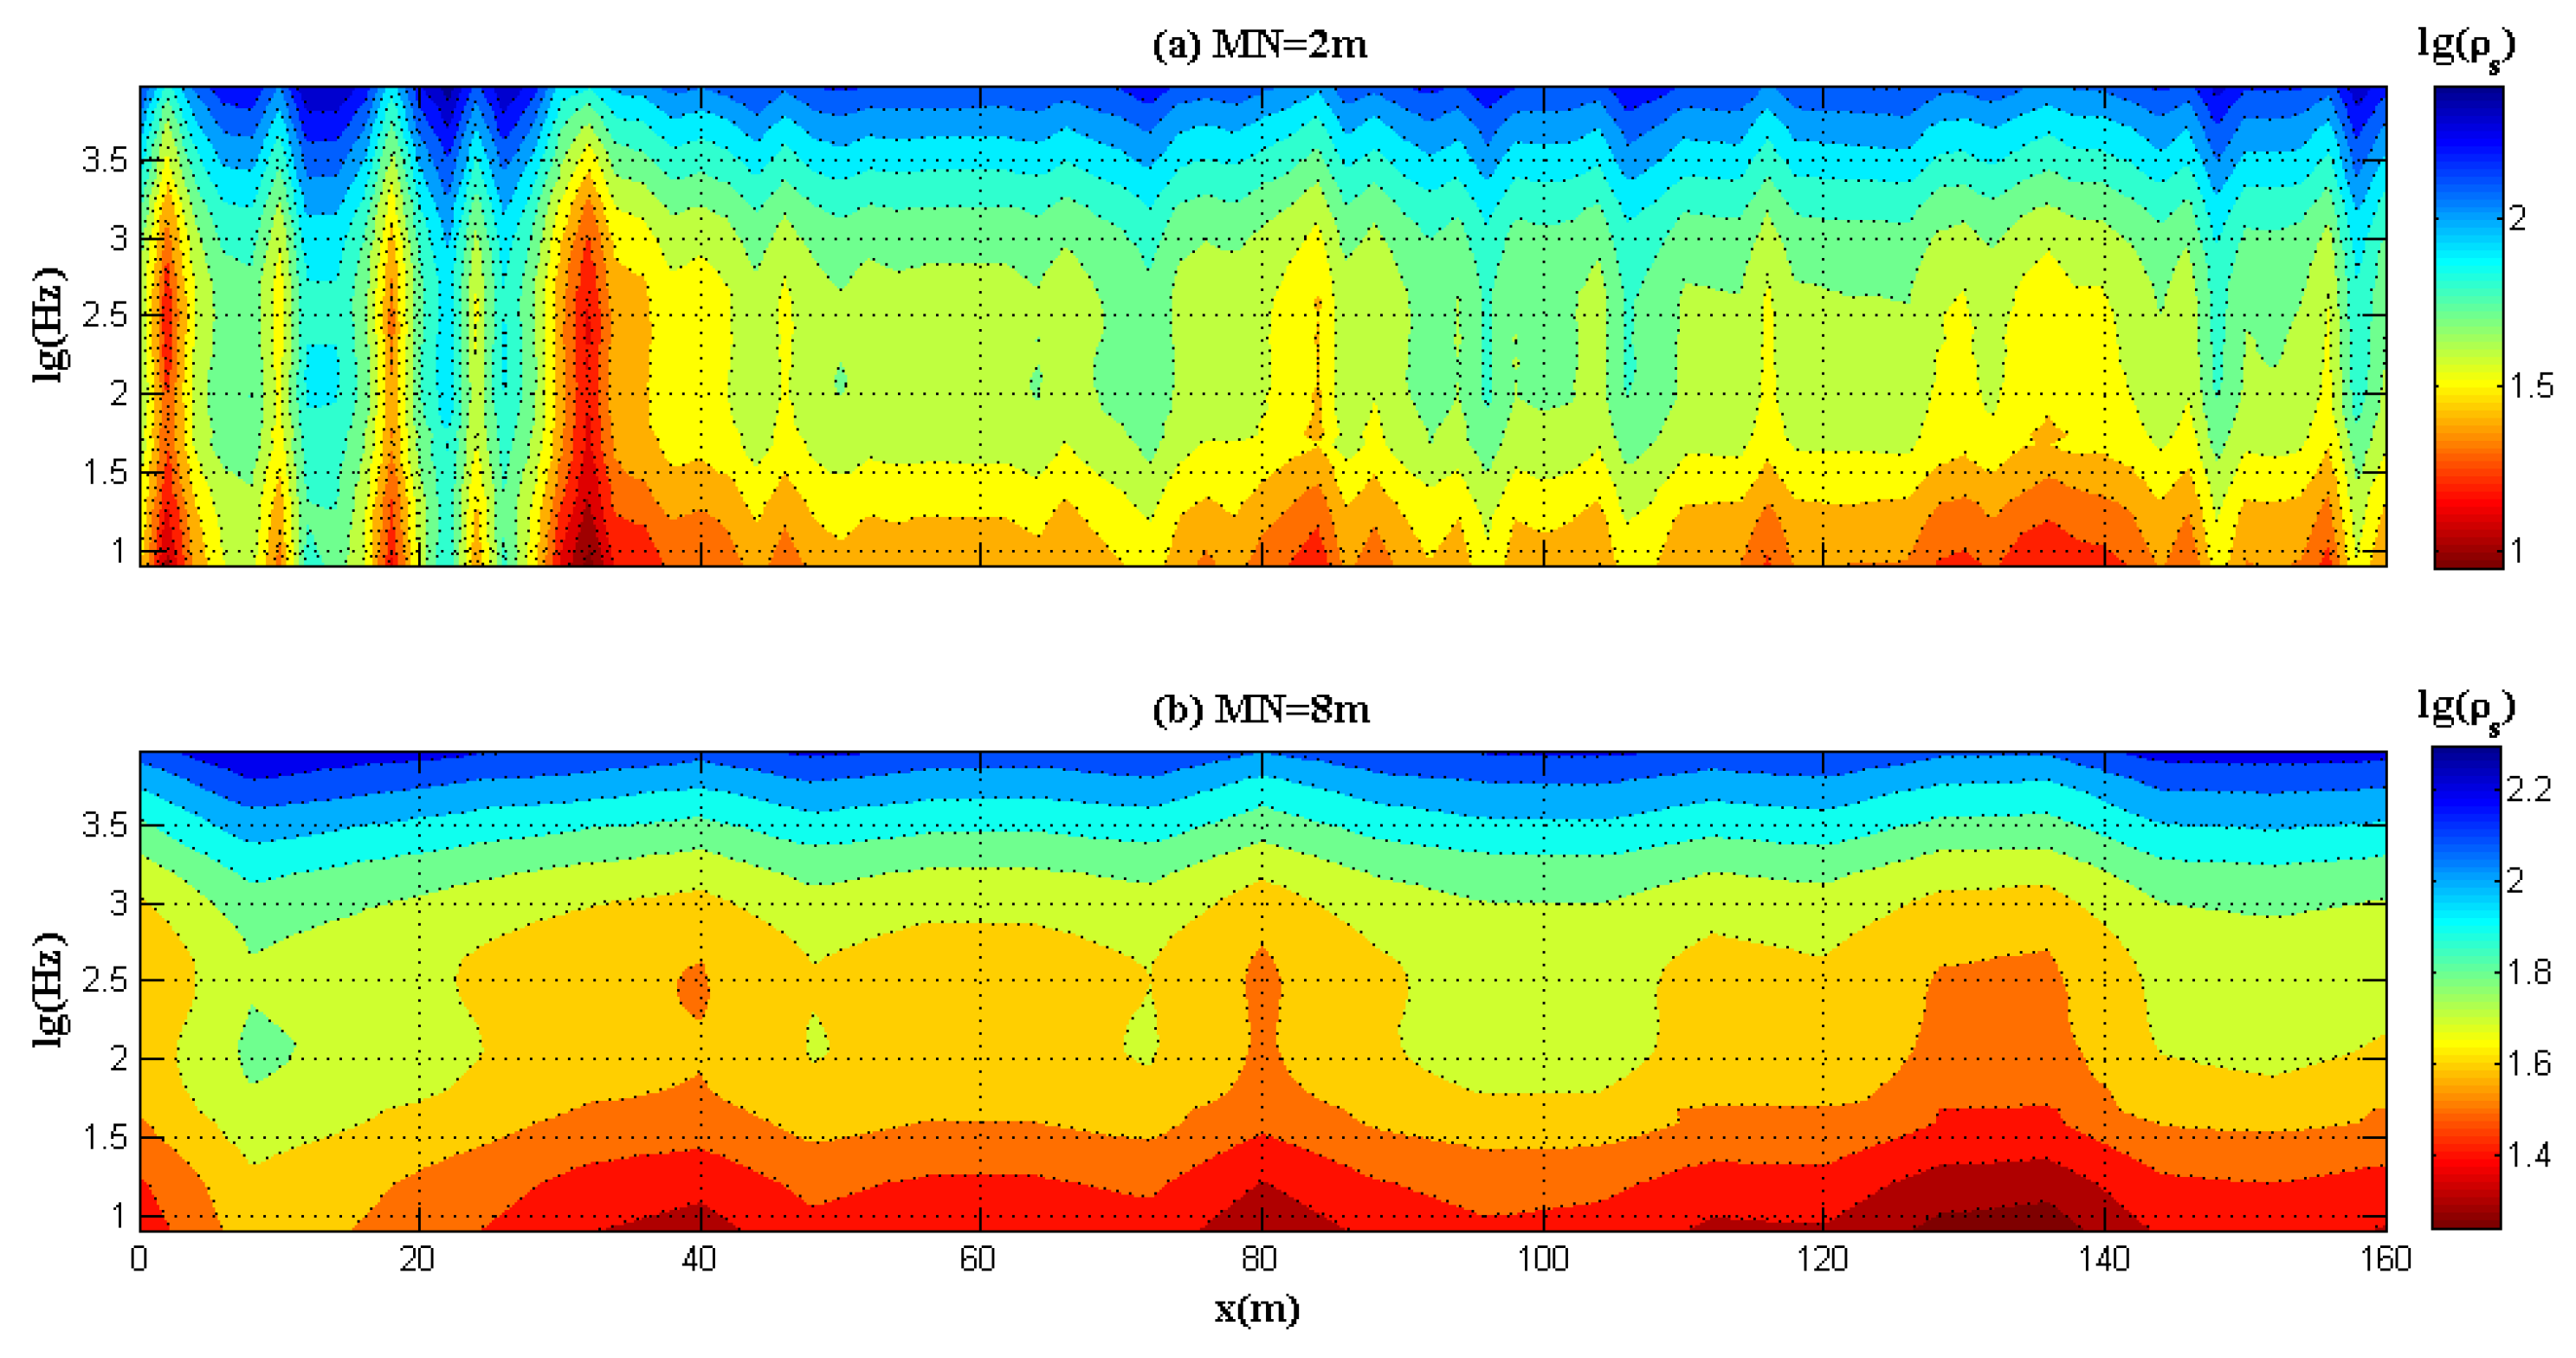
- Measurement factors
- (3)
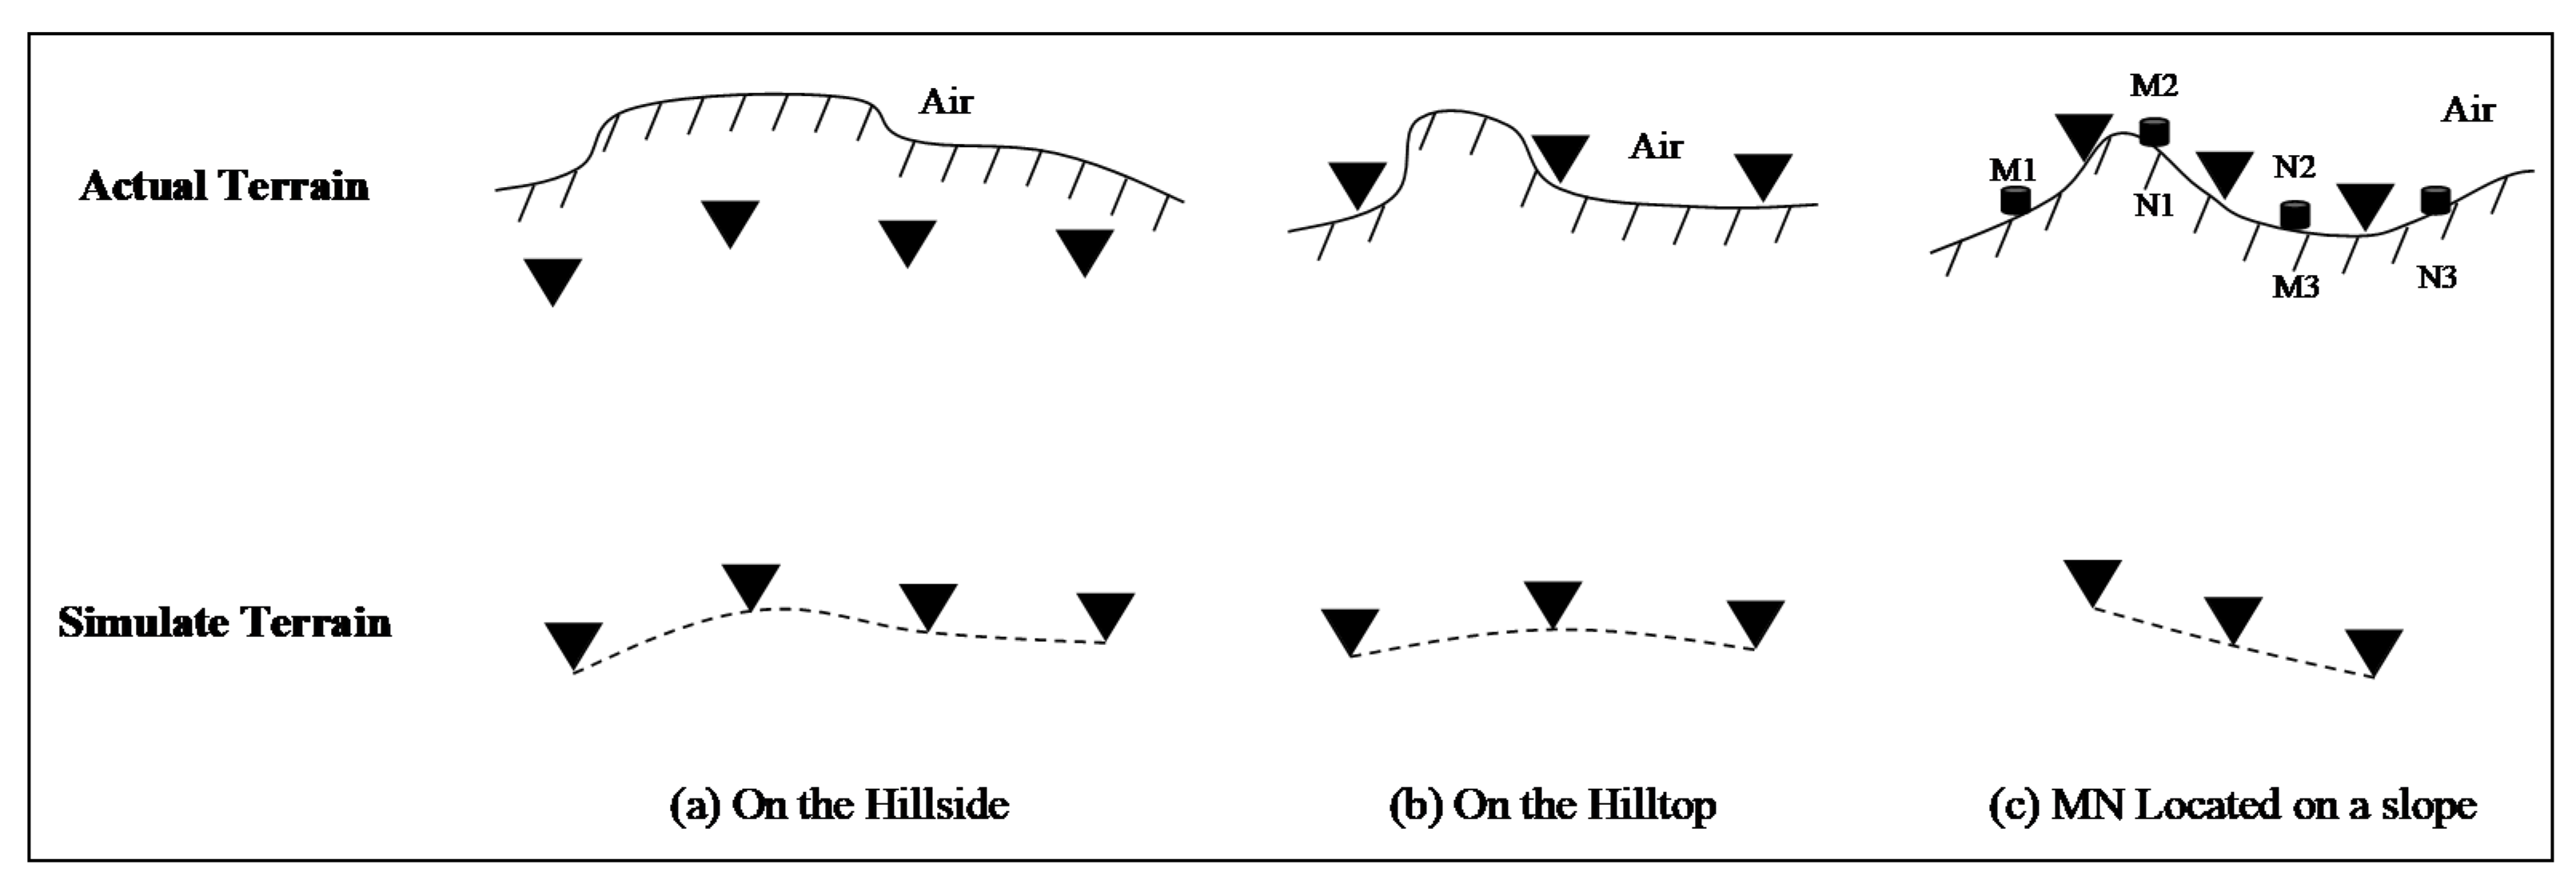
- Topographical factor
3.1.2. Processing algorithm factors
- (1)
- Data editing and filtering processing
- (2)
- Static effect problem
- (3)
- Inversion of the initial model problem
- (4)
- Problems with the inversion method
3.2. Difficulties Encountered by WFEM Method in the Detection of the Mid-Deep Geothermal Energy
4. Case Analysis of the Evaluation of the Geothermal Energy Potential and the Detection of the Mid-Deep Layer of Jiyang Depression, Shandong Province
4.1. Geological and Geophysical Characteristics
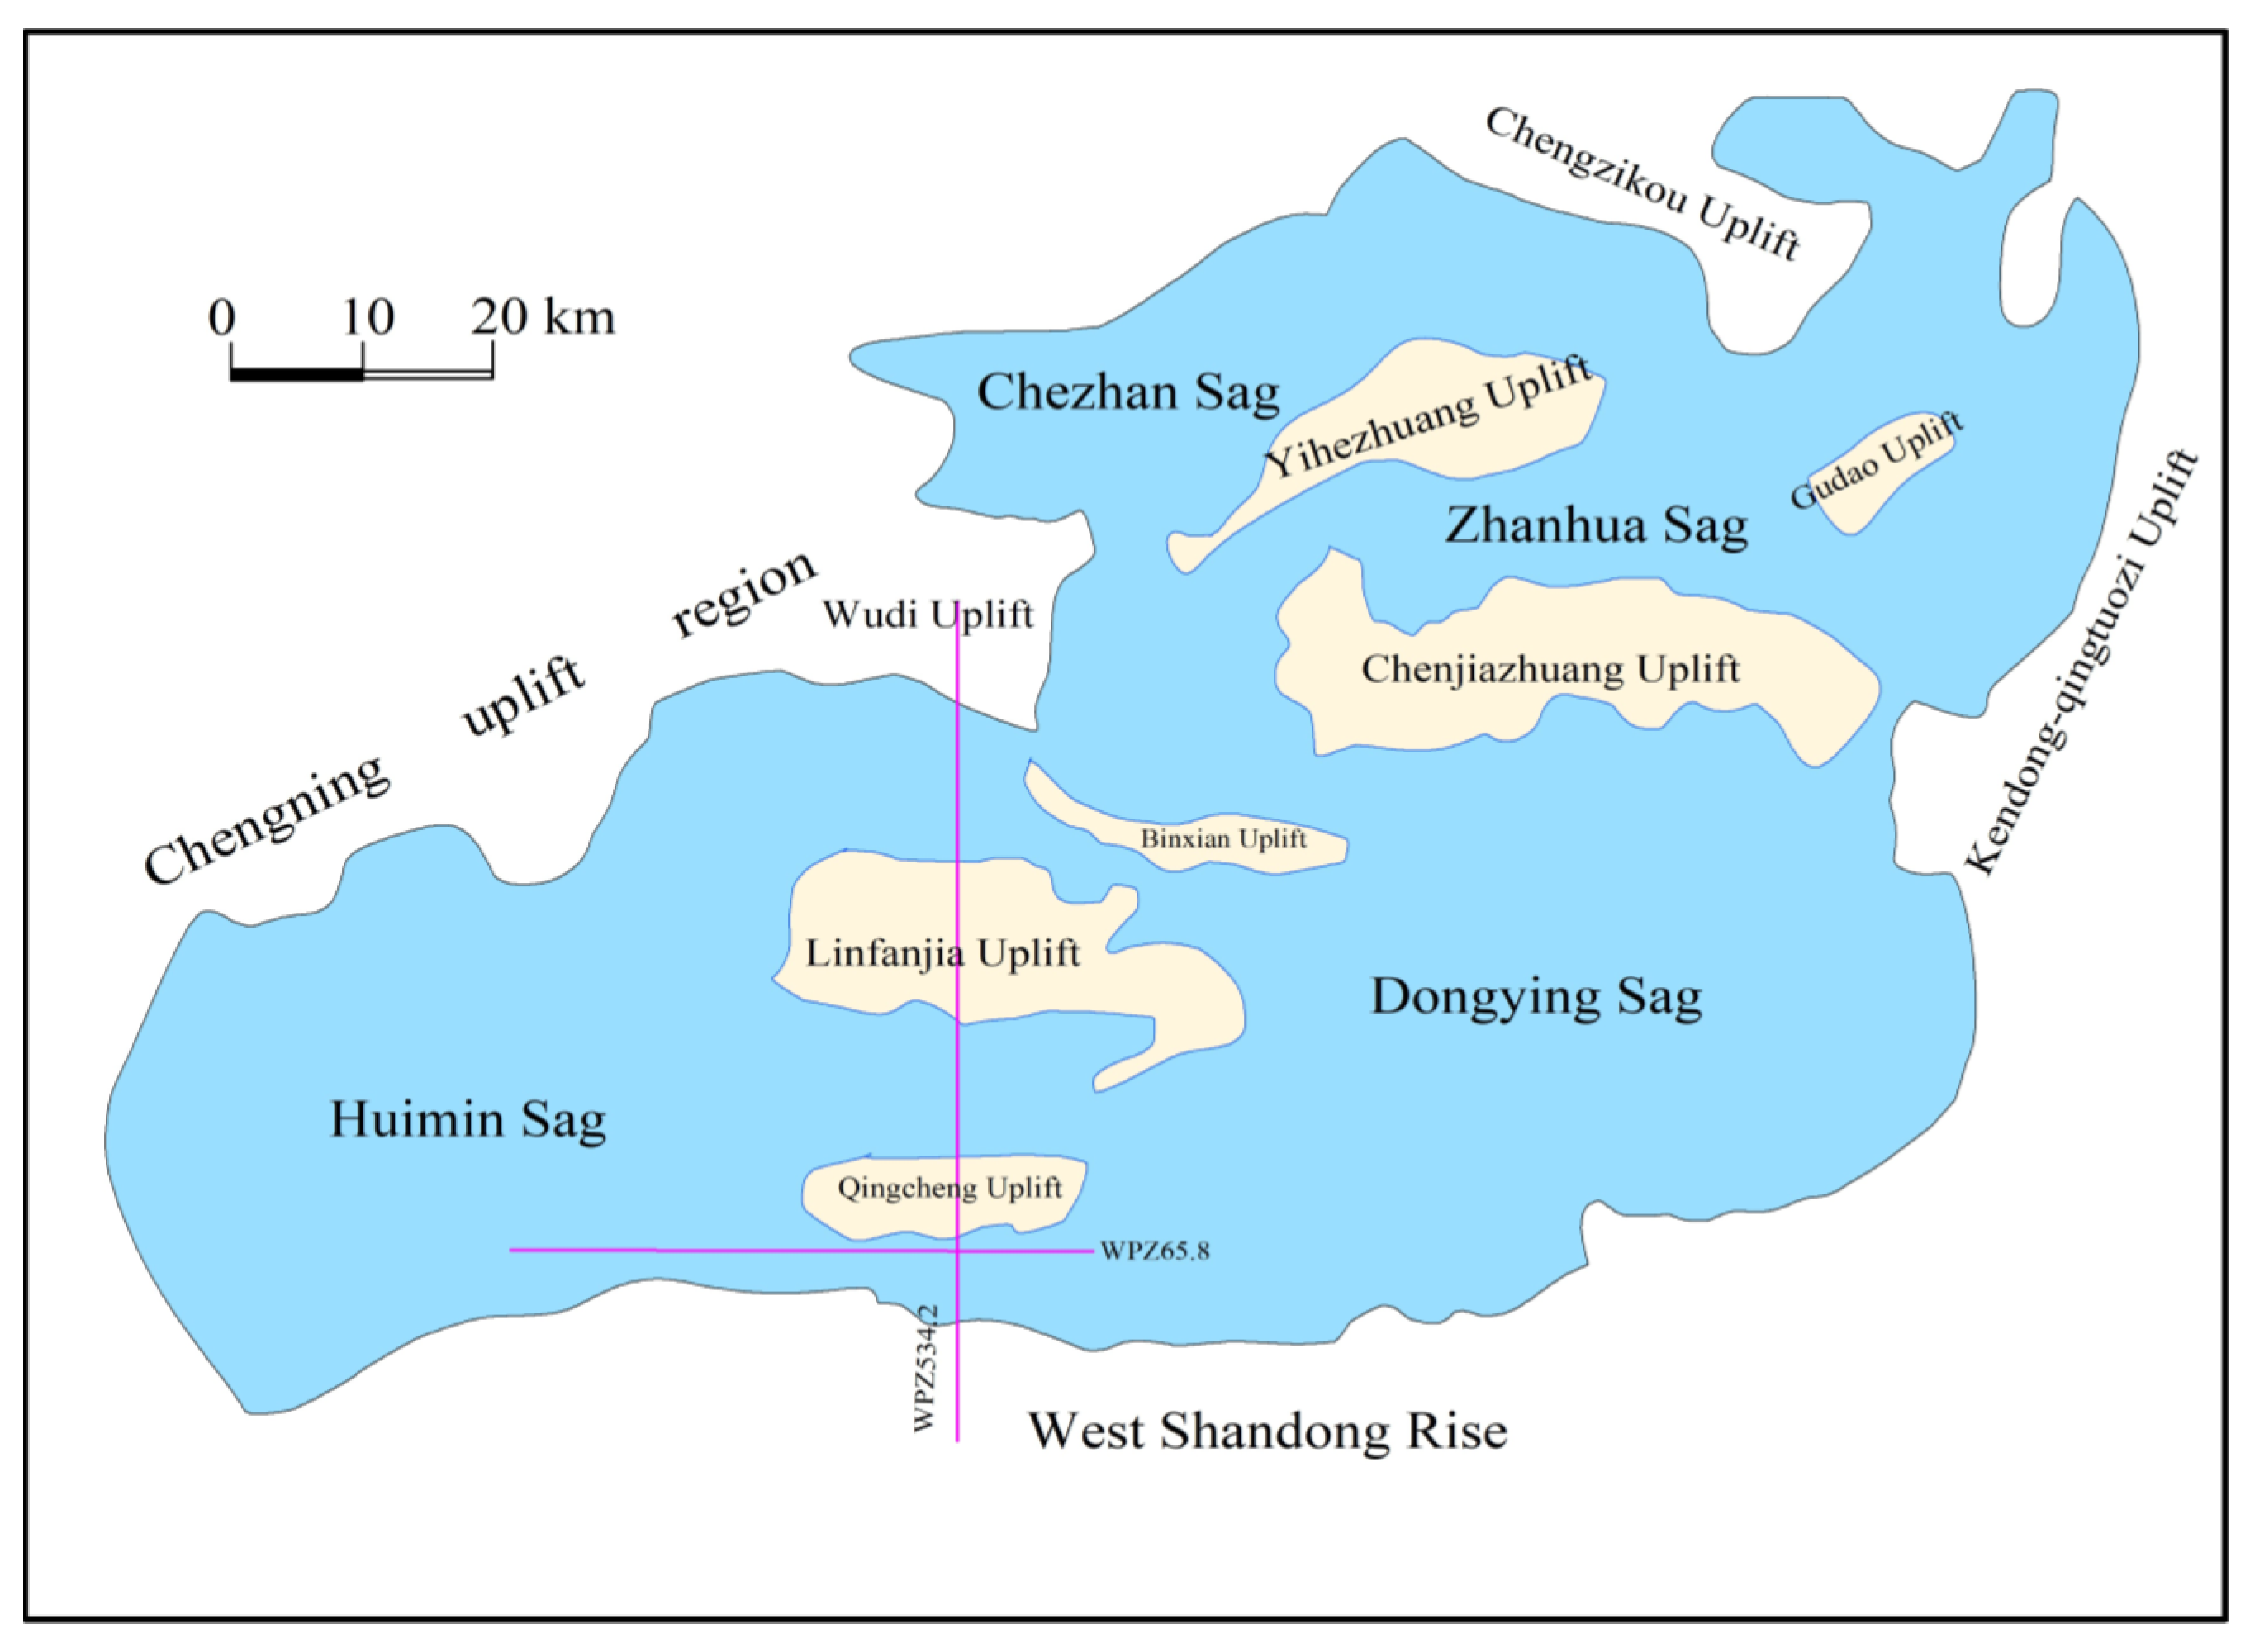
4.1.1. Tectonic Background
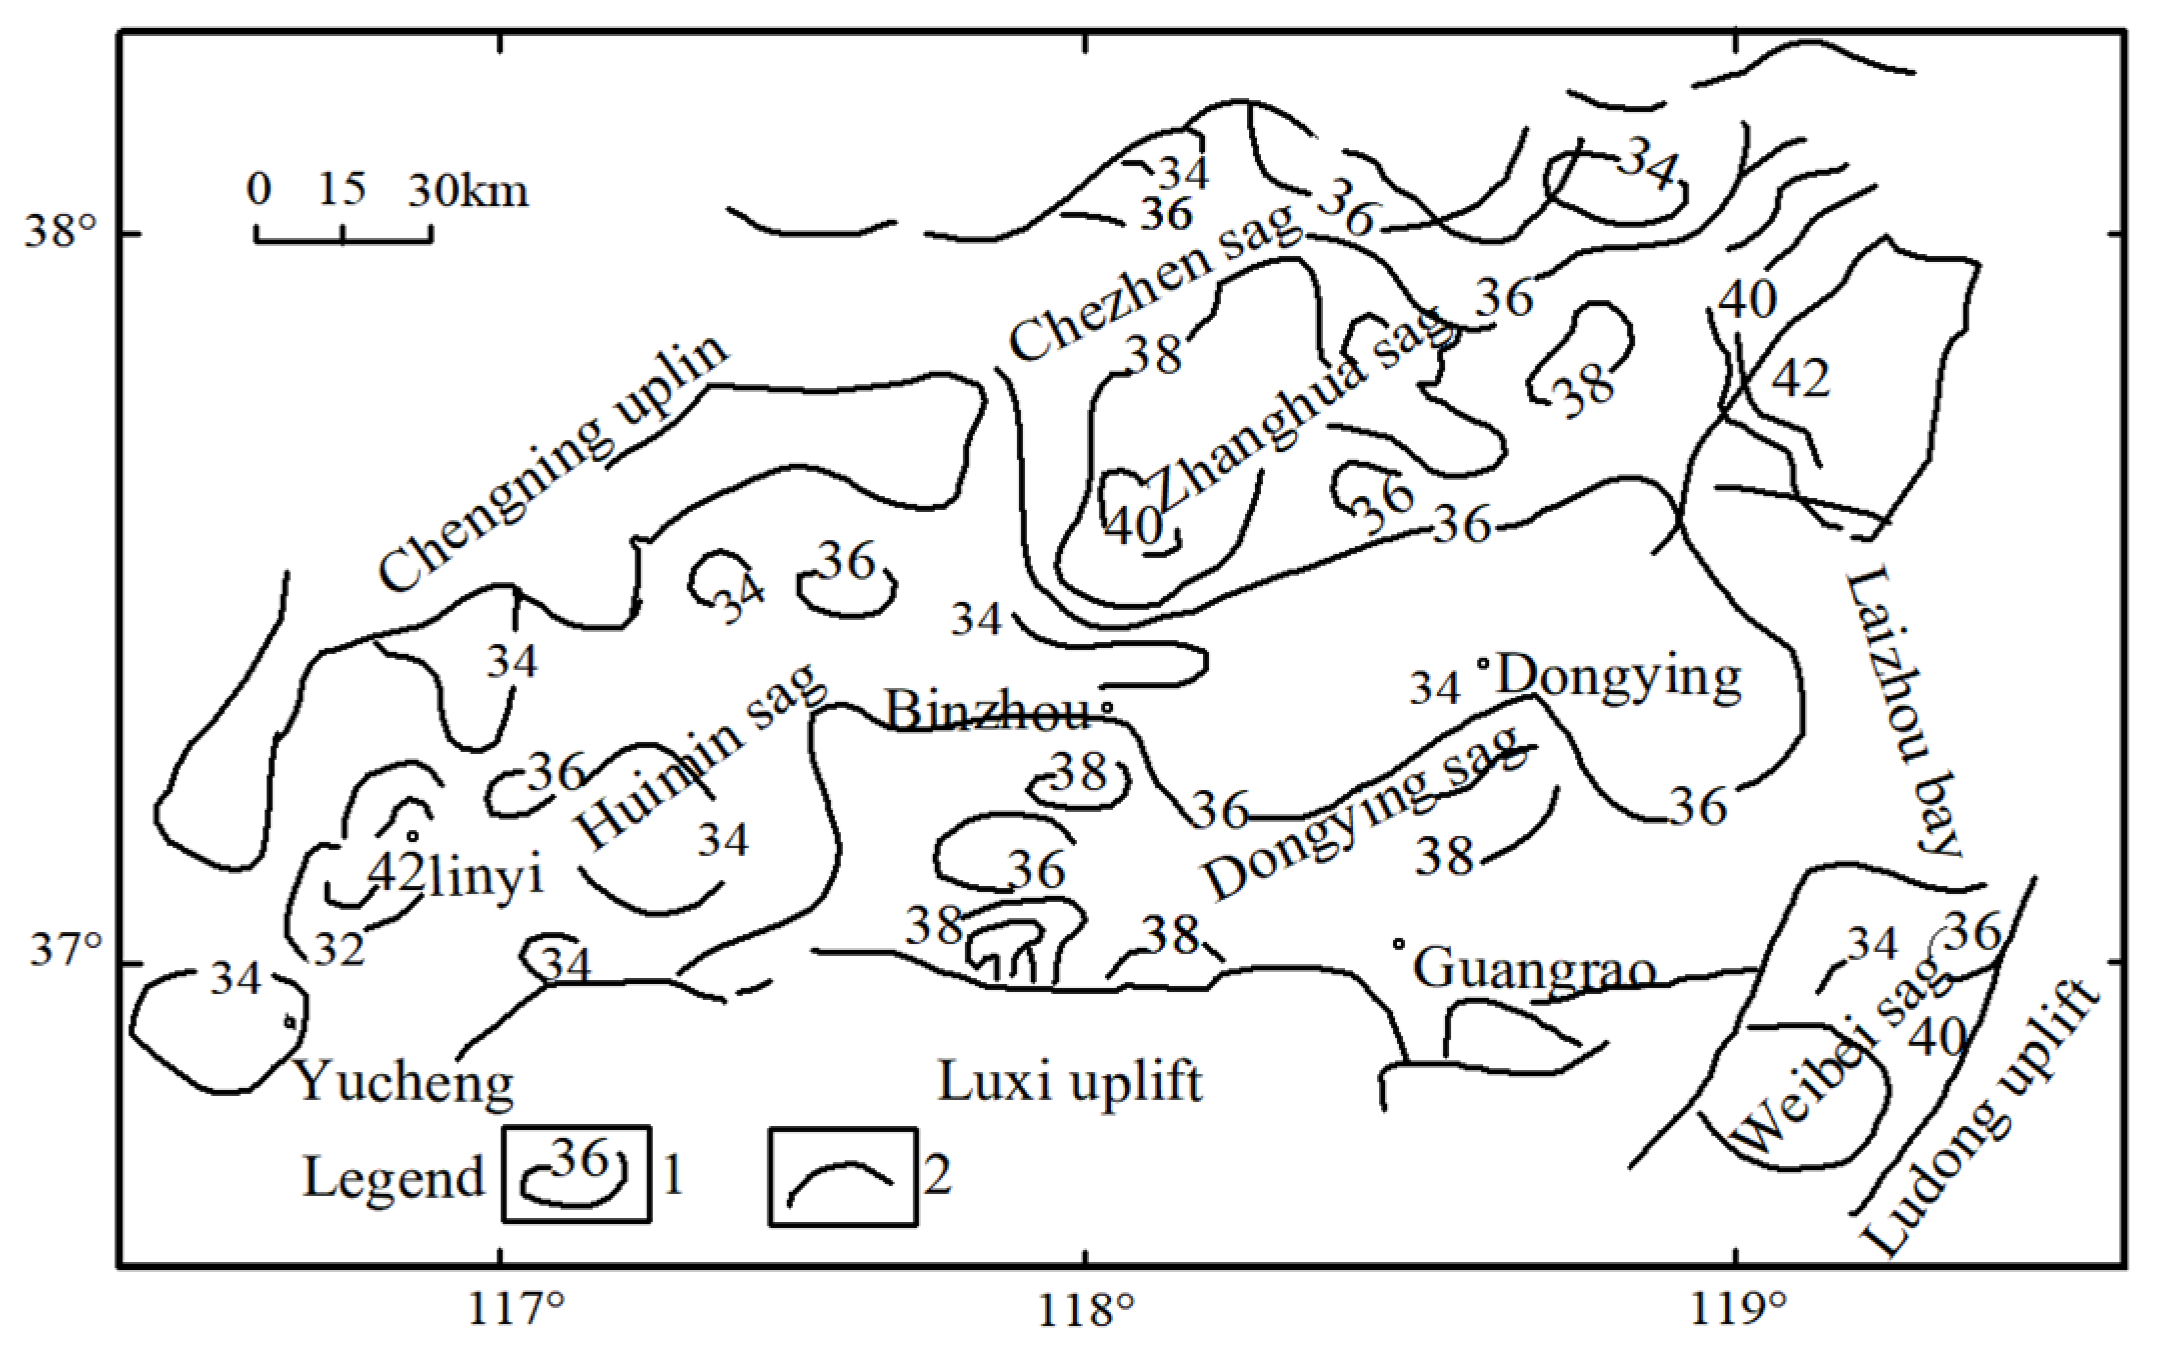
4.1.2. Characteristics of the Geothermal Field
4.1.3. Characteristics of the Electric Field
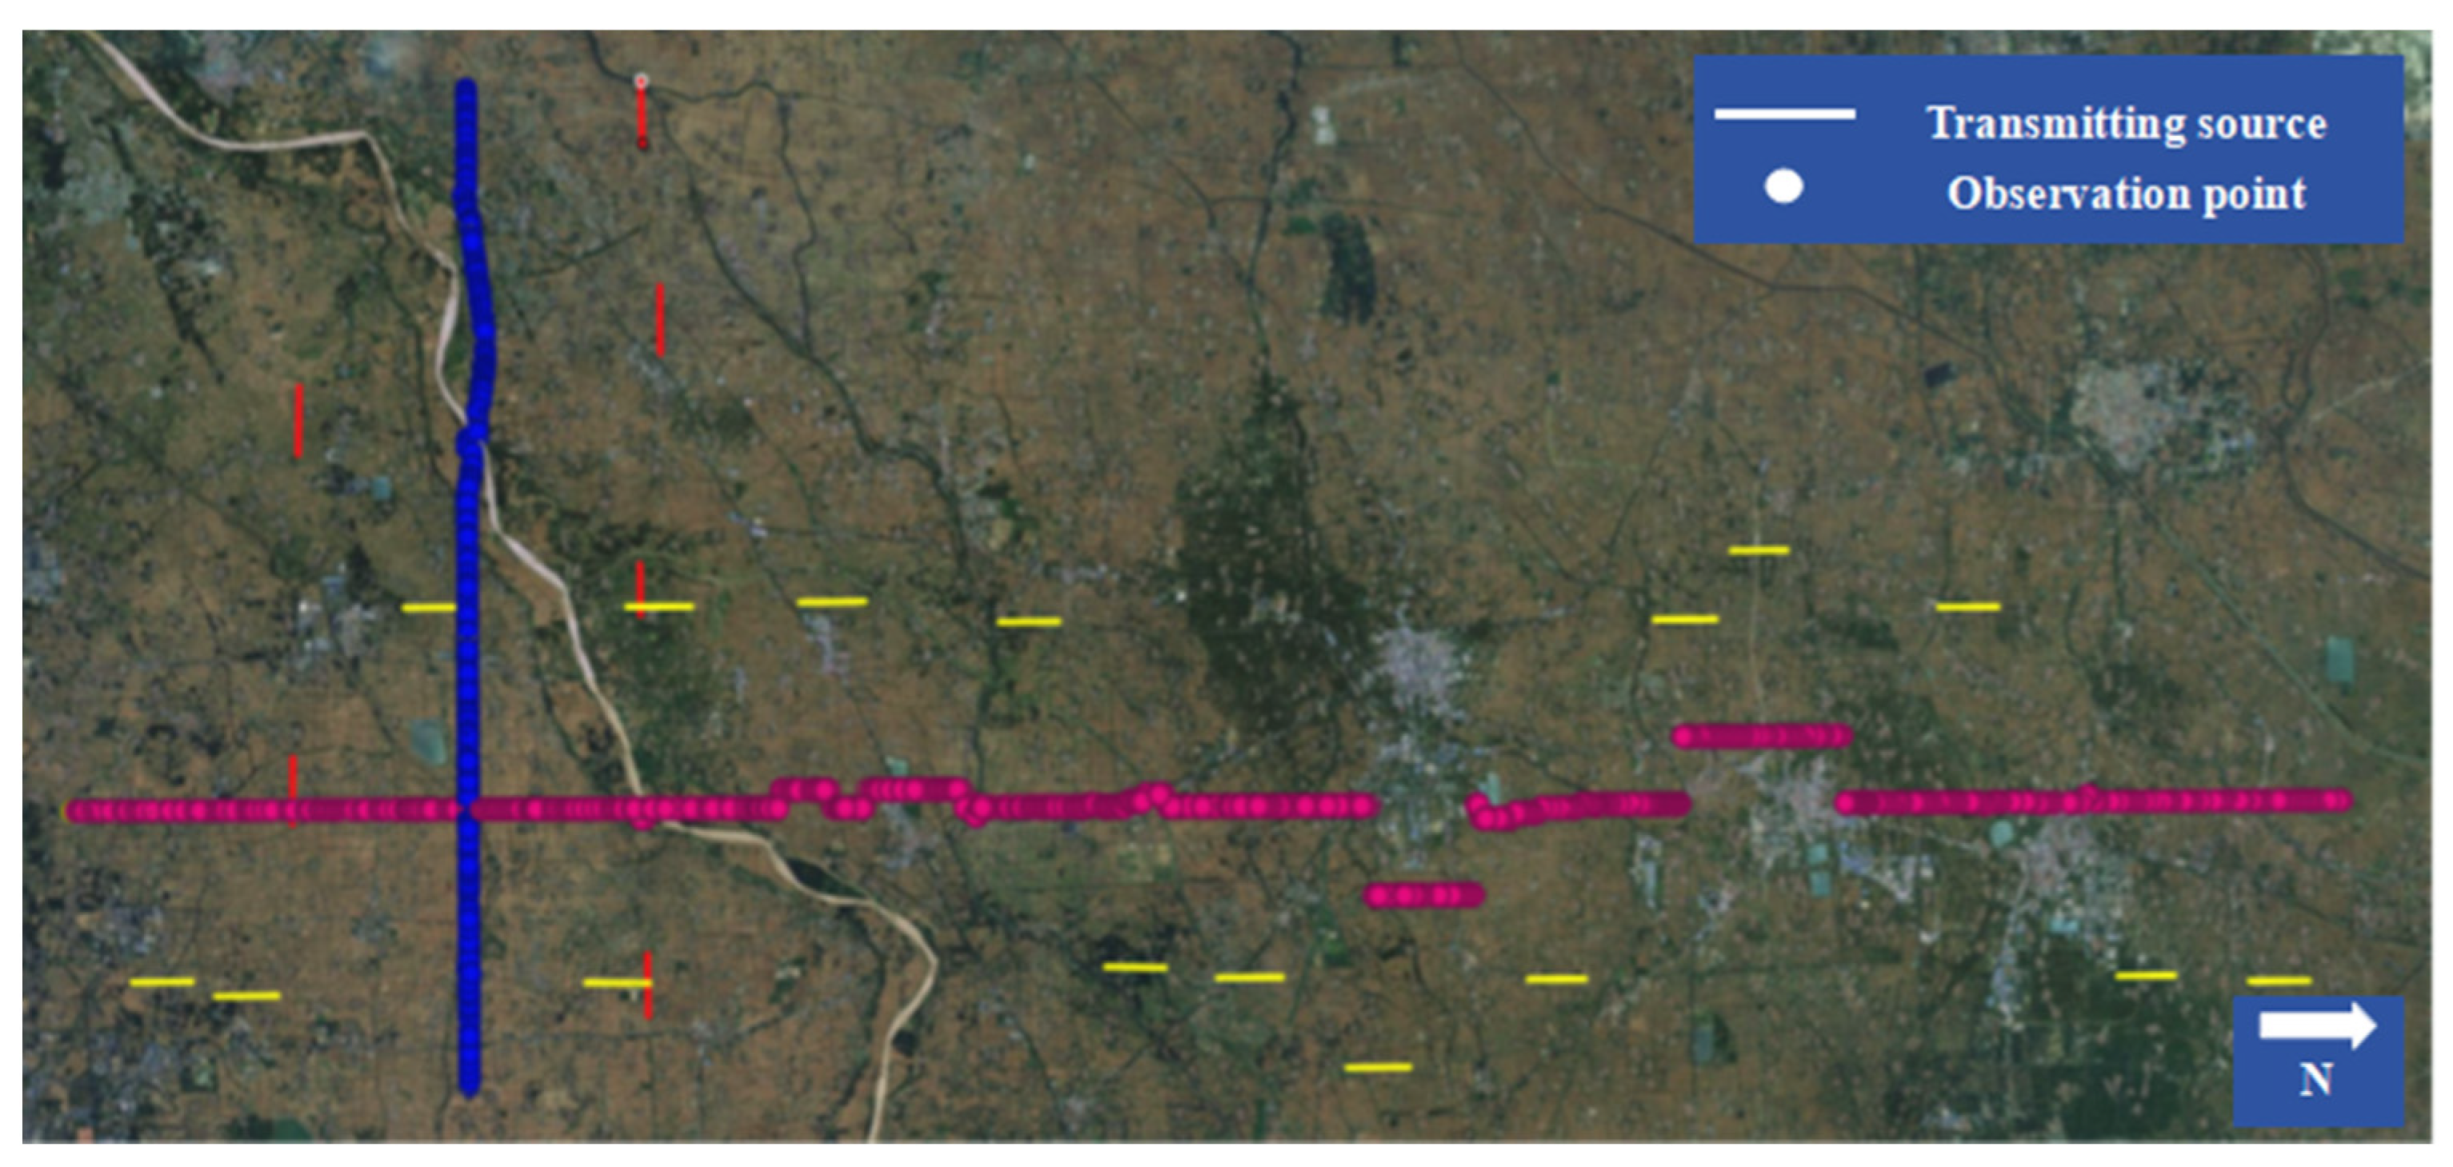
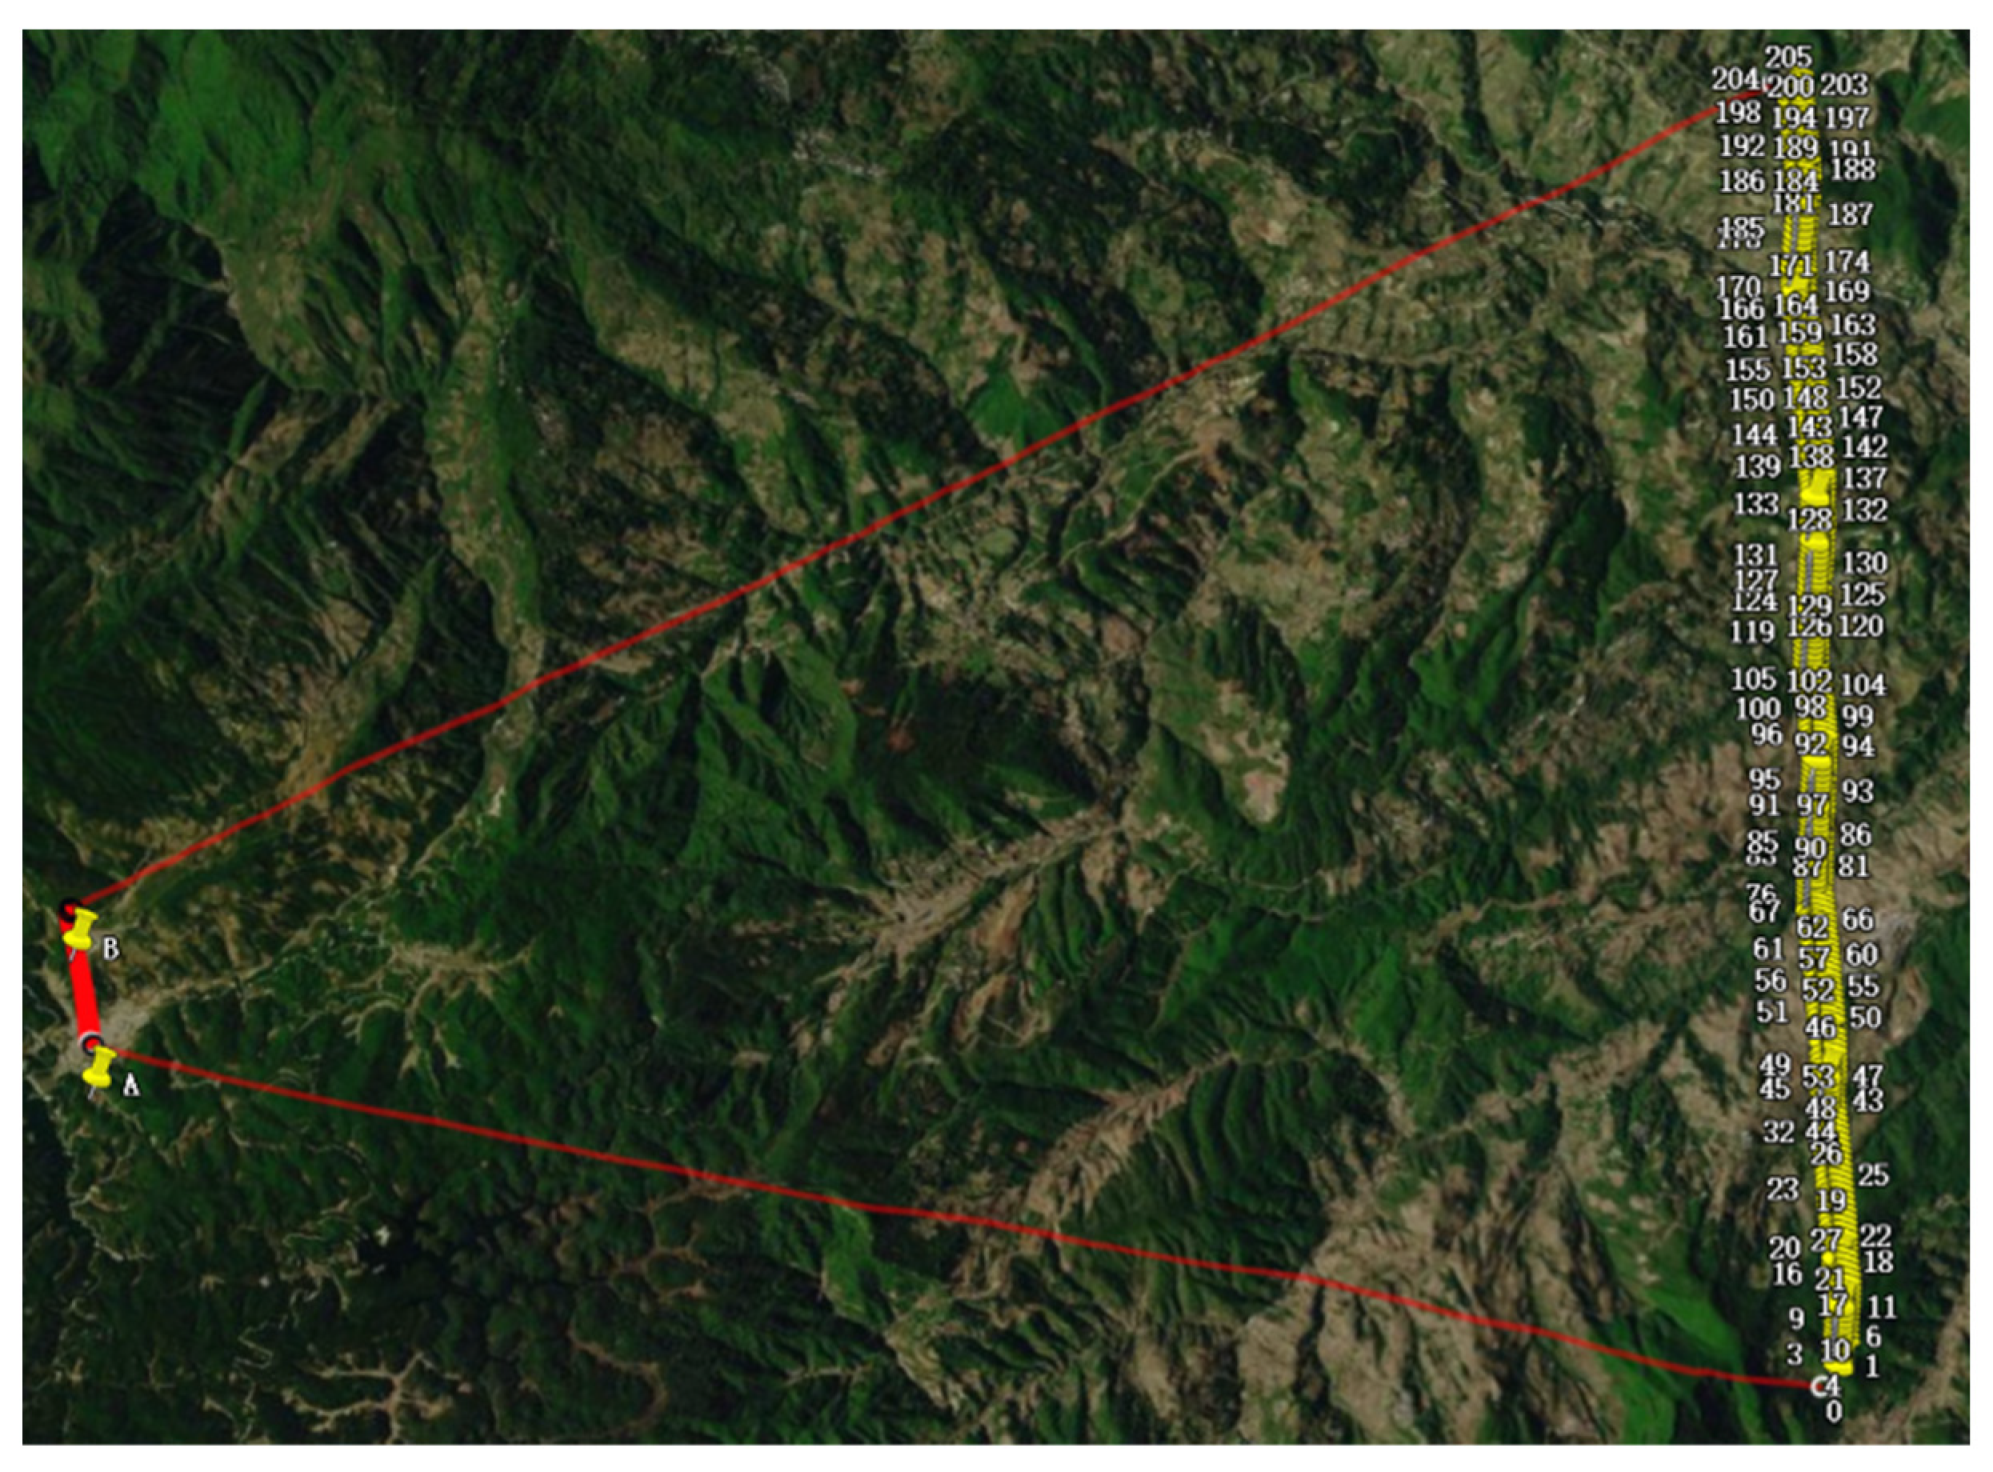
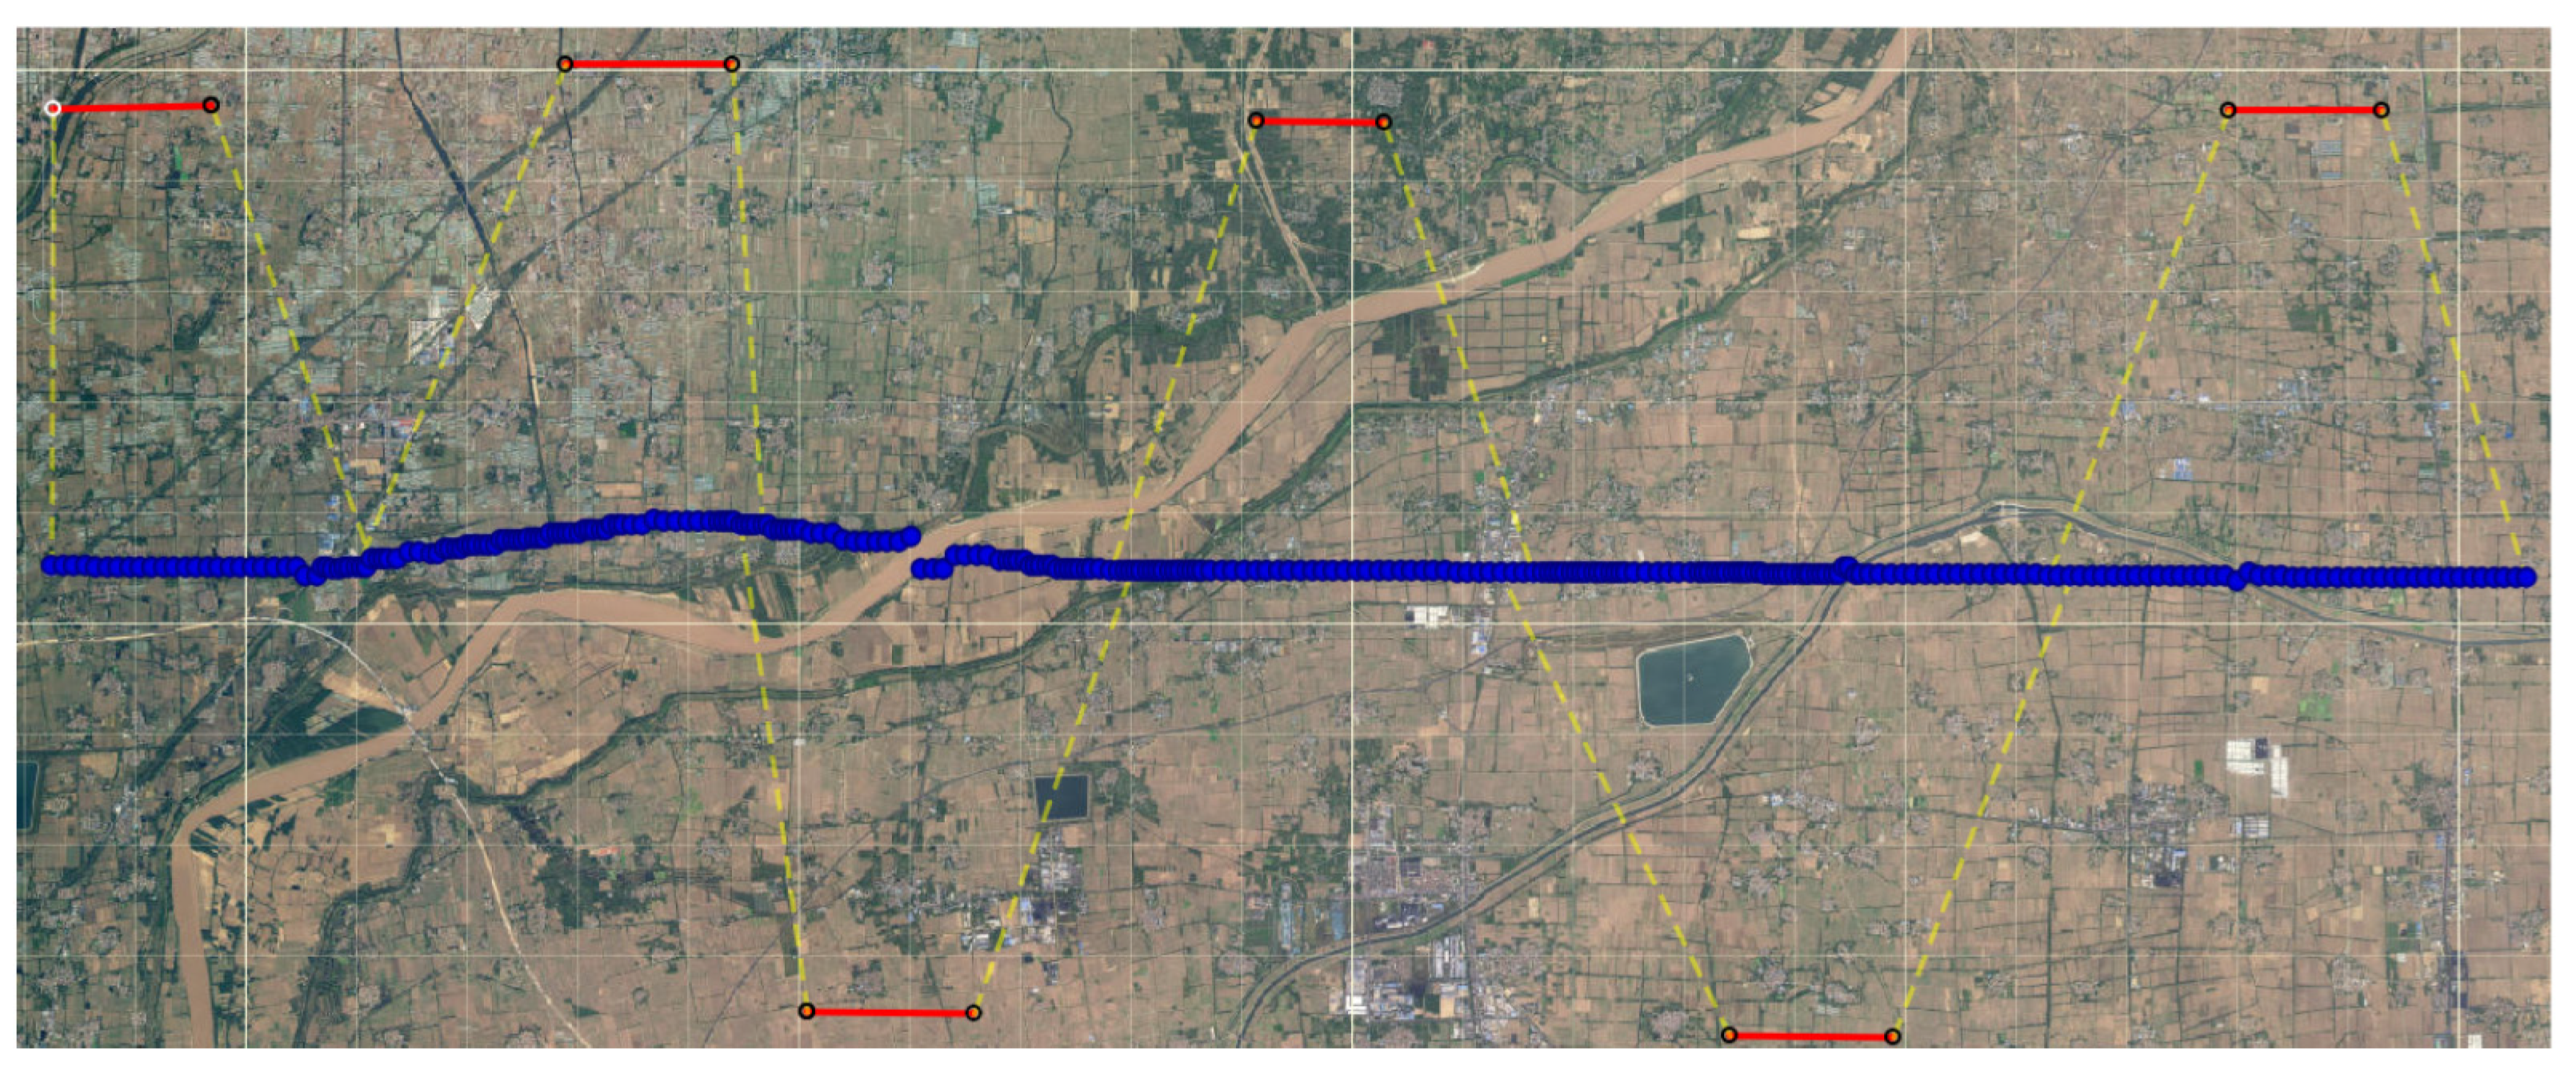
4.2. Solution of Wide Field Electromagnetic Detection
4.3. Data Processing and Result Analysis
4.3.1. Data Processing
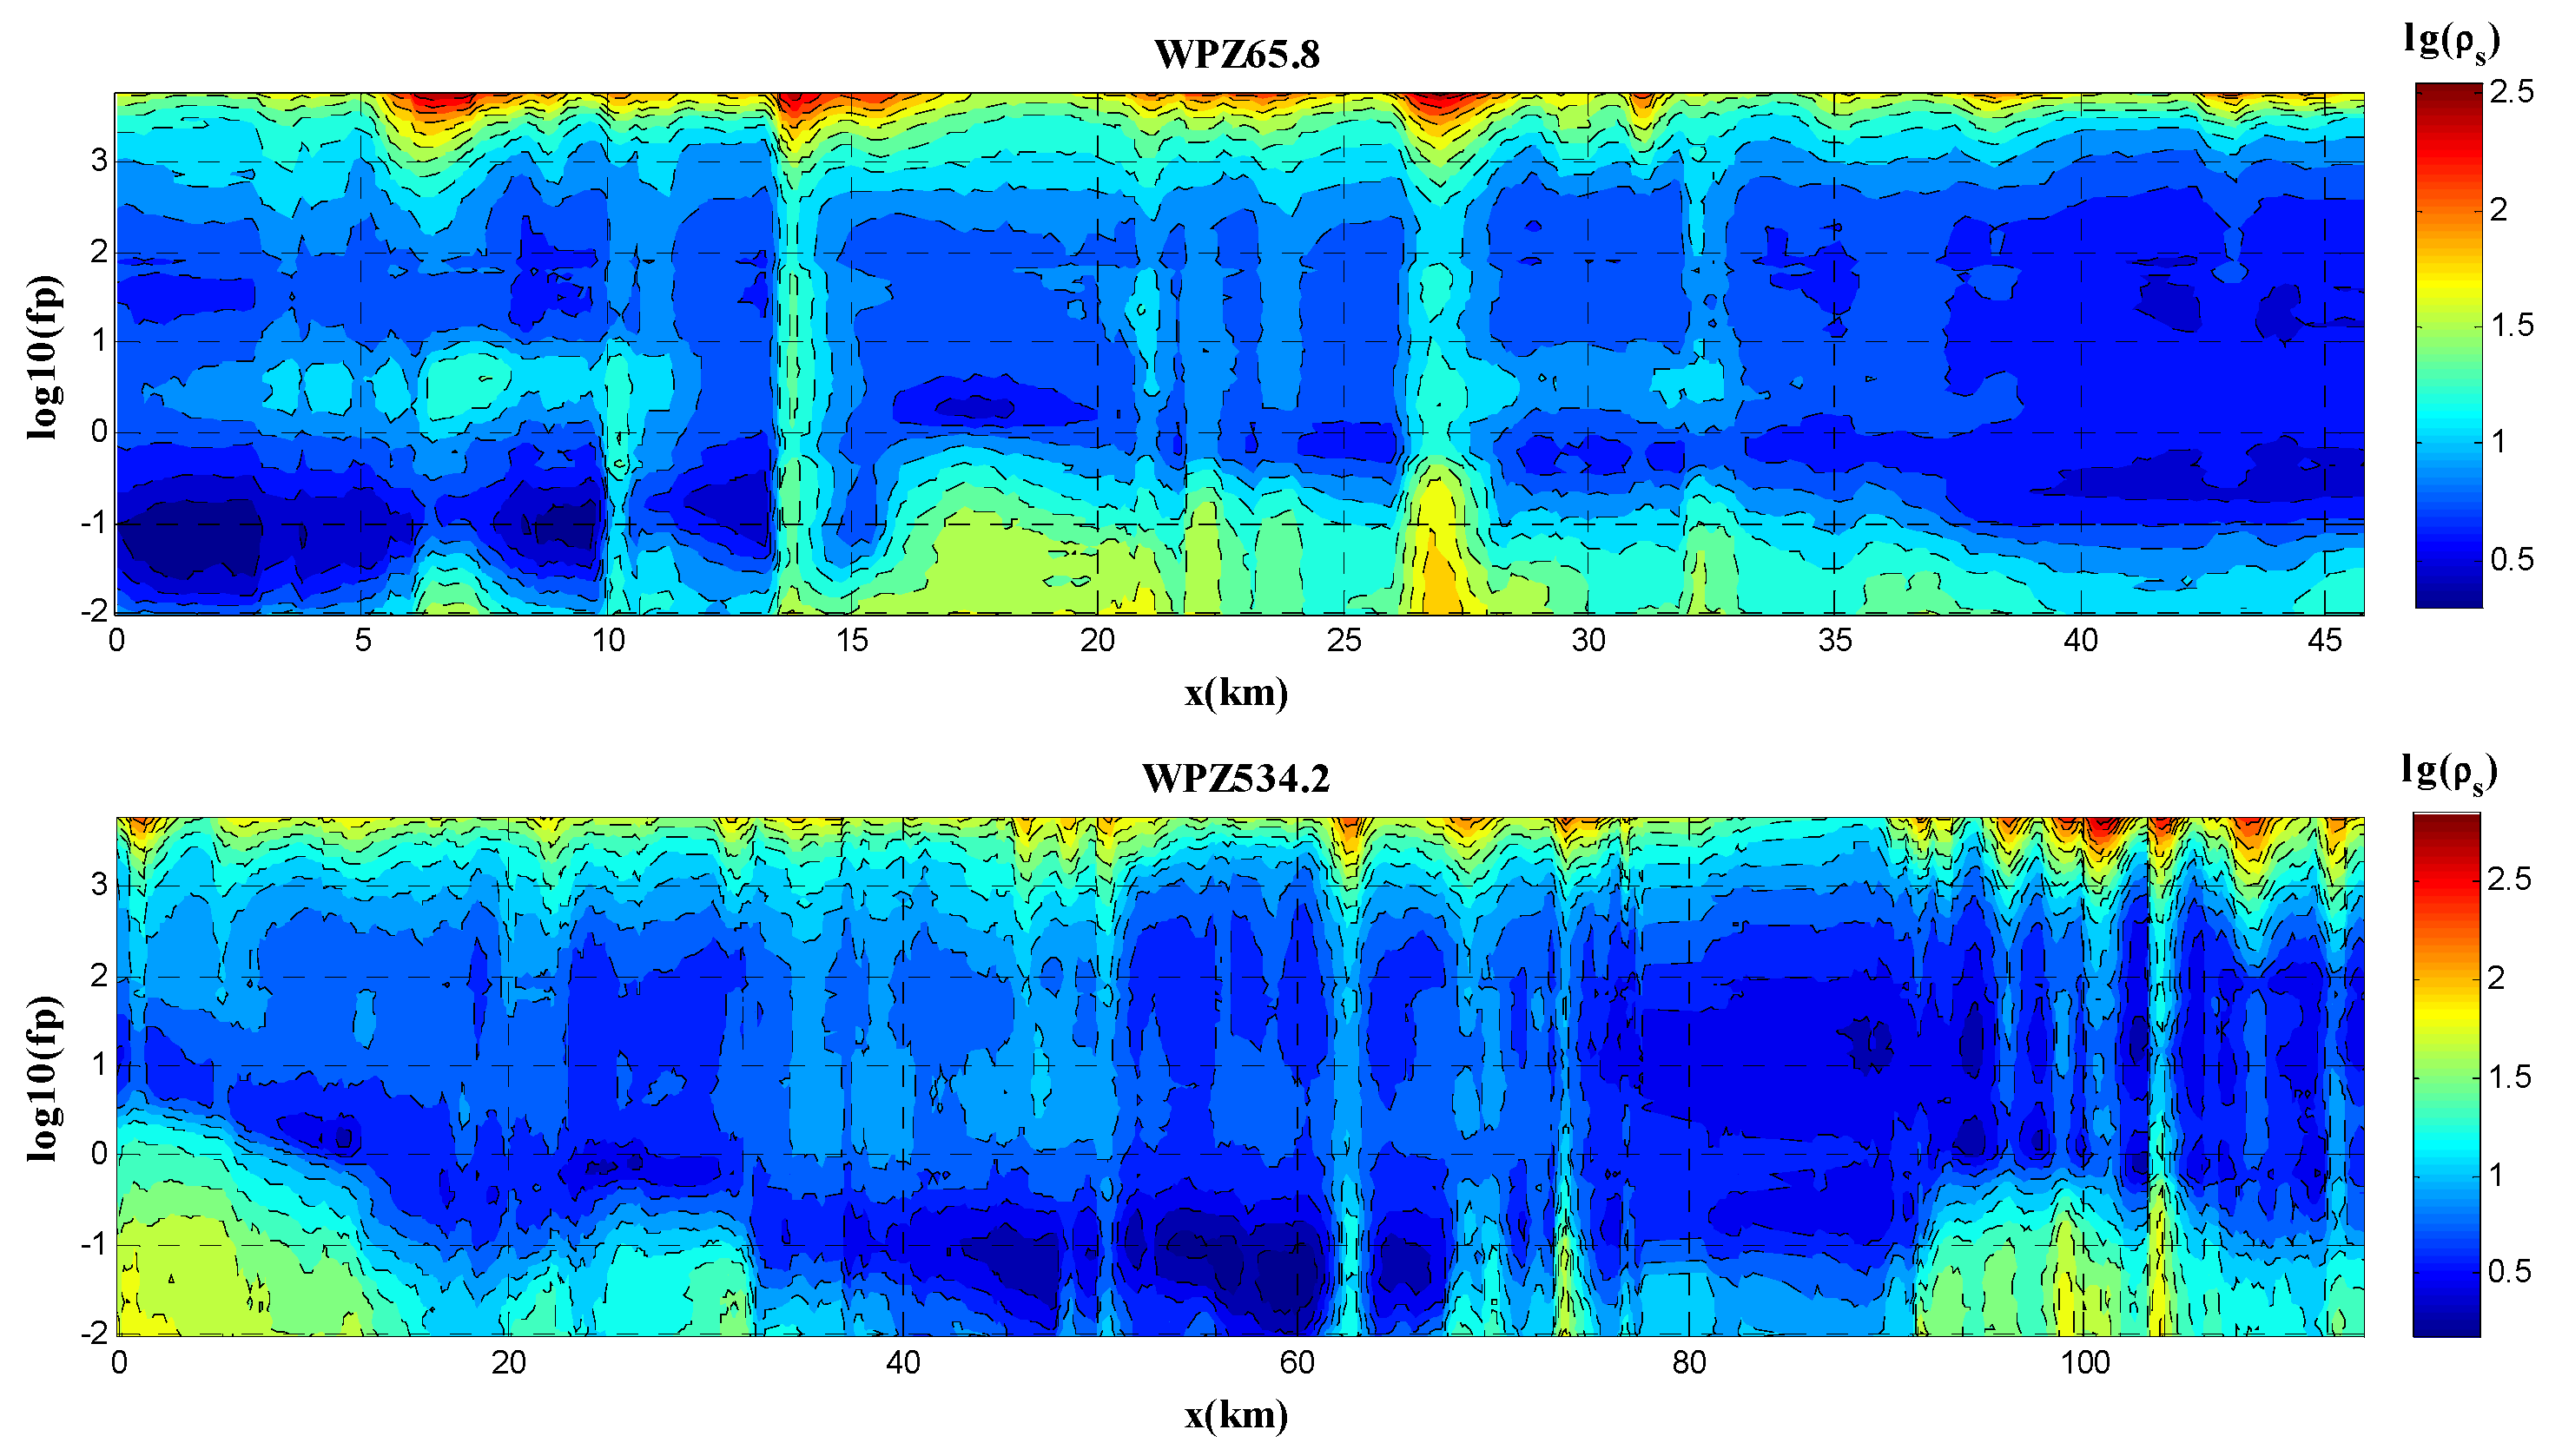
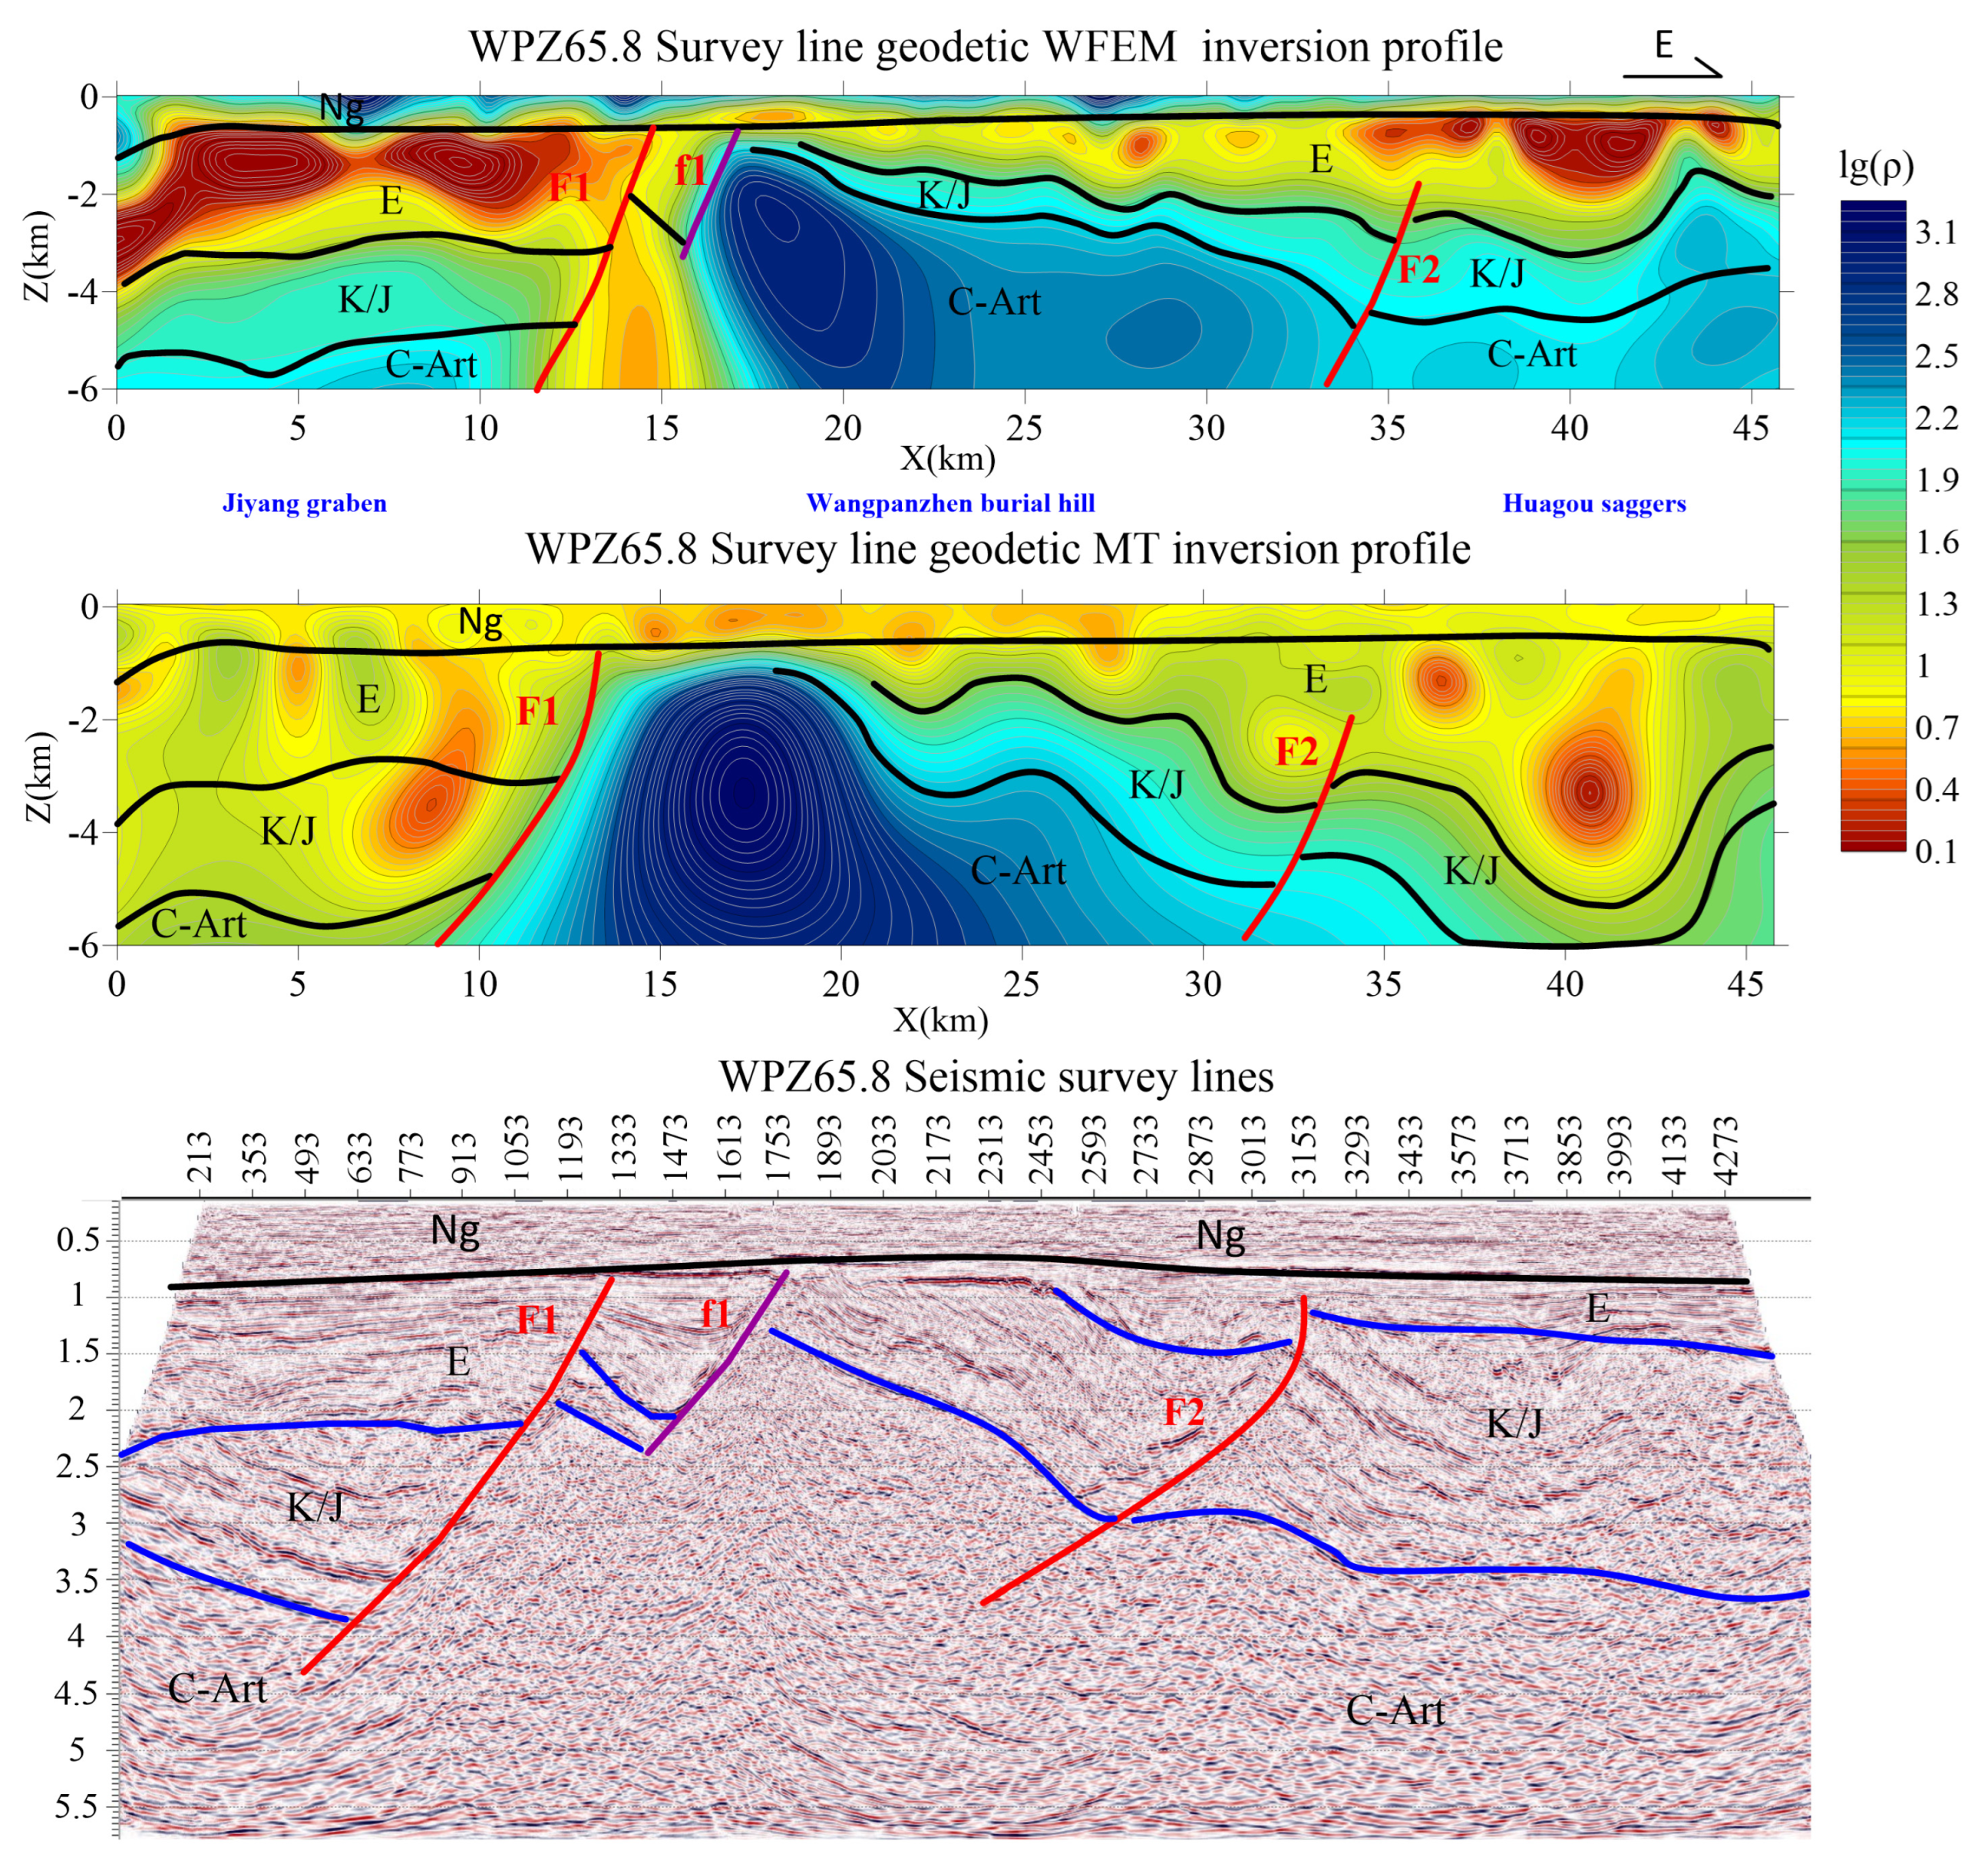
4.3.2. Analysis of the WFEM Detection Results of the Survey Line WPZ65.8
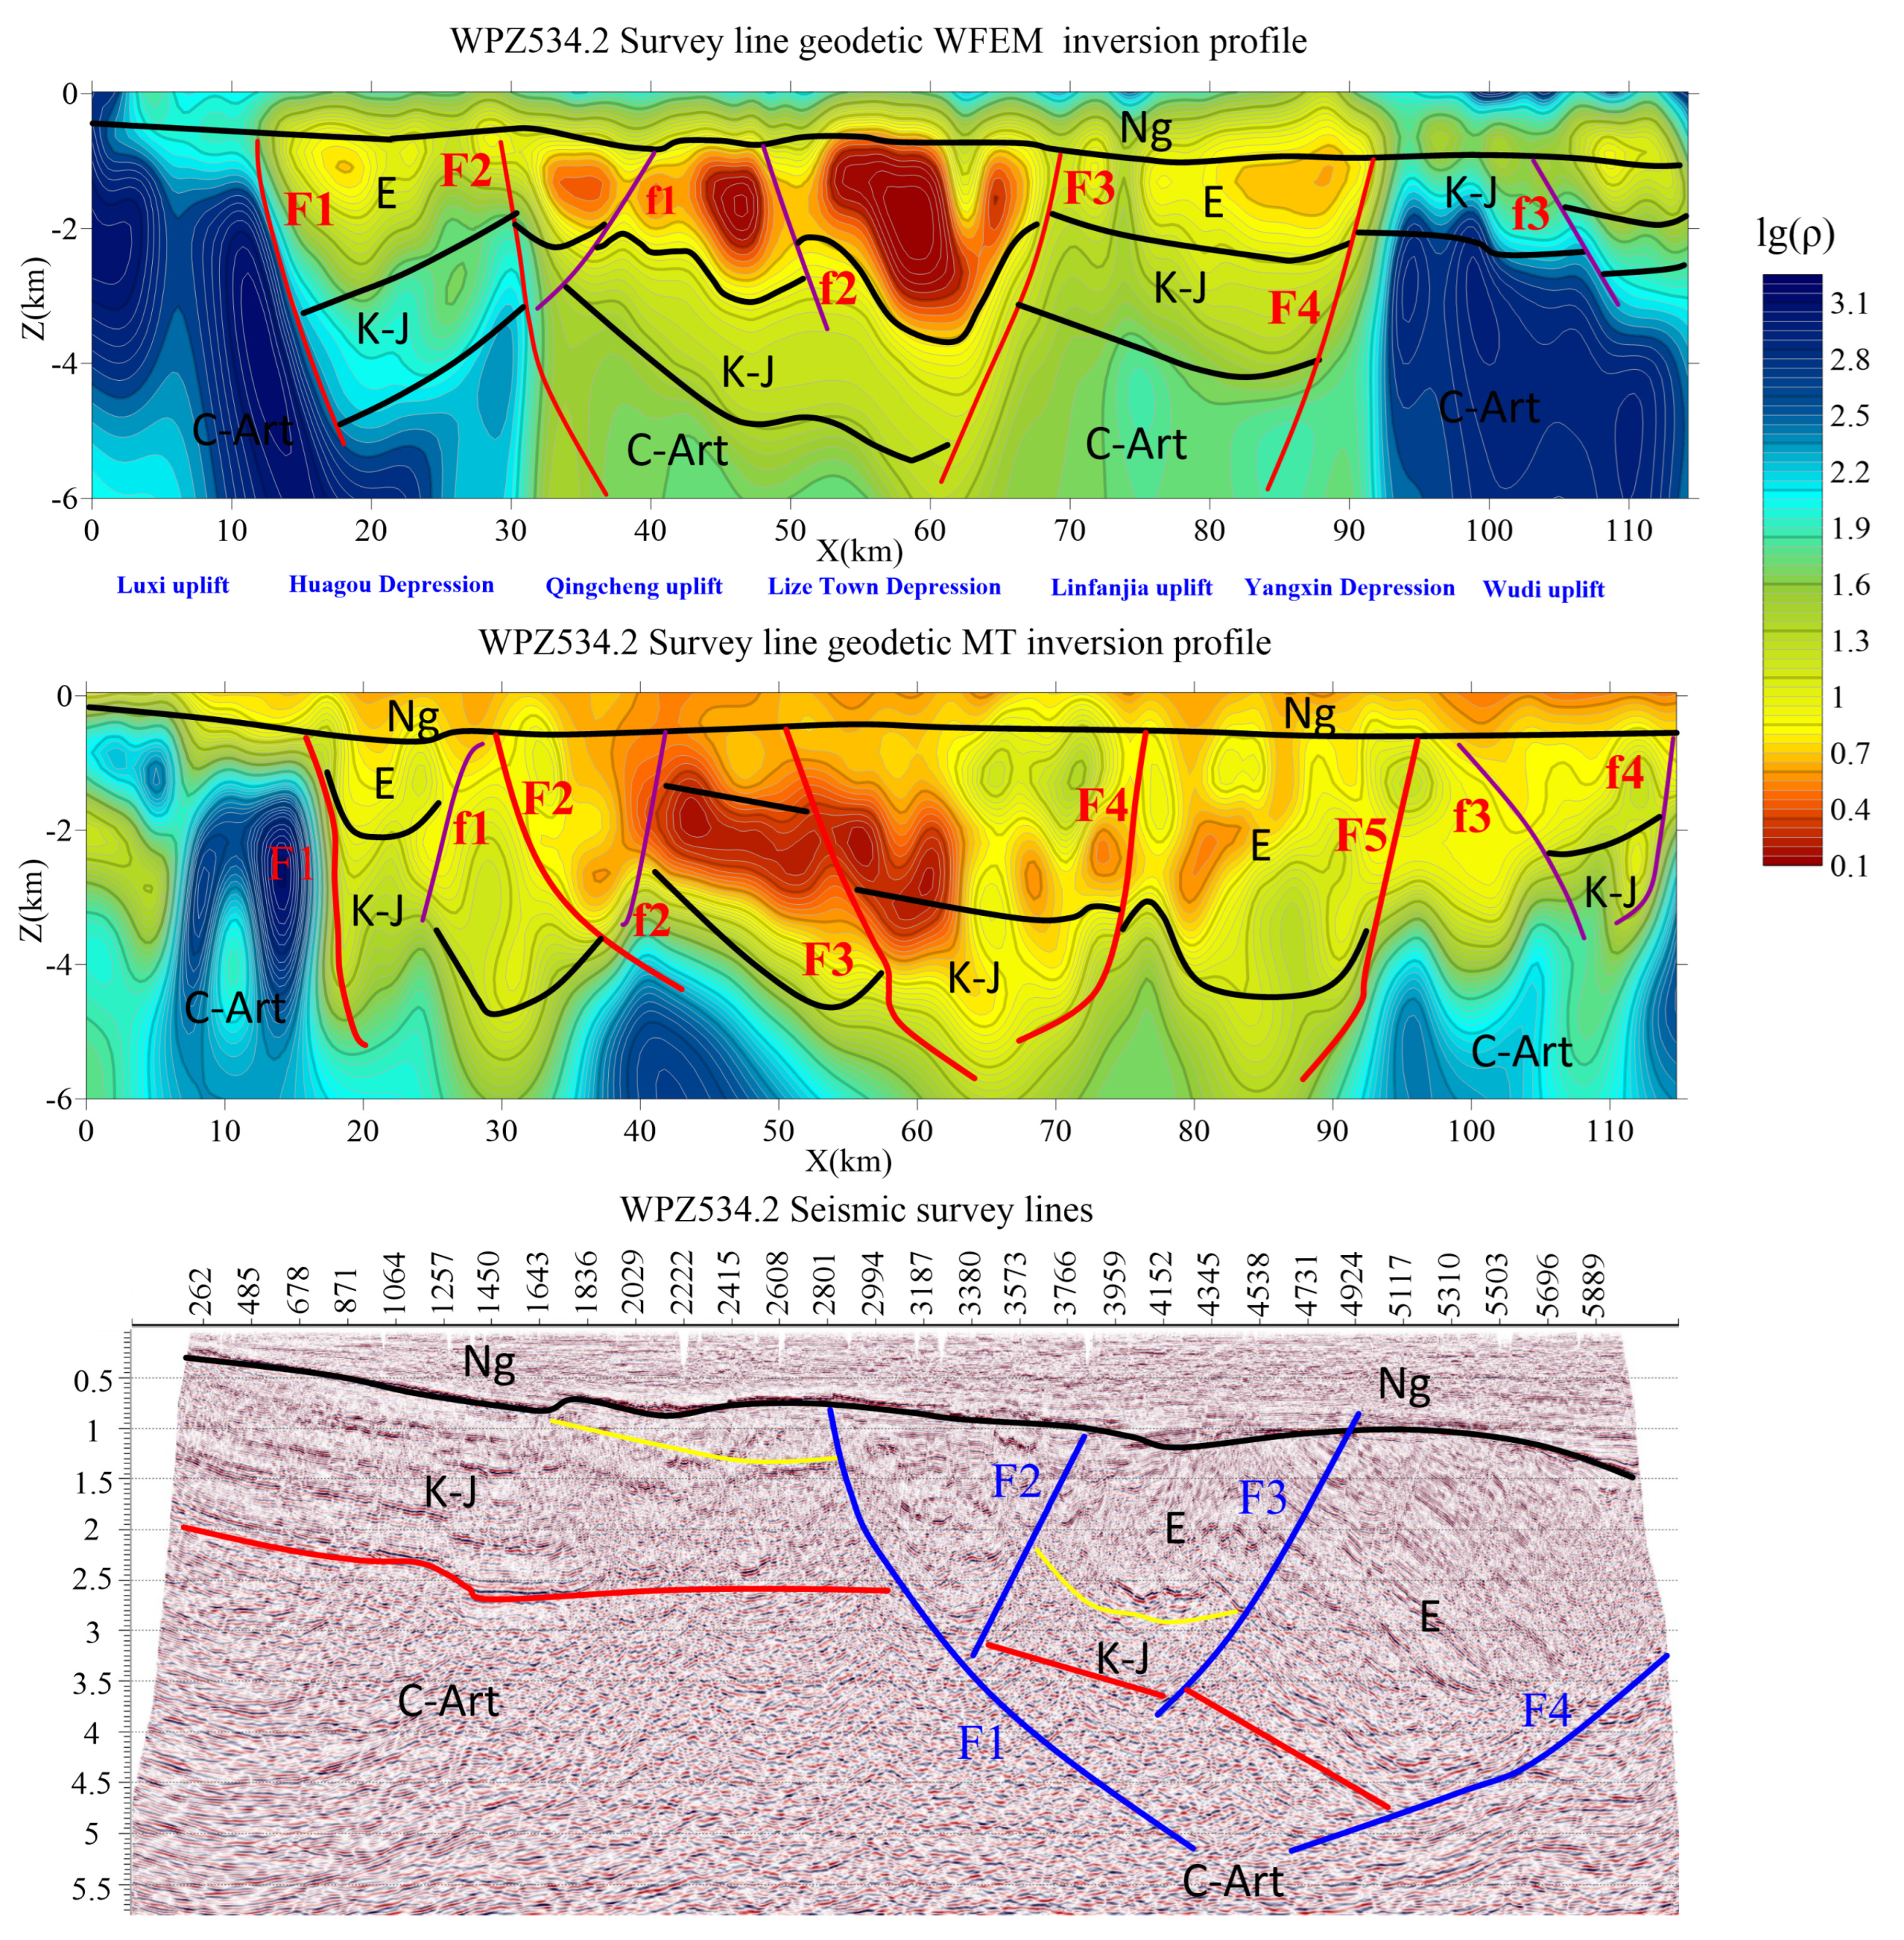
4.3.3. Analysis of the WFEM Detection Results of the Survey Line WPZ534.2
5. Conclusions
- (1)
- The numerical simulation results of the WFEM method revealed that for a hydrothermal geothermal resource target, detection is feasible when the thickness-to-depth ratio exceeds 1%, and the ratio of the thickness-to-depth ratio to the resistivity contrast ratio(the ratio of the target’s resistivity to the background resistivity) exceeds 10%. For hot dry rock geothermal resource targets, detection is feasible when the thickness-to-depth ratio exceeds 5%, and the product of the thickness-to-depth ratio and the resistivity contrast ratio is approximately greater than 25%.
- (2)
- It is difficult to detect the geothermal resources in the middle and deep layers. The WFEM method also faces a lot of difficulties in field source deployment, data acquisition, data processing and inversion algorithms. So, it is necessary to choose a suitable solution in fieldwork to improve the reliability of the detection results.
- (3)
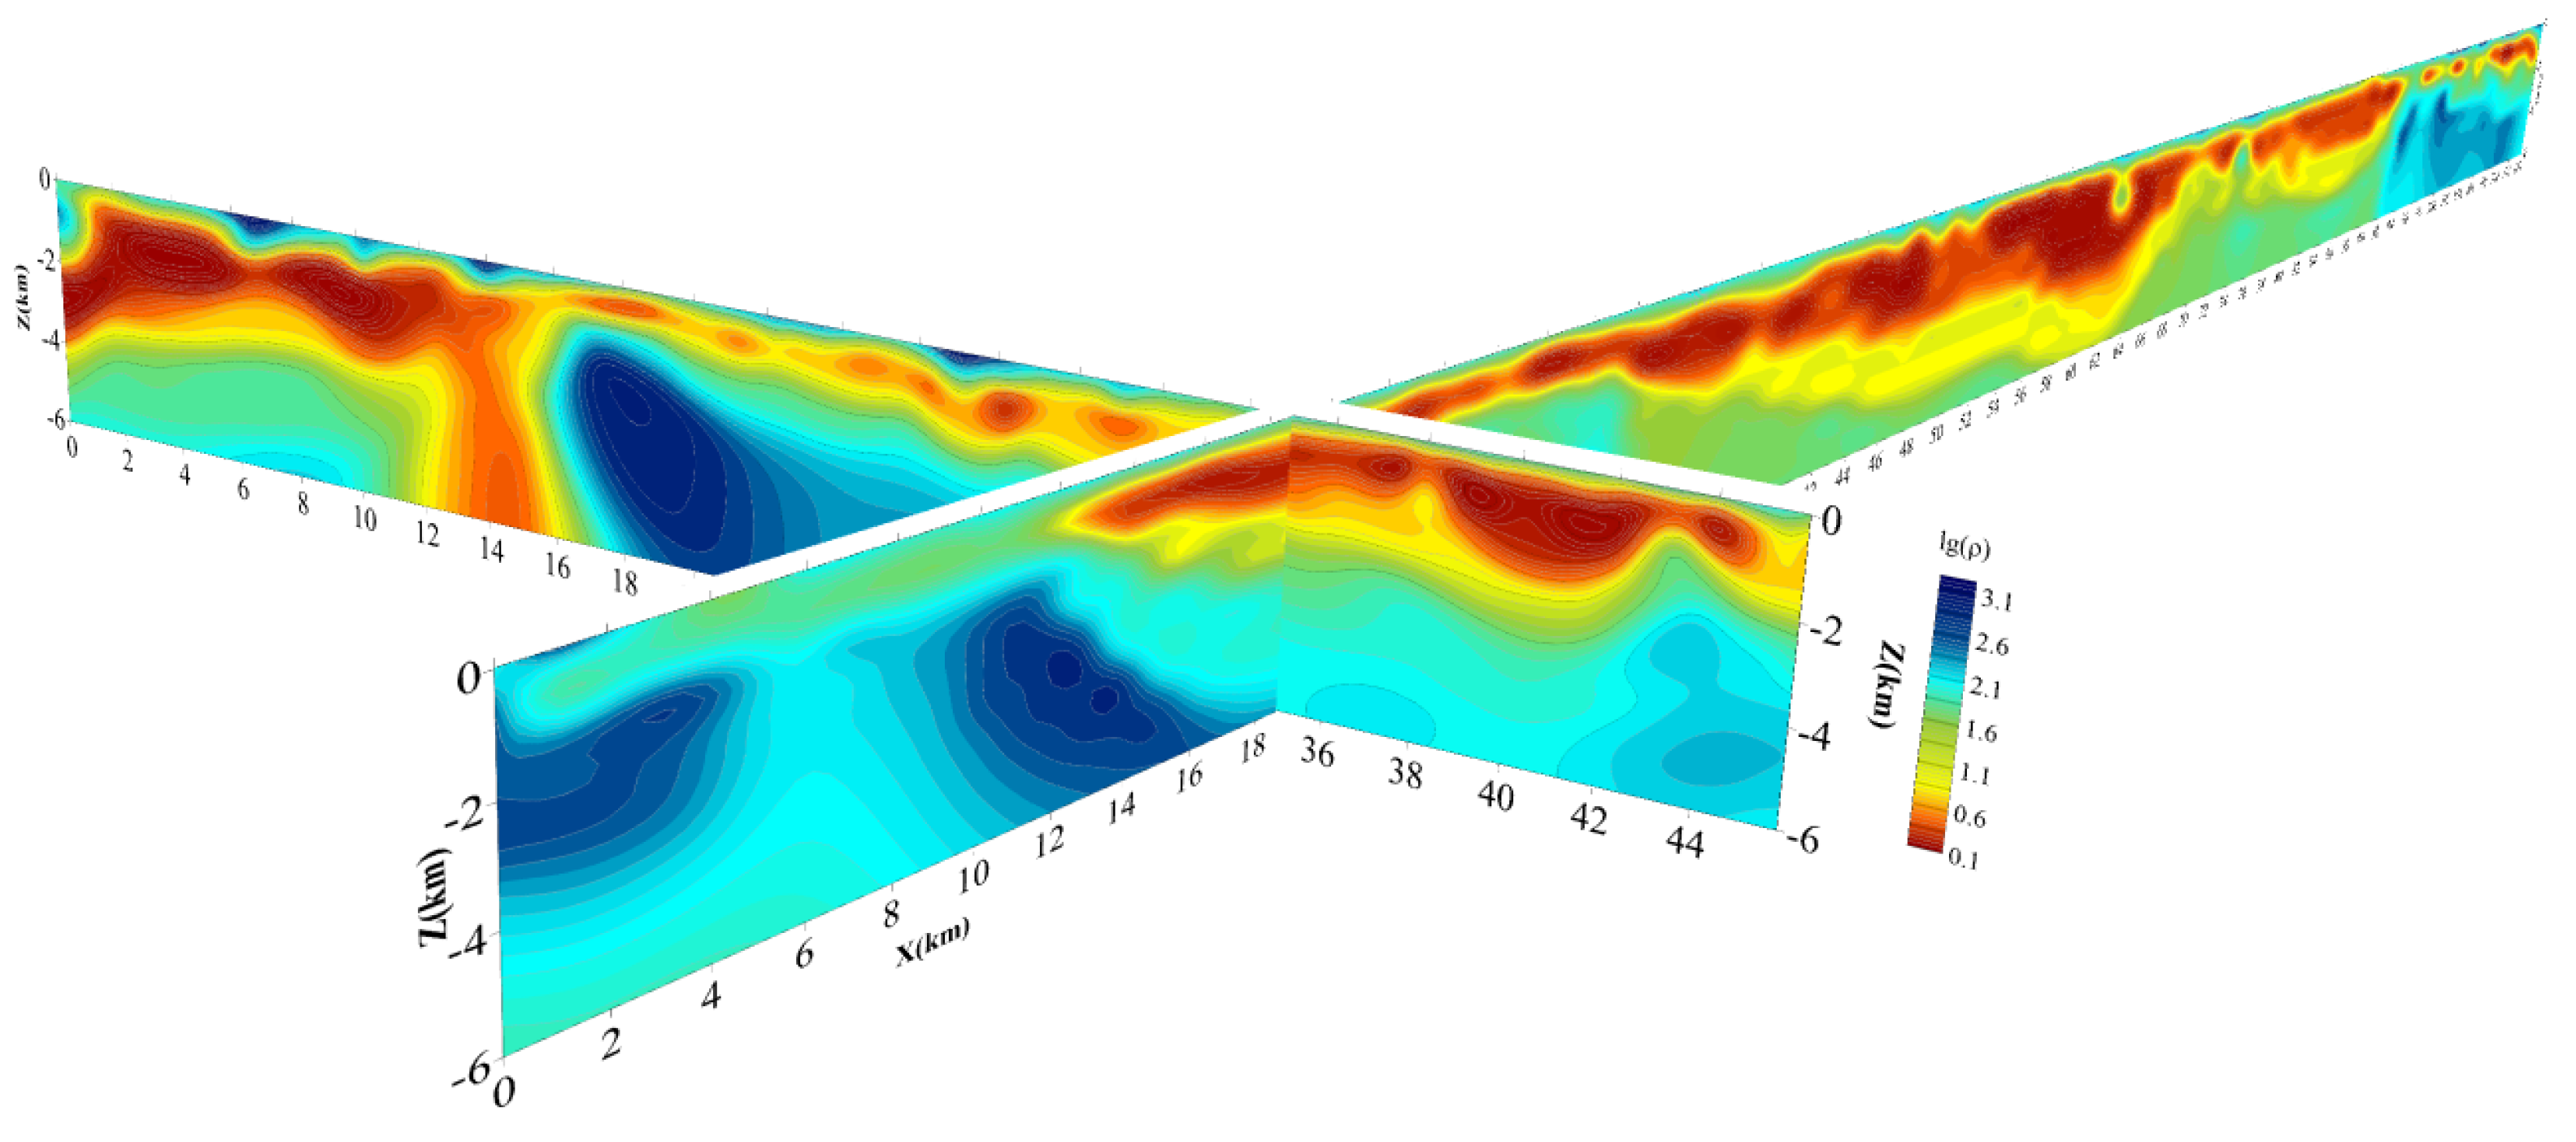
- Human interference is serious in geothermal energy detection in the middle and deep layers of the Jiyang Depression. The WFEM method has obtained raw data with a relatively high signal-to-noise ratio quality. The overall apparent resistivity profile is consistent with the changing trend of formation lithology, and the uplift and depression divisions are in good agreement with the actual geological conditions. The 2D WFEM inversion results can make mutual verification and reference with the magnetotelluric profile and seismic profile. On the premise of maintaining the consistency of the overall large structure, the shallow depth resolution of the WFEM inversion profile is higher with richer details than the others, which makes up for the weak links in the seismic profile.
- (4)
- According to the uplift and pattern of the depression and the distribution of the main heat-controlling structures, the Huagou depression is a mid-rise one, which has a well-developed caprock and a shallowly basement, sandwiched by two heat-controlling faults F1 and F2, possessing a high potential of both hydrothermal and hot dry rock geothermal resources, whereas the Linfanjia Uplift is an uplift in a depression, sandwiched by two deep thermal conductive faults F3 and F4, also having a high potential of deep geothermal resources.
- (5)
- WFEM methods are efficacious for probing medium to deep geothermal energy resources. However, practical applications encounter numerous challenges. It is recommended to employ a multiplicity of geophysical exploration techniques to enhance the reliability of detection outcomes.
Author Contributions
Funding
Data Availability Statement
Conflicts of Interest
References
- Soltani, M.; Kashkooli, F.M.; Dehghani-Sanij, A.R.; Nokhosteen, A.; Ahmadi-Joughi, A.; Gharali, K.; Mahbaz, S.B.; Dusseault, M.B. A comprehensive review of geothermal energy evolution and development. Int. J. Green Energy 2019, 16, 971–1009. [Google Scholar] [CrossRef]
- Dhar, A.; Naeth, M.A.; Jennings, P.D.; Gamal El-Din, M. Geothermal energy resources: Potential environmental impact and land reclamation. Environ. Rev. 2020, 28, 415–427. [Google Scholar] [CrossRef]
- Pang, Z.H.; Luo, J.; Cheng, Y.Z.; Duan, Z.F.; Tian, J.; Kong, Y.L.; Li, Y.M.; Hu, S.B.; Wang, J.Y. Evaluation of geological conditions for the development of deep geothermal enery in China. Earth Sci. Front. 2020, 27, 134–151. [Google Scholar]
- Wang, G.L.; Zhang, W.; Ma, F.; Lin, W.J.; Liang, J.Y.; Zhun, X. Overview on hydrothermal and hot dry rock researches in China. China Geol. 2018, 1, 273–285. [Google Scholar] [CrossRef]
- Wang, G.L.; Lin, W.J.; Liu, F.; Gan, H.N.; Wang, S.Q.; Yue, G.F.; Long, X.T.; Liu, Y.G. Theory and survey practice of deep heat accumulation in geothermal system and exploration practice. Acta Geol. Sin. 2023, 97, 639–660. [Google Scholar]
- Barbier, E. Geothermal energy technology and current status: An overview. Renew. Sustain. Energy Rev. 2002, 6, 3–65. [Google Scholar] [CrossRef]
- Kana, J.D.; Djongyang, N.; Raïdandi, D.; Nouck, P.N.; Dadjé, A. A review of geophysical methods for geothermal exploration. Renew. Sustain. Energy Rev. 2015, 44, 87–95. [Google Scholar] [CrossRef]
- Zhang, S.Q.; Li, X.F.; Song, J.; Wen, D.G.; Li, Z.W.; Li, D.P.; Cheng, Z.P.; Fu, L.; Zhang, L.Y.; Feng, Q.D.; et al. Analysis on geophysical evidence for existence of partial melting layer in crust and regional heat source mechanism for hot dry rock resources of Gonghe Basin. J. Earth Sci. 2021, 46, 1416. [Google Scholar]
- Van der Meer, F.; Hecker, C.; van Ruitenbeek, F.; van der Werff, H.; de Wijkerslooth, C.; Wechsler, C. Geologic remote sensing for geothermal exploration: A review. Int. J. Appl. Earth Obs. Geoinf. 2014, 33, 255–269. [Google Scholar] [CrossRef]
- Cagniard, L. Basic theory of the magnetotelluric method of geophysical prospecting. Geophysics 1953, 18, 605–635. [Google Scholar] [CrossRef]
- Marwan; Yanis, M.; Idroes, R.; Ismail, N. 2D inversion and static shift of MT and TEM data for imaging the geothermal resources of Seulawah Agam Volcano, Indonesia. Int. J. Geomate. 2019, 17, 173–180. [Google Scholar] [CrossRef]
- Spichak, V.; Manzella, A. Electromagnetic sounding of geothermal zones. J. Appl. Geophys. 2009, 68, 459–478. [Google Scholar] [CrossRef]
- Jegen, M.D.; Hobbs, R.W.; Tarits, P.; Chave, A. Joint inversion of marine magnetotelluric and gravity data incorporating seismic constraints. Earth Planet Sci. Lett. 2009, 282, 47–55. [Google Scholar] [CrossRef]
- Muñoz, G. Exploring for Geothermal Resources with Electromagnetic Methods. Surv. Geophys. 2014, 35, 101–122. [Google Scholar] [CrossRef]
- Ren, W.Q.; Ren, Z.Y.; Xue, G.Q.; Chen, W.Y.; Zhao, P.; Liu, J.L. Three-dimensional audio magnetotelluric imaging of the Yangyi geothermal field in Tibet, China. J. Appl. Geophys. 2023, 211, 104966. [Google Scholar] [CrossRef]
- Cheng, Z.P.; Lei, M.; Li, S.; Lian, S.; Wei, Q. Research on time-frequency electromagnetic method detection of deep karst thermal reservoir and prediction of favorable area in Dongli Lake of Tianjin. N. Chin. Geol. 2023, 46, 1–8. [Google Scholar]
- Kouadio, K.L.; Xu, Y.X.; Liu, C.M.; Boukhalfa, Z. Two-dimensional inversion of CSAMT data and three-dimensional geological mapping for groundwater exploration in Tongkeng Area, Hunan Province, China. J. Appl. Geophys. 2020, 183, 104204. [Google Scholar] [CrossRef]
- Wang, J.C.; Zhao, Z.G.; Gao, S.Y.; Luo, C.G.; Li, L.; Xu, M.Z.; Li, Y.; Yuan, G.J. Application of a comprehensive geophysical exploration methods in the exploration of geothermal resources in Yueliang, Binhai County. Geophys. Geochem. Explor. 2023, 47, 321–330. [Google Scholar]
- Wu, G.J.; Hu, X.Y.; Huo, G.P.; Zhou, X.C. Geophysical Exploration for geothermal resources: An Application of MT and CSAMT in Jiangxia, Wuhan, China. J. Earth Sci. 2012, 23, 757–767. [Google Scholar] [CrossRef]
- Hu, Y.F.; Li, D.Q.; Yuan, B.; Suo, G.Y.; Liu, Z.J. Application of pseudo-random frequency domain electromagnetic method in mining areas with strong interferences. Trans. Nonferrous Met. Soc. China 2020, 30, 774–788. [Google Scholar] [CrossRef]
- Zhu, Y.Q.; Li, D.Q.; Hu, Y.F.; Zhang, X.; Li, F.; Ma, F.; Wang, G.L. Deep structure of the Rongcheng geothermal field, Xiongan New Area: Constraints from resistivity data and boreholes. Geothermics 2023, 114, 102776. [Google Scholar] [CrossRef]
- Lüschen, E.; Wolfgramm, M.; Fritzer, T.; Dussel, M.; Thomas, R.; Schulz, R. 3D seismic survey explores geothermal targets for reservoir characterization at Unterhaching, Munich, Germany. Geothermics 2014, 50, 167–179. [Google Scholar] [CrossRef]
- Pussak, M.; Bauer, K.; Stiller, M.; Bujakowski, W. Improved 3D seismic attribute mapping by CRS stacking instead of NMO stacking: Application to a geothermal reservoir in the Polish Basin. J. Appl. Geophys. 2014, 103, 186–198. [Google Scholar] [CrossRef]
- Asrillah, A.; Abdullah, A.; Bauer, K.; Norden, B.; Krawczyk, C.M. Fracture characterisation using 3-D seismic reflection data for advanced deep geothermal exploration in the NE German Basin. Geothermics 2024, 116, 102833. [Google Scholar] [CrossRef]
- Represas, P.; Monteiro, S.F.A.; Ribeiro, J.; Ribeiro, J.A.; Almeida, E.P.; Gonçalves, R.; Moreira, M.; Mendes-Victor, L.M. Interpretation of gravity data to delineate structural features connected to low-temperature geothermal resources at Northeastern Portugal. J. Appl. Geophys. 2013, 92, 30–38. [Google Scholar] [CrossRef]
- Witter, J.B.; Siler, D.L.; Faulds, J.E.; Hinz, N.H. 3D geophysical inversion modeling of gravity data to test the 3D geologic model of the Bradys geothermal area, Nevada, USA. Geotherm. Energy 2016, 4, 14. [Google Scholar] [CrossRef]
- Pocasangre, C.; Fujimitsu, Y.; Nishijima, J. Interpretation of gravity data to delineate the geothermal reservoir extent and assess the geothermal resource from low-temperature fluids in the Municipality of Isa, Southern Kyushu, Japan. Geothermics 2020, 83, 101735. [Google Scholar] [CrossRef]
- He, J.S. Combined Application of Wide-Field Electromagnetic Method and Flow Field Fitting Method for High-Resolution Exploration: A Case Study of the Anjialing No.1 Coal Mine. Engineering 2018, 4, 188–205. [Google Scholar] [CrossRef]
- Tang, J.T.; He, J.S. The Method of CSAMT and Its Application; Central South University Press: Changsha, China, 2005. (In Chinese) [Google Scholar]
- Zhang, X.; Li, D.Q.; Li, J.; Liu, B.; Jiang, Q.Y.; Wang, J.H. Signal-Noise Identification for Wide Field Electromagnetic Method Data Using Multi-Domain Features and IGWO-SVM. Fractal Fract. 2022, 6, 80. [Google Scholar] [CrossRef]
- Xiao, J.Y. Application of Orthogonal Source Wide-Field Electromagnetic Method in the Detection of Water-Rich Area of Coal Mine; Central South University: Changsha, China, 2021. (In Chinese) [Google Scholar]
- Zhang, B.M.; Jiang, Q.Y.; Mo, D.; Xiao, L.Y. A novel method for handling gross errors in electromagnetic prospecting data. Chin. J. Geophys. 2015, 58, 2087–2102. [Google Scholar]
- Zhou, C.; Tang, J.T.; Pang, C.; Hu, S.G. A theory and simulation study on the space-time array hybrid source electromagnetic method. Chin. J. Geophys. 2019, 62, 3827–3842. [Google Scholar]
- Yang, Y.; He, J.S.; Li, D.Q. Energy distribution and effective components analysis of 2n sequence pseudo-random signal. Trans. Nonferrous Met. Soc. China 2021, 31, 2102–2115. [Google Scholar] [CrossRef]
- Ye, T.; Chen, X.B.; Yan, L.J. Reined techniques for data processing and two-dimensional inversion in magnetotelluric (Ⅲ): Using the Impressing Method to construct starting model of 2D magnetotelluric inversion. Chin. J. Geophys. 2013, 56, 3596–3606. [Google Scholar]
- Cui, Y.A.; Zhang, L.J.; Zhu, X.X.; Liu, J.X.; Guo, Z.W. Inversion for magnetotelluric data using the particle swarm optimization and regularized least squares. J. Appl. Geophys. 2020, 181, 104156. [Google Scholar] [CrossRef]
- Niu, Z.C.; Wang, Y.S.; Wang, X.J.; Zhang, X.J.; Wang, X.H.; Han, D.M.; Liu, X.; Wang, R.; Wang, J. Hydrocarbon Generation Potential of Pre-Paleogene Source Rocks in the Jiyang Depression. Geol. J. China Univer. 2022, 28, 73–85. [Google Scholar]
- Cheng, B.H.; Xu, L.; Xiang, X.Y.; Mu, X. Present-day geothermal field and thermal history of the Zhanhuadong Block, Jiyang depression. Chin. J. Geophys. 2001, 44, 238–244. [Google Scholar]
- Wang, L.S.; Liu, S.W.; Xiao, W.Y.; Li, C.; Li, H.; Guo, S.P.; Liu, B.; Luo, Y.H.; Cai, D.S. Characteristics of geothermal flux distribution in the Bohai Basin. Chin. Sci. B 2002, 151–155. [Google Scholar]
- Qiu, N.S.; Zuo, Y.H.; Zhou, X.H.; Li, C.C. Geothermal regime of the Bohai Offshore Area, Bohai Bay Basin, North China. Energy Explor. Exploit. 2010, 28, 327–350. [Google Scholar] [CrossRef]
- Wu, S.C. A systematic study of the Chinese petroliferous basins. Acta Pet. Sin. 1993, 14, 20–34. [Google Scholar]
- Gong, Y.L.; Wang, L.S.; Liu, S.W.; Guo, L.Z.; Cai, J.G. Distribution characteristics of geotemperature field in Jiyang depression, Shandong, north China. Chin. J. Geophys. 2003, 46, 652–658. [Google Scholar]
- Zong, G.H. Study on Tectonic Model and Hydrocarbon Accumulation in Jiyang Depression; Nanjing University: Nanjing, China, 1997. (In Chinese) [Google Scholar]
- Zhang, J.H.; Zhao, G.Z.; Xiao, Q.B.; Tang, J. Analysis of electric structure of the central Tan-Lu fault zone (Yi-Shu fault zone, 36°N) and seismogenic condition. Chin. J. Geophys. 2010, 53, 605–611. [Google Scholar]


| Depth of Target (m) | Thickness to Depth Ratio | Numerical Modeling Results | |||||||
|---|---|---|---|---|---|---|---|---|---|
| 2000 | 5% | Resistivity (Ωm) | 100 | 50 | 20 | 10 | 5 | 2 | 1 |
| Maximum abnormal amplitude (%) | / | 4.5 | 13.2 | 23.4 | 39.6 | 64.0 | 78.4 | ||
| Explorability(Yes or No) | / | N | Y | Y | Y | Y | Y | ||
| 2% | Resistivity (Ωm) | 100 | 50 | 20 | 10 | 5 | 2 | 1 | |
| Maximum abnormal amplitude (%) | / | 1.0 | 5.3 | 9.3 | 18.3 | 36.9 | 54.5 | ||
| Explorability(Yes or No) | / | N | Y | Y | Y | Y | Y | ||
| 1% | Resistivity (Ωm) | 100 | 50 | 20 | 10 | 5 | 2 | 1 | |
| Maximum abnormal amplitude (%) | / | 0.3 | 3.3 | 6.9 | 11.5 | 26.1 | 41.5 | ||
| Explorability(Yes or No) | / | N | N | Y | Y | Y | Y | ||
| 500 | 5% | Resistivity (Ωm) | 100 | 50 | 20 | 10 | 5 | 2 | 1 |
| Maximum abnormal amplitude (%) | 2.7 | 8.1 | 24.7 | 51.9 | 100 | 179 | 215 | ||
| Explorability(Yes or No) | N | Y | Y | Y | Y | Y | Y | ||
| 2% | Resistivity (Ωm) | 100 | 50 | 20 | 10 | 5 | 2 | 1 | |
| Maximum abnormal amplitude (%) | 1.4 | 4.1 | 12.4 | 26.5 | 54.3 | 123 | 184 | ||
| Explorability(Yes or No) | N | N | Y | Y | Y | Y | Y | ||
| 1% | Resistivity (Ωm) | 100 | 50 | 20 | 10 | 5 | 2 | 1 | |
| Maximum abnormal amplitude (%) | 0.92 | 2.7 | 8.3 | 17.7 | 36.5 | 89.3 | 152 | ||
| Explorability(Yes or No) | N | N | Y | Y | Y | Y | Y | ||
| Depth of Target (m) | Thickness to Depth Ratio | Numerical Modeling Results | |||||||
|---|---|---|---|---|---|---|---|---|---|
| 3000 | 28.5% | Resistivity (Ωm) | 100 | 200 | 500 | 1000 | 2000 | 5000 | 10,000 |
| Maximum abnormal amplitude (%) | / | 26.5 | 50.4 | 59.9 | 65.1 | 68.5 | 69.9 | ||
| Explorability | / | Y | Y | Y | Y | Y | Y | ||
| 3500 | 13.3% | Resistivity (Ωm) | 100 | 200 | 500 | 1000 | 2000 | 5000 | 10,000 |
| Maximum abnormal amplitude (%) | / | 11.3 | 19.8 | 23.0 | 24.7 | 25.7 | 26.2 | ||
| Explorability | / | Y | Y | Y | Y | Y | Y | ||
| 3800 | 5.1% | Resistivity (Ωm) | 100 | 200 | 500 | 1000 | 2000 | 5000 | 10,000 |
| Maximum abnormal amplitude (%) | / | 4.1 | 6.8 | 7.7 | 8.2 | 8.6 | 8.7 | ||
| Explorability | / | N | Y | Y | Y | Y | Y | ||
| Depth Range | Geothermal Gradient (°C/km) | ||||||||
|---|---|---|---|---|---|---|---|---|---|
| Jiyang Depression | Dongying Depression | Huimin Depression | Zhanhua Depression | Chezhen Depression | |||||
| Average Value | Range | Average Value | Range | Average Value | Range | Average Value | Range | Average Value | |
| 0~2 km | 36.9 | 25.5~45.0 | 36.5 | 27.9~43.2 | 34.9 | 30.1~44.9 | 37.6 | 29.5~42.5 | 36.5 |
| 2~3 km | 35.2 | 29.6~44.0 | 35.3 | 29.0~39.5 | 34.4 | 24.2~44.7 | 35.5 | 28.1~42.0 | 35.2 |
| 3~4 km | 30 | 29.9~33.1 | 33.8 | 21.1~38.4 | 30 | 20.9~44.8 | 34.5 | 27.1~38.0 | 33.1 |
| >4 km | 29 | <29.0 | <26.0 | <32 | <28.0 | ||||
| Total average | 35.5 | 35.5 | 34.6 | 36.1 | 35.4 | ||||
| Line Number | Measuring Line Length | WFEM | MT | ||
|---|---|---|---|---|---|
| Measuring Point | Checking Point | Measuring Point | Checking Point | ||
| WPZ65.8 | 44.3 | 294 | 12 | 45 | 3 |
| WPZ534.2 | 106.0 | 755 | 27 | 66 | 3 |
| Well-side sounding | - | - | - | 2 | - |
| Summation | 150.3 | 1049 | 39 | 113 | 6 |
Disclaimer/Publisher’s Note: The statements, opinions and data contained in all publications are solely those of the individual author(s) and contributor(s) and not of MDPI and/or the editor(s). MDPI and/or the editor(s) disclaim responsibility for any injury to people or property resulting from any ideas, methods, instructions or products referred to in the content. |
© 2024 by the authors. Licensee MDPI, Basel, Switzerland. This article is an open access article distributed under the terms and conditions of the Creative Commons Attribution (CC BY) license (https://creativecommons.org/licenses/by/4.0/).
Share and Cite
Fu, G.; Li, Z.; Zhang, Q.; Guo, T.; Jiang, Q.; Yang, Y.; Chen, X.; Lei, C.; Li, J. The Applications of WFEM in the Exploration of Medium-Depth Geothermal Resources. Energies 2024, 17, 1904. https://doi.org/10.3390/en17081904
Fu G, Li Z, Zhang Q, Guo T, Jiang Q, Yang Y, Chen X, Lei C, Li J. The Applications of WFEM in the Exploration of Medium-Depth Geothermal Resources. Energies. 2024; 17(8):1904. https://doi.org/10.3390/en17081904
Chicago/Turabian StyleFu, Guoqiang, Zhuqiang Li, Qiangjiang Zhang, Tao Guo, Qiyun Jiang, Yonghong Yang, Xueguo Chen, Chuang Lei, and Jie Li. 2024. "The Applications of WFEM in the Exploration of Medium-Depth Geothermal Resources" Energies 17, no. 8: 1904. https://doi.org/10.3390/en17081904
APA StyleFu, G., Li, Z., Zhang, Q., Guo, T., Jiang, Q., Yang, Y., Chen, X., Lei, C., & Li, J. (2024). The Applications of WFEM in the Exploration of Medium-Depth Geothermal Resources. Energies, 17(8), 1904. https://doi.org/10.3390/en17081904