Article

A Comparative Study of Time-Evolution Characteristics of Single and Double Cavity Partial Discharges

by
Isaac Kwabena Kyere
1,*,
Cuthbert Nyamupangedengu
1 and
Andrew Graham Swanson
2
1
Department of Electrical Engineering, Faculty of Engineering and Technology, Vaal University of Technology, Private Bag X021, Vanderbijlpark 1900, South Africa
2
Discipline of Electrical, Electronic and Computer Engineering, University of KwaZulu Natal, Durban 4041, South Africa
*
Author to whom correspondence should be addressed.
Energies 2024, 17(8), 1905; https://doi.org/10.3390/en17081905
Submission received: 1 February 2024 / Revised: 3 April 2024 / Accepted: 9 April 2024 / Published: 17 April 2024
(This article belongs to the Special Issue Partial Discharge Monitoring and Analysis)

Abstract

:
Partial discharge (PD) in cavities can lead to a breakdown in solid insulation and, therefore, indicate the onset of aging in electrical equipment. It is necessary to investigate the activity of single- and double-cavity PD under aging conditions, which is the focus of this study. The results obtained can be useful in monitoring the condition of insulation systems. The factors (pressure, effective work function, and charge decay time constant) that influence PD behaviour under different test conditions were permutated in a PD model. The simulation results agree with measurements obtained for the same applied voltage. The model can generate PD pulse distribution shapes similar to the measured PD of single and double cavities. Both turtle-like and rabbit-ear-like phase-resolved PD (PRPD) patterns were observed during the aging process of the samples in both double and single cavities. This study concludes that the identification of the PD pattern achieved in this work for closely coupled cavities is a step towards characterizing multiple defects phenomena through PD evolution patterns.

1. Introduction

Reliable electrical energy supply is the most sought-after resource today [1]. Dielectric materials are critical to the reliable operation of electrical equipment. They are used as electric stress control materials in a variety of applications, including electronics and high-voltage equipment [2]. Compared to other insulating materials, polymeric materials have many advantages, including elasticity, low manufacturing cost, resistance to chemicals, and thermal stability [3]. In electric power equipment, polyethylene is used as an electrical insulation material due to its excellent mechanical and electrical properties.
The most common cause of power equipment failure is weak insulation [4]. PD in air cavities embedded in solid insulation can lead to dielectric breakdown and therefore indicate the onset of aging in high-voltage equipment (HV) [5,6,7]. According to the IEC 60270 standard [8], PDs are localized electrical discharges that partially bridge the insulation between conductors, which may or may not occur adjacent to a conductor.
There are different types of partial discharges, such as surface discharges, corona discharges, and cavity discharges, but the most studied and harmful are cavity discharges. The concept of PD diagnosis is that if one can measure and identify PD in equipment, one can then determine the type of defect and devise a preventative asset management strategy to ensure reliability. The strength of the solution to the reliability problem of electrical equipment based on PD is in the correctness of the interpretation of PD signals, which is diagnosis. Most of the knowledge used to interpret PDs is derived from research studies that have been conducted on single air cavities. However, in real-life equipment, single-cavity PD defects rarely occur. This means that the interpretation of PDs is not yet fully mature. Based on the knowledge that already exists, standards have been developed, and the interpretation of partial discharges in equipment has been developed.
Interpretation in PD diagnosis is largely based on single-cavity PD knowledge and yet, such knowledge is extended to multiple-cavity cases. The knowledge gaps must be filled. The question is whether the PD signal characteristics of a single cavity are the same as those of double cavities? Furthermore, since PD activity is known to evolve with time, how does the evolution of single-cavity PD signals compare with those of closely coupled cavities? Studying how partial discharge behaves in two cavities that are closely coupled in an insulation material and comparing that to the single cavity will provide additional knowledge of PD phenomena.
The present paper begins with a review of the knowledge of the evolutionary nature of partial discharges in Section 2. The experimental design and results are presented in Section 3, which comprises the test sample setup and experimental setup. Section 4 deals with the analysis and discussions of the results. Finally, the concluding points are in Section 5.

2. The Evolutionary Nature of Partial Discharges: A Review of Existing Knowledge

Partial discharges typically begin with the presence of localized defects or impurities within the insulation material. During the production process of polymeric insulation systems, defects such as cracks, impurities, and voids may be inevitable [9,10]. When sufficient electric stress is applied to these defects, it can initiate partial discharges. Once initiated, PDs tend to grow in intensity and repetition rate if the electric field remains above the PD inception threshold. The PD growth phase is characterized by the discharge activity becoming more frequent and the discharge magnitudes increasing over time. It is important to note that PDs can vary in terms of their intensity, frequency, and location within the insulation material.
In insulation cavity defects, the PD bridges only the cavity and does not bridge the entire insulation between electrodes. Air-filled cavities have lower permittivity than the surrounding polymeric materials, which causes the electric field inside the cavity to rise above the material and cause PD inside the cavity [11,12]. During PD activity, the air turns from non-conductive to conductive, causing the electric field within the cavity to drop from a high to a low value in a relatively short time [13]. The PD activity therefore has feedback processes that affect the nature of the subsequent PD characteristics. PD evolution is subsequently non–linear.
Repeated PD causes the material to chemically degrade over time. The conductivity of the surface of the cavity can be increased by PD byproducts. The pressure in the cavity may change as a result of the generation of gaseous byproducts, depending on the type of gas in the cavity and the material around it [14]. During a PD event, high-energy charges can disrupt the chemical bonds of the insulation, causing the dielectric to deteriorate, while discharge byproducts such as ozone or nitric acid can speed up the process [15,16].
The degradation reduces the dielectric strength of the insulation. Electrical treeing is generally the final stage of PD failure. Electrical treeing occurs when the cumulative action of PD in a cavity causes the material to create many, branching, partially conducting discharge channels [17,18]. Electrical branching, which forms a conductive conduit between electrodes, is a key degradation mechanism that can lead to insulation breakdown [18,19,20]. Table 1 shows some of the research findings from the literature on single-cavity PD.
With reference to Table 1, it can be concluded that PD activity and corresponding PD signal parameters evolve with the time of continuous PD activity.
Many researchers, especially in laboratory experiments, focused mainly on the study of single cavities. This is logical since the primary goal is to understand the discharge activity in one cavity before moving on to study more complex insulating systems. However, in real life, multiple cavities may exist [27]. Much less has been studied regarding the feasibility of two nearby cavities in a solid dielectric [28] and their discharge behaviour. Danikas [29] used measurements to analyse the behaviour of two neighbouring voids in polyethylene samples and to determine whether one void can influence the other. The author reports that the fact that one of the voids discharges first depends on the available seed electrons, their positioning in each of the voids, and the micro geometry of the voids. The author also reported that the apparent charge magnitudes for the double cavities were 55% more than those of a single cavity. Some studies have shown that a triggering mechanism may be at work in adjacent closed cavities, and that a breakdown in one cavity may trigger a breakdown in the other cavity [30,31]. Additionally, it has been reported that the voltage or current wave profile of the recorded discharge pulses may not be significantly different between a single cavity and closely coupled cavities.
The apparent charge magnitude may be different. This could be attributed to the triggering mechanism [32,33]. However, more studies are needed to further understand PD mechanisms in double cavities.
While there has been some work performed on characterizing double-cavity PDs, as summarized in Table 2, the aspect of the time evolution of PD activity in double cavities has not yet been widely explored. Most published work has focused on measuring and modelling PD events within double cavities. It is notable that in Table 2, four out of six studies are based on simulations and not on measurements. Therefore, it is imperative to investigate the activity of PD in more than one cavity under aging conditions, which is the focus of this study. Table 2 gives an overview of the research landscape on double-cavity PD phenomena.

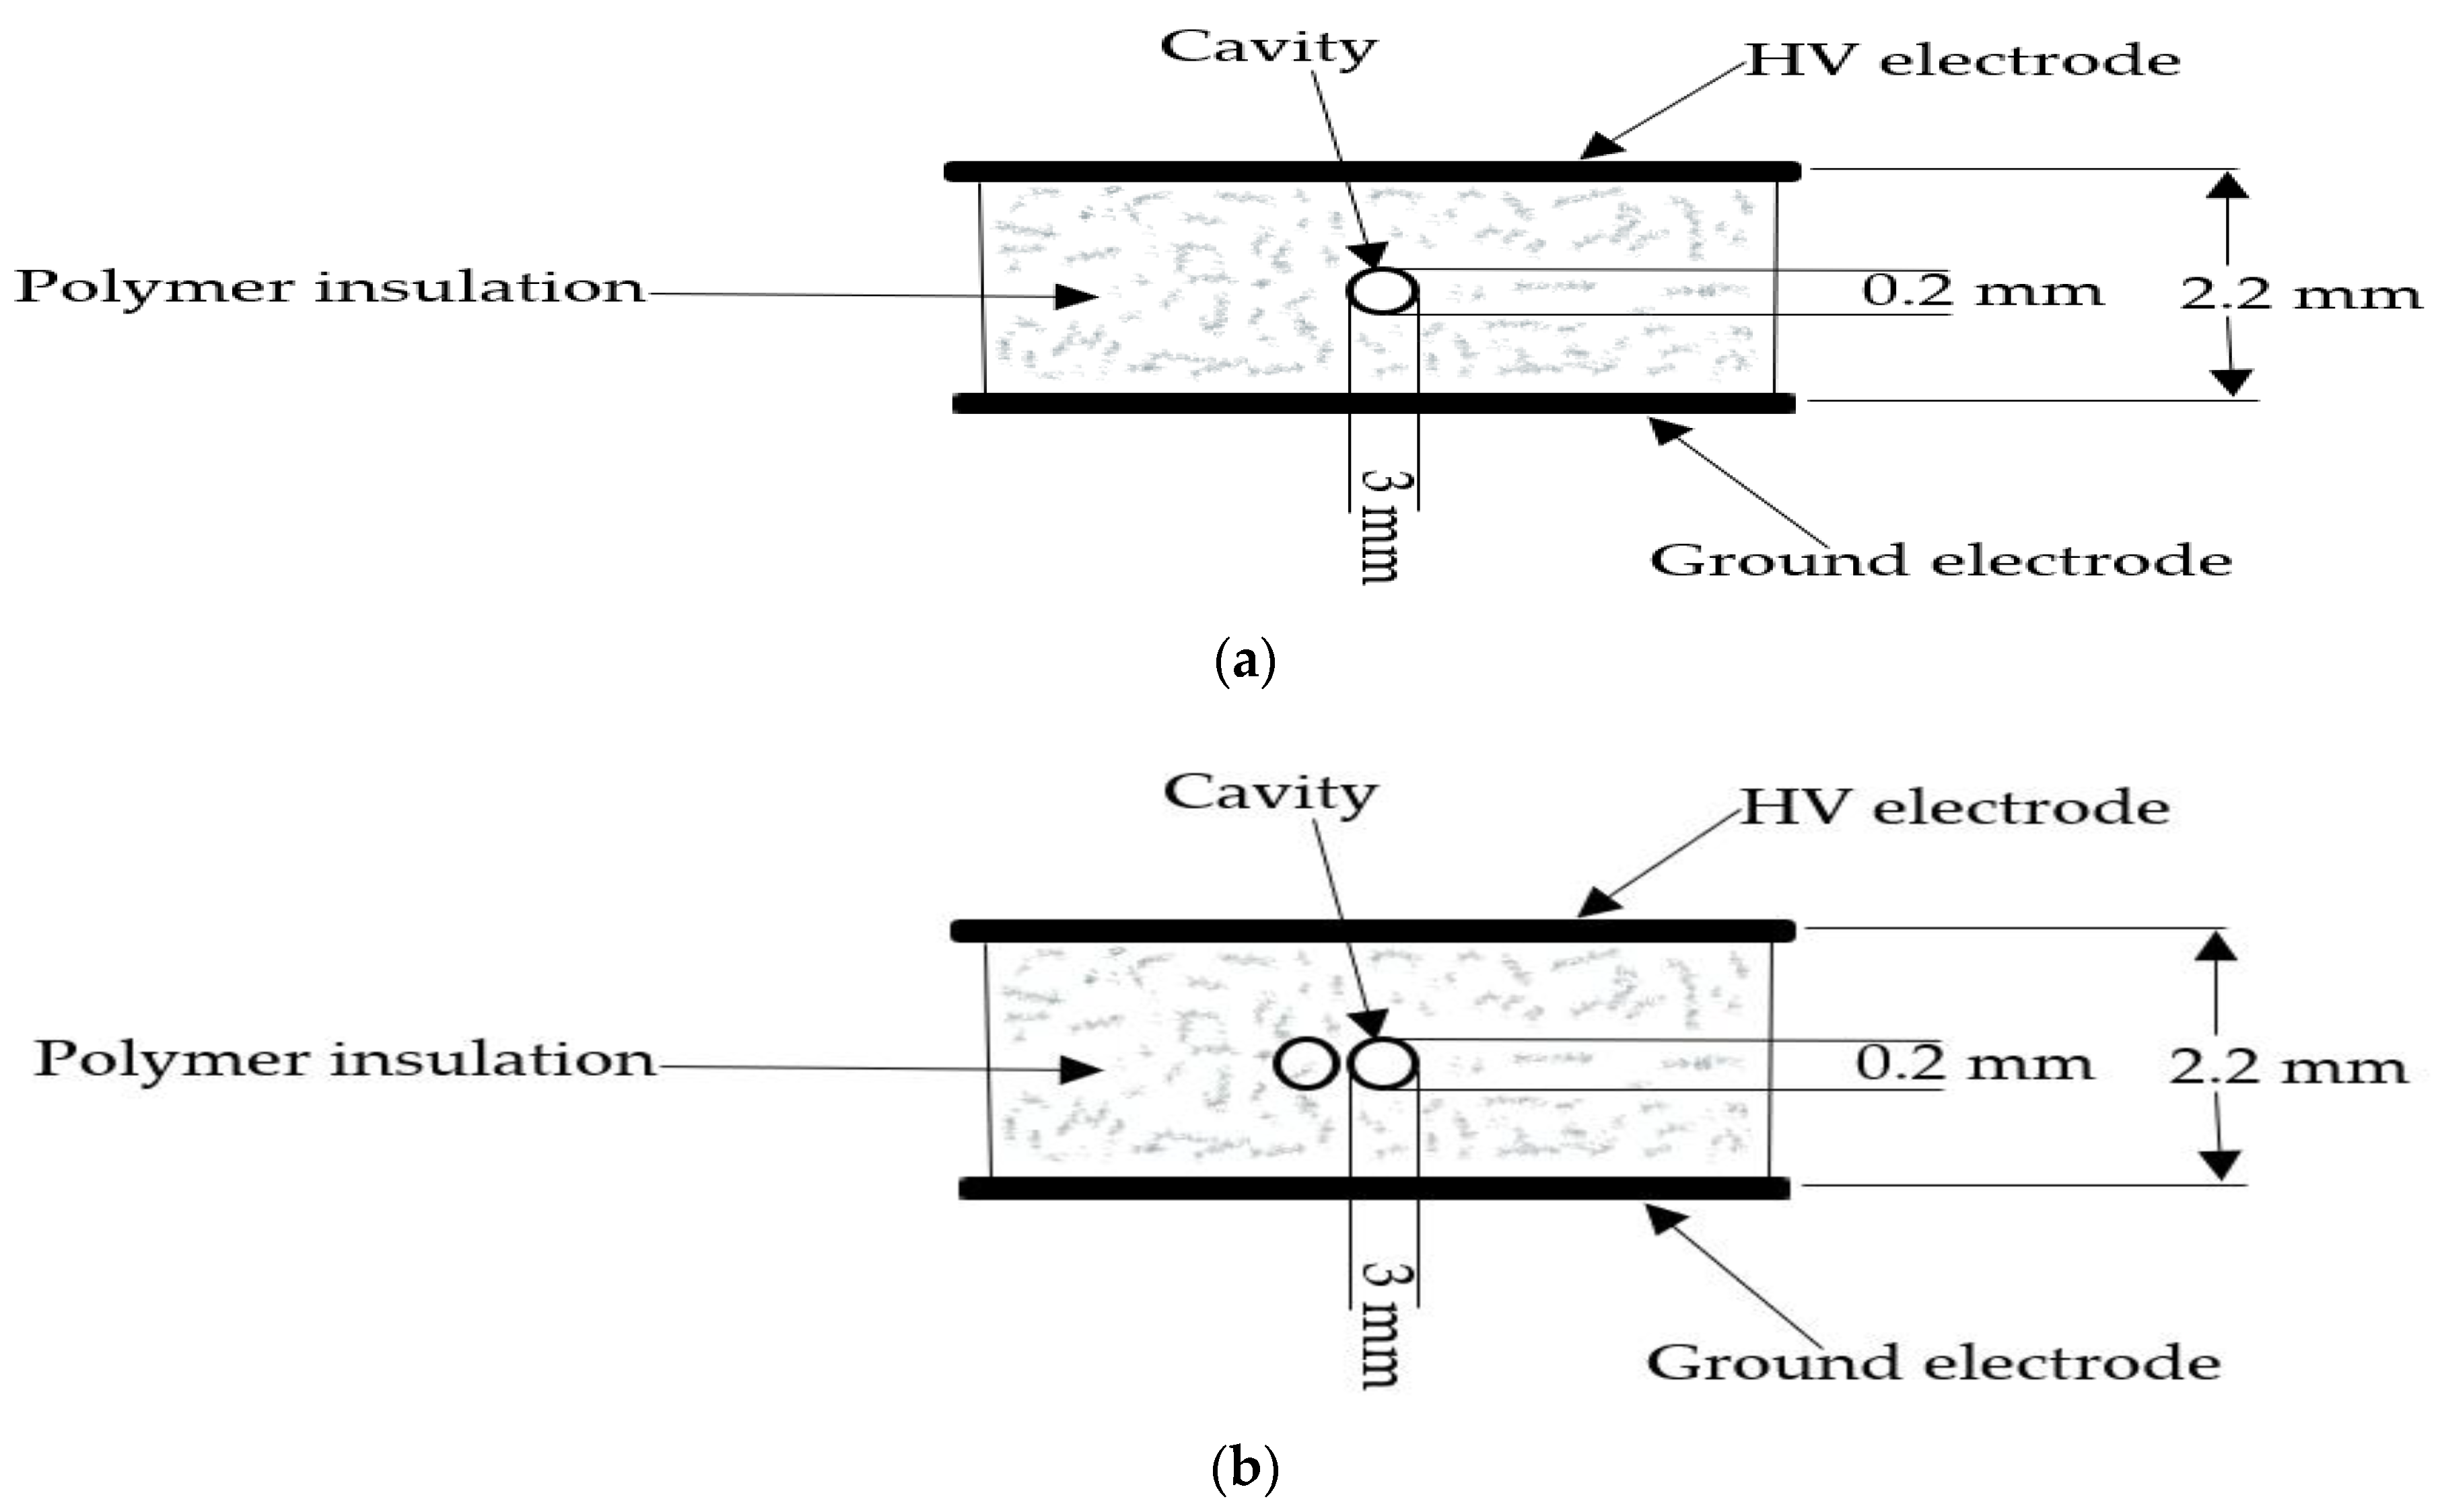
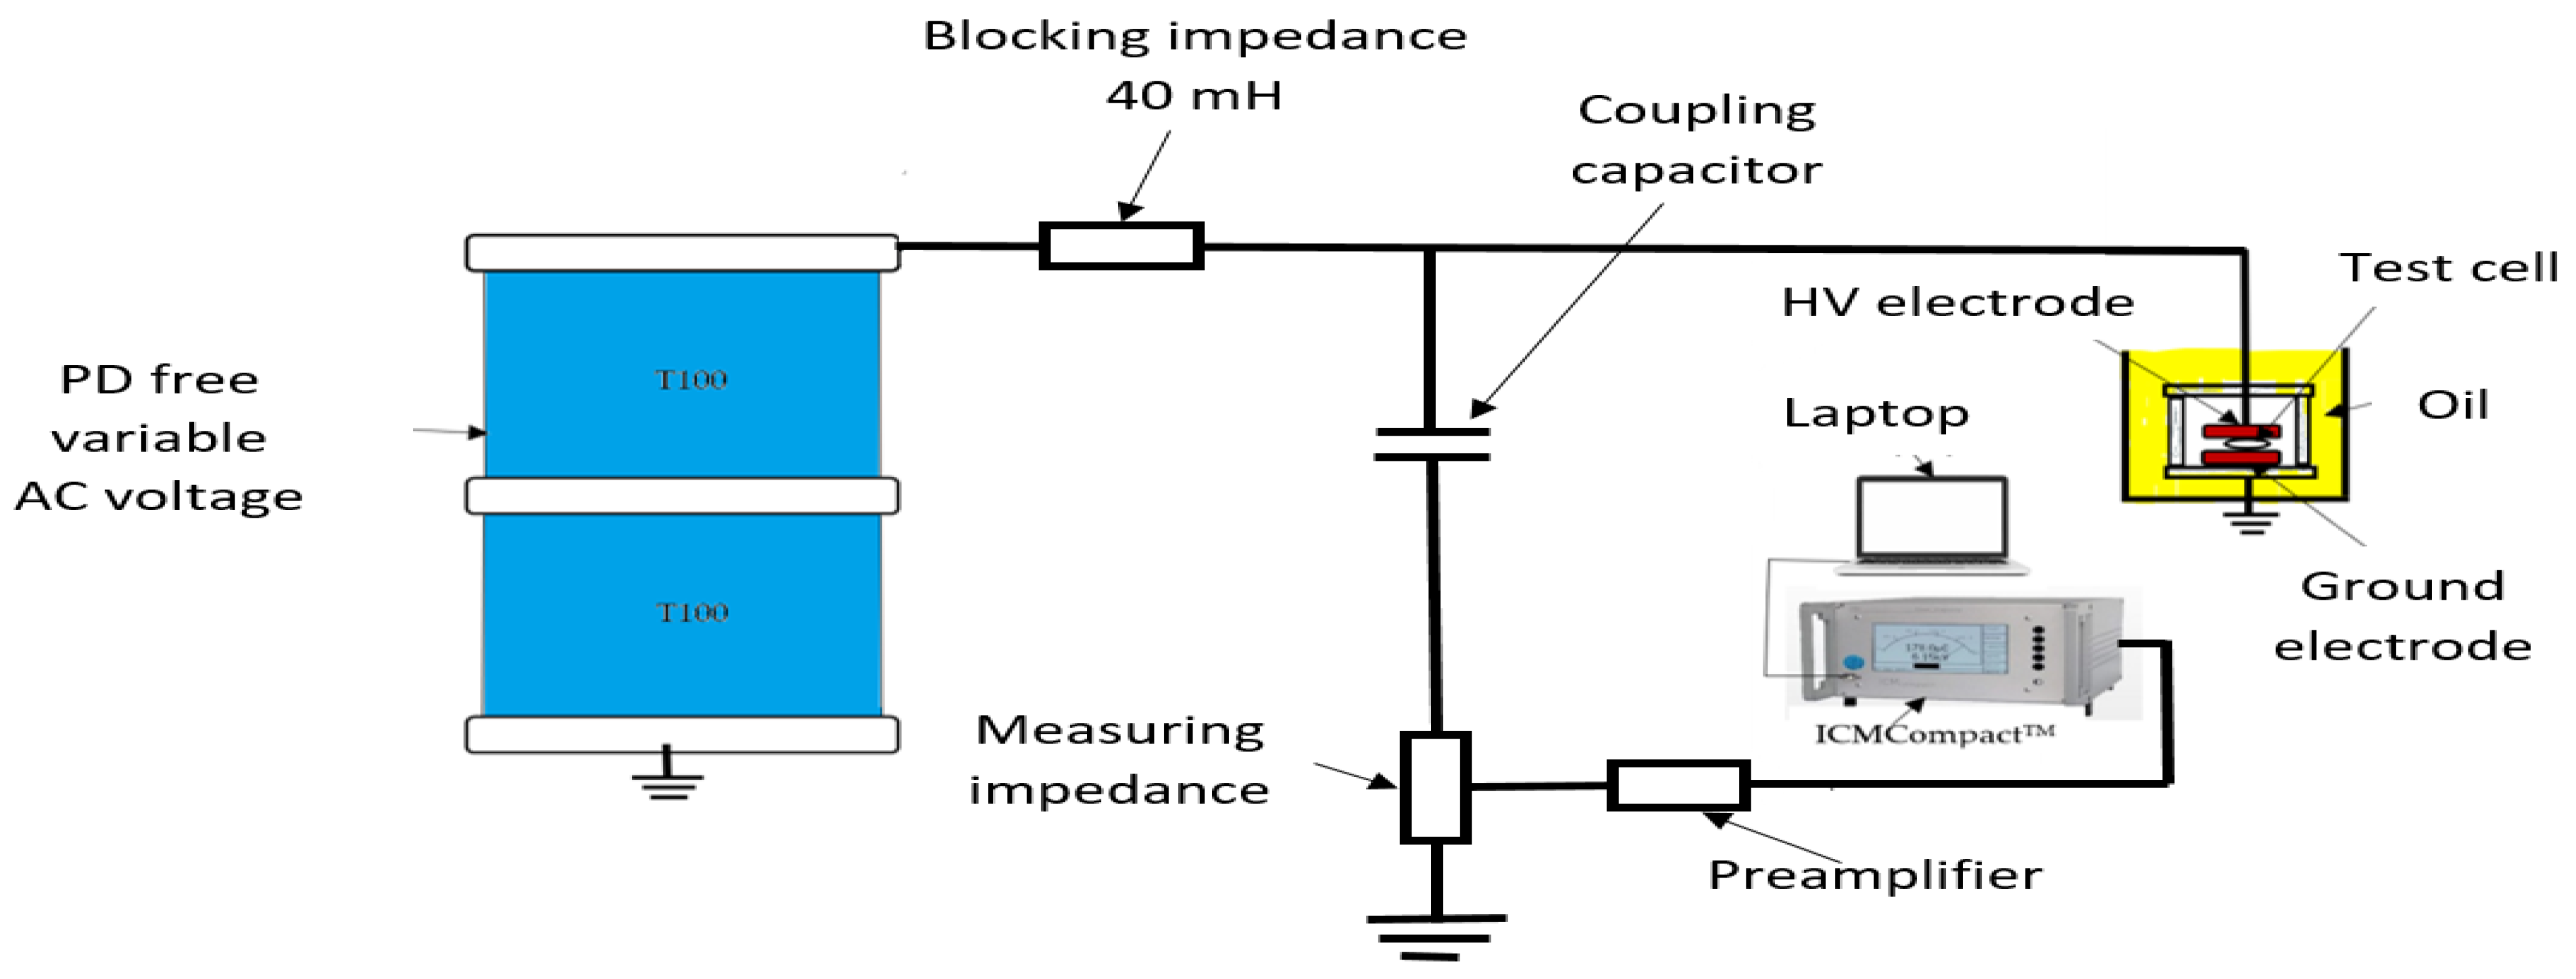
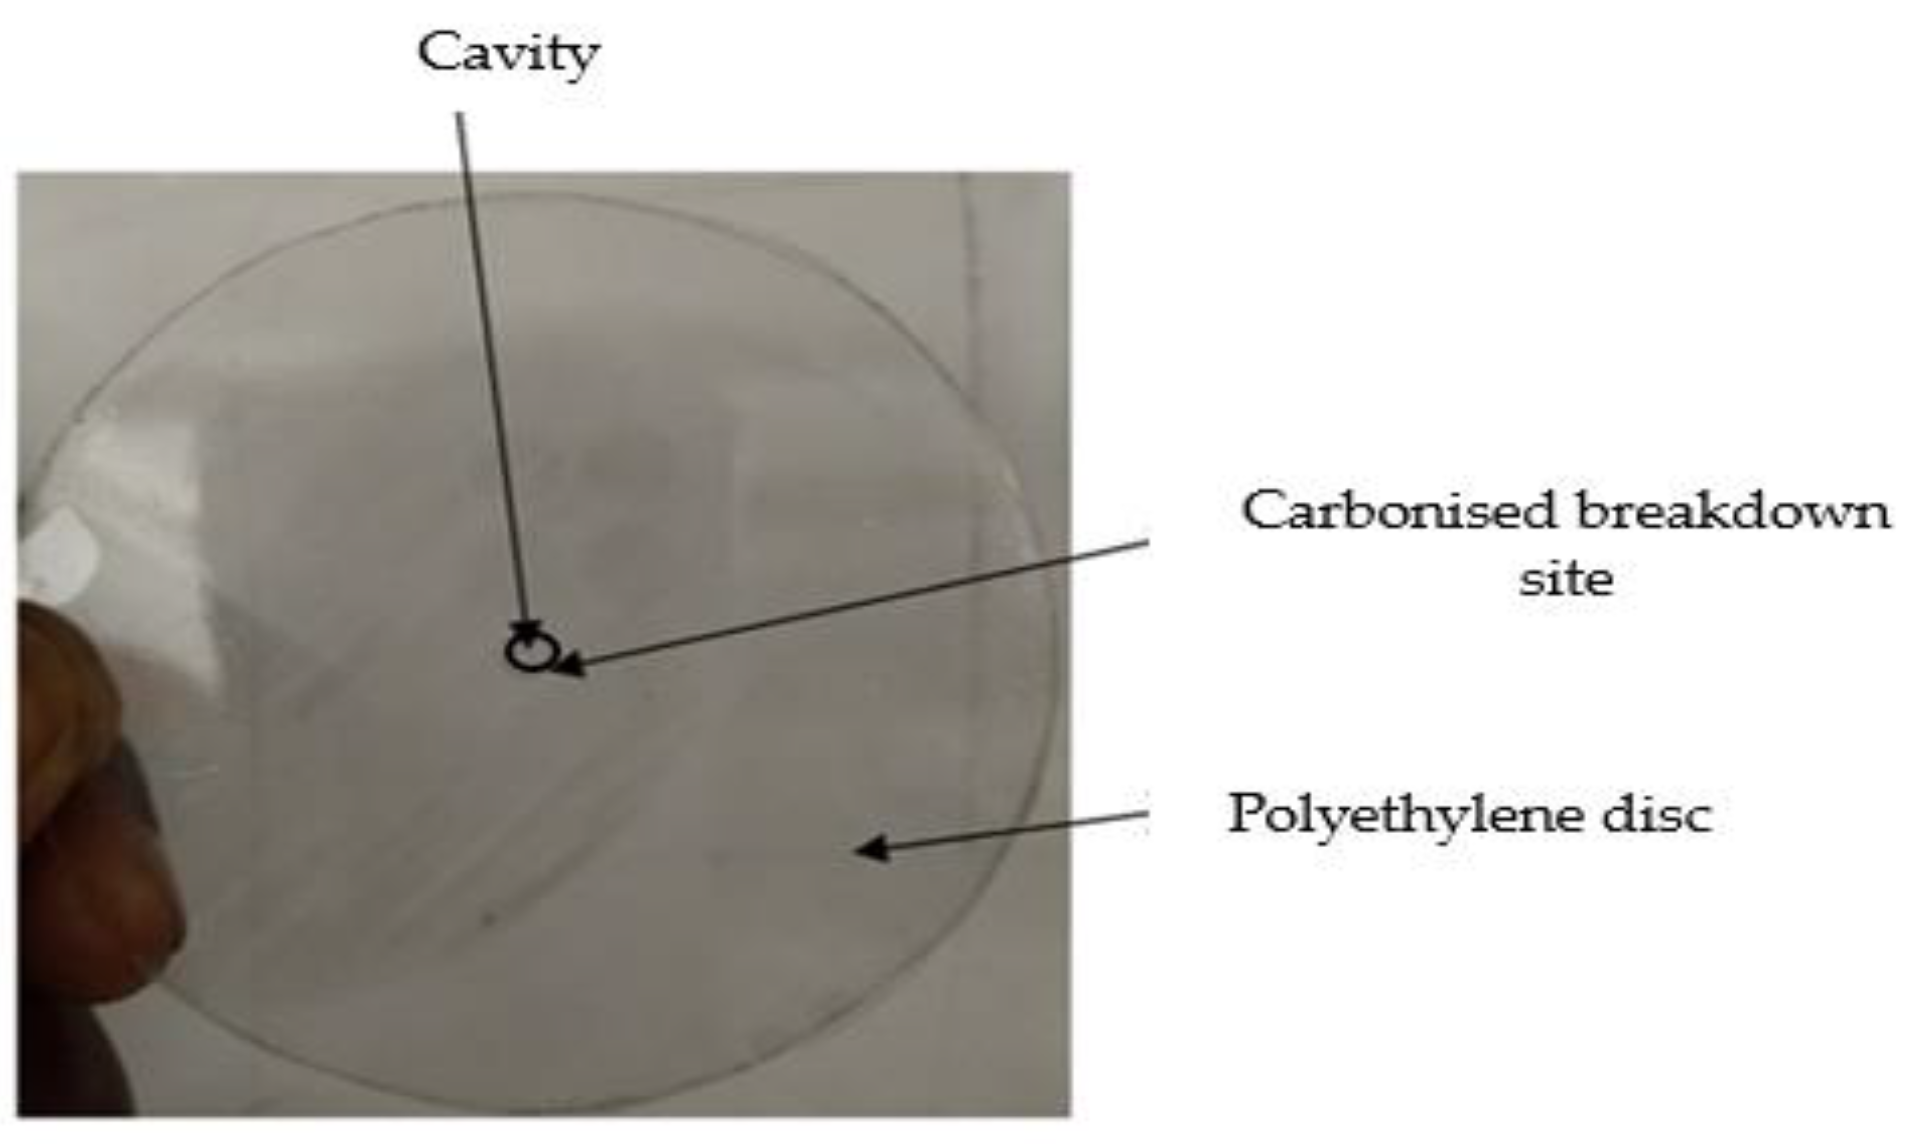
3. Experimental Design

PD Test Cell Setup

The PD testing procedure was in accordance with the IEC 60270 standard and involved acquiring PRPD patterns for both single and double cavities using a Power Diagnostix ICMCompact™, Power Diagnostix System GmbH, Aachen, Germany, PD measurement instrument.
Figure 1 shows the test specimen design used to generate partial discharge (PD) signals in both single- and double-cavity samples. The test sample comprised a 2.2 mm stack of polymer discs. A disc shape cavity of 3 mm and 0.2 mm depth was punched in one disc. The disk with the deformity was placed between the unaffected polymer discs and then tightly clamped together. The diameter of the electrode was 75 mm. The copper pipe was used for high-voltage connections and the copper tape was used for ground connections. The sample was placed between the two electrodes and the whole setup was fully submerged in oil to suppress surface discharges from the edges when high voltage was applied. An 18 kV AC voltage at a frequency of 50 Hz was applied. Figure 2 shows the PD measurement setup.
Six identical test specimens underwent voltage application and their PD patterns were recorded from inception to failure. At suitable intervals, PD data were recorded. The sensitivity of the system was 0.5 pC and the inception voltage was 6.6 kV for single cavities and 6.4 kV for double cavities. The measurements were taken at 18 kV, which is three times higher. To understand the factors influencing the PD mechanisms, the PD mechanisms were simulated.
The simulation model that was used in this study was adopted from Niemeyer’s model, which in turn was updated by Chang in 2015 [38]. It is a mathematical model that simulates PD characteristics in free space. The method uses electric field collapse to determine PD magnitude and Pedersen’s derivation to convert estimated real charge to apparent charge [39]. This model accounts for stochastic initial electron creation by considering both volume and surface generation rates. Parameters such as pressure, charge decay time constant, effective work function, and surface conductivity were investigated. The model was then reconstructed to investigate the above-mentioned parameters for closely coupled cavities. Based on the evolution stages observed in the experimental results, typical PRPD patterns for each level were reproduced.

4. Results Analysis and Discussion

The results of the experimental measurements and simulations for both single and closely coupled cavities are presented in the following subsection.

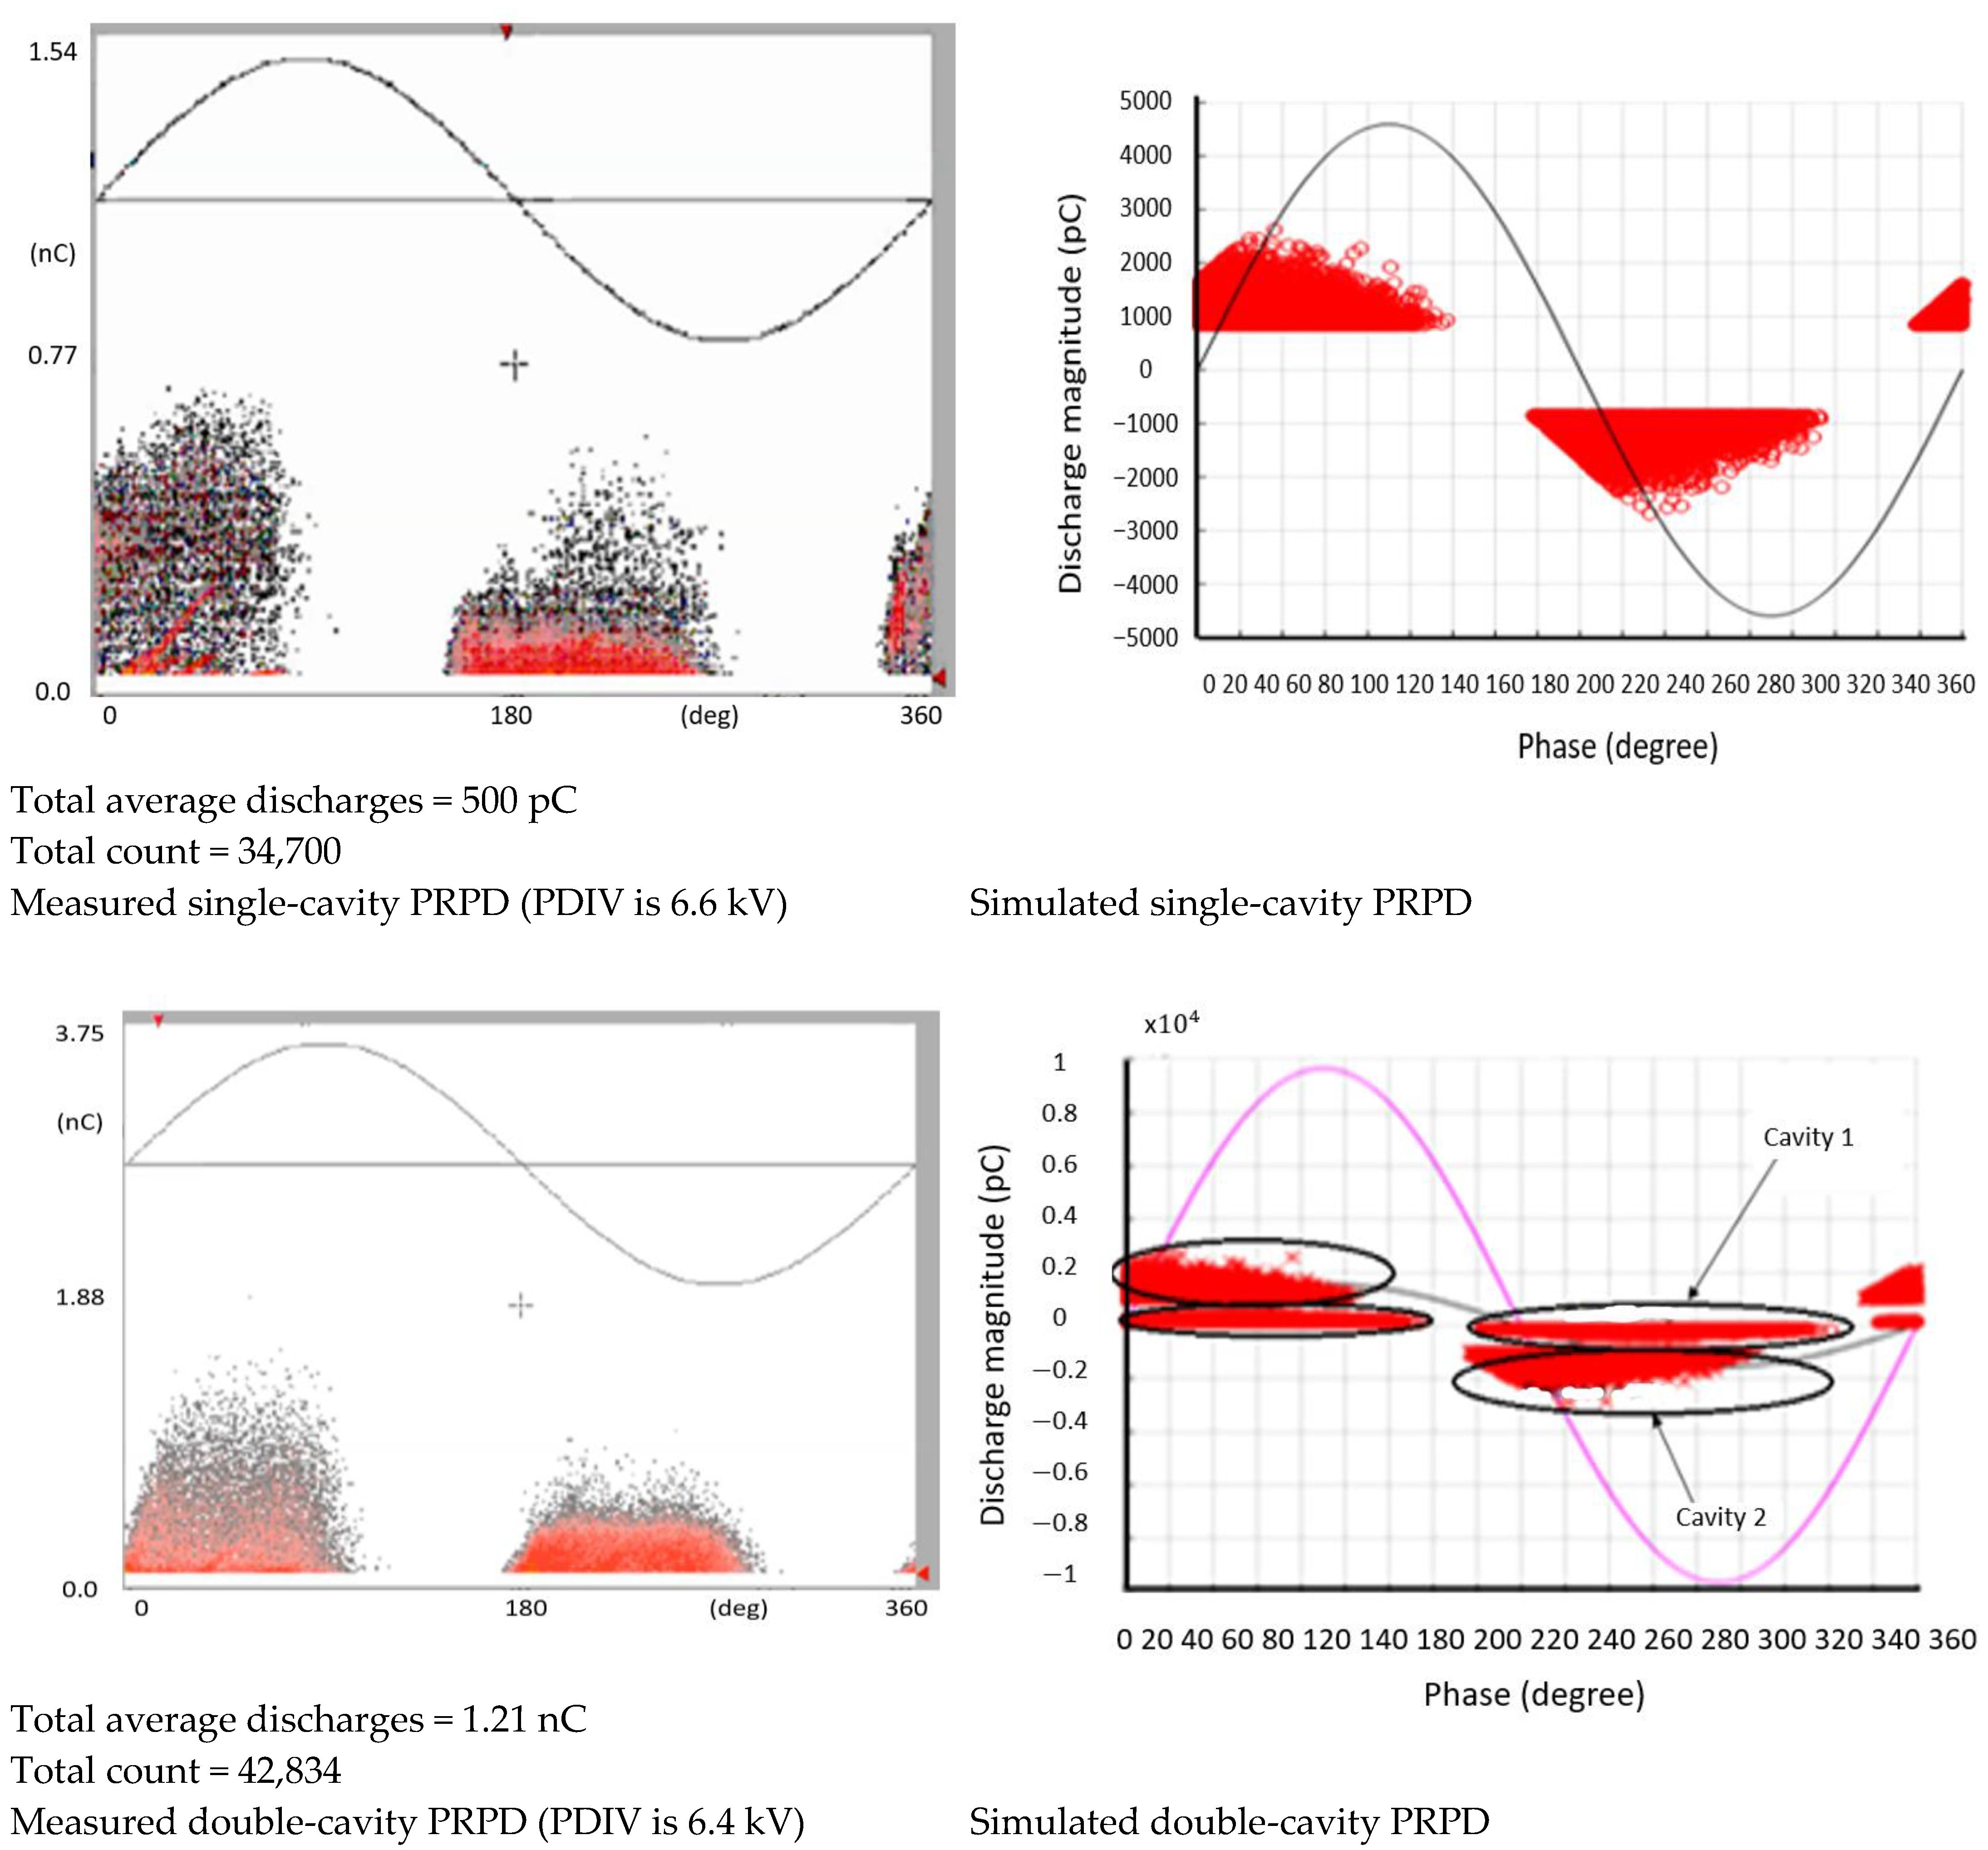
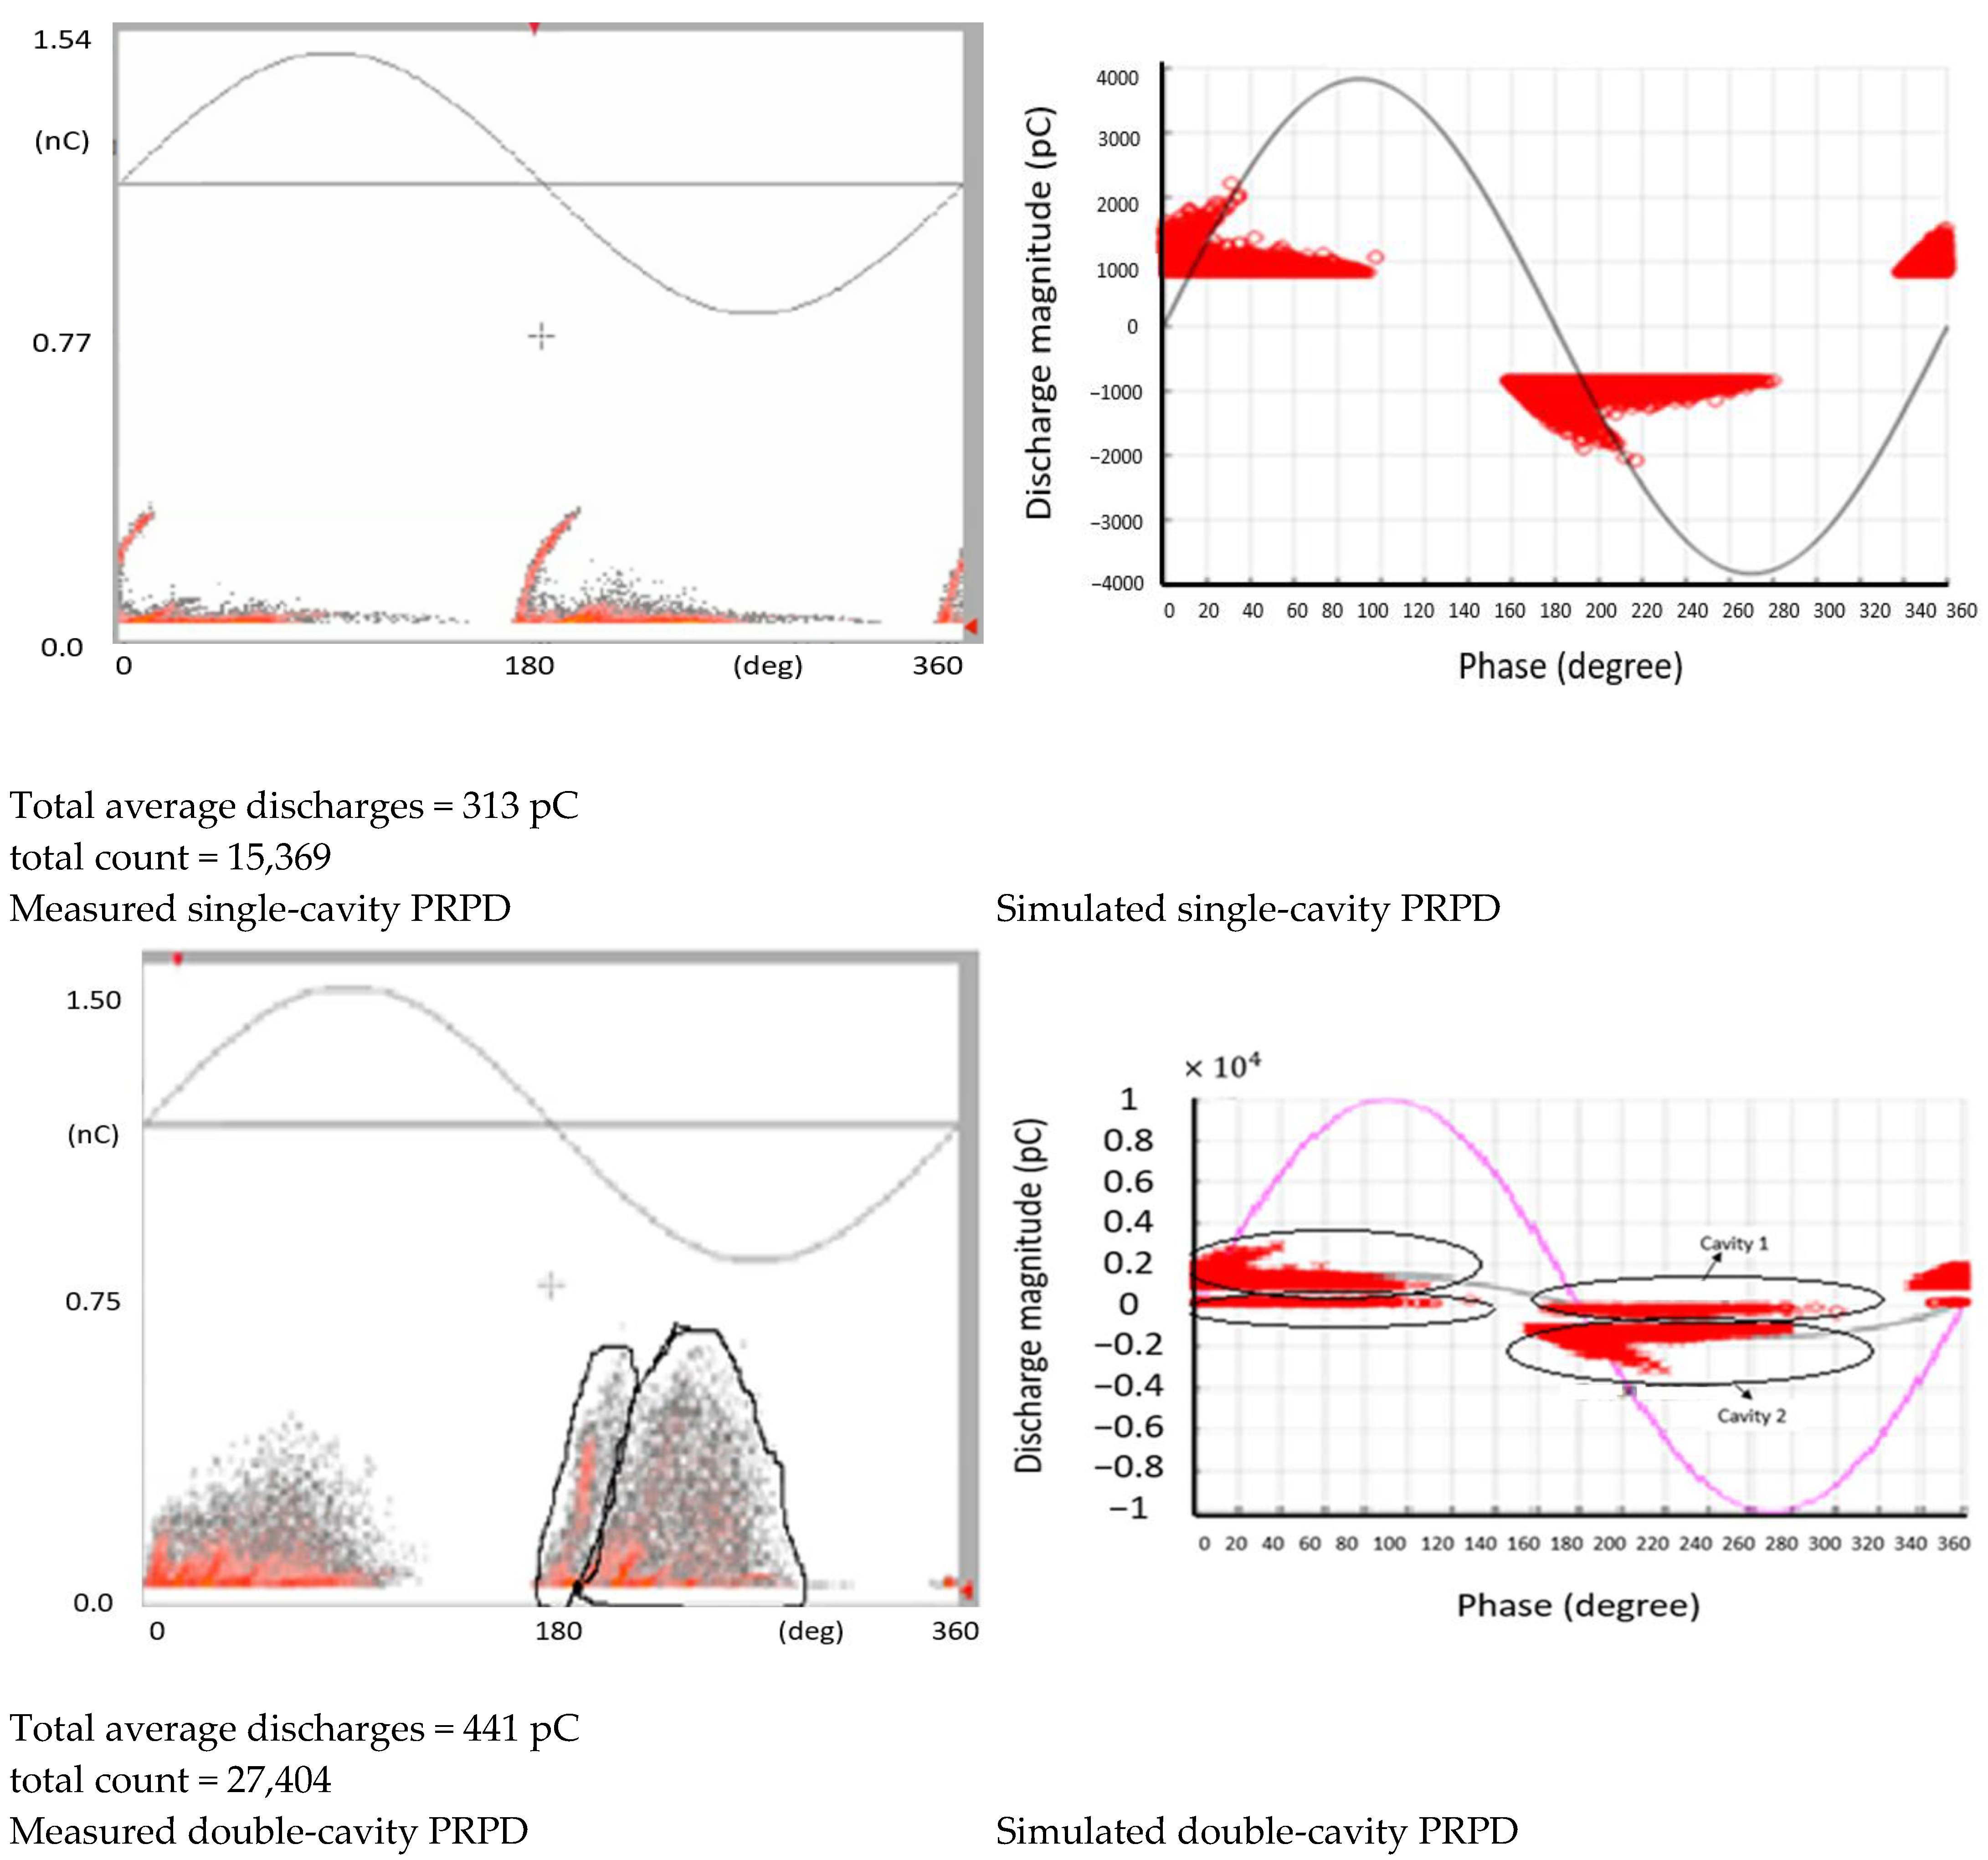
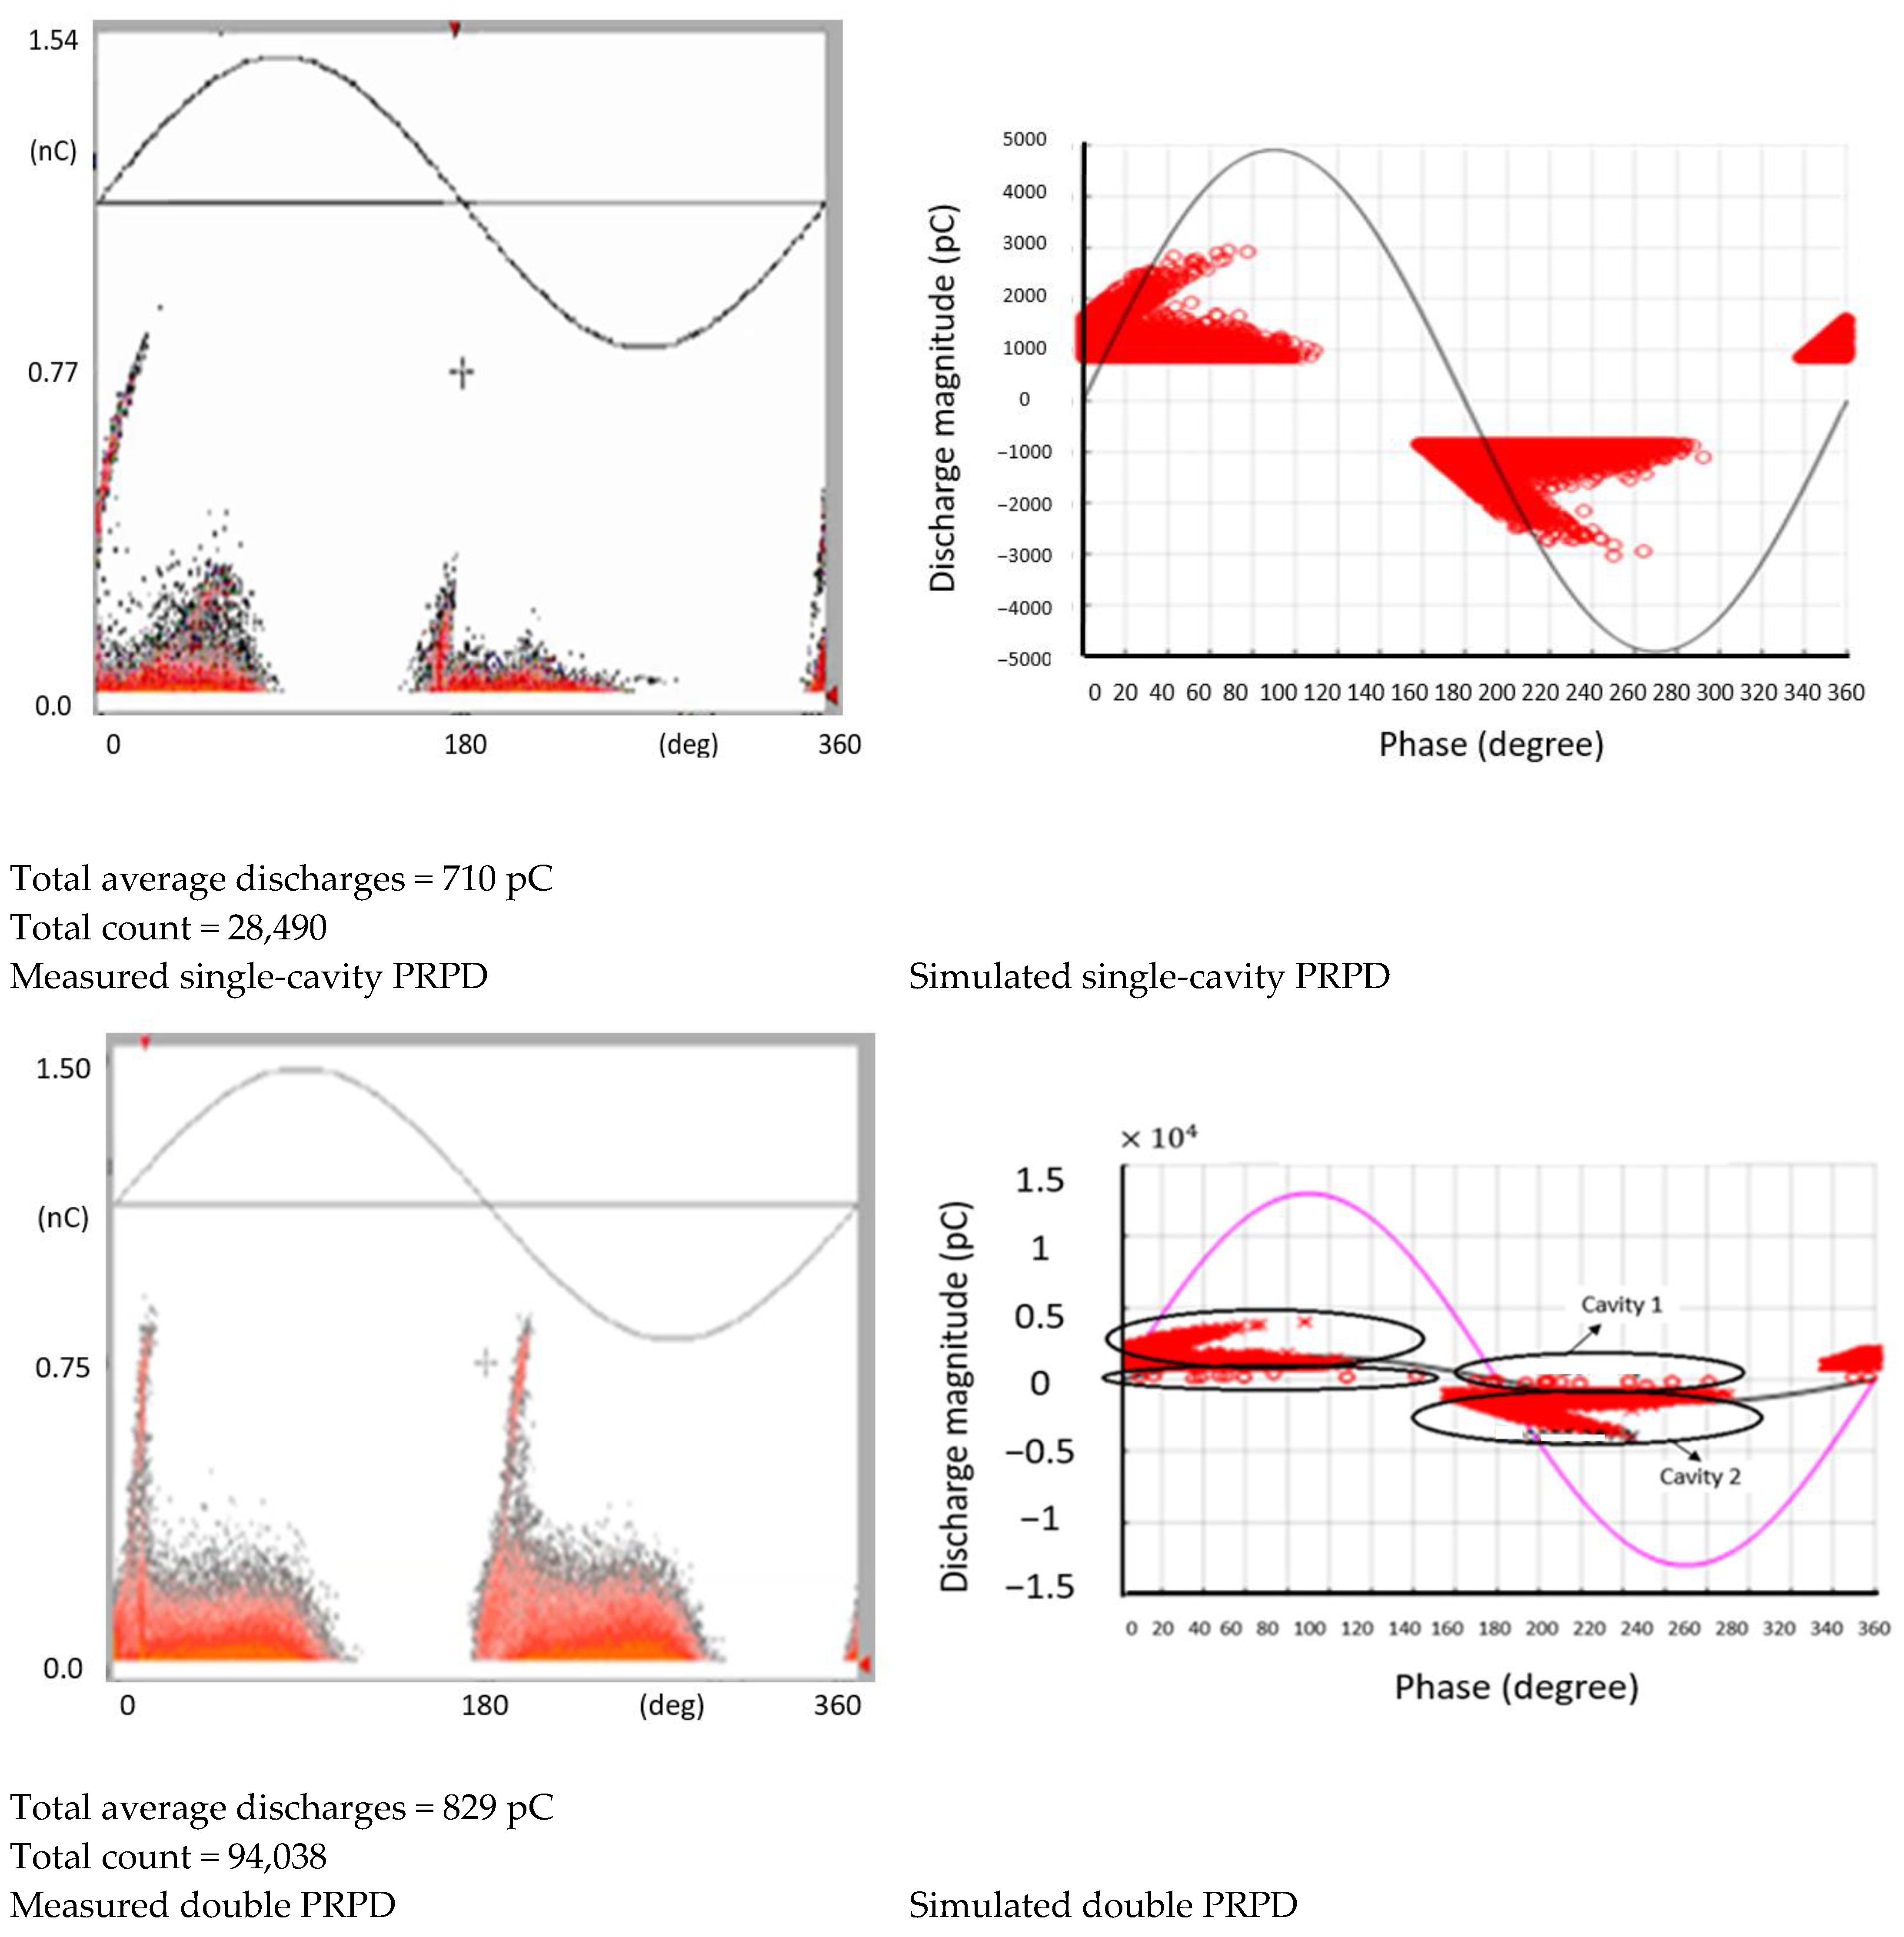
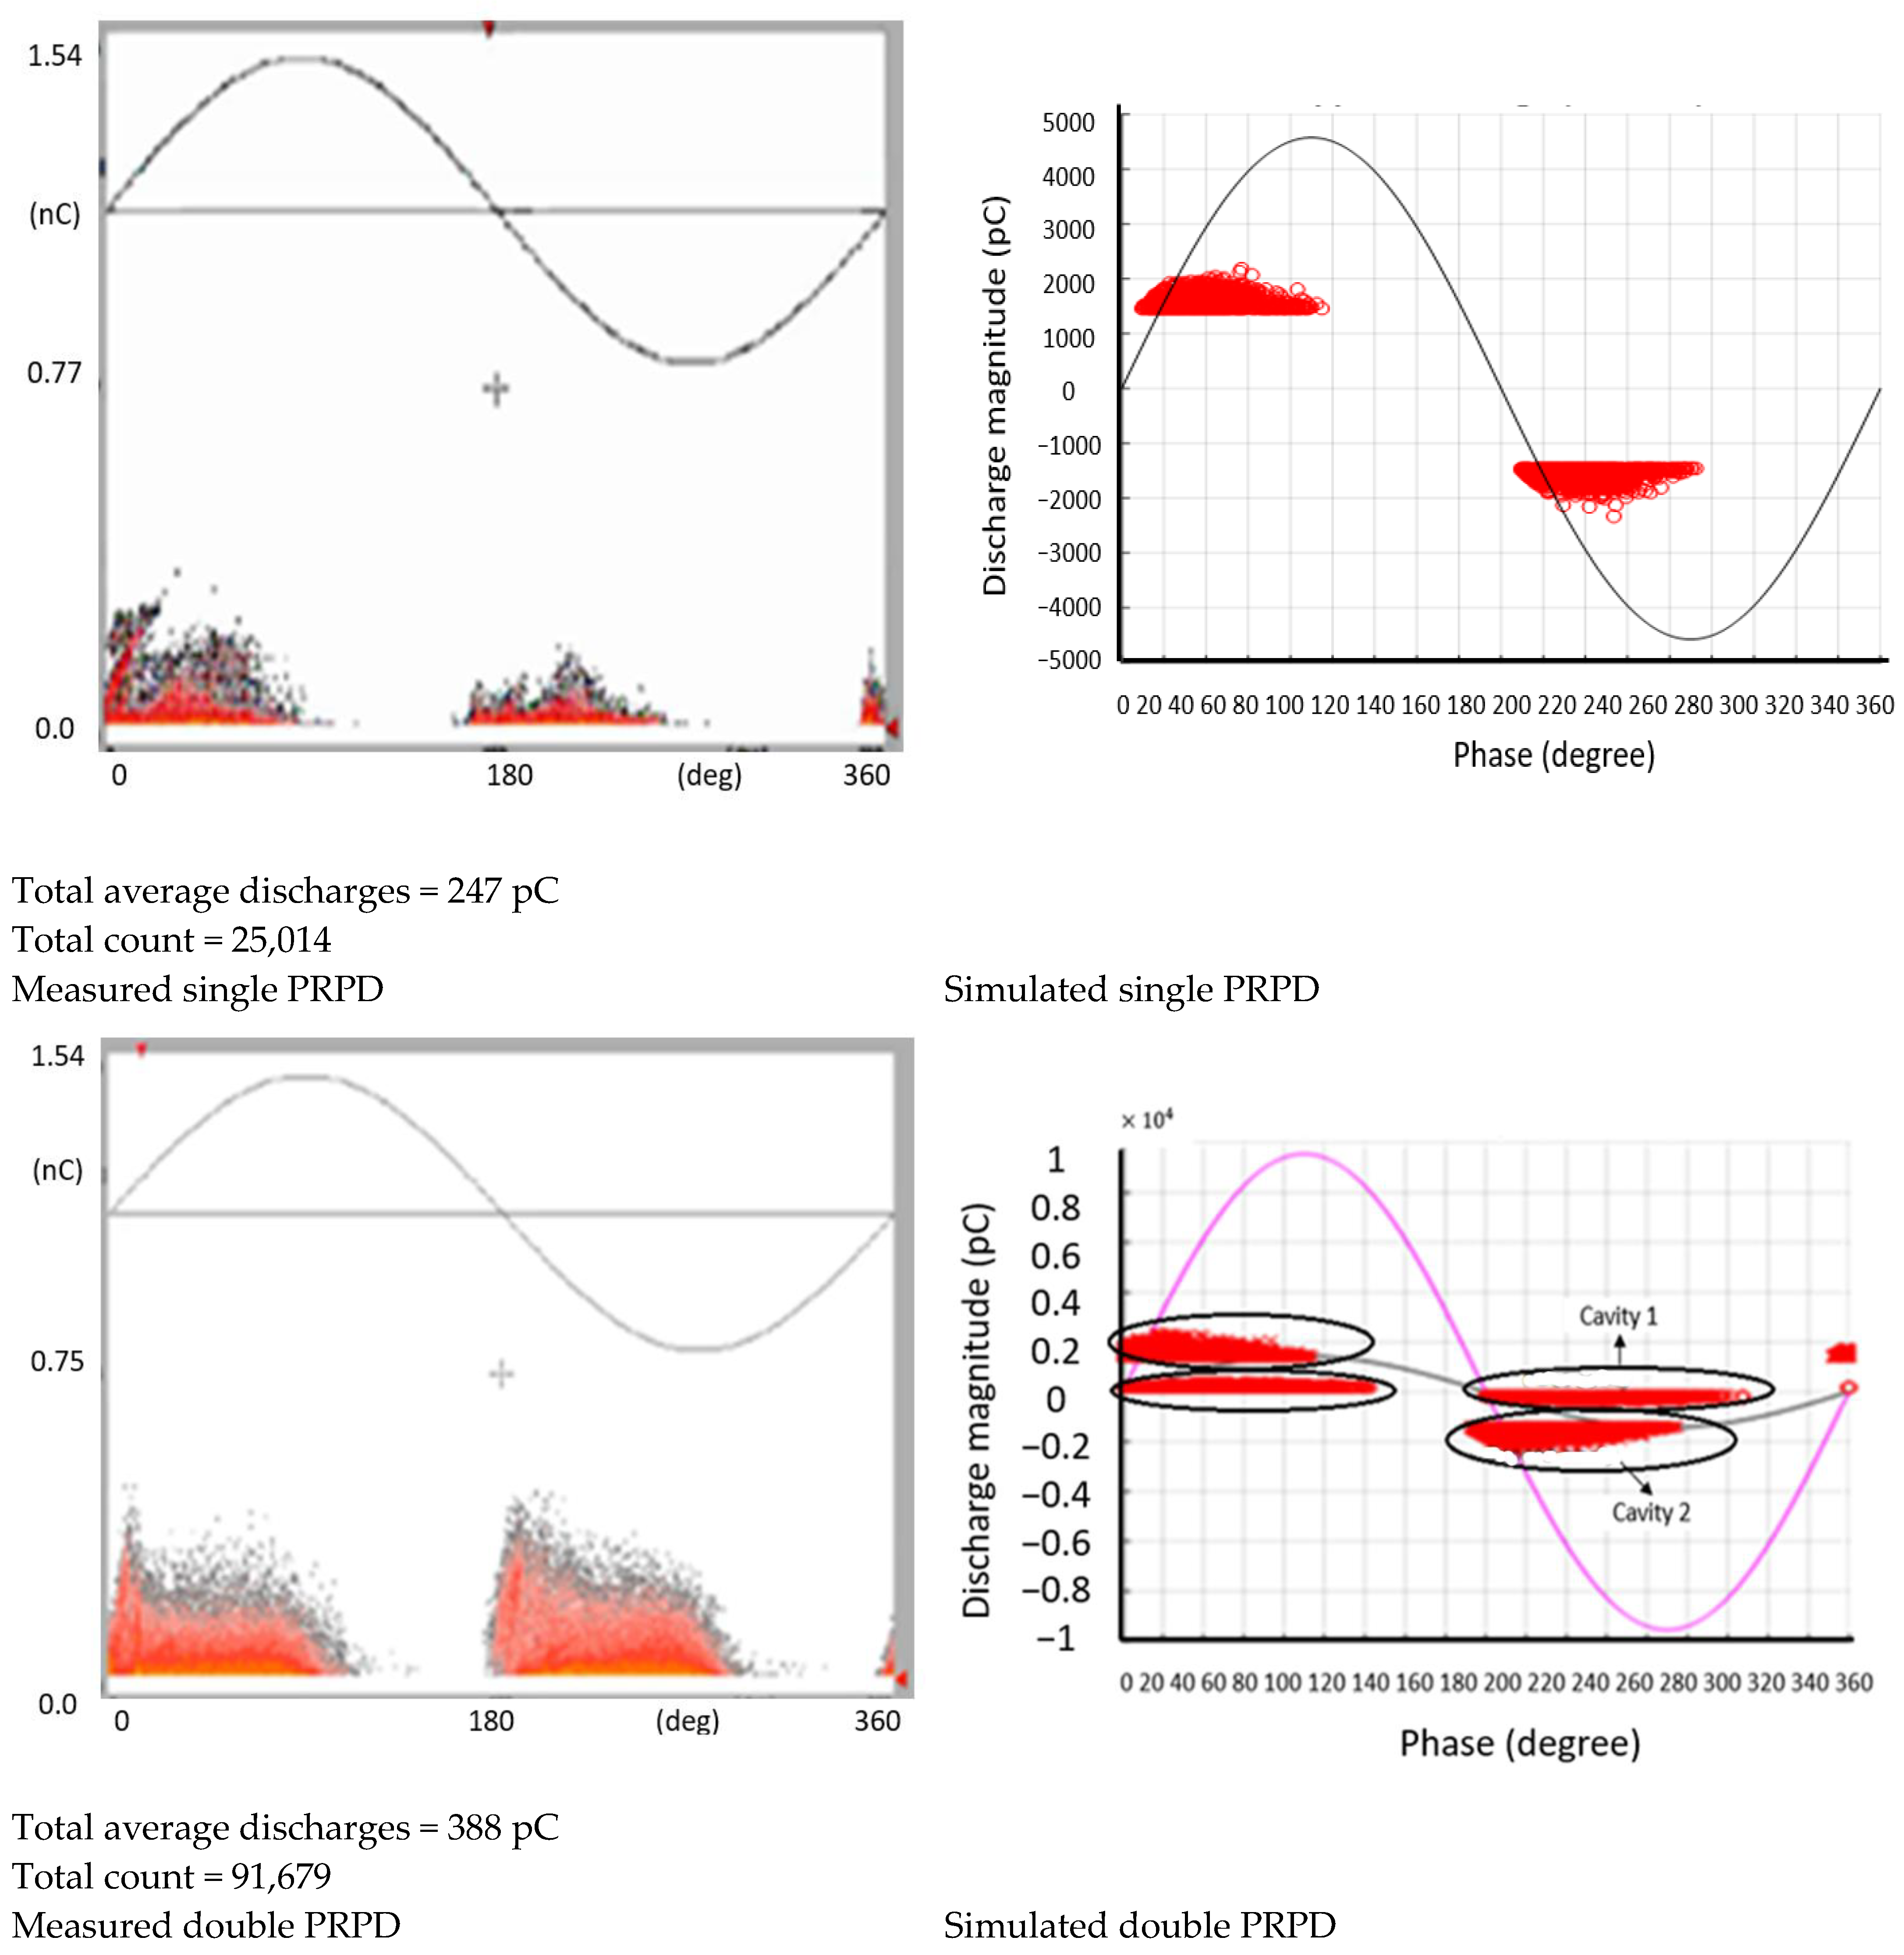
Single and Double Cavities’ Time Evolution

Figure 3 presents the image of an example of a failed single-cavity test specimen. The carbonized failure site is apparent along the edges of the cavity.
Stage 1:
In stage 1, the PRPD pattern exhibits a turtle-like pattern and increasing PD magnitude. The increase in PD activity may be due to the formation of gases and reactive species generated by the PD activity along with the change in gas pressure inside the cavity. Some researchers claim that the amount of oxygen drops due to the discharges. At this stage, it is believed that oxygen molecules are gradually consumed by the oxidation of the polyethylene due to PD [40,41]. This makes PD occur relatively easily as similar results were reported by Mizutani et al. [22]. Since oxygen is an electronegative gas, this depletion of oxygen may help to increase PD activity [42,43] as less oxygen implies fewer electron harvesters, and therefore more electrons will be available to sustain PD activity.
Examples of measured PRPD for both single and double cavities in stage 1 of aging are presented in Figure 4. In the same figure, and adjacent to the physical measurement results, are the corresponding simulation results. The similarities are apparent.
As explained earlier, the increased behaviour of PD activity in stage 1 of long-term aging is mainly influenced by pressure changes inside the cavity. The manner in which the pressure is accounted for in the simulation model is explained next.
The PD inception electric field in the cavity is strongly influenced by gas pressure. Gutfleish and Niemeyer [44] formulated the relationship between gas pressure and streamer inception, as shown in Equation (1).
E i n c = ( E P ) c r . p [ 1 + B ( p . d ) n ]
where p is the gas pressure; d is the cavity height; (E/P)cr, B, and n characterize the ionization process in the gas inside the cavity. In the present case, the dielectric is air, (E/p)cr = 24.2 kV/(cm·bar), B = 8.6 Pa0.5·m0.5, and n = 0.5.
Wang [45] simulated PD patterns of unaged test samples with pressures of 10 kPa and 100 kPa and found the same shape characteristics. Therefore, the minimum pressure value in the present work was set to 100 kPa in the model of the present work. The pressure was then varied to 150 kPa, 200 kPa, and 250 kPa. The applied voltage of 18 kV and frequency of 50 Hz were maintained. All other parameters were kept constant except pressure. The lowest pressure is the one that gave a similar result to the measured result. According to Paschen’s law, at lower pressure, electronic avalanches are more intense due to the increased mean free path that results in increased ionization probability. It is notable that under the same conditions, the average PD magnitudes in single cavities were about 50% of those in closely coupled cavities. Similar results were reported in [29].
The simulated model can generate similar shapes of PD distribution for single cavities. The “turtle-like” shape of PD patterns is seen in both measured and simulated results. However, the simulated double cavity patterns show a clear distinction between two clusters of PD data points in “turtle-like” shapes. Assuming that cavity 1 discharged first, the cluster with relatively smaller PD was therefore presumed to be for cavity 1. As cavity 1 discharged, the conductive discharge channel caused further enhancement of the electric field in the neighbouring cavity 2. The resultant discharge magnitudes in cavity 2 became bigger than in cavity 1, as evident in Figure 4. However, in the practically measured data, the patterns from both voids overlapped and this can be attributed to the resolution limitations of the measurement equipment. Similar results were obtained by Illias et al. [46]. When PDs occur within two closely coupled same-sized voids, PDs can occur at a higher repetition rate in one of the voids than the other [35]. This is also reported by Medoukali et al. [47] due to the cavities’ mutual impact.
Stage 2:
After 5 h, the PD patterns evolve into what is termed stage 2 in this article. During stage 2 of the ageing process, short rabbit-like ear patterns were exhibited [19,22,24,48]. The PDs are of reduced magnitudes (63% of the stage 1 magnitudes on average). The total repetition rate increased by 126%. To reproduce the experimental measurements through simulations at this stage, Equations (2) and (3) were used to model the dominant parameters. The de-trapping work function (Φ) was decreased from 1.3 to 1.24 eV, representing the change in cavity surface due to continuous bombardment by PD, therefore making it easier to de-trap electrons. The charge decay time constant (τ) was decreased from 1 s to 0.007 s, representing the increased ease of residual charge dispersion along the cavity surface in the increasing presence of the conductive PD byproduct film deposited on the cavity surface. The pressure remained set at 100 kPa. The effect of the charge decay time constant on partial discharge can be significant and is generally related to the ability of the insulation to dissipate charges and prevent the occurrence and escalation of partial discharges. This produces a decrease in the time lag, resulting in a reduction in the number of PDs per half cycle and a decrease in the PD charge magnitude.
The effective work function of the material influences the availability of the seed electrons that initiate electron avalanches in PD activity. The decrease in work function and the decrease in charge decay time constant represent the unaged cavity surface that produces fewer detrapped electrons to sustain PD compared to an aged cavity. Therefore, varying these two parameters produced similar patterns in stage 2 as those obtained through measurement results. Figure 5 presents the patterns of both experimental measurements and simulated results.
N e = v o N d t   e x p [ e E i 4 π ε o Φ k T ]
  • v o is the fundamental phonon frequency.
  • Φ is the effective work function for detrapping.
  • e E i 4 π ε o Φ k T is the Schottky term.
  • K is the Boltzman constant.
  • T is the absolute temperature
  • Ndt accounts for the number of detrappable electrons.
N d t = ζ ( q e )   exp   ( t τ )
where
  • ζ < 1 is a dimensionless factor for detrappable electrons that accounts for the difference in efficiency when the surface is impacted by a positive ion (normal condition) or an electron (polarity reversed).
  • q is the true PD charge.
  • e is the elementary charge
  • t is the time interval since the previous discharge event
  • τ is the effective decay time constant.
Figure 5. Comparisons of PRPD pattern at stage 2 for single and double cavities. Each dot represents a PD pulse. The brighter the colour the higher the repetition rate.
Energies 17 01905 g005
Stage 3:
After 27 h, the PD patterns evolved into what is termed stage 3 in this paper. In stage 3, there is an occurrence of long rabbit-like ear patterns similar to those reported by other researchers [21,22,40,49]. The discharge magnitude increased by about 44% compared to stage 2. The double cavities exhibited the same characteristics. To reproduce the experimental measurements through simulations at this stage, Equations (2) and (3) were used in the model. The de-trapping work function was maintained at 1.24 eV and the charge decay time constant was further reduced from 0.007 to 0.005 s while the initial pressure was maintained at 100 kPa. All other parameters were kept constant. Figure 6 presents the typical PRPD patterns.
Stage 4:
Finally, after 28 h of aging, the PD patterns evolve into stage 4. PD characteristics transitioned into turtle-like patterns with a reduced average discharge magnitude of 35% less than stage 3. The total discharges increased by 14% from those in stage 3. Wang [45] also reported a similar result. The trend was, in both cases, for single and double cavities. To reproduce experimental measurements at aging stage 4 in the simulation model, Equation (1) was used to simulate the attendant parameter. The initial pressure was varied to represent the changes in gas consumption and gaseous byproduct generation rates. The pressure value was set to 200 kPa while other parameters were kept constant. It is therefore inferred that after about 28 h, in the aging of the test sample, the pressure in the cavity begins to increase, resulting in a decreasing rate of PD charge magnitude. At stage 4, the PRPD pattern exhibits a “turtle-like” structure like in stage 1. However, the magnitude of the PD charge is lower by 49% in comparison to stage 1. Typical simulated phase-resolved PD patterns compared with the measurement results of single and double cavities are presented in Figure 7.

5. Conclusions

The main concluding points drawn from this study are as follows:
  • This work confirmed the existing knowledge that PD phase-resolved patterns of air-filled cavity defects in polymer materials evolve through distinct stages as the PD activity progresses from inception to complete failure.
  • The overall shapes of PD phase-resolved patterns of single cavities and those of closely coupled cavities evolve in a similar way and are therefore difficult to distinguish. This is because the same PD mechanisms are present in both double and single cavities. This is not surprising as the physics of the PD discharge does not depend on the configuration of the cavities.
  • By using a suitable PD simulation model and a curve-fitting approach in reproducing physically measured PD patterns, the dominant variables responsible for time-dependent PD pattern evolution changes were identified.

Author Contributions

Conceptualization, C.N.; Methodology, I.K.K.; Validation, C.N.; Formal analysis, I.K.K. and C.N.; Investigation, I.K.K.; Resources, C.N.; Data curation, I.K.K.; Writing—original draft, I.K.K.; Writing—review & editing, I.K.K., C.N. and A.G.S.; Visualization, C.N. and A.G.S.; Supervision, C.N. and A.G.S. All authors have read and agreed to the published version of the manuscript.

Funding

This research received no external funding.

Data Availability Statement

Data are contained within the article.

Conflicts of Interest

The authors declare no conflict of interest.

References

  1. IEEE Std 493-2007 Revis; IEEE Recommended Practice for the Design of Reliable Industrial and Commercial Power Systems. IEEE: New York, NY, USA, 2007.
  2. Kulkarni, S.V.; Khaparde, S.A. Transformer Engineering: Design, Technology, and Diagnostics, 2nd ed.; CRC Press: New York, NY, USA, 2012; ISBN 978-1-4398-5377-1. [Google Scholar]
  3. Chanda, M.; Roy, S.K. Industrial Polymers, Specialty Polymers, and Their Applications, 1st ed.; CRC Press: Boca Raton, FL, USA, 2008. [Google Scholar]
  4. Tenbohlen, S.; Coenen, S.; Djamali, M.; Müller, A.; Samimi, M.H.; Siegel, M. Diagnostic Measurements for Power Transformers. Energies 2016, 9, 347. [Google Scholar] [CrossRef]
  5. Tanaka, T. Internal partial discharge and material degradation. IEEE Trans. Electr. Insul. 1986, EI-21, 899–905. [Google Scholar] [CrossRef]
  6. Morshuis, P.H.F. Degradation of solid dielectrics due to internal partial discharge: Some thoughts on progress made and where to go now. IEEE Trans. Dielectr. Electr. Insul. 2005, 12, 905–913. [Google Scholar] [CrossRef]
  7. Stone, G.C. Partial discharge diagnostics and electrical equipment insulation condition assessment. IEEE Trans. Dielectr. Insul. 2005, 12, 891–904. [Google Scholar] [CrossRef]
  8. IEC60270; High-Voltage Test Techniques—Partial Discharge Measurements. International Electrotechnical Commission: Geneva, Switzerland, 2000.
  9. Ahmed, N.; Srinivas, N. PD types and their detection possibilities by PD test methods. In Proceedings of the 2001 Annual Report Conference on Electrical Insulation and Dielectric Phenomena, Kitchener, ON, Canada, 14–17 October 2001; pp. 307–310. [Google Scholar]
  10. Seghir, T.; Mahi, D.; Lebey, T.; Malec, D. Analysis of the electric field and the potential distribution in cavities inside solid insulating electrical materials. In Proceedings of the COMSOL User Conference, Paris, France, 7 November 2006. [Google Scholar]
  11. Boggs, S.A. Partial discharge. iii. cavity-induced PD in solid dielectrics. IEEE Electr. Insul. Mag. 1990, 6, 11–16, 19–20. [Google Scholar] [CrossRef]
  12. Kuffel, E.; Zaengl, W.S.; Kuffel, J. High Voltage Engineering Fundamentals, 2nd ed.; Elsevier: Amsterdam, The Netherlands, 2000. [Google Scholar]
  13. Boggs, S.; Densley, J. Fundamentals of partial discharge in the context of field cable testing. IEEE Electr. Insul. Mag. 2000, 16, 13–18. [Google Scholar] [CrossRef]
  14. Morshuis, P.H.F.; Kreuger, F.H. Transition from streamer to Townsend mechanisms in dielectric voids. J. Phys. D Appl. Phys. 1990, 23, 1562–1568. [Google Scholar] [CrossRef]
  15. Gulski, E.; Kridva, A. Influence of aging on classification of PD in HV components. IEEE Trans. Dielectr. Electr. Insul. 1995, 2, 676–684. [Google Scholar] [CrossRef]
  16. Komori, F.; Kojima, A.; Hikita, M.; Suzuoki, Y.; Mizutani, T. Phase-resolved study on partial discharge for degradation diagnosis in polymeric insulating materials using model electrode system. In Proceedings of the 1998 IEEE 6th International Conference on Conduction and Breakdown in Solid Dielectrics (Cat. No.98CH36132), Vasteras, Sweden, 22–25 June 1998; pp. 153–156. [Google Scholar]
  17. Seanor, D.A. Electrical Properties of Polymers; Academic Press, Inc.: Cambridge, MA, USA, 1982; Chapter 1; pp. 1–10. [Google Scholar]
  18. Montanari, G.C. Online partial discharge diagnosis of power cables. In Proceedings of the IEEE Electrical Insulation Conference, Montreal, QC, Canada, 31 May–3 June 2009; pp. 210–215. [Google Scholar]
  19. Dodd, S.J.; Champion, J.V.; Vaughan, A.S.; Sutton, S.J.; Swingler, S.G. The influence of morphology on electrical treeing in polyethylene blends. Proc. Sci. Meas. Technol. 2003, 150, 58–64. [Google Scholar] [CrossRef]
  20. Krueger, F.H. Discharge Detection in High Voltage Equipment; Temple Press Books Ltd.: London, UK, 1964. [Google Scholar]
  21. Mizutani, T.; Kondo, T.; Nakao, K. Change in partial discharge properties of a void in LDPE. In Proceedings of the Annual Report Conference on Electrical Insulation and Dielectric Phenomena, Austin, TX, USA, 17–20 October 1999; Volume 1, pp. 257–260. [Google Scholar]
  22. Mizutani, T.; Kim, C.-S.; Ichikawa, K.; Tani, Y. Changes in PD pattern and PD current shape for a void in LDPE. In Proceedings of the Annual Report Conference on Electrical Insulation and Dielectric Phenomena (Cat. No.00CH37132), Victoria, BC, Canada, 15–18 October 2000; Volume 2, pp. 670–673. [Google Scholar]
  23. Ijichi, K.W.T.; Kojima, A.; Komori, F.; Suzuoki, Y. Influence of PD rest time on φ-q-n patterns from voids. In Proceedings of the 2001 IEEE 7th International Conference on Solid Dielectrics (Cat. No.01CH37117), Eindhoven, The Netherlands, 25–29 June 2001; pp. 93–96. [Google Scholar]
  24. Wu, K.; Suzuoki, Y.; Dissado, L.A. Improved Simulation model for PD pattern in voids considering effects of discharge area. In Proceedings of the Annual Report Conference on Electrical Insulation and Dielectric phenomena, Albuquerque, NM, USA, 19–22 October 2003; pp. 32–35. [Google Scholar]
  25. Guo, D.; Hepburn, D.M.; Nesbitt, A.; Zhou, C. Change in pattern of void-type PD with ageing. In Proceedings of the International Conference on Condition Monitoring and Diagnosis, Beijing, China, 21–24 April 2008; pp. 109–112. [Google Scholar]
  26. Nyamupangedengu, C. Time-varying partial discharge spectral characteristics in solid polymer insulation. IET Sci. Meas. Technol. 2012, 6, 85–95. [Google Scholar] [CrossRef]
  27. Danikas, M.G.; Morsalin, S. Foreign Inclusions, Enclosed Cavities, Partial Discharge Models and Discharge Energy: A Short Review Regarding Solid Dielectrics and Composite Insulating Systems. Eng. Technol. Appl. Sci. Res. 2019, 9, 4659–4666. [Google Scholar] [CrossRef]
  28. Kuebler, B. Investigations of Partial Discharge Measuring Techniques Using Epoxy Resin Samples with Several Voids. In Proceedings of the 1978 IEEE International Conference on Electrical Insulation, Philadelphia, PA, USA, 12–14 June 1978; pp. 82–85. [Google Scholar]
  29. Danikas, M.G. Partial discharge behavior of two (or more) adjacent cavities in polyethylene samples. J. Electr. Eng. 2001, 52, 36–39. [Google Scholar]
  30. Agoris, D.P.; Hatziargyriou, N.D. Two voids model for simulation of partial discharges in solid dielectrics. Model. Simul. Control 1992, 42, 1–14. [Google Scholar]
  31. Agoris, D.P.; Hatziargyriou, N.D. Approach to partial discharges development in closely coupled cavities embedded in solid dielectrics by the lumped capacitance model. IEE Proc.-A 1993, 140, 131–134. [Google Scholar] [CrossRef]
  32. Agoris, D.P.; Hatziargyriou, N.D. A modelistic consideration of the interaction between discharges in cavities of solid dielectrics. In Proceedings of the 8th International Symposium on High Voltage Engineering, Yokohama, Japan, 23–27 August 1993. [Google Scholar]
  33. Agoris, D.P.; Hatziargyriou, N.D. Application of the EMTP program in the study of discharges in two cavities enclosed in a solid dielectric during its stressing with AC or impulse voltage. In Proceedings of the CIGRE Greek National Committee, Athens, Greece, 10–11 February 1994. [Google Scholar]
  34. Illias, H.A.; Chen, G.; Lewin, P.L. Measurement of Partial Discharge Activities within Two Artificial Spherical Voids in an Epoxy Resin. In Proceedings of the Annual Report Conference on Electrical Insulation and Dielectric Phenomena, Cancun, Mexico, 16–19 October 2011; pp. 489–492. [Google Scholar]
  35. Illias, H.; Chen, G.; Lewin, P.L. Modelling of partial discharge activity in spherical cavities within a dielectric material. IEEE Electr. Insul. Mag. 2011, 27, 38–45. [Google Scholar] [CrossRef]
  36. Illias, H.A.; Chen, G.; Bakar, A.H.A.; Mokhlis, H.; Tunio, M.A. Partial discharges within two spherical voids in an epoxy resin. J. Phys. D Appl. Phys. 2013, 46, 335301. [Google Scholar] [CrossRef]
  37. Pan, C.; Chen, G.; Tang, J.; Wu, K. Numerical Modeling of Partial Discharges in a Solid Dielectric-bounded Cavity: A Review. IEEE Trans. Dielectr. Electr. Insul. 2019, 26, 981–1000. [Google Scholar] [CrossRef]
  38. Chang, C. Degradation by Partial Discharge in Cavities under AC Electric Field. Master’s Dissertation, University of Southampton, Southampton, UK, 2015. [Google Scholar]
  39. Pedersen, A.; Crichton, G.C.; McAllister, I.W. The functional relation between partial discharges and induced charge. IEEE Trans. Dielectr. Electr. Insul. 1995, 2, 535–543. [Google Scholar] [CrossRef]
  40. Ehara, Y.; Ito, T.; Kishida, H.; Sakai, T.; Ito, M. Characteristics of Gaseous Discharges Products and Discharge Magnitude Distribution in Void Discharge Deterioration. Trans. Inst. Electr. Eng. 1992, 112, 643–650. [Google Scholar]
  41. Ito, T.; Sato, O.; Sakai, T.; Ehara, Y. Analysis of Internal Discharge Degradation of Polyethylene by Simultaneous Chemical and Electrical Measurement. Trans. Inst. Electr. Eng. Jpn. (IEE) 1989, 109, 457–463. [Google Scholar]
  42. Liao, R.; Yan, J.; Yang, L.; Zhu, M.; Liu, B. Study on the relationship between damage of oil-impregnated insulation paper and evolution of phase-resolved partial discharge patterns. Eur. Trans. Electr. 2011, 21, 2112–2124. [Google Scholar] [CrossRef]
  43. Gjaerde, A.C. Measurement of Void Gas Pressure during Combined Thermal and Partial Discharge Ageing of Epoxy. IEE Proc. Sci. Meas. Technol. 1995, 142. [Google Scholar] [CrossRef]
  44. Gutfleisch, F.; Niemeyer, L. Measurement and simulation of PD in epoxy voids. IEEE Trans. Dielectr. Electr. Insul. 1995, 2, 729–743. [Google Scholar] [CrossRef]
  45. Wang, L.E. Physical Model of PD Behavior and Relevant Damage Growth from Micro-Cavities in Polyethylene-Based Material under ac Voltage. Ph.D. Thesis, University of Bologna, Bologna, Italy, 2011. [Google Scholar]
  46. Illias, H.A.; Othman, M.E.; Tunio, M.A.; Bakar, A.H.A.; Mokhlis, H.; Chen, G.; Lewin, P.L.; Ariffin, A.M. Measurement and simulation of partial discharge activity within a void cavity in a polymeric power cable model. In Proceedings of the IEEE International Conference (ICSD) on Solid Dielectric, Bologna, Italy, 30 June–4 July 2013; pp. 105–108. [Google Scholar]
  47. Medoukali, H.; Guibadj, M.; Zegnini, B. Study of Electrical Constraints within Cavities in High Voltage Cables. Int. J. Comput. Exp. Sci. Eng. 2015, 1, 30–35. [Google Scholar] [CrossRef]
  48. Wang, L.; Testa, L.; Cavallini, A.; Montanari, G.C. Relation between the trend of partial discharges and aging models under AC voltage. In Proceedings of the IEEE 9th International Conference on the 220 Properties and Applications of Dielectric Materials, Harbin, China, 19–23 July 2009; pp. 268–271. [Google Scholar]
  49. Kim, C.S.; Kondo, T.; Mizutani, T. Change in PD pattern with aging. IEEE Trans. Dielectr. Electr. Insul. 2004, 11, 13–18. [Google Scholar]
Figure 1. Sample setup showing dielectric-bounded cavities in the middle of the Polymer (a) Single cavity test specimen, (b) Closely coupled cavity specimen.
Energies 17 01905 g001
Figure 2. The IEC 60720 partial discharge measurement circuit [8].
Energies 17 01905 g002
Figure 3. Failed single-cavity test specimen with carbonized breakdown site.
Energies 17 01905 g003
Figure 4. Comparisons of PRPD patterns at stage 1 for single and double cavities. Each dot represents a PD pulse. The brighter the colour the higher the repetition rate.
Energies 17 01905 g004
Figure 6. Comparisons of PRPD pattern at stage 3 for single and double cavities. Each dot represents a PD pulse. The brighter the colour the higher the repetition rate.
Energies 17 01905 g006
Figure 7. Comparisons of PRPD pattern at stage 4 for single and double cavities. Each dot represents a PD pulse. The brighter the colour the higher the repetition rate.
Energies 17 01905 g007
Table 1. Highlights on findings in the literature regarding the single-cavity PD phenomena.
ReferenceDefect TypesParametersKey Findings
Gulski & Krivda [15]
  • 10 mm flat cavity in polyethylene
  • PRPD
  • Statistical analysis
  • The aging progress was accompanied by a few consecutive changes in the phase-resolved patterns.
  • Discharge magnitude decreases as the aging time increases.
Komori et al. [16]
  • 0.1 mm thick LDPE in MGI electrode system (7 kVrms)
  • 0.1 mm thick LDPE in IGI electrode system (12 kVrms)
  • Statistical PD pattern
  • The PD pattern and statistical parameter (PD inception phase) changed with the ageing time.
  • The IGI (Insulator-gap-insulator) electrode system showed a similar change in PD pattern with degradation to the change of the MGI (Metal-gap-insulator) electrode system.
Mizutani & Kondo [21]
  • 3 mm cylindrical void in 0.2 mm LDPE
  • PD ϕ-q-n
    pattern and PD current shape
  • Effect of change in gas volume in voids
  • The changes in PD pattern and current shape in the ageing process.
Mizutani et al. [22]
  • 1 mm void in LDPE
  • PD pulse shape
  • The pulse height of the PD pulse was smaller and its width wider with ageing time.
  • The estimated frequency peak and the kurtosis of the PD pulse shape are highly correlated to the time of the ageing stage.
Ijichi et al. [23]
  • CIGRE Method
  • electrode system
  • ϕ-q-n patterns
  • With increasing PD rest time, the first pulse after polarity reversal tended to increase in a rabbit-like pattern.
  • Turtle-like patterns did not change.
Wu et al. [24]
  • Void size of 18 × 18 × 1 unit
  • ϕ-q-n pattern
  • The effects of charge distribution left on the void surface by consecutive PDs on the fluctuation of PD discharge area and PD magnitude under AC voltage.
Guo et al. [25]
  • Spherical void
  • Defects in epoxy resin samples
  • ϕ-q-n pattern
  • During successive ageing periods, the ageing trend at different sizes and stress levels was similar.
  • Variations in gas pressure and charge build-up in the void wall can cause changes in the ϕ-q-n pattern over time.
Nyamupangedengu [26]
  • Artificial defects in polymer insulation
  • Frequency spectral
  • Aging affects the frequency content of PDs, resulting in unique spectral patterns depending on the source type.
Table 2. Highlights of research findings in the literature on the double cavity.
ResearchersDefect TypesParametersKey Findings
Illias et al. [34]
  • Two spherical voids
  • Finite element analysis (FEA)
  • When two voids are close together in a material, their electric fields are greatly influenced by each other, potentially impacting PD occurrences within them.
Illias et al. [35]
  • Two artificial spherical voids in epoxy resin
  • PRPD patterns
  • Pulse sequential analysis (PSA)
  • PDs occurring within two different voids can be distinguished.
Illias et al. [36]
  • Two cavities
  • Finite element analysis (FEA)
  • The PD occurrences in both voids overlap, making it difficult to discriminate between them through measurements.
Agoris & Hatziargyriou [32]
  • Two closely coupled cavities
  • Electromagnetic
  • Transients Program (EMTP)
  • Breakdown of one cavity in the dielectric creates transient overvoltages across the other cavity.
  • The height of these overvoltages may cause the breakdown of the second cavity.
Pan et al. [37]
  • Numerical modelling of cavity PD
  • PRPD pattern
  • Capacitance, Electrostatic, Conductance, and Plasma models
  • Obtained a better understanding of the PD mechanism.
  • The factors (free electron supply, discharge development, and surface charge decay) which contribute to PD behaviour under different test conditions were identified.
Danikas [29]
  • Two closely coupled cavities
  • Discharge current measurement
  • The apparent charge magnitude of two closely coupled cavities is almost doubled compared to the single cavity.
Disclaimer/Publisher’s Note: The statements, opinions and data contained in all publications are solely those of the individual author(s) and contributor(s) and not of MDPI and/or the editor(s). MDPI and/or the editor(s) disclaim responsibility for any injury to people or property resulting from any ideas, methods, instructions or products referred to in the content.

