Abstract
This study investigated the impact of information and communication technology (ICT) on electricity intensity, incorporating electricity prices, financial development, and population growth in Korea from 1990 to 2020, using the ARDL (autoregressive distributed lag) model. Three cases were considered, each relating to a different ICT proxy: Internet use, mobile cellular phone use, and exports of ICT-related products. The results varied depending on the proxy used to represent ICT. An increase in mobile cellular phone use leads to an increase in electricity intensity in the long run; however, the short-run effects of this change are unclear. An increase in Internet use also leads to an increase in electricity intensity in the long run but induces a decrease in electricity intensity in the short run. Increments in the exports of ICT-related products lead to an increase in electricity intensity in the short run; however, this effect is negligible in the long run. Electricity prices do not affect electricity intensity in all cases, and financial development reduces the intensity of electricity in the cases of the use of both mobile cellular phones and the Internet as proxies for ICT, whereas population growth increases electricity intensity in all cases.
1. Introduction
Studies on the relationship between information and communication technology (ICT) and energy consumption first began to appear in the 1950s, a notable one being Thirring’s study [1]. However, this topic did not receive significant attention until the early 1980s (Walker, [2,3]). Since the 1990s, the development of the Internet and wireless communication technology has brought about the rapid proliferation of smartphones and computers, as well as the rapid development of hardware (such as data centers and communication networks) and related software technologies. According to the World Bank’s World Development Indicators (WDIs) Database [4], only 0.023% of the total population of Korea (The Republic of Korea) used the Internet in 1990. However, this figure had increased to 97.57% by 2021. Additionally, the number of mobile cellular subscriptions (per 100 people) was only 0.18 in 1990; this figure has since risen to 140.57 as of 2021. Electricity is used in the ICT sector to power users’ devices (such as laptops and smartphones) and the infrastructure underpinning them (i.e., communication networks and data centers). Cardoso et al. [5] reported that data centers were responsible for 1% of the global electricity demand in 2018. However, these are expected to account for more than 20% of it by 2030. Conversely, despite increases in energy consumption due to ICT systems, energy efficiency can be optimized by ICT (Bastida et al. [6]). The electricity efficiency of ICT equipment has also increased rapidly due to the implementation of energy-saving technologies within ICT-related devices and trends such as cloud computing. Therefore, the development of ICT represents an opportunity to decrease both electricity demand and electricity intensity.
Previous studies have attempted to glean whether the proliferation of ICT devices and the development of related technologies have resulted in an increase in electricity demand. Most previous studies have focused on the direct relationship between ICT use and electricity consumption, which can be classified either as panel analyses targeting multiple countries or studies targeting specific countries. Panel studies targeting multiple countries can then be further divided into analyses focused on developed and developing countries.
Examples of panel analyses targeting developed countries include those by Salahuddin et al. [7] and Magazzino et al. [8]. Salahuddin et al. [7] estimated the effects of ICT use on electricity consumption in OECD countries from 1985 to 2012, and Magazzino et al. [8] investigated the relationship between the diffusion of ICT, electricity consumption, economic growth, and environmental pollution in 16 EU countries from 1990 to 2017 using pooled mean group (PMG) estimation and the Dumitrescu–Hurlin causality test. The results of Salahuddin et al. [7] showed that ICT use caused electricity consumption and increased electricity consumption in both the short and long run. Magazzino et al. [8] showed a one-way causality running from ICT use to electricity consumption using Dumitrescu–Hurlin panel causality tests. However, the results of panel mean group regression evinced that the use of ICT did not affect energy consumption. Analysis of developed countries has yielded different research results depending on their target countries and periods.
Examples of panel analyses that target developing countries include those of Sadorsky [9], Afzel and Gow [10], Saidi et al. [11], Saidi et al. [12], and Zhao et al. [13]. Sadorsky [9] examined the impact of ICT on electricity consumption using GMM estimation in emerging economies from 1993 to 2008, and they observed a positive and statistically significant relationship between ICT and electricity consumption. Afzel and Gow [10] investigated the influence of ICT on electricity consumption using mean group (MG) and PMG estimation in the next eleven (N-11) emerging economies from 1990 to 2014 and observed a positive and statistically significant relationship between ICT and electricity consumption. Saidi et al. [11] investigated the impact of ICT and economic growth on electricity consumption using GMM estimation in 67 countries from 1990 to 2012 and discovered that ICT had a positive and statistically significant effect on electricity consumption. Saidi et al. [12] examined the relationship between energy consumption, ICT, foreign direct investment, and economic growth using the Granger causality test in 13 MENA countries from 1990 to 2012 and did not find a causal relationship between ICT use and energy consumption. Zhao [13] investigated the effects of ICT on energy efficiency and environmental sustainability using autoregressive distributed lag (ARDL) pooled mean group estimation in emerging Asian economies from 1990 to 2019. The results showed that Internet and mobile use increased energy efficiency in the long run. While Sadorsky [9], Afzel and Gow [10], and Saidi et al. [11] showed that an increase in ICT usage increased power consumption, other studies have not confirmed these results.
Examples of studies targeting specific countries include those by Collard et al. [14], Ishida [15], Shehzad et al. [16], and Solarin et al. [17]. Collard et al. [14] examined how the diffusion of ICT-related capital goods affected electricity usage in the French service sector from 1978 to 1999 using a non-linear least squares method and observed that the growth of ICT-related capital goods decreased electricity intensity in the service sector. However, the intensity of electricity has been shown to vary depending on the ICT proxy, where the intensity of electricity usage increased with the use of computers and software but decreased with the adoption of communication devices. Ishida [15] investigated the relationship between ICT and energy consumption in Japan from 1980 to 2010 using the ARDL bounds test and found that ICT investment contributed to a moderate reduction in energy consumption. Shehzad et al. [16] investigated the relationship between ICT and electricity consumption in the United Arab Emirates from 1975 to 2011 using a vector error correction model. They found that ICT increased electricity demand and observed, additionally, an inverted U-shaped relationship between ICT and electricity consumption. Solarin et al. [17] investigated the effects of ICT on electricity consumption in Malaysia from 1990 to 2015 using a Toda–Yamamoto Granger causality approach, and they observed that ICT had a positive impact on electricity consumption. The impact of ICT use on electricity consumption in specific countries varies from country to country. In some countries, the use of ICT has been shown to improve electricity efficiency, thereby causing a decrease in electricity consumption. However, in other countries, the use of ICT has proven to increase electricity consumption. Observing various country-specific research results, ICT has improved electricity consumption efficiency in France and Japan, but it has also increased overall electricity consumption in Malaysia and the United Arab Emirates.
This study analyzes the effects of various proxies for ICT on electricity intensity, incorporating electricity prices, financial development, and population growth in Korea from 1990 to 2020. To the best of our knowledge, this is the first study to investigate this topic in Korea. This study is differentiated from previous studies in the following ways:
Firstly, while most studies have analyzed the direct relationship between ICT and electricity consumption, this study analyzes the relationship between ICT and electricity intensity. Here, electricity intensity is defined as the ratio of electricity consumption to GDP. Therefore, electricity intensity is affected not only by an increase in electricity consumption but also by an increase in GDP. In other words, the effects of ICT on electricity consumption and GDP can be considered simultaneously through the metric of electricity intensity.
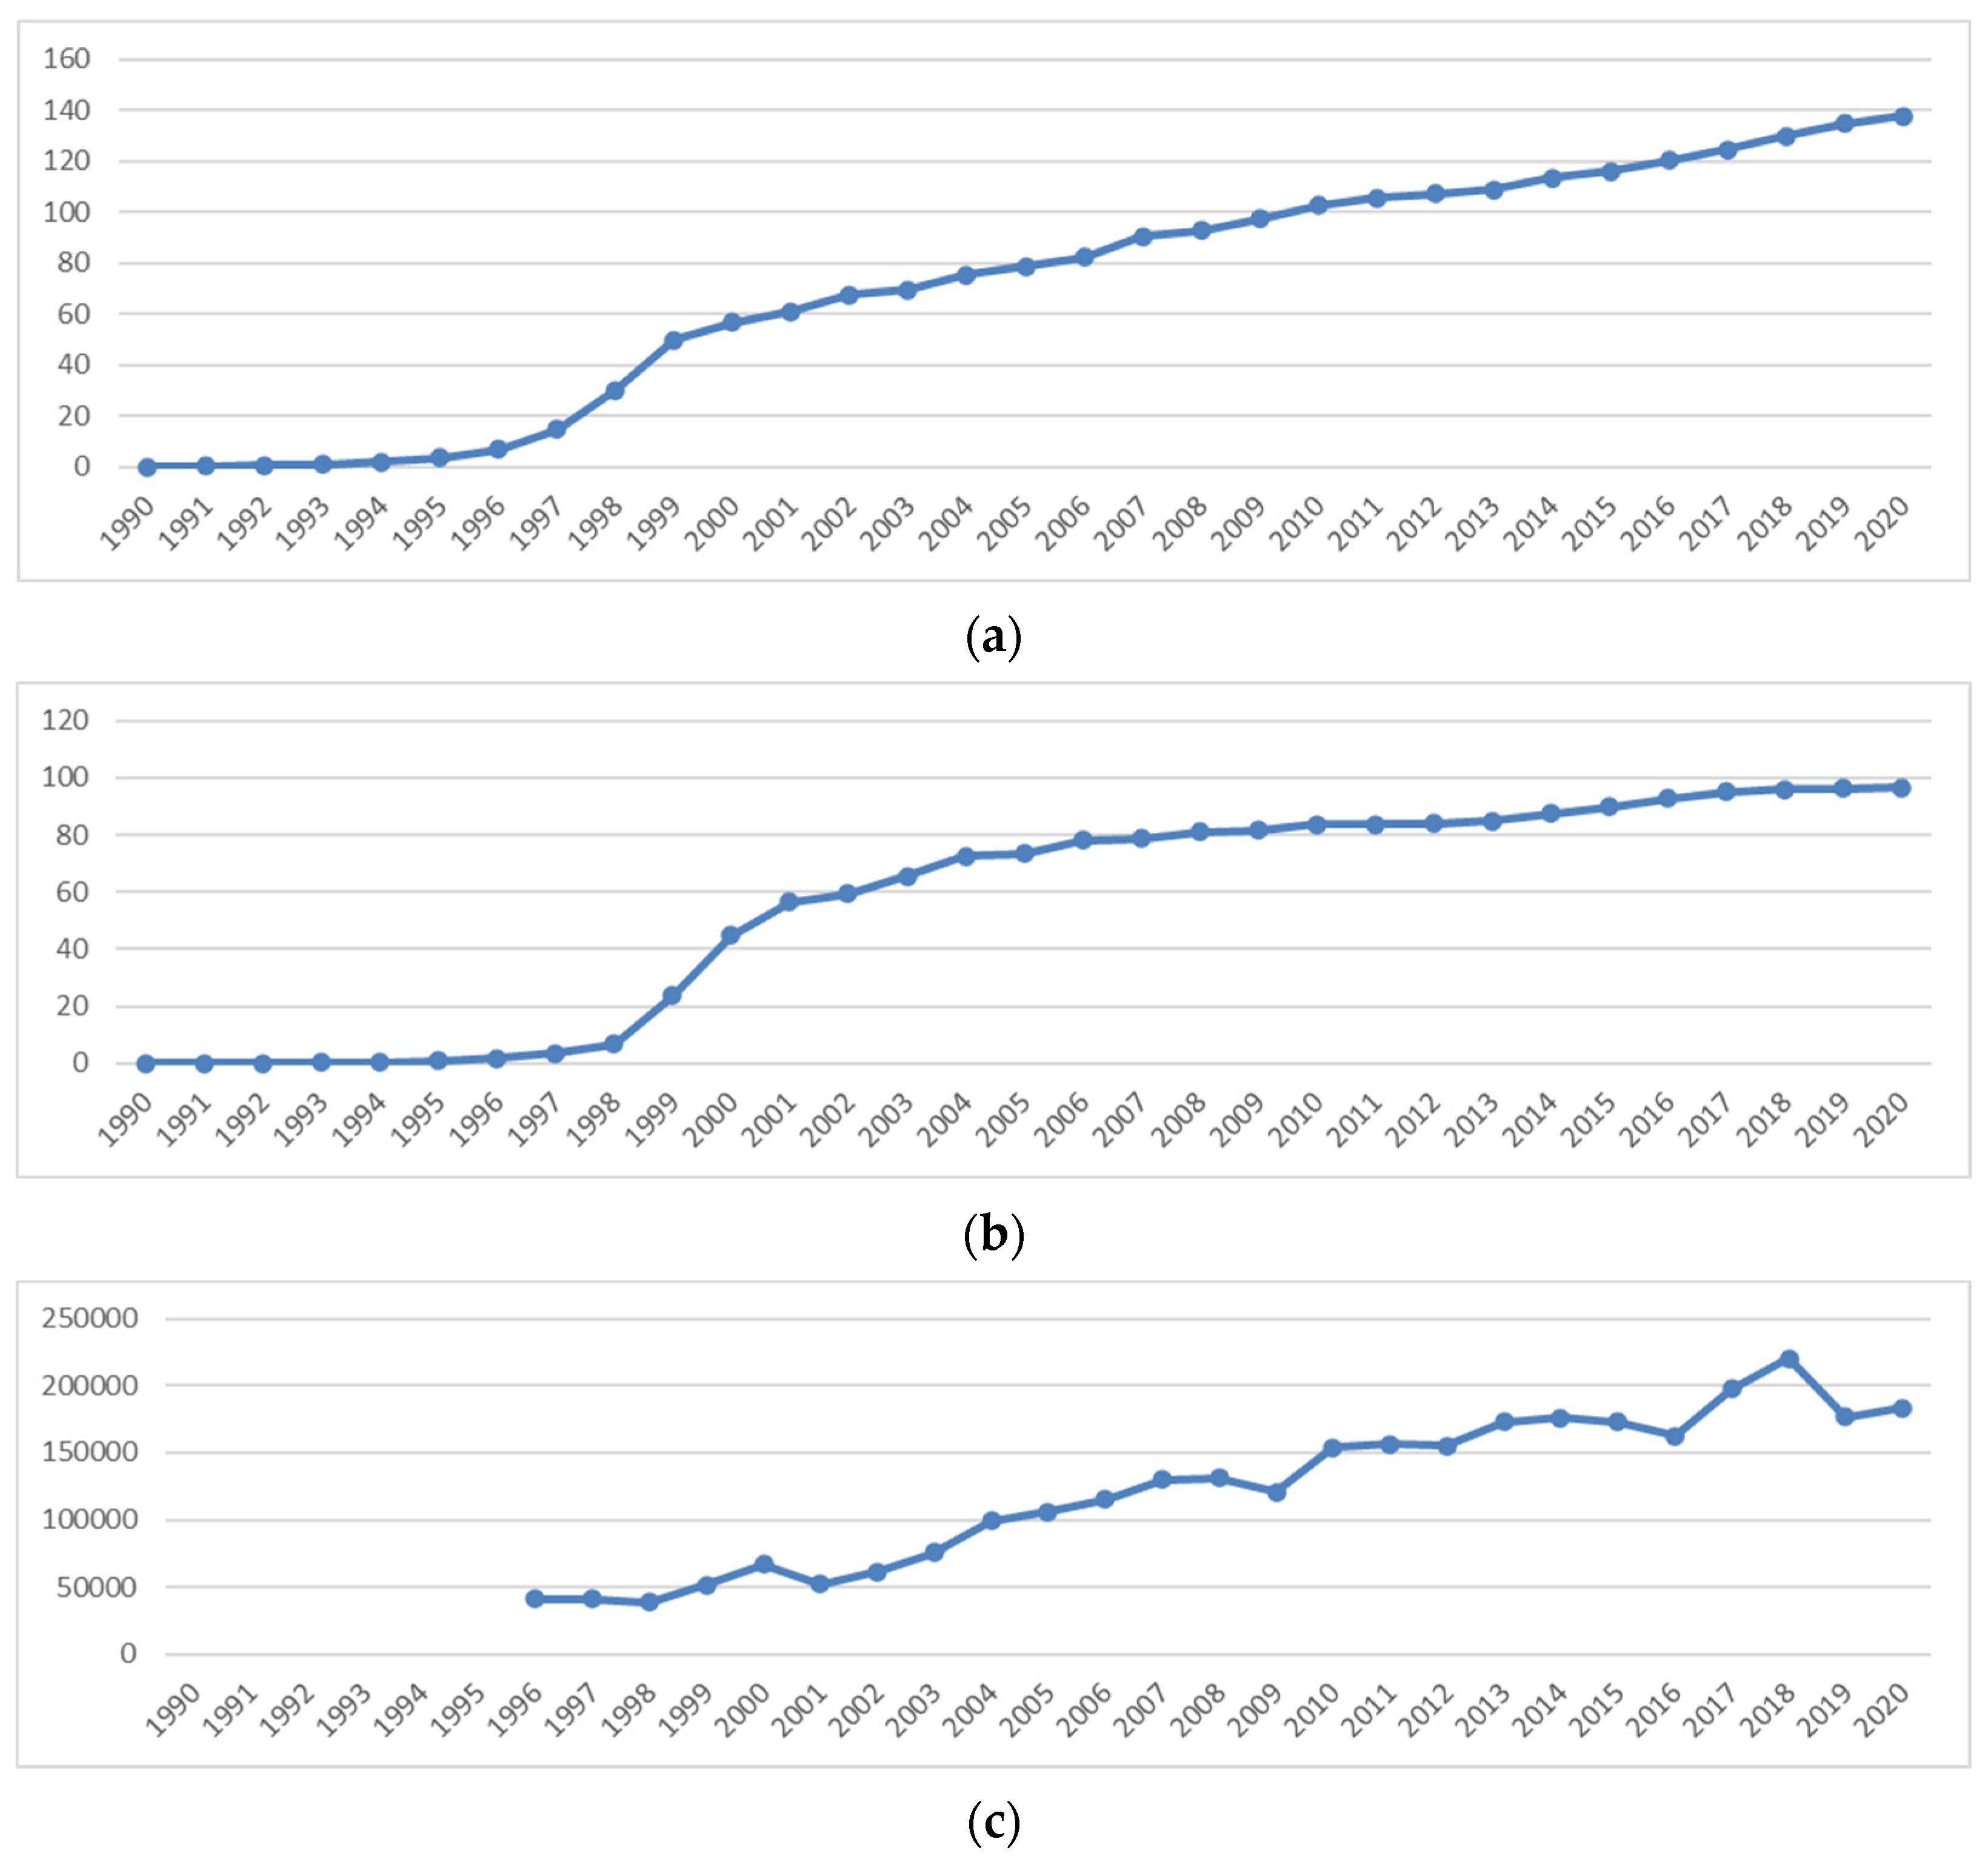
Secondly, this study focuses on Korea. Although Korea has been included in some previous panel analyses on these topics, no analysis has focused solely on Korea. South Korea has undergone rapid development in terms of ICT over the past 30 years, with the spread of the Internet and mobile cellular devices. Figure 1 shows the trends in various proxies for ICT in Korea; (a) and (b) represent Internet use and mobile cellular phone use, respectively, and data that show similar trends. However, the export of ICT goods (c) shows a quite different trend. One consistent observation is that Korea’s ICT sector has developed rapidly due to the spread of the Internet and mobile cellular devices. This development, in turn, is assumed to have led to changes in electricity consumption, which in turn affects electricity intensity. Specifically, the ARDL model is used to examine the short- and long-run effects of ICT on electricity intensity.
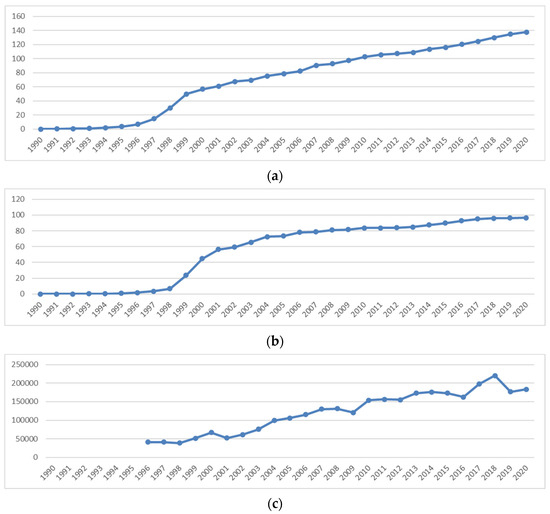
Figure 1.
Trends in proxies for ICT: (a) Mobile cellular subscriptions per 100 people; (b) Internet users per 100 people; (c) exports of ICT-related products (in millions of USD).
Thirdly, this study utilized three proxies for ICT: Internet users per 100 people, mobile cellular subscriptions per 100 people, and exports of ICT-related products. This approach provides a more comprehensive understanding of how different proxies for ICT affect electricity intensity. Most previous studies have used the Internet and mobile cellular phones as proxies for ICT. This study includes exports of ICT-related products as a new proxy for ICT. However, these proxy data are only available from 1996 onwards.
Fourthly, if the impact of ICT on electricity intensity is confirmed, it could have implications for the energy policies and strategies being implemented in order to reduce carbon emissions. This study aims to provide implications for energy-related policies and climate change mitigation strategies in Korea.
2. Materials and Methods
In this study, we utilized the ARDL methods introduced by Pesaran and Pesaran [18], Pesaran and Shin [19], and Pesaran et al. [20] to evaluate short- and long-run cointegration among variables. The ARDL approach is used to explore long-run relationships between variables and to analyze how these relationships evolve over time. This model allows for the analysis of short-run changes and shocks and how they affect long-run relationships. This can help in understanding the short-term effects of policy changes or external shocks on economic indicators. Utilizing the ARDL model, it is possible to test whether different variables maintain a long-run equilibrium relationship, known as a relationship of cointegration. This implies that the variables move together in the long run and maintain a certain state of equilibrium. Once a long-run relationship is established, the ARDL model can be restructured into an error correction model, which allows the analysis of how variables adjust in the short run to return to their long-run equilibrium.
The ARDL cointegration method is considered more effective than the Johansen cointegration method developed by Engle and Granger [21] because it is valid even for short and finite sample data sets and provides effective results regardless of whether the variables are integrated at I(0), I(1), or jointly cointegrated (Pesaran et al. [20]). The ARDL method also provides valid estimators in the presence of endogeneity and autocorrelation in the model, as shown in previous studies by Armi [22] and Shehzad et al. [16], which focused on a single country.
Synthesizing the models used in previous studies such as Sadorsky [9], Salahuddin et al. [7], Saidi et al. [11], Zhao et al. [13], Shahbaz et al. [16], and Solarin et al. [17], the following equation can be used to specify the long-run empirical model that reflects the effect of exogenous variables, including ICT, on electricity intensity:
where ln is the natural logarithm and EE represents electricity intensity, which is calculated by dividing electricity consumption by GDP. EP represents electricity prices. ICT represents information and communication technology. FD represents financial development, which is measured according to the share of domestic credit in the private sector in GDP (%), and PO represents the population. The error term is denoted as . Subscript represents the time dimension. The expected signs of the independent variables could be either positive or negative. Generally, higher electricity prices are expected to reduce electricity consumption due to the law of demand (Salahuddin et al. [7], Shahbaz et al. [16]). Therefore, it is expected that the price of electricity will have a negative effect on electricity intensity. Previous research has indicated that financial development also affects electricity consumption. This variable was included in the study of Saidi et al. [11] and Solarin et al. [17]. Therefore, financial development is also expected to affect electricity intensity. Population growth has also been found to affect electricity consumption in many studies by Saidi et al. [11] and Zhao et al. [13]. Population growth has been shown to increase electricity consumption in most studies. Therefore, we expected population growth to have a negative impact on electricity intensity. As shown in Table 1, ICT can have both positive and negative effects on electricity consumption. The effects are expected to vary depending on the characteristics of the country.

Table 1.
Previous studies on ICT’s effect on electricity consumption or electricity intensity.
Three different cases were considered, each using a different proxy for ICT, with MO denoting mobile cellular subscriptions (per 100 people), INT denoting the number of Internet users (per 100 people), and EX denoting the amount of exports of ICT-related products. MO, INT, and EX as proxies for ICT are named Case 1, 2, and 3, respectively.
The estimation of the ARDL models involves three steps. The first step is to perform an ARDL bounds test to determine whether a long-run cointegration relationship exists between the variables. Once this is established, the conditional error correction model can be formulated using the following equation:
Equation (3) includes the first difference operator, denoted by ∆, and the long-term coefficients . The optimal lag length, represented by p and to , is determined using the Akaike information criterion (AIC).
If the first step confirms the existence of a cointegration relationship, the second step estimates the augmented ARDL model using the following equation:
The long-run coefficients in this ARDL model are estimated using Equation (4):
where
The third step involves identifying the short-run dynamics using the ARDL error correction model (ARDL-ECM) presented below:
where is the error term, and represents the error correction term. When the coefficients of () are negative and statistically significant, the associated variables will converge to the long-run equilibrium.
The stability of the ARDL model is tested using the cumulative sum of the recursive residual test (CUSUM) and the cumulative sum of squares of the recursive residual test (CUSUMSQ). The E-views package was used to estimate this ARDL model.
The specific data and sources are listed in Table 2. The time range of the data, except for EX, is 1990 to 2020. Data for EX are only available from 1996 onward, as there were no data prior to 1996. MO, INT, FD, and PO were obtained from the DataBank of the World Bank [4], and EE and EP were obtained from the Korea Energy Statistical Information System (KESIS) of the Korea Energy Economics Institute (KEEI) [23]. EX was obtained from the Korean Statistical Information Service (KOSIS) of Statistics Korea [24]. Table 3 shows the descriptive statistics of individual variables.
Table 2.
Data Sources.
Table 3.
Descriptive statistics.
3. Results
3.1. Unit Root Test
Whether the variables are I(0) or I(1) should first be checked using a unit root test to evaluate the long-run relationships of cointegration among the variables using the ARDL approach. We adopted the augmented Dickey–Fuller test (Dickey and Fuller [25]) to test whether each variable was stationary. Table 4 shows the results of the ADF test at the variable level, and Table 5 shows the results of the first difference in the variables. According to these results, lnEP, lnFD, and lnEX had unit roots at the level but not at the first difference. Therefore, these variables were integrated at I(1). lnEE, lnPO, and lnMO did not have unit roots at this level, indicating that these variables were integrated at I(0).
Table 4.
Unit root test (level).
Table 5.
Unit root test (first difference).
Because all the variables are integrated at I(0) or I(1), the ARDL cointegration method can be applied to this study. The ARDL cointegration method is also valid, even if the variables have a mixed order of integration. All variables are either I(0) or I(1), which satisfies the requirement of the ARDL model using a bound testing approach (Pesaran et al. [20]).
3.2. Model Selection Criterion and ARDL Bounds Test
An appropriate lag length was chosen to avoid erroneous estimates and consequent low model reliability. The Akaike information criterion (AIC) criteria was used to select the appropriate lag length. The AIC measure is widely used in statistics for model selection among a set of models. The AIC provides a relative estimate of the information lost when a given model is used to represent the process of generating the data. In simpler terms, the AIC helps to quantify how well a model fits the data while penalizing for the number of parameters used, thus encouraging parsimony.
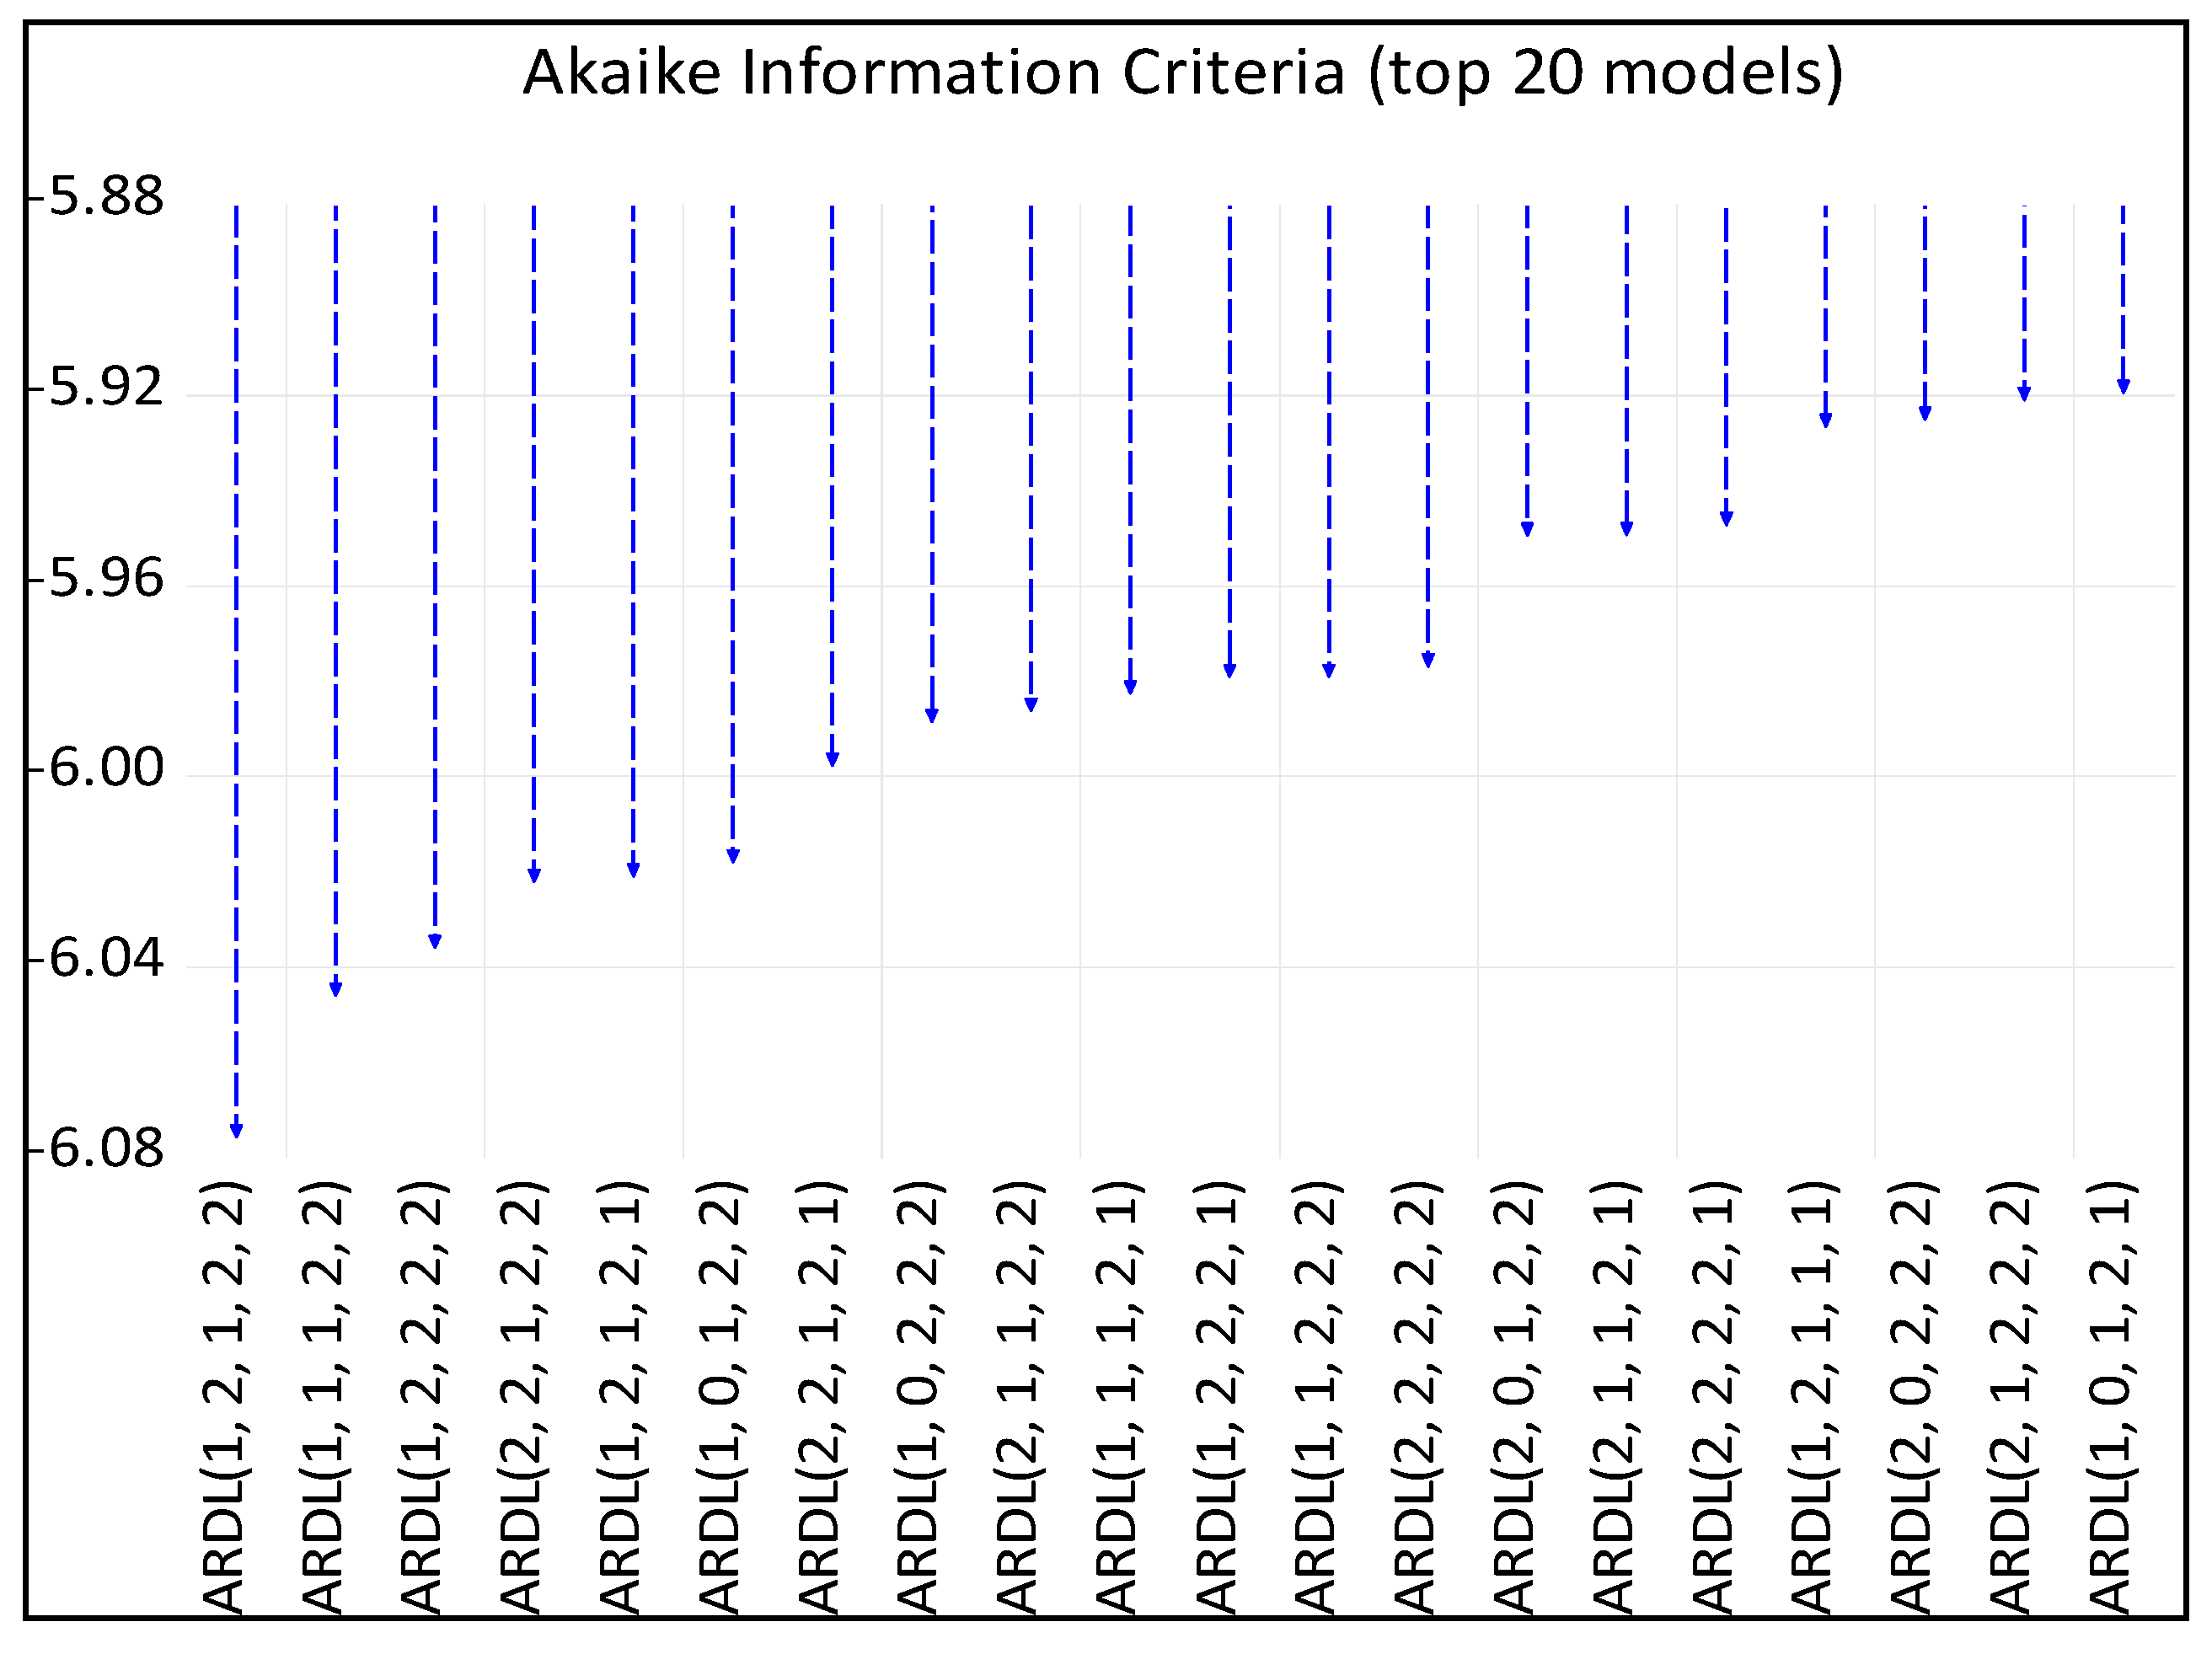
Figure A1, Figure A2 and Figure A3 presents the top 20 ARDL models for each case, differing according to the chosen proxy for ICT. Figure A1 shows the models determined for mobile cellular phone use as a proxy for ICT; the ARDL (1,1,2,2,1) model shows the lowest AIC value. Therefore, the appropriate lag lengths for each variable, lnEE, lnEP, lnMO, lnFD, and lnPO, correspond to , , , , and , respectively. Figure A2 shows the models for Internet use as a proxy for ICT; the ARDL (1,2,1,2,2) model indicates the lowest AIC value. Therefore, the appropriate lag lengths for lnEE, lnEP, lnINT, lnFD, and lnPO correspond to , , , , and , respectively. Figure A3 shows the models for exports of ICT-related products as a proxy for ICT; the ARDL (1,2,1,2,2) model has the lowest AIC value. Therefore, the appropriate lag lengths for lnEE, lnEP, lnEX, lnFD, and lnPO correspond to , , , , and , respectively.
ARDL bounds tests were conducted to determine whether a long-run cointegration relationship existed among the variables. The results of the bounds test for the selected ARDL models are presented in Table 6. The null hypothesis of the F-statistic bounds test was that there was no cointegration among the variables. As the sample size was relatively small, the critical bound values provided by Narayan [26] were used to identify a long-run cointegrating relationship.
Table 6.
ARDL F-bounds test.
According to Table 6, the calculated F-statistics of the selected ARDL (1,1,2,2,1) for Case 1, with lnEE as the dependent variable and lnEP, lnMO, lnFD, and lnPO as independent variables, are 8.177. This value is greater than the upper bound of 4.44 at the 1% significance level, indicating the existence of a long-run cointegrating relationship among the variables. The calculated F-statistic of the selected ARDL (1,2,1,2,2) for Case 2, with lnEE as the dependent variable and lnEP, lnINT, lnFD, and lnPO as independent variables, is 7.936, which is above the upper bound of 5.84 at the 1% significance level, thus confirming the presence of a long-run cointegrating relationship among the variables. Finally, the calculated F-statistic of the selected ARDL (1,2,1,2,2) for Case 3, with lnEE as the dependent variable and lnEP, lnEX, lnFD, and lnPO as independent variables, is 5.317, which is above the upper bound of 4.62 at the 10% significance level, indicating the existence of a long-run cointegrating relationship among the variables.
3.3. Long-Run Equilibrium Relationship
The reduced equation, as shown in Equation (5), is presented in Table 7. In Case 1, the long-run coefficients of lnMO and lnPO were statistically significant at the 1% level, indicating that mobile cellular subscriptions (as a proxy for ICT) and population growth contributed to an increase in electricity intensity in the long run. However, the coefficients of lnEP and lnFD are not statistically significant, indicating that electricity price and financial development do not have long-term effects on electricity intensity.
Table 7.
Long-run equilibrium.
In Case 2, the long-run coefficients of lnINT and lnPO were statistically significant at the 1% level, indicating that mobile cellular subscriptions (as a proxy for ICT) contributed to the increase in electricity intensity and population growth contributed to a decrease in electricity intensity in the long run. However, the coefficients of lnEP and lnFD were not statistically significant, indicating that electricity price and financial development did not have a long-term effect on CO2 emissions.
In Case 3, the long-run coefficient of lnEX was not statistically significant, indicating that exports of ICT-related products (as a proxy for ICT) did not affect electricity intensity. The coefficient of lnPO was statistically significant at the 1% level, indicating that population growth contributed to the decrease in electricity intensity in the long run. The coefficient of lnFD was statistically significant at the 10% level, indicating that financial development contributed to an increase in electricity intensity in the long run.
The effects of ICT on electricity intensity varied depending on the proxy for ICT being used. While electricity intensity tended to deteriorate with an increase in the use of the Internet and mobile devices, there appeared to be a minimal relationship between the export of ICT-related products and electricity intensity. In the first two cases, the development of ICT, namely the increased use of the Internet and mobile phones, was shown to have led to an increase in electricity consumption in the long run, which has, in turn, led to an increase in electricity intensity. This is consistent with the findings of most of the studies presented in Table 1. In particular, Salahuddin [7] found in a study of the OECD that an increase in the use of the Internet and mobile phones led to an increase in electricity consumption. Korea is also one of the OECD member countries, and this study shows that the relationship between ICT and electricity consumption in Korea is consistent with that in OECD member countries.
In all three cases, electricity prices did not affect electricity intensity. In expounding upon Equation (1), we predicted that electricity prices would reduce electricity consumption and thus reduce electricity intensity. However, the results show that electricity prices have no effect on electricity intensity in the long run. These results are inconsistent with those of previous studies that have examined other countries, such as the UAE (Shahbaz et al. [16]). In the case of Korea, electricity prices have been subject to regulation and have, therefore, remained stable and low compared with other countries. As a result, changes in the price of electricity in Korea have not led to any significant changes in the consumption of electricity.
Financial development had no effect on electricity intensity in Cases 1 and 2, and its effect was non-significant in Case 3. This result distinguishes our study from previous studies by Saidi et al. [11] and Solarin et al. [17]. In particular, Saidi et al. [11], which analyzed a global panel of 67 countries, found significant results that financial development increased electricity consumption in global, middle-income, and low-income panels. However, the results from global analyses are not guaranteed to be applicable to individual countries. In Korea, financial development does not seem to increase electricity consumption in the long run.
The impact of population growth on power intensity in the long run showed mixed results. In Case 1, population growth was found to worsen electricity intensity, but in Cases 2 and 3, no clear relationship between population growth and electricity intensity could be found. Previous studies by Solarin et al. [11] and Zhao et al. [13] found that population growth increases electricity consumption in the long run. Of course, the former study was based on the OECD, and the latter study was based on Malaysia. The difference between these results is due to the difference in the model between the previous studies and this study. In our model, population growth was accompanied by an increase in GDP, which offsets the effect on electricity intensity.
3.4. Short-Run Dynamics
The short-run dynamics for Case 1 are shown in Table 8. The elasticity of electricity price with respect to electricity intensity was not statistically significant in the short run, indicating that electricity price does not affect electricity intensity in the short run. However, an increase in the use of mobile phones was shown to increase electricity intensity in period t and decrease it in period t − 1. In addition, as financial development progressed in the short run, electricity intensity improved. Improvements in the financial system led to a decrease in electricity intensity. Finally, population growth was found to increase electricity intensity, which could be attributed to an increase in electricity demand. As expected, the lagged error correction term in Case 1 was negative and statistically significant, supporting cointegration among the variables (Bahmani-Oskooee and Nasir [27]). The estimated coefficient of −0.4343 suggests that convergence to equilibrium takes slightly more than two years.
Table 8.
Short-run dynamics of Case 1 based on ARDL (1,1,2,2,1).
The short-run dynamics for Case 2 are shown in Table 9. As in Case 1, the electricity price had no effect on electricity intensity in the short run and had no effect on changes in electricity consumption. However, an increase in Internet use decreased electricity intensity in the short run. Similarly, financial development was found to decrease electricity intensity, and population growth was found to increase electricity intensity in the short run. As expected, the lagged error correction term in Case 2 was negative and statistically significant. The estimated coefficient of −0.4582 suggests that convergence to equilibrium takes slightly more than two years.
Table 9.
Short-run dynamics of Case 2 based on ARDL (1,2,1,2,2).
The short-run dynamics for Case 3 are shown in Table 10. It was found that an increase in the export of ICT-related products increased electricity intensity in the short run. This is because semiconductors, which are representative ICT-related products, are electricity-intensive industries, and an increase in production due to an increase in the export of these products is accompanied by an increase in electricity demand. However, financial development reduced electricity intensity after one period, and population growth increased electricity intensity in the short run. As expected, the lagged error correction term in Case 3 was negative and statistically significant. The estimated coefficient of −0.2479 suggests that the convergence to equilibrium takes about four years.
Table 10.
Short-run dynamics of Case 3 based on ARDL (1,2,1,2,2).
3.5. Model Stability
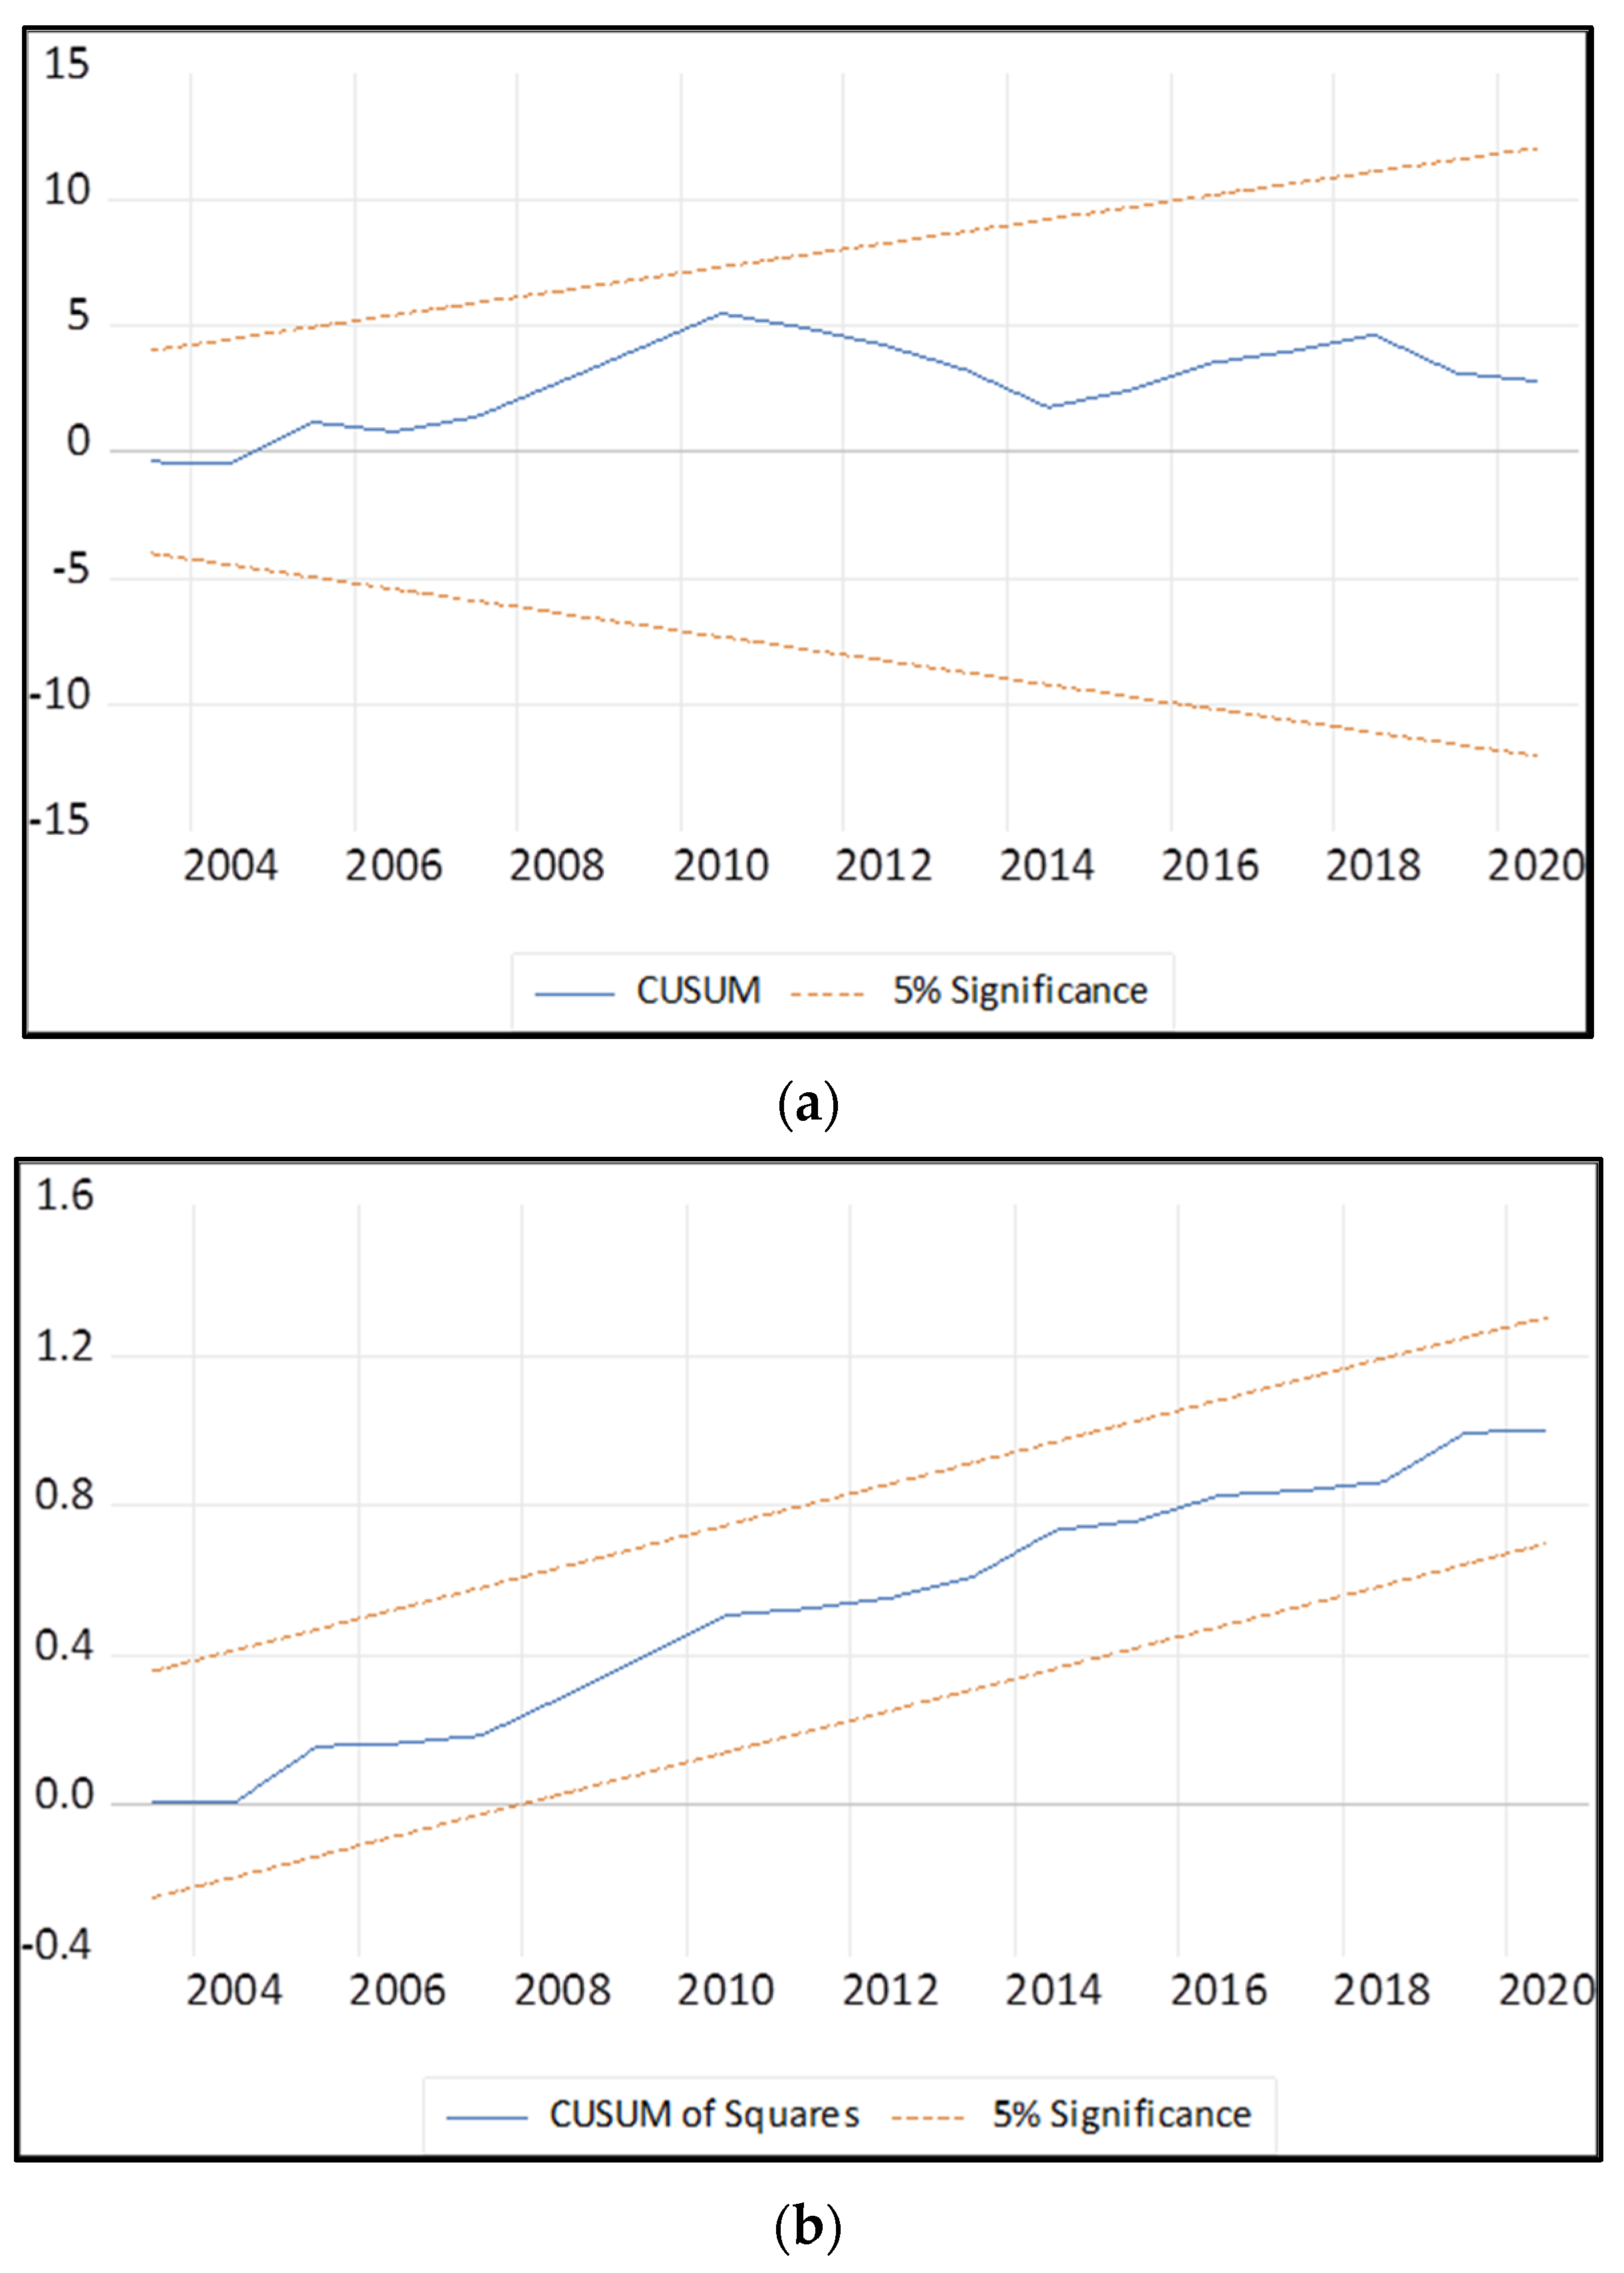
The stability of the coefficients in the estimated models was tested using the cumulative sum (CUSUM) and the cumulative sum of squares (CUSUMSQ) of the recursive residuals (Pesaran and Pesaran [18]). The cumulative sum test identifies systematic changes in the regression coefficients, while the cumulative sum of squares test detects sudden changes in the constancy of the regression coefficients.
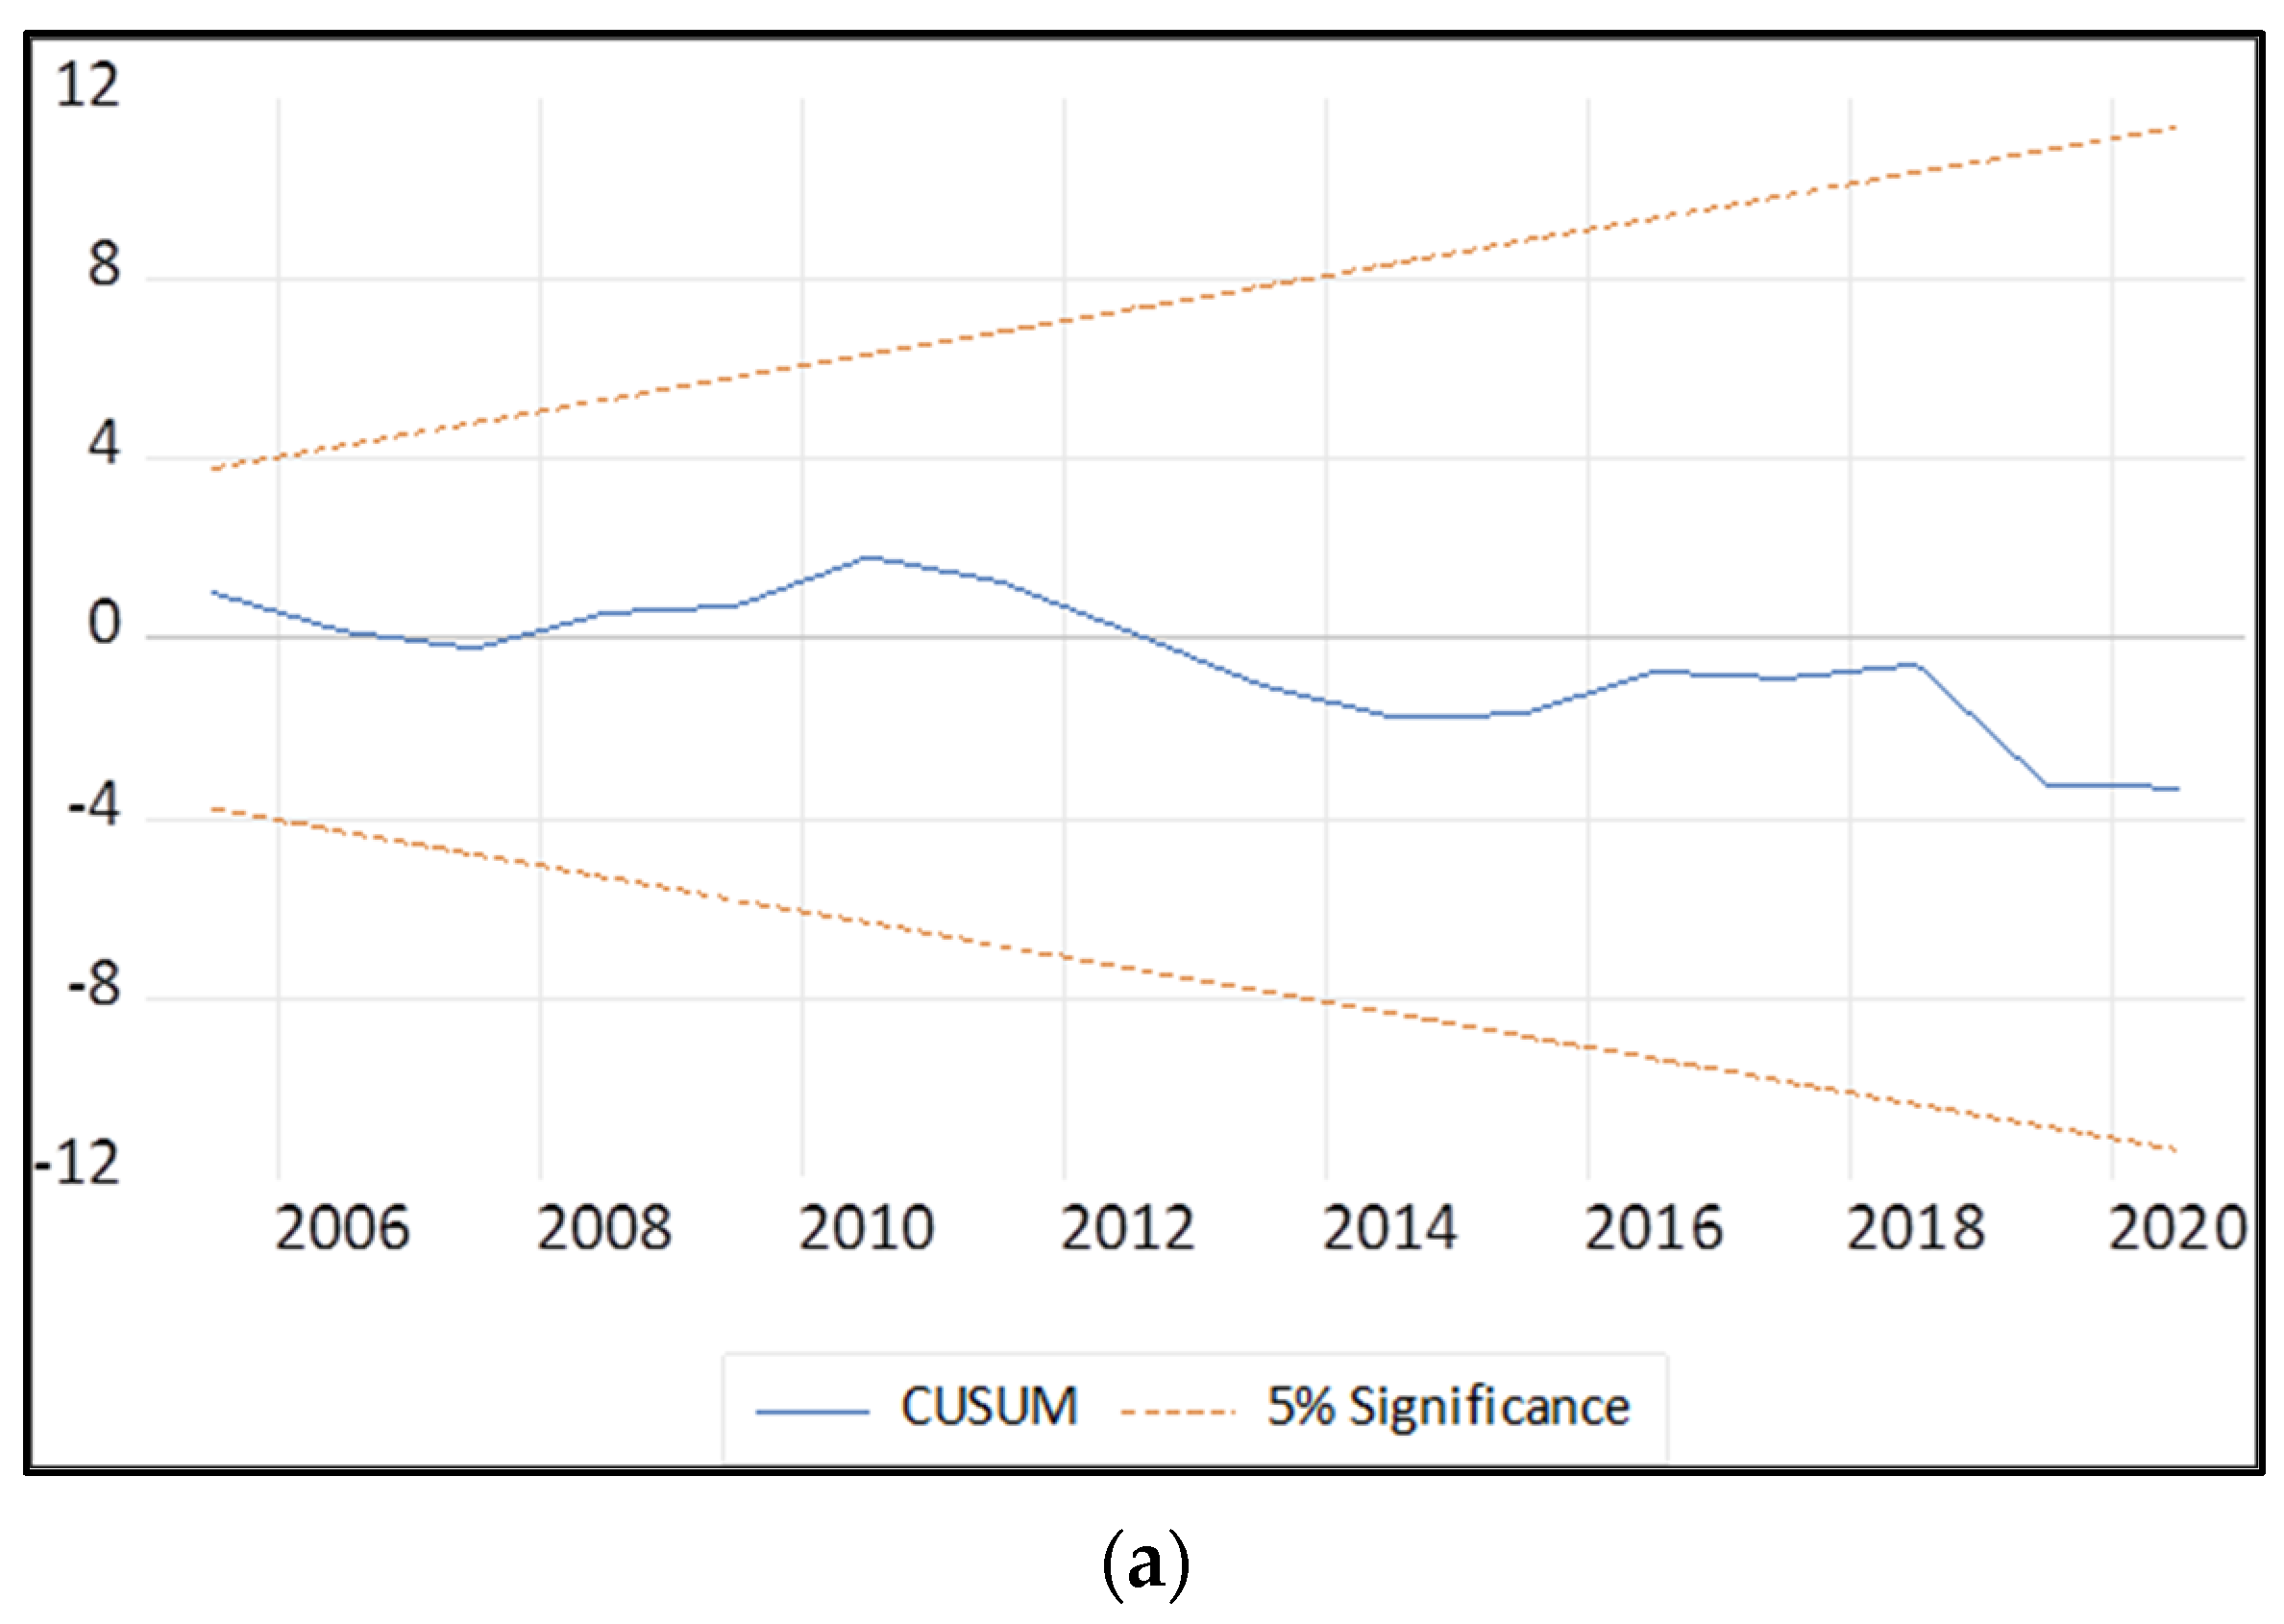
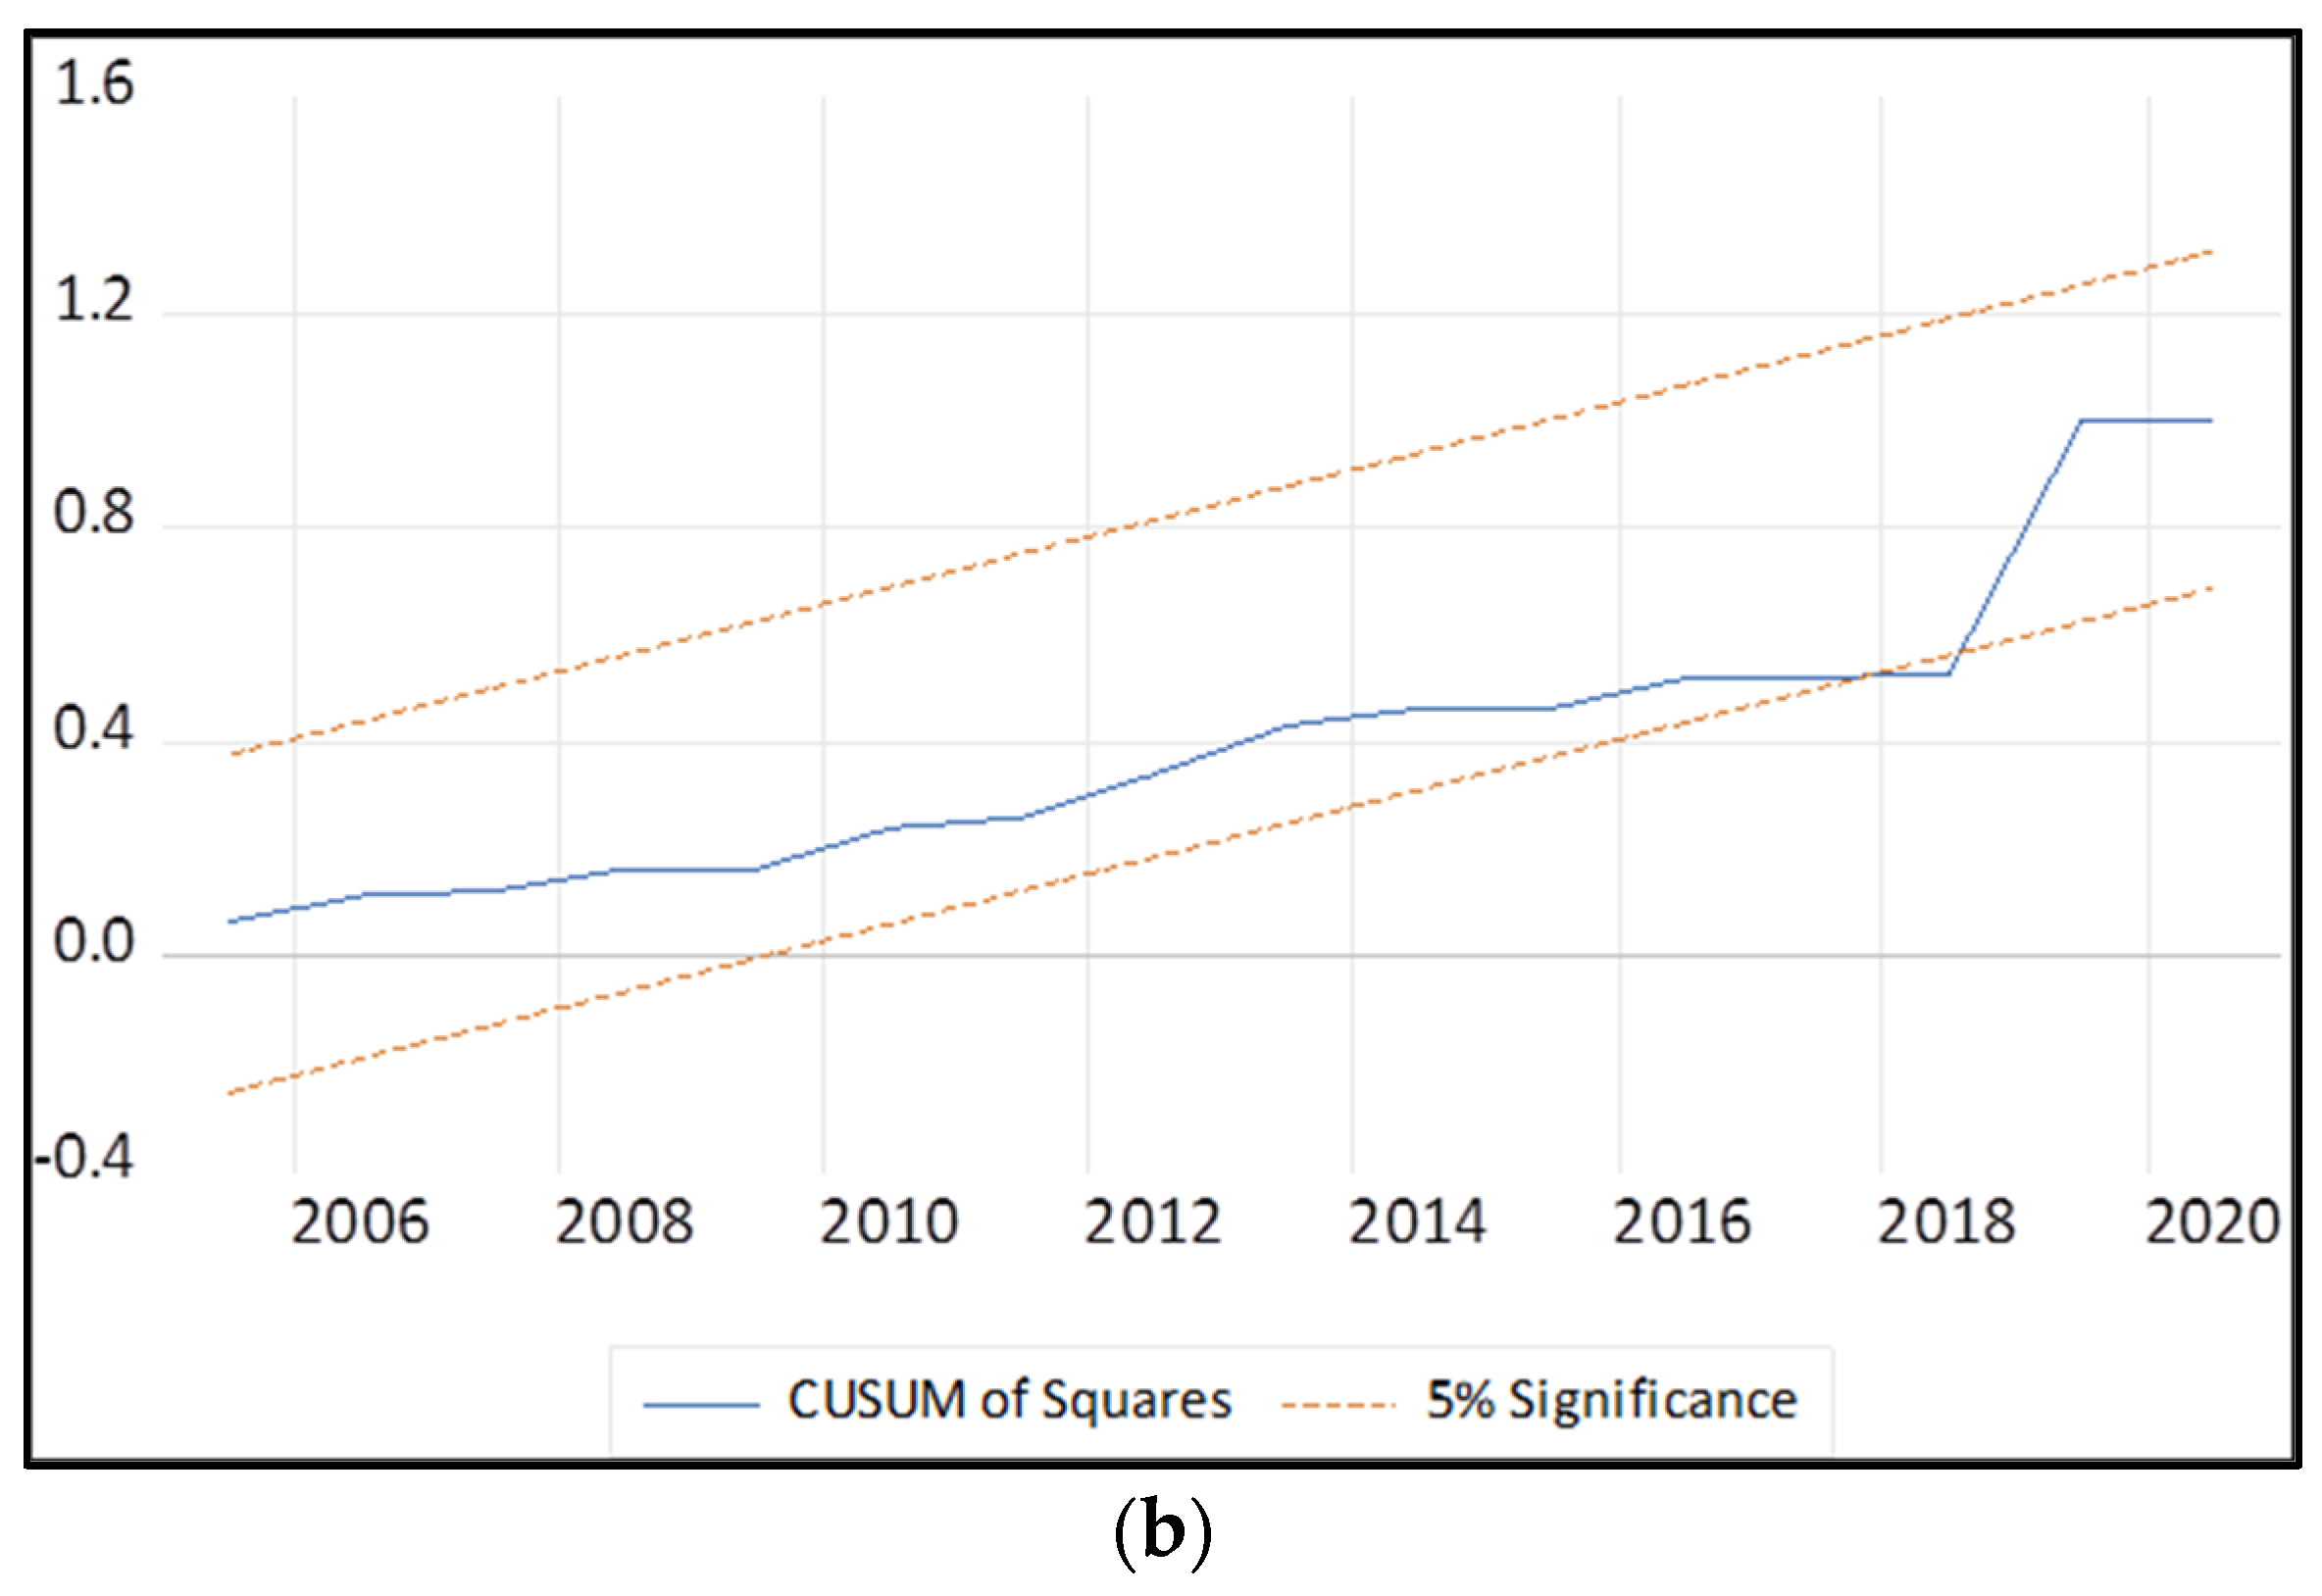
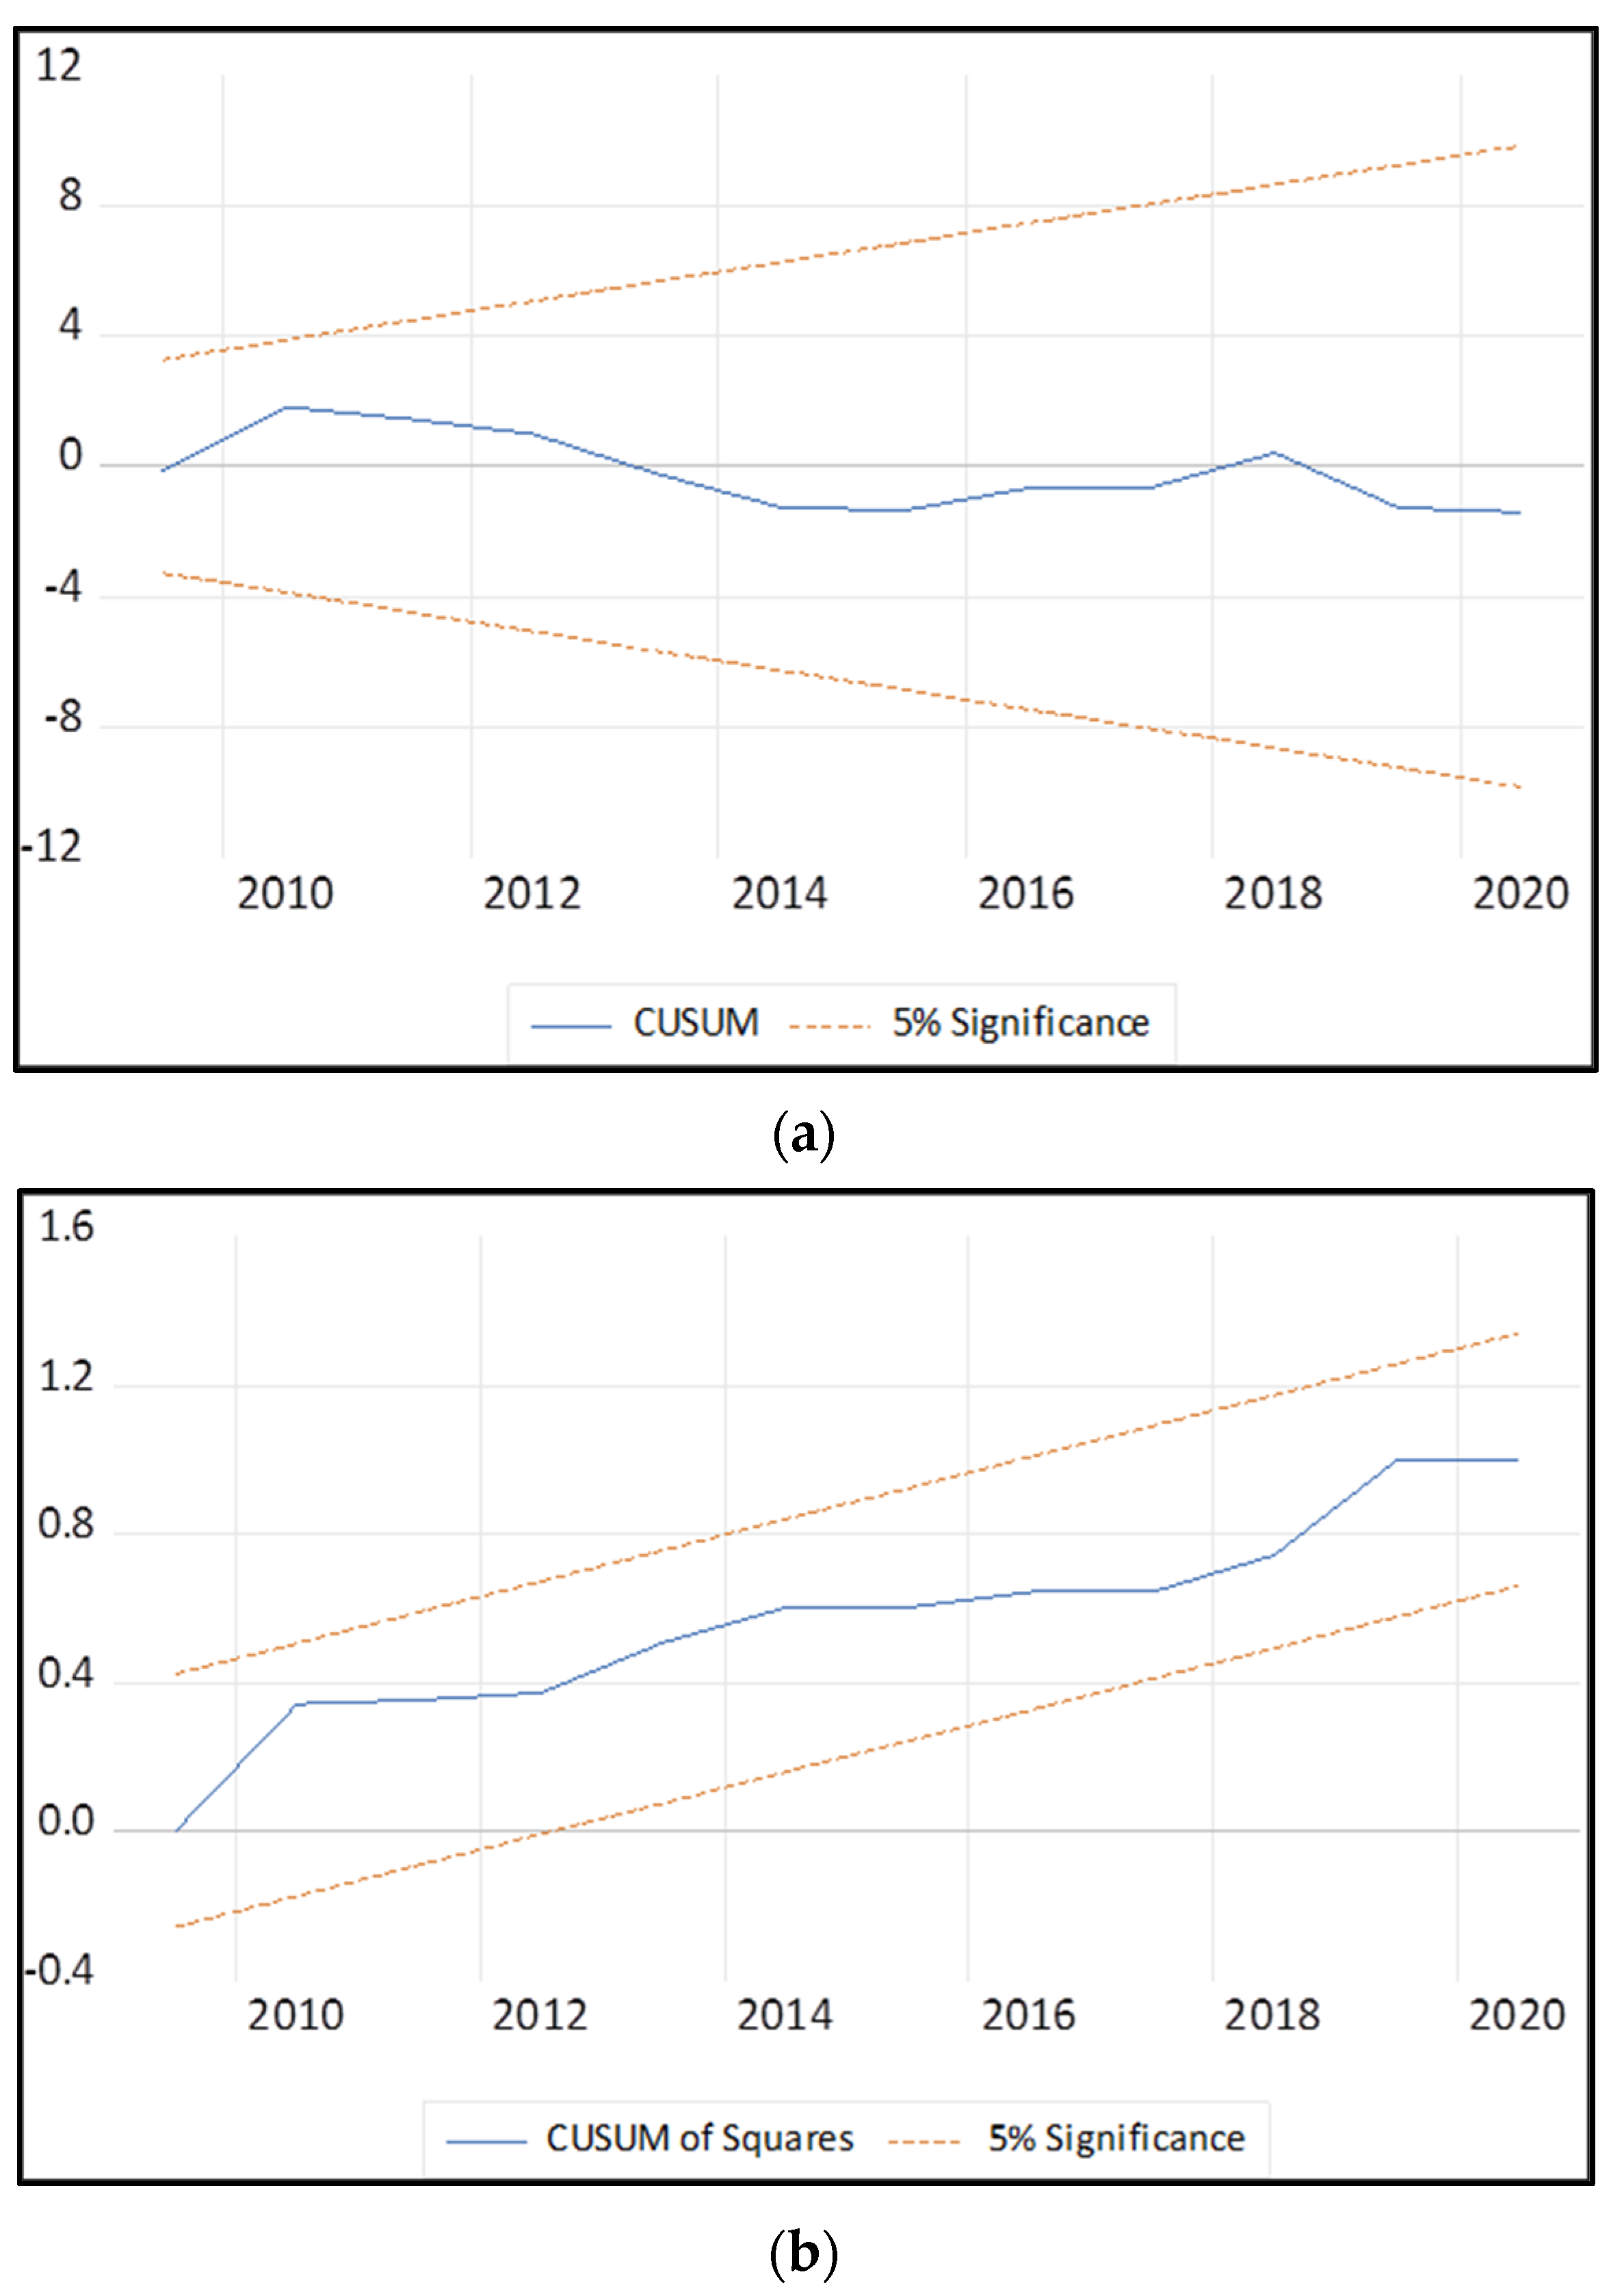
Figure 2, Figure 3 and Figure 4 illustrate the stability test results for each case, respectively. The graphs demonstrate that the estimated parameters for all the models remained stable throughout the sample period.
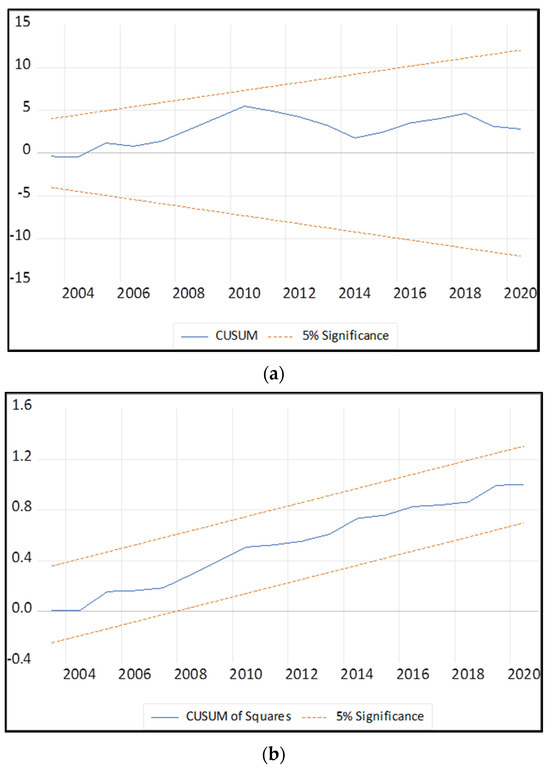
Figure 2.
Plot of CUSUM and CUSUMSQ for Case 1: (a) plot of CUSUM; (b) plot of CUSUMSQ.
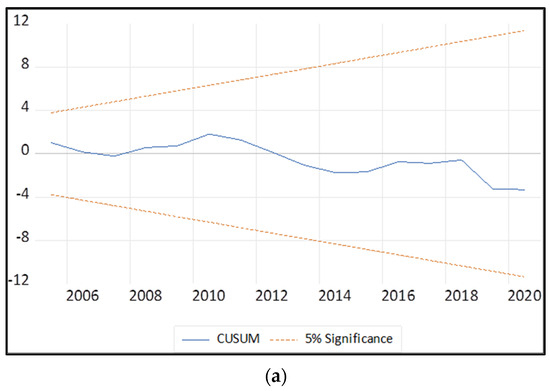
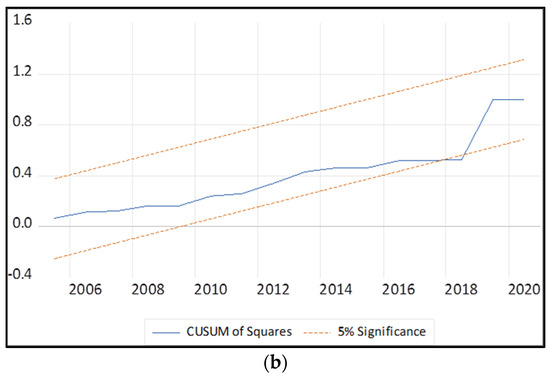
Figure 3.
Plot of CUSUM and CUSUMSQ for Case 2: (a) plot of CUSUM; (b) plot of CUSUMSQ.
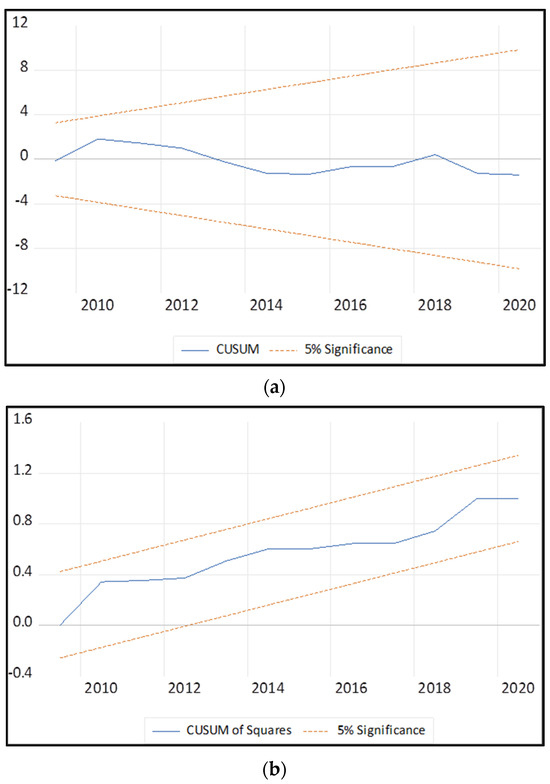
Figure 4.
Plot of CUSUM and CUSUMSQ for Case 3: (a) plot of CUSUM; (b) plot of CUSUMSQ.
4. Discussion and Conclusions
This study investigated the impact of ICT on electricity intensity by incorporating electricity prices, financial development, and population growth in Korea from 1990 to 2020. The main findings derived from the empirical analysis are as follows:
First, the results vary depending on the proxy for ICT incorporated as a variable. When mobile phone use is used as a proxy for ICT, its increase leads to an increase in electricity intensity in the long run. However, the short-term effects of mobile phone use remain unclear. Second, when Internet use is used as a proxy for ICT, its increase leads to an increase in electricity intensity in the long run. In the short run, however, Internet use reduces electricity intensity. Third, when the export of ICT-related products is used as a proxy for ICT, its increase leads to an increase in electricity intensity in the short run; however, the long-run effects are negligible. As shown above, the impact of ICT on electricity intensity varies depending on which proxy for ICT is being assessed. In particular, the increases in the use of mobile phones and the Internet seem to increase electricity demand in the long run, leading to an increase in electricity intensity. This finding is similar to that of a previous study that used these same variables as proxies for ICT. The effect of the exports of ICT-related products on electricity intensity remains unclear because the increase in energy consumption due to an increase in exports of ICT-related products is offset by a concurrent increase in GDP due to an increase in the production of ICT-related goods.
Meanwhile, electricity prices do not affect electricity intensity in all cases. This is because electricity prices in Korea are regulated by the government and have been relatively low for a considerable period of time compared with prices in other developed countries. Accordingly, in the short run, financial development induced a decrease in electricity intensity in cases of mobile phones and Internet use as proxies for ICT. Meanwhile, population growth increased electricity intensity in all cases.
5. Policy Implications
In this study, we found that the growth in Internet and mobile phone use, commonly used proxies for ICT, induced an increase in electricity intensity in Korea. Therefore, to reduce electricity intensity, it is necessary to reduce electricity consumption through ICT. Energy diagnosis and conservation technologies that utilize ICT have not yet been widely implemented in Korea. Energy-saving companies using new ICT are emerging, but this is a phenomenon of recent years. In the future, it will be necessary to promote the diffusion of electricity-saving technologies using ICT. In particular, energy management system technologies such as FEMS (factory energy management system) and BEMS (building energy management system) should be more widely applied in manufacturing plants and public and private buildings. Korea’s electricity prices have remained low compared to those in other countries. Relative to those of its neighbor Japan, Korea’s electricity prices are around 50% lower. Therefore, it is necessary to establish an effective system for determining electricity prices based on fuel prices; this may incentivize consumers to save their electricity consumption.
A limitation of this study is that the results vary depending on the proxy used to measure ICT. Each ICT index represents the expansion of ICT and its influence in its own way. However, it is difficult to conclude that an increase in ICT exports alone can reflect the production capacity of the ICT hardware industry and the overall development of ICT technology. Similarly, it is difficult to discern whether the use of mobile phones directly represents a form of ICT. Although Internet use is a good indicator of ICT, it also has limitations as an ICT index. Therefore, future studies should consider other proxy variables that are representative of ICT.
Funding
This research was supported by the 2022 Hongik Research Fund.
Data Availability Statement
Data is contained within the article.
Conflicts of Interest
The author declares no conflicts of interest.
Appendix A
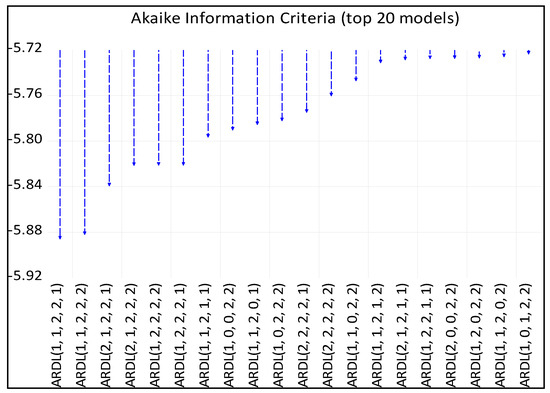
Figure A1.
Lag length criteria of Case 1.
Figure A1.
Lag length criteria of Case 1.
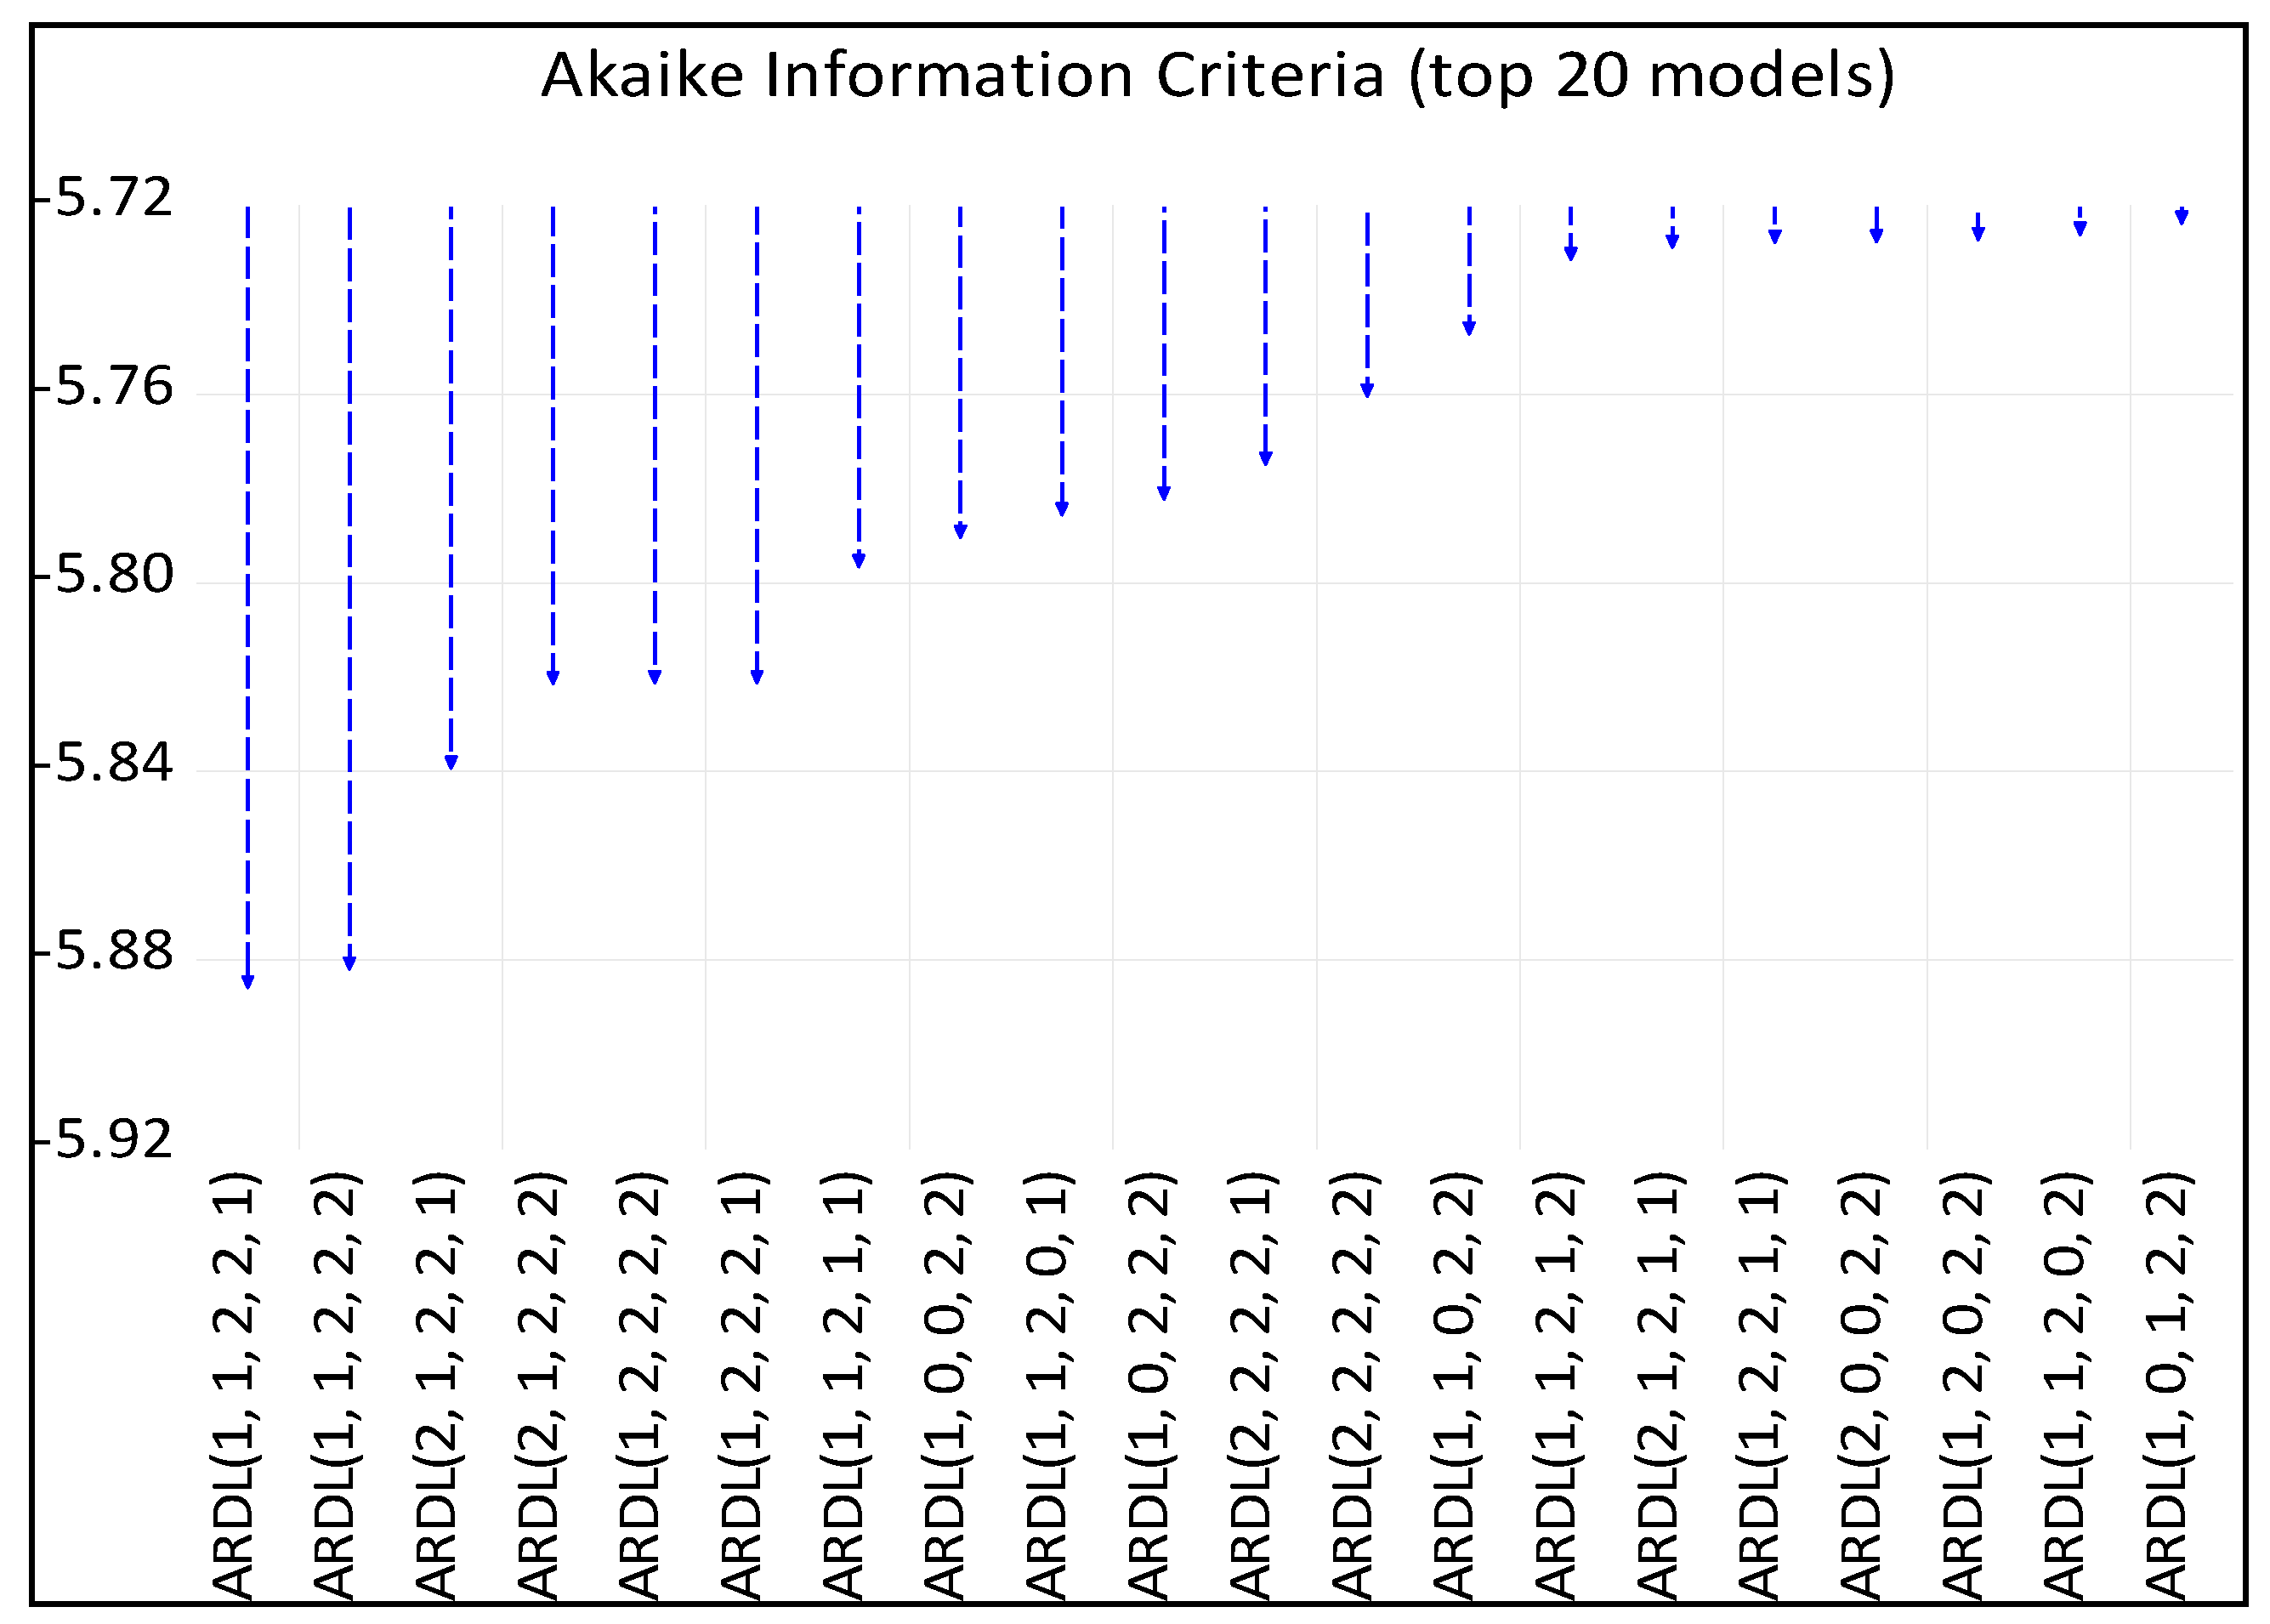
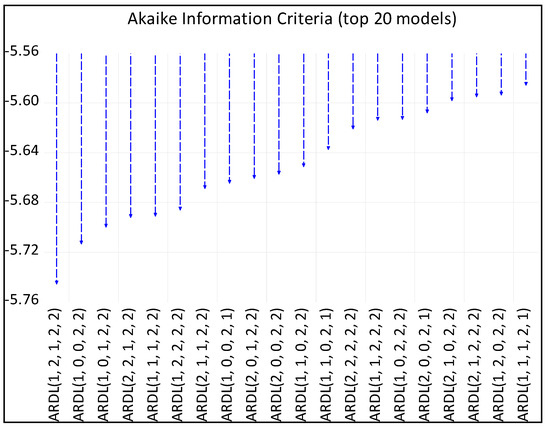
Figure A2.
Lag length criteria of Case 2.
Figure A2.
Lag length criteria of Case 2.
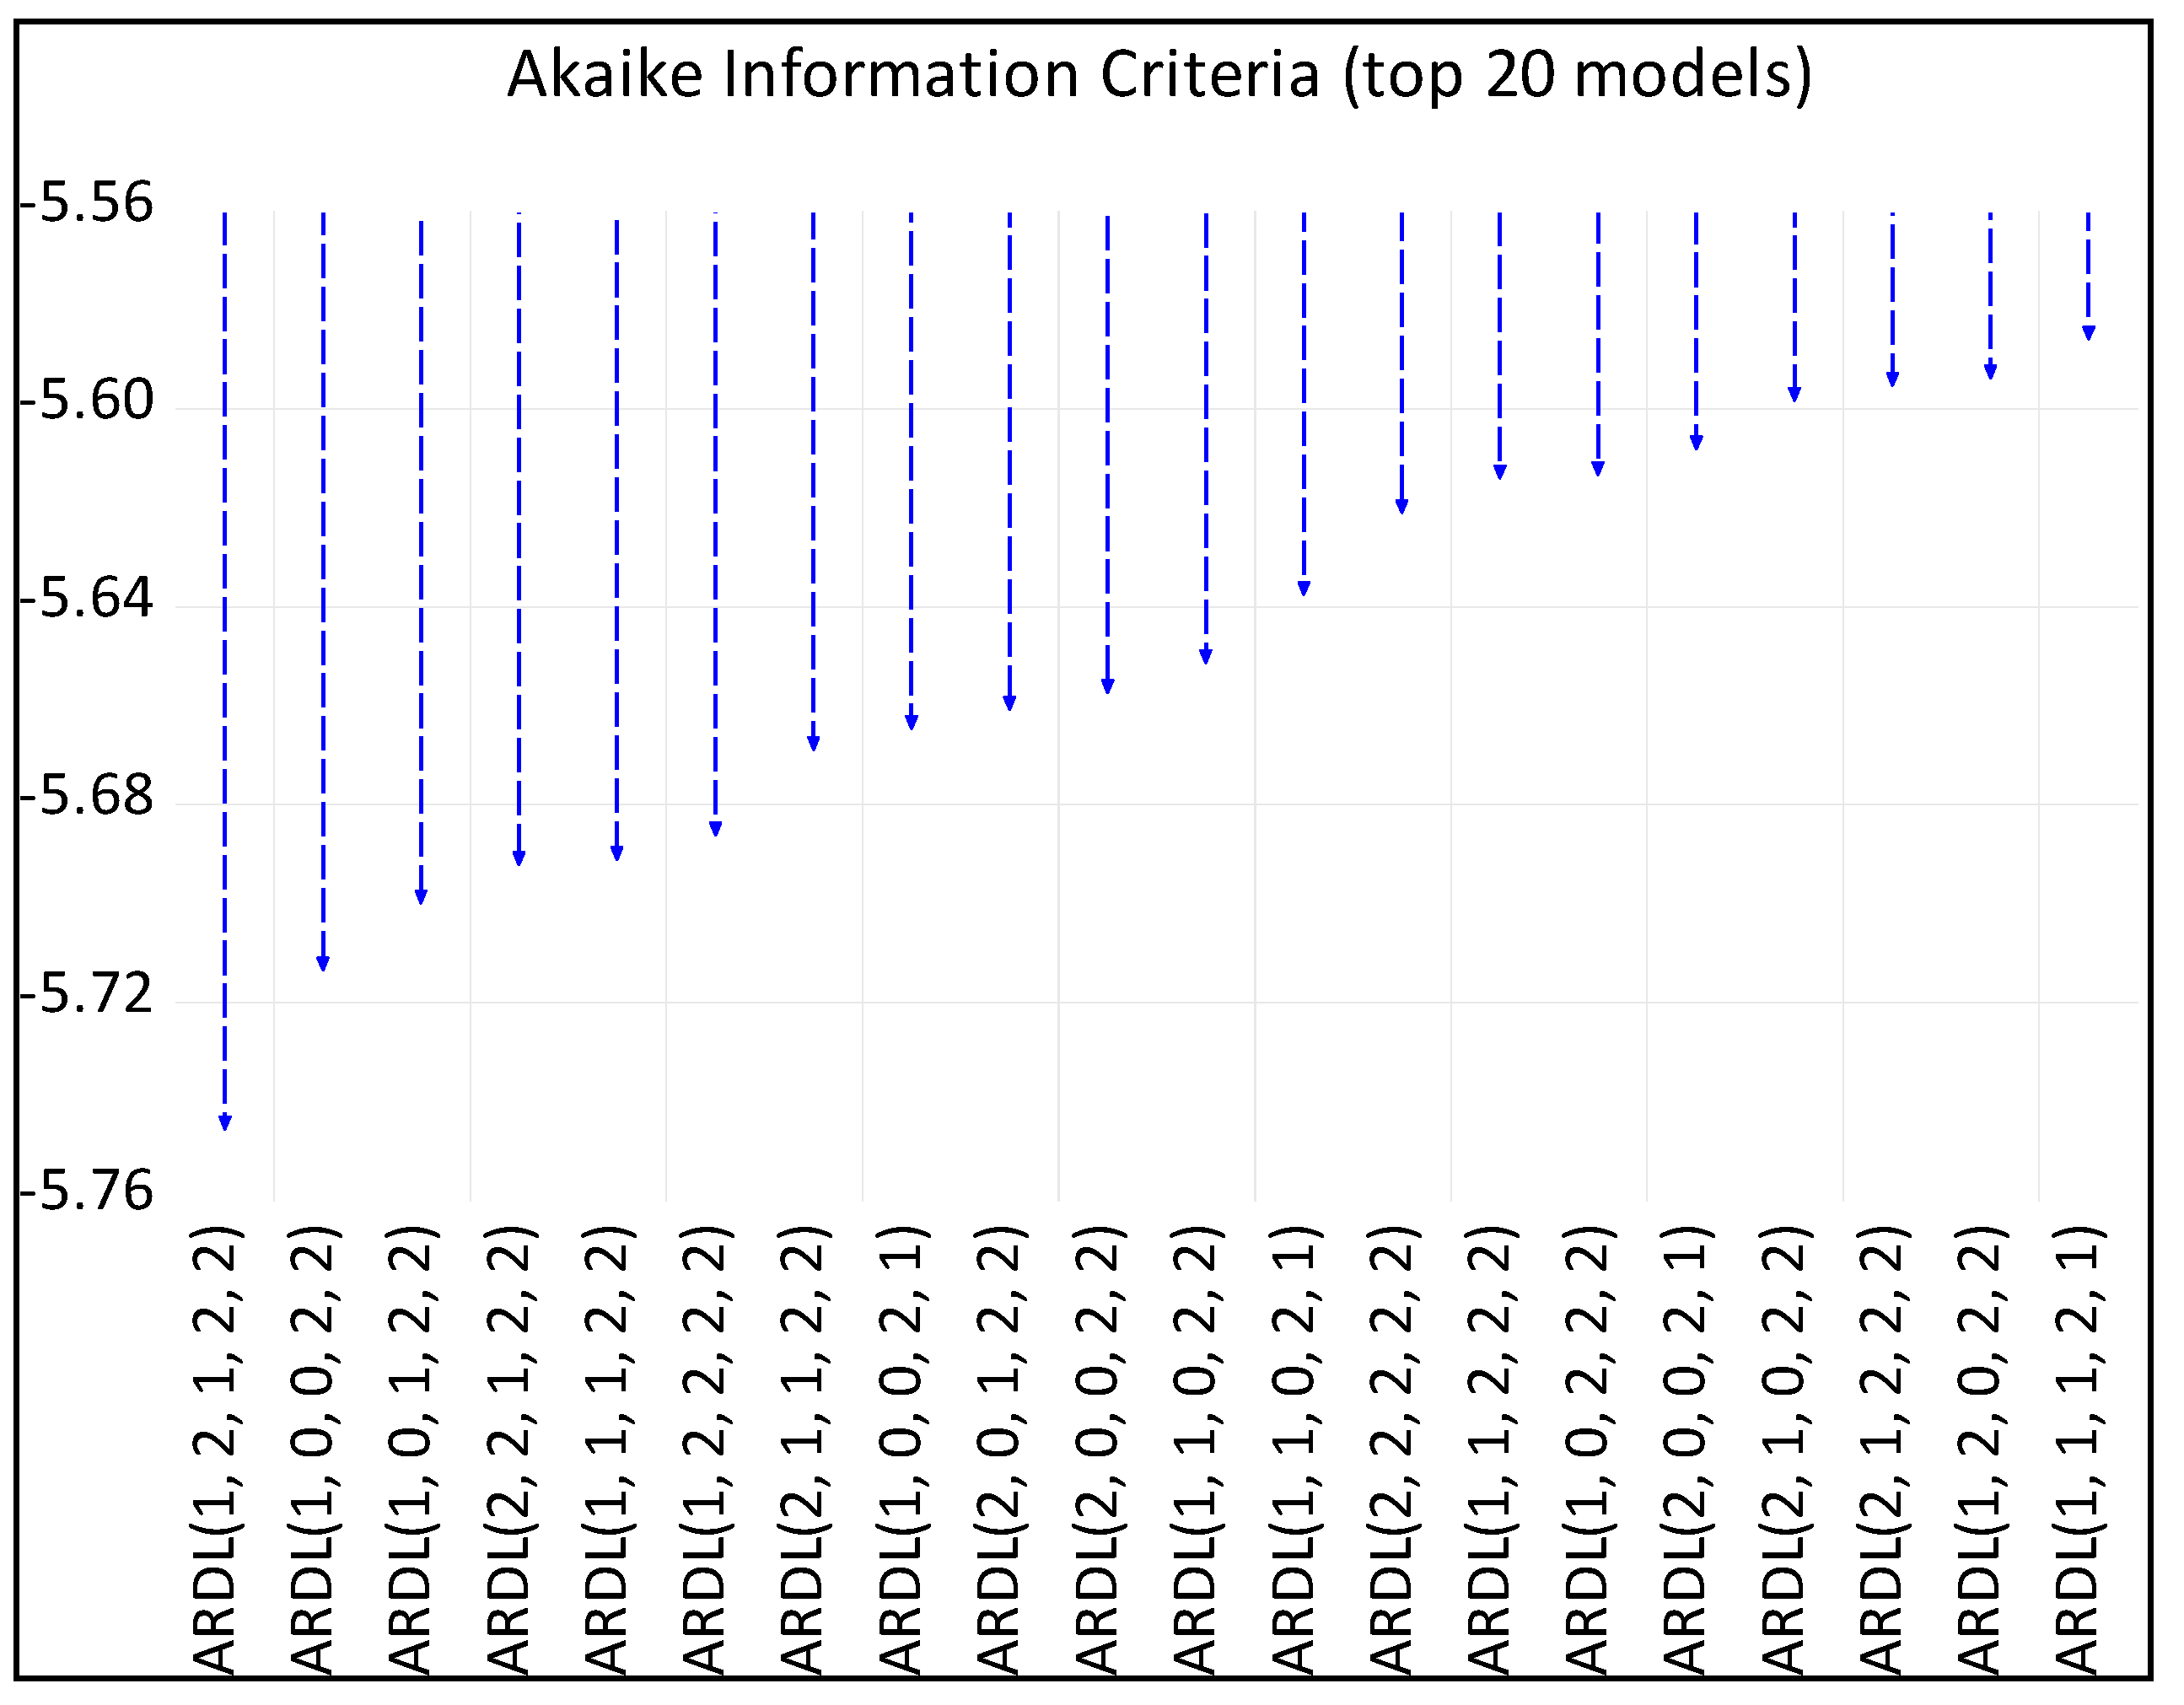
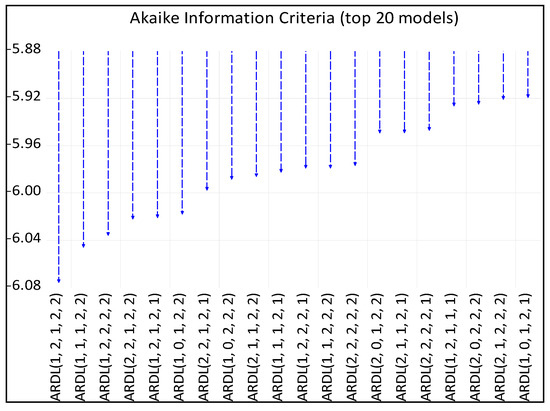
Figure A3.
Lag length criteria of Case 3.
Figure A3.
Lag length criteria of Case 3.
References
- Thirring, H. Energy for Man: Windmills to Nuclear Power; Indiana University Press: Bloomington, IN, USA, 1958. [Google Scholar]
- Walker, W. Information technology and the use of energy. Energy Policy 1985, 13, 458–476. [Google Scholar] [CrossRef]
- Walker, W. Information technology and energy supply. Energy Policy 1986, 14, 466–488. [Google Scholar] [CrossRef]
- World Bank World Development Indicators (WDI) Database. Available online: http://data.worldbank.org (accessed on 1 March 2022).
- Cardoso, A.; Camarasa Hernando, C.; Køien, G.M.; Wang, X.; Deschamps, S.; Data Centers. Digitalisation Powerhouse and Energy Efficiency Potential; DTU Library. 2020. Available online: https://backend.orbit.dtu.dk/ws/files/222047537/2020_10_IssueBrief_Datacenter_v2_EN_endors2.pdf (accessed on 1 March 2022).
- Bastida, L.; Cohen, J.J.; Kollmann, A.; Moya, A.; Reichl, J. Exploring the role of ICT on household behavioural energy efficiency to mitigate global warming. Renew. Sustain. Energy Rev. 2019, 103, 455–462. [Google Scholar] [CrossRef]
- Salahuddin, M.; Alam, K.; Ozturk, I. The effects of Internet usage and economic growth on CO2 emissions in OECD countries: A panel investigation. Renew. Sustain. Energy Rev. 2016, 62, 1226–1235. [Google Scholar] [CrossRef]
- Magazzino, C.; Porrini, D.; Fusco, G.; Schneider, N. Investigating the link among ICT, electricity consumption, air pollution, and economic growth in EU countries. Energy Sources B 2021, 16, 976–998. [Google Scholar] [CrossRef]
- Sadorsky, P. Information communication technology and electricity consumption in emerging economies. Energy Policy 2012, 48, 130–136. [Google Scholar] [CrossRef]
- Afzel, M.N.I.; Gow, J. Electricity consumption and information and communication technology in the next eleven emerging economies. Int. J. Energy Econ. Policy 2016, 6, 381–388. [Google Scholar]
- Saidi, K.; Toumi, H.; Zaidi, S. Impact of information communication technology and economic growth on the electricity consumption: Empirical evidence from 67 countries. J. Knowl. Econ. 2017, 8, 789–803. [Google Scholar] [CrossRef]
- Saidi, K.; Mbarek, M.B.; Amamri, M. Causal dynamics between energy consumption, ICT, FDI, and economic growth: Case study of 13 MENA countries. J. Knowl. Econ. 2018, 9, 228–238. [Google Scholar] [CrossRef]
- Zhao, S.; Hafeez, M.; Faisal, C.M.N. Does ICT diffusion lead to energy efficiency and environmental sustainability in emerging Asian economies? Environ. Sci. Pollut. Res. Int. 2022, 29, 12198–12207. [Google Scholar] [CrossRef] [PubMed]
- Collard, F.; Fe`veb, P.; Portierc, F. Electricity consumption and ICT in the French service sector. Energy Econ. 2005, 27, 541–550. [Google Scholar] [CrossRef]
- Ishida, H. The effect of ICT development on economic growth and energy consumption in Japan. Telemat. Inform. 2015, 32, 79–88. [Google Scholar] [CrossRef]
- Shahbaz, M.; Rehman, I.; Sbia, R.; Hamdi, H.S. The Role of Information Communication Technology and Economic Growth in Recent Electricity Demand: Fresh Evidence from Combine Cointegration Approach in UAE. J. Knowl. Econ. 2016, 7, 797–818. [Google Scholar] [CrossRef]
- Solarin, S.A.; Shahbaz, M.; Khan, H.N.; Razali, R.B. ICT, financial development, economic growth and electricity consumption: New evidence from Malaysia. Glob. Bus. Rev. 2021, 22, 941–962. [Google Scholar] [CrossRef]
- Pesaran, M.H.; Pesaran, B. Working with Microfit 4.0: Interactive Econometric Analysis; Oxford University Press: Oxford, UK, 1997. [Google Scholar]
- Pesaran, M.H.; Shin, Y. An autoregressive distributed lag modelling approach to cointegration analysis. In Econometrics and Economic Theory in the 20th Century: The Ragner Frisch Centennial Symposium; Strom, S., Holly, A., Diamond, P., Eds.; Cambridge University Press: Cambridge, UK, 1999; pp. 1–33. [Google Scholar]
- Pesaran, M.H.; Shin, Y.; Smith, R.J. Bounds testing approaches to the analysis of level relationships. J. Appl. Econ. 2001, 16, 289–326. [Google Scholar] [CrossRef]
- Engle, R.F.; Granger, C.W.J. Co-integration and error correction: Representation, estimation, and testing. Econometrica 1987, 55, 251–276. [Google Scholar] [CrossRef]
- Amri, F. Carbon dioxide emissions, total factor productivity, ICT, trade, financial development, and energy consumption: Testing environmental Kuznets curve hypothesis for Tunisia. Environ. Sci. Pollut. Res. Int. 2018, 25, 33691–33701. [Google Scholar] [CrossRef] [PubMed]
- Korea Energy Economics Institute (KEEI). KESIS Database. Available online: https://www.kesis.net/main/main.jsp (accessed on 1 March 2022).
- Statistics Korea. (KOSTAT). Korean Statistical Information Service (KOSIS). Available online: https://kosis.kr/index/index.do (accessed on 1 March 2022).
- Dickey, D.A.; Fuller, W.A. Distribution of the estimators for autoregressive time series with a unit root. J. Am. Stat. Assoc. 1979, 74, 427–431. [Google Scholar]
- Narayan, P.K. The saving and investment nexus for China: Evidence from cointegration tests. Appl. Econ. 2005, 37, 1979–1990. [Google Scholar] [CrossRef]
- Bahmani-Oskooee, M.; Nasir, A.B.M. ARDL approach to test the productivity bias hypothesis. Rev. Dev. Econ. 2004, 8, 483–488. [Google Scholar] [CrossRef]
Disclaimer/Publisher’s Note: The statements, opinions and data contained in all publications are solely those of the individual author(s) and contributor(s) and not of MDPI and/or the editor(s). MDPI and/or the editor(s) disclaim responsibility for any injury to people or property resulting from any ideas, methods, instructions or products referred to in the content. |
© 2024 by the author. Licensee MDPI, Basel, Switzerland. This article is an open access article distributed under the terms and conditions of the Creative Commons Attribution (CC BY) license (https://creativecommons.org/licenses/by/4.0/).