Article

Integrated Efficiency of Japan’s 47 Prefectures Incorporating Sustainability Factors

School of Environment and Society, Tokyo Institute of Technology, Tokyo 108-0023, Japan
*
Author to whom correspondence should be addressed.
Energies 2024, 17(8), 1910; https://doi.org/10.3390/en17081910
Submission received: 25 February 2024 / Revised: 14 April 2024 / Accepted: 15 April 2024 / Published: 17 April 2024
(This article belongs to the Special Issue New Trends in Energy, Climate and Environmental Research)

Abstract

:
The purpose of this study is to examine a productive efficiency index that incorporates two new production factors of sustainability—an environmental variable as an undesirable output and a well-being indicator as a desirable output—for 12 years of data from 2007 to 2018 pertaining to 47 prefectures in Japan. This study proposes a combination of a new data envelopment analysis (DEA) intermediate approach with the DEA super-efficiency model to measure the integrated productive efficiency. The approach incorporates CO2 emissions and a well-being indicator into the conventional productivity index. A three-stage analysis is conducted by sequentially adding new factors, CO2 emissions, and a well-being indicator. We also conduct a club convergence analysis of the productive efficiency and observe how clubs are formed, what their characteristics are, and how the efficiency changes over time. Through these approaches, we examine the practicality of the new efficiency measure and discuss regional policy implications. We found that higher labor productivity and carbon productivity in major industries caused increased productive efficiency. Adding sustainability factors to the conventional production factors in efficiency measurement widened the efficiency gap among prefectures.

1. Introduction

Measuring regional productivity and its changes over time is vital when discussing regional economies and related policies. Productivity indices have been measured using labor, capital, energy, and materials as inputs and gross domestic product (GDP) and gross regional product (GRP) as outputs [1]. However, such productivity indices fail to capture the impact of production activities on the environment and their contribution to people’s well-being.
In 1992, the United Nations General Assembly adopted the United Nations Framework Convention on Climate Change (UNFCCC), laying the foundation for international efforts to prevent global warming. The third Conference of the Parties (COP) of the UNFCCC adopted the Kyoto Protocol in 1997, which set greenhouse gas (GHG) reduction targets for developed countries. In 2015, the United Nations (UN) adopted the 2030 Agenda for Sustainable Development to Transform Our World, which proposed the Sustainable Development Goals (SDGs). In the same year, the Paris Agreement was adopted at the 21st COP and enacted the following year. Former Japanese Prime Minister Yoshihide Suga announced in 2020 that Japan would aim to become carbon neutral by 2050, and discussions continue on how to achieve reduction goals for GHG, such as CO2. In response, a regional decarbonization roadmap was presented in 2021, which included the goal of creating at least 100 “decarbonized regions” by the fiscal year 2030 [2], thereby increasing the importance of environmental initiatives at the prefectural and other local government levels.
The report of the Commission on the Measurement of Economic Performance and Social Progress released in September 2009 [3] addressed the limitations of GDP as an indicator of economic performance, the importance of subjective and objective indicators of well-being and sustainability, and of the future direction of these indicators. In 2011, the Organisation for Economic Co-operation and Development (OECD) released the “Better Life Index”. The index covers OECD member countries and major OECD partner countries and measures well-being in 11 items that reflect the material living conditions and quality of life that the OECD identifies as essential for well-being. The United Nations Sustainable Development Solutions Network published the Global Well-being Indicator in 2012, and the United Nations Environment Programme published the Inclusive Wealth Index in 2012. In Japan, based on the Framework Policy 2018, initiatives focusing on well-being (visualization of qualitative and subjective satisfaction, surveys for policy management, consideration of indicators, etc.) are promoted mainly by the Cabinet Office.
The purpose of this study is to examine a productive efficiency index that incorporates two new production factors of sustainability—an environmental variable as an undesirable output and a well-being indicator as a desirable output—for 12 years of data from 2007 to 2018 pertaining to 47 prefectures in Japan. We propose a new type of data envelopment analysis (DEA) method that combines a DEA intermediate approach with the DEA super-efficiency model. Furthermore, we conduct club convergence analysis using the obtained productive efficiency values. From the results of these analyses, we discuss regional economic policy implications.
Furthermore, examining the club convergence of regional productivity can enhance regional policy discussions. The concept of club convergence assumes that not all regions converge to a single steady state but rather converge to several different steady states (clubs). Based on this assumption, it is possible to examine convergence on a club-by-club basis and develop detailed policy discussions observing the characteristics of each club.
The novelty of this study is that it proposes a new comprehensive productive efficiency index that sequentially incorporates CO2 emissions as an environmental factor. It also proposes an integrated well-being indicator that refers to the Comprehensive Subjective Satisfaction level created by the Cabinet Office into a DEA intermediate approach combined with the DEA super-efficiency model. The DEA intermediate approach holds desirable features of both radial and non-radial DEA models. Then, we perform a convergence analysis of productive efficiency scores covering recent years that are extended from previous studies. We investigate the practical use of the proposed comprehensive productive efficiency that incorporates undesirable output and a well-being indicator. The novelty of our study is not in proposing new mathematical models and delving into the underpinning theory, but rather in establishing an integrated well-being indicator and applying it to Japan’s regional economies. Using the new model, this study measured the efficiency for each prefecture and the changes in efficiency values due to the addition of new factors. Subsequently, this study conducts a club convergence analysis for the efficiency values and examines changes in the results before and after the addition of new elements. Based on these results, this study discusses regional policy implications for Japan’s 47 prefectures from 2007 to 2018, and captures the latest trends not observed in previous studies.
The remainder of this paper is organized as follows. Section 2 reviews prior literature. Section 3 describes the analytical methods (DEA and club convergence analysis) and data used. Section 4 summarizes the results and discusses the policy implications. Section 5 concludes and considers future research directions.

2. Literature Review

We summarize the literature on measuring productivity and verifying the convergence of prefectures in Japan. In particular, we focus on DEA or DEA-based studies for the former (productivity), while, for the latter (convergence), we do not limit the methodology. The reason for focusing on the DEA approach is that it has been applied to a wide range of productivity and sustainability assessments for countries, cities, industrial sectors, companies, and facilities ([4,5]). See also [6] for comprehensive reviews of research in this aspect.
First, regarding the productivity measurement, ref. [7] compared the Luenberger productivity index and the Malmquist productivity index and showed that the former is superior in capturing productivity growth in a competitive environment, such as that in Japan. The study also highlighted the importance of choosing the right method for measuring productivity in a regional economy. Ref. [8] measured prefectural productivity from 1981 to 2000 using the Hicks–Moorsteen–Bjurek productivity index that was proposed by the study. They identified technological change and efficiency change as important factors driving cyclical fluctuations in productivity, and that these factors are supply shocks and demand shocks, respectively. Ref. [9] measured the productivity changes in prefectures from 1991 to 2002 using the Luenberger productivity index accounting for CO2 emissions. The results showed that the operating rate, share of energy-intensive industries, and social capital had significant impacts on productivity. Ref. [10] measured the productivity of prefectures from 2006 to 2009 using dynamic network DEA. The results showed that population density, agglomeration economies, and a lower share of the manufacturing sector positively affect productive efficiency. Ref. [11] measured the productivity of 47 Japanese prefectures from 2001 to 2014, including the effect of CO2 and a well-being indicator, using a two-stage network DEA model. The results showed that the average prefecture could reduce CO2 emissions by 15% while increasing the well-being of its citizens, and that 28% of the prefectures had a 2.6% surplus labor force. Ref. [12] examined the productivity growth and its four components for Japanese regional economies applying the Hicks–Moorsteen–Bjurek productivity growth index proposed by [8] to 47 prefectures for the period 1995–2012. The results provided two policy recommendations for Japan’s new economic growth strategy, which are associated with government support for the diffusion of advanced technology over regions and the creation and development of unique innovation by regional industries. Ref. [13] computed the regional total-factor energy efficiency in Japan for 47 prefectures over the period 1993–2003 employing DEA. They delved into energy efficiency and found a U-shaped relation similar to the environmental Kuznets curve between energy efficiency and per capita income.
Second, regarding the inter-regional convergence of productivity in Japan, ref. [14] used a cross-sectional analysis to show inter-regional convergence in labor productivity and personal income in Japan from 1930 to 1990. Meanwhile, ref. [15] re-examined the convergence of GDP per capita from 1955 to 1991 using a different approach to that of [14]. The results showed no convergence across the 47 prefectures, or even within a divisional region. Ref. [16] examined the convergence of labor productivity from 1985 to 1997 using the Markov transition matrix. The results showed that there was no convergence of labor productivity at the national level and that the productivity distribution was polarized in industries with relatively high labor productivity. Further, ref. [16] measured Törnqvist-type total factor productivity (TFP) using data from 1980 to 2010. The results showed that TFP has continuously increased and converged in the direction of narrowing regional disparities, and that the TFP has converged to a level specific to each region rather than to the national level. Ref. [12] also examined whether the regional convergence of productivity changes and their components occurred during the period of the study from 1992 to 2012 using a method that explicitly incorporates inefficiency. According to their study, the regional disparities have widened during the period between the highest and the lowest. Thus, their results were consistent with those of [15,16], but inconsistent with those of [14,17].
In research outside Japan, since the convergence in economic performance or environmental performance is a popular research topic, many researchers have examined the convergence using different methodologies, such as [18,19]. Ref. [20] used the DEA intermediate approach to assess productive efficiency and evaluated the sustainable development of 121 countries from 1990 to 2014. They calculated and ranked each country’s score by prioritizing either economic or environmental criteria. The results showed that developed countries significantly outperformed developing countries in prioritizing environmental criteria. The obtained productive efficiency values were also used to perform club convergence analysis to identify clubs and the importance of country-specific climate change measures. They also addressed that there is strong evidence of club convergence regardless of the models employed.

3. Methodology and Data

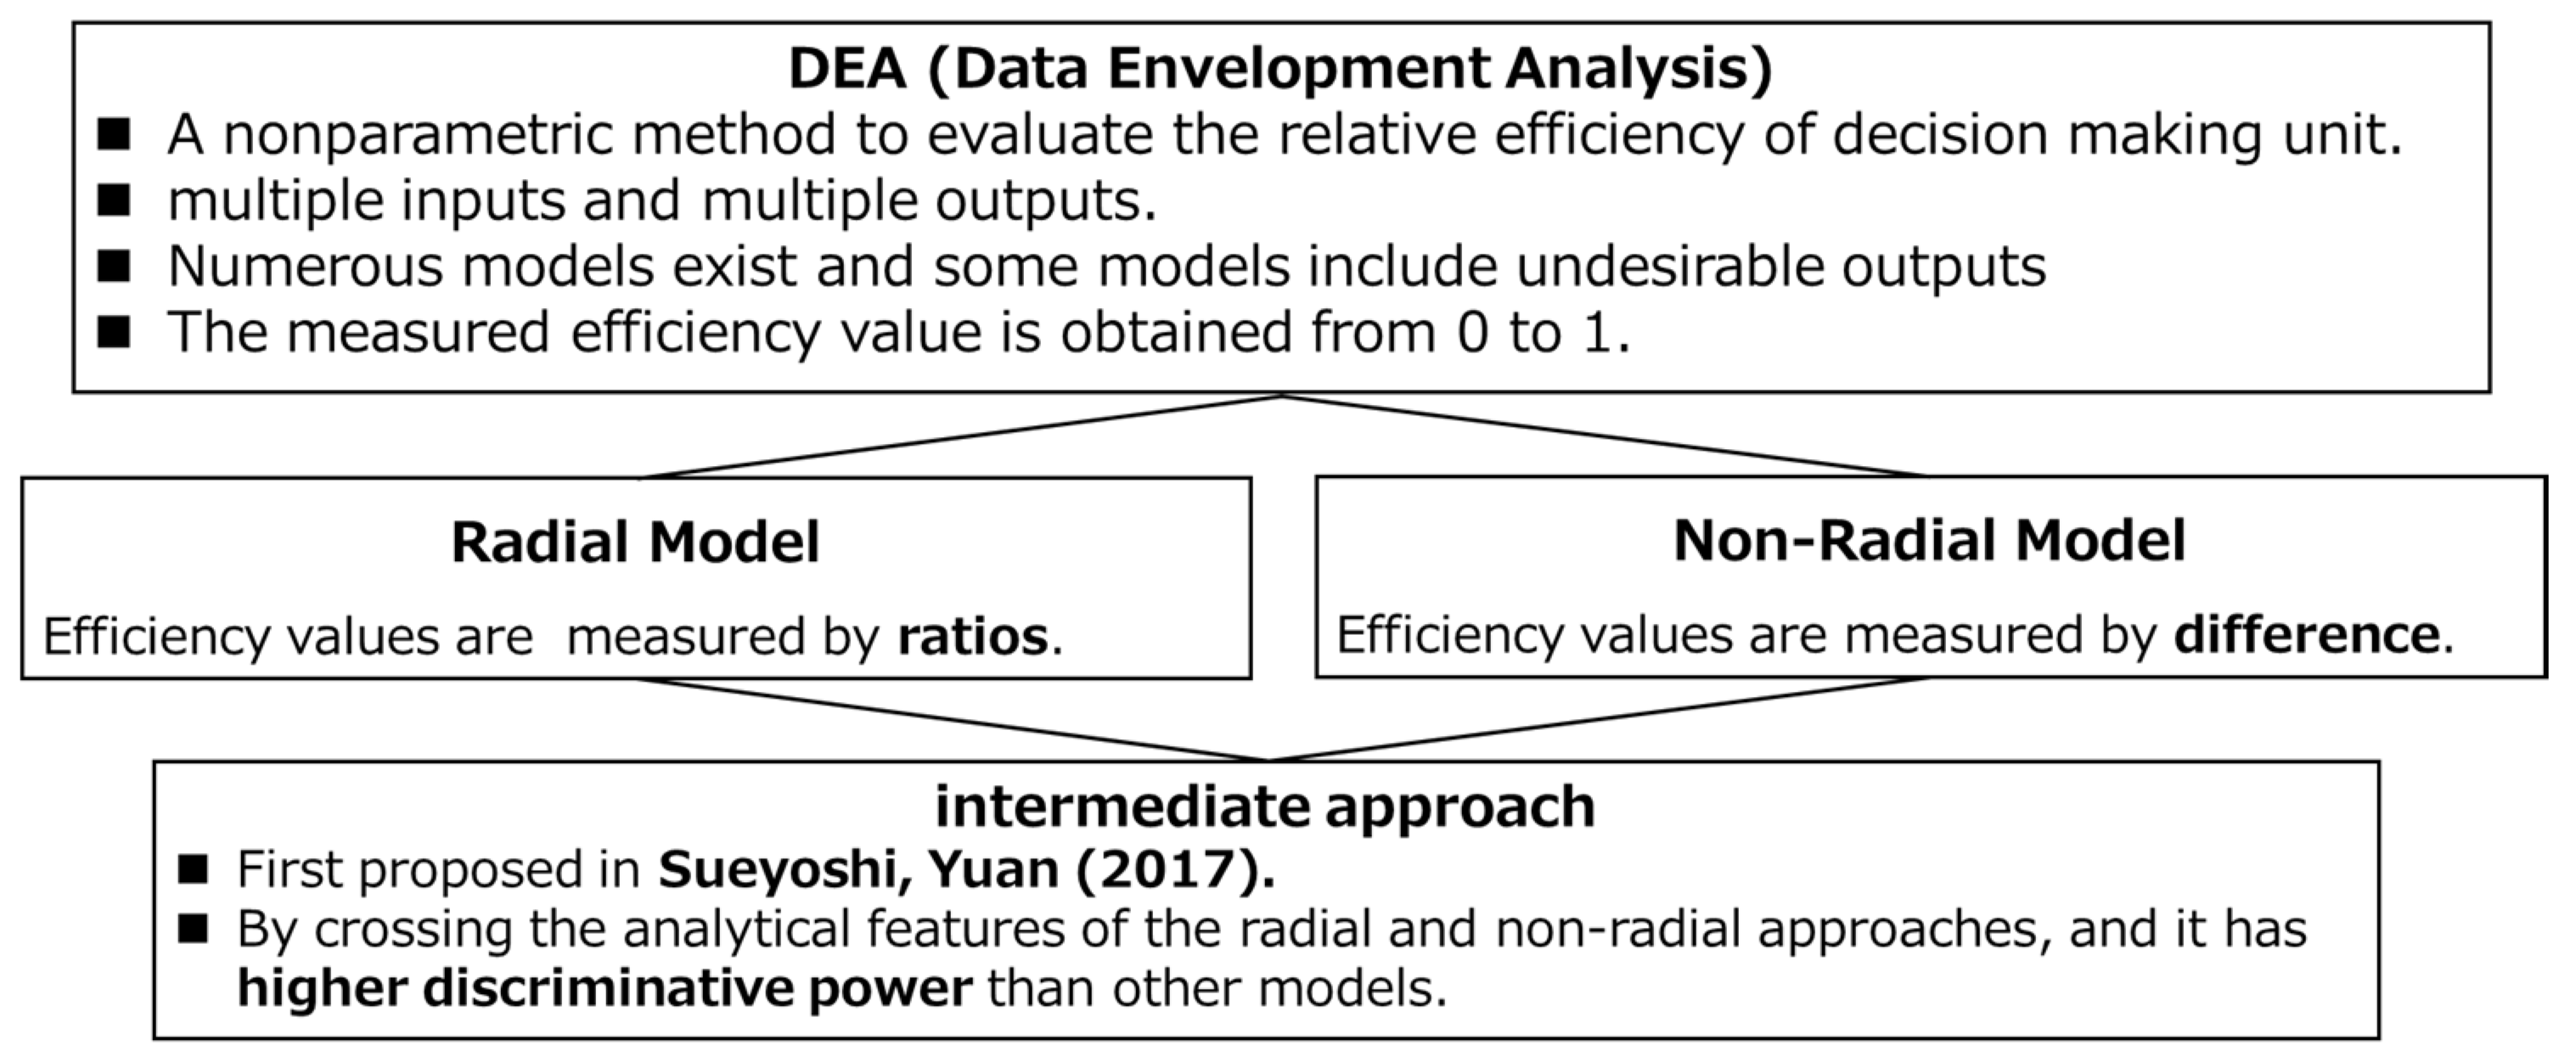
3.1. Data Envelopment Analysis

We apply the DEA intermediate approach to a dataset spanning from 2007 to 2018 for 47 prefectures in Japan. DEA is a non-parametric analytical method used to evaluate the relative efficiency of decision-making units (DMUs), which are the prefectures in this study. It has been applied by many researchers from theoretical and empirical research perspectives. DEA evaluates the efficiency level of each DMU using the efficiency frontier formed by the efficient DMUs as a benchmark. First, we describe the basic formulation.

3.1.1. CCR and BCC Models

We consider the problem of measuring the efficiency value of D M U j   j = 1 , n based on m inputs X R m × n and s outputs Y R s × n . Using the Charnes–Cooper-Rhodes (CCR) model, the most basic model of DEA proposed by [21], the problem can be formulated in Model (1) as follows:
min θ j                                                             s . t . θ j x j X λ j d x = 0 , Y λ j d y = y r j ,                           λ j 0 ,   d x 0 ,   d y 0 ,
where λ j R n is the vector of weight variable for each DMU, d x R m is the slack variable for the inputs, d y R s is the output slack variable, and θ j R is the variable representing the efficiency value of the j th DMU ranging between 0 and 1. Solving the problem provides the optimal values ( θ j * , λ j * , d x * , d y * ) . D M U j is evaluated as efficient when the result is θ j * = 1 , d x * = 0 , and d y * = 0 , and, if not, D M U j is inefficient. The smaller the value, the greater the inefficiency.
The Banker–Charnes–Cooper (BCC) model proposed by [22] adds the following constraint to the CCR model:
j = 1 n λ j = 1 .
The inclusion of this equation results in the DEA’s variable returns to scale (VRS) technology model. This model differs from the CCR model, which assumes a constant return to scale (CRS) production technology.
A model that incorporates inputs and outputs, as well as undesirable outputs, in the production process was first proposed by [23]. Traditionally, undesirable outputs have been addressed by ignoring them in the first place, treating them as inputs; however, these treatments do not correctly reflect the production process. Ref. [23] introduced the directional distance function proposed by [24] and incorporated undesirable outputs directly into the model. If X and Y have the same conditions as in Equation (1), and there are h undesirable outputs B R h × n , the equation becomes Model (3).
max β j                                               s . t . X λ j x i j 0 ,   Y λ j + β j y r j 0 , B λ j β j b h j = 0 , j = 1 n λ j = 1 .
Model (3) employs VRS technology, and the formula is output-oriented, aiming to maximize desirable outputs and minimize undesirable outputs while maintaining a given level of input.

3.1.2. Intermediate Approach

A DEA intermediate approach, which combines the analytical features of radial and non-radial models, was first proposed by [25]. Figure 1 presents the features of the intermediate approach. The model of [25] tries to find the inefficiency of each output element and take its average value. Subsequently, applied models have been considered, such as the model of [20], which considers one common inefficiency variable for all outputs, and the model of [26], which considers the inefficiencies of all inputs and outputs and determines their average values.
This study uses the model of [20]. The model uses a common inefficiency variable for desirable and undesirable outputs, which strengthens the constraints on a single variable. Compared with the model of [25], the differences between DMUs and changes when new elements are added are smaller, but the single inefficiency variable makes it applicable to the super-efficiency model and other models described below. Model (4) measures the efficiency value of D M U j with output-oriented VRS production technology.
max θ j = ξ j + ε n i = 1 m R i x d i x + r = 1 s R r g d r g + f = 1 h R f b d f b s . t . j J x i j λ j + d i x = x i k     i = 1 , , m , j J g r j λ j d r g ξ j g r k = g r k     r = 1 , , s , j J b f j λ j d f b + ξ j b f k = b f k     f = 1 , , h , j J λ j = 1 , ξ j 1   j = 1 , n , d i x 0   i = 1 , , m ,     d r g 0   r = 1 , , s , d f b 0   f = 1 , , h ,     λ j 0 , j = 1 n λ j = 1 , ρ j = 1 θ j , ξ j :   unrestricted .
In this model, the production factors are inputs x i   i = 1 , , m , desirable outputs g r   r = 1 , , s , and undesirable outputs b f   f = 1 , , h . Slack variables d i ,   d r ,   d f are obtained for all prefectures j   j = 1 , , 47 . λ j is a weight variable of each DMU. ξ j is a variable indicating inefficiency, and ξ j itself has no restriction, but in the process of transforming it into a linear problem, a restriction of less than or equal to 1 is added. ρ j is the productive efficiency variable calculated by subtracting the inefficiency variable θ j from 1 and is expressed in the range from 0 to 1. In addition, ε n ,   R i ,   R g ,   R f are used to adjust the data range and are defined as ε n = 0.001 ,     R i x = m + s + h 1 max j x i j m i n j x i j 1 ,   R r g = m + s + h 1 max j g r j m i n j g r j 1 ,   R f b = m + s + h 1 max j b f j m i n j b f j 1 .

3.1.3. Super-Efficiency Model
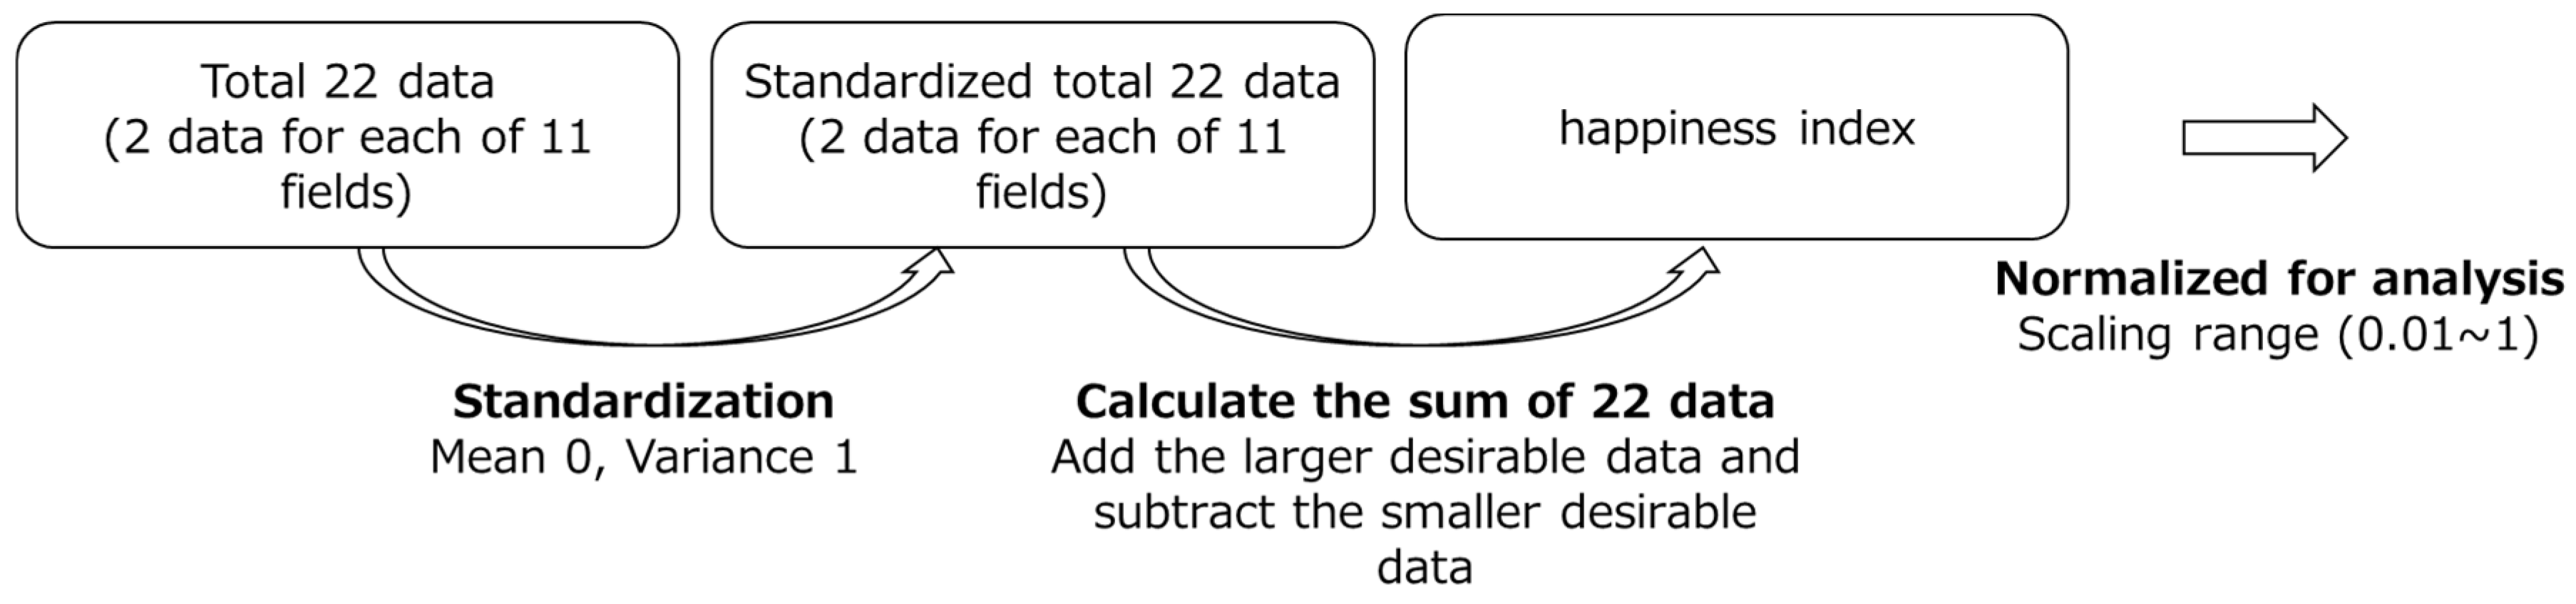
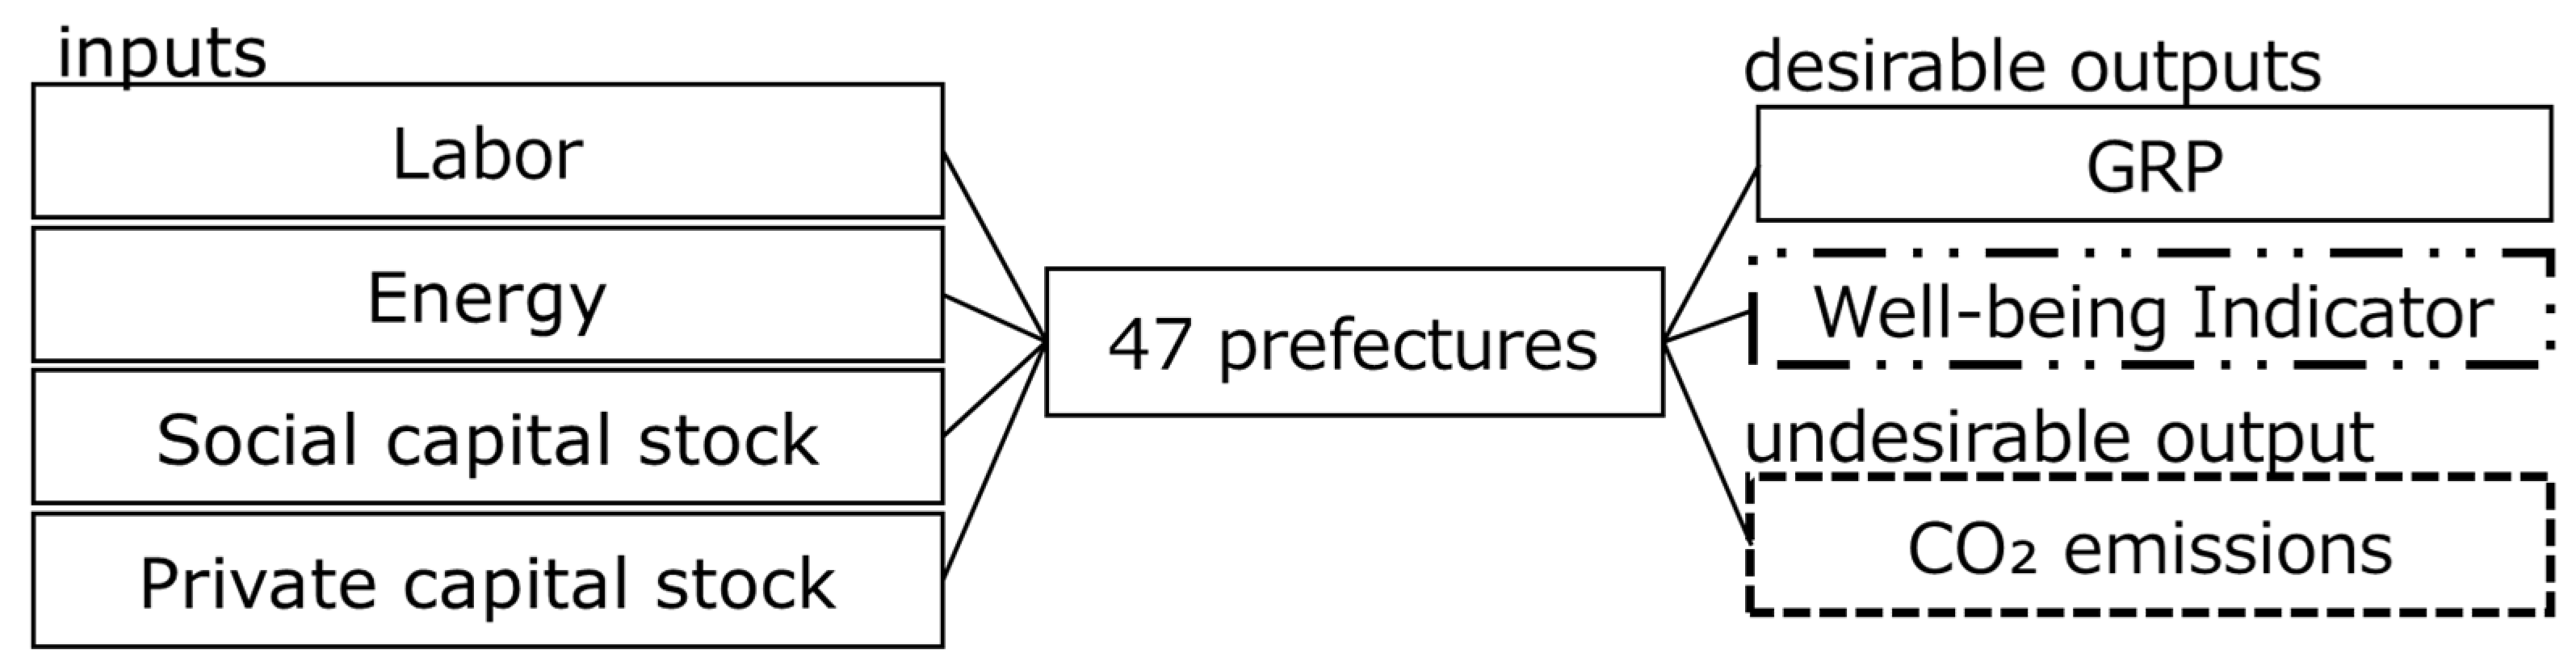
A problem often arises when multiple DMUs are evaluated as efficient in the DEA, making comparisons between efficient DMUs impossible. In the super-efficiency model proposed by [27], an efficient DMU is deleted from the reference set, the efficiency frontier is reconstructed, and the deleted DMU is re-evaluated using the new frontier as a benchmark. Ref. [28] proposed a new DEA model that applies super-efficiency to a slacks-based measure, and many researchers have used it for their empirical studies, including [29,30]. This calculation process of super-efficiency results in the efficiency value of the efficient DMU being greater than one, whereas the efficiency value of the inefficient DMU remains the same as that obtained in Model (4). This creates a difference in the efficiency values of efficient DMUs and allows them to be compared. Based on Model (4), Model (5) re-evaluates the second most efficient DMU.
max θ j = ξ j + ε n i = 1 m R i x d i x + r = 1 s R r g d r g + f = 1 h R f b d f b s . t . j J a x i j λ j + d i x = x i a     i = 1 , , m , j J a g r j λ j d r g ξ j g r a = g r a     r = 1 , , s , j J a b f j λ j d f b + ξ j b f a = b f a     f = 1 , , h , j J a λ j = 1 , ξ j 1   j = 1 , n , d i x 0   i = 1 , , m ,     d r g 0   r = 1 , , s , d f b 0   f = 1 , , h ,     λ j 0 , j = 1 n λ j = 1 , ρ = 1 θ , ξ j :   unrestricted .
In this study, three levels of analysis, Analyses A, B, and C, are conducted using Models (4) and (5). Analysis A is based on a conventional index, and the production factors enveloped by the solid line in Figure 2 are used as the analytical framework. In Analysis B, CO2 emissions are included as an undesirable output, and production factors in the solid and dashed lines in Figure 2 are used as the analysis framework. Analysis C includes well-being indicators as desirable outputs, and those listed in the solid, dashed, and double-dashed box outlined in Figure 2 are all used as the analysis framework.
Analysis A does not consider undesirable outputs, and thus, the third constraint equation and d f b 0   f = 1 , , h are removed from the objective function in Models (4) and (5). By contrast, the framework in Analysis C assumes that prefectural production activities generate economic benefits and well-being through capital, labor, and other inputs. CO2 is emitted as a secondary consequence of these activities. We assume VRS production technology for the three analyses. We used Matlab R2023a for computations.

3.2. Data

The data presented in Figure 2 are listed in Table 1. Labor, social capital stock, and GRP are obtained from the Cabinet Office website under “Number of Workers in the Prefecture”, “Capital Stock”, and “Gross Prefectural Product”. Energy data are obtained from the Agency for Natural Resources and Energy website under “Total Energy Consumption”, and CO2 emissions data are obtained from the Ministry of the Environment website. The R-JIP database is maintained by the Research Institute of Economy, Trade and Industry (RIETI), and includes data on “value added”, “capital”, and “labor” by prefecture and industry. Well-being indicators are constructed by the authors as described below.
When the DEA is used, each data point is normalized for computational convenience. For normalization, the scaling range was set from 0.01 to 1. This is because, in the DEA, when 0 is included in the inputs and outputs, infeasible solutions may occur in some cases.
We then describe the authors’ definition of the created well-being indicator. This study defines a well-being indicator based on the “comprehensive subjective satisfaction” indicator, for which the Cabinet Office published a tentative draft for the first time in 2018. The Cabinet Office created a set of indicators (dashboards) of satisfaction and quality of life for use in policy making.
In the tentative draft released in 2021, comprehensive subjective satisfaction consists of 33 data items (the 3rd column) categorized into 11 areas (the 2nd column), with 3 datasets in each area. However, collecting all the data employed for comprehensive subjective satisfaction on a prefecture-by-prefecture basis may be difficult. Some studies try to estimate preferences and social acceptance for a specific policy and a measure using a quantitative analysis method [31,32], while we try to create an integrated index of well-being following a specified formula to incorporate various aspects of well-being. Therefore, for the well-being indicator used in this study, we simplify comprehensive subjective satisfaction and select two datasets for each of the 11 areas, resulting in a total of 22 data items. The definition of comprehensive subjective satisfaction is given in Table 2. The data used in the well-being indicator of this study are given in Table 3, and the flow of the calculation method for the well-being indicator is depicted in Figure 3.
Table 3 summarizes the datasets for the well-being indicator for each of the 22 data items (the 2nd column). The reference factor for "comprehensive subjective satisfaction” (the 3rd column) indicates which of the 33 data items that make up comprehensive subjective satisfaction is referred to; “+/−” indicates whether each data item should be larger or smaller for better performance. Data items marked with a “+” (e.g., disposable income) should be larger. Otherwise, data items marked with “−” (e.g., unemployment rate) should be smaller.
Figure 3 provides a flowchart for creating the well-being indicator. Specifically, the 22 datasets consisting of two data points for each of the 11 fields are standardized such that each has a mean of 0 and a variance of 1. Next, we calculate the sum of the 22 standardized data points. In this process, we add larger desirable data points and subtract smaller desirable data points. The sum of the 22 data points is the well-being indicator; the larger the indicator, the more desirable it is for achieving higher well-being.
Looking at the data calculated from Table 4, the Hokuriku region, including Toyama, Fukui, and Ishikawa prefectures had larger values. By contrast, the Osaka, Okinawa, and Fukuoka prefectures had smaller values. This trend is consistent with that of the Happiness Ranking of All 47 Prefectures, which has been conducted every other year since 2012 by The Japan Research Institute, a general incorporated foundation.

3.3. Club Convergence Analysis

Club convergence refers to the convergence of the performance of multiple economic agents to multiple steady states, where each agent forms a club and converges. In this study, we use the models proposed in [33] to analyze the club convergence. The model is characterized by the identification of clubs considering the specificity of economic agents and growth paths. In addition, because it is a data-driven approach, it does not require any special assumptions regarding trend stationarity. In the following, we explain the algorithm of club convergence analysis using the productive efficiency value ρ j t * in period t   t = 1 , , T of prefecture j ( j = 1 , , n ) obtained by DEA.
The productive efficiency value ρ j t * can be expressed as the specific growth component b j t and the common growth component μ t as shown in Equation (6):
ρ j t * = b j t μ t .
By scaling ρ j t * by the average of the productive efficiency values as in Equation (7), the common growth component μ t can be removed:
h j t = ρ j t * n 1 j = 1 n ρ j t * = b j t n 1 j = 1 n b j t .
If convergence occurs, h j t   1 ,     a s   t     ,     a l l   j = 1 , , n and Equation (8) holds:
H t = n 1 j = 1 n h j t 1 2   0     a s   t     .
In addition, b j t for the semi-parametric specification, Phillips and Sul [32] use Equation (9):
b j t = b j + σ j log t t α η j t ,
where b j is a time-invariant fixed value; σ j is a constant with a value greater than zero; η j t is a probability distribution that follows a standard normal distribution but is independent for j and weakly dependent on t ; log t is a slowly varying increasing function; α is the convergence rate.
Using these factors, the null hypothesis H 0 that all economic agents converge is expressed as H 0 :   b j = 0   and   α > 0 . The alternative hypothesis H A   is expressed as H A   : b j 0   for   all   j ,   or   α < 0 . Under H 0 , different growth paths were allowed, including a temporary divergence.
This hypothesis can be tested using the log regression model presented in Equation (10):
log H 1 H t 2 log l o g t = c + β l o g t + u t ,   for   r T , r T + 1 , , T ,  
where H t = n 1 i = 1 n h j t 1 2 and c denote the intercept term, and u t denotes the error term; r indicates the fraction of samples that are removed when performing regression. Let us assume positive values of r = 0 ,   1 , where r T is the integer part of r T . Phillips and Sul [33] recommend that r = 0.3 . The null hypothesis of convergence was tested by using a one-sided t test. In this test, the inequality β > 0 is the criterion for convergence, especially in the case of t β < 1.65 , and it rejects the null hypothesis at the 5% level. The value of −1.65 is determined by convention. Convergence analysis for all prefectures was performed using Equation (10) for verification. If there was no overall convergence, clustering was performed using the following four steps.
Step 1: Sort the prefectures in descending order based on their productive efficiency values in the last year of the covered period.
Step 2: Form a core group of converging prefectures. Specifically, the core convergence group can be identified by running the log regression test of Equation (10) on the k   2 k n prefectures with the highest efficiency values obtained in Step 1; k is determined by finding the maximum value k * ( a r g max k t k   s . t . min t k > 1.65 ) .
Step 3: From the remaining n k * prefectures, test whether they converge to the same steady state as the core group in Step 2. Perform a log regression test of Equation (10), and if the obtained t-statistic is greater than −1.65, add it to the core group as is. The first convergence club is formed through this process.
Step 4: Repeat Steps 1–3 for the prefectures that are not classified into the core group and identify other clubs. Prefectures that do not find converging clubs as a result of repeated steps diverge.
The formation of a club implies that the unique growth components of the entities in that club converge at the same steady state. Therefore, the productive efficiency values of prefectures obtained by DEA do not directly imply convergence within clubs. This study uses the Convergence Clubs package in R provided by [34] to conduct the club convergence analysis.

4. Results and Discussion
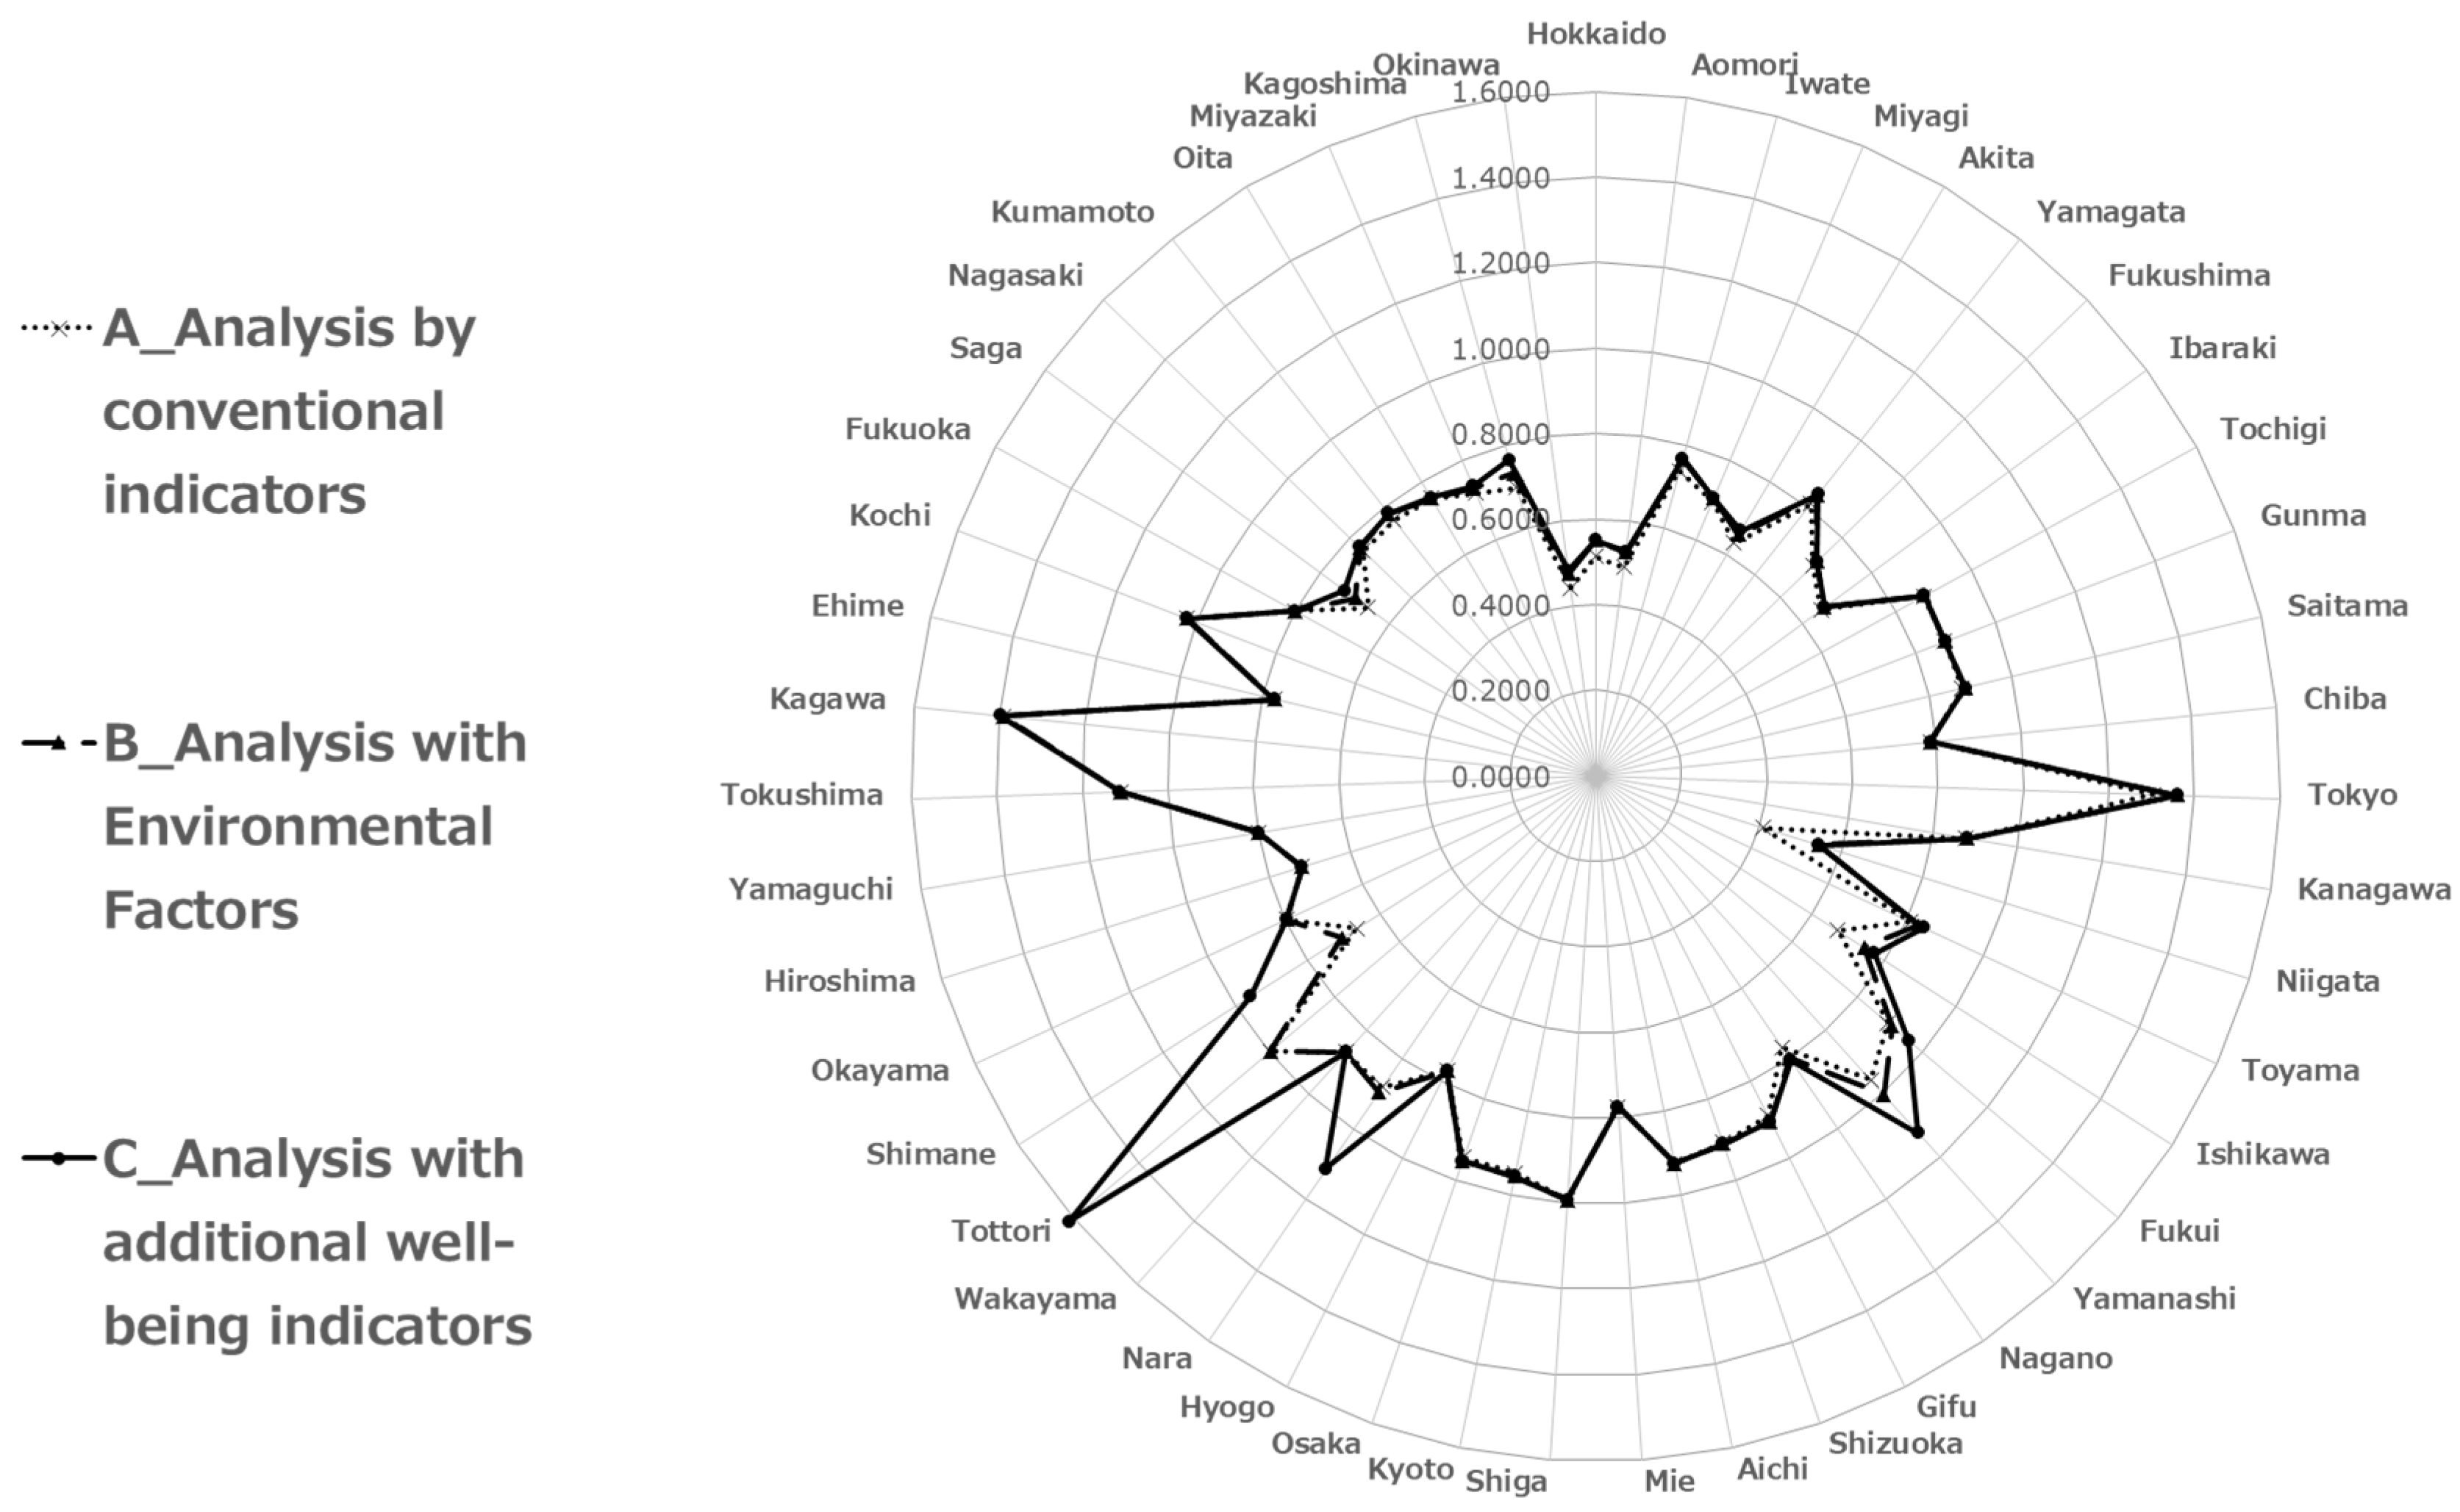
4.1. DEA Results

Figure 4 and Table 5 present the productive efficiency values for each prefecture in Analyses A, B, and C. For Analysis A, the top five prefectures in terms of the average efficiency values for the entire period using conventional factors are Tokyo, Kagawa, Tokushima, Kochi, and Shiga. Meanwhile, the bottom five prefectures are Okinawa, Aomori, Niigata, Hokkaido, and Akita.
In Analysis B, in which environmental factors are added to the conventional index, no significant changes are observed for each prefecture owing to the characteristics of the model. However, efficiency values and rankings were particularly improved in the Ishikawa, Yamanashi, Nagano, and Nara prefectures. These prefectures can be regarded as examples of prefectures with smaller environmental burdens in terms of production scale and improved evaluation compared with the conventional index. These results are consistent with [10,13], which have evaluated these prefectures as being energy efficient.
In Analysis C, the addition of environmental factors and well-being indicators to the conventional production factors changed the results from Analysis A. Prefectures with particularly improved efficiency values and rankings were Tottori, Shimane, Ishikawa, Toyama, and Fukui.

4.2. Discussion on DEA Results

Regarding the top five prefectures (Tokyo, Kagawa, Tokushima, Kochi, and Shiga) in Analysis A, Tokyo has a large-scale production, accounting for approximately 20% of Japan’s gross prefectural product. According to the Regional Economic Analysis System, most industries have higher labor productivity than the national average. In addition, the highly profitable financial and insurance industries are concentrated in Tokyo, which consumes less energy relative to its output. The high concentration of these industries in a small prefectural area is thought to be the reason for the high efficiency, as shown in Analysis A, which is consistent with [1,10].
Meanwhile, the Kagawa, Tokushima, and Kochi prefectures are small-scale prefectures in the Shikoku region. The Shikoku region is characterized on the industrial front by a large concentration of highly functional materials and many niche top firms with strong technological capabilities. The Kagawa and Tokushima prefectures have the advantage of high labor productivity in machinery- and electronics-related industries, resulting in a large gross prefectural product relative to inputs. In addition, these two prefectures have low social capital because of their small areas, resulting in low stock estimates. Therefore, their high evaluation can be attributed to higher labor productivity in key industries compared to the national average and smaller capital. The tendency for Shikoku to have relatively high productive efficiency is also observed in [1]. The low productive efficiency for prefectures with low manufacturing ratios is also consistent with a view of [1]. To maintain a high level of productivity in the future, it is valid to address issues of higher labor productivity by overcoming aging social capital while simultaneously fostering and maintaining growth in industries that have advantages compared with other regions and countries.
The Shiga prefecture is medium in terms of its production scale and has an industrial structure with a high percentage of secondary industries, particularly manufacturing. In addition, the prefecture’s location facilitates the export of products to the three major economic zones of Kinki, Chubu, and Hokuriku. Its well-developed road transportation infrastructure and railroad network enable it to ship a large number of industrial products. These factors contribute to the high gross prefectural product in relation to inputs, resulting in the high productive efficiency value in Analysis A. However, the evaluations in Analysis B, which includes environmental factors, and Analysis C, which includes a well-being indicator, indicate a slight downward trend, suggesting that environmental and well-being measures are required at a high level, especially in the manufacturing sector, which is the foundation of the prefecture’s industrial structure.
Meanwhile, the bottom five prefectures are Okinawa, Aomori, Niigata, Hokkaido, and Akita. The Okinawa prefecture is characterized by a small share of manufacturing in total industry sales and has few high-value-added industries. Furthermore, the employment environment is not as well developed as in other prefectures in Japan, suggesting the inefficient use of human capital. Other prefectures face the Sea of Japan, have a large amount of snowfall in winter, have large prefectural areas, and have a small share of manufacturing in total industry sales. The large size of the prefectures means that they have been required to invest more in the development of social capital. Thus, economic output and productivity relative to social capital stock tend to be low because economic activities are not necessarily conducted throughout the prefecture. In addition, as in the Okinawa prefecture, the small percentage of high-value-added manufacturing industries is a factor that lowers the prefecture’s gross prefectural product. Thus, one important factor for higher efficiency is the ratio of key industries with relatively high labor productivity. For example, labor productivity in Tokyo is higher than the national average in key industries and also in most industries; that in Kagawa and Tokushima is higher in the machinery industry among manufacturing industries.
The development of social capital is also important. The studies of [1,35], and others, suggested the economic effects of social capital development, and the Shiga prefecture is thought to receive these benefits. However, prefectures with large social capital are not necessarily economically efficient in their development. As an inference for the large social capital stock estimates for inefficient prefectures, ref. [9] pointed out that governments tend to focus on less productive areas when making public investment decisions, and thus social capital in less productive areas is relatively large. These prefectures need to use social capital effectively to gain economic benefit from it. On the other hand, they may be developed to enhance residents’ convenience and well-being, e.g., by ensuring connections among residents. Efforts to incorporate economic efficiency and well-being as factors in the indicator may help alleviate the negative evaluation of prefectures that hold a large-scale social capital.
For Analysis B, Ishikawa prefecture’s production structure is characterized by a specialization factor of more than twice the national average for machinery and electronic equipment-related industries, such as electronic components/devices and general, production, and industrial machinery. The machinery and electronic equipment-related industries are characterized by high value-added creation and low CO2 emissions per unit of production value among manufacturing industries. In other words, sectors with high carbon productivity are the center of the industry, and thus the carbon productivity of the Ishikawa prefecture as a whole is also high. That is a reason for the improvement in the evaluation.
The Yamanashi and Nagano prefectures have an industrial structure that specializes in machinery and electronics. As in the Ishikawa prefecture, the high value-added creation capacity and carbon productivity of the main industries are considered to have improved the evaluation. However, in the transportation sector, the Nagano prefecture is a relatively large CO2 emitter. CO2 emissions from private passenger cars are particularly large due to the high number of passenger cars in use and the high rate of passenger car use in daily life. Many other prefectures also face these issues and can reduce them through shifts to low-carbon vehicles such as EVs, trip length reduction measures, and the development of railroad networks in the future.
Nara prefecture’s main industries are wholesale and retail, medical care, welfare, and other services. There is a concentration of local industries in the manufacturing sector that emit relatively small amounts of CO2. These emissions from the transportation sector are low because the prefecture has a high rate of daily railroad use. The reduction in CO2 emissions in the consumer business and household sectors is large, so it assumes a high level of energy conservation awareness among companies and households.
From the above, it was found that prefectures with industries with high carbon productivity (e.g., machinery- and electronics-related industries) as their primary focus in the industrial sector improved their evaluation. However, because it is difficult to change the industrial structure quickly to increase productive efficiency, each prefecture is required to take measures to improve carbon productivity in its industries. In addition, the high dependence of rural areas on private passenger cars compared with urban areas with a high rate of rail use increases the CO2 emission ratio in the transportation sector and makes it difficult to increase the reduction rate. Measures to address this issue include road maintenance, expanding rail infrastructure, EV shift of private passenger cars, infrastructure development for supporting the EV shift, and the reduction in trip length through navigation optimization. Because the reduction rate in the transportation sector is not as high as that in other sectors throughout Japan, there is an opportunity for prefectures to adopt an advanced approach. In addition, the reduction rate in the household and consumer business sectors in recent years has been relatively high in some prefectures compared to other sectors, and this is an area where there are differences among prefectures. Promoting energy conservation in the private sector is an immediate reduction measure.
In Analysis C, the two prefectures of Tottori and Shimane in the San-in region share a common trend of having a good working environment as far as the well-being indicator is concerned. The Tottori prefecture has a high paid leave utilization rate and high female childcare leave utilization rate, whereas the Shimane prefecture has a high paid leave utilization rate, high male childcare leave utilization rate, and a low total unemployment rate. The paid leave utilization rate has remained high in both prefectures since the beginning of the period. With regard to the low unemployment rate, the Shimane prefecture has a higher ratio of effective job offers to job-seekers than the national average because of the labor shortage caused by the declining population, and the number of job openings exceeds the number of job-seekers. In addition, apart from ease of work, the number of persons killed in traffic accidents is low, and the average time devoted to volunteer work is high.
The three Hokuriku prefectures of Ishikawa, Toyama, and Fukui show some common trends in well-being data. The first is the high level of disposable income and savings in the household sector. One possible reason for this is the high percentage of women in the labor force. A large proportion of working women increases the ratio of dual earners in general households, which, in turn, raises household income. In addition, the low cost of renting land in a specific area lowers the share of housing costs in the household budget. These factors can explain why the household sector in the three Hokuriku prefectures tends to have a higher level of disposable income and savings than the rest of Japan. Furthermore, housing is large in the area, and the level of academic achievement of elementary and junior high school students is high.
A feature common to both the San-in and Hokuriku regions is the high level of elements related to “work” in both regions. The San-in region has strengths in work–life balance and ease of employment, while the Hokuriku region has strengths in ease of dual employment and relatively high salary levels. This trend can be attributed to the fact that “work” is a field that positively influences the other fields. For example, the ease of taking leave allows people to spend more time on hobbies and leisure activities, and caring for children and providing nursing care. Ease of working will lead to more time in the household budget and improve the quality of children’s education and the housing environment. Thus, it is desirable to pursue measures that improve one area that will affect other areas and lead to an across-the-board improvement in well-being. Therefore, focusing on measures to improve the well-being of work-related issues is one way to improve the productive efficiency of each prefecture. This effect can be maximized via the ripple effect on other issues.

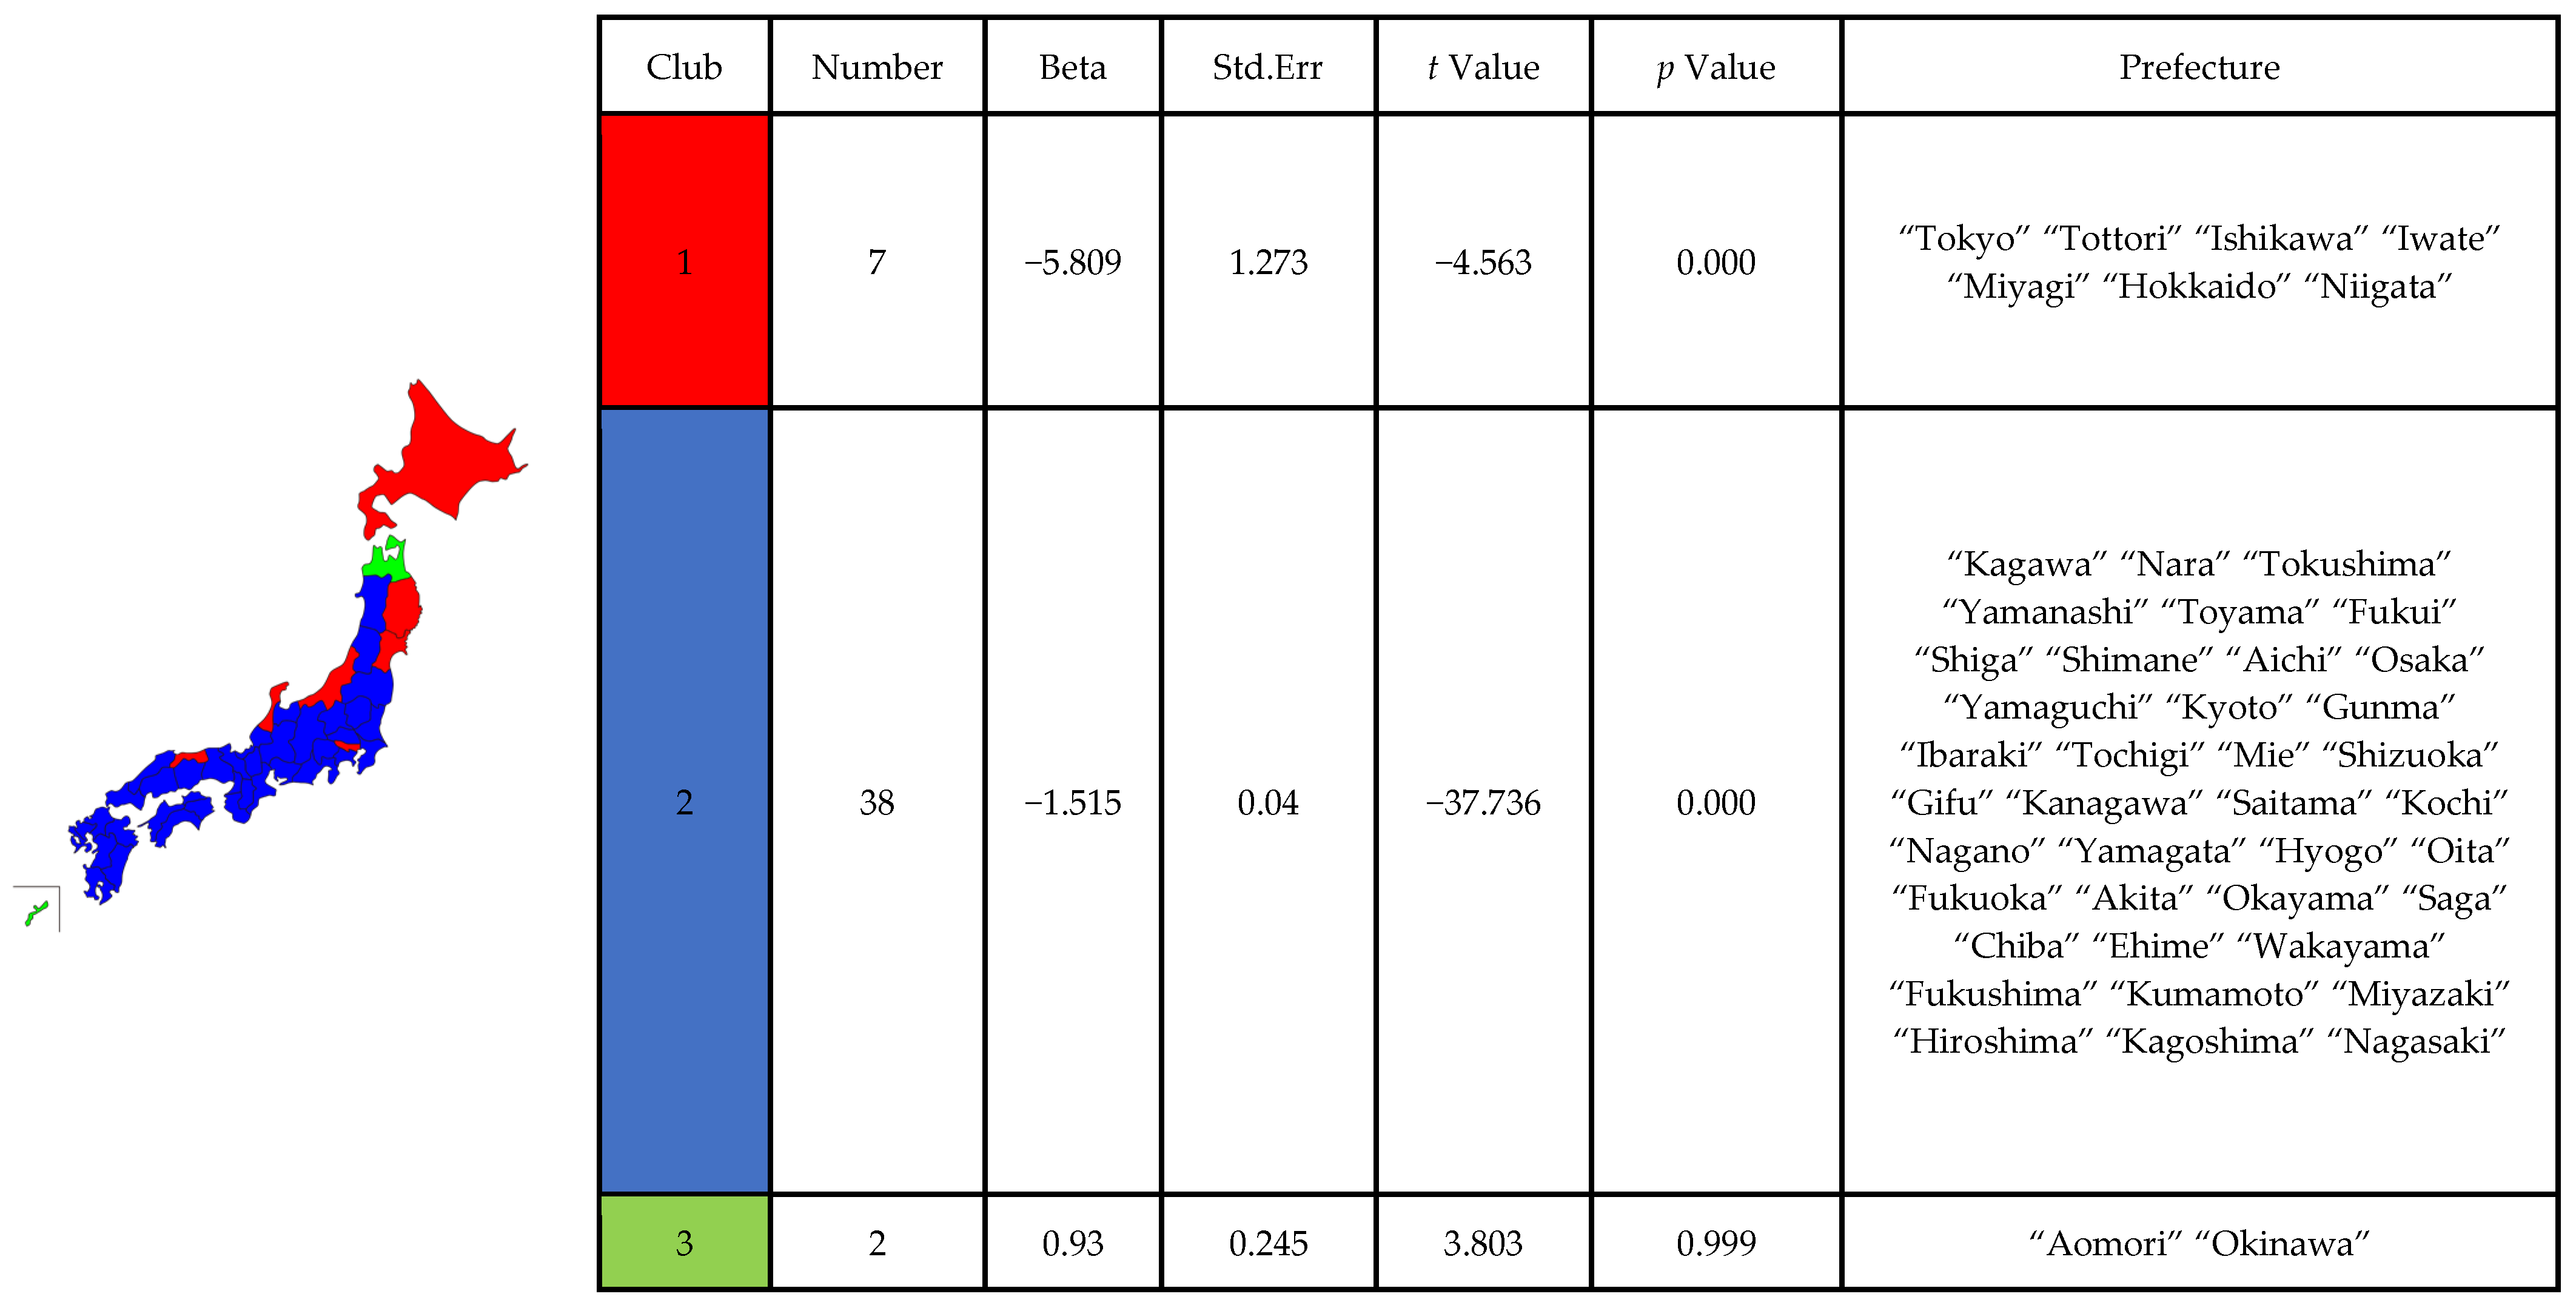
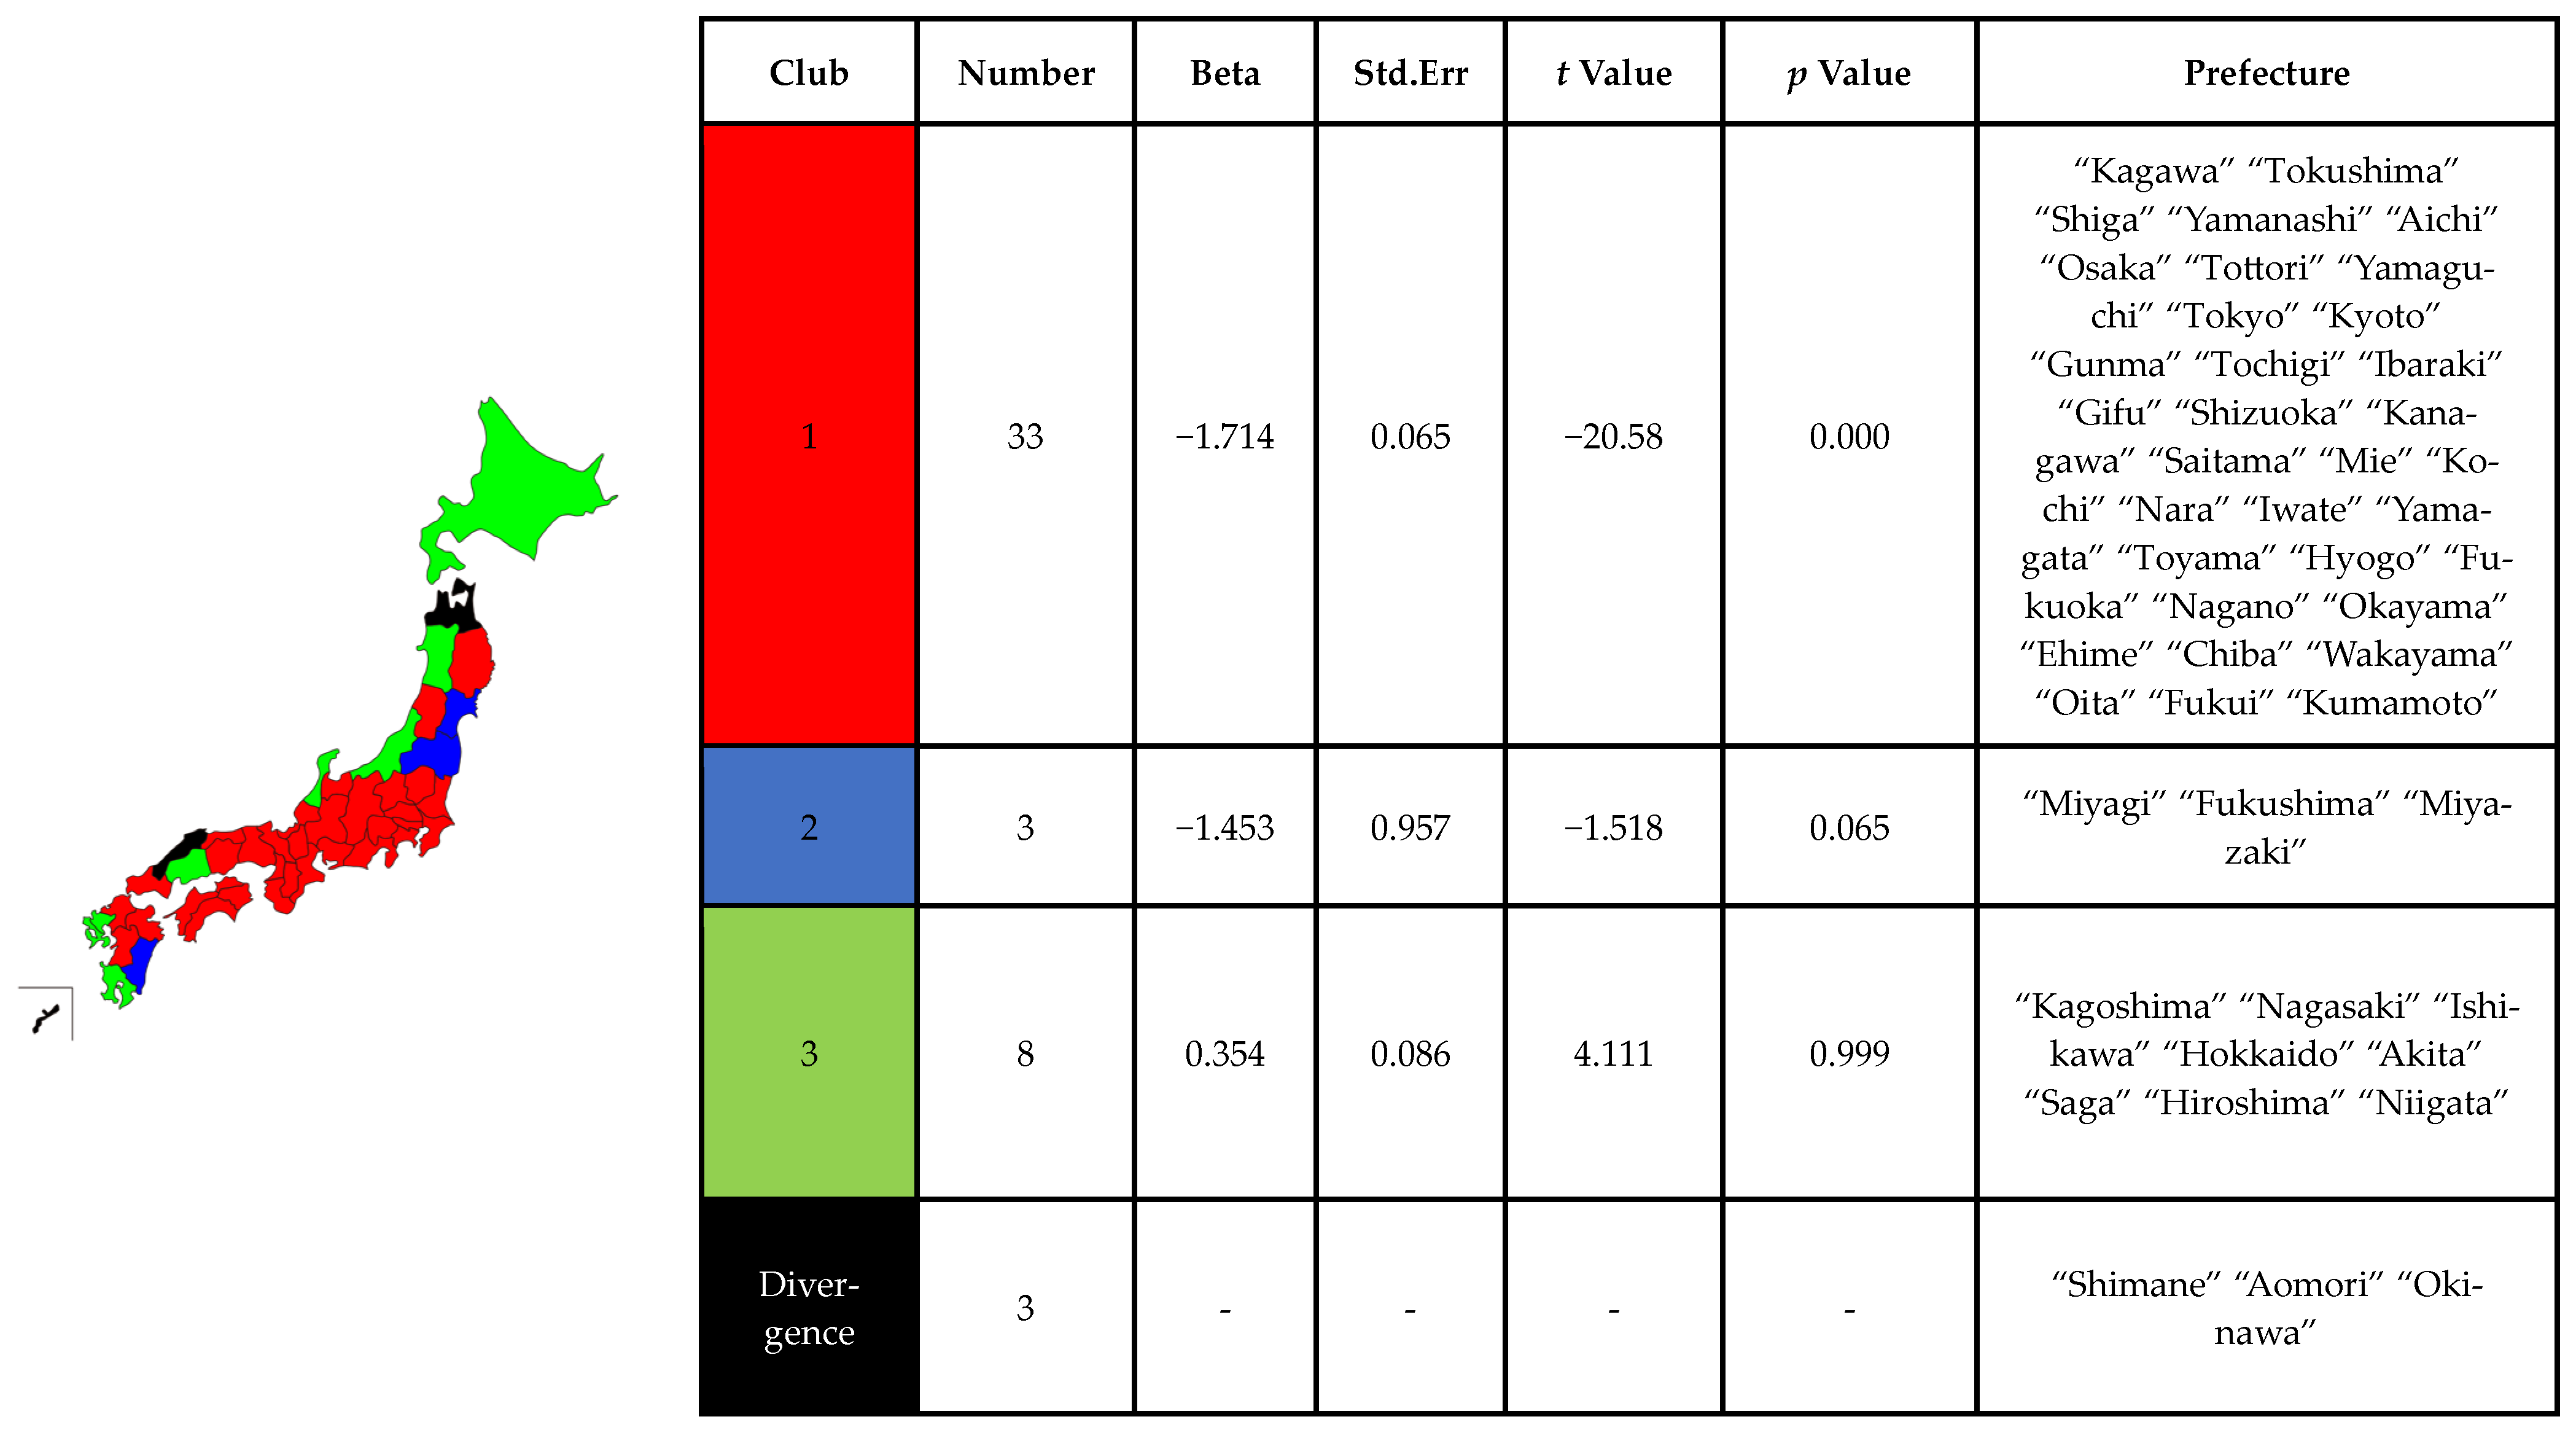
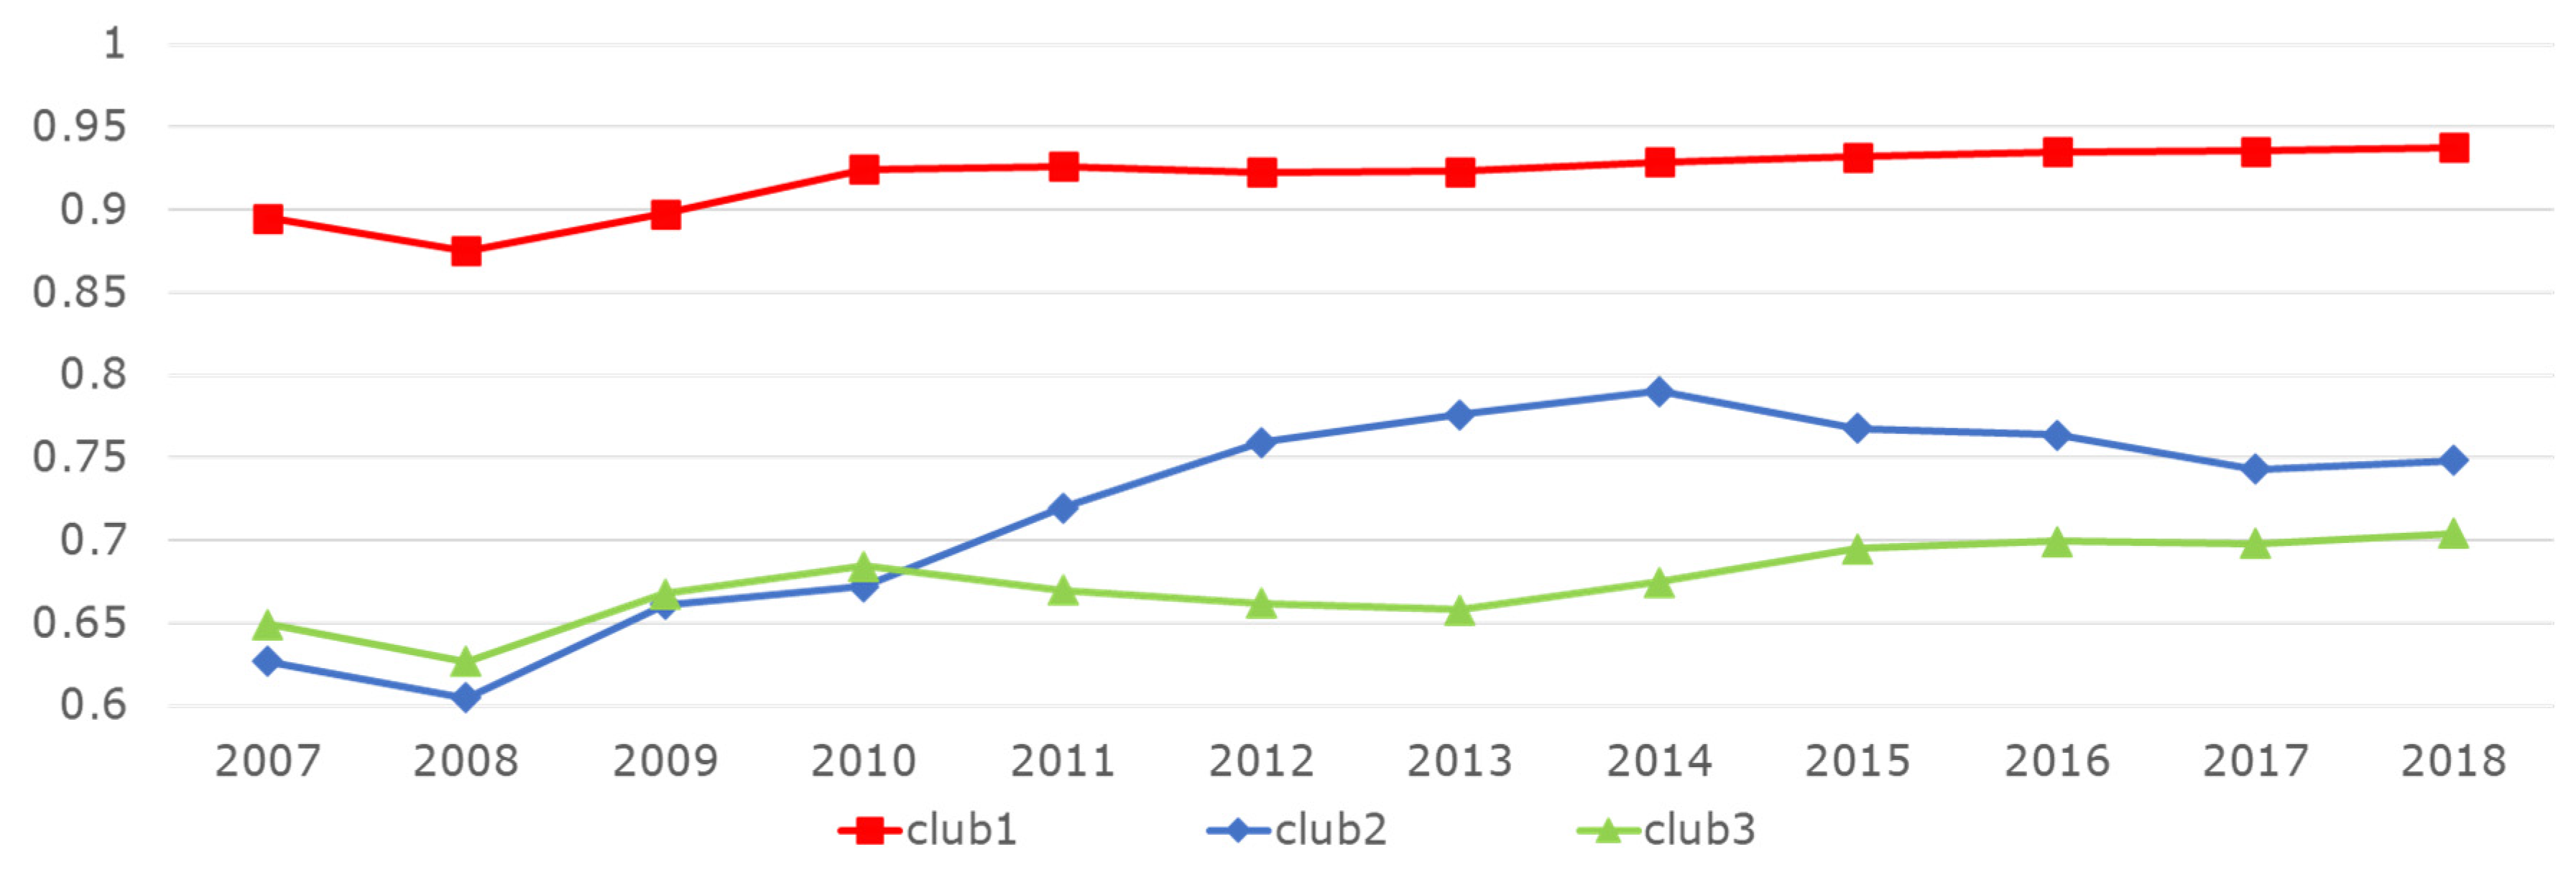
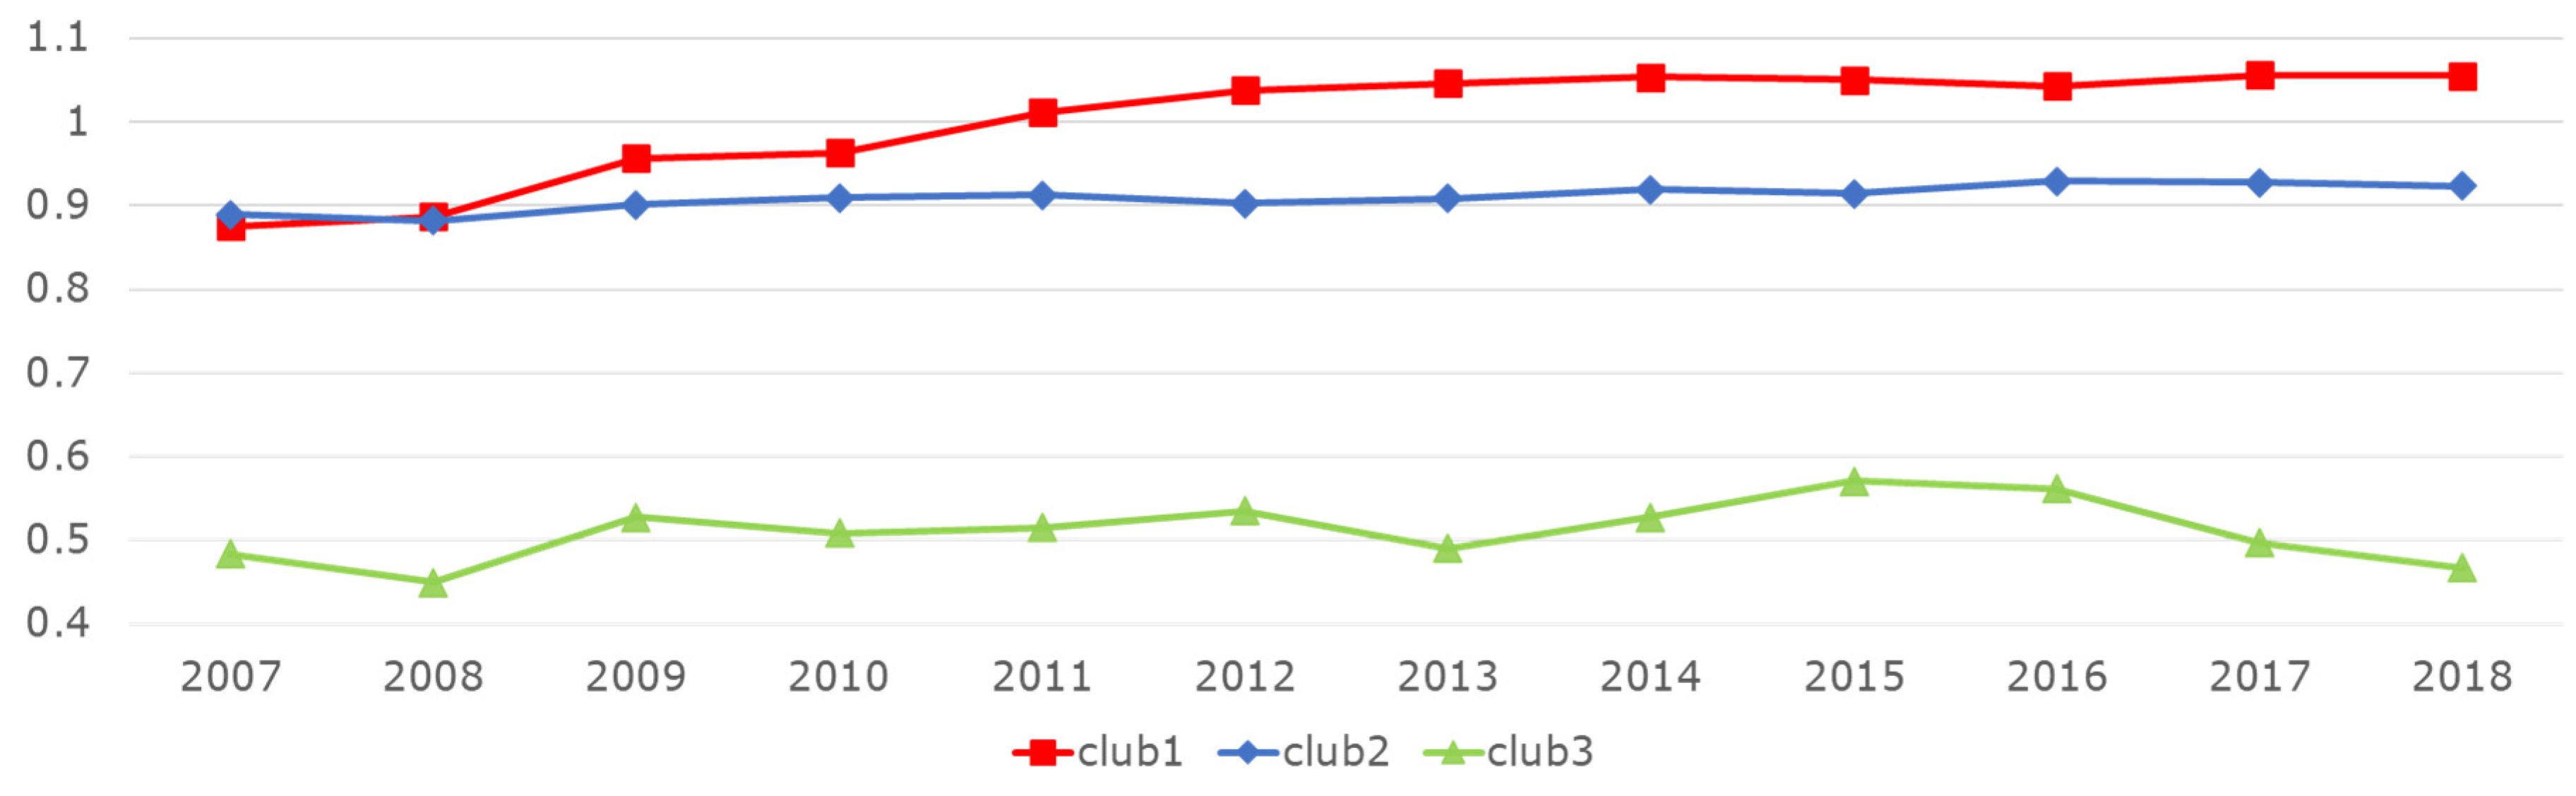
4.3. Club Convergence Results

Using the model proposed by [33] as described in Section 3.3 of this study, we performed a club convergence analysis using the efficiency values for each prefecture obtained in Analyses A, B, and C. The results of Analysis B are close to A, so we examine Analyses A and C. The results of the overall convergence analysis (β value, standard error, t-value, and p-value), the number of prefectures belonging to the obtained clubs, and the names of prefectures belonging to clubs are tabulated and mapped in color for each club in Table 6 and Table 7 and Figure 5, Figure 6, Figure 7 and Figure 8. The average efficiency value trends of the prefectures belonging to the clubs are also presented, and the growth trends of each club are discussed.
Table 6 shows that the null hypothesis of overall convergence was rejected at the 1% level when the efficiency values obtained in Analysis A were used. This implies no existence of overall convergence and existence of club convergence.
Figure 5 confirms the existence of the three clubs and the divergence of the three prefectures that do not belong to any of them. Club 1 (red) is the largest, consisting of 33 prefectures, and convergence across this club is rejected at the 1% level. Looking at Figure 6, the secular change in productive efficiency values for prefectures in Club 1 shows gradual growth over the period covered. The fact that there is no convergence suggests that prefectures with lower productive efficiency values in the club do not grow faster than those with higher values, and that the gap in productive efficiency may not close at this rate or that the gap may widen.
Club 2 (blue) consists of the Miyagi, Fukushima, and Miyazaki prefectures, and the null hypothesis of convergence is not rejected. Figure 6 confirms the growth in productive efficiency from 2010 to 2014. It can be assumed that the two Tohoku prefectures were affected by the Great East Japan Earthquake and experienced rapid economic growth during this period, whereas the Miyazaki prefecture showed a stronger growth trend than the prefectures comprising Club 1. The club increased its economic efficiency during the study period.
Club 3 (green) consists of eight prefectures, including the Kagoshima prefecture, and so on, and shows a trend toward convergence. By tracking the growth path of productive efficiency in each of the eight prefectures, we found that regions with strong industry, such as the Hiroshima and Ishikawa prefectures, have been overtaken by regions where industry is not a mainstay, such as the Hokkaido, Akita, and Niigata prefectures. One reason for this is assumed to be that industrial regions had to devote more resources to environmental protection measures, such as CO2 emission reductions, resulting in smaller economic efficiency improvements.
Finally, the Shimane, Aomori, and Okinawa prefectures do not belong to any club. These three prefectures have their production structures and are considered independent from an economic perspective.
Table 7 shows that the null hypothesis of overall convergence is rejected at the 1% level when the efficiency values obtained in Analysis C are used. This implies no overall convergence and the existence of club convergence.
Figure 7 shows that the prefectures are classified into three clubs, with no divergent prefectures. In terms of club composition, the Aomori and Okinawa prefectures belong to Club 3, while the other 45 prefectures are categorized into two clubs; the trend of the results differs from those of Analyses A and B.
Club 1 (red) comprises seven prefectures, and the convergence of the entire club is rejected at the 1% level. Figure 8 shows that this club is composed of prefectures with a growth trend during the study period. The Iwate, Miyagi, Hokkaido, and Niigata prefectures showed a growth trend over time, whereas Tokyo and Tottori belonged to Club 1 but showed little growth trend over time. The Ishikawa prefecture belonged to the club and behaved as a prefecture whose level caught up with other prefectures.
Club 2 (blue) is the largest, consisting of 38 prefectures. The convergence of the entire club is rejected at the 1% level. Figure 8 shows that the average productive efficiency remained unchanged. This means that for most prefectures in Japan, the overall economic, environmental, and well-being efficiencies relative to the scale of production were constant during the period covered in this study.
Club 3 (green) is the smallest club, consisting of two prefectures that are divergent in Analysis A and show a convergence trend in Analysis C. Although these two prefectures have unique production structures, the increase or decrease in CO2 emissions relative to the scale of production showed similar trends. Learning from the other prefectures/clubs on CO2 emission reduction measures may be effective in improving the productive efficiency of this group.

4.4. Discussion on Club Convergence Results

The results of the club convergence analyses are summarized as follows. First, there is no overall convergence trend in any of the analyses, which is consistent with the results of [12,15,16] and incongruent with the results of [6,9]. One of the factors of the differences is the length of the covered period; previous studies that showed a trend toward convergence had longer periods of interest using an older dataset. Re-examination over a longer time period is an issue for future research.
Second, the results of the club convergence analysis of A revealed that many prefectures belong to Club 1, centered in Tokyo, but that this club has not converged. The covered period was a time of stagnation in Japanese economic growth, the depopulation of rural areas, and an increasing concentration in Tokyo, and there is a possibility of widening disparities among the regions. However, because it is difficult to quickly make structural changes in manufacturing and tertiary industries, which have a major impact on the economy, comprehensive productive efficiency improvement is required through measures for the environment and well-being outside of the economy. Meanwhile, some prefectures form a club of lower-level efficiency, unlike Tokyo, where a trend toward convergence can be observed. To prevent regional disparities from becoming entrenched, there is an urgent need to implement bold green investments and R&D, and to spread the benefits of such investments over a wide area in Japan. Such policies can be seen in the government’s Green Innovation Fund that was established and operated by the New Energy and Industrial Technology Development Organization (https://green-innovation.nedo.go.jp/en/ (accessed on 1 April 2024)).
Third, the situation changes when the environment and well-being are considered. Regarding the overall efficiency trend considering CO2 emissions and well-being, the growth trend up to 2010 and the downward trend of the average efficiency in 2012 are consistent with the results of [11]. However, the club convergence analysis in this study further revealed the existence of prefectures that do not follow the 2012 downward trend and show a growth trend. Further, the trend of regions with high economic efficiency showing productivity stagnation, while regions with low efficiency showing significant productivity growth, is consistent with [17]. For example, the Niigata prefecture shows a particular growth trend in this study. Compared to [17], the shift in the covered period has resulted in fewer prefectures showing economic growth and more showing stagnation. On the other hand, the addition of environmental factors and well-being indicators eliminates the trend of convergence in the main club to which most prefectures belong. The two main clubs showed no convergence trend in the club convergence analysis in Analysis C, while some prefectures belonged to the same club as Tokyo and tended to grow, and the other many prefectures are unable to break out of clubs that do not show growth trends. Tokyo is a leader in new elements and the disparity between regions may widen further. Each prefecture needs to establish and implement a regional growth strategy to overcome this situation. Some of these are observed in higher-efficiency prefectures, including the formulation of new industry clusters, structural changes toward low-carbon industry sectors, the proactive deployment of renewable energy sources for reducing CO2 emissions, establishing high-speed transportation networks, and improving happiness indicators related to work or improving work–life balance, which are all expected to increase the overall productive efficiency and help narrow the gap between urban and rural areas. In order to achieve this, national policy support as well as private-sector efforts will be necessary. For example, policies to foster industry, such as those seen in Hokkaido and Kumamoto to attract semiconductor centers to Japan, will become increasingly necessary in the future.

5. Conclusions

The purpose of this study was to examine the productive efficiency for Japan’s 47 prefectures from 2007 to 2018, in which we incorporated the following two new production factors: an environmental variable as an undesirable output and a well-being indicator as a desirable output. Using a combination of the DEA intermediate approach and the DEA super-efficiency model, a three-stage analysis was conducted by sequentially adding new factors, CO2 emissions, and a well-being indicator to obtain an evaluation of the productive efficiency with an emphasis on economic aspects in conventional factors (Analysis A); an evaluation of the productive efficiency in which the two aspects of the economy and the environment were emphasized (Analysis B); an evaluation of the productive efficiency in which the three aspects of economy, environment, and well-being were emphasized (Analysis C). We also conducted a club convergence analysis using the productive efficiency and observed how the clubs were formed among prefectures, what their characteristics were, and how they changed over time. Through these analytical processes, we confirmed the usefulness of the new combination model and index, and considered regional policy implications.
The results of the three-step productive efficiency analysis indicated that the high concentration of profitable financial and insurance industries observed in Tokyo is thought to be the reason for the high economic efficiency, which is consistent with [1,10]. The development of social capital is also important, as [17,35] and other studies suggested for the economic effects of social capital development, although prefectures with large social capital areas are not necessarily economically efficient in their development. The results of the convergence analyses showed that there is no overall convergence trend in any of the analyses, which is consistent with the results of [7,8,12] and incongruent with the results of [14,17]. These differences are mainly attributed to the length of the covered period; previous studies showing a trend toward convergence had longer periods of interest using an older dataset. Re-examination over a longer time period is an issue for future research.
The results of the club convergence analyses also showed that Tokyo led in new environmental and well-being factors, and the evaluation of the new index increased the possibility of widening disparities. To improve this situation and avoid widening regional disparities, measuring the holistic regional productive efficiency incorporating the environment and well-being factors is an effective tool for monitoring the situation and implementing regional policy. Reducing CO2 emissions in the transportation sector by shifting to low-carbon vehicles and improving happiness levels related to work–life balance, for example, are expected to help narrow the gap between urban and rural areas. Improving the work-related well-being is one way to increase productive efficiency of each prefecture. Learning good policy from high-efficiency prefectures would be effective to maximize the ripple effect on individual issues between regions. In order to achieve this, national policy support as well as municipal and private-sector efforts will be necessary.
We have three limitations and future research tasks in this study. First, we discussed the source of the inefficiency, but it can be investigated further using a formal approach with a combination of regression analysis and DEA efficiency scores. Second, we created a well-being indicator based on our proposed formula. This formula and indicator are examples in a wide range of methods of indicator creation, thereby it can be more sophisticated by extending the discussion for suitable indicators that adapt specific efficiency measurements. Third, this study used new data compared to previous studies, but due to the source data constraint, the study period does not include recent events such as the COVID-19 pandemic and economic recovery. Expanding the period covered and applying the method to other countries/regions for efficiency measurements and convergence analysis could reveal the latest trends after 2020 in Japan and the world. All of these are the future research tasks of this study.

Author Contributions

Conceptualization, R.I. and M.G.; methodology, R.I. and M.G.; software, R.I.; formal analysis, R.I.; investigation, R.I.; data curation, R.I.; writing—original draft preparation, R.I.; writing—review and editing, R.I. and M.G.; visualization, R.I.; supervision, M.G.; project administration, M.G.; funding acquisition, M.G. All authors have read and agreed to the published version of the manuscript.

Funding

This work was supported by Council for Science, Technology and Innovation (CSTI), Cross-ministerial Strategic Innovation Promotion Program (SIP), and the third period of SIP “Smart energy management system”, Grant Number JPJ012207 (Funding agency: JST). We are deeply grateful for the insights provided by four reviewers. Their constructive comments and expertise have been valuable in guiding our revisions and have helped us to present a more polished and refined piece of research.

Data Availability Statement

Data are contained within the article.

Conflicts of Interest

The authors declare no conflicts of interest.

References

  1. Otsuka, A. Analysis of productive efficiency in Japanese regional economies. Stud. Reg. Sci. 2014, 44, 453–465. [Google Scholar] [CrossRef]
  2. Regional Decarbonization Roadmap. Available online: https://www.cas.go.jp/jp/seisaku/datsutanso/pdf/20210609_chiiki_roadmap.pdf (accessed on 1 April 2024). (In Japanese).
  3. Stiglitz, J.E.; Sen, A.; Fitoussi, J.-P. Report by the Commission on the Measurement of Economic Performance and Social Progress. Available online: https://www.economie.gouv.fr/files/finances/presse/dossiers_de_presse/090914mesure_perf_eco_progres_social/synthese_ang.pdf (accessed on 1 April 2024).
  4. Wang, D.; Li, S.; Sueyoshi, T. DEA environmental assessment on U.S. industrial sectors: Investment for improvement in operational and environmental performance to attain corporate sustainability. Energy Econ. 2014, 45, 254–267. [Google Scholar] [CrossRef]
  5. Wang, D.D. Assessing road transport sustainability by combining environmental impacts and safety concerns. Transp. Res. D Transp. Environ. 2019, 77, 212–223. [Google Scholar] [CrossRef]
  6. Sueyoshi, T.; Goto, M. Environmental Assessment on Energy and Sustainability by Data Envelopment Analysis; John Wiley & Sons, Ltd.: Chichester, UK, 2018; pp. 1–699. [Google Scholar]
  7. Managi, S. Luenberger and Malmquist productivity indices in Japan, 1955–1995. Appl. Econ. Lett. 2003, 10, 581–584. [Google Scholar] [CrossRef]
  8. Nemoto, J.; Goto, M. Productive efficiency, scale economies and technical change: A new decomposition analysis of TFP applied to the Japanese prefectures. J. Jpn. Int. Econ. 2005, 19, 617–634. [Google Scholar] [CrossRef]
  9. Nakano, M.; Managi, S. Productivity analysis with CO2 emissions in Japan. Pac. Econ. Rev. 2010, 15, 708–718. [Google Scholar] [CrossRef]
  10. Hashimoto, A.; Fukuyama, H. Evaluation of prefectural productivity considering greenhouse gas emissions. Trans. Oper. Res. Soc. Jpn. 2017, 60, 1–19. (In Japanese) [Google Scholar] [CrossRef]
  11. Fukuyama, H.; Hashimoto, A.; Weber, W.L. Environmental efficiency, energy efficiency and aggregate well-being of Japanese prefectures. J. Clean. Prod. 2020, 271, 122810. [Google Scholar] [CrossRef]
  12. Goto, M.; Mohammed Atris, A.; Otsuka, A. Productivity change and decomposition analysis of Japanese regional economies. Reg. Stud. 2018, 52, 1537–1547. [Google Scholar] [CrossRef]
  13. Honma, S.; Hu, J.-L. Total-factor energy efficiency of regions in Japan. Energy Policy 2008, 36, 821–833. [Google Scholar] [CrossRef]
  14. Barro, R.J.; Sala-i-Martin, X. Regional cohesion: Evidence and theories of regional growth and convergence. Eur. Econ. Rev. 1995, 40, 1325–1352. [Google Scholar]
  15. Kawagoe, M. Regional dynamics in Japan: A reexamination of Barro regressions. J. Jpn. Int. Econ. 1999, 13, 61–72. [Google Scholar] [CrossRef]
  16. Togo, K. Productivity convergence in Japan’s manufacturing industries. Econ. Lett. 2002, 75, 61–67. [Google Scholar] [CrossRef]
  17. Otsuka, A.; Goto, M. Total factor productivity and the convergence of disparities in Japanese regions. Ann. Regional Sci. 2016, 56, 419–432. [Google Scholar] [CrossRef]
  18. Jobert, T.; Karanfil, F.; Tykhonenko, A. Convergence of per capita carbon dioxide emissions in the EU: Legend or reality? Energy Econ. 2010, 32, 1364–1373. [Google Scholar] [CrossRef]
  19. Kounetas, K.; Zervopoulos, P.D. A cross-country evaluation of environmental performance: Is there a convergence-divergence pattern in technology gaps? Eur. J. Oper. Res. 2019, 273, 1136–1148. [Google Scholar] [CrossRef]
  20. Sueyoshi, T.; Wang, D. Rank dynamics and club convergence of sustainable development for countries around the world. J. Clean. Prod. 2020, 250, 119480. [Google Scholar] [CrossRef]
  21. Charnes, A.; Cooper, W.W.; Rhodes, E. Measuring the efficiency of decision making units. Eur. J. Oper. Res. 1978, 2, 429–444. [Google Scholar] [CrossRef]
  22. Banker, R.D.; Charnes, A.; Cooper, W.W. Some models for estimating technical and scale inefficiencies in data envelopment analysis. Manag. Sci. 1984, 30, 1078–1092. [Google Scholar] [CrossRef]
  23. Chung, Y.H.; Fare, R.; Grosskopf, S. Productivity and undesirable outputs: A directional distance function approach. J. Environ. Manag. 1997, 51, 229–240. [Google Scholar] [CrossRef]
  24. Chambers, R.G.; Chung, Y.; Färe, R. Benefit and distance functions. J. Econ. Theory 1996, 70, 407–419. [Google Scholar] [CrossRef]
  25. Sueyoshi, T.; Yuan, Y. Social sustainability measured by intermediate approach for DEA environmental assessment: Chinese regional planning for economic development and pollution prevention. Energy Econ. 2017, 66, 154–166. [Google Scholar] [CrossRef]
  26. Tomikawa, T.; Goto, M. Efficiency assessment of Japanese National Railways before and after privatization and divestiture using data envelopment analysis. Transp. Policy 2022, 118, 44–55. [Google Scholar] [CrossRef]
  27. Andersen, P.; Petersen, N.C. A procedure for ranking efficient units in data envelopment analysis. Manag. Sci. 1993, 39, 1261–1264. [Google Scholar] [CrossRef]
  28. Tone, K. A slacks-based measure of super-efficiency in data envelopment analysis. Eur. J. Oper. Res. 2002, 143, 32–41. [Google Scholar] [CrossRef]
  29. Zhang, X.; Sun, H.; Wang, T. Impact of financial inclusion on the efficiency of carbon emissions: Evidence from 30 provinces in China. Energies 2022, 15, 7316. [Google Scholar] [CrossRef]
  30. Chu, X.; Jin, Y.; Wang, X.; Wang, X.; Song, X. The evolution of the spatial-temporal differences of municipal solid waste carbon emission efficiency in China. Energies 2022, 15, 3987. [Google Scholar] [CrossRef]
  31. De Salvo, M.; Signorello, G.; Cucuzza, G.; Begalli, D.; Agnoli, L. Estimating preferences for controlling beach erosion in Sicily. Aestimum 2018, 72, 27–38. [Google Scholar]
  32. De Salvo, M.; Notaro, S.; Cucuzza, G.; Giuffrida, L.; Signorello, G. Protecting the local landscape or reducing greenhouse gas emissions? A study on social acceptance and preferences towards the installation of a wind farm. Sustainability 2021, 13, 12755. [Google Scholar] [CrossRef]
  33. Phillips, P.; Sul, D. Transition modeling and econometric convergence tests. Econometrica 2007, 75, 1771–1855. [Google Scholar] [CrossRef]
  34. Sichera, R.; Pizzuto, P. Convergence clubs: A package for performing the Phillips and Sul’s club convergence clustering procedure. R J. 2019, 11, 142–151. [Google Scholar] [CrossRef]
  35. Yamao, N.; Ohkawara, T. The regional allocation of public investment: Efficiency or equity? J. Reg. Sci. 2000, 40, 205–229. [Google Scholar] [CrossRef]
Figure 1. DEA intermediate approach [25].
Energies 17 01910 g001
Figure 2. Analytical framework. Analysis A uses production factors enveloped by the solid line, Analysis B uses those by the solid and dashed lines, Analysis C uses those by the solid, dashed, and double-dashed lines.
Energies 17 01910 g002
Figure 3. Well-being indicator creation flow.
Energies 17 01910 g003
Figure 4. Results of Analysis A, B, and C.
Energies 17 01910 g004
Figure 5. Results of the club convergence analysis (productive efficiency values for Analysis A). The black color part in map corresponds to divergence.
Energies 17 01910 g005
Figure 6. Average changes in the productive efficiency values for each club (productive efficiency values for Analysis A).
Energies 17 01910 g006
Figure 7. Results of club convergence analysis (productive efficiency values for Analysis C).
Energies 17 01910 g007
Figure 8. Average changes in the productive efficiency values for each club (productive efficiency values for Analysis C).
Energies 17 01910 g008
Table 1. Data used in DEA.
ElementData UsedUnitSource
LaborNumber of workers in the prefectureNumber of personsPrefectural Accounts, Cabinet Office, Government of Japan
EnergyTotal energy consumptionTJ (Terajoule)Statistical Survey of Energy Consumption by Prefecture, Agency for Natural Resources and Energy, Ministry of Economy, Trade and Industry
Social capital stockTotal social capital stockMillions of YenCabinet Office, Government of Japan Social Capital Stock Estimates
Private capital stockR-JIP net capital stockMillions of YenRIETI (Research Institute of Economy, Trade and Industry) Industrial Productivity by Prefecture (R-JIP) database
GRPGross prefectural productMillions of YenPrefectural Accounts, Cabinet Office, Government of Japan
CO2 emissionsCO2 emissionsTon CO2Ministry of the Environment Greenhouse Gas Emissions Calculation, Reporting and Publication System
Happiness indexHappiness indexCreated by the author
Table 2. Comprehensive subjective satisfaction definitions.
1st Layer2nd Layer3rd Layer
Comprehensive Subjective Satisfaction1. Households and assets① Disposable income
② Financial assets balance
③ Lifetime wage
2. Employment environment and wages① Unemployment rate/job openings
② Number of full-time and involuntary part-time jobs
③ Prescribed salary amount/minimum wage
3. Housing① Gross floor area
② Expenses for rent of space, land, etc.
③ House ownership rate
4. Work and life① Actual working hours
② Percentage of employees working long hours (49 h or more per week)
③ Sub-yearly percentage of employees taking paid leave
5. Health condition① Average life expectancy/healthy life expectancy
② Percentage of persons with strongly suspected diabetes and number of deaths due to lifestyle-related diseases
③ Percentage of those who have an exercise habit
6. Educational standards and environment① University attendance rate
② International rankings of learning achievement
③ Number of social enrolment
7. Social connections① Volunteer action rate
② Total individual donations
③ Time of dating/relationship
8. Natural environment such as air and water① Percentage of achievement of environmental standards for PM2.5 and water quality
② Percentage of noise meeting environmental standards
③ Forest coverage, urban park area per capita
9. Personal safety① Number of criminal offenses
② Number of persons killed in traffic accidents
③ Deaths and missing persons due to natural disasters
10. Ease of raising children① Number of children on waiting list for childcare centers
② Percentage of employees taking childcare leave
③ Total cost of study for children (kindergarten through high school)
11. Ease of caring and being cared for① Percentage of recipients of long-term care insurance services
② Percentage of establishments with nursing care leave system provisions/nursing care turnover rate
③ Nursing and caregiving hours
Table 3. Data used for the well-being indicator.
FieldData UsedReference Factors for Comprehensive Subjective SatisfactionUnit+/−Source
1. Households and assets① Disposable income
(average of working households)
Disposable incomeYen+Social and Demographic Systems L
② Deposits and savings
(average of working households)
Financial assets balanceYen+Social and Demographic Systems L
2. Employment environment and wages① Fully unemployed rateUnemployment rate/job openingsPersonSocial and Demographic Systems F
② Prescribed salary amount (total average)Prescribed salary amount/minimum wageThousands Yen+Social and Demographic Systems F
3. Housing① Gross floor area per residenceGross floor aream2+Social and Demographic Systems H
② Rent per 3.3 m2Expenses for rent of space, land, etc.YenSocial and Demographic Systems H
4. Work and life① Overtime work hours (total average)Percentage of employees working long hours (49 h or more per week)HourSocial and Demographic Systems F
② Percentage of employees taking paid leaveSub-yearly percentage of employees taking paid leave%+Social Survey of Living Standards
5. Health condition① Healthy life expectancy (total average)Average life expectancy/healthy life expectancyAge+Social and Demographic Systems I
② Total average hours per sports actor per weekPercentage of those who have an exercise habitMinute+Social Survey of Living Standards
6. Educational standards and environment① Academic status survey results (elementary school students)International rankings of learning achievementScore+National Survey of Academic Performance and Learning
② Academic status survey results (junior high school students)International rankings of learning achievementScore+National Survey of Academic Performance and Learning
7. Social connections① Total average hours of volunteer and social participation activitiesVolunteer action rateMinute+Social Survey of Living Standards
② Donation totalTotal individual donationsYen+Red Feather Community Chest
8. Natural environment such as air and water① Percentage of forest areaForest coverage, urban park area per capita%+Social and Demographic Systems B
② Percentage of nature park areaForest coverage, urban park area per capita%+Social and Demographic Systems B
9. Personal safety① Amount of damage caused by disastersDeaths and missing persons due to natural disastersMillions of YenSocial and Demographic Systems K
② Number of persons killed in traffic accidentsNumber of persons killed in traffic accidentsPersonSocial and Demographic Systems K
10. Ease of raising children① Percentage of employees taking childcare leave (male)Percentage of employees taking childcare leave%+Basic Survey of Employment Structure
② Percentage of employees taking childcare leave (female)Percentage of employees taking childcare leave%+Basic Survey of Employment Structure
11. Ease of caring and being cared for① Amount of nursing care benefits paid per casePercentage of recipients of long-term care insurance servicesThousands Yen+Social and Demographic Systems J
② Nursing and caregiving hoursNursing and caregiving hoursMinuteSocial Survey of Living Standards
Table 4. Calculated well-being indicator (normalized).
PrefectureAverageRankPrefectureAverageRankPrefectureAverageRank
Hokkaido0.327940Ishikawa0.83623Okayama0.424331
Aomori0.275443Fukui0.92682Hiroshima0.474827
Iwate0.403634Yamanashi0.555816Yamaguchi0.498822
Miyagi0.287342Nagano0.59399Tokushima0.471429
Akita0.65597Gifu0.567112Kagawa0.533918
Yamagata0.536317Shizuoka0.65736Ehime0.412132
Fukushima0.488624Aichi0.476426Kochi0.364438
Ibaraki0.504721Mie0.573011Fukuoka0.190945
Tochigi0.520519Shiga0.560514Saga0.513820
Gunma0.425330Kyoto0.383236Nagasaki0.317441
Saitama0.488325Osaka0.049947Kumamoto0.385535
Chiba0.472128Hyogo0.370637Oita0.556915
Tokyo0.66005Nara0.492323Miyazaki0.411833
Kanagawa0.566213Wakayama0.245144Kagoshima0.332139
Niigata0.589710Tottori0.62118Okinawa0.104146
Toyama0.98961Shimane0.73304
Table 5. Results of Analysis A, B, and C.
PrefectureAnalysis A Ave.
(2007–2018)
Analysis B Ave.
(2007–2018)
Analysis C Ave.
(2007–2018)
PrefectureAnalysis A Ave.
(2007–2018)
Analysis B Ave.
(2007–2018)
Analysis C Ave.
(2007–2018)
Hokkaido0.60840.60840.6088Shiga0.99980.99981.0123
Aomori0.52430.53100.5376Kyoto0.94920.95370.9541
Iwate0.75670.76660.7707Osaka0.95800.95800.9580
Miyagi0.70310.70480.7057Hyogo0.78990.78990.7936
Akita0.64130.65520.8097Nara0.88130.89671.1141
Yamagata0.81610.83340.8665Wakayama0.87080.87080.8708
Fukushima0.73680.73680.7481Tottori0.99590.99641.6124
Ibaraki0.84590.84590.8500Shimane0.66230.70411.0661
Tochigi0.87690.87690.8906Okayama0.80270.80270.8067
Gunma0.87400.87480.8763Hiroshima0.73080.73080.7421
Saitama0.89260.89260.8958Yamaguchi0.91070.91070.9173
Chiba0.79930.79930.8026Tokushima1.11161.11161.1129
Tokyo1.63341.63391.6570Kagawa1.39311.39311.3993
Kanagawa0.89010.89010.8942Ehime0.77690.77690.7897
Niigata0.58170.58190.6054Kochi1.02321.02321.0247
Toyama0.84870.84881.1104Fukuoka0.81550.81550.8155
Ishikawa0.69810.74671.0594Saga0.66170.69830.7648
Fukui0.91540.91651.1607Nagasaki0.75690.76650.7687
Yamanashi0.95811.00441.1266Kumamoto0.77100.78090.7907
Nagano0.78920.79940.8478Oita0.77860.77860.8164
Gifu0.90740.90740.9254Miyazaki0.71830.73050.7454
Shizuoka0.91830.91830.9334Kagoshima0.71380.73260.7653
Aichi0.93320.93320.9338Okinawa0.44310.47600.4847
Mie0.85930.85930.8730
Note: Ave. means average over the period 2007–2018.
Table 6. Results of overall convergence analysis (productive efficiency values for Analysis A).
BetaStd.Errt-Valuep-Value
−1.4200.022−64.2600.000
Table 7. Results of the overall convergence analysis (productive efficiency values for Analysis C).
BetaStd.Errt-Valuep-Value
−1.7490.049−35.5760.000
Disclaimer/Publisher’s Note: The statements, opinions and data contained in all publications are solely those of the individual author(s) and contributor(s) and not of MDPI and/or the editor(s). MDPI and/or the editor(s) disclaim responsibility for any injury to people or property resulting from any ideas, methods, instructions or products referred to in the content.

