1. Introduction
1.1. Background
According to the definition established by the European Commission, the Energy-Intensive Industry (EII) ecosystem covers a broad range of sectors, including chemicals, steel, paper, plastics, mining, extraction and quarrying, refineries, cement, wood, rubber, non-ferrous metals, glass, and ceramics. Eurostat reports that the EII sector in the EU is made up of 548,000 commercial entities which employ 7.8 million people throughout the 27 EU member nations and generate EUR 549 billion per year. Additionally, the EIIs are closely tied with the energy, waste, and recycling industries [
1]. In 2019, these sectors were also responsible for 22% of the total EU greenhouse gas emissions. Due to these factors, the European Commission decided that the EII sector required an EU Energy Intensive Industries’ Transformation Masterplan to facilitate Europe’s transition to carbon neutrality by 2050, as laid out in the European Green Deal [
2].
One of the factors significantly impacting the energy transformation process of the EII sector is the introduction of capacity mechanisms to the electricity market. Capacity mechanisms are defined as instruments in the energy policies geared toward ensuring sufficient capacity in the power systems by generating economic incentives to address the problem of inadequate capacity [
3]. They serve as platforms matching the infrastructure which offer the resources necessary to ensure that a sufficient electrical capacity is available to meet the customers’ peak demand. By providing a stream of revenue independent of the generated energy, they allow for the offsetting of the risk of insufficient capacity during periods of high demand, therefore ensuring a safe energy supply to the users [
4]. They are particularly useful during the transition of the energy mix toward a greater portion of renewable energy, characterized by a less certain generation pattern compared to the conventional sources. By creating a safety feature, capacity mechanisms allow for smoother implementation of renewables into the energy mix [
5].
The UK was the first country among the EU member states to introduce such a mechanism through the UK’s Energy Act of 2013, which established the Electricity Market Reform. It set forth a system of auctions in which power companies could bid for long-term contracts to provide adequate capacity in the power system [
6]. This mechanism faced a series of controversies. It was first recognized as meeting the EU Environmental and Energy State Aid Guidelines and approved by the European Commission in 2014 [
7]. Subsequently, the Commission’s decision was appealed in the case “Tempus Energy Ltd. and Tempus Energy Technology Ltd. v European Commission” and annulled on procedural grounds by the General Court [
8]. Although the General Court did not rule on the compatibility of the British Capacity Market with the State Aid rules, it recommended further investigation of that subject by the European Commission. The final decision on that matter, confirming the compatibility of the British Capacity Market Scheme with EU regulations, was issued on 24 October 2019 [
9]. Following the British example, a similar mechanism was introduced in Poland. Initially laid out in the Capacity Market Act of 2017, the Polish capacity scheme was based on the British legislation, adjusted to the specific local conditions, and addressed potential misalignments with the EU State Aid rules [
10,
11].
One of the changes to the Polish tariff system resulting from the establishment of the capacity market was the introduction of the so-called capacity charge. The fee is meant to cover the costs associated with the functioning of the capacity market, particularly the costs of the capacity obligations sold by the generators. It is applied to both commercial and private users, although at different rates. Starting in January 2021, capacity charges are collected by Polish distribution system operators (DSOs) from their customers. DSOs then transfer the collected capacity charges to the transmission system operator—Polskie Sieci Elektroenergetyczne S.A.—which is the party purchasing capacity obligations from the generators [
12]. As of the end of 2023, there are five major DSOs operating in the Polish market: Enea Operator Sp. z o.o., Energa-Operator S.A., Stoen Operator Sp. z o.o., PGE Dystrybucja S.A., and Tauron Dystrybucja S.A. [
13]. The tariffs established by each of these groups, which include the charges and conditions of their services, by law must be approved annually by the President of the Energy Regulatory Office (PURE). The PURE also announces the unit cost of the capacity charge, which is binding for all of the DSOs operating in the country. As a result, all users are subject to the same tariff conditions of the capacity mechanism, independently of their DSO.
1.2. Motivation
This paper will focus on the perspective of the individual industrial customers from the EII sector and the implications of capacity market operation. A series of unstructured interviews conducted in 2021 among the Polish EII sector revealed that the introduction of the capacity market in Poland created a demand for new energy management tools. According to the interviewees, the capacity charge can account for more than 45% of the total energy delivery cost, making it an interesting area for exploring activities geared toward lowering electricity bills for the EIIs. Managing this component of the electricity bill, however, is a complex task. Interviewed managers and staff of the Polish EII sectors reported that so far, none of the production management tools present in the market address the needs of the industrial users seeking to minimize the capacity charge.
The main factor contributing to the inadequacy of the existing solutions results from the dynamic nature of the production processes. Technologists and shift leaders of the manufacturing facilities, often exposed to dynamic situations involving malfunctions of the production equipment, emergency stopovers, delays, and changes in the production plan, cannot rely solely on the fixed plans prepared ahead of time to ensure the correct profile of the power demand curve, which could allow for the minimization of the capacity charge [
14]. Despite having an operation plan which optimizes the anticipated demand characteristics with respect to the expected tariffs and the timing of the demand peaks, the personnel supervising production are unprepared when it comes to responding to unexpected events disturbing the previously established production schedule [
15]. Interviewed industry experts pointed out that currently available tools do not allow for real-time capacity charge monitoring and forecasting, which are vital for a fast response to unexpected events which might affect the electricity costs accrued by the production facility. To improve the robustness of their operation, industry professionals expressed a strong need for a predictive tool which could complement conventional planning methods.
1.3. Literature Review
The conducted literature review confirms the insights gained from the users, pointing toward a knowledge gap in the field of electricity cost optimization. In recent years, the EII sector has witnessed a growing focus on optimizing electricity costs amidst volatile energy markets and increasing regulatory pressures. Several studies have explored various strategies and technologies aimed at managing electricity costs. Recent research underscores the significance of data-driven predictive modeling, demand response strategies, and cloud-based energy management platforms in managing the costs associated with energy fees for industrial consumers. By leveraging these technologies and methods, production facilities can effectively optimize their energy consumption patterns and minimize the financial impact of capacity charges. Honarmand et al. presented an extensive review of Demand Response (DR) programs, categorizing different DR schemes based on the type of market, reliability, power flexibility, and the participants’ economic motivation [
16]. According to them, DR is crucial for enhancing network reliability, managing peak demand, and deploying integrated technologies in power systems. It involves upgrading smart grid information processing and increasing customer awareness of benefits like cost savings and avoiding blackouts. DR utilizes distributed generation, dispatchable loads, and storage systems to modify power supply. The concept of modifying consumption patterns links to Demand-Side Management (DSM) or Energy Service Management (ESM). DSM, evolving since the 1970s, aims to reform energy consumption patterns by shifting consumption to low-demand time slots. With the liberalization of electricity markets, DSM has evolved into DR, defined as changes in electric usage in response to price signals or incentives [
17]. DR transforms customers from passive to active actors in the energy market. Demand-Side Integration (DSI) substitutes DSM in the restructured environment, with DR categorized as a subset. Integrated Demand Response (IDR) combines multiple energy sources, enhancing economic efficiency, energy security, and extracting potential sources for DR [
17,
18].
However, the literature shows that the potential of DR in industry is not fully exploited [
19]. Shoreh et al. identified two barriers to the widespread use of DR in industry [
20]. The first problem is industry-specific: unlike the residential and commercial sectors, energy consumption in manufacturing companies varies significantly due to their use of a wide range of machinery and equipment. In order to implement DR effectively, it is necessary to have a model that captures the physical characteristics of all equipment in the system. However, accurately modeling an industrial facility is not easy; in addition to managing the energy subsystem, raw materials, semi-finished products, and production aids must be taken into account. A second problem is the need to guarantee the planned volume and structure of production: DR can, after all, cause production losses or cost increases because production has to be shifted in time. To solve these problems, solutions have to be found to avoid complex modeling while maintaining production levels and minimizing energy costs; for this purpose, classical operational research methods or methods based on artificial intelligence are used [
19]. Successful implementation of DR programs requires a number of actions, including developing appropriate load forecasting methods, developing pro-efficiency tariff rates, selecting appropriate participating customers, and developing customer-side energy management algorithms. In all of these activities, various artificial intelligence (AI) methods can be helpful, as has been particularly evident in recent years [
21]. The authors particularly highlight the importance and possibilities of AI in forecasting, production planning and scheduling, incentive program development, tariff design, and customer classification.
The problems associated with the implementation of DR in the EIIs are considered by E. Lee et al. [
22]. The authors note that the use of DR elements for each type of industrial load must be preceded by an analysis of the load characteristics (such as periodicity or load patterns, which can be different for different processes). At the same time, they state that no studies have yet evaluated the potential of DR based on the results of industrial load data analysis. Therefore, they proposed a new method for estimating and evaluating DR potential flexibility based on the data analysis results of industrial load resources. The analysis, carried out using two cement plants as an example, showed that it is possible to reduce a load by more than half of the usual power consumption.
Finally, current DR programs can be divided into two groups: incentive and price-based. The capacity charge mechanism discussed in this publication, which is used in the Polish market, is a type of incentive program in which customers are encouraged to flexibly manage their loads in order to balance their energy consumption schedules. Thus, both customers and energy companies can benefit from the implementation of DR in the form of reduced energy consumption and generation costs.
1.4. Scope of This Work
This work addresses the needs identified through a literature analysis and structured interviews with subject matter experts. The primary research objective is to test a new approach to capacity charge management in the EII sector. Unlike the currently available methods which do not meet the needs of the users, the proposed approach relies on capacity charge forecasting and a continuous analysis of the energy consumption profile, as well as providing real-time feedback to the O&M staff to guide their decisions.
This study is conducted according to the rules of the capacity market in Poland and describes pilot tests of a software platform relying on the proposed approach to mitigate the capacity charge. The tested system hints at how the characteristics of energy consumption can be changed during the production process to reduce the energy costs. Predictive models are used to forecast the energy consumption profile of the production facility based on the previously observed patterns. Subsequently, actions for capacity charge management are proposed. It is then left at the operator’s discretion as to which actions should be taken at the facility. Over the duration of the settlement period, decisions of the plant personnel and the resulting changes to the energy consumption profile are used to continuously update the forecasted fees.
The creation of a commercially viable tool to aid production management while decreasing energy costs is a projected long-term outcome of this research study. Such a solution will aid the implementation of the EU and national masterplans for climate neutrality, the so-called “Green Deal”, for the EIIs [
23]. It will also respond to the growing energy prosumer sector among the EIIs, which results in the need for the integration of innovative energy management tools with the existing production processes [
24,
25]. Finally, it will be helpful to both the users and to the electricity providers, as both sides can benefit from better capacity charge management.
2. Materials and Methods
2.1. Capacity Charge Management
The capacity charge is calculated for each settlement period as a rate applied to the volume of electricity drawn from the grid during the qualifying time window. Settlement periods for the industrial customers were initially monthly, and since January 2023, they have been changed to 10-day intervals. According to the regulations, the qualifying time window for each settlement period falls on weekdays, from 7 AM till 10 PM, excluding bank holidays. The rate of the capacity charge for the end customers is calculated based on the electricity drawn from the grid during the time window
Zk, expressed as cost per MWh used over the settlement period [
10]. It is then recalculated into a total fee by factoring in a coefficient
A derived from the electricity consumption characteristics and the unit cost
SOM, according to Equation (1).
where:
WOM—the final cost of the capacity charge charged to the end user for the given settlement period.
A—the capacity charge factor, contingent on the capacity charge benchmark ∆s.
Zk—the volume of electricity drawn from the grid and consumed within the qualifying window of the given settlement period.
SOM—the base unit rate of the capacity charge, imposed by the regulatory authority.
Coefficient
A was introduced in September 2021. An amendment to the Capacity Market Act from 23 July 2021 established four customer groups, denoted with the codes
K1 to
K4, differentiated by the value of the coefficient
A applied to their capacity charge. Customers are assigned to the groups based on an analysis of their demand profile over the settlement period to incentivize certain customer behaviors. To assign a customer to a group, the average energy consumption for each hour of the settlement period is calculated. These values are then averaged over the entire settlement period according to Equation (2) to calculate ∆
s. This parameter benchmarks the difference in average electricity consumption within and outside the capacity charge window.
where:
∆s—the difference between the average consumption of electrical energy within the window and outside the window over a given settlement period.
n—the hour falling within the qualifying window during a settlement period.
N—the total number of hours within the qualifying window over a settlement period.
m—the hour falling outside the qualifying window during a settlement period.
M—the total number of hours outside the qualifying window over a settlement period.
ZSn—the volume of electrical energy drawn from the grid or delivered through a direct line and consumed by the end consumer every hour n, expressed in MWh, rounded to three decimal places.
ZPSm—the volume of electrical energy drawn from the grid or delivered through a direct line and consumed by the end consumer every hour m, expressed in MWh, rounded to three decimal places.
The resulting parameter ∆
s for the analyzed settlement period is then used to be assigned to the coefficient
A. An example of the calculation for each group of customers is provided in
Table 1 below.
Based on the provided information, the purpose of introducing the capacity charge is to incentivize customers to shift their energy consumption outside the qualifying window and to establish more consistent demand characteristics. Both strategies lead to lowering the cost of the capacity charge—decreasing demand in the capacity charge qualifying window lowers ZK and preventing peak loads lowers A (through lowering ∆s and moving the user to a less costly group). The latter strategy is especially attractive. The existence of different user groups allows for the management of the cost of the capacity charge without major readjustments to the production plan, which would be associated with shifting demand outside of the qualifying window. However, it presents a major challenge due to the short 10-day settlement period. A short settlement period requires taking quick and accurate actions, in which a predictive software can outperform a human operator. This will be even more pronounced starting in 2025, when the settlement period will be further shortened to only one day.
2.2. Test Site and Equipment
The platform was pilot tested in the period from January 2022 to September 2023 at a large production facility located in southern Poland. It experiences an annual electricity consumption exceeding 30,000 MWh and is characterized by the high contribution of the electricity cost to the overall expenses. The electricity consumption corresponded to more than EUR 3.3 million in accrued costs in the reference year 2021. The baseline capacity fee constituted 8% of these costs, thus being among the main components of the electricity distribution costs. Electricity is supplied to the test facility over two 110 kV power lines and converted using 115 kV/6.3 kV and 110 kV/6 kV transformers. On-site measurements for the purpose of this study were performed using E650 series 3 electricity meters made by Landis+Gyr, and distributed in Poland by Landis+Gyr Sp. z o.o., specifically the ZMD405CT44—a combination meter designed for semi-direct and indirect measurements of active and reactive power consumed and released in a three-phase, four-wire network. The meter has an internal real-time clock, an energy and power recorder, a maximum power indicator, and a load profile and network analysis. Data can be accessed using the MAP110 program. Although the instrument is capable of a wide range of measurements, the load profile analysis does not allow for the calculation of the specific components of the tariff, so this piece of information for the past billing periods is calculated by the tested software based on the historical data logs of the facility.
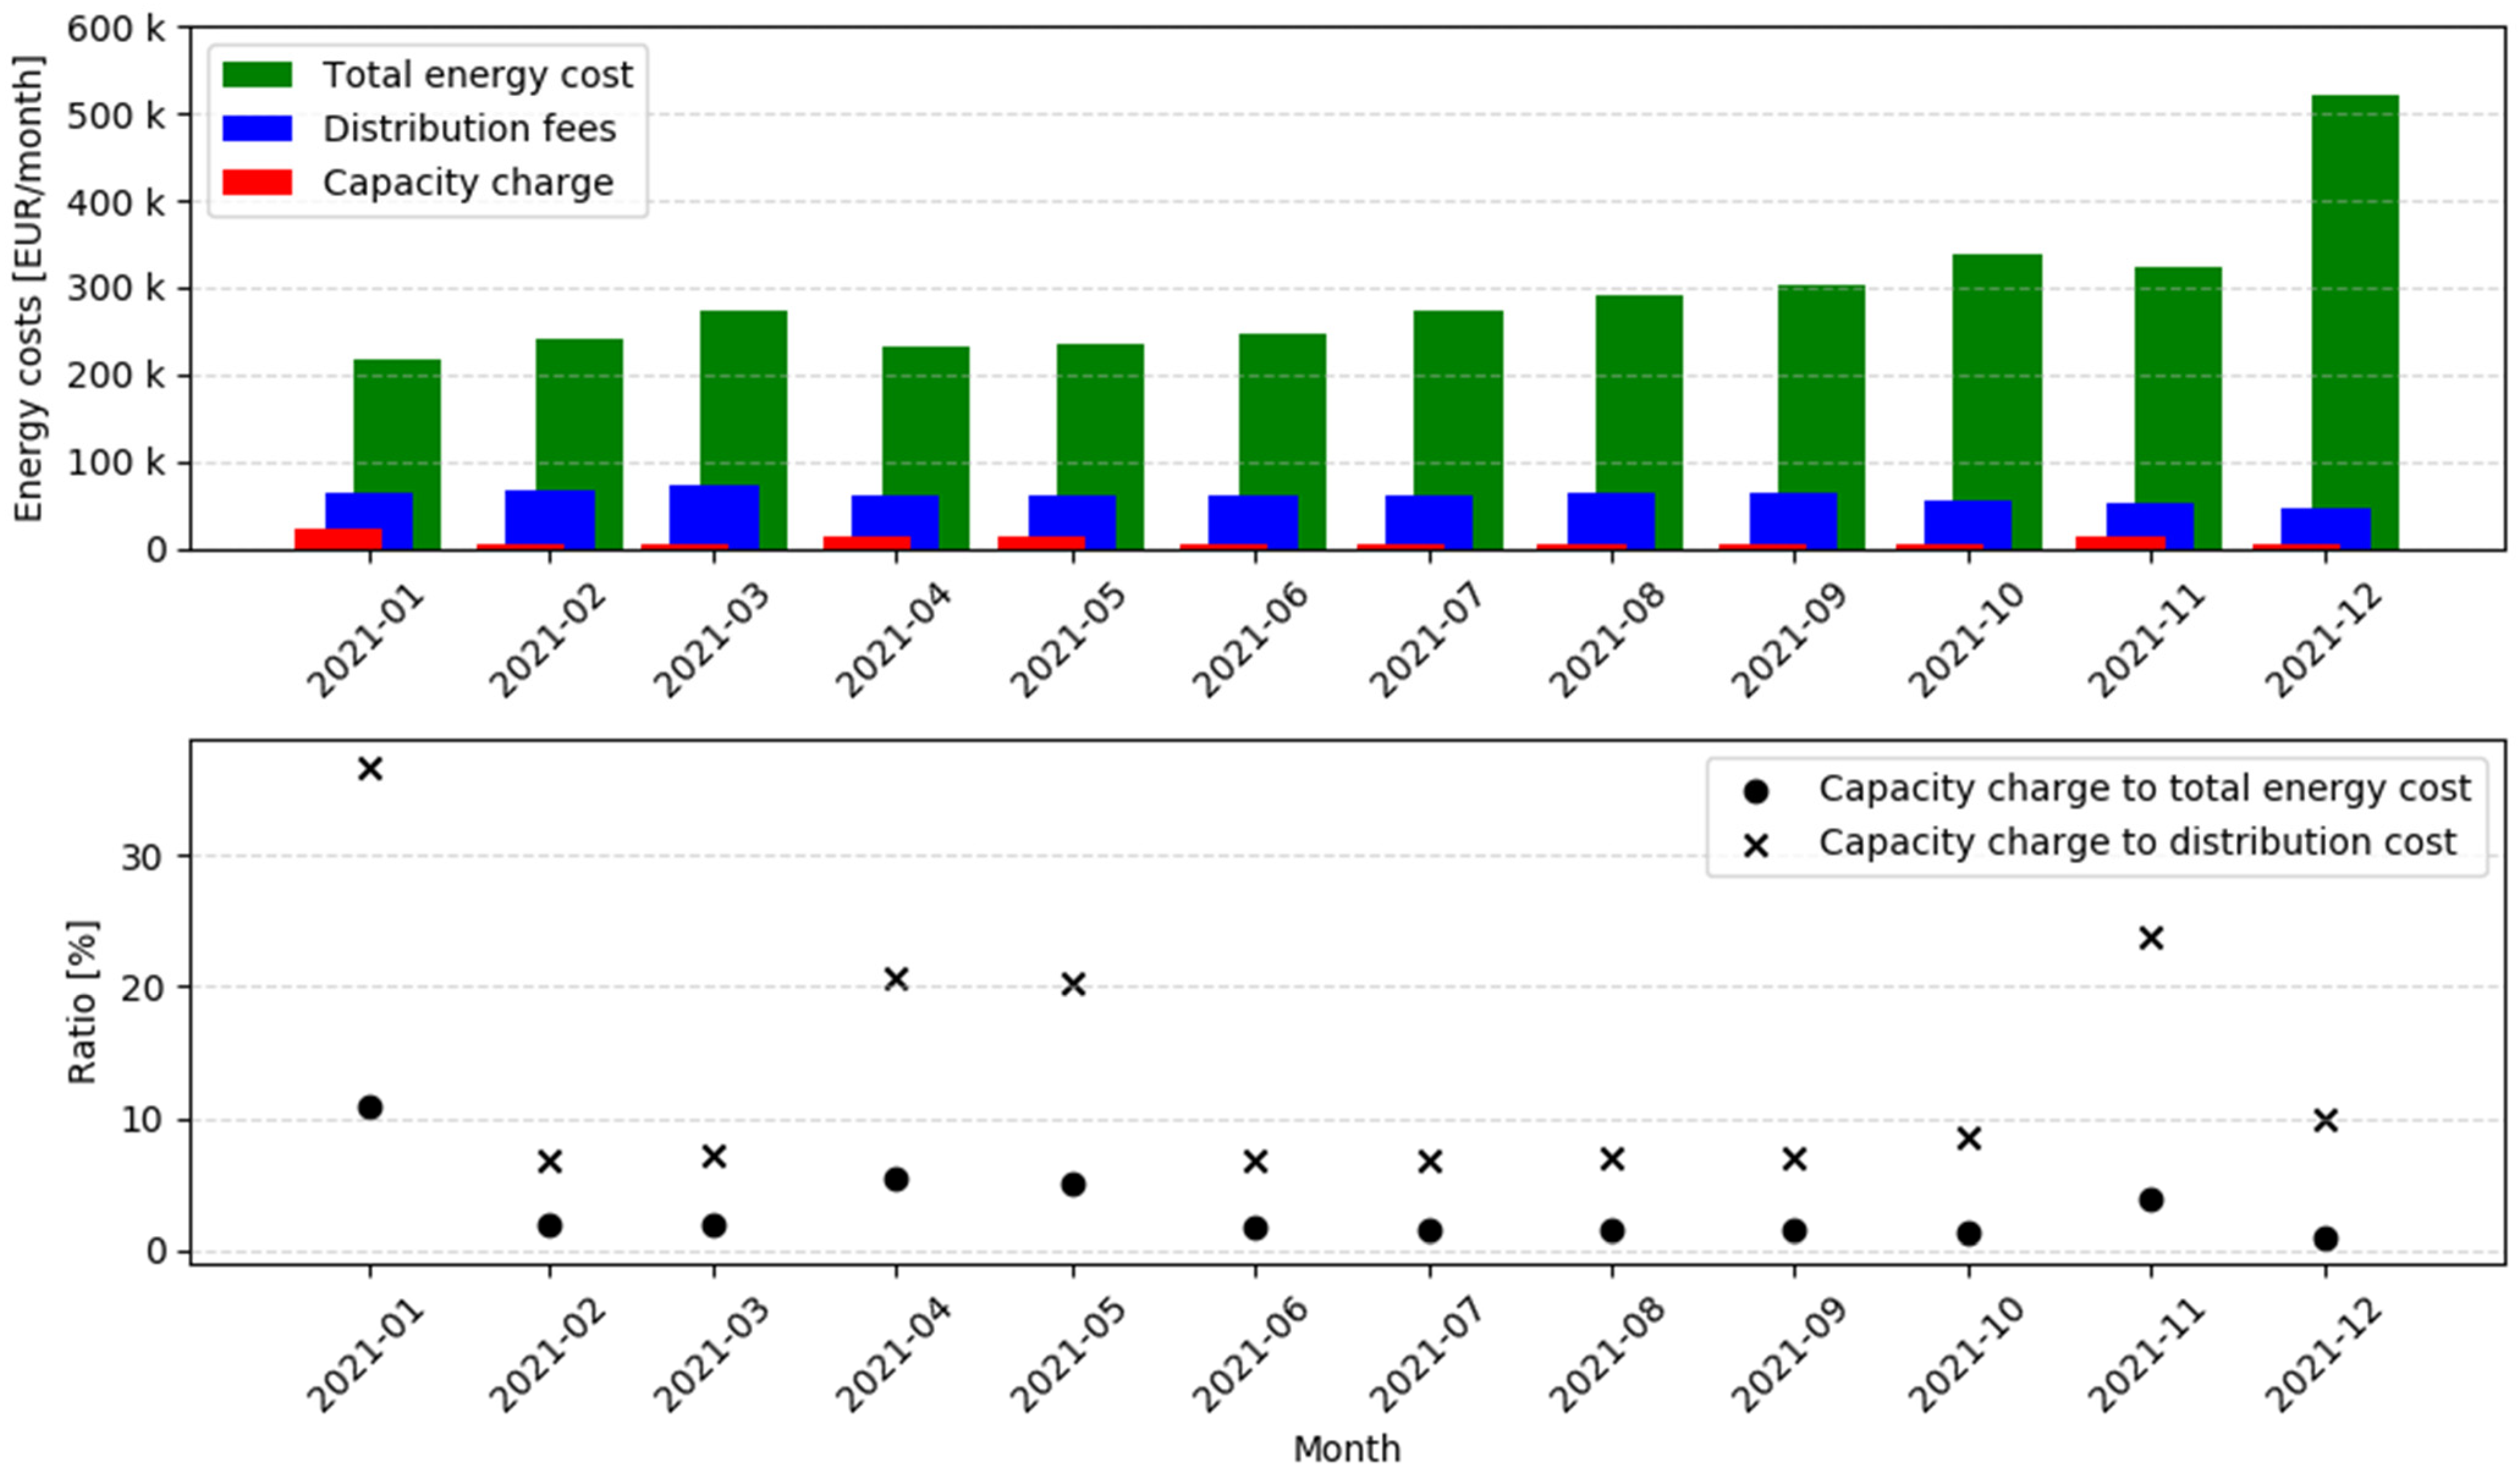
In the specific case of this facility, electricity bills account for more than 6% of the total value of the produced goods. Due to the high electricity demand and the corresponding costs, this site provides a good platform for practical validation of the tested tool, which could then be implemented at other production facilities which share similar characteristics. The monthly power consumption profile of the plant is shown in
Figure 1. In 2021, the capacity charge was first implemented in Poland, so no data on the costs of this part of the tariff exist for the periods prior to January 2021. Nevertheless, it was right away obvious that this new fee would become a significant burden on the plant, when in the first month of the year, it was already accounting for 11% of the total energy cost. This led to an expedited effort toward managing it.
2.3. Software Functionality
The tested software is a cloud platform comprised of a simulation tool, a data acquisition module, and a user interface. It is suited to communicating directly with the database storing the processed information through SQL queries for a broad spectrum of applications, without relying on compatibility with the metering equipment. Either two-way or one-way communication is possible, depending on the established IT security policy.
A key functionality of the system is the real-time calculation of indicators and coefficients of the capacity charge, carried out in accordance with the Capacity Market Act, and displaying them to the user together with a recommendation for a corrective action. The platform relies on a simple approach to capacity charge forecasting. It predicts the final value of the capacity charge at the end of the current settlement period, under the assumption that the plant’s operations in the following days will follow its standard production schedules and standard line occupancy. For a given settlement period, the tool calculates the current ∆
s for the present day and the estimated ∆
s at the end of the period, based on the energy consumption prediction. The user receives information on how to shift consumption to achieve the lowest capacity charge rate at the end of the billing period. They also receive information about the remaining consumption amount available for different periods of the day (qualifying and non-qualifying), which allows the facility to remain within the current range of the capacity charge index.
Appendix A provides a step-by-step analysis of this calculation, as well as the predictions for sample settlement periods.
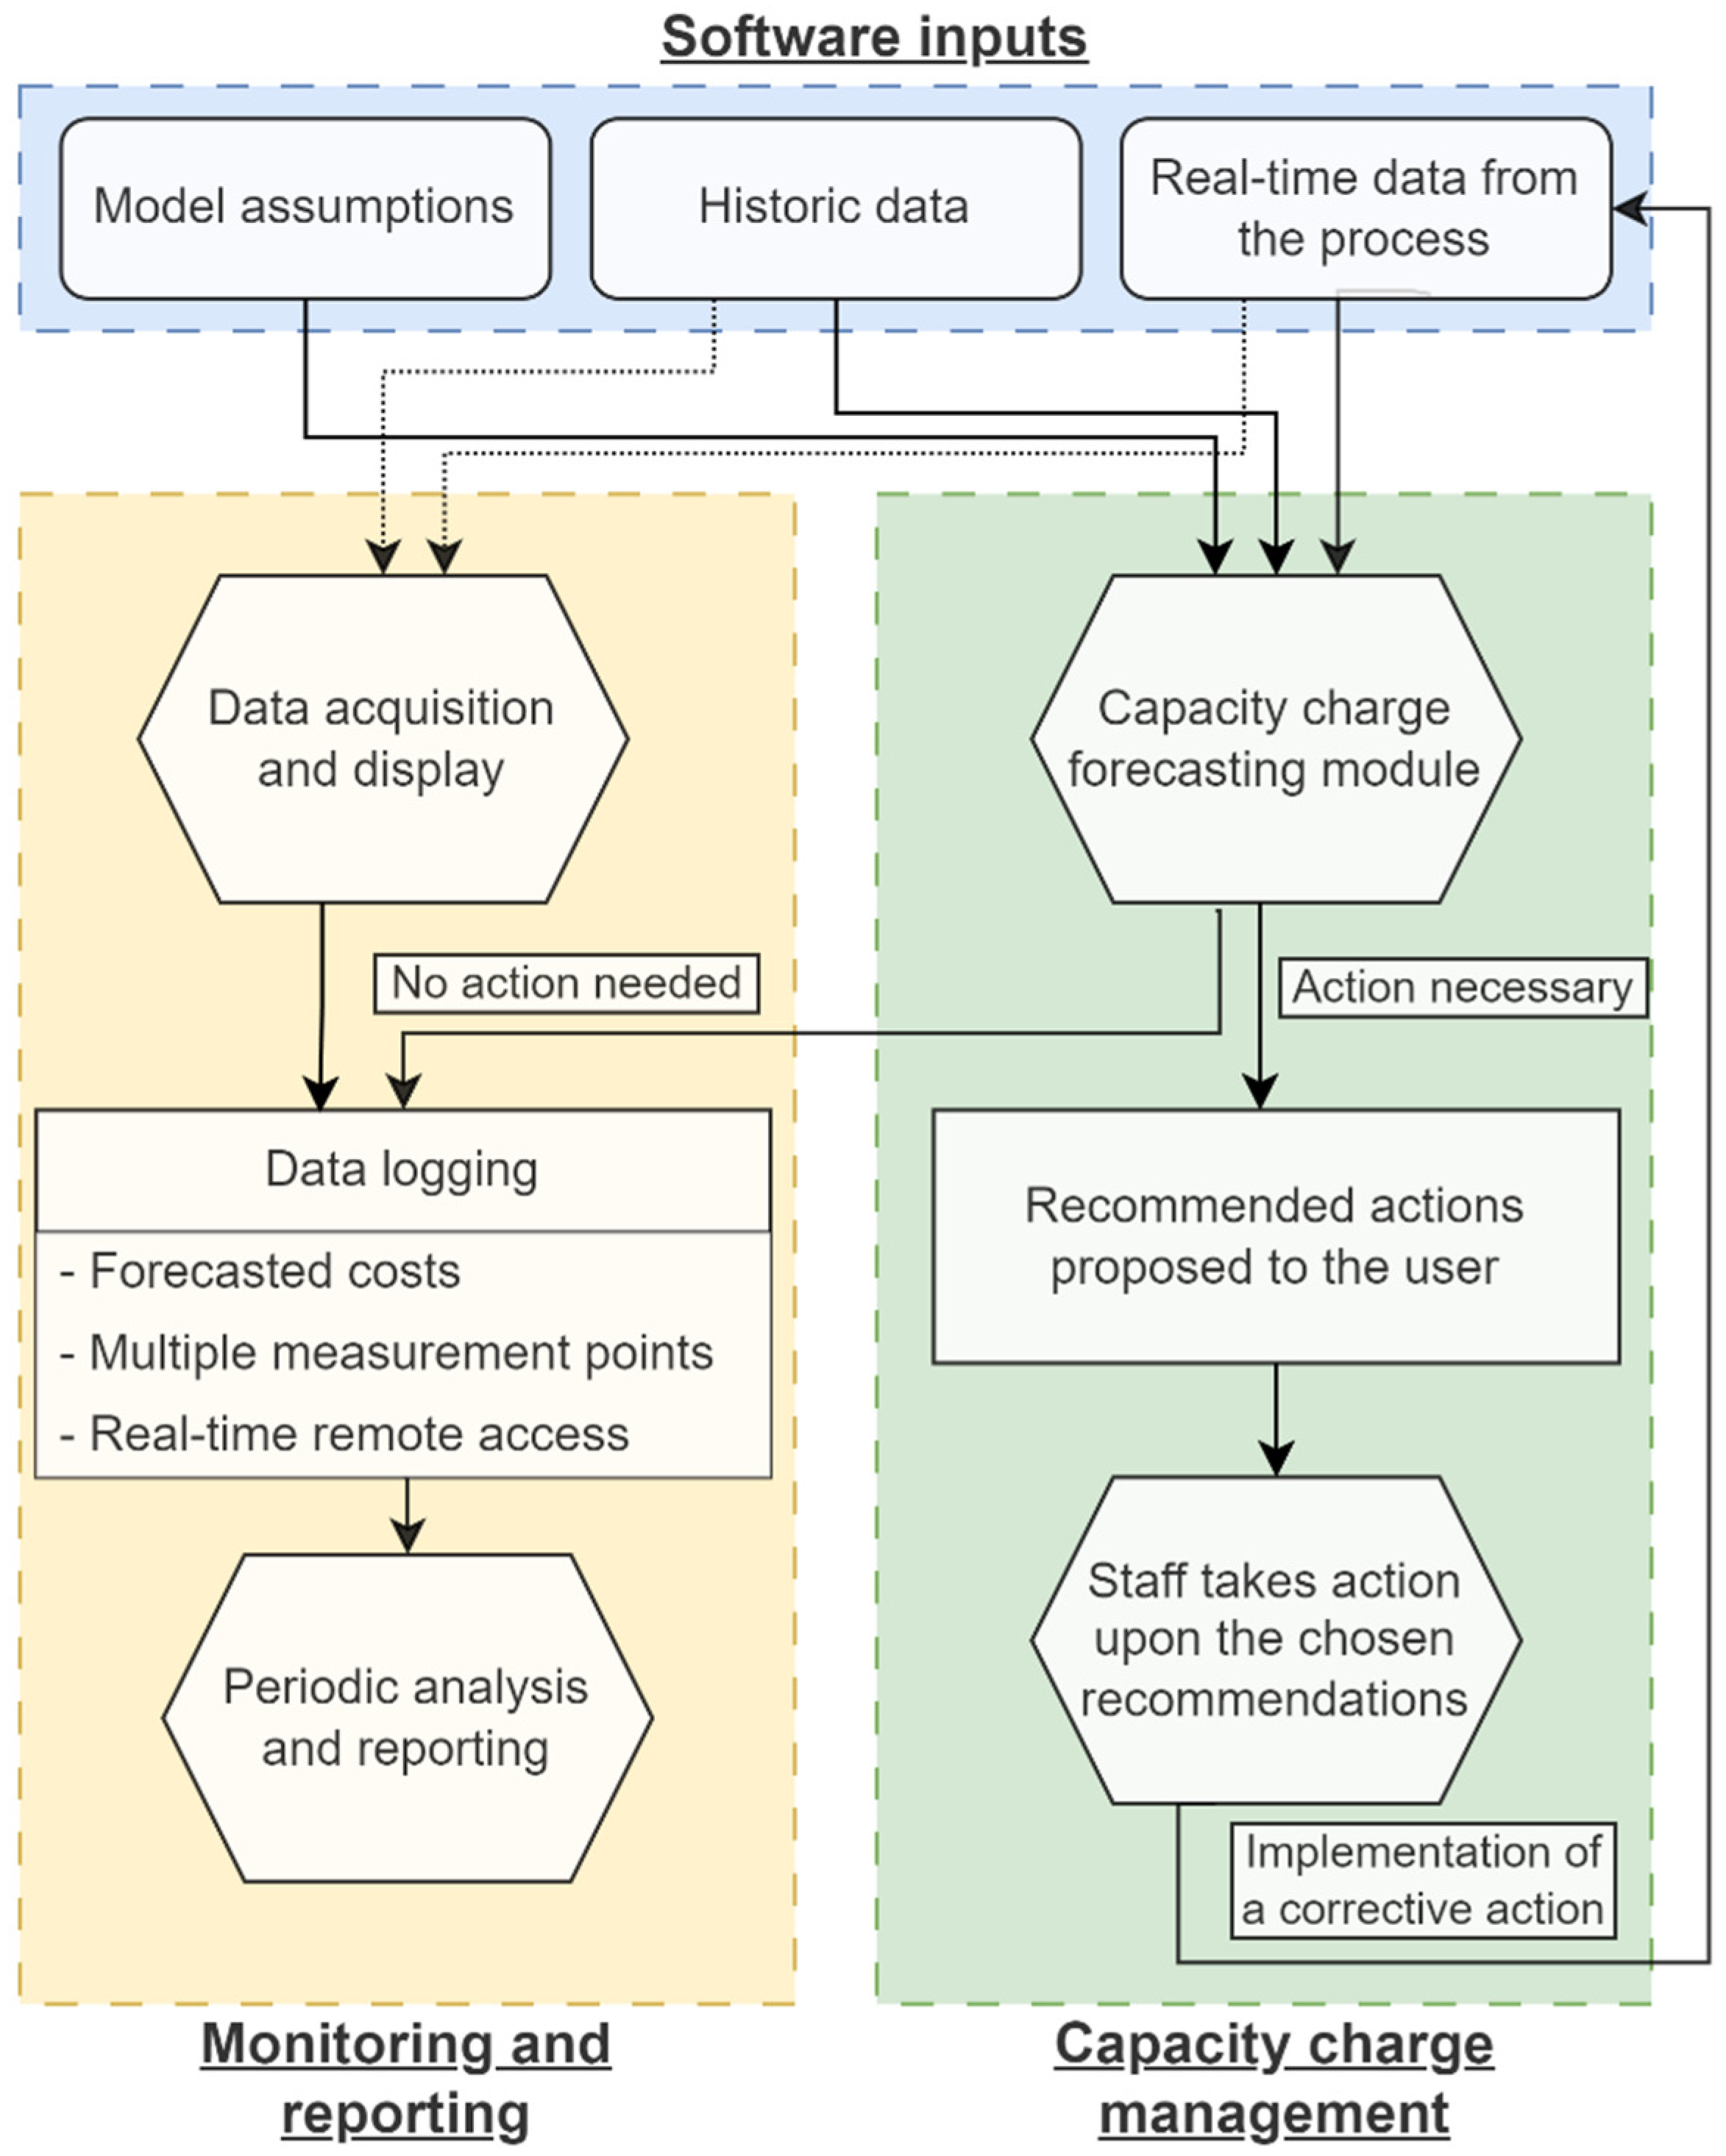
When considering standard conditions, the model primarily analyzes the day of the week, proximity to holidays, the current month, and the plant’s operational characteristics in recent weeks. The model combined with the functionality to simulate the plant’s electricity consumption for different periods of the day allows for real-time management of the capacity charge. Users can simulate changes in the load on specific lines powering the production facility and can assess the impact of potential changes on the final capacity charge coefficient. Based on the forecasts, the software provides real-time recommendations to the users on how to minimize the costs of the capacity charge in the current settlement period, making the system a powerful tool for supporting production management. It also serves as a monitoring tool. Through constant monitoring and real-time calculations, this information is readily available to the users, providing them with an immediate response to current events. A schematic diagram of the platform is shown in
Figure 2.
2.4. Modifications Made to the Test Setup
The project was conducted over a period of almost three years. The reference period started in January 2021 and lasted 12 months. The actual pilot tests took 21 months, from January 2022 until September 2023. Due to the nature of the extensive pilot test campaign conducted on the premises of the operating factory, various elements of the test setup changed throughout the duration of the study. These changes were the combined result of an organic approach to the development of the project, mainly relying on comments and insights from users, as well as changes happening in the legislative environment. Four main changes happened during the duration of the project, including the following:
Constant changes related to the legislative environment were influencing the test system. Throughout the pre-test reference period in 2021, the users were not divided into groups which would allow for the management and optimization of the capacity charge. Coefficient A was fixed at 1, meaning that at that time, it was a fee only dependent on the energy consumption, not affected by the consumption patterns. This changed in the current system with four groups of users in September 2021, opening the path for optimizing this parameter. Although this change happened before the start of the pilot tests and had no practical influence on the presented results, it is important to include when analyzing the user’s incentives which were mainly driven by the costs of the capacity charge prior to the beginning of the tests.
An increasing base price of the capacity charge is another change affecting the test conditions. This complicates projections of savings, as they can be calculated using two different methods—either by assuming the actual price from the reference period or by projecting the current prices onto the historical data for the capacity charge coefficient. The results of both approaches will be presented, as well as the raw capacity charge coefficient data, which represent the core parameter depicting the performance of the analyzed tool.
The duration of the settlement periods changed during the experiments. Initially, coefficient A was calculated for one-month settlement periods. However, starting in January 2023, the settlement frequency changed from monthly to every 10 days. This is represented in the reported data by the change in the time-vector sampling frequency. However, to allow for a convenient representation of the cumulative parameters such as the accrued costs, a monthly reporting period is calculated and provided as well.
The learning curve had a clear impact on the results, as the described project was a constant learning experience for both the R&D team and the personnel of the test site. Prompt responses to questions and requests from the management and the O&M staff turned out to be vital for building trust and confidence in the new tool. These insights resulted in various modifications to the tested tool as well. As a result, significant development efforts both at the backend and at the frontend were particularly impactful during the first couple of months of the pilot test period.
3. Results
3.1. Efficiency of the Tool
For the baseline year 2021, the annual cost of the capacity charge in the facility exceeded EUR 260,000. This value was calculated for the historically low unit price of 16.57 EUR/MWh present at that time. However, within the period from January 2021 to September 2021, due to the new regulations enforced at that time, both power lines supplying the test facility were subject to a maximum capacity charge coefficient A equal to 1. During the next two months, one of the connections was still recording A = 1, while the other was recording A = 0.17. Finally, in December 2021, both connections recorded A = 0.17. These conditions are treated as a benchmark for the pilot tests.
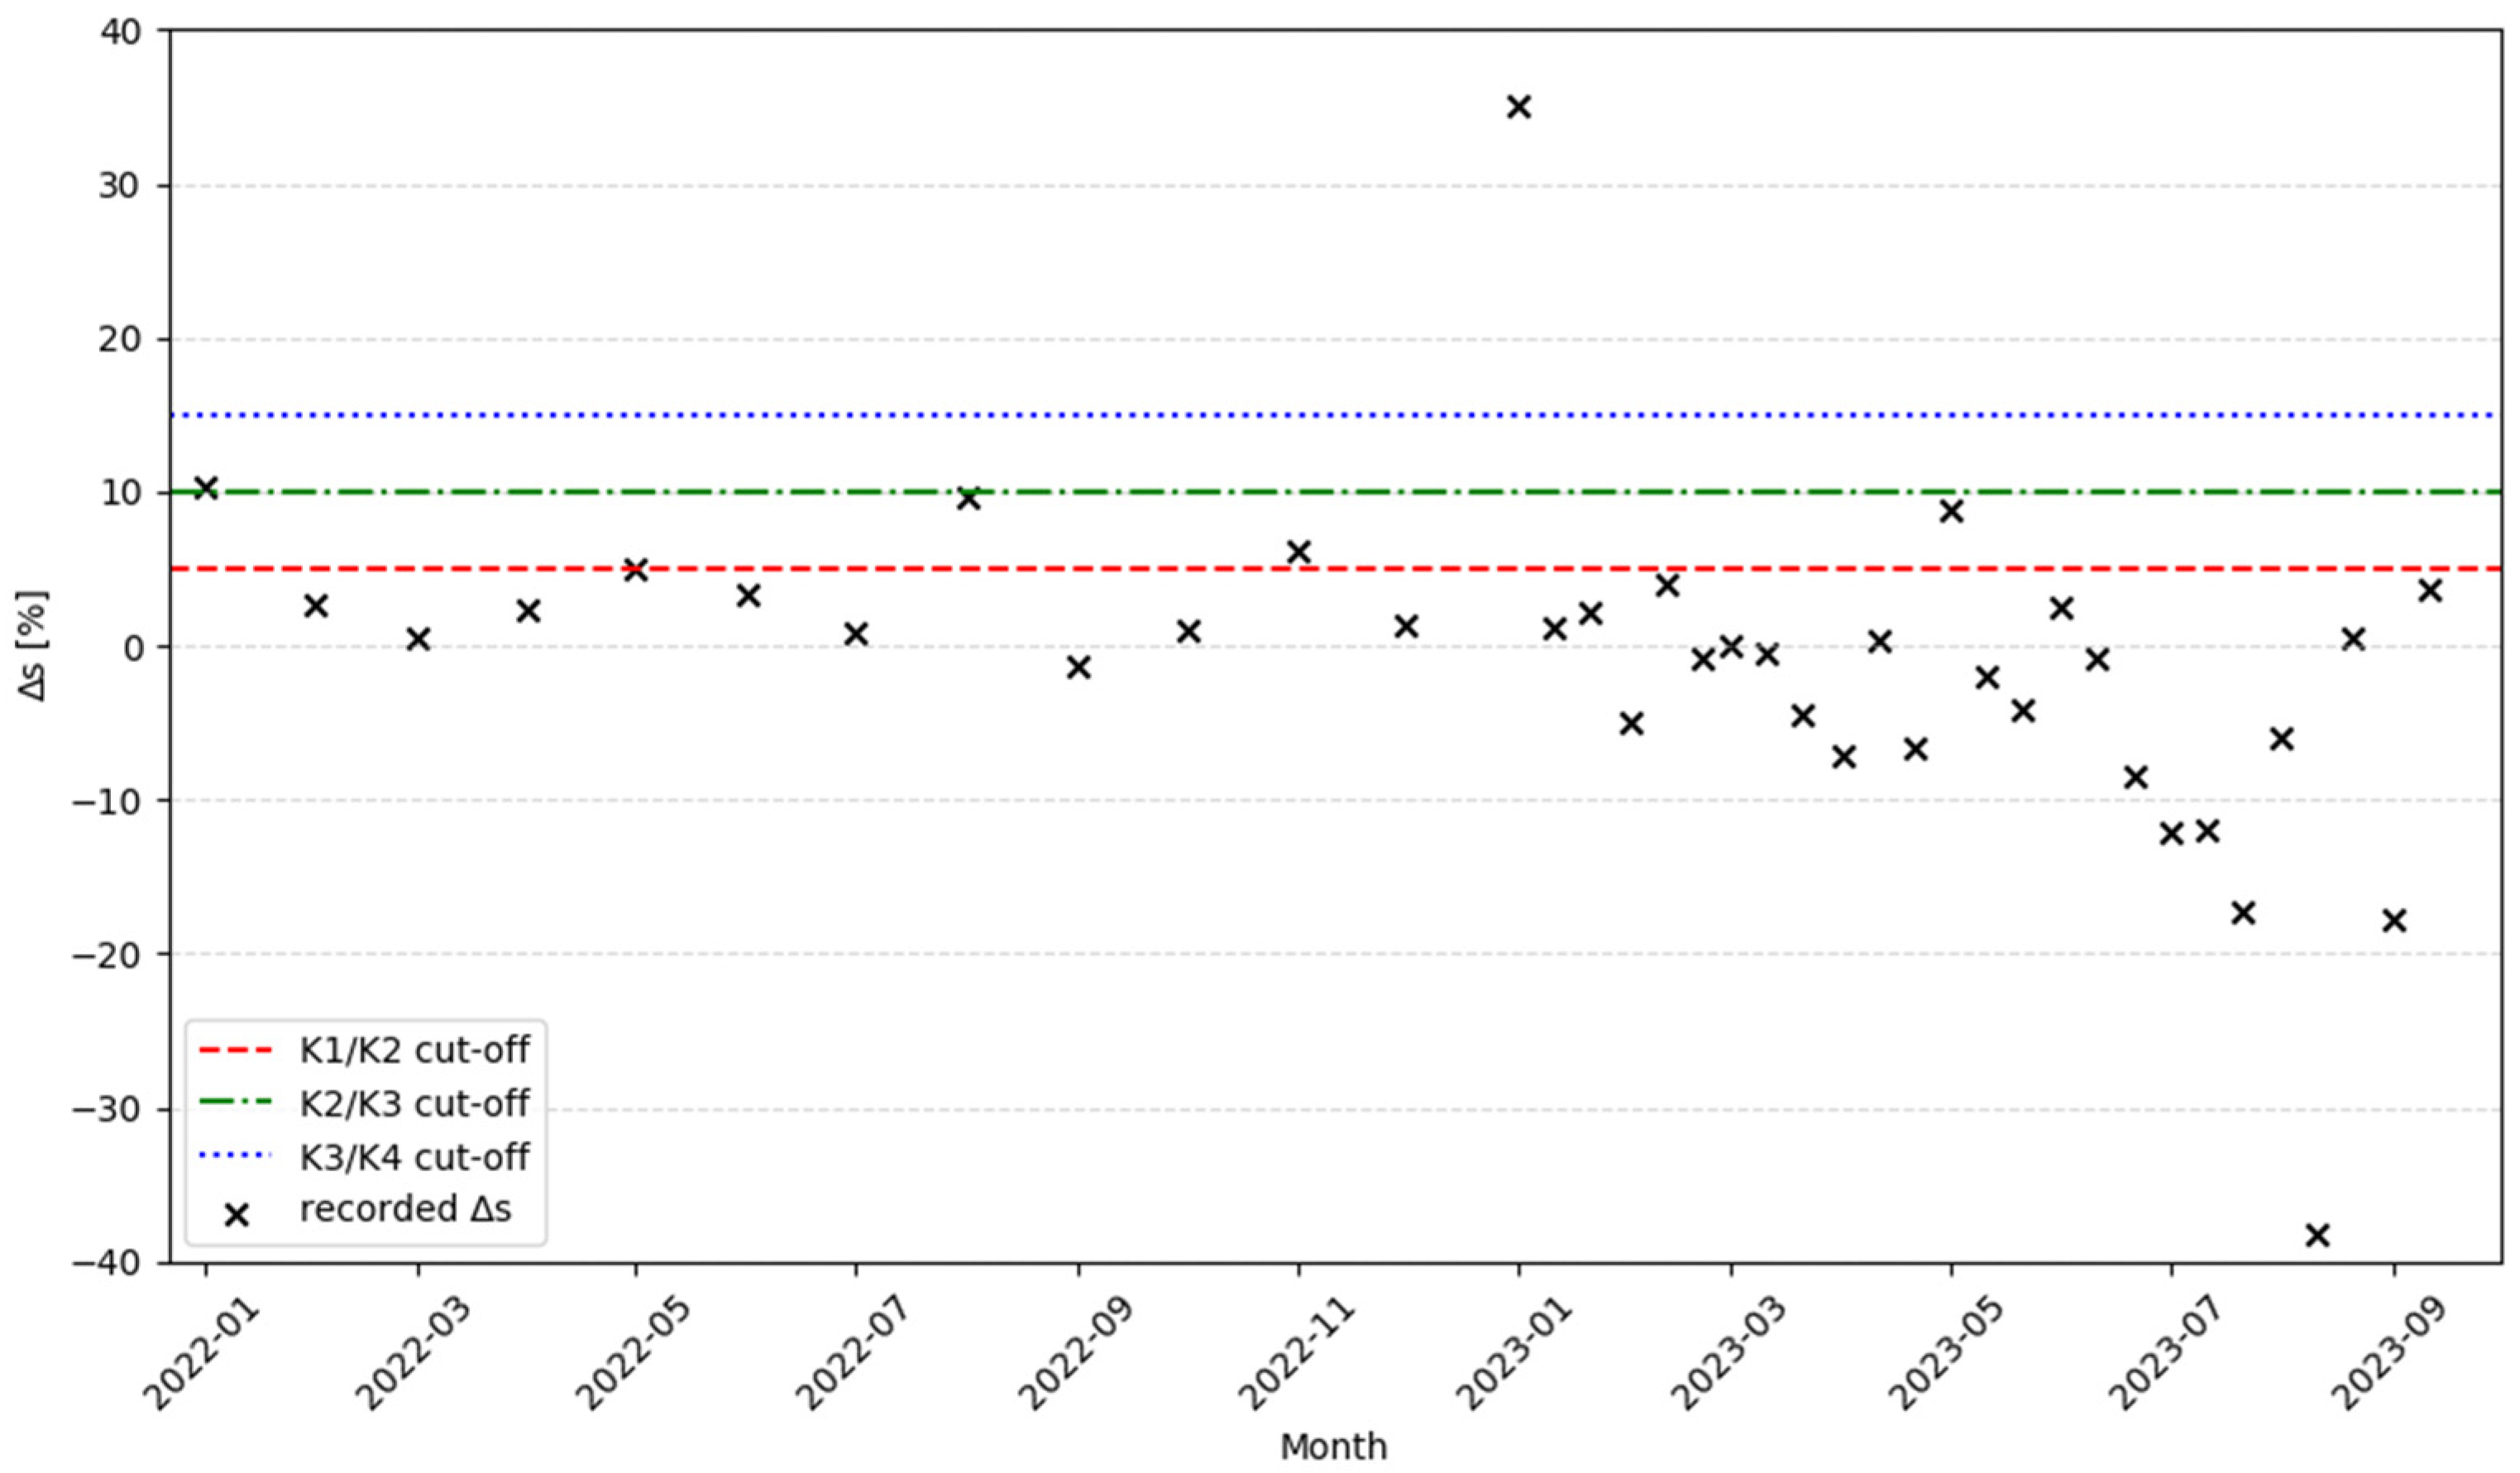
Throughout the year 2022, the O&M staff were still learning how to implement the new tool and thus experienced difficulties associated with using its full potential. The platform itself was also undergoing intensive development, which both factored into the poor performance of the system during the first month of 2022. Overcoming the learning curve and technical problems is visible in the graph showing the historical performance of the tool. During the first 6 months of the pilot tests (January–June 2022), the average ∆
s = 4.02%. It was decreasing over the period of the experiments, and during the last 6 months of the test (April–September 2023), the average ∆
s = −7.56%. This improvement was also reflected by qualifying the plant hosting the pilot tests for more favorable customer groups. In 2022, the facility spent 3 months in
K2 and 1 month in the
K3 customer group, which in total accounted for 33% of the year not meeting the requirements for the lowest tariff. In 2023, this improved to 10 days in
K2 and 10 days in
K4, accounting for only 7% of the year not meeting the requirements for the lowest tariff. Changes in ∆
s with the cut-off thresholds for different A values are shown in
Figure 3.
3.2. Impact on Plant Operation
The use of the tool resulted in only one significant change to the organization of the production process. Specifically, in June 2022, a weekly furnace heat-up period was moved to the Sunday night shift to minimize the energy consumption during the Monday morning shift, which was typically experiencing the highest demand during the qualifying window. No other changes to production outside of the capacity charge window were required.
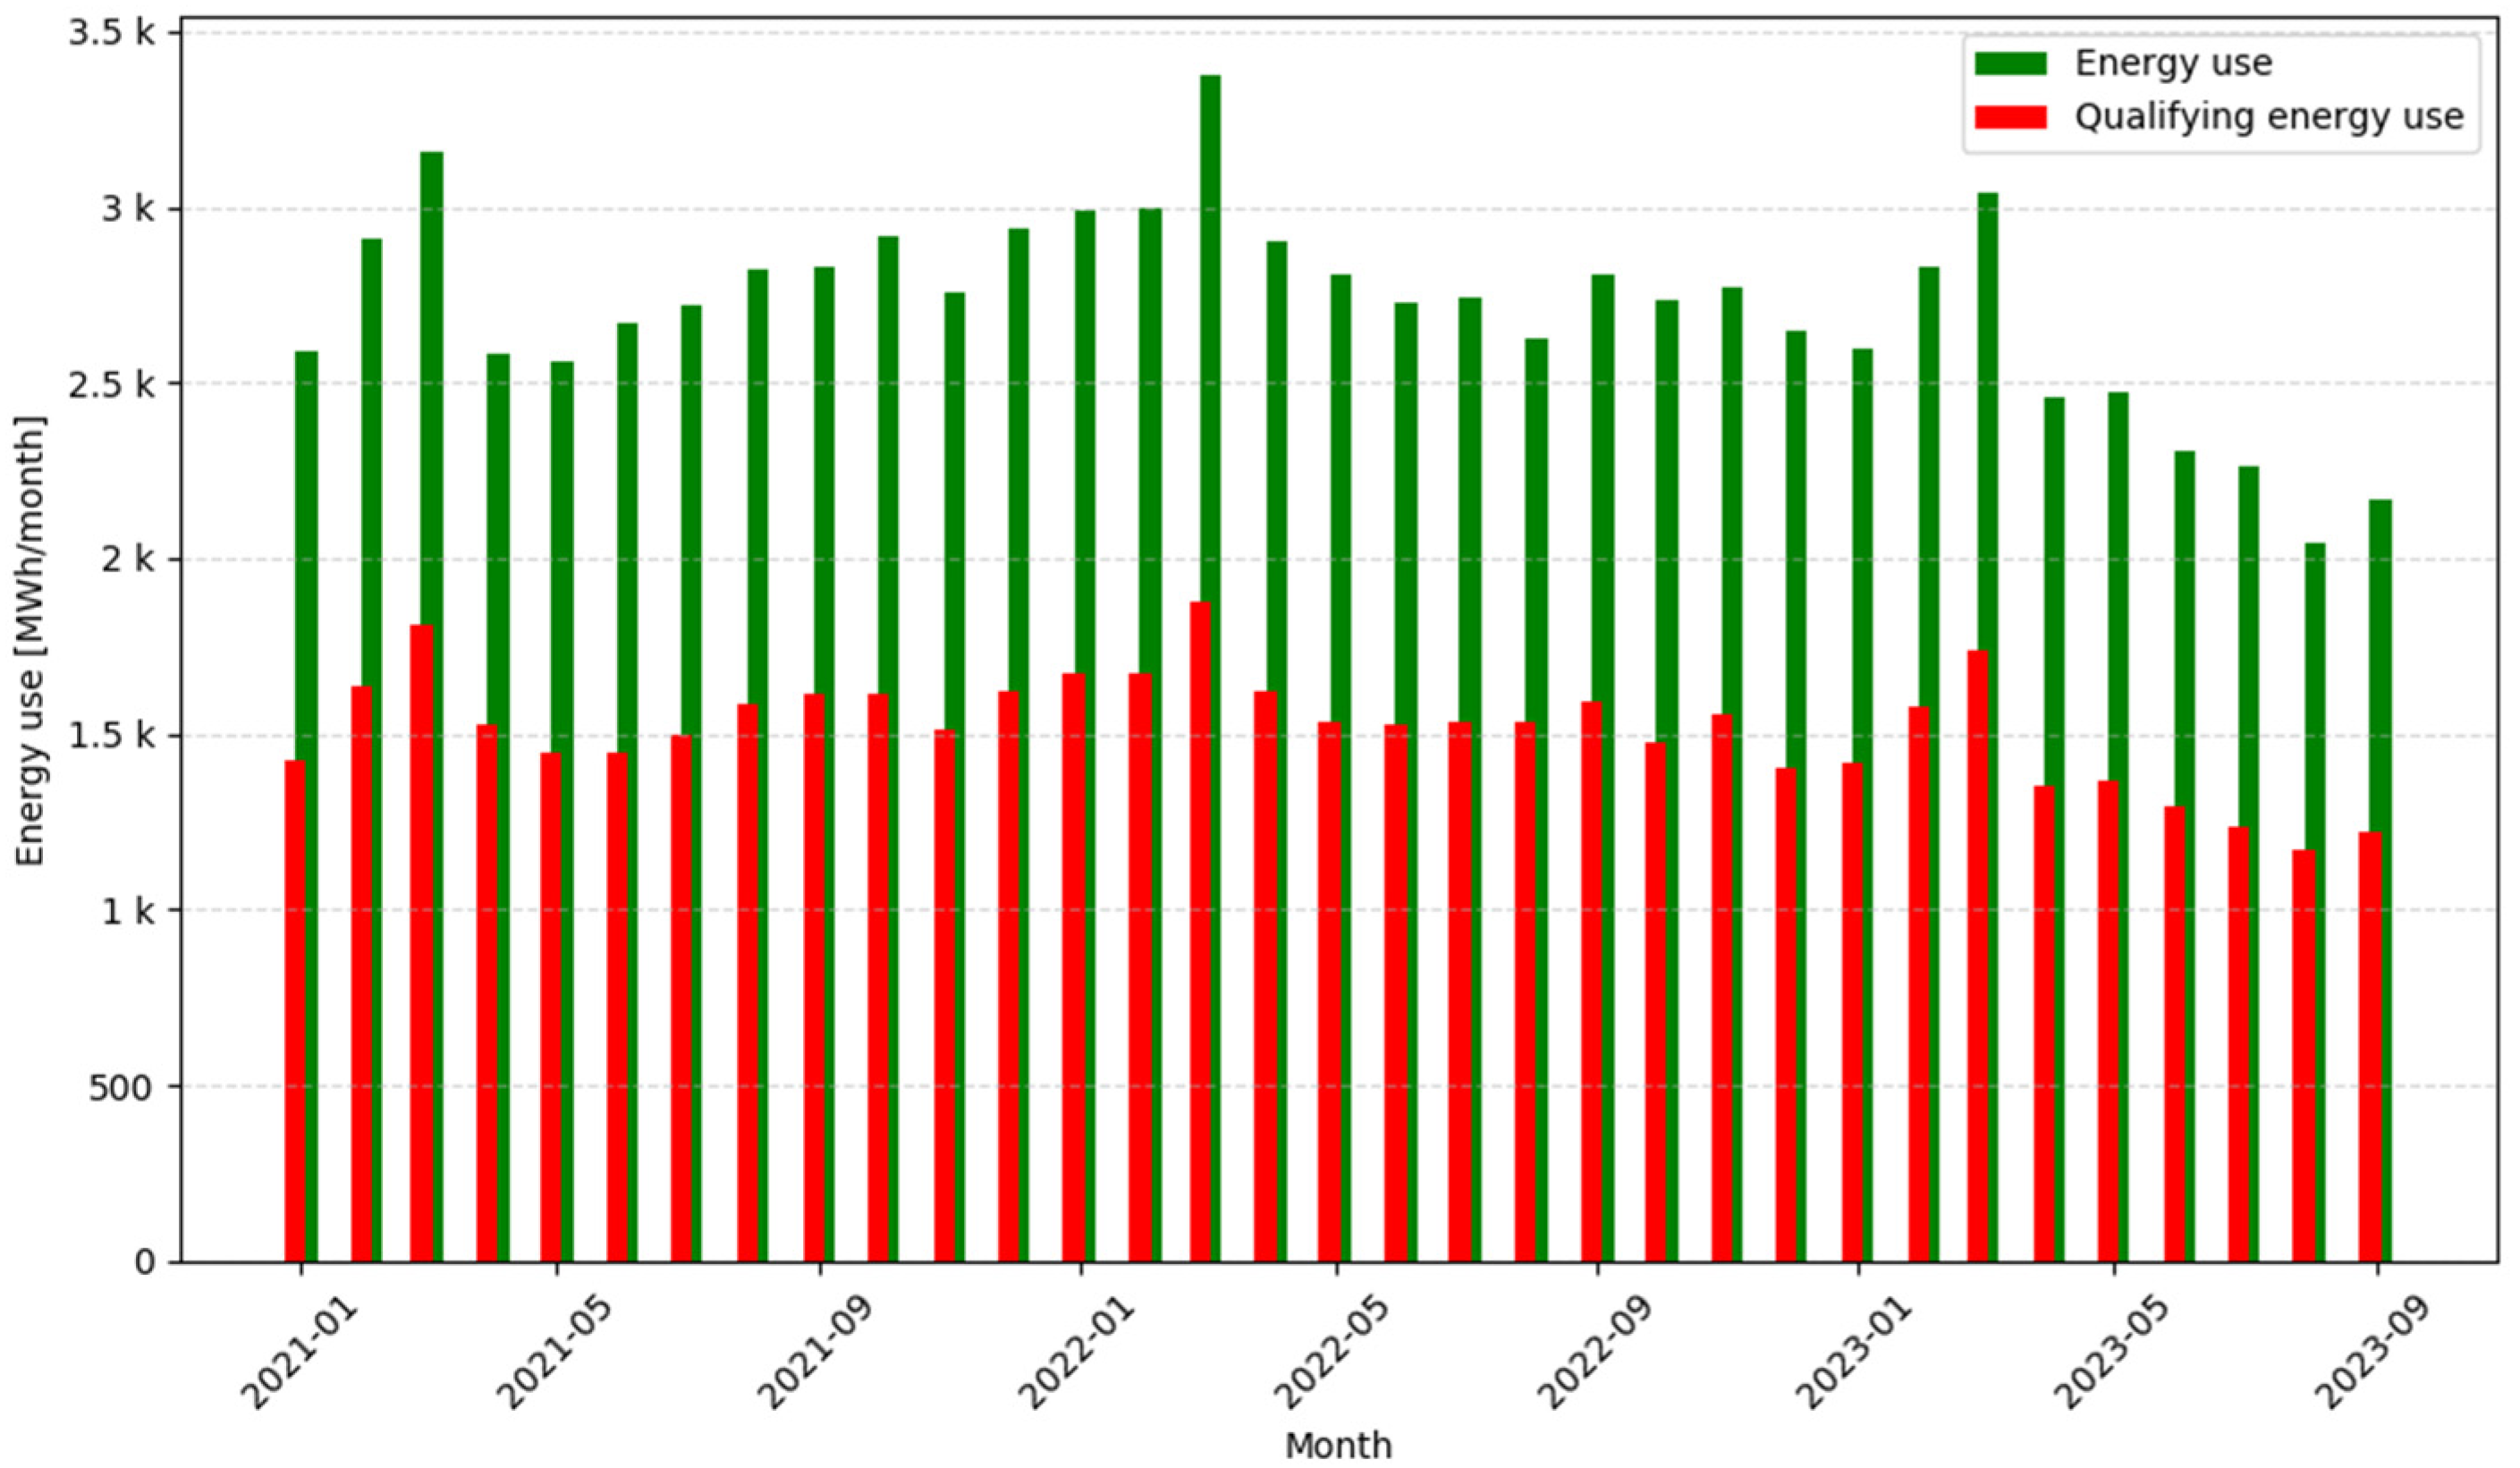
Figure 4 shows that the distribution of the energy consumption within the capacity charge qualifying period and outside of it stayed constant throughout the reference year 2021 and during the experiments in 2022 and 2023. The average percentage of energy used during the capacity charge qualifying windows, calculated for the duration of the entire project, is equal to 55.8%. This is an important consideration for users, as their operation is configured to allocate most of the workload during the weekdays and morning shifts. Potential changes to that pattern would be a major roadblock in the implementation of the platform.
4. Discussion
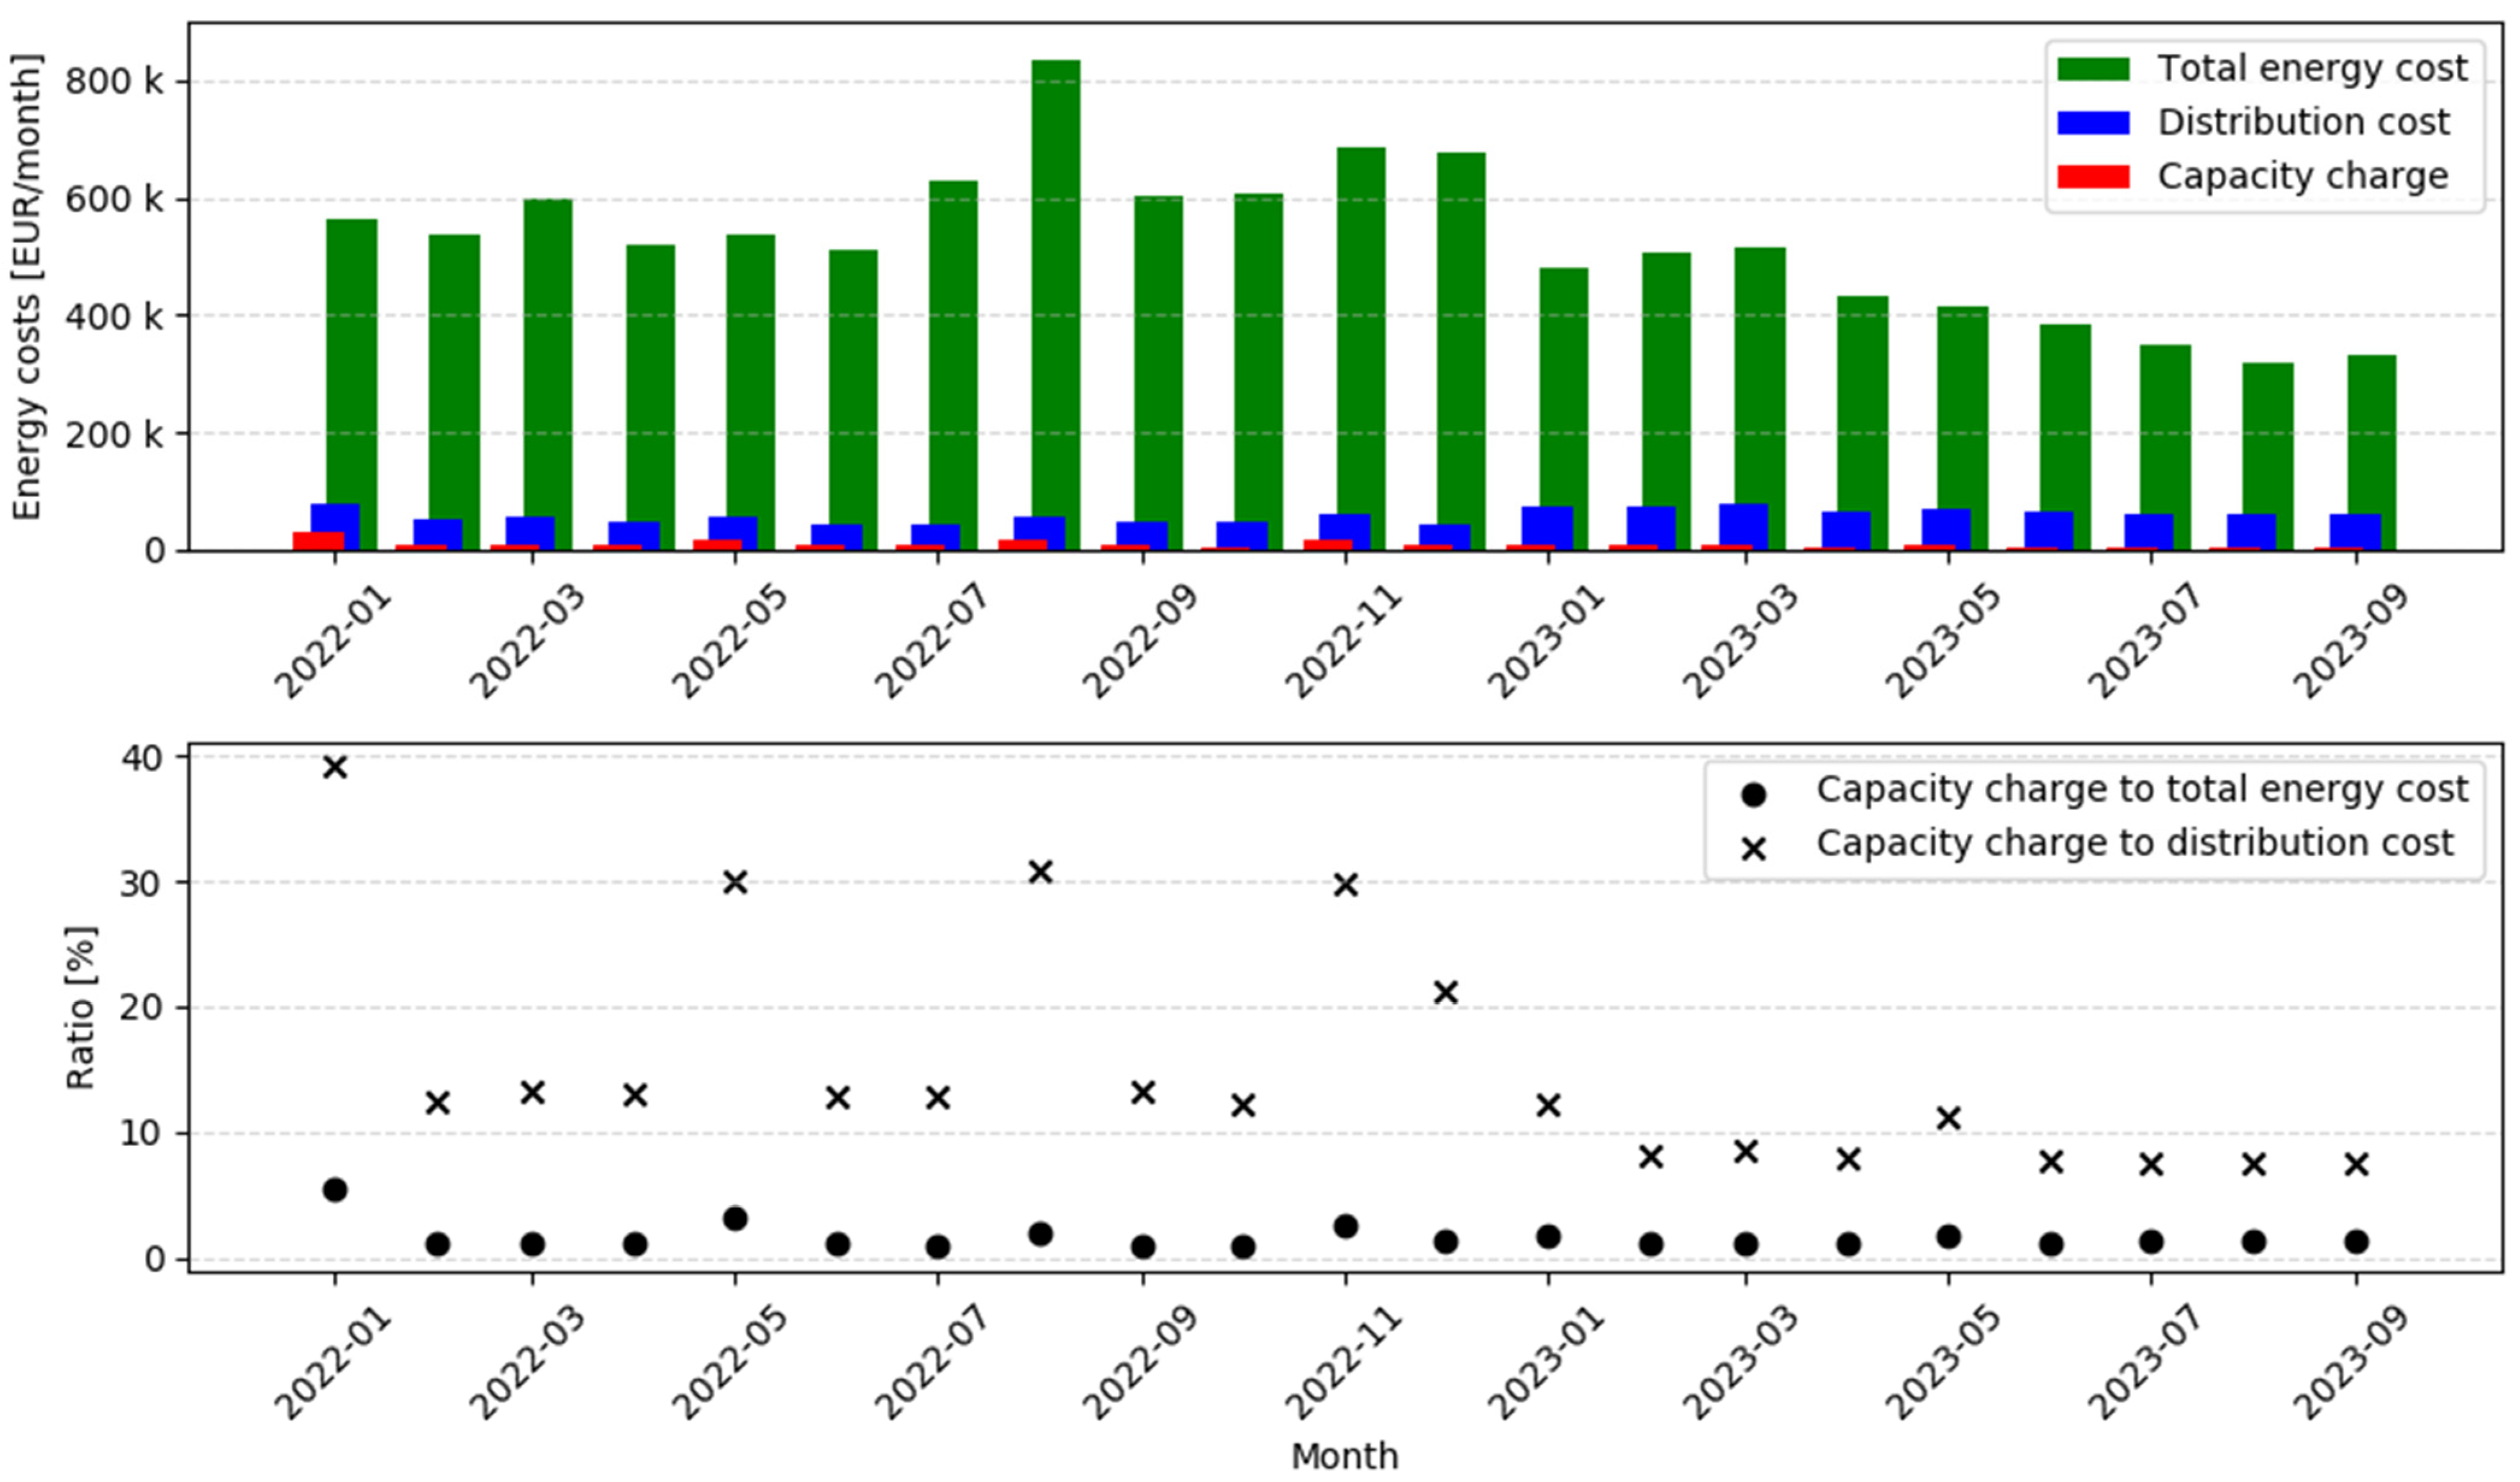
Although the tested tool allowed for a significant improvement in the energy consumption characteristics, it is hard to evaluate it in comparison with any benchmark. A capacity charge was recently introduced to the Polish market and the governing legislation obtained its current form only three months before the beginning of the test period. As such, it should be analyzed in the context of the low unit prices at that time, combined with the regulation imposing the maximum
A coefficient until September 2021. The project started only 3 months after the tariff system was amended by introducing the user groups and was conducted in a facility which was already very well managed. These factors limited the amount of relevant historical data available for comparison. Despite those factors, the capacity charge accounted for an average of 3.13% of the total electricity costs in 2021. In 2022—the first year of the pilot tests—it decreased to 1.84%. Finally, in the period from 1 January to 30 September 2023, it accounted for only 1.41% of the electricity bill. Historical energy cost data available for the test site are provided in
Figure 5.
While analysis of the absolute economic figures is problematic, the actual performance of the tool is better captured by the fact that it significantly exceeded the thresholds set up by the regulators. During the last 6 months of operation, the average capacity charge coefficient ∆s decreased by more than 11 percentage points compared to the first 6 months of the test period. This level of performance guarantees that the fees will remain minimized well into the future, even with the tightening of regulations.
Various events which occurred during the experiments require additional comments. A significant cost of the capacity charge in January 2022, exceeding EUR 30,000, resulted from two main factors. January 2022 was the first month when the users were subjected to an elevated unit capacity charge, which increased from 16.57 EUR/MWh to 22.60 EUR/MWh. On top of that, the production facility experienced extraordinarily high demand for their products in that period, resulting in a higher than usual use of electricity and thus higher resulting costs. This, combined with the increased coefficient A for that month of 0.83, contributed to higher costs. The combination of those factors in the early stage of the test—in the first month, personnel of the facility were still not used to relying on the tested tool—resulted in poor performance recorded for that month. A similar event occurred during the first 10 days of January 2023, when the plant jumped to the K4 user group due to the unusually short operation during the settlement period. In the subsequent settlement periods, this was successfully mitigated and did not affect the financial metrics for the entire month, only being reflected in the coefficient A for the first part of the month.
Overall, the tested software demonstrated high performance in test conditions. The capacity charge benchmark parameter ∆
s plotted in
Figure 3 clearly decreases after the initial phase of the project. This downward trend is further augmented during the rest of the test period, as the plant personnel learn how to use the new tool. This, however, is not the only indicator of the effectiveness of the platform. The operation of the pilot project also resulted in substantial monetary savings for the facility. Although the absolute values are hard to accurately estimate, savings can be expressed in terms of minimizing the fraction of the time in which the facility is moved to a more expensive user group. When analyzing the entire project, the total duration of periods when the plant was in more costly user groups
K2–
K4 decreased by more than four times between 2022 and 2023. Especially in the context of increasing energy prices, the tested platform allowed us to avoid substantial costs, incrementing on a year-to-year basis. Additionally, the tested system is the only tool allowing for real-time observation of how current actions are impacting the tariff component. This translates to a more conscious operation and a better understanding of the facility among the personnel.
Finally, the presented study is a proof-of-concept work, conducted without optimizing the predictive algorithms responsible for capacity charge forecasting. Predictions of the capacity charge were calculated under the assumption of the operation as usual, i.e., following the patterns observed in the past. Their correctness is hard to determine because the staff of the factory acted upon that data in real time in order to mitigate the costs. In that sense, the experimental system is changing continuously based on the results of the generated predictions. It is inherently invalidating the historical predictions, as they are based on the assumption of an as-normal operation, which does not hold when the results are shared with operators in real time and subject to their corrective actions. For example, even if the prediction on day 5 of the month was a substantial capacity charge to be paid, the staff were instructed on how to mitigate that, and it usually was not valid on day 30 of the same month.
5. Conclusions
The proposed approach to the management of the capacity charge has been effective in the stage of pilot tests. The tested tool has had a major impact, decreasing the expenses accrued by the users resulting from the regulatory fees and reducing the benchmark parameter set up to calculate those fees below the minimum threshold established in the legislation. By providing operators with actionable insights and recommendations in real time, the platform enables them to make informed decisions that rationalize energy consumption patterns to minimize costs. One of the key findings from the experiment was the notable decrease in the time span of elevated capacity charges over the period of the tests, almost five-fold between the years 2022 and 2023. It is worth emphasizing that this improvement was achieved without necessitating significant alterations to existing production plans, with customer delivery dates being met. Additionally, although the factory was already close to optimal performance, the tested tool allowed for further reductions in the capacity charge coefficient ∆s. From a broader perspective, this will give room to continuously avoid the fees in the case of future tightening of the regulations.
Further research and development efforts can build upon these findings to enhance the platform’s predictive capabilities and expand its applicability to other industrial settings. In the future, the predictive model integrated with the platform can be extended to include new conditions: the type of plant, its operating profile, and the dependence on external conditions, including, e.g., raw material prices in the market, weather, and current order base. This will further improve the functionality of the tool, especially by improving the forecasting capability.
Author Contributions
Conceptualization, M.S. (Mariola Sawczuk); methodology, M.S. (Mariola Sawczuk), A.S., O.O. and D.K.; software, D.K.; validation, M.S. (Marcin Sawczuk), M.S. (Mariola Sawczuk), A.S. and O.O.; formal analysis, M.S. (Marcin Sawczuk); investigation, M.S. (Mariola Sawczuk), A.S., O.O. and D.K.; resources, M.S. (Mariola Sawczuk); data curation, M.S. (Marcin Sawczuk) and D.K.; writing—original draft preparation, M.S. (Marcin Sawczuk); writing—review and editing, M.S. (Marcin Sawczuk), O.O. and D.K.; visualization, M.S. (Marcin Sawczuk); supervision, M.S. (Mariola Sawczuk); project administration, M.S. (Mariola Sawczuk); funding acquisition, M.S. (Mariola Sawczuk). All authors have read and agreed to the published version of the manuscript.
Funding
This study was funded by the Smart Growth Operational Programme—Call 6/1.1.1/2020, POIR.01.01.01-IP.01-00-006/20.
Data Availability Statement
The data presented in this study are only available on request from the corresponding author due to restrictions resulting from the signed confidentiality agreements. The data are not publicly available due to the sensitive nature of the collected information, which is protected by the non-disclosure agreement signed between the parties.
Conflicts of Interest
Author Mariola Sawczuk is an employee and a shareholder of the company Modus Sp. z o.o. Authors Adam Stawowy and Damian Kurek were employed by the company Modus Sp. z o.o. The remaining authors declare that the research was conducted in the absence of any commercial or financial relationships that could be construed as a potential conflict of interest.
Appendix A. Algorithm Breakdown
In this section, we present a model employed in our software platform. It is a step-by-step explanation of the implementation of the rules laid out in the Capacity Market Act [
10], combined with the forecasted values for qualifying and non-qualifying energy consumption. It follows a different convention of indices to represent how to perform the calculations for any given moment within the settlement period, as this reflects the conditions of providing real-time recommendations to the users.
Appendix A.1. Indices
| n = 1, …, N | the hour falling within the qualifying window. |
| m = 1, …, M | the hour falling outside the qualifying window. |
| t = 0, 1, …, T | the current day in a given settlement period, with 0 for the initial prediction. |
| h = 1, …, H | the analyzed day from the recorded historical operation. |
Appendix A.2. Parameters
| N | the total number of hours within the qualifying window over a settlement period. |
| M | the total number of hours outside the qualifying window over a settlement period. |
| Nt | the total number of hours within the qualifying window over a period 1, …, t. |
| Mt | the total number of hours outside the qualifying window over a period 1, …, t. |
| T | the length of a settlement period (in days). |
| H | the number of days in retrospect analyzed for prediction. |
| SOM | the base unit rate of the capacity charge, imposed by the regulatory authority. |
Appendix A.3. Variables
| Zkt | the recorded volume of qualifying electricity drawn from the grid and consumed until the day t of the given settlement period (in MWh). |
| At | the current capacity charge factor as per day t, contingent on the capacity charge benchmark ∆st. |
| WOM | the forecasted final cost of the capacity charge charged to the end user for the given settlement period. |
| ∆st | the difference between the average consumption of electrical energy within the window and outside the window over the current settlement period, according to the forecast on day t. |
| ZSn | the volume of electrical energy drawn from the grid every hour n (in MWh). |
| ZPSm | the volume of electrical energy drawn from the grid every hour m (in MWh). |
| ZSh | the historical volume of qualifying electrical energy drawn from the grid on day h (in MWh). |
| ZPSh | the historical volume of non-qualifying electrical energy drawn from the grid on day h (in MWh). |
| pZS | the predicted daily volume of qualifying electrical energy drawn from the grid (in MWh/day). |
| pZPS | the predicted daily volume of non-qualifying electrical energy drawn from the grid (in MWh/day). |
Appendix A.4. Formulation
- 1.
For each day t of the settlement period, define its class as follows:
Startup, if the day falls after the holiday or another stopover.
Regular, if the day follows a normal operation.
Shutdown, if the day falls before a holiday or another anticipated stopover.
Use historical data logs to identify H most recent instances of days pertinent to each of the classes.
- 2.
Extract the qualifying and non-qualifying energy uses for the historical days of each class:
Calculate the forecasted qualifying and non-qualifying daily energy use for each class by excluding the extreme values from the sets and averaging the remaining values according to Equations (A1) and (A2):
Notably, the predicted values of energy use are class-specific and should only be used to predict energy use during the day assigned to the same class.
- 3.
Calculate the current ∆
st at the beginning of day
t, using Equation (A3):
Equation (A3) combines Equation (1) imposed by the legislative act with the forecasted values of both energy use categories calculated according to Equations (A1) and (A2). Equation (1) is used for calculations covering the previous days within the settlement period from day 1 until the current day t, while the forecasted values are used for future predictions from the current day t until the last day of the settlement period T. For each future day, the prediction for a correct class has to be used.
- 4.
Determine the current (as per the day t) value of At based on the value of ∆st according to the provided rules:
if ∆st < 5%, then At = 0.17;
if (∆st >= 5% and ∆st < 10%), then At = 0.50;
if (∆st >= 10% and ∆st < 15%), then At = 0.83;
if ∆st >= 15%, then At = 1.00.
- 5.
Using Equation (A4), calculate the cost of the capacity charge (
WOM) for the given settlement period using the information available on day
t:
- 6.
Utilize real-time forecasting and monitoring tools to adjust the demand pattern to minimize WOM, according to the following:
Provide the users with estimated capacity charge values at the end of the settlement period.
Simulate the changes in electricity consumption patterns to assess the impact on WOM.
Display real-time recommendations to users on how to shift consumption to minimize WOM for the current settlement period.
- 7.
Throughout the duration of the settlement period, continuously repeat steps 1 through 6 while updating the WOM forecast in real time using the most recent energy consumption characteristics.
Appendix A.5. Validation
For each prediction, an error is calculated by comparing the predicted value to the final ∆
s, according to Equation (A5):
Prediction errors were calculated for each day during the monthly settlement periods and grouped according to the length of the prediction period during which the prediction was made.
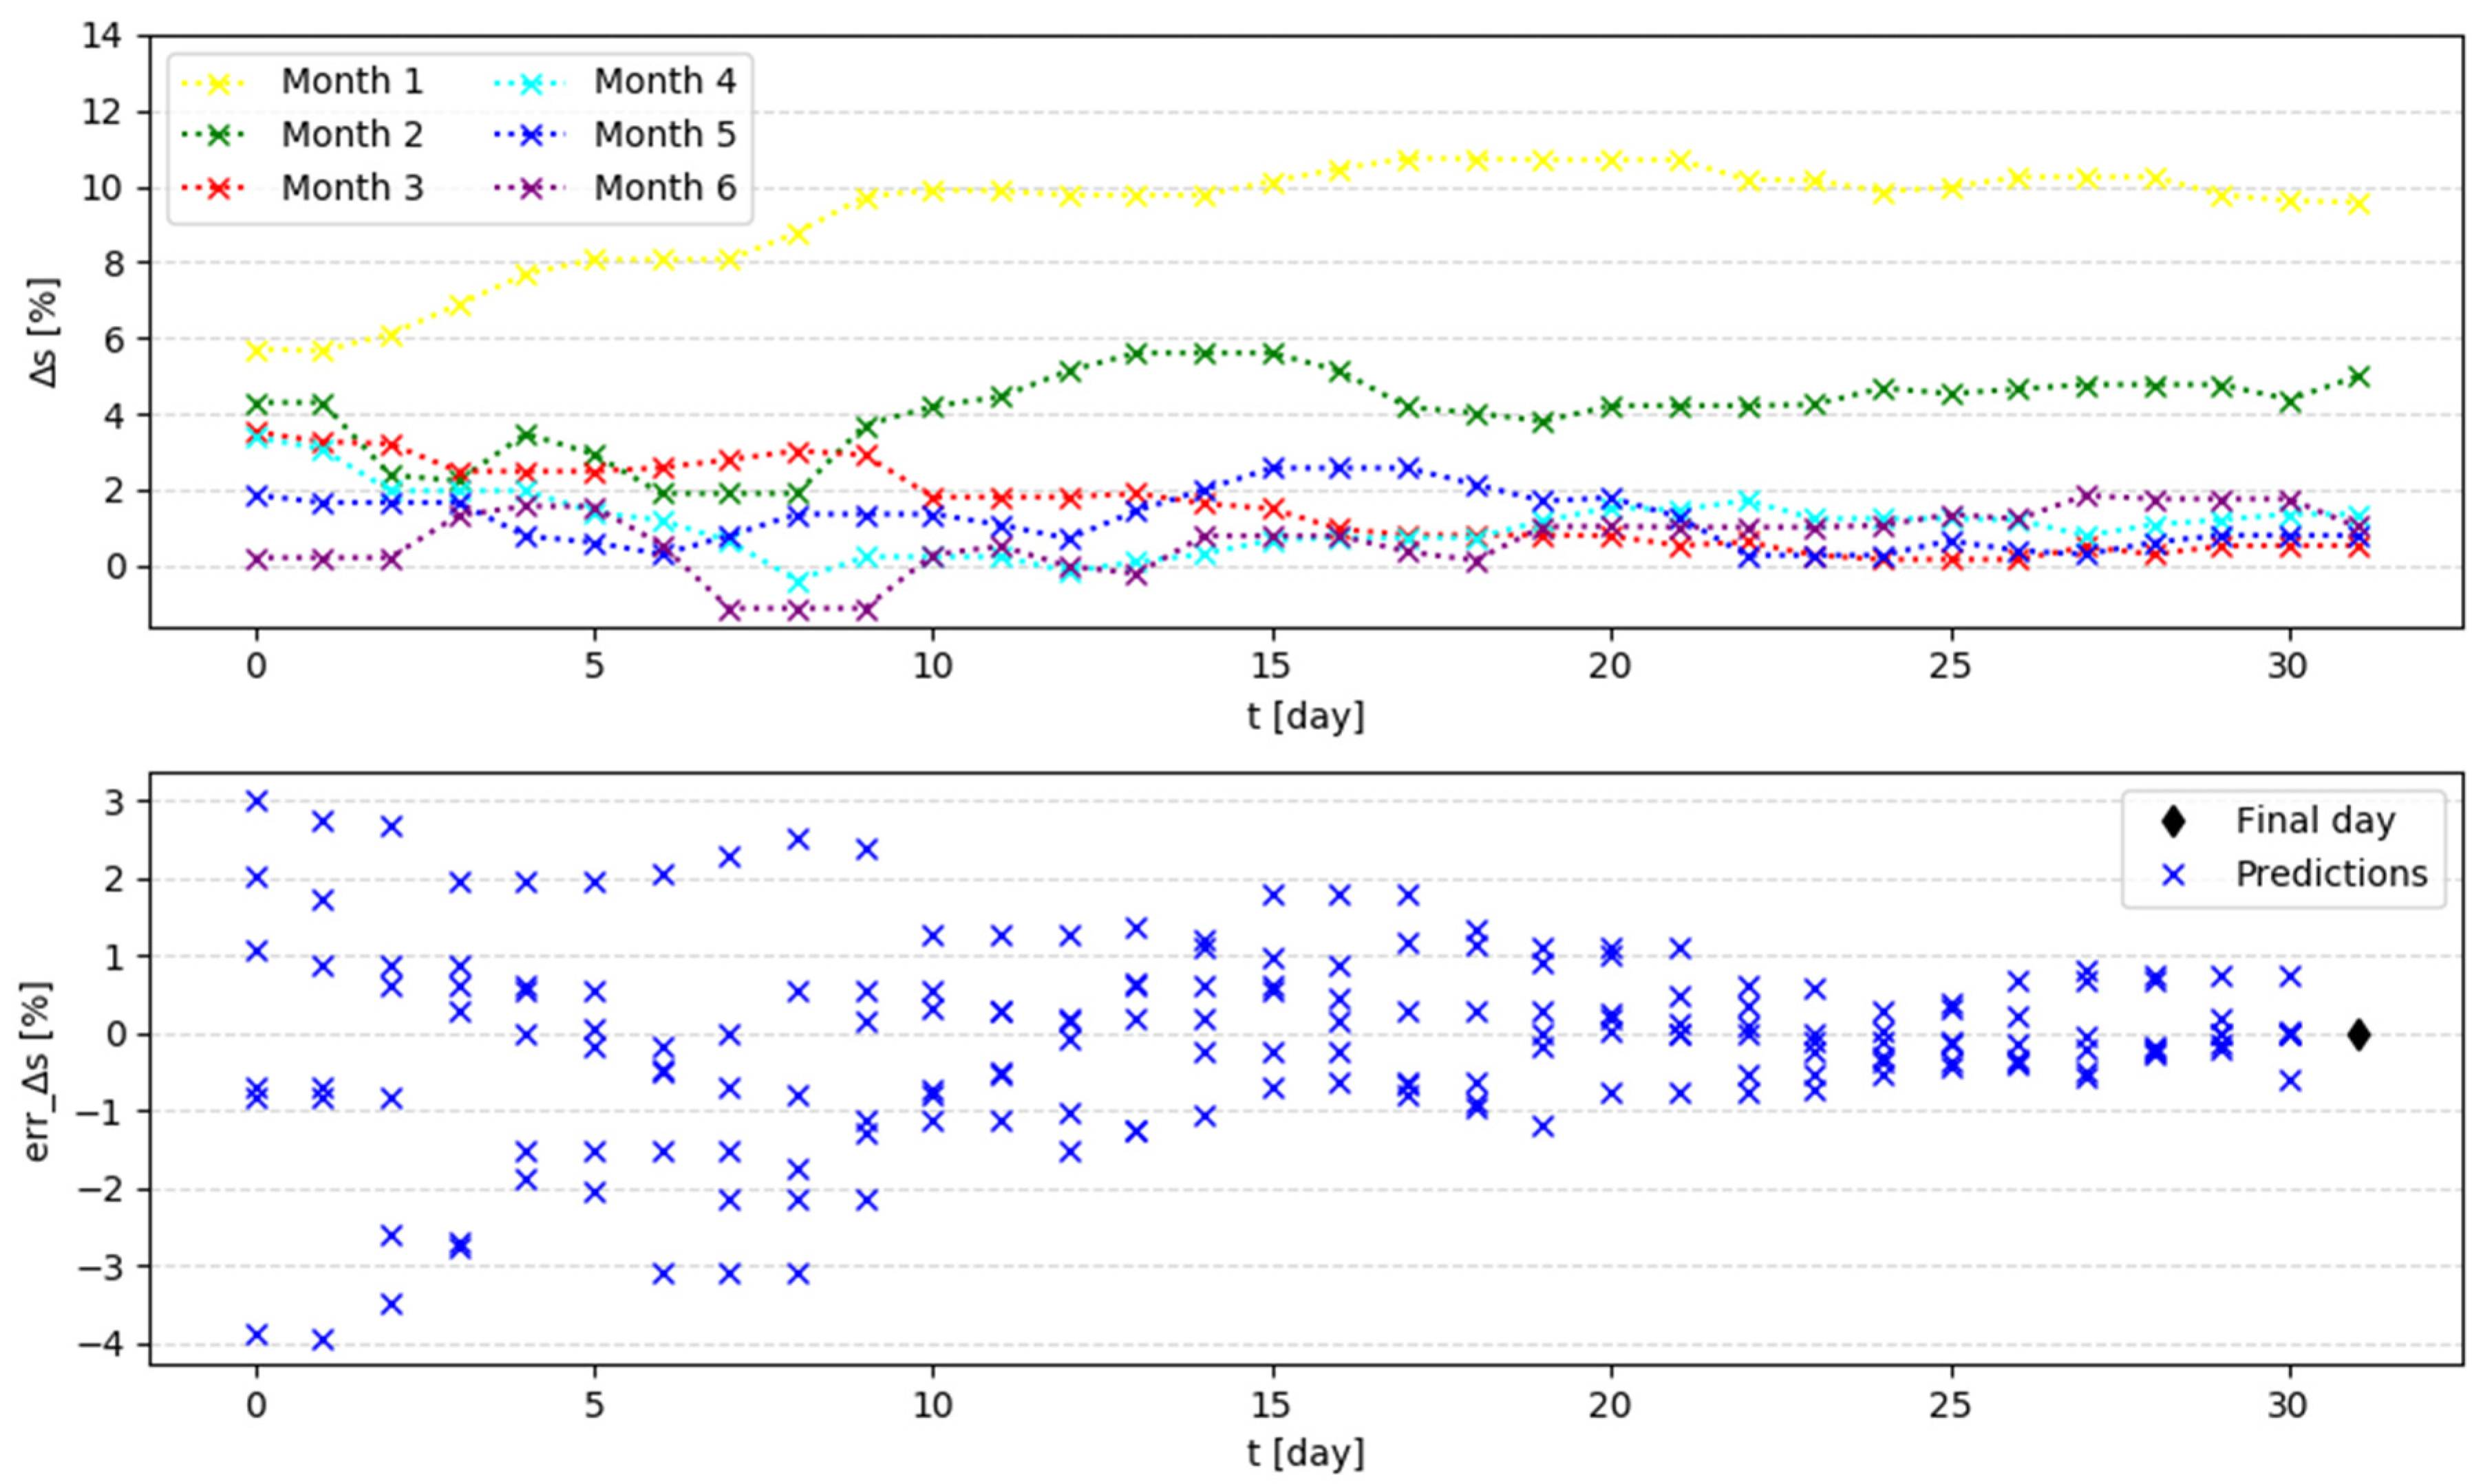
Figure A1 shows both the predictions and the results of the error calculation for the six 31-day months of the year 2022. January is excluded from the chart, due to the unusual characteristics of this month, which starts with more than a week of vacation when the facility is mostly shut down.
Figure A1.
Daily predictions for each of the 31-day months in the year 2022 (top); errors in the daily predictions for the 31-day-long months, with the final day representing a measured value (bottom).
Figure A1.
Daily predictions for each of the 31-day months in the year 2022 (top); errors in the daily predictions for the 31-day-long months, with the final day representing a measured value (bottom).
Across all of the settlement period durations, the predictions shared similar accuracy. At less than 10 days until the end of the settlement period, ∆s was predicted with ±1 percentage point accuracy, which exceeds the accuracy required for the described application. At less than 20 days until the end of the settlement period, the accuracy decreased to ±2 percentage points, which is the minimum accuracy needed for the presented problem. At more than 20 days until the end of the settlement period, the prediction error approached ±4 percentage points. Consequently, predictions made more than 20 days in advance can only serve as approximate guidance for the decision making process.
Notably, observed errors are related to both the precision of the used method and the human factor. The results of the ∆s prediction are provided in real time to the staff of the production facility. Workers are taking actions upon the provided information, which results in changes in the analyzed system and therefore shifts to the final ∆s value. Further work will evaluate the contributions of both factors to the operation of the tested platform.
References
- European Commission Staff Working Document: Annual Single Market Report 2021. 2021. Available online: https://eur-lex.europa.eu/legal-content/EN/TXT/PDF/?uri=CELEX:52021SC0351&from=en (accessed on 30 November 2023).
- European Commission. Directorate-General for Internal Market, Industry, Entrepreneurship and SMEs Masterplan for a Competitive Transformation of EU Energy-Intensive Industries Enabling a Climate-Neutral, Circular Economy by 2050; European Commission: Brussels, Belgium, 2019. [Google Scholar]
- Bhagwat, P.C.; Marcheselli, A.; Richstein, J.C.; Chappin, E.J.L.; De Vries, L.J. An Analysis of a Forward Capacity Market with Long-Term Contracts. Energy Policy 2017, 111, 255–267. [Google Scholar] [CrossRef]
- Kirschen, D.S.; Strbac, G. Fundamentals of Power System Economics, 2nd ed.; Wiley: Hoboken, NY, USA, 2019; ISBN 978-1-119-21324-6. [Google Scholar]
- Aagaard, T.S.; Kleit, A.N. Electricity Capacity Markets, 1st ed.; Cambridge University Press: Cambridge, UK, 2022; ISBN 978-1-108-77915-9. [Google Scholar]
- Newbery, D. Missing Money and Missing Markets: Reliability, Capacity Auctions and Interconnectors. Energy Policy 2016, 94, 401–410. [Google Scholar] [CrossRef]
- European Commission Press Release State Aid: Commission Authorises UK Capacity Market Electricity Generation Scheme. 2014. Available online: https://ec.europa.eu/commission/presscorner/detail/en/ip_14_865 (accessed on 4 February 2024).
- Tempus Energy Ltd. vs. European Commission, Case T-793/14 2018. Available online: https://curia.europa.eu/juris/document/document_print.jsf?mode=lst&pageIndex=0&docid=207792&part=1&doclang=EN&text=&dir=&occ=first&cid=2637614 (accessed on 2 March 2024).
- Eurropean Commission Decision on the Aid Scheme SA.35980—2019/C United Kingdom—Electricity Market Reform: Capacity Mechanism. 2019. Available online: https://eur-lex.europa.eu/legal-content/EN/TXT/PDF/?uri=CELEX:32020D0348 (accessed on 17 February 2024).
- Ustawa o Rynku Mocy [Capacity Market Act]; 2023. Available online: https://sip.lex.pl/akty-prawne/dzu-dziennik-ustaw/rynek-mocy-18670745 (accessed on 17 February 2024).
- Benalcazar, P.; Nalepka, P. The Polish Capacity Market Proposal vs the British Model. Polityka Energetyczna Energy Policy J. 2017, 20, 59–72. [Google Scholar]
- Komorowska, A.; Kaszyński, P.; Kamiński, J. Where Does the Capacity Market Money Go? Lessons Learned from Poland. Energy Policy 2023, 173, 113419. [Google Scholar] [CrossRef]
- Agregatorzy i OSD [Aggregators and DSOs]. Available online: https://www.pse.pl/uslugi-dsr/agregatorzy-i-osd (accessed on 3 February 2024).
- Vieira, G.E.; Herrmann, J.W.; Lin, E. Rescheduling Manufacturing Systems: A Framework of Strategies, Policies, and Methods. J. Sched. 2003, 6, 39–62. [Google Scholar] [CrossRef]
- Pechmann, A.; Zarte, M. Procedure for Generating a Basis for PPC Systems to Schedule the Production Considering Energy Demand and Available Renewable Energy. Procedia CIRP 2017, 64, 393–398. [Google Scholar] [CrossRef]
- Honarmand, M.E.; Hosseinnezhad, V.; Hayes, B.; Shafie-Khah, M.; Siano, P. An Overview of Demand Response: From Its Origins to the Smart Energy Community. IEEE Access 2021, 9, 96851–96876. [Google Scholar] [CrossRef]
- Huang, W.; Zhang, N.; Kang, C.; Li, M.; Huo, M. From Demand Response to Integrated Demand Response: Review and Prospect of Research and Application. Prot. Control Mod. Power Syst. 2019, 4, 12. [Google Scholar] [CrossRef]
- Wang, J.; Zhong, H.; Ma, Z.; Xia, Q.; Kang, C. Review and Prospect of Integrated Demand Response in the Multi-Energy System. Appl. Energy 2017, 202, 772–782. [Google Scholar] [CrossRef]
- Lu, R.; Bai, R.; Huang, Y.; Li, Y.; Jiang, J.; Ding, Y. Data-Driven Real-Time Price-Based Demand Response for Industrial Facilities Energy Management. Appl. Energy 2021, 283, 116291. [Google Scholar] [CrossRef]
- Shoreh, M.H.; Siano, P.; Shafie-khah, M.; Loia, V.; Catalão, J.P.S. A Survey of Industrial Applications of Demand Response. Electr. Power Syst. Res. 2016, 141, 31–49. [Google Scholar] [CrossRef]
- Ali, A.N.F.; Sulaima, M.F.; Razak, I.A.W.A.; Kadir, A.F.A.; Mokhlis, H. Artificial Intelligence Application in Demand Response: Advantages, Issues, Status, and Challenges. IEEE Access 2023, 11, 16907–16922. [Google Scholar] [CrossRef]
- Lee, E.; Baek, K.; Kim, J. Evaluation of Demand Response Potential Flexibility in the Industry Based on a Data-Driven Approach. Energies 2020, 13, 6355. [Google Scholar] [CrossRef]
- COMMISSION REGULATION (EU) 2017/ 1485—Of 2 August 2017—Establishing a Guideline on Electricity Transmission System Operation. Available online: https://eur-lex.europa.eu/legal-content/EN/TXT/PDF/?uri=CELEX:32017R1485 (accessed on 17 November 2023).
- Ho, M.H.; Hnaien, F.; Dugardin, F. Electricity Cost Minimisation for Optimal Makespan Solution in Flow Shop Scheduling under Time-of-Use Tariffs. Int. J. Prod. Res. 2021, 59, 1041–1067. [Google Scholar] [CrossRef]
- Bänsch, K.; Busse, J.; Meisel, F.; Rieck, J.; Scholz, S.; Volling, T.; Wichmann, M.G. Energy-Aware Decision Support Models in Production Environments: A Systematic Literature Review. Comput. Ind. Eng. 2021, 159, 107456. [Google Scholar] [CrossRef]
| Disclaimer/Publisher’s Note: The statements, opinions and data contained in all publications are solely those of the individual author(s) and contributor(s) and not of MDPI and/or the editor(s). MDPI and/or the editor(s) disclaim responsibility for any injury to people or property resulting from any ideas, methods, instructions or products referred to in the content. |
© 2024 by the authors. Licensee MDPI, Basel, Switzerland. This article is an open access article distributed under the terms and conditions of the Creative Commons Attribution (CC BY) license (https://creativecommons.org/licenses/by/4.0/).


