Abstract
This paper introduces a new concept in transmission expansion planning based on unconventional lines, termed “smart transmission expansion planning”. Traditionally, the domains of transmission expansion planning (TEP) and transmission line design are separate entities. TEP planners typically rely on the electrical specifications of a limited set of standard conventional line designs to evaluate planning scenarios, ultimately leading to the construction of the selected candidate line. In this context, it is noted that cost-effective scenarios often diverge from meeting the technical criteria of load flow analysis. To address this discrepancy, this paper proposes an alternative approach wherein TEP is conducted based on the specific requirements of the system earmarked for expansion. The transmission expansion planner initiates the process by determining optimal line parameter values that not only meet the operational criteria but also ensure cost-effectiveness. Subsequently, a line is designed to embody these optimal parameters. A detailed comparative analysis is conducted in this study, comparing the outcomes of TEP analyses conducted with conventional lines, unconventional lines, and lines featuring optimal parameters. Through extensive load flow analysis performed under normal and all single-contingency scenarios across three distinct loading conditions (peak load, dominant load representing 60% of peak load, and light load representing 40% of peak load), the results reveal that transmission lines engineered with optimal parameters demonstrate effective operation, with fewer transmission lines required to meet identical demands compared to other approaches.
1. Introduction
The contemporary restructuring of the power industry into a horizontally integrated open market model has prompted significant transformations in both the supply and demand sides. Traditional large synchronous generators have been supplanted by lighter generators and variable renewable energy resources, while modernization efforts on the demand side include the proliferation of distributed variable energy resources, advancements in energy storage technologies, and the adoption of demand response strategies for the demand side management. Various factors are contributing to the swift evolution of electric power systems, including governmental policies, economics, and technological advancements [1,2]. These elements collectively propel the transformation of the power sector, with the overarching objective of delivering reliable energy sourced from progressively cleaner and cost-effective sources. Despite these advancements, the transmission sector has seen minimal hardware changes over its extensive history.
Even with the integration of energy efficient technologies into power system demand sectors, a sustained increase in energy demand persists. The International Energy Outlook 2023 predicts significant increases in energy consumption across different sectors by 2050, with expected rises of 62% in the industrial sector, 41% in transportation energy and a tripling of consumption in commercial and industrial buildings by 2050 [3]. To achieve the 1.5 pathway outlined in the Paris Agreement, the energy transition necessitates a swift proliferation of electricity generation derived from renewable sources. Within the framework of the 1.5 scenario, end-use sectors are anticipated to undergo rapid electrification by 2050, resulting in a tripling of global electricity demand from the level recorded in 2020. Concurrently, the proportion of renewable energy within the power generation matrix is projected to escalate substantially, soaring from 28% to 91% over the time frame spanning from 2020 to 2050 [4]. A study conducted in 2021 examining the feasibility of achieving zero emissions in the United States by 2050 found that there would be a need to expand the capacity of high-voltage transmission lines by around 60% by 2030 and triple it by 2050 [5]. Nonetheless, the expenses associated with high- and extra-high-voltage (EHV) transmission lines are substantial. In the domain of electrical power transmission, overhead three-phase transmission remains dominant. Although underground transmission presents an alternative, its significantly higher cost poses an economic barrier, and the high charging current in EHV AC cables introduces technical complexities [6,7]. The High Voltage Direct Current (HVDC) transmission requirement for large-scale power transfer, along with its technological frameworks and recent advancements, is thoroughly discussed in [8,9,10]. Nevertheless, from the economic perspective, it is only viable for exceedingly long distances, often exceeding 800 km [9], and HVDC circuit breakers have yet to be commercialized, which is another major issue.
The need for cost-effective transmission expansion planning (TEP) becomes evident in such a situation. Such planning is crucial for efficiently transferring electrical power and upholding grid resilience and reliability. It serves as a vital mechanism for facilitating the seamless conveyance of electricity from generation sources to consumption centers. Numerous studies in the literature have extensively explored transmission expansion planning, delving into various facets of power grid enhancement. Most studies focus on utilizing TEP to integrate large-scale renewable energy sources into the primary grid ([11,12,13], to cite a few), on ensuring the system remains robust under the uncertainty of contingency, load demand, and renewable energy sources ([14,15], to cite a few), and on incorporating a market-based approach into TEP in a deregulated environment based on optimized power flow and locational marginal prices ([16,17], to cite a few). On the other hand, designing transmission lines with non-circular or non-ellipsoidal bundles to increase the natural loading of transmission lines has been carried out [18,19]. An unconventional High Surge Impedance Loading (HSIL) transmission line with a generic conductor bundle configuration has been used for TEP analysis in the literature [20,21]. However, line design and TEP analysis have yet to be integrated.
To date, TEP and line design have been considered independent processes, whether in research or actual utilization. The typical engineering practice for TEP is based on studying local planning cases, where load flow, short circuit, and transient stability studies under peak and light loading conditions for normal conditions and single contingencies are carried out using commercial software tools. Ultimately, the scenarios that meet the technical criteria are economically compared. In this regard, planners use the line parameters per length of a few common and available conventional line configurations for each voltage level and calculate them for the given length for the abovementioned studies. Thereafter, the final planning scenario, including those conventional transmission lines, is constructed. This has also been the case for research conducted on TEP to date, in which line parameter values from a few conventional line configurations for each voltage level are used. In such a sequence, cost-effective scenarios (or scenarios with any other objective) often do not meet the technical criteria of the mentioned studies. In this paper, we will overturn the above sequence. Our goal is to enable a transmission expansion planner that can determine the optimal line parameter values leading to the most cost-effective scenario and then design a line that has these optimal parameters. Although this cannot currently be realized through conventional line configurations, it can be realized by using breakthrough unconventional line designs. The main contributions of this article are summarized as follows:
- Introduction to the requirements of cost-effective extra-high-voltage AC transmission systems for power system expansion.
- Proposal for an innovative approach in transmission expansion planning based on requirements by finding optimal line parameters as required instead of using available standard conventional line configurations.
- Comparing the operations of each TEP scenario with a conventional line, unconventional HSIL line, and the proposed line for smart TEP to supply the designated load.
- Cost comparison of each TEP scenario using a conventional line, unconventional HSIL line, and the proposed line for the smart TEP throughout the life span of the transmission line.
The remainder of this article is organized as follows: Section 2 provides an overview of the base test system from which TEP is carried out. Section 3 presents transmission expansion planning with different line configurations. Section 4 provides a detailed cost comparison of the different TEP approaches, and Section 5 concludes the paper.
2. Base Test System
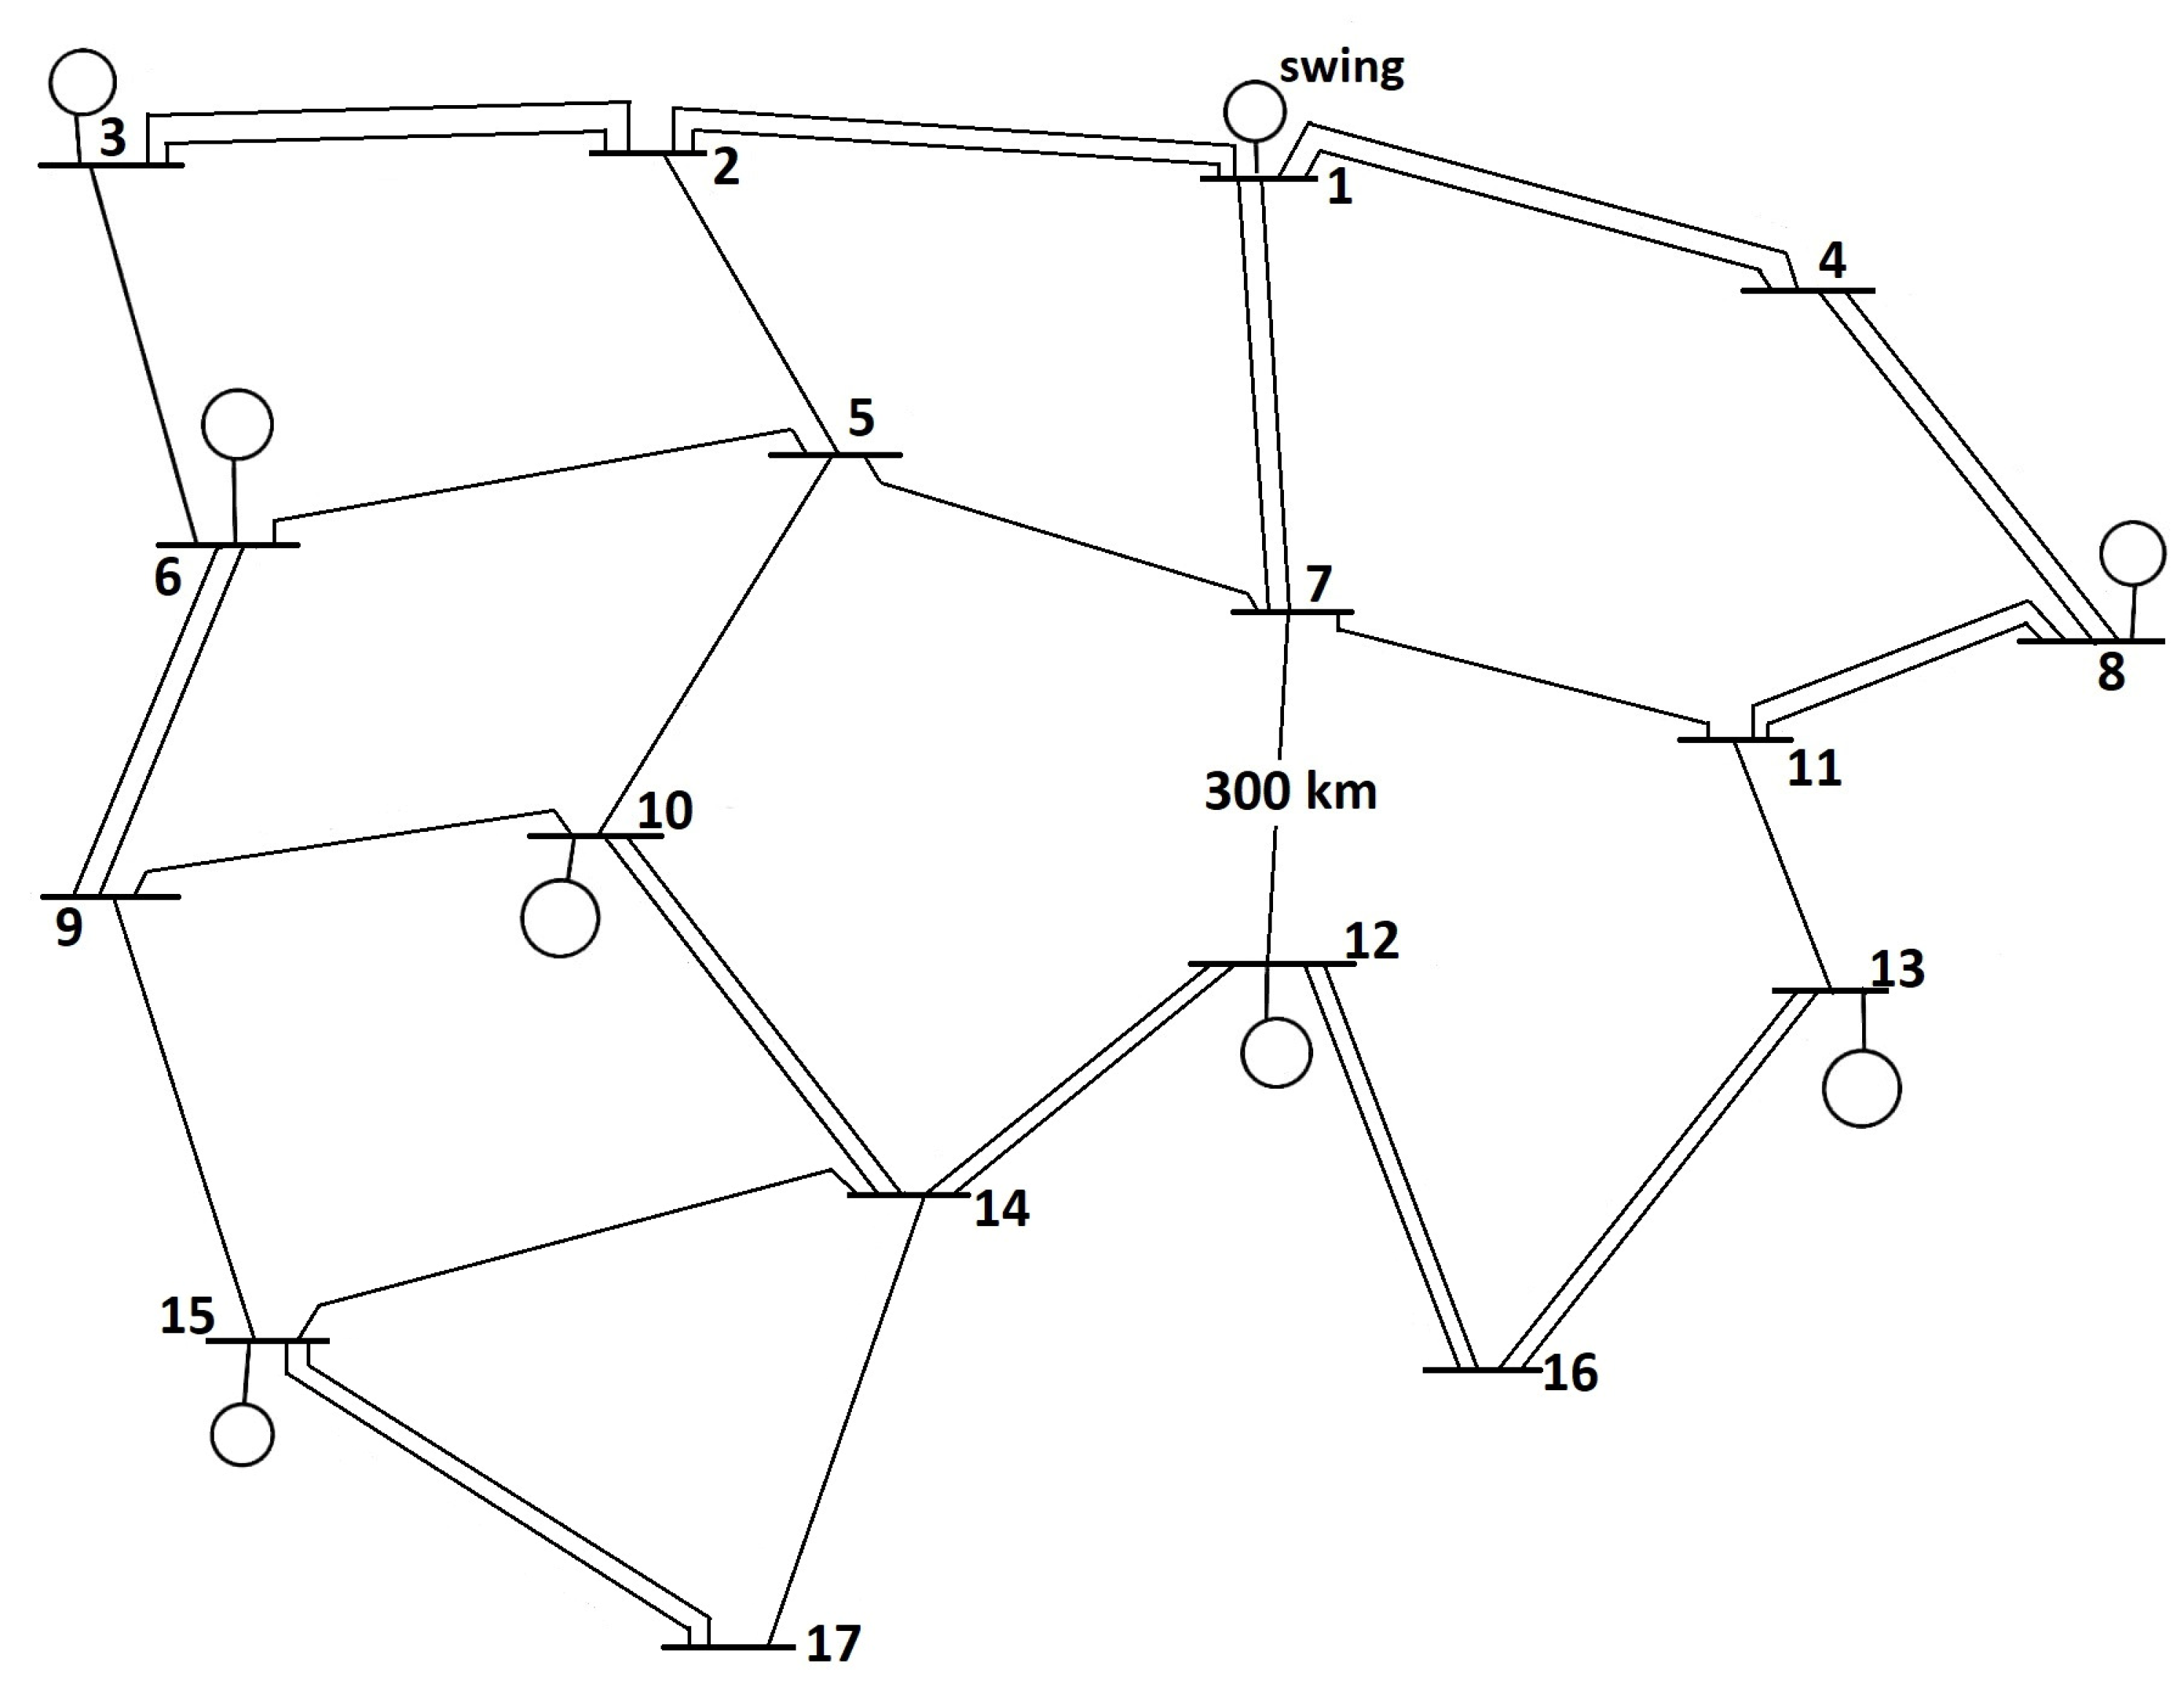
The base 500 kV test system is taken from [22], and its single-line diagram is depicted in Figure 1. The transmission line configuration within this system follows a conventional horizontal layout, is characterized by a phase spacing of 12.3 m and is situated at a height of 28 m from the ground level. The length of each transmission line is presented in Table 1. Each transmission line is classified as a long transmission line and is modeled with an equivalent model. Additionally, each transmission line is equipped with four Macaw conductors per bundle. The line resistance, inductance, and capacitance per km of transmission line for this configuration are specified as 0.0228 Ω/km, 0.878 mH/km, and 12.975 nF/km, respectively. The generation, load, and shunt compensation information for this test system at peak loading conditions are provided in Table 2. It is noteworthy that this test system operates effectively under normal conditions and under all single-contingency scenarios, including peak load, dominant load, and light load conditions. The power loss in the base test system at peak loading condition is 321.2 MW. The cumulative capacities of the required shunt reactor at the dominant and light loading conditions are 2350 Mvar and 6800 Mvar, respectively. Further details regarding this system can be found in [22].
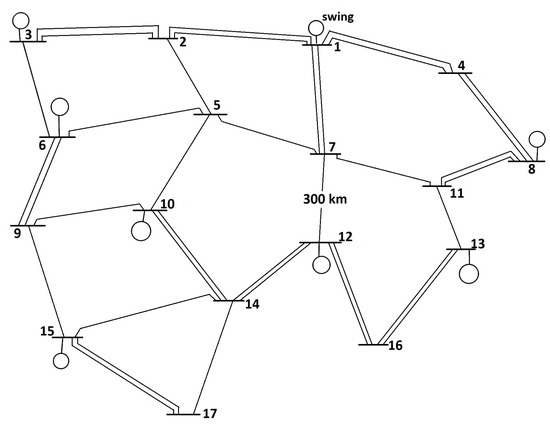
Figure 1.
The 17-bus base test system used for the TEP study.

Table 1.
Transmission line length of the test system shown in Figure 1.
Table 2.
Generation, load, and shunt compensation information of test system at peak load.
3. Transmission Expansion Planning
The transmission expansion planning objective is to connect a 1250 MW load with a 0.9 lagging power factor located at a new bus, bus 18. Bus 18 is located at 341.84 km and 341.84 km from bus 16 and bus 17, respectively.
3.1. Using an Unconventional Line
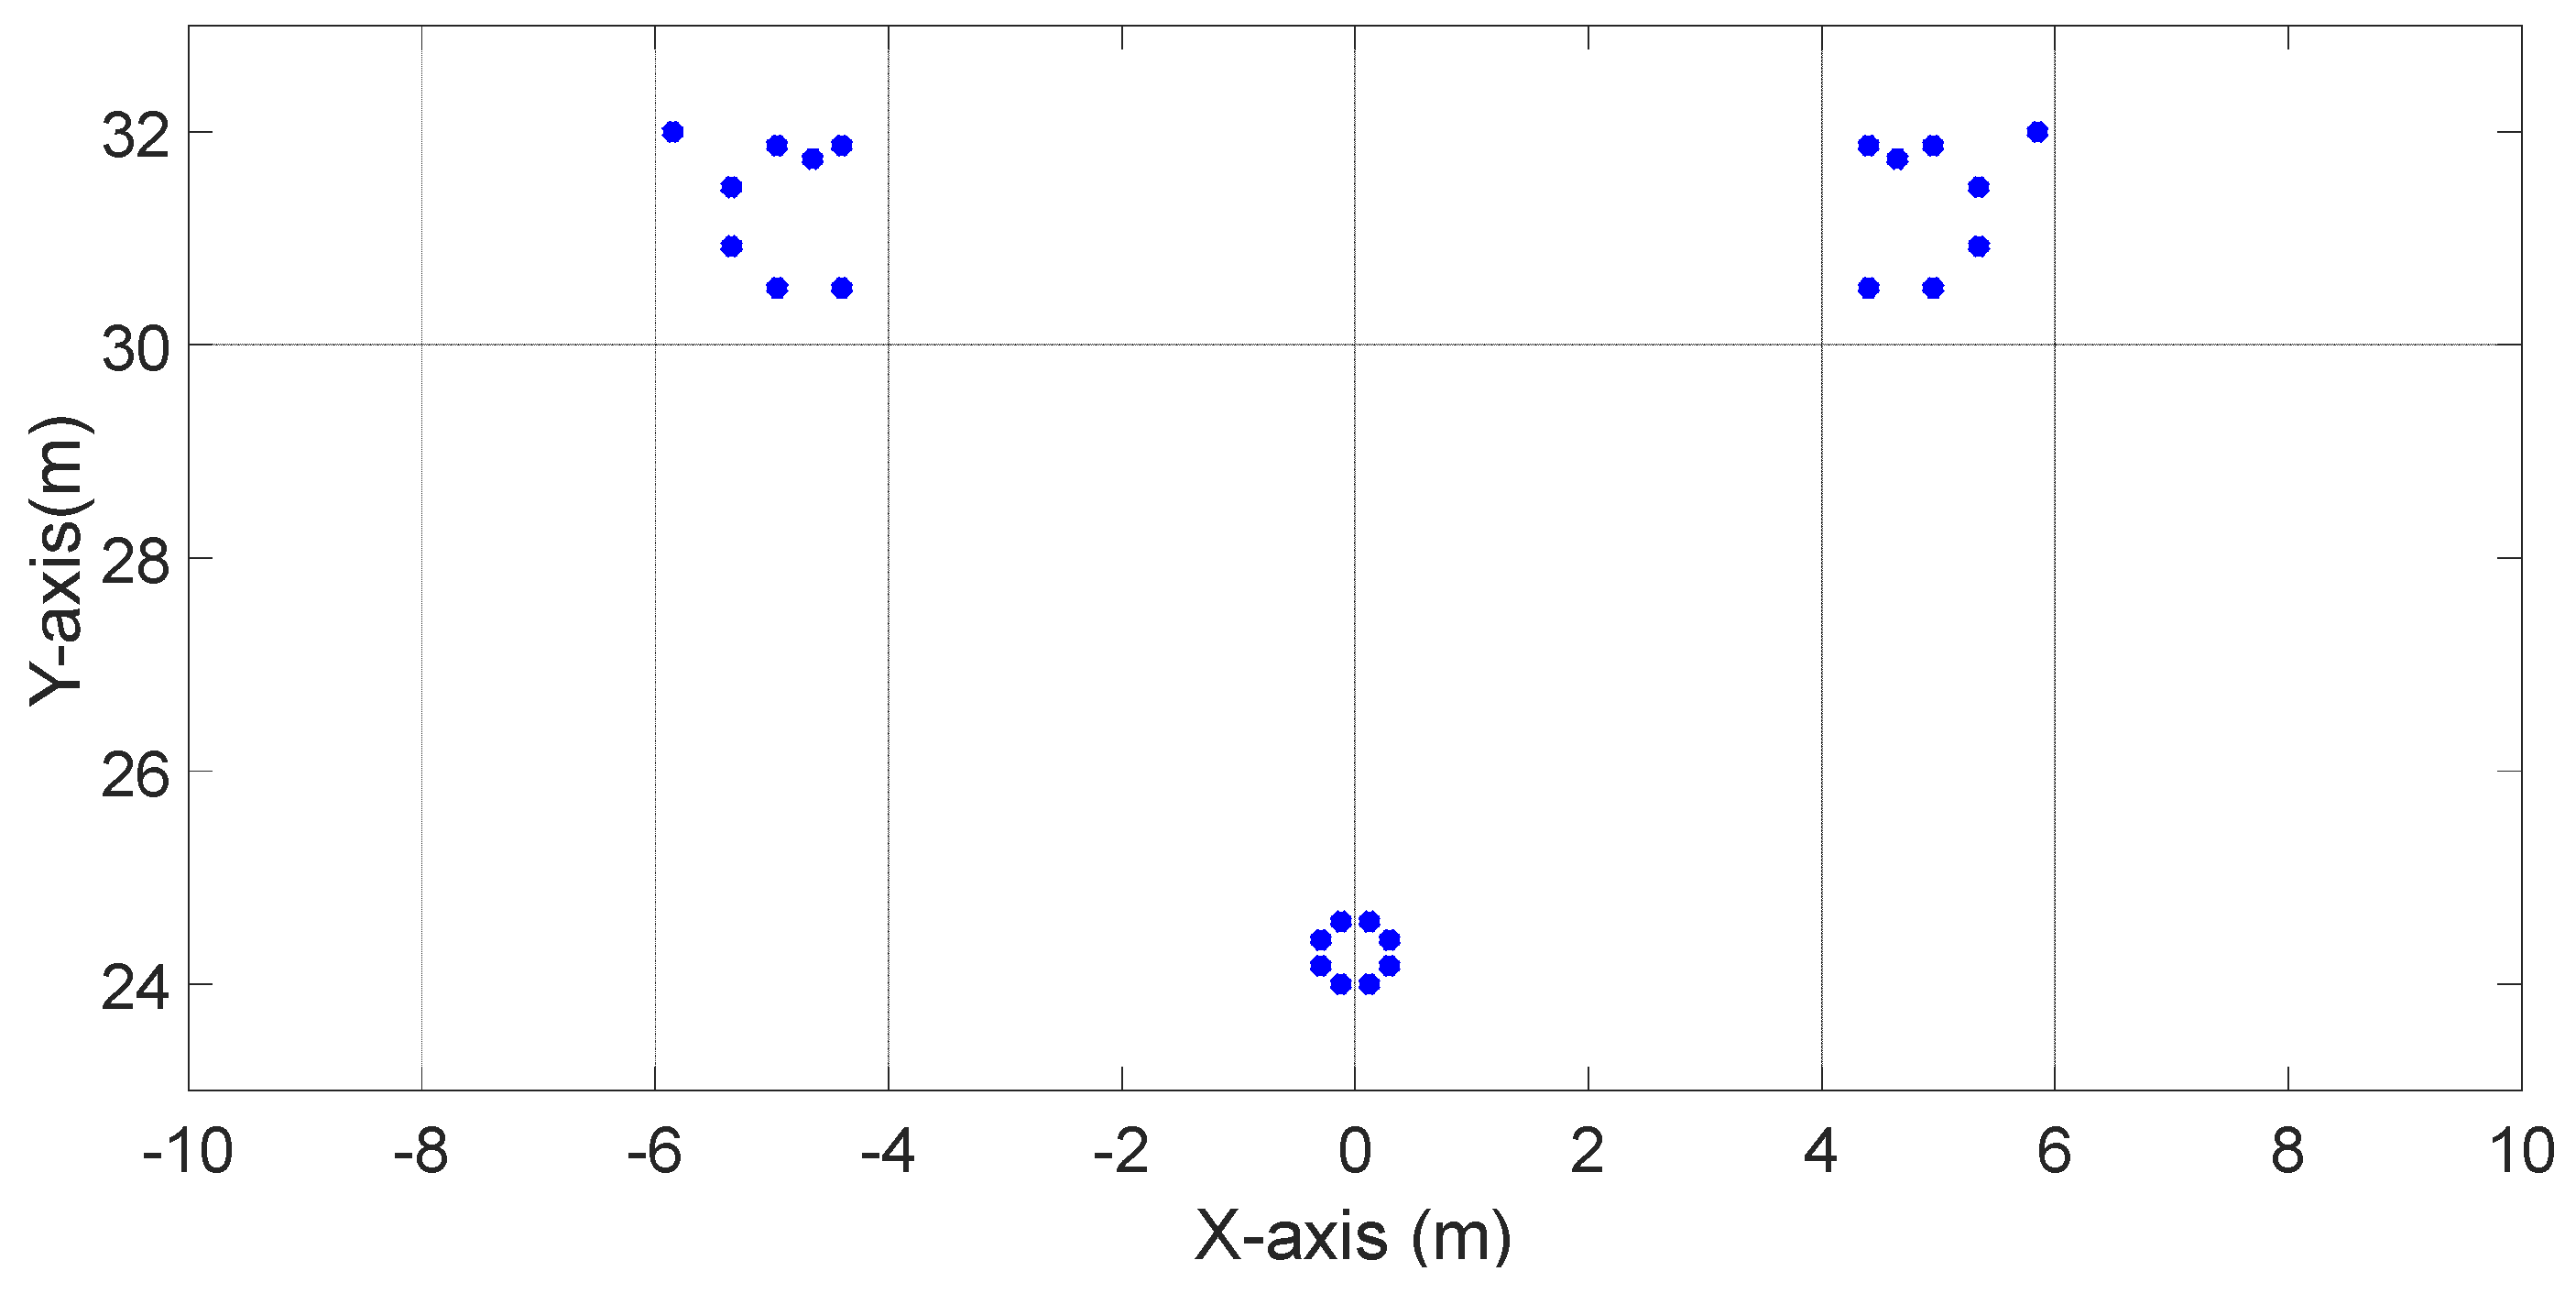
The unconventional line, featuring eight chickadee conductors per bundle for the line configuration, is sourced from [20,21]. The line configuration is visually depicted in Figure 2, and the specifications of this line configuration are provided in Table 3. In Figure 2, each blue circle shows a subconductor.
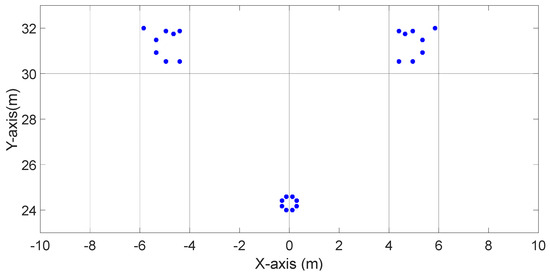
Figure 2.
Unconventional line configuration used for the comparison.
Table 3.
Line parameters and some important information about the line shown in Figure 2.
To supply the demand of a 1250 MW load at bus 18 utilizing the unconventional line, incorporating two-line connections from bus 16 to bus 18 and two-line connections from bus 17 to bus 18 becomes imperative within the system framework. Furthermore, adding one more line connection from bus 14 to bus 17, adhering to the conventional line configuration, is necessary to ensure satisfactory system operability under normal operating conditions and all single-contingency scenarios. The required shunt compensations to guarantee satisfactory system performance during peak loading conditions, including other loading conditions, are delineated in Table 4. This tabulation indicates that a total capacity of 1250 Mvar for shunt capacitors and 1500 Mvar for shunt reactors must be integrated across various buses at peak load. A comprehensive load flow analysis was performed to analyze the TEP of this system, which is presented in Figure 3. All load flow analyses in this paper were done by PSS/E 35.4.
Table 4.
The required shunt compensations to guarantee satisfactory system performance during peak load, dominant load, and light load conditions for the TEP with the unconventional HSIL line.
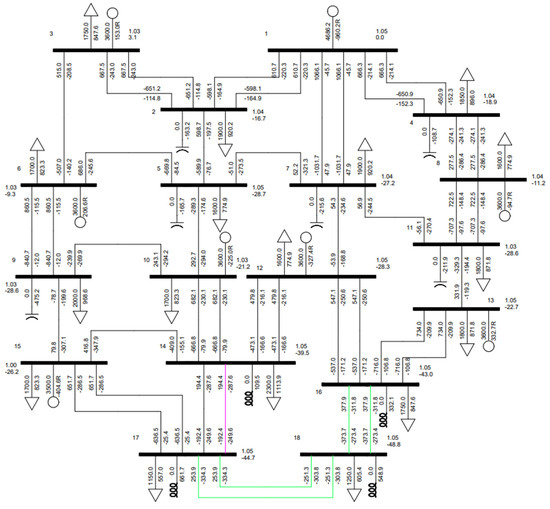
Figure 3.
TEP with the unconventional HSIL line (green) and conventional line (purple).
This TEP assessment illustrates that the system adheres to specified constraints to uphold operational requirements. These constraints encompass maintaining the bus voltage within predefined limits, denoted as for normal operation and for contingency situations. Additionally, reactive power generation is constrained within the bounds of , where represents the active power generation of individual generating units. Moreover, line loading limits are also observed within their thermal rating. The total power loss in the system at peak loading conditions for this TEP approach is 436.2 MW. The voltage, reactive power generation, and line loading limits also meet the required limit for the other loading scenarios, such as dominant and light loading conditions. However, an adjustment in the shunt reactors is needed, as depicted in Table 4.
This TEP approach necessitates an additional line within the 17-bus test system configuration, in addition to two/two-line connections from bus 16 and bus 17 to bus 18. This extra line connection in the test system is also required with the other two/two-line connections from bus 16 and bus 17 to bus 18 if the conventional transmission line described in Section 2 is utilized for the TEP. The maximum power loss for the TEP with the conventional transmission line is 435.1 MW under peak loading conditions. Detailed information about the required shunt compensation to ensure the system remains satisfactorily operable during peak, dominant, and light loading conditions is presented in Table 5. This information shows that the cumulative capacity of the 1250 Mvar shunt capacitors and 900 Mvar shunt reactor at peak loading, 3100 Mvar shunt reactor at dominant loading, and 7500 Mvar shunt reactors at light loading condition needed to be connected in the system.
Table 5.
Shunt compensation information at peak load, dominant load, and light loadings for the TEP using the conventional line.
This TEP analysis with the conventional and an unconventional line prompts the inquiry into whether a TEP approach capable of supplying the specified load can be achieved solely by implementing a two/two-line connection from bus 16 and bus 17 to bus 18. The subsequent section delineates a new approach for TEP based on the system requirements.
3.2. Smart Transmission Expansion Planning
3.2.1. Methodology
The objective of smart transmission expansion planning is to decrease the capital cost and the operational cost of the expanded transmission line to meet the designated load demand throughout the life span of the transmission line. The capital cost includes the investment in expanded transmission line construction, the cost of required additional shunt compensating devices, and the cost of additional bays needed to connect the transmission line and shunt compensating devices to the bus. The considered operational cost of TEP is the cost incurred by the additional power losses in the system due to the TEP. The detailed formulation of smart transmission expansion planning is as follows:
Objective: Minimize Cost (investment + operational) of TEP
Constraints:
- (i)
- Transmission line parameter constraints:
Rsmart = R
0.8L ≤ Lsmart ≤ 1.2L
0.8C ≤ Csmart ≤ 1.2C
0.8L ≤ Lsmart ≤ 1.2L
0.8C ≤ Csmart ≤ 1.2C
- (ii)
- Power balance constraint:
and are the active and reactive power demand at bus , and are the injected active and reactive power into the bus , and are the active and reactive power loss in the system, and are the magnitude and angle of the bus voltage, and and are the real and imaginary parts of the element of the bus admittance matrix corresponding to the -th row and -th column. is the total number of buses in the system.
- (iii)
- Bus voltage constraint:
- (iv)
- Constraint on power flow in transmission line:
- (v)
- Constraint reactive power generation:
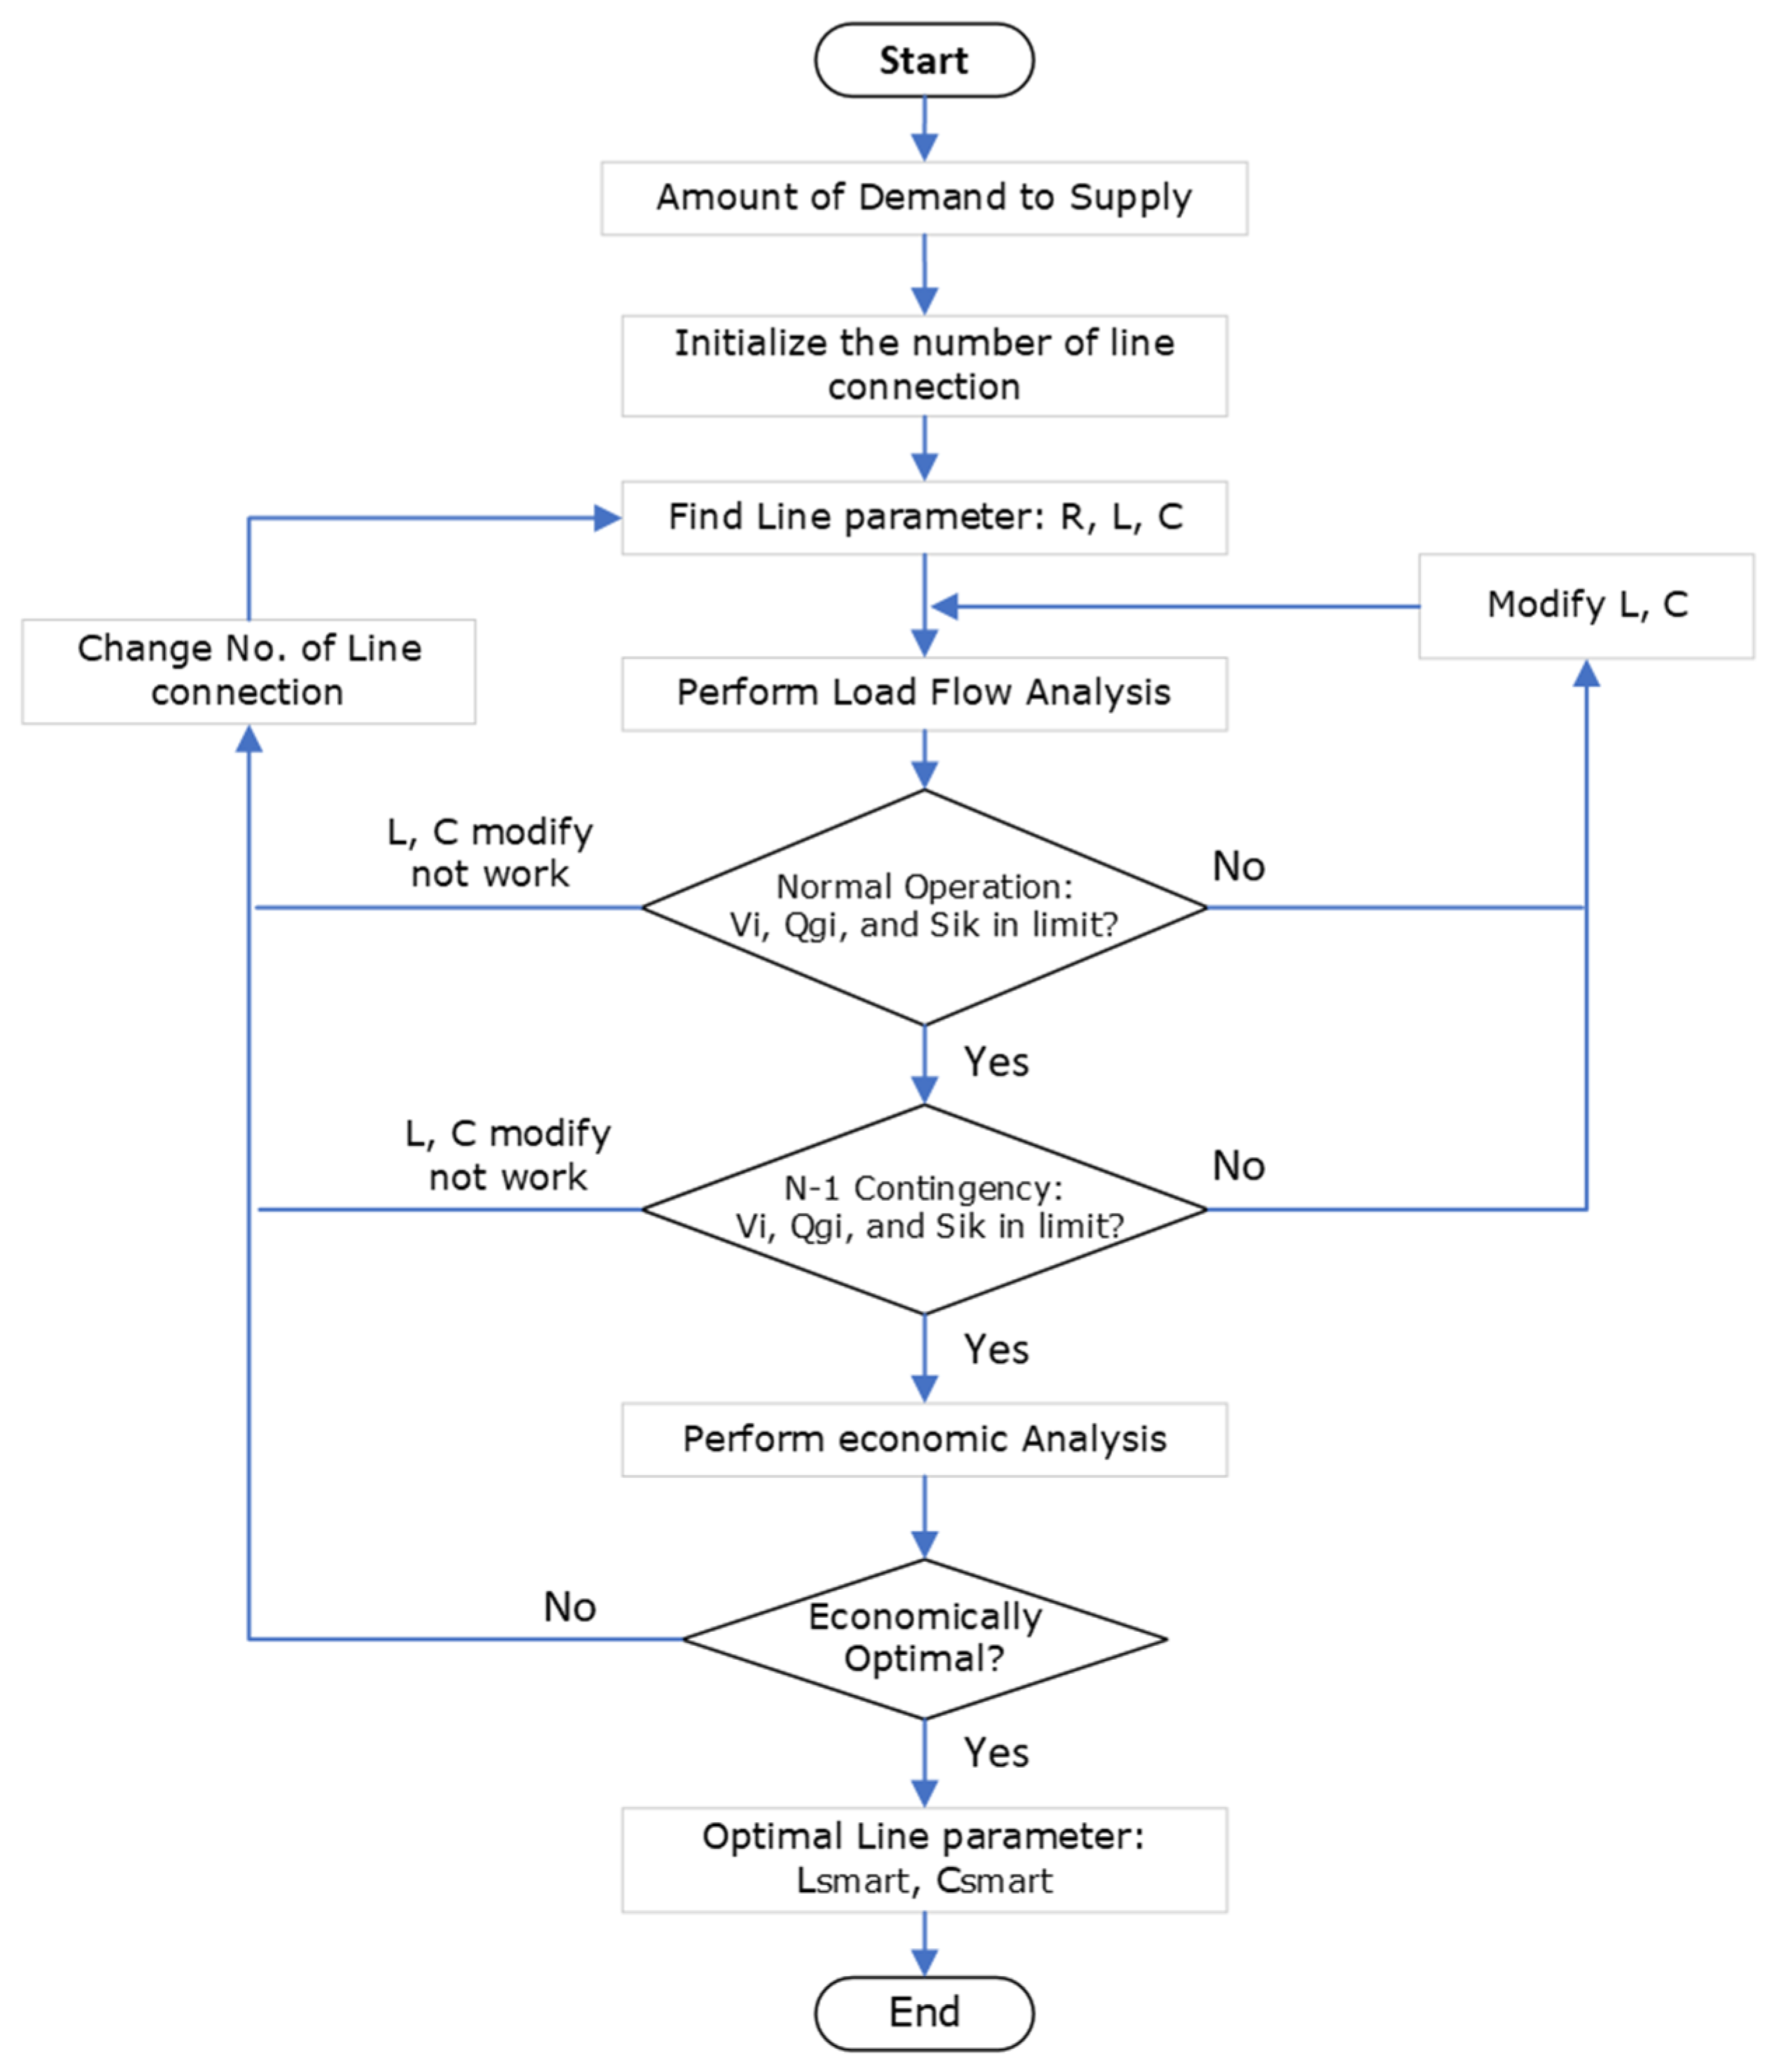
The methodology for smart transmission expansion planning is thoroughly elucidated within the comprehensive flowchart shown in Figure 4.
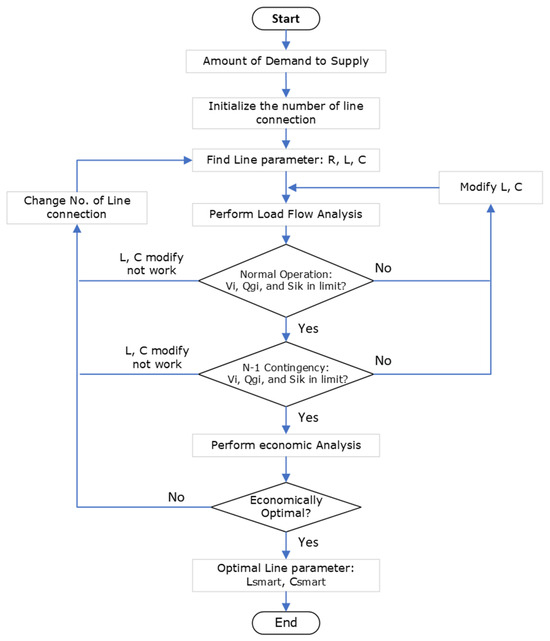
Figure 4.
Flow chart of the methodology used for smart TEP.
3.2.2. TEP Analysis
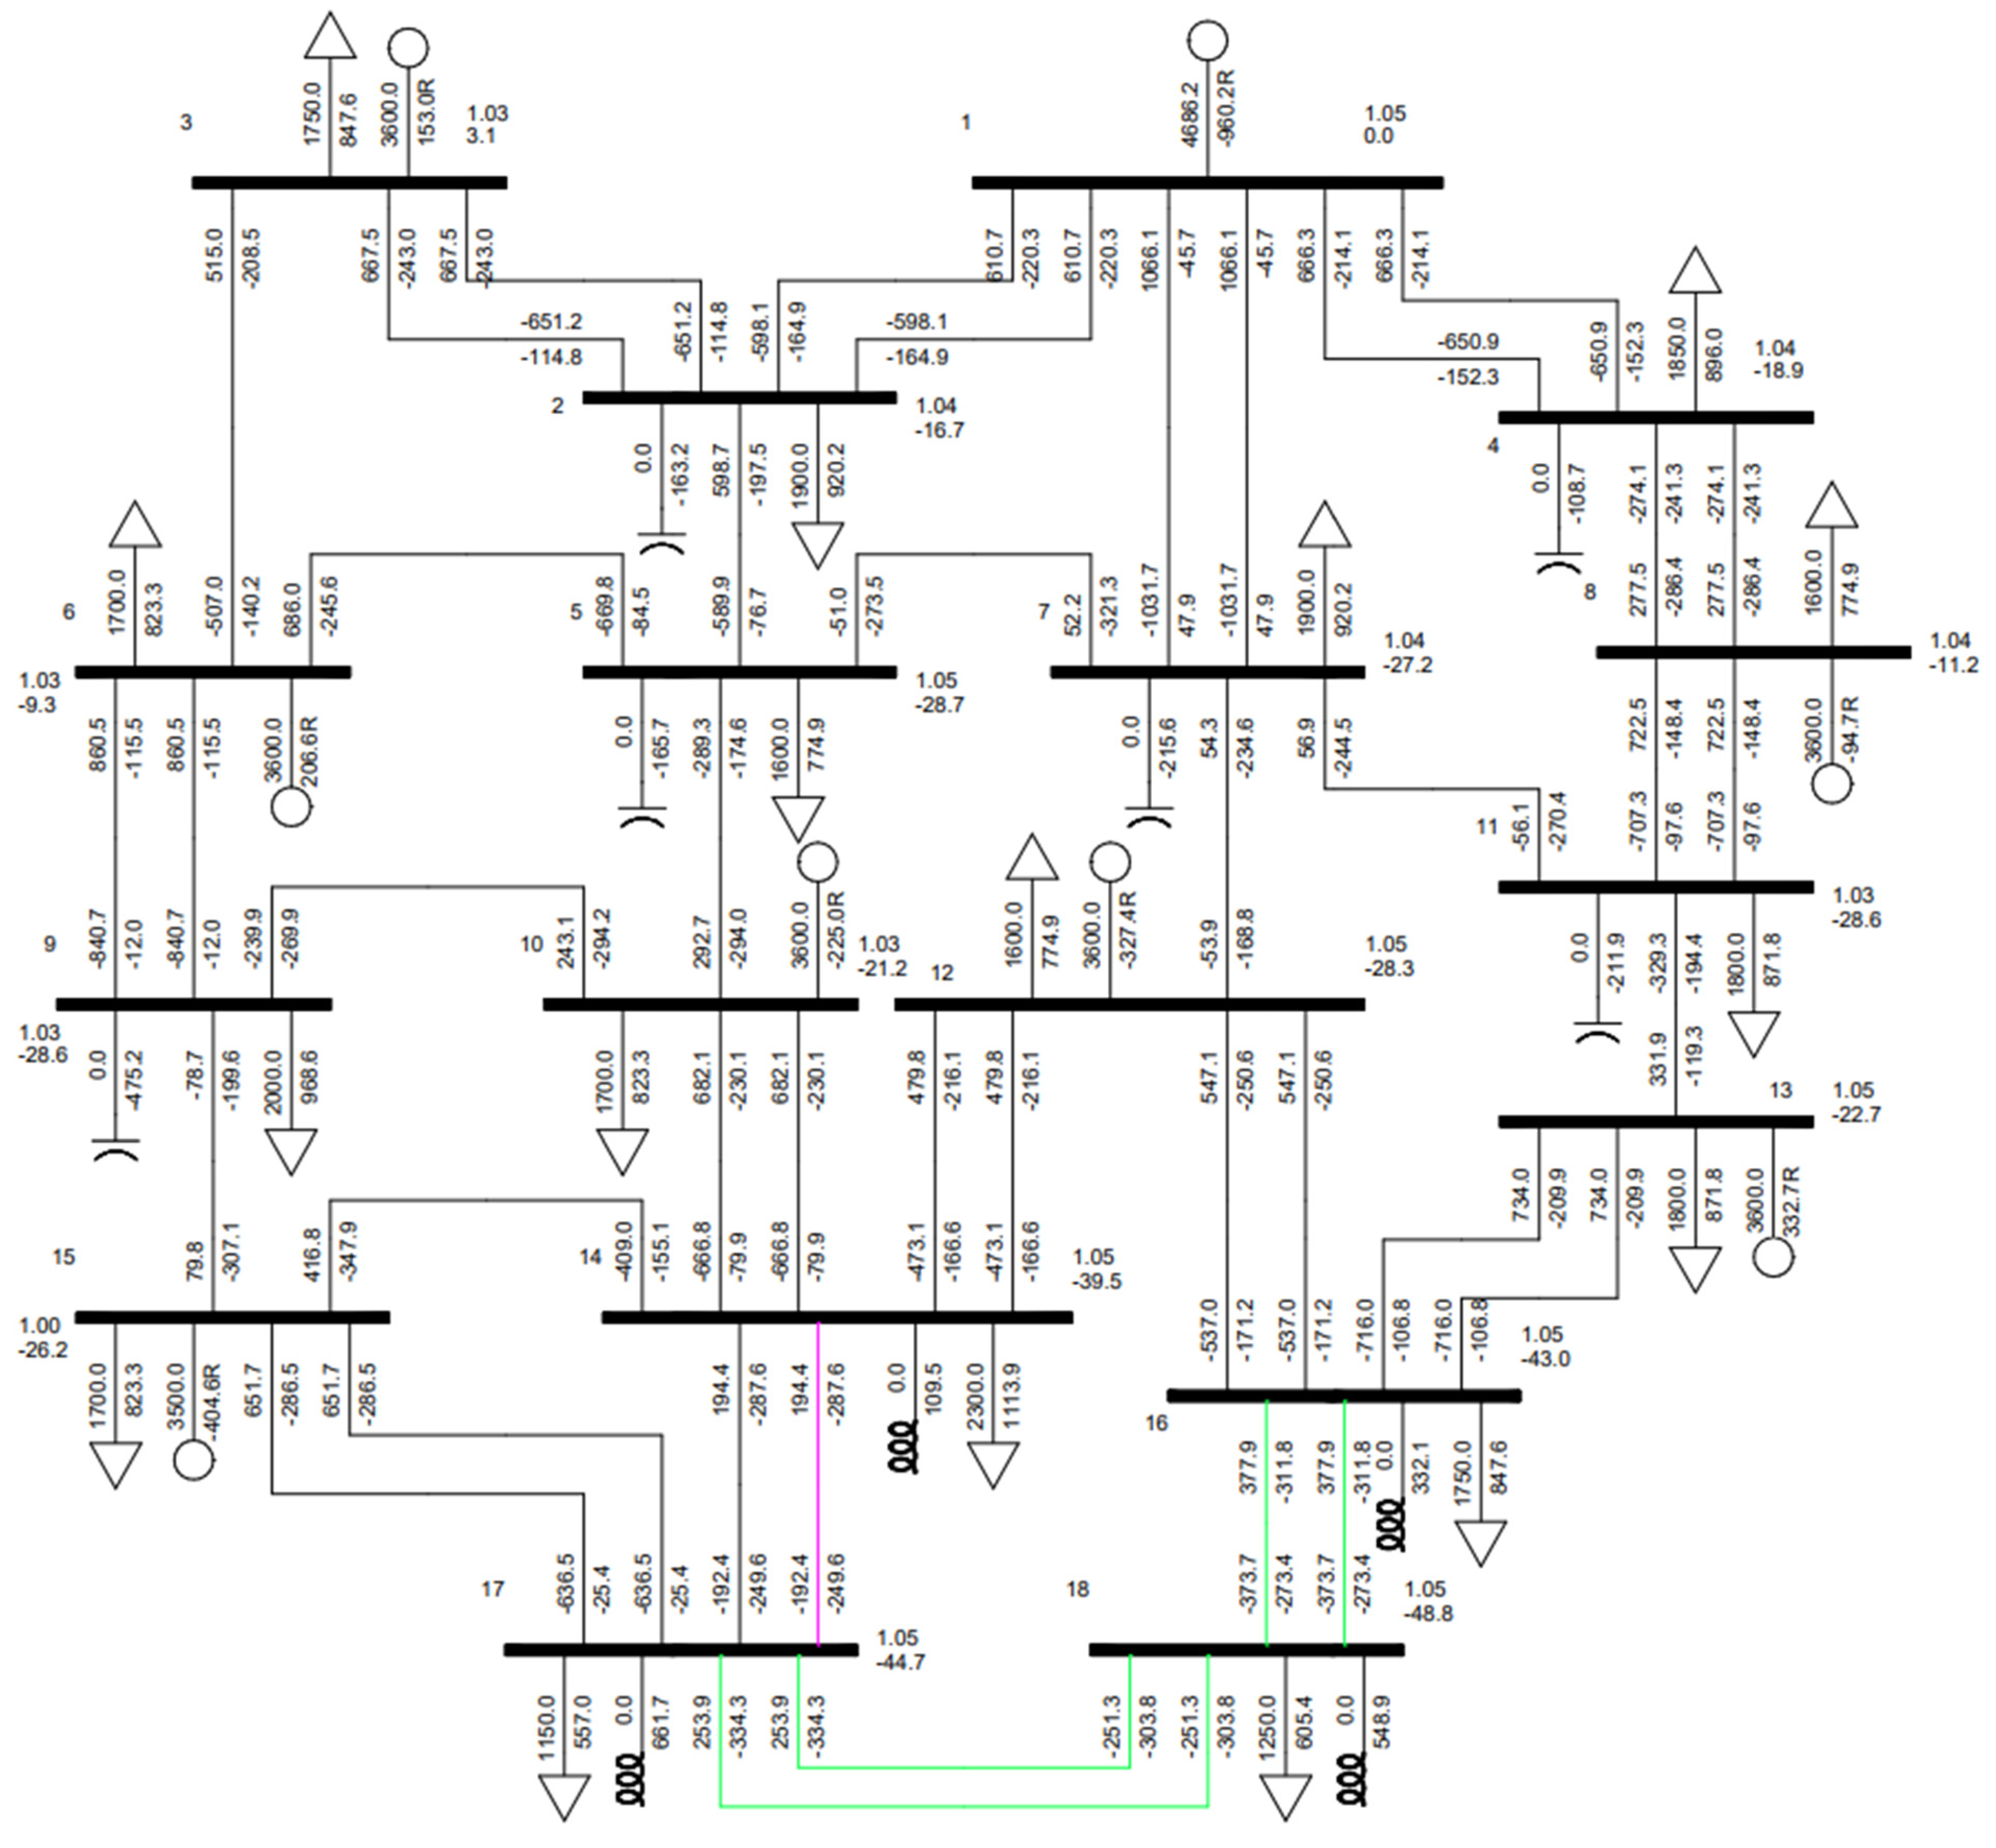
If the transmission line undergoes a redesign, altering the line configuration to achieve line inductance and capacitance values equal to 90% of those of the unconventional line specified in Section 3.1, while maintaining an identical total conductor cross-section and hence the same line resistance, it becomes feasible to supply the 1250 MW load with a 0.9 lagging power factor at bus 18 using only two-line connections from bus 16 to bus 18 and two-line connections from bus 17 to bus 18. Notably, there would be no requirement for an additional line connection between buses 14 and 17. This TEP approach fulfills the system requirements under normal and all single-contingency conditions, encompassing peak loading conditions as well as other loading conditions such as dominant and light loadings. The line inductance and capacitance for this reconfigured line are specified as 0.5571 mH/km and 16.379 nF/km, respectively. All transmission lines are modeled using an equivalent model for long transmission lines. The total per-unit series and shunt parameters for lines 16–18 and 17–18 are detailed in Table 6.
Table 6.
Per-unit line parameters for the transmission line for smart TEP.
To ensure the satisfactory operation of the system under normal conditions and all single contingencies, a cumulative capacity of 1400 Mvar shunt capacitors and 900 Mvar shunt reactors is essential within the system. The precise allocation of shunt compensation capacity and their respective buses are presented in Table 7.
Table 7.
Shunt compensation information at peak load, dominant load, and light loadings for smart TEP.
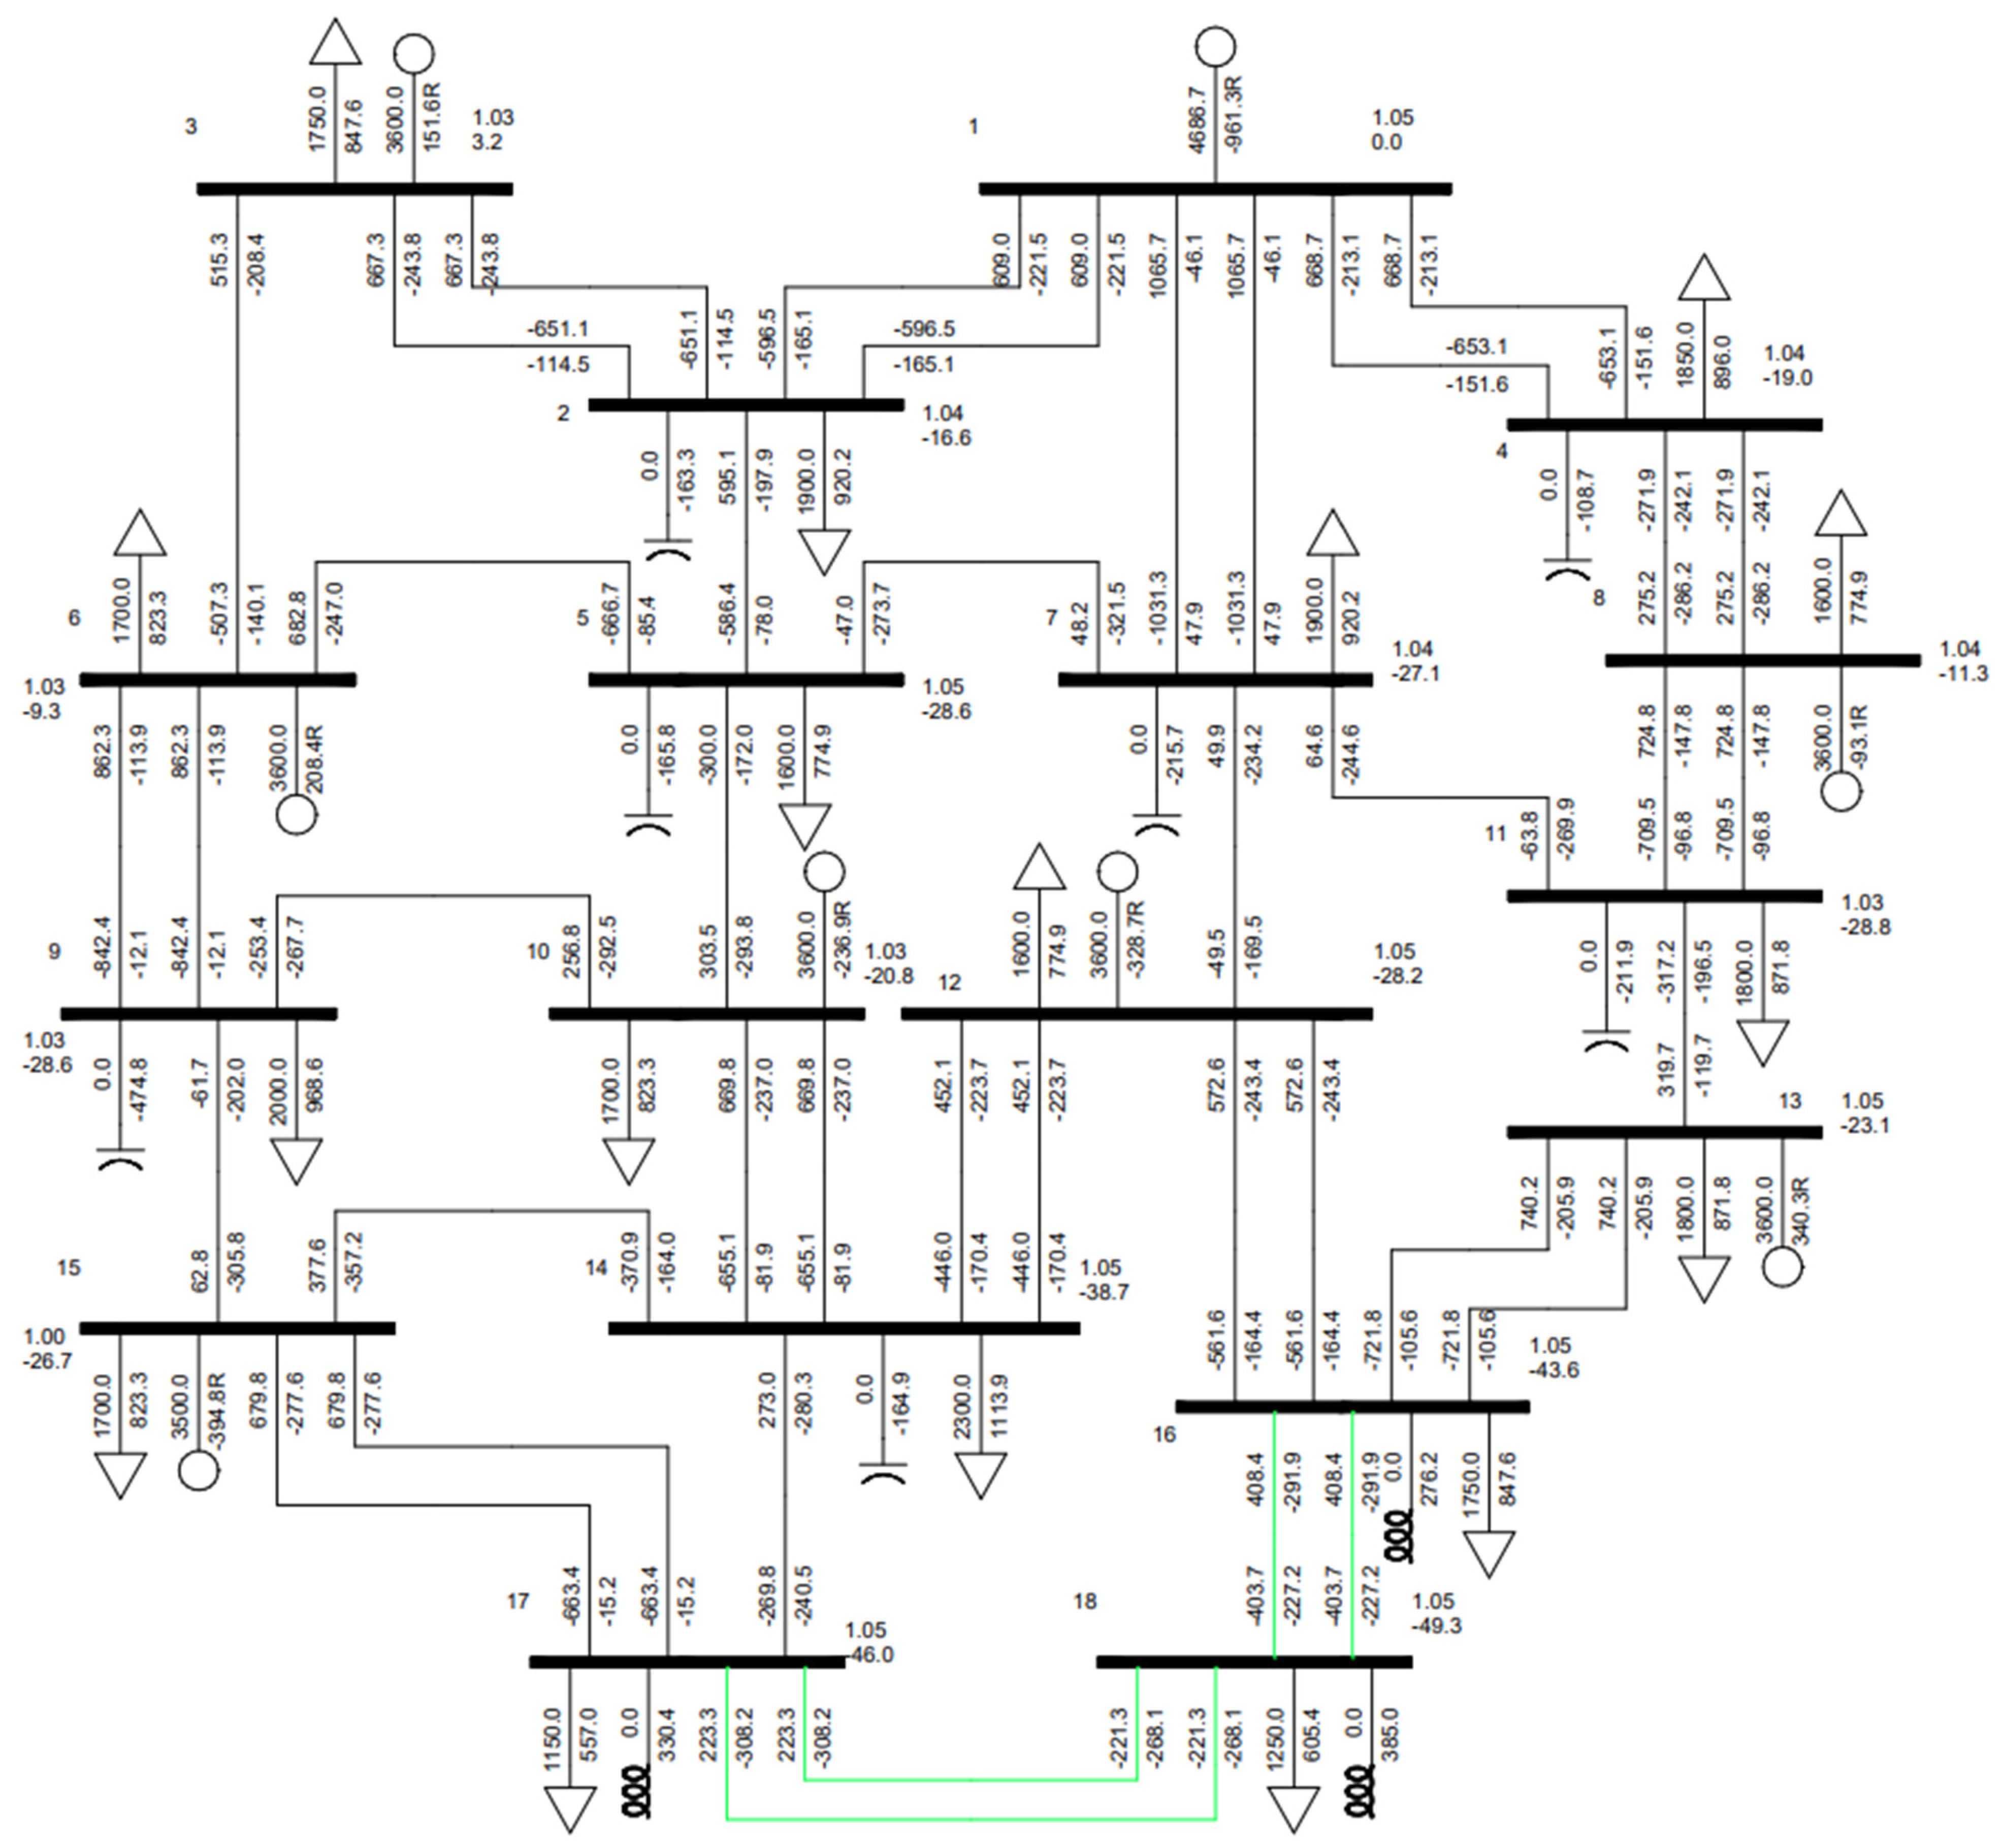
The detailed load flow analysis for this TEP approach, denoted as smart TEP, at peak load under normal operating condition is illustrated in Figure 5.
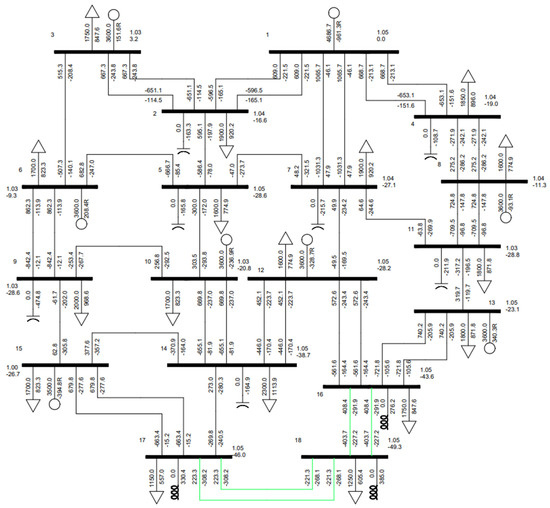
Figure 5.
Smart TEP with the new unconventional line based on system requirement.
As evidenced by the comprehensive load flow analysis, the system successfully satisfies all technical requisites under steady-state operating conditions. Evidently, the voltage limits of all the generating units, loading constraints of the transmission lines, and reactive power generation for all generating units linked to PV buses remain within the prescribed limits necessary for seamless system operation under normal conditions. The total power loss in the system at peak loading conditions for smart TEP is 436.7 MW.
Furthermore, the system complies with these requirements across various loading scenarios, including dominant and light loading under normal and all single-contingency conditions. Adjustments to the shunt reactors are essential to ensure the technical integrity of the test system in both dominant and light loading conditions under regular operation and all single-contingency scenarios. Specifically, a total capacity of 3200 Mvar shunt reactors is needed to address the dominant loading, and a total capacity of 7450 Mvar shunt reactors for the light loading condition, as detailed in Table 7.
In the same network configuration, the TEP utilizing a conventional line can supply a maximum load of 1250 MW with a power factor of 0.9 at bus 18, meeting all requirements for all single-contingency situations. Under normal operating conditions, this setup can deliver a load of up to 2400 MW on bus 18. Similarly, employing an unconventional HSIL line as illustrated in Figure 2, the TEP (Figure 3) can accommodate a load of up to 1325 MW, ensuring adherence to all the technical requirements during any contingency event. Moreover, this configuration can effectively sustain a load of up to 2850 MW at bus 18 while satisfying all technical specifications during regular operation. On the other hand, the line with parameters designated by smart TEP can deliver a power output of 1310 MW at bus 18, fulfilling all technical prerequisites during all single contingencies. It can handle a load of up to 2900 MW at bus 18 under regular operational conditions. However, compensation must be adjusted for each case to ensure satisfactory operation under normal operating conditions and single-contingency situations. This analysis demonstrates that the smart TEP option with an unconventional line configuration has a greater capacity to handle future increased loads with fewer lines compared to the conventional and unconventional HSIL lines considered.
4. Cost Comparison
In this TEP study, four Macaw conductors per bundle were used for the TEP with the conventional line, and eight Chickadee conductors per bundle per phase were used for the TEP with both the unconventional HSIL line and the line considered in the smart TEP. These conductors were chosen in such a way that the total aluminum cross-section for the four macaw conductors was identical to that of the eight-chickadee conductor. In addition, the total weight per km for four macaw conductors and eight chickadee conductors is almost the same. Therefore, the cost of the conductors and the tower’s strength to handle the conductor weight per circuit are comparable in all the considered TEP cases.
Various components need to be factored into determining the expenses for each TEP case. These include the costs associated with the 500 kV transmission line, the shunt reactor, the bay, and energy loss costs. Detailed information about these cost elements can be found in the 2023 report from the Midcontinent Independent System Operator (MISO) on the Transmission Cost Estimation Guide [23]. The report provides comprehensive information on the average transmission line costs, expenses related to incorporating bays for new line connections, and the unit costs of grid-supporting equipment like shunt reactors or shunt capacitors across different voltage levels, including 500 kV. According to the report, the average cost of a single-circuit 500 kV transmission line varies across different states in the United States, with an average cost of USD 2.672 million per kilometer. In addition, integrating a bay into a 500 kV substation equipped with necessary features like a breaker and half-bus characteristics for facilitating new line connections costs approximately USD 7.0 million. The report also indicates that the shunt reactor cost per Mvar is estimated to be USD 23,625. It is important to note that connecting the shunt compensating devices to bus 18, the new bus after TEP, requires an additional bay.
When planning the expansion of a transmission system, it is essential to consider the cost of power losses within the system. The generation units compensate for these losses and can be quantified in terms of generation cost, equivalent to the amount of power loss. According to reference [24], the average capital cost per MW of generation units for natural gas-fired combined cycle power plants in the U.S. is USD 1.04 million. Additionally, as outlined in reference [25], the fixed operational and maintenance (O&M) cost for such a plant is USD 30,000 per MWh, with a variable O&M cost of USD 1.92 per MWh. Therefore, the annual operation and maintenance cost for generating 1 MW of power would be approximately USD 0.046819 million. The average cost of natural gas in 2023 was reported to be USD 2.665 per MMbtu [26], and the heat rate was 6.30 MMbtu/MWh [25]. As a result, the annual fuel cost for a 1 MW power plant amounts to approximately USD 0.147076 million. The cost analysis of each TEP case was conducted, assuming the transmission line has a lifespan of 30 years and constant O&M and fuel costs over the period. The results presented in Table 8 show that smart TEP has the lowest total cost among the three approaches, which is USD 1082.737 million cheaper than the conventional line and USD 1106.817 million cheaper than the unconventional HSIL line presented in Section 3.
Table 8.
Total cost of each TEP case.
It should be noted that line design is a complex multidisciplinary and interdisciplinary subject. Different electrical, mechanical, and structural aspects need to be studied when developing a new design for an overhead line. Some of the electrical aspects are corona effects (corona loss, audible noise, and radio and television interferences), electric and magnetic fields under the line, various types of electromagnetic transients and insulation coordination, etc. The idea of determining the optimal line parameters leading to a cost-effective scenario for a TEP study, or combining line design and TEP studies is feasible. However, to determine the optimal number, type, and location of subconductors in space leading to these optimal line parameters, other aspects of line design should be also studied. For example, it must be determined if the electric and magnetic fields at the edge of the right-of-way of the line meet the related guidelines or not. The number and location of shield wires necessary to protect this new line against lightning strikes must also be determined. Each of these topics could be a separate study and are beyond the scope of this paper. Once all are these questions are addressed, given the remarkable savings resulting from the idea of this paper, this approach will be the preferred strategy when performing a TEP study.
It also should be noted that a new type of conductor, tower, insulator, or special materials for tower foundations are not being proposed or introduced in this paper. In other words, all the components and materials used in the smart and unconventional HSIL lines are those available on the market. Therefore, these items will not have an impact on price. However, for any new line design, all various electrical, mechanical, and structural aspects of line design need to be studied, as mentioned above. Some of these aspects, like the electric and magnetic fields under the line at the ground level or at a height of 1 m, can be easily studied using existing analytical methods and computer code. Some other aspects, like corona loss, radio interference, etc., which are mainly based on empirical formulae, need to be studied in a full-scale testing facility, and this may be a costly and time-consuming process. However, all costs and efforts to test and evaluate different line design aspects are a one-time cost and effort. The key contribution and idea of this paper is to show that the line parameters that have had no role in TEP studies to date can be determined and tailored for a TEP study, leading to a remarkable cost-effective scenario. This means that even for a given base system, different TEP case studies lead to different line parameters and, in turn, different line designs; and handling all line design aspects for each one can be a barrier to the practical realization of the idea. This is the case for any new/novel idea where many technical challenges need to be addressed. In this regard, different aspects of line design can be carried out for a range or area of positions for subconductors, and for a range of the number of subconductors in the bundle for a given voltage level, for example, 500 kV. As a result, we can have a range of line parameters and consider this as a constraint in the TEP optimization problem. This, of course, opens new windows for research. For example, it is necessary to obtain empirical formulae for those ranges considered, or to move toward developing or improving the basic theoretical approaches for different aspects of line design like corona loss. All these are open questions that need further research. However, the savings that can result from the idea are so great (for example, more than 1000 million USD in the TEP case presented here) that it is worth conducting these studies.
5. Conclusions
This paper introduces a new concept in transmission expansion planning based on unconventional lines named “smart transmission expansion planning”. Departing from traditional methodologies, this innovative approach tailors the planning process to the specific needs of the designated expansion system, treating line parameters as variables. Instead of relying on standard-design conventional lines, the planning procedure involves identifying optimal line parameters capable of meeting operational technical criteria while maximizing cost-effectiveness. Through meticulous load flow analyses conducted under various conditions, including peak load, dominant load, and light load, the performance of transmission lines designed with optimal parameters is compared against performance utilizing conventional lines. The results underscore the effectiveness of transmission lines engineered with optimal parameters, demonstrating superior efficiency in meeting demands with fewer lines compared to alternative approaches.
Author Contributions
Conceptualization, B.D. and M.G.; methodology, B.D. and M.G.; software, B.D. and M.G.; validation, B.D. and M.G.; formal analysis, B.D. and M.G.; investigation, B.D. and M.G.; writing—original draft preparation, B.D.; writing—review and editing, M.G.; supervision, M.G.; project administration, M.G.; funding acquisition, M.G. All authors have read and agreed to the published version of the manuscript.
Funding
This research was supported in part by the National Science Foundation (NSF) under Award 2306098.
Data Availability Statement
Data are contained within the article.
Conflicts of Interest
The authors declare no conflicts of interest.
References
- Henderson, M.I.; Novosel, D.; Crow, M.L. Electric Power Grid Modernization Trends, Challenges, and Opportunities. Available online: https://www.cmu.edu/epp/irle/readings/henderson-novosel-crow-electric-power-grid-modernization.pdf (accessed on 2 March 2024).
- Heeter, J.S.; Speer, B.K.; Glick, M.B. International Best Practices for Implementing and Designing Renewable Portfolio Standard (RPS) Policies. NREL/TP--6A20-72798, April 2019. Available online: https://www.nrel.gov/docs/fy19osti/72798.pdf (accessed on 2 March 2024).
- U.S. Energy Information Administration (EIA). International Energy Outlook. Available online: https://www.eia.gov/outlooks/ieo/data.php (accessed on 12 December 2023).
- World Energy Transitions Outlook 2023. Available online: https://www.irena.org/Digital-Report/World-Energy-Transitions-Outlook-2023#page-2 (accessed on 15 March 2024).
- Drossman, J.; Williams, R.; Pacala, S.; Socolow, R. Net-Zero America: Potential Pathways, Infrastructure, and Impacts. Available online: https://netzeroamerica.princeton.edu/img/Princeton_NZA_Interim_Report_15_Dec_2020_FINAL.pdf (accessed on 2 March 2024).
- Scribd. Kiessling Overhead Power Lines Planning Design Construction|PDF|Manufactured Goods|Electric Power Distribution. Available online: https://www.scribd.com/doc/216733502/Kiessling-Overhead-Power-Lines-Planning-Design-Construction (accessed on 15 March 2024).
- Commonwealth of Virginia, Joint Legislative Audit and Review Commission. Evaluation of Underground Electric Transmission Lines in Virginia, House Document No. 87, 2006. Available online: https://rga.lis.virginia.gov/Published/2006/HD87 (accessed on 2 March 2024).
- Bak, C.L.; da Silva, F.F. High voltage AC underground cable systems for power transmission—A review of the Danish experience, part 1. Electr. Power Syst. Res. 2016, 140, 984–994. [Google Scholar] [CrossRef]
- Arcia-Garibaldi, G.; Cruz-Romero, P.; Gómez-Expósito, A. Future power transmission: Visions, technologies and challenges. Renew. Sustain. Energy Rev. 2018, 94, 285–301. [Google Scholar] [CrossRef]
- Sapkota, S.; Pokharel, K.; Li, W.; Wang, Y.; Saleem, U. An improved bidirectional T-source circuit breaker for MVDC. Electr. Eng. 2022, 104, 2319–2332. [Google Scholar] [CrossRef]
- Sun, M.; Cremer, J.; Strbac, G. A novel data-driven scenario generation framework for transmission expansion planning with high renewable energy penetration. Appl. Energy 2018, 228, 546–555. [Google Scholar] [CrossRef]
- Yin, S.; Wang, J. Generation and transmission expansion planning towards a 100% renewable future. IEEE Trans. Power Syst. 2022, 37, 3274–3285. [Google Scholar] [CrossRef]
- Ugranli, F.; Karatepe, E. Transmission expansion planning for wind turbine integrated power systems considering contingency. IEEE Trans. Power Syst. 2016, 31, 1476–1485. [Google Scholar] [CrossRef]
- Wu, Z.; Liu, Y.; Gu, W.; Wang, Y.; Chen, C. Contingency-constrained robust transmission expansion planning under uncertainty. Int. J. Electr. Power Energy Syst. 2018, 101, 331–338. [Google Scholar] [CrossRef]
- Roldán, C.; Mínguez, R.; García-Bertrand, R.; Arroyo, J.M. Robust transmission network expansion planning under correlated uncertainty. IEEE Trans. Power Syst. 2019, 34, 2071–2082. [Google Scholar] [CrossRef]
- Buygi, M.O.; Balzer, G.; Shanechi, H.M.; Shahidehpour, M. Market-based transmission expansion planning. IEEE Trans. Power Syst. 2004, 19, 2060–2067. [Google Scholar] [CrossRef]
- Babić, A.B.; Sarić, A.T.; Ranković, A. Transmission expansion planning based on locational marginal prices and ellipsoidal approximation of uncertainties. Int. J. Electr. Power Energy Syst. 2013, 53, 175–183. [Google Scholar] [CrossRef]
- Alexandrov, G.N. Design of Compacted UHV Transmission Line; Energoatomizdat: Moscow, Russia, 1993. (In Russian) [Google Scholar]
- Ghassemi, M. High surge impedance loading (HSIL) lines: A review identifying opportunities, challenges, and future research needs. IEEE Trans. Power Del. 2019, 34, 1909–1924. [Google Scholar] [CrossRef]
- Dhamala, B.; Ghassemi, M. Unconventional high surge impedance loading (HSIL) lines and transmission expansion planning. IEEE N. Am. Power Symp. (NAPS) 2023, 1–6. [Google Scholar] [CrossRef]
- Dhamala, B.; Ghassemi, M. Comparative Study of Transmission Expansion Planning with Conventional and Unconventional High Surge Impedance Loading (HSIL) Lines. In Proceedings of the IEEE PES General Meeting, Seattle, WA, USA, 21–25 July 2024. [Google Scholar]
- Dhamala, B.; Ghassemi, M. A Test System Meeting Requirements under Normal and Contingency Conditions at Multiple Loadings for Transmission Expansion Planning. In Proceedings of the IEEE Dallas Circuits and Systems Conference (DCAS), Dallas, TX, USA, 19–21 April 2024. [Google Scholar]
- Transmission Cost Estimation Guide for MTEP23, Midcontinent Independent System Operator (MISO). May 2023. Available online: https://www.misoenergy.org/planning/transmissionplanning/#t=10&p=0&s=FileName&sd=desc (accessed on 2 March 2024).
- CPV Three Rivers Energy Center, Illinois, US. Power Technology. Available online: https://www.power-technology.com/projects/cpv-three-rivers-energy-center-illinois-us/ (accessed on 2 March 2024).
- Technologies|Electricity|2023|ATB|NREL. Available online: https://atb.nrel.gov/electricity/2023/technologies (accessed on 2 March 2024).
- Natural Gas Futures Contract 1 (Dollars per Million Btu). Available online: https://www.eia.gov/dnav/ng/hist/rngc1M.htm (accessed on 2 March 2024).
Disclaimer/Publisher’s Note: The statements, opinions and data contained in all publications are solely those of the individual author(s) and contributor(s) and not of MDPI and/or the editor(s). MDPI and/or the editor(s) disclaim responsibility for any injury to people or property resulting from any ideas, methods, instructions or products referred to in the content. |
© 2024 by the authors. Licensee MDPI, Basel, Switzerland. This article is an open access article distributed under the terms and conditions of the Creative Commons Attribution (CC BY) license (https://creativecommons.org/licenses/by/4.0/).