Article

Reconceptualizing Reliability Indices as Metrics to Quantify Power Distribution System Resilience

by
Gerald A. Abantao
1,
Jessa A. Ibañez
2,
Paul Eugene Delfin C. Bundoc
3,
Lean Lorenzo F. Blas
1,
Xaviery N. Penisa
4,
Eugene A. Esparcia, Jr.
4,
Michael T. Castro
4,
Roger Victor E. Buendia
2,†,
Karl Ezra S. Pilario
4,
Adonis Emmanuel D. Tio
1,
Ivan Benedict Nilo C. Cruz
1,
Joey D. Ocon
4 and
Carl Michael F. Odulio
1,*
1
Electrical and Electronics Engineering Institute, University of the Philippines Diliman, Quezon City 1101, Philippines
2
Energy Engineering Program, National Graduate School of Engineering, University of the Philippines Diliman, Quezon City 1101, Philippines
3
Department of Electrical Engineering, University of the Philippines Los Baños, Los Baños 4031, Philippines
4
Department of Chemical Engineering, College of Engineering, University of the Philippines Diliman, Quezon City 1101, Philippines
*
Author to whom correspondence should be addressed.
Deceased author.
Energies 2024, 17(8), 1909; https://doi.org/10.3390/en17081909
Submission received: 30 November 2023 / Revised: 14 February 2024 / Accepted: 12 March 2024 / Published: 17 April 2024
(This article belongs to the Special Issue Hybrid-Renewable Energy Systems in Microgrids)

Abstract

:
In regions heavily affected by recurrent typhoons, the need for more resilient electricity infrastructure is pressing. This emphasizes the importance of integrating resilience assessment, including incorporating resilience metrics, into the planning process of power distribution systems against any disruptive events. Although standardized metrics exist for assessing distribution system reliability, the absence of formalized resilience metrics hampers informed investments in critical infrastructure such as microgrid development. In this work, a set of resilience metrics is proposed by reconceptualizing reliability metrics. The metrics were formulated to account for both the type of extreme event and its specific impact on loads with varying levels of criticality. The effectiveness of the proposed metrics is demonstrated through a Philippine microgrid case study. A Monte Carlo framework incorporating an extreme event model, component fragility model, and system response model was used to quantify the resilience improvement before and after stand-alone microgrid operation of the power distribution system. Results show that the proposed metrics can effectively evaluate resilience enhancement and highlight the value of a holistic approach of considering critical loads and types of extreme events to strengthen societal and community resilience, making a compelling case for strategic investments in infrastructure upgrades such as microgrids.

1. Introduction

With the increasing dependency on an uninterrupted electricity supply across societal sectors, power system resilience is of vital importance. Resilience refers to the power system’s capability to endure and sustain a stable power supply during catastrophic events [1]. Focusing on power distribution systems, the definition can be narrowed further to indicate a continuous and stable energization of critical loads [2,3]. Such loads are life-supporting facilities whose incapacitation during extreme events could lead to severe consequences on human lives and economic operations. Catastrophic or extreme events such as typhoons, earthquakes, flooding, war, and terrorist attacks are characterized by having high impact and low frequency. However, it is anticipated that these events will have a rise in both frequency and intensity, especially in typhoons due to climate change [4]. Super typhoons in countries like the Philippines lead to prolonged outages across distribution networks, hampering post-calamity recovery. Hence, planning for these events and effectively quantifying resilience levels is paramount for developing better solutions and proposing investments.
The electric power industry has actively pursued studies on the development of resilience metrics. Notable examples include the IEEE PES Distribution Resilience Working Group’s storm and non-storm metrics, focused on weather-related events, and the US DOE’s Multi-Criteria Decision Analysis (MCDA) and Performance-based metrics, suitable for cost–benefit and planning analyses [1]. Additionally, innovative frameworks, such as the resilience trapezoid, offer a nuanced approach by breaking down resilience events into phases, enhancing the understanding of system performance throughout the process. A quantitative resilience metric system, “ΦΛEΠ,” corresponds to key attributes in the resilience trapezoid, providing a detailed evaluation of system performance in each phase [5].
Evolving resilience metrics not only deepen the understanding of power system nuances but also align with the broader perspective of measuring consequences through performance metrics. This connection gains significance when considering the frequent conflation of reliability and resilience, where both terms, typically assessed through performance metrics, share a common focus on addressing system outages. However, reliability only focuses on low-impact, high-frequency events like equipment failure, weather-related events, human error, and vegetation interference. Distribution system reliability is quantified using customer-based performance indices [6]. These include the System Average Interruption Frequency Index (SAIFI), System Average Interruption Duration Index (SAIDI), and Expected Energy Not Served (EENS). These metrics are calculated by aggregating outages and customer information over a specified period. Additionally, these metrics provide a general picture of power availability that can be easily communicated to stakeholders for annual performance regulation.
Reliability becomes an incomplete descriptor of power distribution system resilience with the increasing occurrence of extreme events. As such, resilience-motivated efforts may appear to provide minimal improvements when reliability-focused assessments and reliability metrics are used. A framework for developing resilience metrics is recommended to better evaluate resilience [7]. Resilience metrics must be (1) threat-specific, (2) based on performance, (3) measure consequence, (4) account for uncertainty, (5) effectively capture resilience, (6) not value judgment, (7) multiple, and (8) based on system-level modeling. Reliability metrics already satisfy these criteria except (1) and (5) which are what make resilience metrics different from them. Resilience metrics should reflect the specific threats a power distribution system can withstand. Moreover, to fully capture resilience from the power distribution system perspective, the metrics should also consider prioritization of critical loads.
Few studies have attempted to transform reliability metrics to assess resilience. One study [8] analyzed storm-related historical customer outage data to establish storm-based SAIFI and SAIDI, depicting the power system’s performance during such events. Another gave emphasis on the varying resilience needs of critical loads from other grid users [9]. Present regulations [10] on power distribution system performance concerning extreme events, particularly, Major Event Days, center on reliability assessments and metrics focusing on outages attributable to such days. However, there remains a lack of comprehensive studies that explore both the nuanced nature of threats and the vital prioritization of critical loads.
In this paper, a reconceptualization of reliability metrics is proposed to encompass the broader spectrum of power distribution system resilience. Here, conventional reliability metrics, namely, SAIFI, SAIDI, and EENS, are transformed to consider not only the kind of threat but also the prioritization of critical loads. This adaptation aligns with the recommended framework from [7], allowing for a more comprehensive evaluation of resilience.
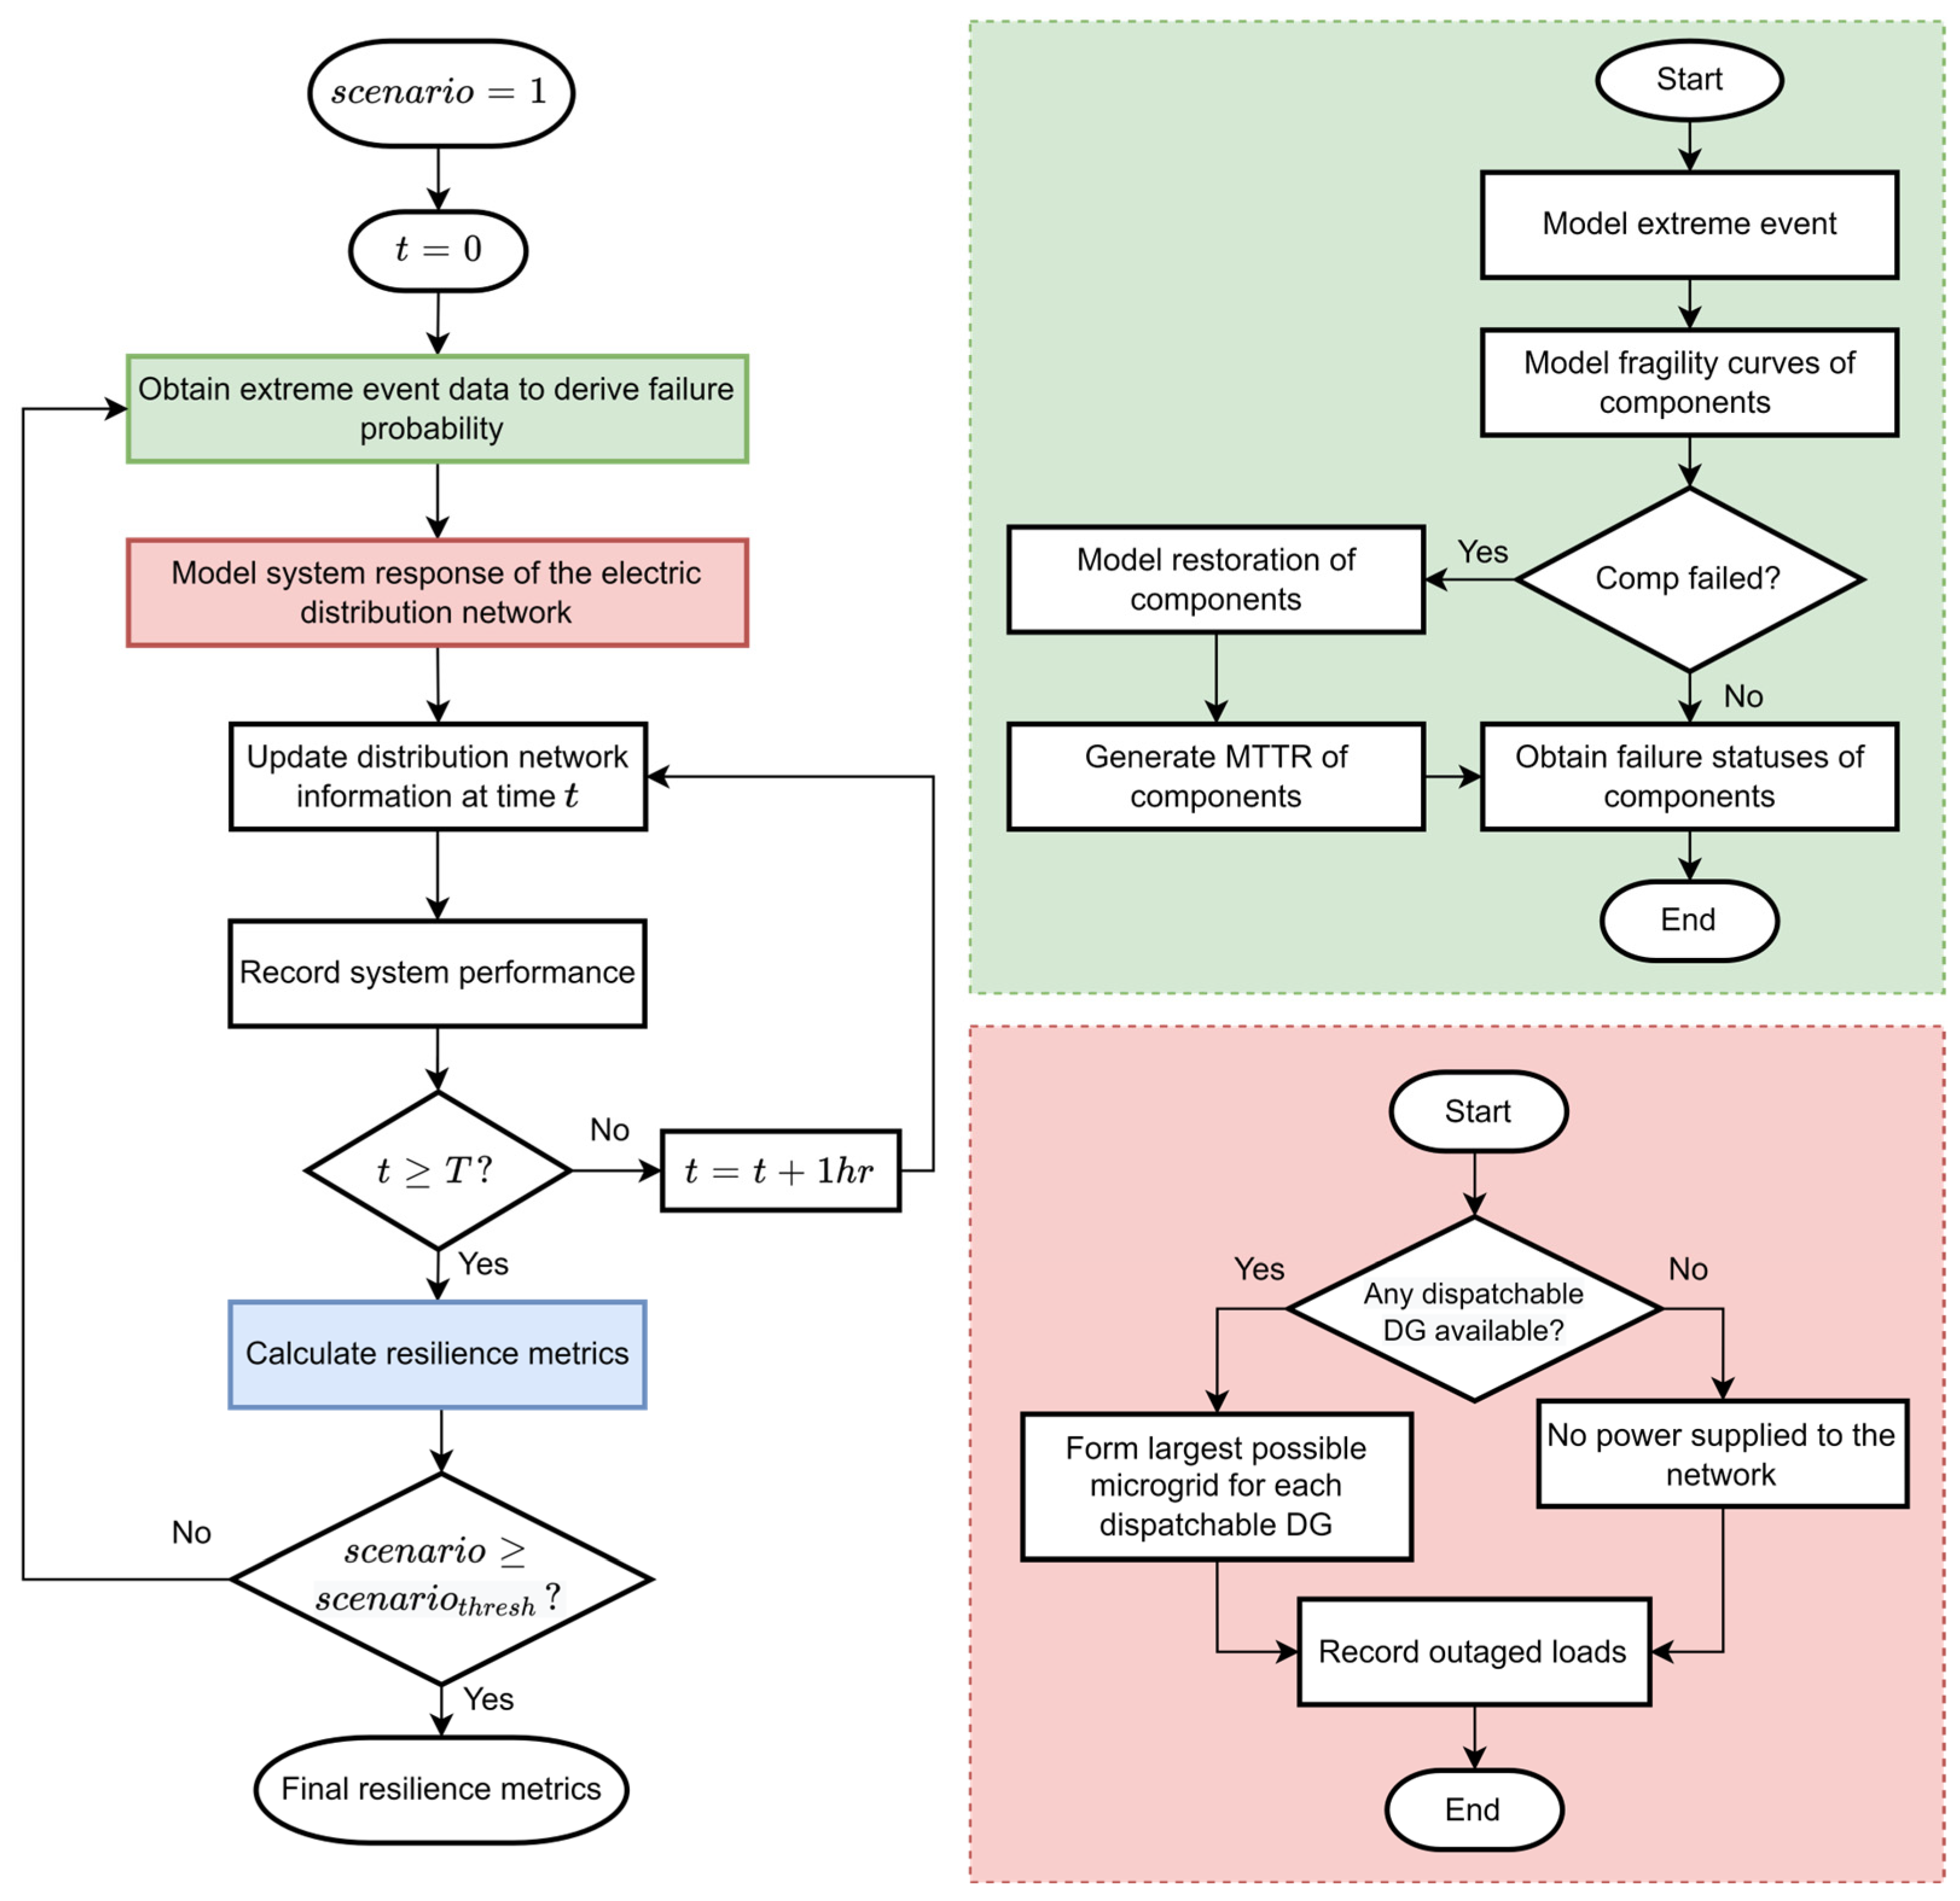
To demonstrate the effectiveness of the proposed metrics, a case study was conducted modeling a distribution utility in Kalinga, Philippines, which is a region frequently battled by typhoons. This choice is strategic, given the Philippines’ susceptibility to severe typhoons, making the research findings relevant to real-world scenarios. Employing a rigorous Monte Carlo framework, which includes an extreme event model, component fragility model, and system response model, adds a layer of statistical robustness to the power distribution system resilience assessment.
The anticipated outcomes include a quantifiable measure of power distribution system resilience improvement before and after adding distributed generation and allowing the operation of the distribution utility as a standalone microgrid, effectively showcasing the proposed metrics’ effectiveness. This nuanced understanding of power distribution system resilience will underscore the importance of adopting a holistic approach to enhance resilience. By providing concrete and measurable outcomes, this research significantly contributes to the ongoing discourse on power system resilience, offering a deeper understanding of the complex dynamics involved.
The potential significance of this research lies in guiding strategic investments, particularly in upgrading infrastructure like microgrids. Beyond the immediate context, this study carries broader implications for disaster-prone regions globally, providing insights into ensuring uninterrupted power supply to critical loads despite the challenges posed by natural calamities. Thus, this study’s contribution extends beyond theoretical frameworks, offering practical guidance for decision-makers in power distribution system planning and resilience enhancement.

2. Materials and Methods

2.1. Proposed Resilience Metrics

Resilience metrics should be able to tell what threat the system’s resilience is being measured against [7]. In the context of power distribution systems, such threats include extreme weather events that cause major disruptions in system operation and electricity supply. Different threats have different attributes that affect power systems differently. For example, flooding affects substations more, whereas strong winds affect distribution lines and poles more. Specifying the type of threat helps provide context in resilience assessment and planning.
Expectations for supply continuity also differ per customer type during extreme events. For example, loads like hospitals, evacuation centers, telecommunication, and water utilities may need to be prioritized over other types of loads in times of typhoons. Load prioritization depends on whether loads are deemed critical or not. Critical loads are facilities connected to the network that are socially, economically, or operationally essential to society or community functions [11]. The scheme used in the load prioritization may vary from system to system depending on how the community is supposed to respond to extreme events. Incorporating load prioritization in the development of resilience metrics will help capture not only the power distribution system’s performance during extreme events but also quantify the consequent effect on the continuous functioning of critical services during extreme events [7].
With these considerations, we propose three event-based resilience indices, inspired by existing reliability indices as shown in Equation (1):
Resilience event = SAIFI sys event ,   SAIDI sys event ,   EENS sys event ,
where Resilience event is the resilience of a power distribution system for a given event captured by three resilience metrics: (1) SAIFI s y s event captures the expected customer interruptions due to the extreme event, (2) SAI D I s y s event captures the expected customer interruption duration due to the extreme event, and (3) EENS sys event captures the expected energy not supplied due to the extreme event. The SAIFI, SAIDI, and EENS [10,12] are commonly used to regulate the reliability of the operation of distribution utilities. Designing resilience metrics based on these widely used reliability metrics will make it easier for utilities and regulators who are already familiar with these metrics to adapt the same metrics for resilience assessment and regulation.
Used in resilience, SAIFI s y s event measures the magnitude of an extreme event’s impact by counting how many times an average customer was interrupted as the extreme event progressed. Consequently, this measures the distribution system’s susceptibility to the impacts of extreme events. For a given extreme event, the SAIFI resilience metrics for each priority level are computed. Each priority level is then assigned a corresponding weight which varies depending on the needs and concerns of the utility. The resilience metric is then computed as the weighted sum of all priority-level resilience metrics. In summary, for a given extreme event, the SAIFI resilience metrics for each priority level and for the whole system, respectively, are calculated as follows:
SAIFI prio event = LP N prio int , LP N prio T
SAIFI s y s event = priority levels ( w prio ×   SAIFI prio event ) ,
where N prio int , LP is the number of interrupted loads connected at load point LP with priority level prio, N prio T is the total number of individual loads in the distribution system with priority level prio, and wprio is the weight assigned to each priority level.
Likewise, the SAI D I s y s event resilience metric measures the average duration of interruption experienced by the loads during an extreme event. This can be associated with how fast the distribution utility can restore power to the affected loads. Equations (4) and (5) define the SAIDI resilience metrics as follows:
SAIDI prio event = LP U LP N prio int , LP N prio T
SAIDI s y s event = priority levels ( w prio × SAI D I prio event ) ,
where U LP is the time duration in hours during which the loads at load point LP are unavailable.
Lastly, the EENS s y s event is included to measure how well the distribution system can maintain sufficient power delivered during resilience events. Equations (6) and (7) define the EENS resilience metrics as follows:
EENS prio event = LP U LP P prio LP
EENS s y s event = priority levels ( w prio × EENS prio event ) ,
where P prio LP is the total peak demand of loads at load point LP with priority level prio. In parallel with reliability, these resilience metrics can be used in assessing baseline resilience and in quantifying future efforts to improve the resilience of the distribution system.
The proposed set of metrics can be used as an integral part of the resilience assessment step in grid-connected microgrid planning such as in the planning framework proposed in [13]. Such implementation offers distribution utilities an opportunity to leverage the proposed metrics in justifying resilience mitigation measures. For example, the Philippine Department of Energy has mandated energy players to submit their Resiliency Compliance Plan [14] where the proposed resilience metrics will be of great benefit in the quantification of an energy player’s compliance measures.

2.2. Resilience Assessment Framework

Quantifying the resilience improvement is needed to justify investment costs associated with the planning measures to the regulator [7]. The assessment methodology was guided by the resilience assessment framework proposed in [15] that uses a non-sequential Monte Carlo resilience assessment model. In this model, an extreme event can cause cascading failures, i.e., cause the failure of spatially dispersed devices and eventually lead to a whole system outage. However, due to the lack of extreme event data with high resolution, the impact of the extreme event was modeled to be a single instantaneous system interruption without cascading outages. The definition of the needed models used in the case study is discussed below.

2.2.1. Extreme Event Model

Typhoon is the extreme event considered in this case study since it is the most common in the region. This kind of extreme event is typically modeled using a probability distribution of maximum sustained wind speeds. The Gumbel probability distribution is suggested for this kind of modeling. The Gumbel distribution is defined in Equations (8)–(10) as follows:
F ( v ) = e e a ( v b )
a = π σ 6
b = V - 0.45 σ
where v is the maximum sustained wind speed of the typhoon extreme event, a is the scale parameter, b is the location parameter, V - is the mean maximum sustained wind speed from historical data, and σ is the standard deviation of the maximum sustained wind speed from historical data [16]. Using the inverse of Equation (8), the maximum sustained wind speeds of the typhoon extreme event can be sampled.

2.2.2. Component Fragility Model

A component’s propensity to fail during an extreme event is typically modeled using fragility curves. In a fragility curve, the intensity parameter of the extreme event is mapped against the failure probability of the component. For typhoons in distribution systems, the failure probability is the likelihood of the distribution pole or overhead line failing for a given value of maximum sustained wind speed. Such curves are typically generated from a wide range of historical data. However, in times when such data are difficult to obtain, empirical failure equations can also be used instead. Equations (11) and (12) [15] model the fragility of the distribution poles and overhead lines in this case study as follows:
FP pl = 0.0001 × e ( 0.0421 × V w )
FP ij = 1     pl = 1 NP ( 1     FP pl ) ,
where FP pl is the failure probability of distribution poles, FP ij is the failure probability of overhead lines between bus i and j, NP is the number of poles between bus i and j, and V w is the maximum sustained wind speed value in mph during a typhoon extreme event. In conjunction with the extreme event model, network topology data, and the system response model, fragility curves can be used to model the number of customers on outage as well as the duration of interruption because of extreme events.

2.2.3. Resilience Assessment Model

The non-sequential Monte Carlo resilience assessment used in this case study is a scenario-based assessment model. This means that for each Monte Carlo simulation, the distribution system is subjected to an extreme event scenario with randomly sampled parameters. Each Monte Carlo simulation is composed of three parts as follows and is summarized in Figure 1.
  • Generation of artificial operating histories
The artificial operating histories simulate which lines are damaged and for how long the system is down due to the wind speed associated with a typhoon. Line outage status and outage duration are determined using Equations (13) and (14) [15,17] as follows:
γ ij line = 1 ,   if   FP ij     x line ( = U 0 , 1 ) 0 , otherwise
M TTR = MTTR normal ,   V w   20   m / s a 1   ×   MTTR normal , 20   m / s   <   V w 40   m / s a 2   ×   MTTR normal , 40   m / s   <   V w 60   m / s , a 1 ~ U 2 ,   4   and   a 2 ~ U 5 ,   7  
where γ ij line is the failure status of the overhead line and MTTR is the mean-time-to-repair. The failure probability of the overhead line is compared with a uniformly distributed variable and if it is greater than that variable, it means that the line has failed and will be out until it is repaired. The mean-time-to-repair (MTTR) varies depending on the intensity of the typhoon extreme event. This is implemented using a multiplier, ai, for each level of intensity.
2.
Damage assessment and simulation of system response
The response of the distribution system varies depending on the network configuration. If there are distributed generators and switches available, islanding can be performed to restore some parts of the distribution system immediately. This reduces the duration of interruptions some customers may experience.
3.
Calculation of the resilience metrics
After simulating the line outages and system response, the number of affected customers and the duration of interruption experienced are collected per load priority. From these statistics, the proposed SAIFI s y s event , SAIDI sys event , and EENS s y s event resilience metrics are computed using Equations (2)–(7).

3. Case Study—Microgrid Operation in Kalinga, Philippines

3.1. Test Network

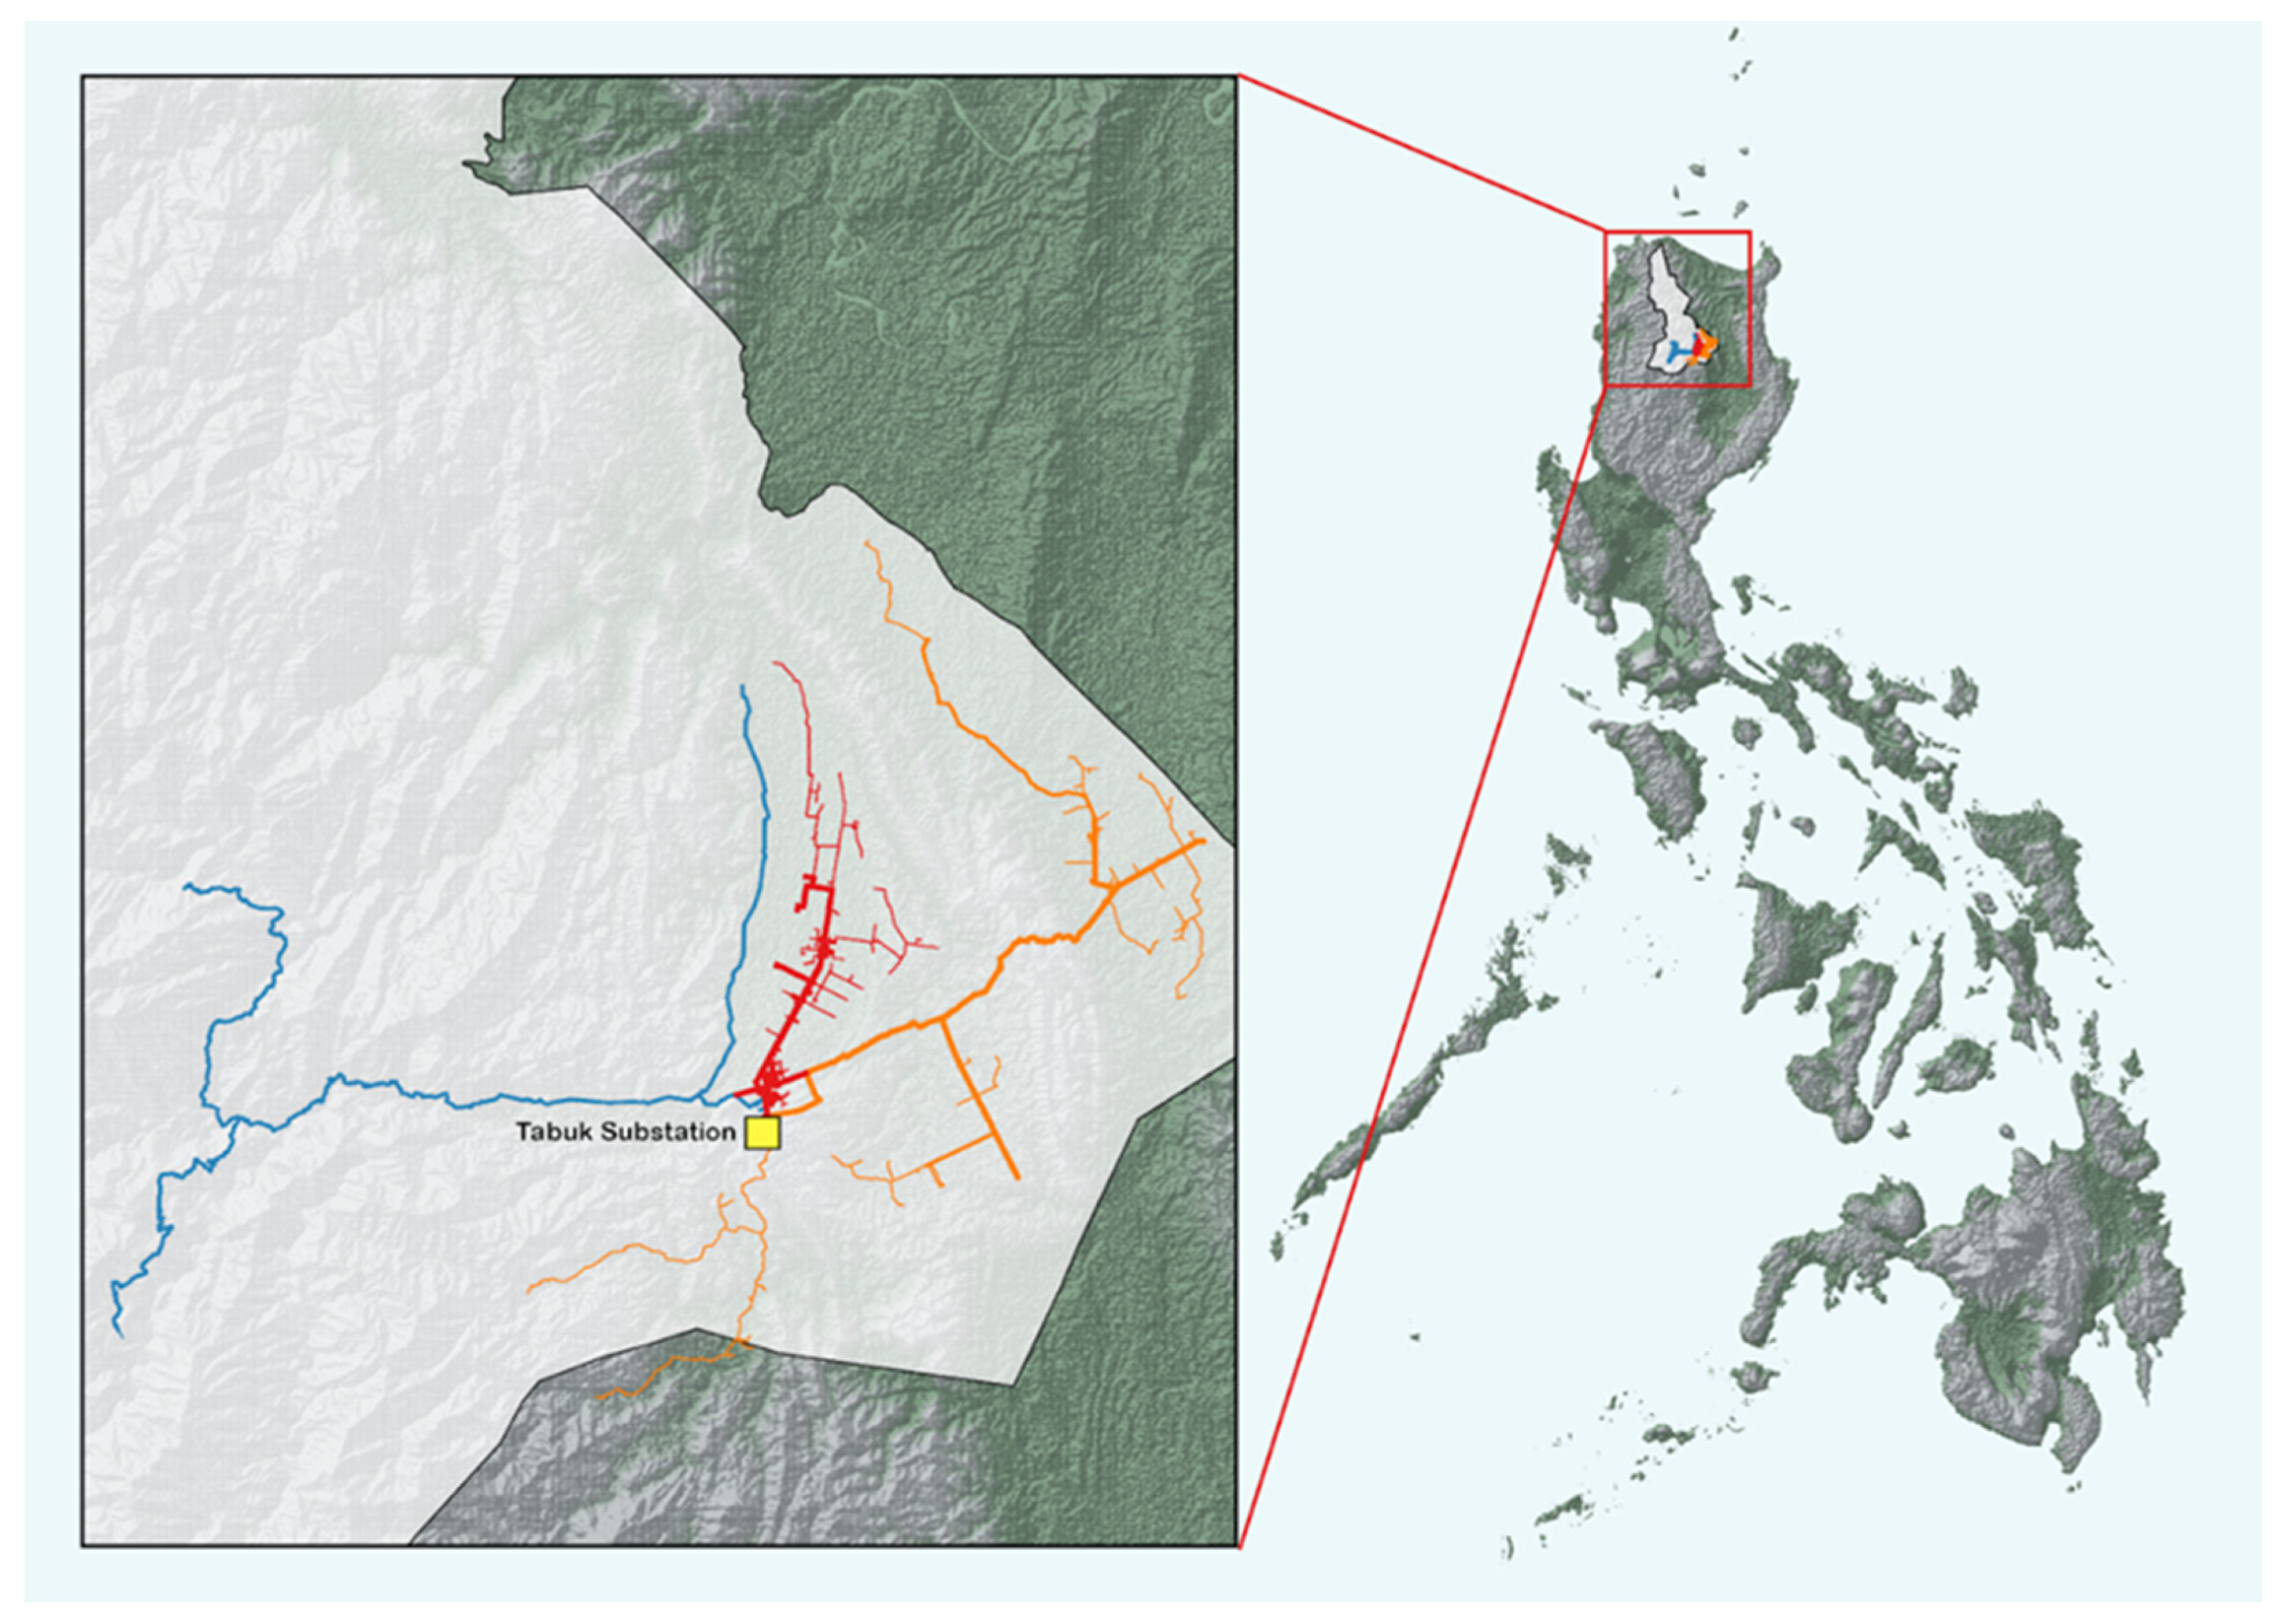
The Kalinga-Apayao Electric Cooperative, Inc. (KAELCO) is a grid-connected distribution utility in the northern Philippines that provides electricity to Kalinga and some municipalities of Apayao. Currently, KAELCO has three main feeders and a 10-MVA substation located at Tabuk City, Kalinga serving all the municipalities in Kalinga and the municipality of Conner in Apayao. Other unconnected parts of the franchise area are locally supplied by small diesel power plants and were not considered in the case study. Figure 2 shows the franchise area of KAELCO.
Within the Philippine archipelago, renewable energy (RE)-based isolated microgrids have been operational in various regions. However, the majority of these microgrids remain unconnected to local distribution networks, with only the most recent installations designed to be on-grid. Despite the prevalence of these microgrids, there’s a notable absence of comprehensive resilience assessments specifically focusing on distribution grid-connected microgrids in the Philippines [18].
It is noteworthy that, according to the Philippine Grid Code, the N-1 security criterion requirement is mandated solely for the transmission grid, lacking a corresponding provision in the Philippine Distribution Code for distribution utilities to comply with this requirement or implement tie-lines. Nevertheless, KAELCO adheres to the distribution guidelines and standards outlined in the Philippine Distribution Code [19,20].
In 2019, residential customers of KAELCO accounted for the majority of the energy sales at 69.48%, whereas commercial and industrial customers accounted for 18.20% [21]. The peak demand for this distribution utility is 9.4 MW. KAELCO is connected to the Philippine Luzon grid, with electricity sources within and outside its franchise area. A 1-MW run-of-river hydroelectric plant located at Tabuk City, Kalinga provides power to KAELCO under a power supply agreement. The remaining demand is met through the wholesale electricity spot market (WESM) [21].
The critical loads connected to the KAELCO distribution system were identified based on the Critical Facility Areas classification in the exposure database developed in [11] and prioritization based on the Risk Category of Buildings and Other Structures from the International Building Code (IBC) [22] as summarized in Table 1. Although Priority Levels 3 and 4 loads are considered critical loads, only Priority Level 4 loads require a continuous supply of power during typhoons. The supply requirement for Priority Level 4 is mainly due to the life-threatening consequences should the distribution network fail to operate. Priority Level 3 loads are facilities that also have importance during emergencies as they can serve as evacuation shelters and for transport.
The KAELCO distribution system was subjected to a total of 100 typhoon extreme event scenarios, i.e., 100 non-sequential Monte Carlo simulations were made. A set of historical (2010–2020) daily maximum sustained wind speeds in Kalinga province was obtained from the National Aeronautics and Space Administration (NASA)’s Prediction of Worldwide Energy Resources (POWER) [23] to produce a Gumbel distribution. This distribution, alongside the estimated range of maximum wind speeds of typhoons [24], from the Tropical Depression category to the Super Typhoon category, was used to extract the wind speed value for every extreme event scenario. It was assumed that the area of the distribution system was small enough that the typhoon extreme event had a geographically homogenous impact. Hence, all distribution components experienced the same level of maximum sustained wind speed for every scenario. The impact of the typhoon is assumed to occur instantaneously, and no cascading outages were considered.
In this paper’s case study, it is important to note that only typhoons were considered a resilience extreme event. To consider other extreme events, the same metrics calculation can be used with the same resilience assessment methodology. However, the data duration may vary depending on the frequency of such events, e.g., earthquake resilience assessment may need more than 10 years of data as this type of extreme event rarely occurs.
The mean time to repair (MTTR) of the components was obtained using the historical outage data of KAELCO and is summarized in Table 2. Depending on the intensity of the typhoon extreme event, a multiplier was multiplied by these MTTR values as explained in the resilience assessment model. It was also found that 9.39% of the total peak demand corresponds to Priority Level 4 loads, 1.93% to Priority Level 3 loads, and the rest correspond to noncritical loads. The assigned weighting factors were 0.5, 0.3, and 0.2 for Priority Level 4, Priority Level 3, and noncritical loads, respectively.
The proposed resilience metrics were then computed to quantify the improvement in the level of resilience of the KAELCO distribution system brought upon by planning measures. Two test cases were evaluated: (1) the base case which simulates the current KAELCO distribution system and (2) the microgrid-enabled case which considers the KAELCO distribution system with planning measures implemented.
The planning measure selected in this case study was enabling the standalone microgrid operation of the KAELCO distribution system. This measure included installing additional switches and several distributed generators utilizing various renewable resources in the local area; the distributed generators and their corresponding capacities were derived from a microgrid generation planning conducted in the same region [13]. However, in the resilience assessment model, only the dispatchable DGs were considered. These include an existing 1MW run-of-river hydro generator in Tabuk connected to Feeder 1 and two newly identified DGs: a 7 MW diesel generator at the substation and a 6 MW run-of-river hydro generator in the Upper Tabuk area connected to Feeder 1. Although the base case network already includes a dispatchable DG, islanding is not possible due to the lack of switches for fault isolation.

3.2. Results and Discussion

Table 3 and Table 4 summarize the results of the non-sequential Monte Carlo simulations on both cases for all loads and Priority 4 loads, respectively. The SAIFI sys typhoon resilience metric can range from 0 where the average customer experiences zero interruptions during typhoons to n where the average customer experiences an interruption at least once during typhoons and may cascade up to n outages. Without any resilience enhancement measures, the SAIFI sys typhoon resilience metric was equal to 1 customer interruption per event. This means that with only the base distribution system, each customer experiences one outage every time a typhoon occurs. On the other hand, the average customer experienced 0.9558 outages every typhoon event when the microgrid planning measure was present. This means that not all customers in the system experience a sustained outage. This is attributed to the fast-isolating action of switches not present in the base case network. However, this improvement in the SAIFI sys typhoon resilience metric might still be considered inappreciable. No pole hardening was included in the planning measures and as such, the distribution poles and overhead lines’ vulnerability to the strong winds of typhoon extreme events remained the same.
Also, it can be observed that enabling microgrid operation greatly improved the SAIDI sys typhoon and EENS sys typhoon resilience metrics with a reduction of 41.12% and 36.50%, respectively, relative to the base case. The addition of switches and distributed generators allowed faster restoration in several parts of the network by partitioning the network and forming islands. Hence, customers in these parts of the network do not have to wait for the full recovery of the distribution system after it was ravaged by the typhoon.
It is to be noted that these improvements are not only expressed in terms of the performance of the distribution system but also in terms of societal consequences. For instance, as seen in Table 4, enabling microgrid operations significantly enhanced the SAIDI 4 typhoon metric of Priority Level 4 loads. This would mean considerably less outage time for hospitals, emergency response institutions, and government offices allowing them to act swiftly and effectively to respond to the impact of the typhoon. Another consequence is economic. Economic losses due to energy not served during typhoon extreme events were also substantially reduced both for critical loads and for the whole system. Also, the compounding increase in interruption costs experienced by customers as the interruption went on was reduced and kept at a shorter duration.
Similar to reliability, regulators can set resilience targets using the proposed resilience metrics. One method in setting yearly reliability expectations for a distribution utility is to use the average from the previous 5-year historical outage data. For resilience, basing the targets similarly may not exactly capture the performance expectations for a distribution utility. As earlier mentioned, it is important that the historical observation period is long enough that sufficient resilience event impact data are recorded but also recent enough such that improvements from resilience-motivated investments of the distribution utility are still characteristic of current existing conditions (e.g., climate, loading level, and network configuration).
As the impact of resilience events on distribution systems varies on a case-to-case basis, setting a single target for all utilities may not be fair. Some areas are more vulnerable to one type of resilience event (e.g., flooding) whereas some are more at risk to another type (e.g., strong winds from typhoons). And even if two distribution utilities are both vulnerable to the same hazard, they may not experience the same level of impact due to varying network configurations. In this case, individualized baseline resilience metrics targets may be the best framework to implement. This individualized approach can be used to assess how effective the distribution utility maintains and improves its resilience to extreme events for better justification of investments and incentives given. It is also to be noted that unique baseline resilience metrics can be set for every type of resilience extreme event so that planning efforts are better guided.

4. Conclusions

In this paper, a set of power distribution system resilience metrics has been proposed, inspired mainly by widely used reliability metrics. This involved adapting the SAIFI, SAIDI, and EENS reliability metrics to specifically capture outages affecting critical loads during an extreme event such as a typhoon. It was shown using a Philippine distribution network case study that the proposed metrics proved instrumental in not only gauging a system’s foundational resilience but also in strategizing improvements and fortifications against future typhoon-related disruptions. The results of the non-sequential Monte Carlo resilience assessment method employed in the case study precisely demonstrated how the implementation of stand-alone microgrid operation resulted in quantifiable enhancements to the system’s resilience, as measured by the proposed metrics.
Continued exploration into applying these metrics across a spectrum of extreme events, accounting for their evolving impact over time and under varying critical load compositions and economic value, is essential for a more comprehensive understanding. Highlighting the need for a more comprehensive analysis, it is imperative to acknowledge that this paper did not delve into the comparison between the investments made and the improvements derived from microgrid operation as illustrated by the EENS sys typhoon resilience metric. Such an evaluation demands a nuanced approach, encompassing an in-depth examination of the economics of investments over their lifespan, considering the varying value of lost loads across priority levels, and conducting detailed simulations of extreme event occurrences throughout the investment’s lifespan. This intricacy prompts a recommendation for future studies that would significantly contribute to accurately delineating the return on investment associated with microgrid operation measures. Furthermore, considering the thoroughness and granularity of the proposed metrics, incorporating them into future studies would not only facilitate a more comprehensive assessment but also enhance the precision and depth of insights into the efficacy of any power distribution system resilience measures.
Exploring the impact of public health-related resilience events, exemplified by the far-reaching consequences of the recent COVID-19 pandemic, on distribution utilities introduces a critical area for future research. Workforce limitations during such events may hinder emergency responses, potentially prolonging mean times for repairs. Investigating this aspect becomes crucial for an extensive understanding of power distribution system resilience in the face of widespread health crises. Additionally, the prospect of defining empirical targets using the proposed metrics tailored to the unique characteristics of individual distribution utilities holds promise. This avenue paves the way for establishing a standardized and adaptable framework for resilience assessment, promoting robust evaluations across diverse contexts.

Author Contributions

Conceptualization, methodology, validation, and formal analysis, G.A.A., P.E.D.C.B., J.A.I., L.L.F.B., X.N.P., E.A.E.J., M.T.C., R.V.E.B., K.E.S.P., A.E.D.T., I.B.N.C.C., J.D.O. and C.M.F.O.; writing—original draft preparation, G.A.A.; writing—review and editing, G.A.A., A.E.D.T. and C.M.F.O.; supervision, project administration, and funding acquisition, C.M.F.O. All authors have read and agreed to the published version of the manuscript.

Funding

This work is financially supported by the Pilot Study for Integrating Micro-grid and Distributed Renewable Energy Sources for an Electric Cooperative Project funded by the Philippines Department of Science and Technology through the Collaborative Research and Development to Leverage the Philippine Economy (CRADLE) program.

Data Availability Statement

The data and source codes presented in this study are available on request from the corresponding author.

Acknowledgments

The authors would also like to thank DPJ Engineers and Consultants and KAELCO for providing the necessary data and Project CIPHER for the APC.

Conflicts of Interest

The authors declare no conflicts of interest.

References

  1. Chiu, B. PES-TR83 Resilience Framework, Methods, and Metrics for the Electricity Sector; IEEE Power and Energy Society: Piscataway, NJ, USA, 2020. [Google Scholar]
  2. Kandaperumal, G.; Srivastava, A. Resilience of the Electric Distribution Systems: Concepts, Classification, Assessment, Challenges, and Research Needs. IET Smart Grid 2019, 3, 133–143. [Google Scholar] [CrossRef]
  3. ‌Diahovchenko, I.M.; Kandaperumal, G.; Srivastava, A.K.; Maslova, Z.I.; Lebedka, S.M. Resiliency-Driven Strategies for Power Distribution System Development. Electr. Power Syst. Res. 2021, 197, 107327. [Google Scholar] [CrossRef]
  4. Climate Signals. Intense Northwest Pacific Typhoon Frequency Increase. Available online: https://www.climatesignals.org/climate-signals/intense-northwest-pacific-typhoon-frequency-increase (accessed on 14 January 2022).
  5. Panteli, M.; Trakas, D.N.; Mancarella, P.; Hatziargyriou, N.D. Power Systems Resilience Assessment: Hardening and Smart Operational Enhancement Strategies. Proc. IEEE 2017, 105, 1202–1213. [Google Scholar] [CrossRef]
  6. Billinton, R. Power System Reliability Evaluation; Taylor & Francis: Abingdon, UK, 1970. [Google Scholar]
  7. Watson, J.-P.; Guttromson, R.; Silva-Monroy, C.; Jeffers, R.; Jones, K.; Ellison, J.; Rath, C.; Gearhart, J.; Jones, D.; Corbet, T.; et al. SANDIA REPORT—Conceptual Framework for Developing Resilience Metrics for the Electricity, Oil, and Gas Sectors in the United States. 2015. Available online: https://www.energy.gov/oe/articles/conceptual-framework-developing-resilience-metrics-electricity-oil-and-gas-sectors (accessed on 16 October 2023).
  8. Ji, C.; Wei, Y.; Poor, H.V. Resilience of Energy Infrastructure and Services: Modeling, Data Analytics, and Metrics. Proc. IEEE 2017, 105, 1354–1366. [Google Scholar] [CrossRef]
  9. Rosales-Asensio, E.; Elejalde, J.-L.; Pulido-Alonso, A.; Colmenar-Santos, A. Resilience Framework, Methods, and Metrics for the Prioritization of Critical Electrical Grid Customers. Electronics 2022, 11, 2246. [Google Scholar] [CrossRef]
  10. Energy Regulatory Commission. Resolution No. 12, Series of 2006: A Resolution Adopting the Guidelines for the Monitoring of Reliability Standards for Distribution Utilities. Available online: https://www.erc.gov.ph/Resolutions-and-Rules/2006/3#focus (accessed on 22 March 2022).
  11. Bautista, M.; Bautista, B.; Narag, I.; Aquino, A.; Papiona, K.; Santos, D.; Sevilla, W.; Melosantos, L.; Badilla, R.; Duran, A.; et al. Enhancing Risk Analysis Capacities for Flood, Tropical Cyclone Severe Wind and Earthquake for Greater Metro Manila Area—Summary Report. 2014. Available online: https://gisweb.phivolcs.dost.gov.ph/phivolcs_hazardmaps/NCR/1%20Region/Earthquake%20Risk/Risk%20Analysis%20Project%20-%20Summary%20Report.pdf (accessed on 7 April 2022).
  12. Report of the Board: Electricity Distribution System Reliability Measures and Expectations. Ontario Energy Board. Available online: https://www.oeb.ca/sites/default/files/uploads/Report_of_the_Board_Reliability_Measures_20150825.pdf (accessed on 26 March 2022).
  13. Abantao, G.A.; Ibañez, J.A.; Bundoc, P.E.D.C.; Blas, L.L.; Penisa, X.N.; Pilario, K.E.S.; Tio, A.E.D.C.; Cruz, I.B.N.C.; Ocon, J.D.; Odulio, C.M.F. Generation and Network Planning of Utility-Scale Grid-Connected Microgrids. Chem. Eng. Trans. 2023, 103, 877–882. [Google Scholar] [CrossRef]
  14. Department of Energy, Republic of the Philippines. Department Circular No. DC2018-01-0001—Adoption of Energy Resiliency in the Planning and Programming of the Energy Sector to Mitigate Potential Impacts of Disasters. 2018. Available online: https://www.doe.gov.ph/laws-and-issuances/department-circular-no-dc2018-01-0001 (accessed on 13 December 2023).
  15. Gautam, P.; Piya, P.; Karki, R. Resilience Assessment of Distribution Systems Integrated with Distributed Energy Resources. IEEE Trans. Sustain. Energy 2021, 12, 338–348. [Google Scholar] [CrossRef]
  16. Kang, D.; Ko, K.; Huh, J. Determination of Extreme Wind Values Using the Gumbel Distribution. Energy 2015, 86, 51–58. [Google Scholar] [CrossRef]
  17. Sonal; Ghosh, D. Resilience Assessment of Microgrid Using Complex Network Theory. In Proceedings of the 2021 1st International Conference on Power Electronics and Energy (ICPEE), Bhubaneswar, India, 2–3 January 2021. [Google Scholar] [CrossRef]
  18. Department of Energy, Republic of the Philippines. Microgrid & PVM Database Visual Mapping. Available online: https://lookerstudio.google.com/u/0/reporting/07c4b4c5-50b5-4117-aad8-4f66d5f58458/page/p_8hjmb0yxyc (accessed on 15 December 2023).
  19. Energy Regulatory Commission, Republic of the Philippines. Resolution No. 02, Series of 2018—A Resolution Approving the Philippine Distribution Code (PDC) 2017 Edition. 2018. Available online: https://policy.asiapacificenergy.org/node/2979 (accessed on 21 January 2024).
  20. Energy Regulatory Commission, Republic of the Philippines. Resolution No. 22, Series of 2016—A Resolution Approving the Publication of the Approved Philippine Grid Code 2016 Edition. 2016. Available online: https://policy.asiapacificenergy.org/node/2978 (accessed on 21 January 2024).
  21. Power Supply Procurement Plan 2019; Kalinga Apayao Electric Cooperative Inc.: Tabuk, Philippines, 2019; pp. 1–21.
  22. Council, I.C.; Thornburg, D.W.; Kimball, C. 2021 International Building Code® Illustrated Handbook; McGraw-Hill Education: New York, NY, USA, 2021. [Google Scholar]
  23. National Aeronautics and Space Administration. Prediction of Worldwide Energy Resources (POWER). POWER|Data Access Viewer. Available online: https://power.larc.nasa.gov/data-access-viewer/ (accessed on 14 January 2022).
  24. Philippine Atmospheric Geophysical and Astronomical Services Administration. PAGASA—About Tropical Cyclones. Available online: https://www.pagasa.dost.gov.ph/information/about-tropical-cyclone (accessed on 14 January 2022).
Figure 1. The flowchart of the resilience assessment framework highlights the three main steps: (1) generation of artificial operating history of components (green), (2) damage assessment and simulation of system response (red), and (3) calculation of resilience metrics (blue).
Energies 17 01909 g001
Figure 2. Franchise area of KAELCO. Zoomed in is KAELCO’s feeder network (Feeder 1—red, Feeder 2—blue, Feeder 3—orange) connected to the Tabuk substation. Image adopted from [13].
Energies 17 01909 g002
Table 1. Load prioritization levels are based on the National Disaster Risk Reduction and Management Council (NDRRMC) and International Building Code (IBC) guidelines [11,22].
Level Electrical Loads
Priority 4 Health and welfare, emergency and defense, government, energy production, water supply, communications, flood control, waste management facilities
Priority 3 Education, cultural, major commercial, heavy industry, transportation, food security, big leisure facilities
Priority 2 Small residential buildings, restaurants
Priority 1 Agricultural facilities, minor storage facilities
Table 2. Mean time to repair overhead distribution lines and transformers obtained from the historical outage data of KAELCO.
ComponentsMean Time to Repair
Feeder 1Feeder 2Feeder 3
Primary Overhead Line1.07 h1.39 h1.32 h
Distribution Transformers0.88 h1.26 h1.70 h
Table 3. Overall resilience against typhoons of the microgrid-enabled network versus of the base case network.
Configuration SAIFI sys typhoon SAIDI sys typhoon EENS sys typhoon
Base Case1.0000 customer—
interruption/event
22.5362 h/event30.1048 MWHr
Microgrid-enabled0.9580 customer—
interruption/event
13.2465 h/event19.1168 MWHr
Table 4. Resilience against typhoons of Priority 4 Loads in the microgrid-enabled network versus Priority 4 Loads in the base case network.
Configuration SAIFI 4 typhoon SAIDI 4 typhoon EENS 4 typhoon
Base Case1.0000 customer—
interruption/event
22.4256 h/event17.7762 MWHr
Microgrid-enabled0.9558 customer—
interruption/event
12.3056 h/event10.1375 MWHr
Disclaimer/Publisher’s Note: The statements, opinions and data contained in all publications are solely those of the individual author(s) and contributor(s) and not of MDPI and/or the editor(s). MDPI and/or the editor(s) disclaim responsibility for any injury to people or property resulting from any ideas, methods, instructions or products referred to in the content.

