1. Introduction
Increasingly stricter standards regarding the emission of toxic compounds from car exhaust necessitate changes in vehicle drive systems. The development of drive systems for modern vehicles using combustion engines is associated with the need to take into account often contradictory requirements, which, on the one hand, are related to the protection of the natural environment by reducing the emission of harmful exhaust gas components into the atmosphere and, on the other hand, to the pursuit of high performance indicators of these units. In addition, safety requirements for vehicles are also changing. More activities that were assigned to the driver are performed automatically by the vehicle. However, these systems require power from energy stored or generated by the vehicle.
Taking into account the perspective of the next several decades, it can be assumed that cars will remain the most important means of transport. More passenger cars and trucks are produced every day, which means that their number is constantly growing. Therefore, for the purposes of environmental protection, it is necessary to use new solutions that can reduce the emission of harmful substances or eliminate them completely. Since its invention, the combustion engine has undergone a number of improvements, and the current designs and capabilities of this type of drive are at a high level. Exhaust emissions and fuel consumption are significantly reduced compared to vehicles from several dozen years ago.
The constant striving to reduce fuel consumption, and thus to reduce carbon dioxide (CO2) emissions, prompts the search for new drive system solutions that enable partial or complete abandonment of the combustion engine. These changes involve design changes, not only resulting from a different type of drive system but also from a different weight distribution, center of gravity position and driving dynamics. In addition, the safety requirements for vehicles are also changing.
Transport is particularly dependent on oil. The future of personal transport is also dictated by the demand and supply of oil. The fuel market is sensitive to all economic and political changes. Oil prices depend on political, economic, social, technical, climatic and military factors. Large fluctuations in the fuel market occur during armed conflicts, especially in oil production areas.
Due to the need to produce cars that meet exhaust emission requirements and due to the extraction and price of crude oil, vehicle manufacturers are forced to use other potential energy sources or significantly reduce fuel consumption and emissions of harmful substances into the atmosphere.
Vehicles with alternative drives have lower energy consumption, which significantly reduces operating costs. These factors make hybrid vehicles (HEV) and electric vehicles (BEV) increasingly competitive compared to conventionally powered vehicles [
1,
2,
3]. One of the barriers to increasing the market share of this type of vehicle is the still high purchase costs. Currently, car companies see their future in vehicles with drive systems powered by electricity or hydrogen.
Sales of electric cars have increased in recent years, mainly in European countries, due to tax breaks and the so-called “green zones” in cities. Nevertheless, it is worth considering the power source of electric cars [
4].
Most countries in Europe still use coal to generate electricity, so charging a car produces harmful substances during electricity production. The second problem is generating enough electricity for electric cars if they were to replace current combustion cars. Hence, the compromise at the moment is hybrid cars.
Comparing the features of hybrid and electric cars shows their positive and negative sides in terms of energy flow.
2. Factors Influencing the Dynamic Characteristics of Car Control
At the end of the last century, most newly produced cars were equipped with a drive system consisting of an internal combustion engine with a clutch, gearbox and final drive driving one or both axles. Care for the environment resulted in the introduction of exhaust emission standards, popularly known as Euro 1, 2, 3, etc., which changed the permissible contents of carbon monoxide, hydrocarbons, nitrogen oxides and particulate matter, as well as carbon dioxide with subsequent editions of the standard. These activities forced vehicle designers to reduce fuel consumption. An electric vehicle is considered a zero-emission car. However, it is not possible to convert the entire production of cars into electric vehicles because this involves switching the automotive industry to the construction of electric cars and changing the car charging infrastructure, producing additional electricity needed to power this type of car. Additionally, it would require increasing the production of electric motors, batteries, inverters and other vehicle accessories. In addition, you also need to prepare the service infrastructure. A vehicle that can meet the requirements of exhaust emission standards today is a hybrid car.
Modern hybrid vehicles may differ significantly, taking into account the type of primary and secondary drive source, their structure and their power. Currently, the primary source of propulsion is most often a spark-ignition combustion engine, less often a compression-ignition engine. A commonly used secondary energy source is electrochemical batteries, but hydropneumatic accumulators, kinetic accumulators and ultracapacitors can also be used. Hence, in terms of energy storage, hybrid vehicle drive systems can be divided into combustion-electric systems with energy stored in electrochemical batteries or capacitors, designated HEV (Hybrid Electric Vehicle), systems consisting of an internal combustion engine and a kinetic battery using the energy of a rotating inertial wheel, systems consisting of an internal combustion engine and a hydropneumatic energy accumulator, and systems consisting of an internal combustion engine and a mechanical energy accumulator.
Due to the structure of the HEV hybrid drive, depending on the transfer and summation of power, a series, parallel and series-parallel drive can be distinguished [
5,
6,
7,
8,
9,
10,
11].
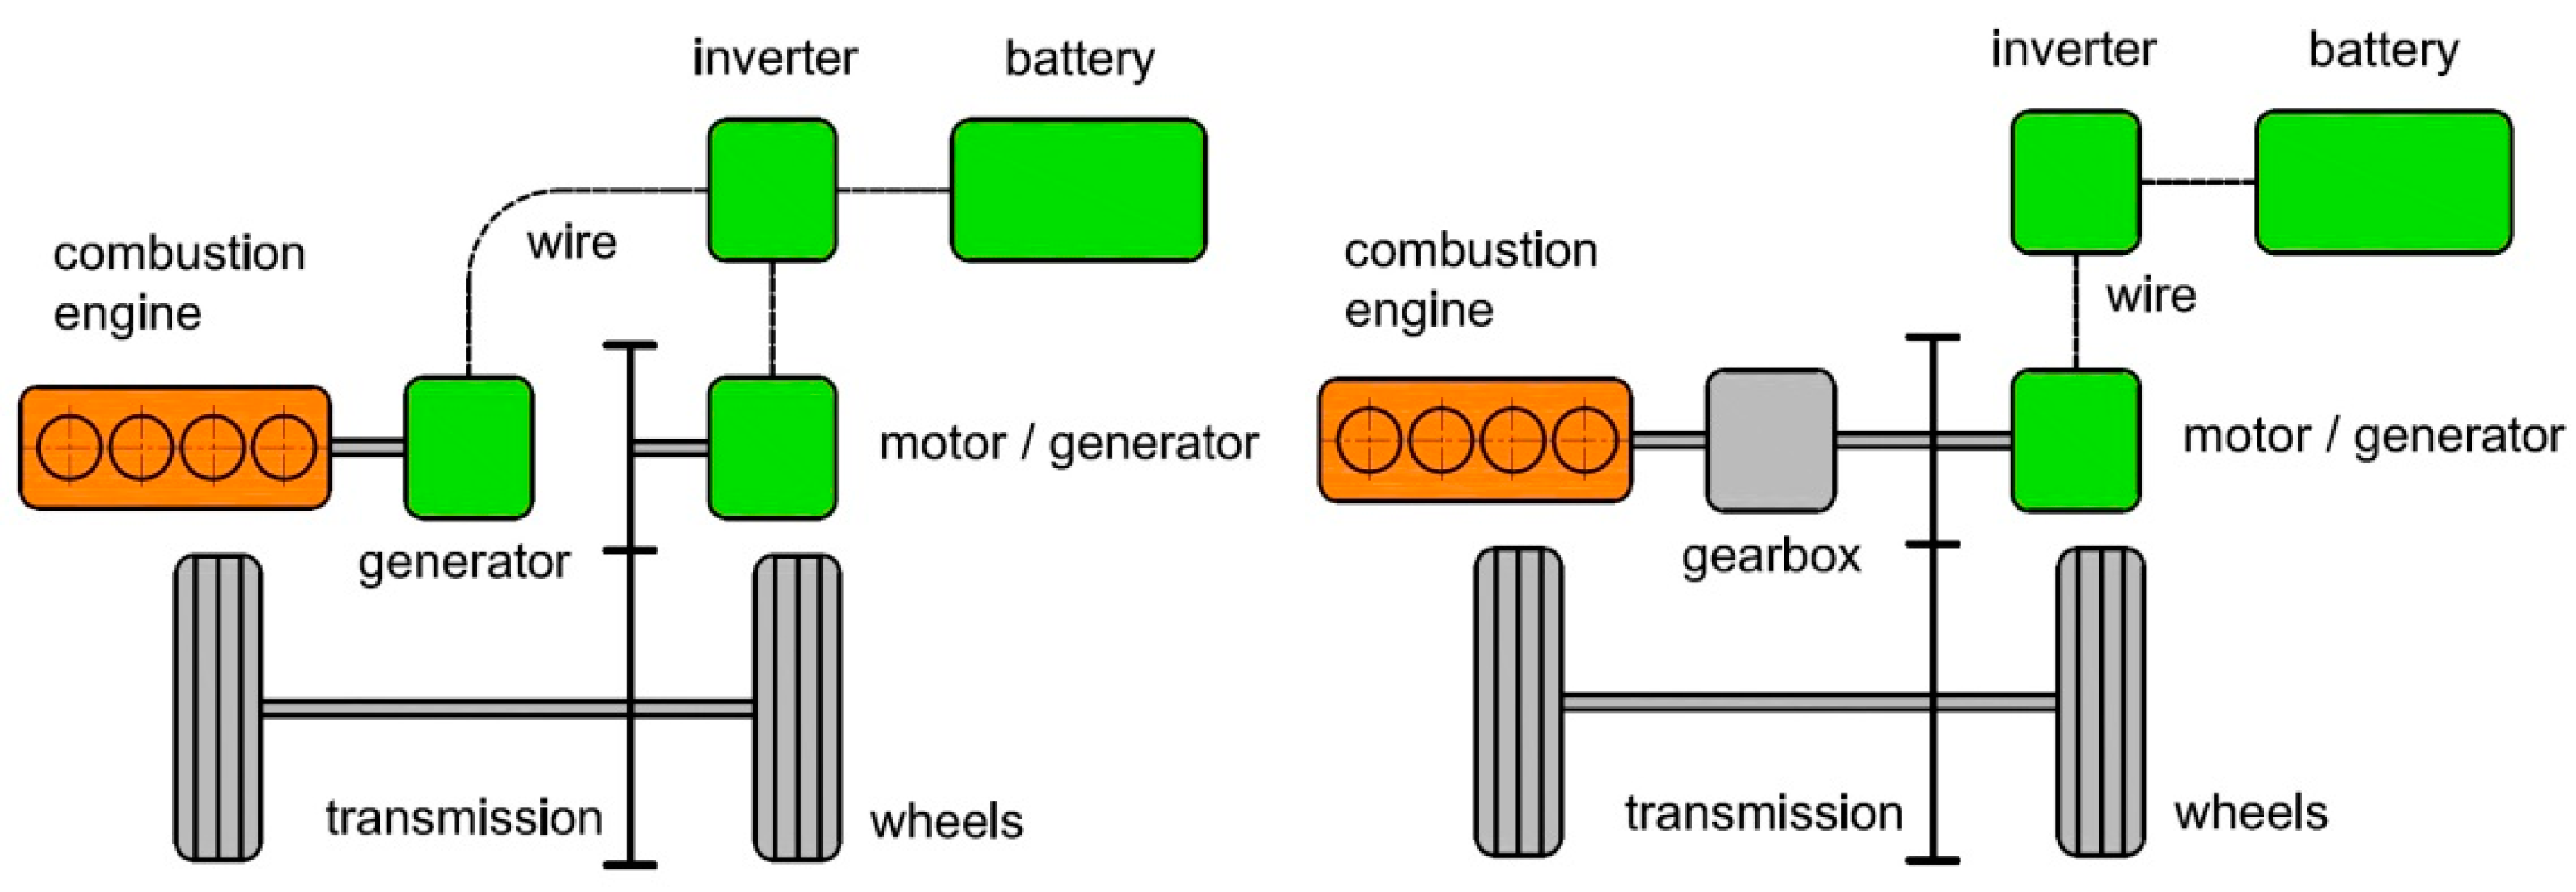
A serial hybrid drive is characterized by the fact that the internal combustion engine drives a generator and is only responsible for producing electricity to power the electric motor that drives the car’s wheels. Excess energy is stored in the battery and can be used at any time while driving. The main advantage of this solution is that the combustion engine operates in steady-state conditions in the optimal load and rotational speed area, which translates into reduced exhaust emissions, including toxic compounds, and lower fuel consumption. The diagram of such a drive system solution is shown in
Figure 1.
In a parallel hybrid drive system, the wheels can be driven by an internal combustion engine or an electric motor, but it is also possible to drive the wheels simultaneously by both engines. In this case, the vehicle has more power than the combustion engine used. Moreover, in this solution, only one reversible electric machine can be, which will act as both a traction engine, supplying power to the vehicle’s wheels, and a generator, allowing the recovery of the vehicle’s kinetic energy during braking (charging the battery).
The series-parallel hybrid drive combines the features of a series and parallel system; thus, it can work both as a series and as a parallel system. The operating mode depends on the power demand and the level of charge of the high-voltage batteries.
Hybrid drive systems also differ in the power of the electric machine. According to this division criterion, we can distinguish: micro-hybrid drive, a partial hybrid drive (mild hybrid) and a full hybrid system.
A micro-hybrid drive is the simplest possible form of hybrid drive. It allows you to define a car as a vehicle with a hybrid system. In this system, the alternator and starter were replaced with a low-power electric machine. It allows you to start the combustion engine, implement the Start-Stop function and recover a small amount of energy during braking. The power of an electric machine is usually several kilowatts.
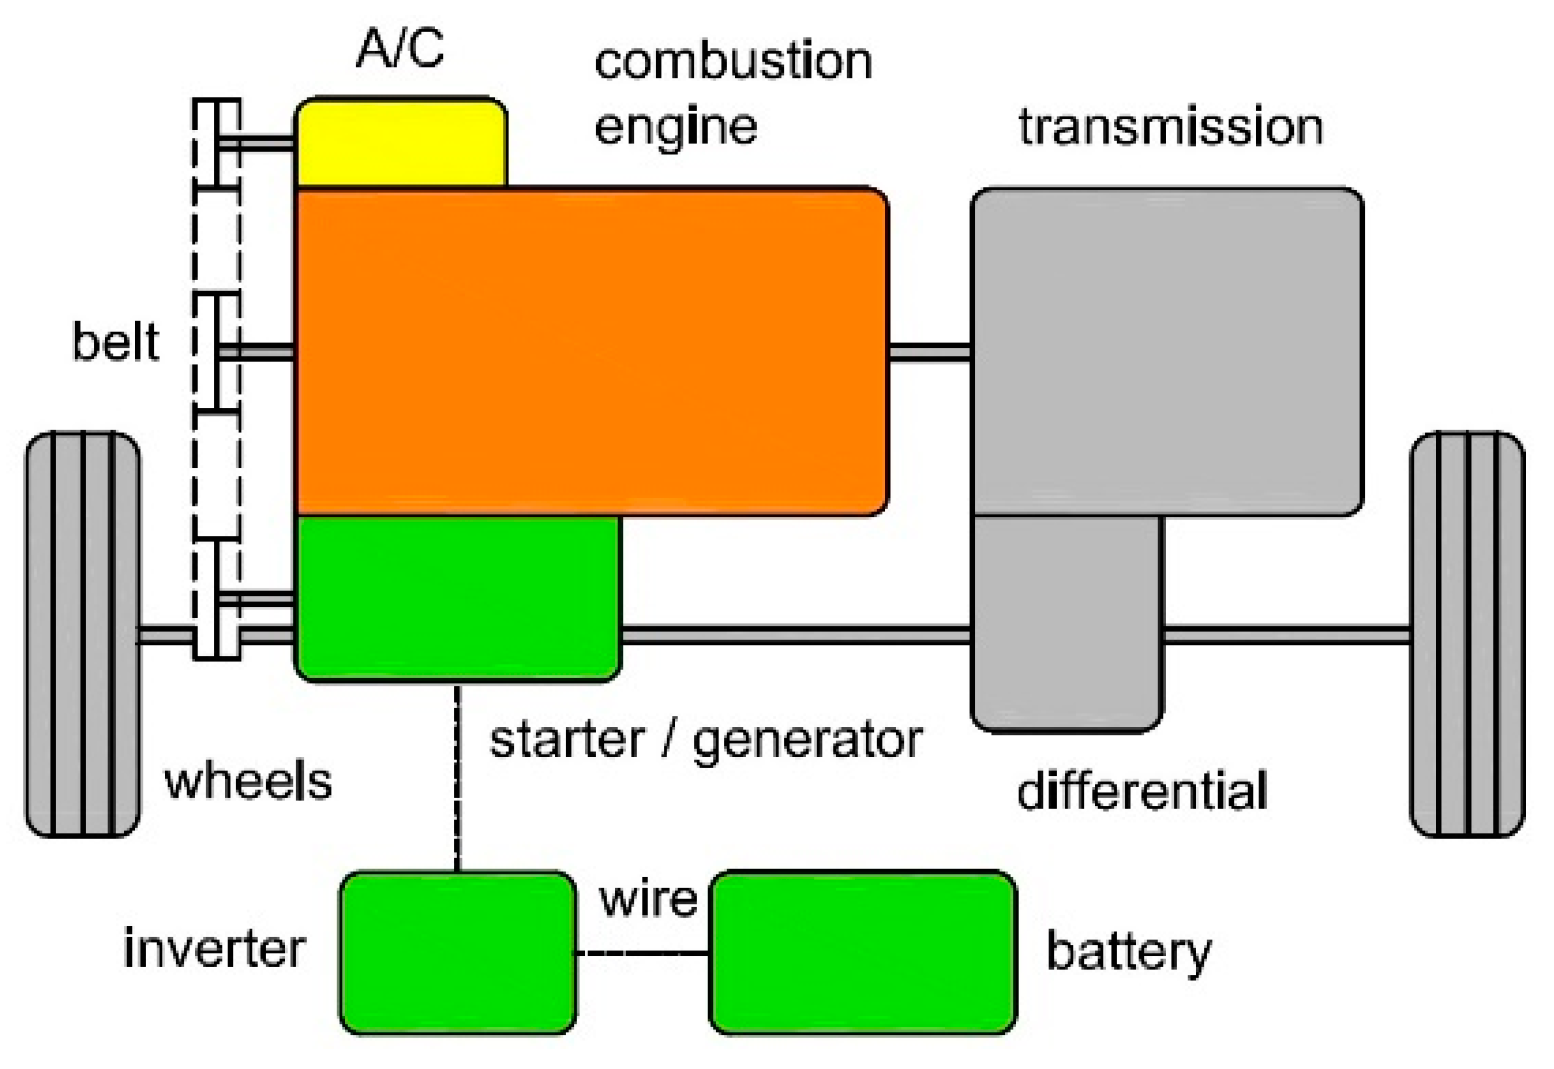
A partial hybrid drive (so-called mild hybrid) uses an electric machine to support the combustion engine during starting and acceleration. In this case, the power of the electric machine is higher than in the case of a micro-hybrid drive and amounts to about a dozen kilowatts. In this case, driving is usually not possible with the electric machine itself. The Start-Stop function, support of the combustion engine during acceleration and partial energy recovery during braking are implemented. The scheme of this solution is shown in
Figure 2.
A full hybrid drive is characterized by greater power of the electric machine, in the order of several dozen kilowatts. In this case, it is possible to move the vehicle using only the electric drive, the internal combustion engine or both sources of drive simultaneously. The electric machine allows the vehicle’s kinetic energy to be recovered during braking. A vehicle with such a system is equipped with a battery with a larger capacity [
13,
14,
15].
Currently, manufacturers are increasingly offering PHEV (Plug-in Hybrid Electric Vehicle) hybrid vehicles. Hybrid vehicles of this type have a battery with a larger capacity of several dozen kilowatt hours, which allows you to cover a larger distance, usually several dozen kilometers, using only the electric drive. These types of vehicles can operate in “green transport” zones [
16,
17].
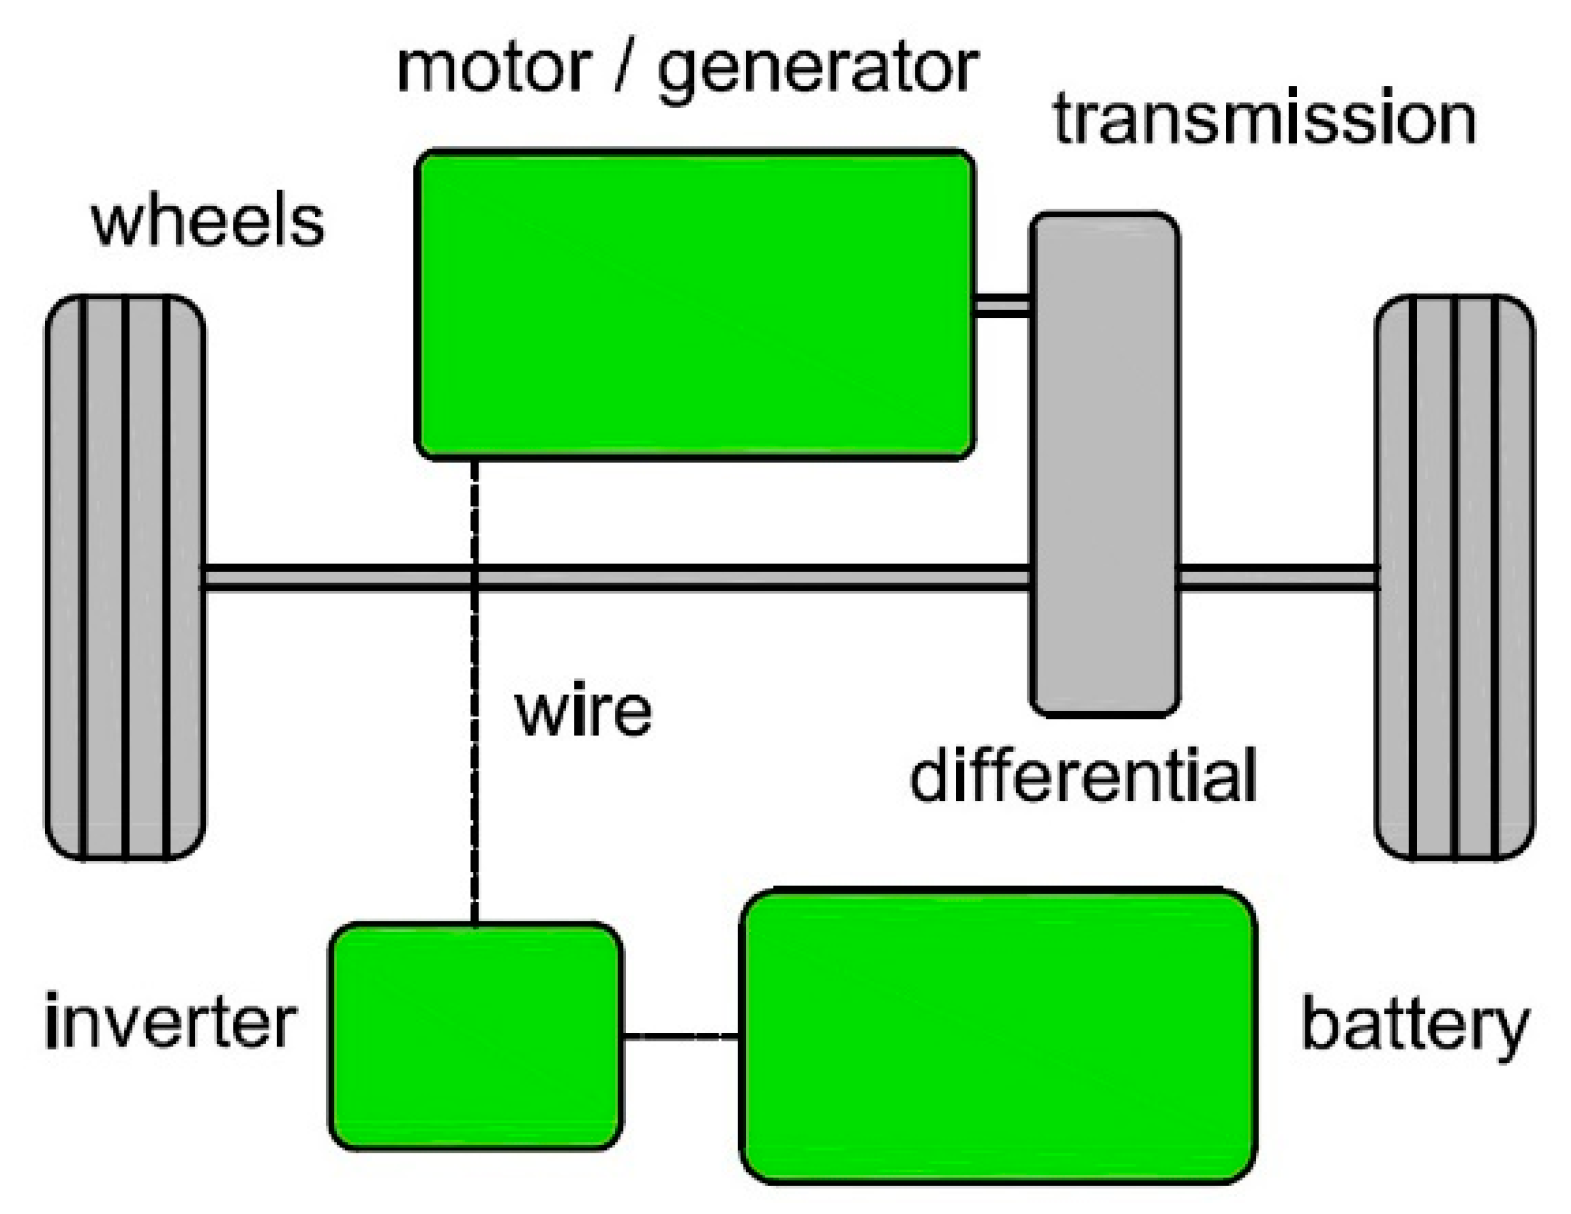
The electric drive is shown in
Figure 3.
3. Problems of Energy Flow in Cars with Different Drive Systems
In cars with different drive systems, the energy needed for propulsion is produced in different ways. In vehicles equipped with internal combustion engines, this energy comes from the combustion of fuel. In cars powered by internal combustion engines, it is not possible to recover kinetic energy. In cars with hybrid drives, energy recovery results from the size of the installed generator-starter. Electric cars recover energy when decelerating.
A class A car of similar size and body structure was selected for analysis, the first of which was equipped with a hybrid combustion-electric-drive system (HEV) and the second with an electric vehicle drive system (BEV). For comparison, data from a vehicle equipped only with an internal combustion engine are presented.
Figure 2 and
Figure 3 show the drivetrain systems of the tested cars. The parameters of the car powered by an internal combustion engine and the tested cars are summarized in
Table 1.
Due to the energy source, the vehicles differ in weight (an electric car is heavier due to the weight of the batteries) and engine power, but for the average user, the differences are not great—the vehicles perform the same functions. The comparison of vehicles shows that a hybrid car is approximately 400 kg lighter than an electric car, which will affect energy consumption during the tests. When starting or accelerating, the electric motor supports the combustion engine. In an electric car, each reduction in driving speed causes energy recovery.
3.1. Energy Use in Vehicles Powered by Combustion Engine and Hybrid Combustion-Electric Vehicles
The power used to drive the vehicle Pwheel (kW) (power at the wheels) is the product of the vehicle’s speed v (m/s) and the driving force on the wheels Fwheel (N), which can be approximated as the sum of resistances: rolling resistance force Frr (N), aerodynamic force Fad (N), the force resulting from the inclination of the road Frg (N) and the acceleration force Faccel (N). In addition, part of the power generated by the engine is used to drive devices inside the vehicle, driven directly or indirectly by the engine (generator, air conditioning pump, sometimes blower).
And so
where:
η is the efficiency of the drive transmission system,
ηs = (1 −
s) slip efficiency;
s–slip;
Cr and
Cd are the coefficients related to rolling resistance and aerodynamic drag, respectively;
m (kg) is the mass of the vehicle;
g (9.81 m/s
2) is the acceleration due to gravity;
α (rad) road slope angle;
ρa (1.2 kg/m
3) refers to the density of air;
Af (m
2) is the effective cross-sectional area of the vehicle; and
δ is the coefficient of inertia of the masses rotating in the vehicle’s drive system.
The power generated by the engine that is not related to the vehicle’s movement (e.g., load generated by the air conditioning or generator) must be added to the power used to propel the vehicle. After taking into account the additional energy lost during vehicle movement, this equation will take the form:
where
Paux—power of additional devices driven by the engine.
When a car is powered by an internal combustion engine, the vehicle’s output power Pout (W) can be estimated by dividing the power at the wheels Pwheel (W) by the drive system efficiency, which determines the power losses in the vehicle’s drive train.
The total energy consumption
Etot associated with the movement of a vehicle powered by an internal combustion engine is:
The share of electricity in the total energy used to drive the vehicle is:
It is estimated that in the NEDC test, the percentage of electricity may be up to 8%, and in the FTP75 test, up to 12% [
18]. This share depends on the size of the electric motor in the hybrid system.
3.2. Energy Use in Battery Electric Vehicles
In the case of the electric motor in Formula (1), efficiency ηm = ηme ηt. It is the product of the efficiency of the electric motor, inverter and gearbox.
When the car is powered by an electric motor, the output power of the BEV Pout (W) can be estimated, as in the case of a car with a classic drive, by dividing the power at the wheels Pwheel (W) by the efficiency of the drive system.
The total energy consumption from the battery
Ebatt related to the movement of the BEV is:
The Pbatt battery output is divided into two main parts:
The energy recovery mode in BEVs usually occurs during deceleration and braking, when the vehicle’s kinetic energy, lost in conventionally powered vehicles, can be partially used to generate electricity and then used to power it, which is known as regenerative braking. In other words, part of the energy during deceleration can be recovered by operating the electric machine as a generator and transferred to the battery. In energy recovery mode, the power at the battery terminals can be estimated as:
where
k (0 <
k <1) is the energy recovery factor, indicating the percentage of the total energy during deceleration that can be recovered by the electric motor(s). In BEVs, the regenerative braking system must work in conjunction with the friction brake because regenerative braking alone cannot generate enough power to reduce speed in the various braking phases of the vehicle.
Nowadays, an increasing number of auxiliary devices for safety and comfort appear in vehicles. They are powered by a 12 V battery, which is charged from a high-voltage battery via a DC/DC converter. The energy consumption of accessory devices can significantly impact the overall energy consumption of an electric vehicle. Therefore, they should be included in the analysis of the vehicle’s energy flow. The power requirement of auxiliary equipment is calculated as follows:
where
PDem is the power demand in (W),
PAc is the power consumption of auxiliary devices in (W), and
ηDC/DC and
η12V_bat are the efficiency of the DC/DC converter and 12 V battery, respectively. Energy consumption by additional devices depends on several factors, such as the power of the switched on electrical devices, ambient temperature, weather conditions, etc.
The average energy consumption values were taken from the literature and are given in
Table 2. The table contains the main auxiliary devices in an electric vehicle and their average power consumption.
In total, while driving, the power demand of additional PAC devices may vary from 750 W to 3.2 kW.
It should be noted that modern systems that increase comfort and safety while driving are becoming increasingly sophisticated, evolving towards electrically powered intelligent systems with a growing number of electronic components and accessories that require a significant increase in electrical power.
Energy recovery when decelerating and using it when accelerating the car allows you to reduce fuel consumption and CO2 emissions into the atmosphere. The reduction in fuel consumption depends on the power of the electric machine used in the vehicle.
During the test on the chassis dynamometer, there are no resistances resulting from the inclination of the road, and inertial resistances are simulated by adding additional rotating masses connected to rollers driven by the vehicle wheels. However, additional load is possible by turning on the vehicle’s energy consumers, e.g., air conditioning, heating, lights, or turning off the Start-Stop system.
4. Energy Consumption Measurements
Vehicle tests were carried out on a chassis dynamometer. Recorded test data were compared. Measurement data from the chassis dynamometer were supplemented with data collected from the CAN network of the tested cars. The measurement data concerned the vehicle’s movement on the chassis dynamometer, i.e., driving speed, load, fuel consumption, toxic exhaust emissions and the test course. Data regarding the car’s operation were read from the vehicle. For this purpose, scanners were made that allowed reading and writing data from the CAN network [
23,
24,
25]. The CAN scanner used in OBD (On Board Diagnostics) systems was used.
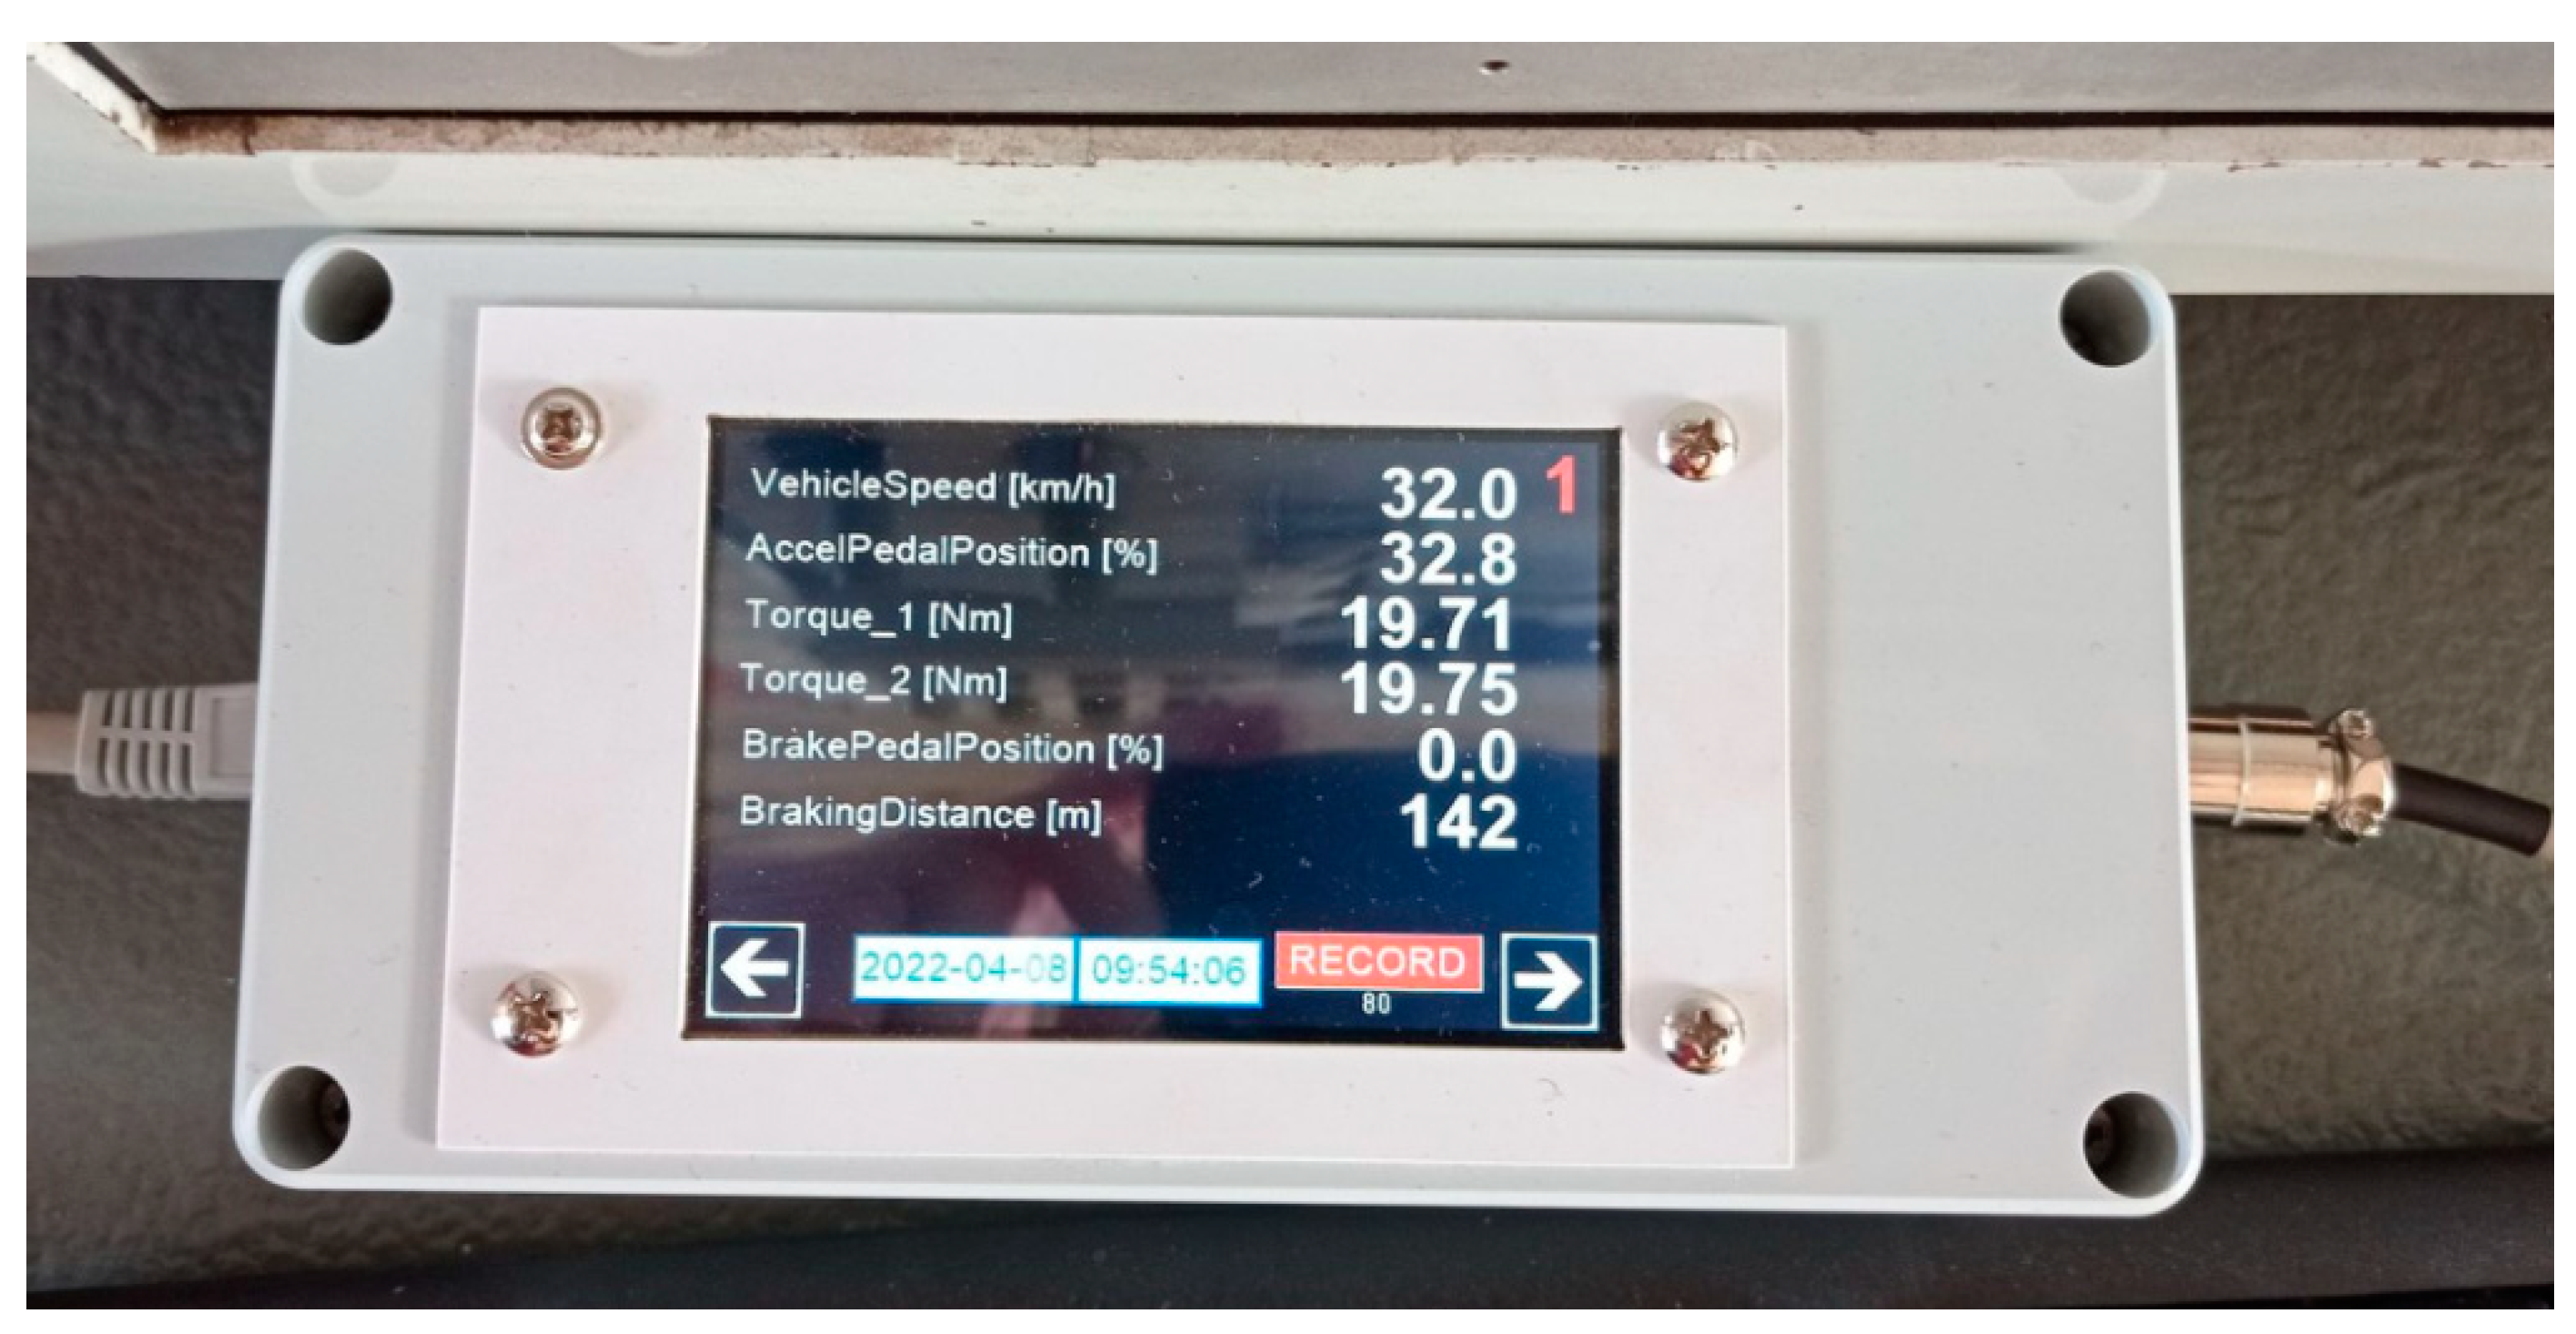
Data obtained through the diagnostic scanner were saved on the memory card. Due to the significant amount of data to be recorded, only the data that allowed for the assessment of energy flow in the vehicle were selected for analysis. Additionally, a number of data points were collected to enable diagnostics of the drive system. Scanners can also be used to measure vehicle movement parameters outside the chassis dynamometer.
Figure 4 shows a measurement scanner for an electric car.
The scanner allows you to read a number of data from the car’s CAN network. For comparisons, in the case of an electric car, the data presented in
Table 3 were used.
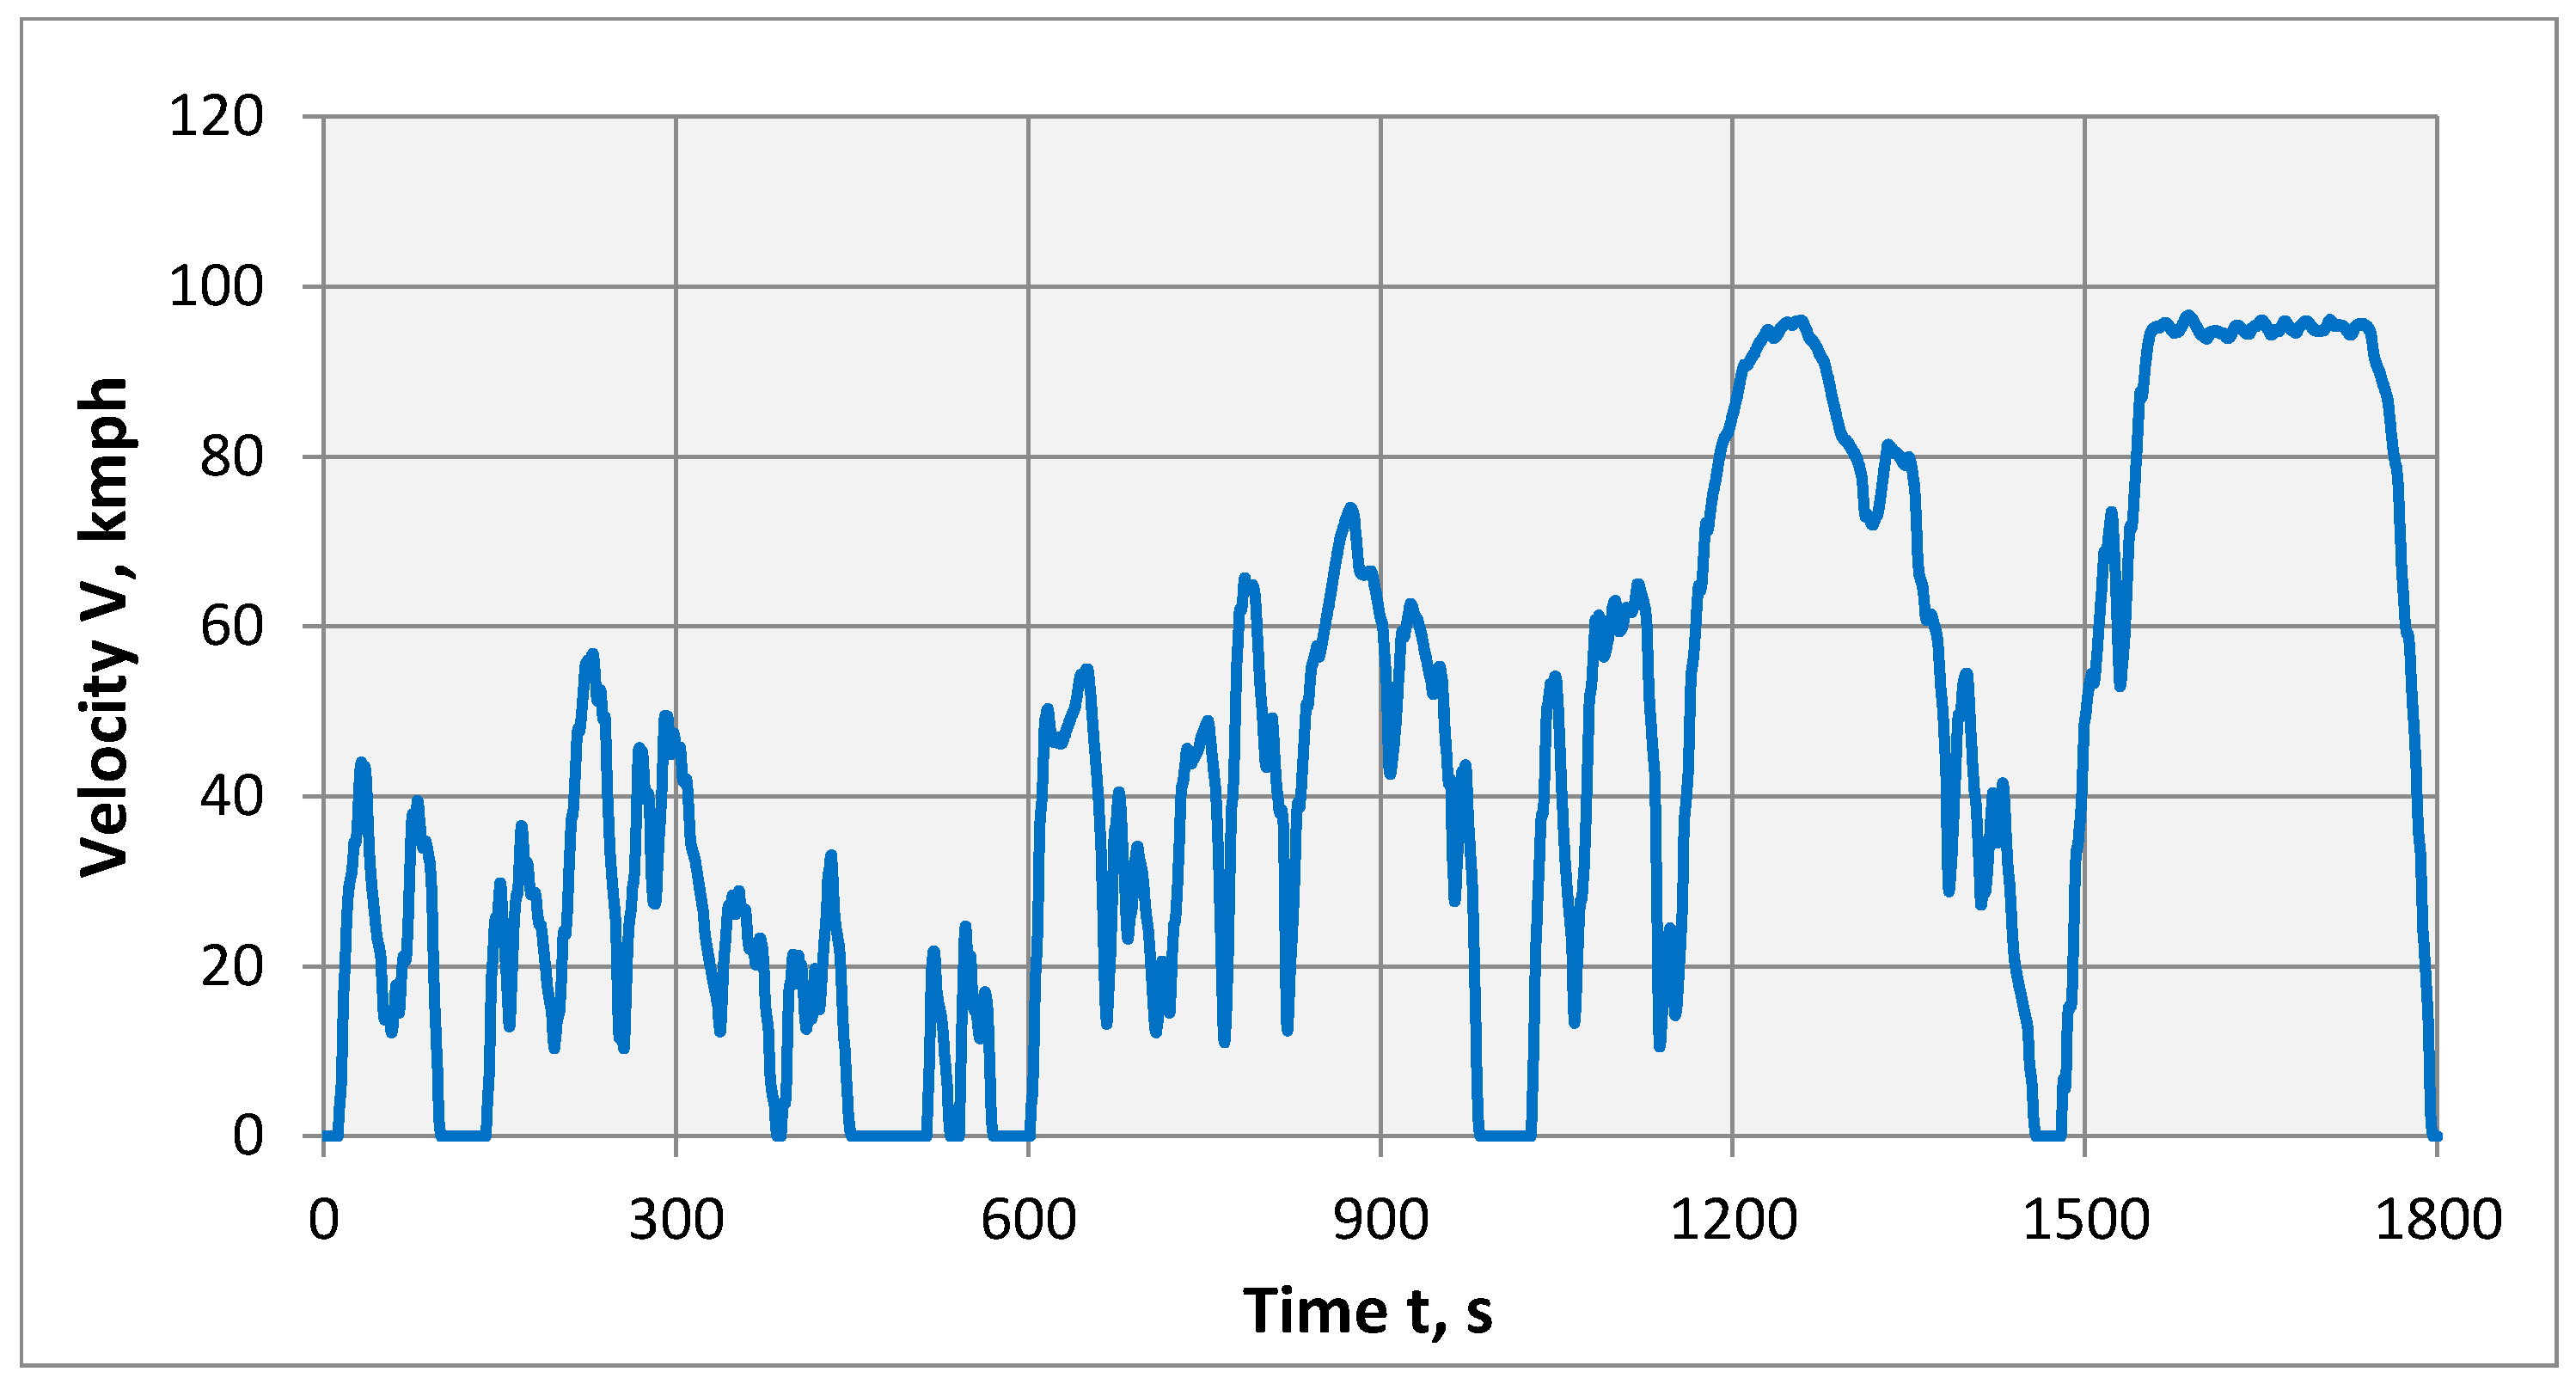
The tests were carried out using a modified WLTP test (Worldwide Harmonized Light-duty Vehicles Test Procedure). This is the test currently used for vehicle testing. It was developed based on real driving conditions. It is a dynamic test lasting 30 min, divided into four phases, 52% of which correspond to driving in the city and 40% to driving outside the city. The average test speed is 46.5 km/h and the maximum speed is 131 km/h. The test takes into account additional characteristics of the car that may affect its mileage. Due to the limitations of the dynamometer used in the tests, the maximum vehicle speed was set at 100 km/h.
The frequency of recording parameters obtained from the chassis dynamometer was 10 Hz, and from the vehicle CAN network, in accordance with the vehicle data protocol, 1 Hz. During the tests, attention was paid to meeting the conditions for the WLTP test.
Figure 5 shows the vehicle’s movement speed during the test.
5. Analysis of Energy Consumption in Cars with Different Drive Systems
Data obtained during the modified WLTP test were used to assess energy consumption. Research was also carried out on the electrical energy consumption of additional receivers in a vehicle with an electric-drive system (BEV) while driving on a chassis dynamometer at a set speed of ~70 km/h. The figures show the results obtained for a car with a hybrid combustion-electric and electric drive.
The tested hybrid vehicle has a so-called “mild hybrid” starter integrated with the alternator (BSG—Belt-Driven Starter Generator). The energy to power the electric machine comes from an additional 12 V battery with a capacity of 11 Ah. This solution does not allow driving in purely electric mode but allows the recovery of kinetic energy during braking and reducing driving speed, which translates into lower fuel consumption. In addition, the electric motor can periodically support the combustion engine, and connecting the starter to the alternator improves the efficiency of the drive. A characteristic feature of this vehicle is the efficient start-stop system, which, when the gear lever is set to idle, turns off the combustion engine at a speed of 30 km/h, further reducing fuel consumption. In an electric car, each reduction in driving speed causes energy recovery.
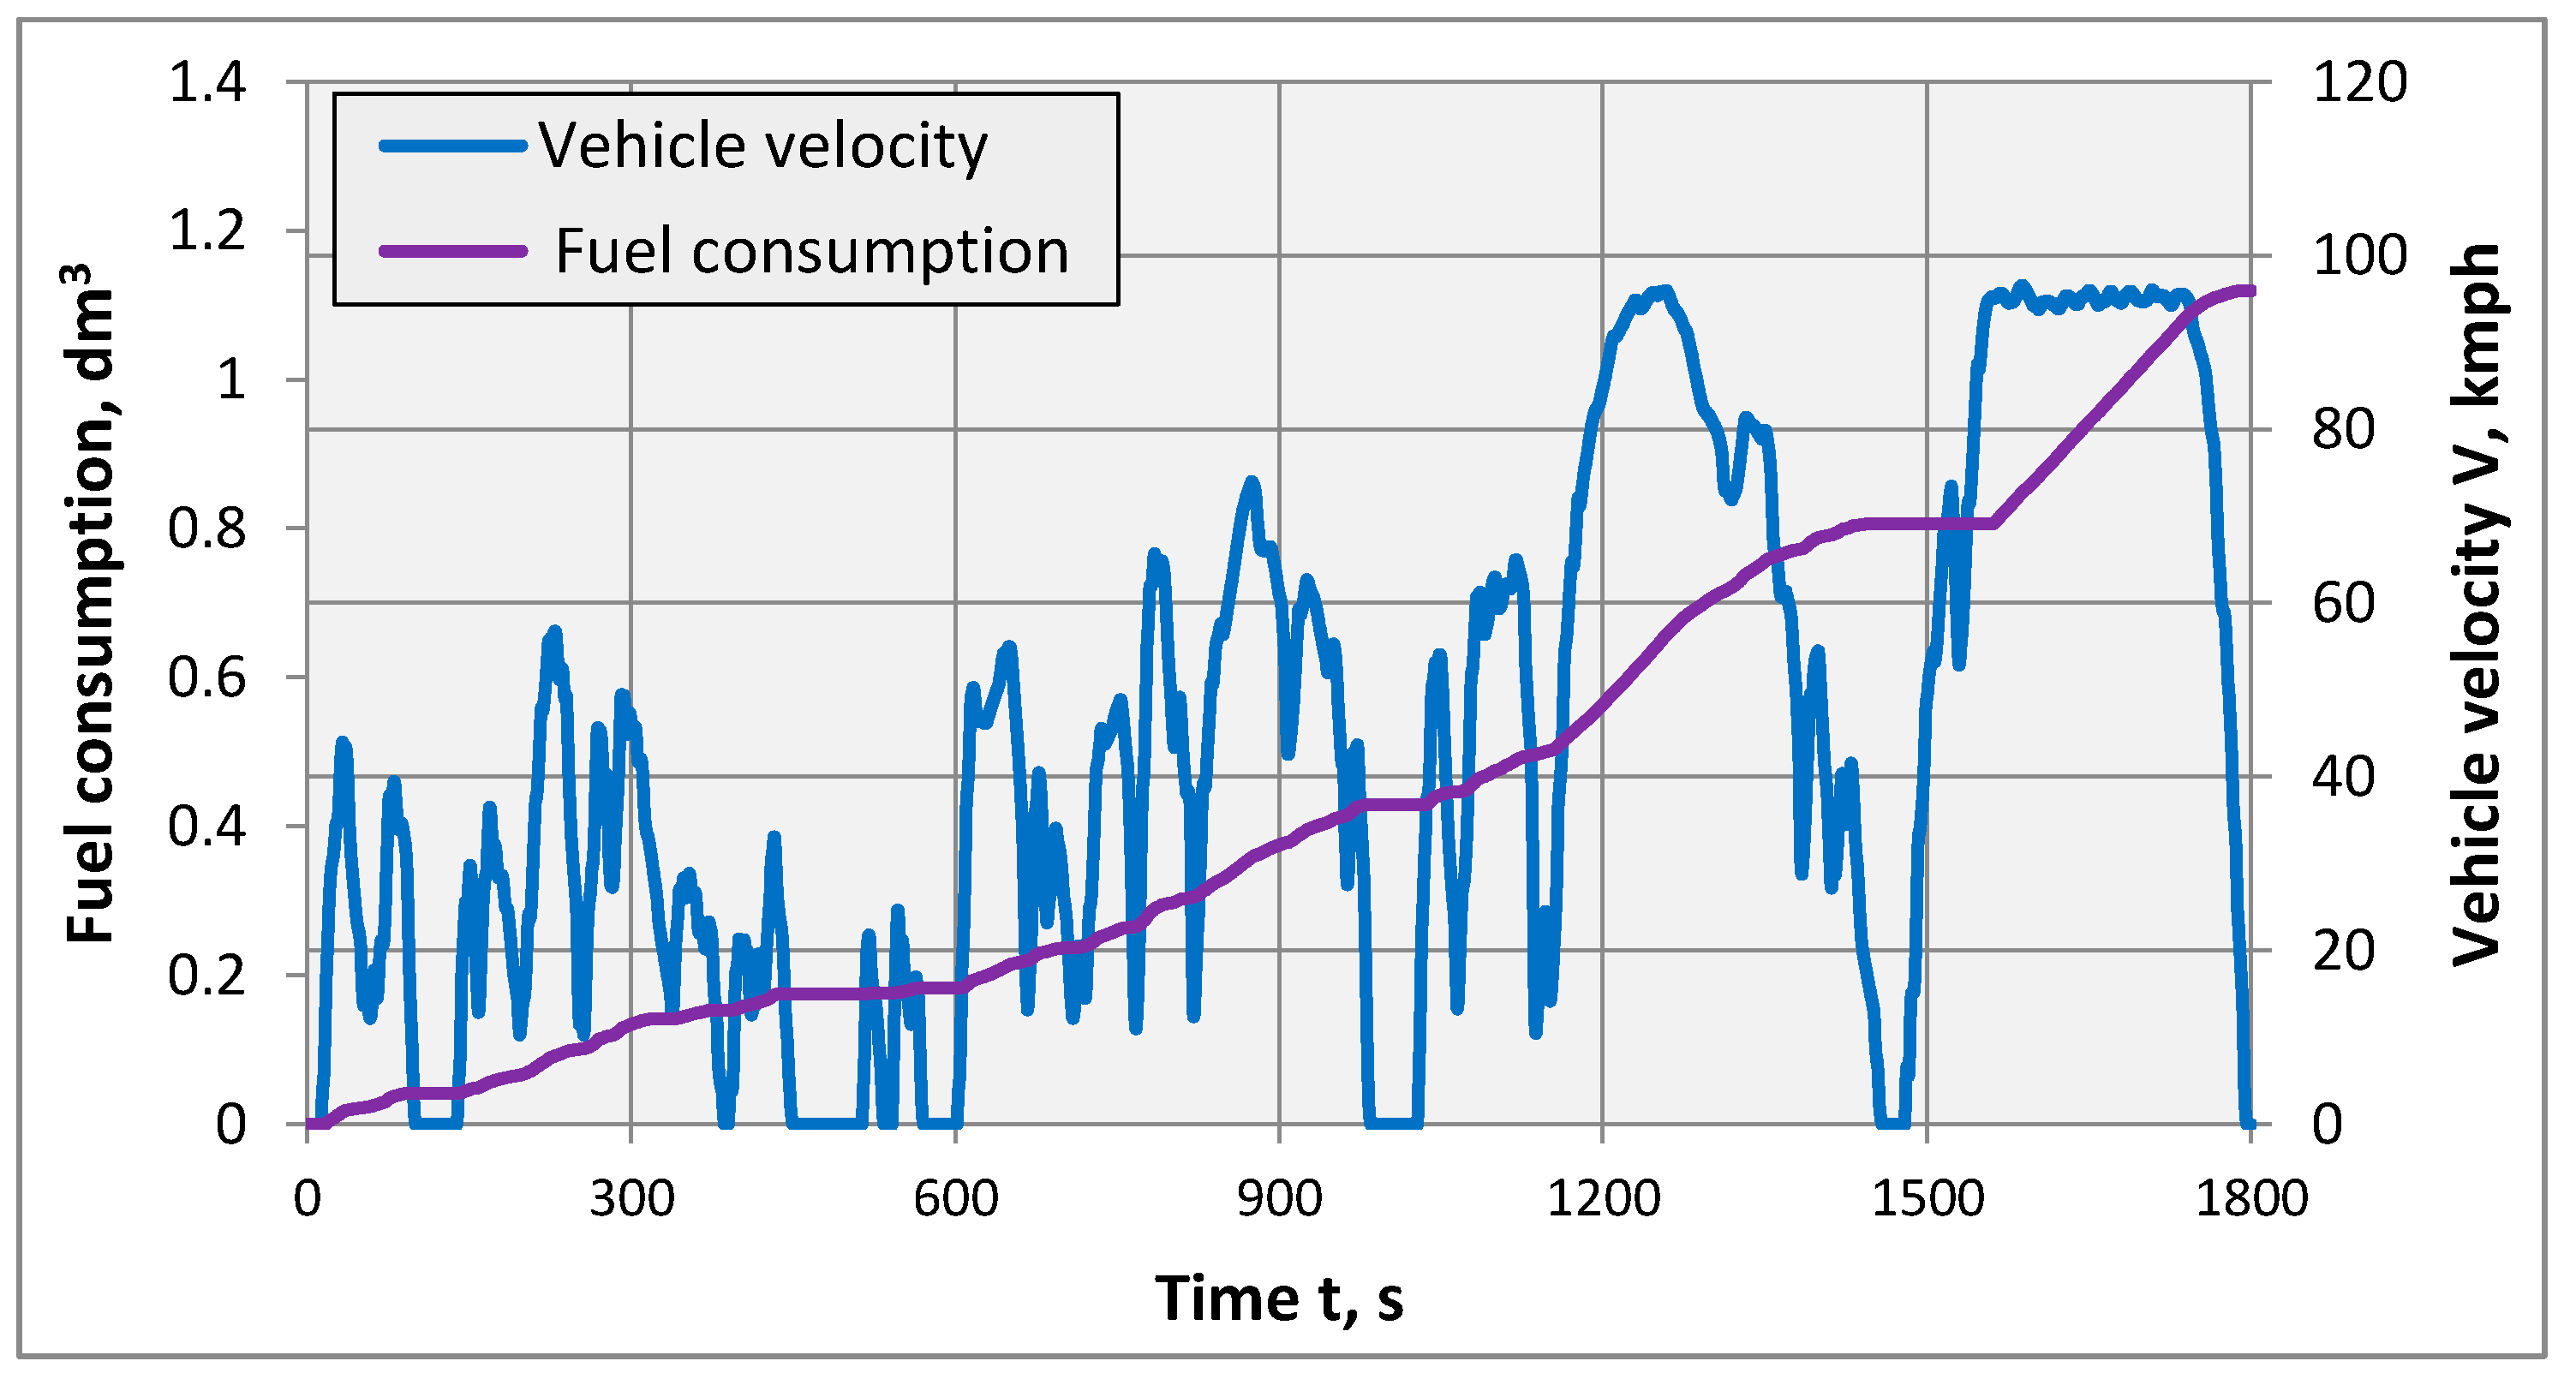
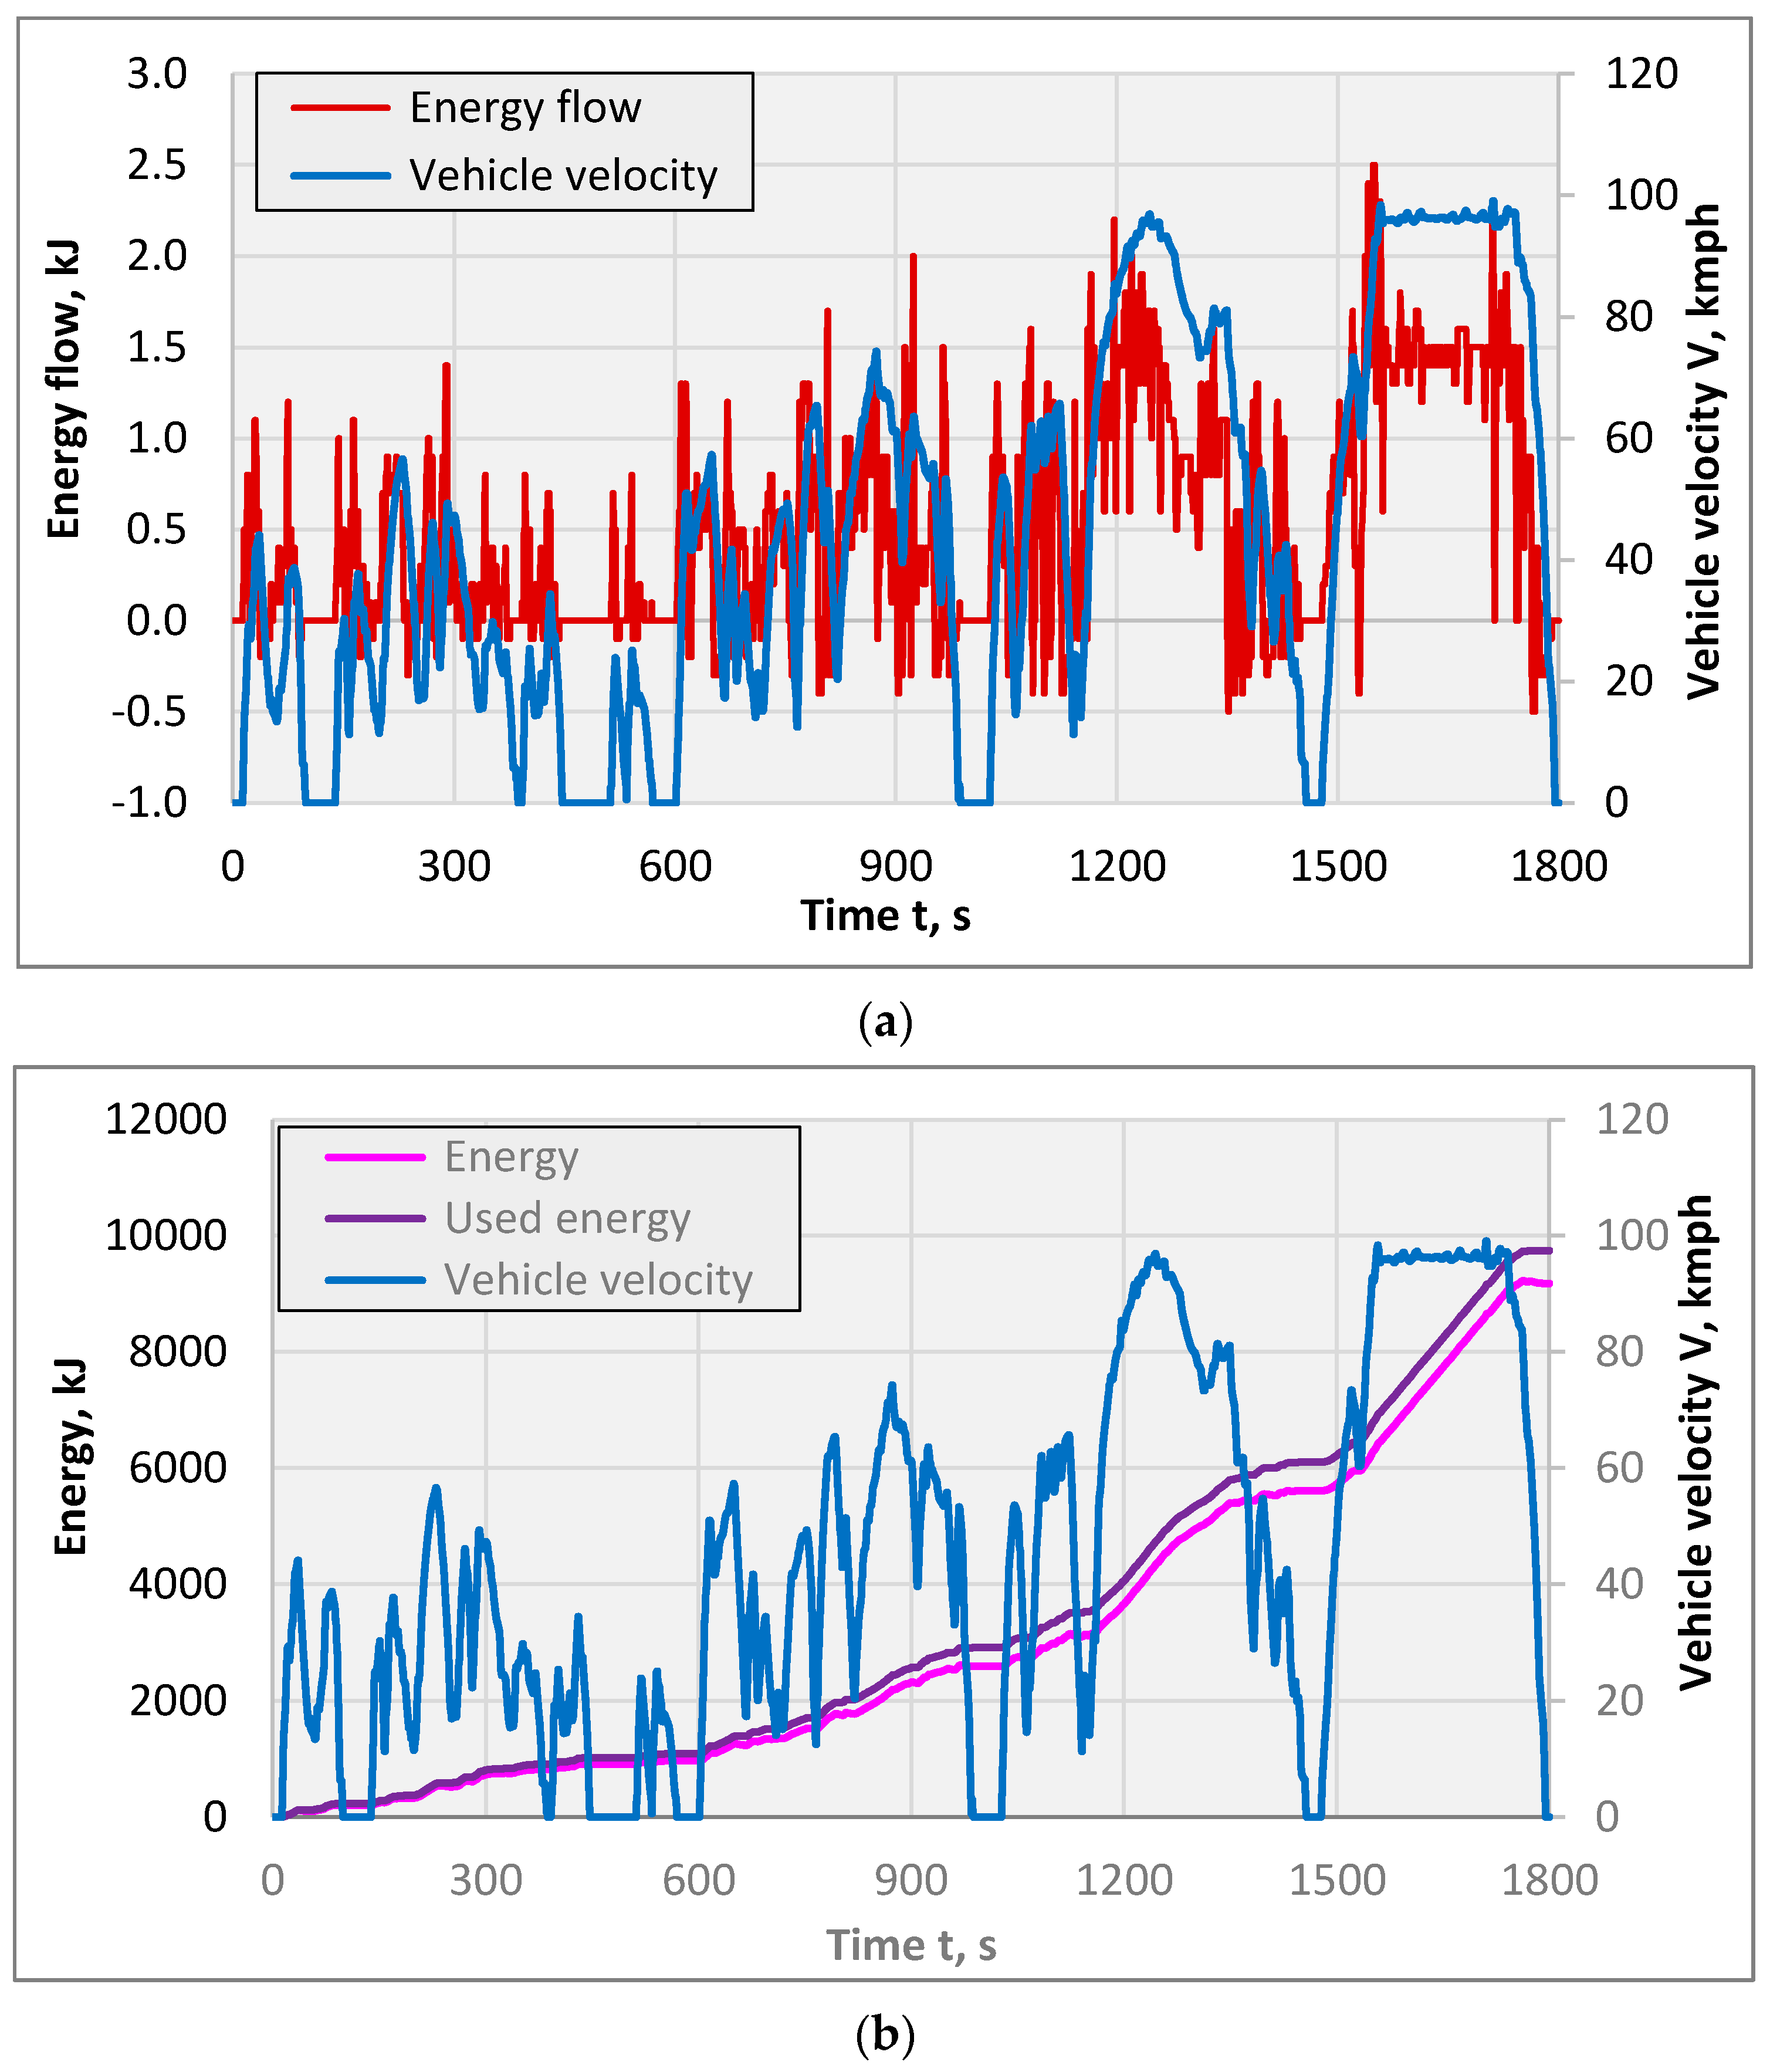
The energy consumption during the test of a hybrid car is presented in
Figure 6. The energy consumed by a hybrid vehicle is the energy of fuel combustion (1.24 L/test), reduced by heat losses and the efficiency of the drive transmission system. Measurements during the test show that the energy consumed was ~9117 kJ. An electric car consumed ~9745 kJ of energy in the same test.
The energy of the fuel consumed during the test (1.24 L) by the hybrid car, determined from its calorific value, is ~39,990 kJ. Taking into account the efficiency of the drive transmission system, the average efficiency of the combustion engine during the test (using fuel to drive the engine) can be estimated at ~20 to 25%.
When comparing vehicles, attention should be paid to the fact that an electric vehicle has a greater mass resulting from the battery pack, which affects not only the energy consumption during the test but also the amount of energy recovered.
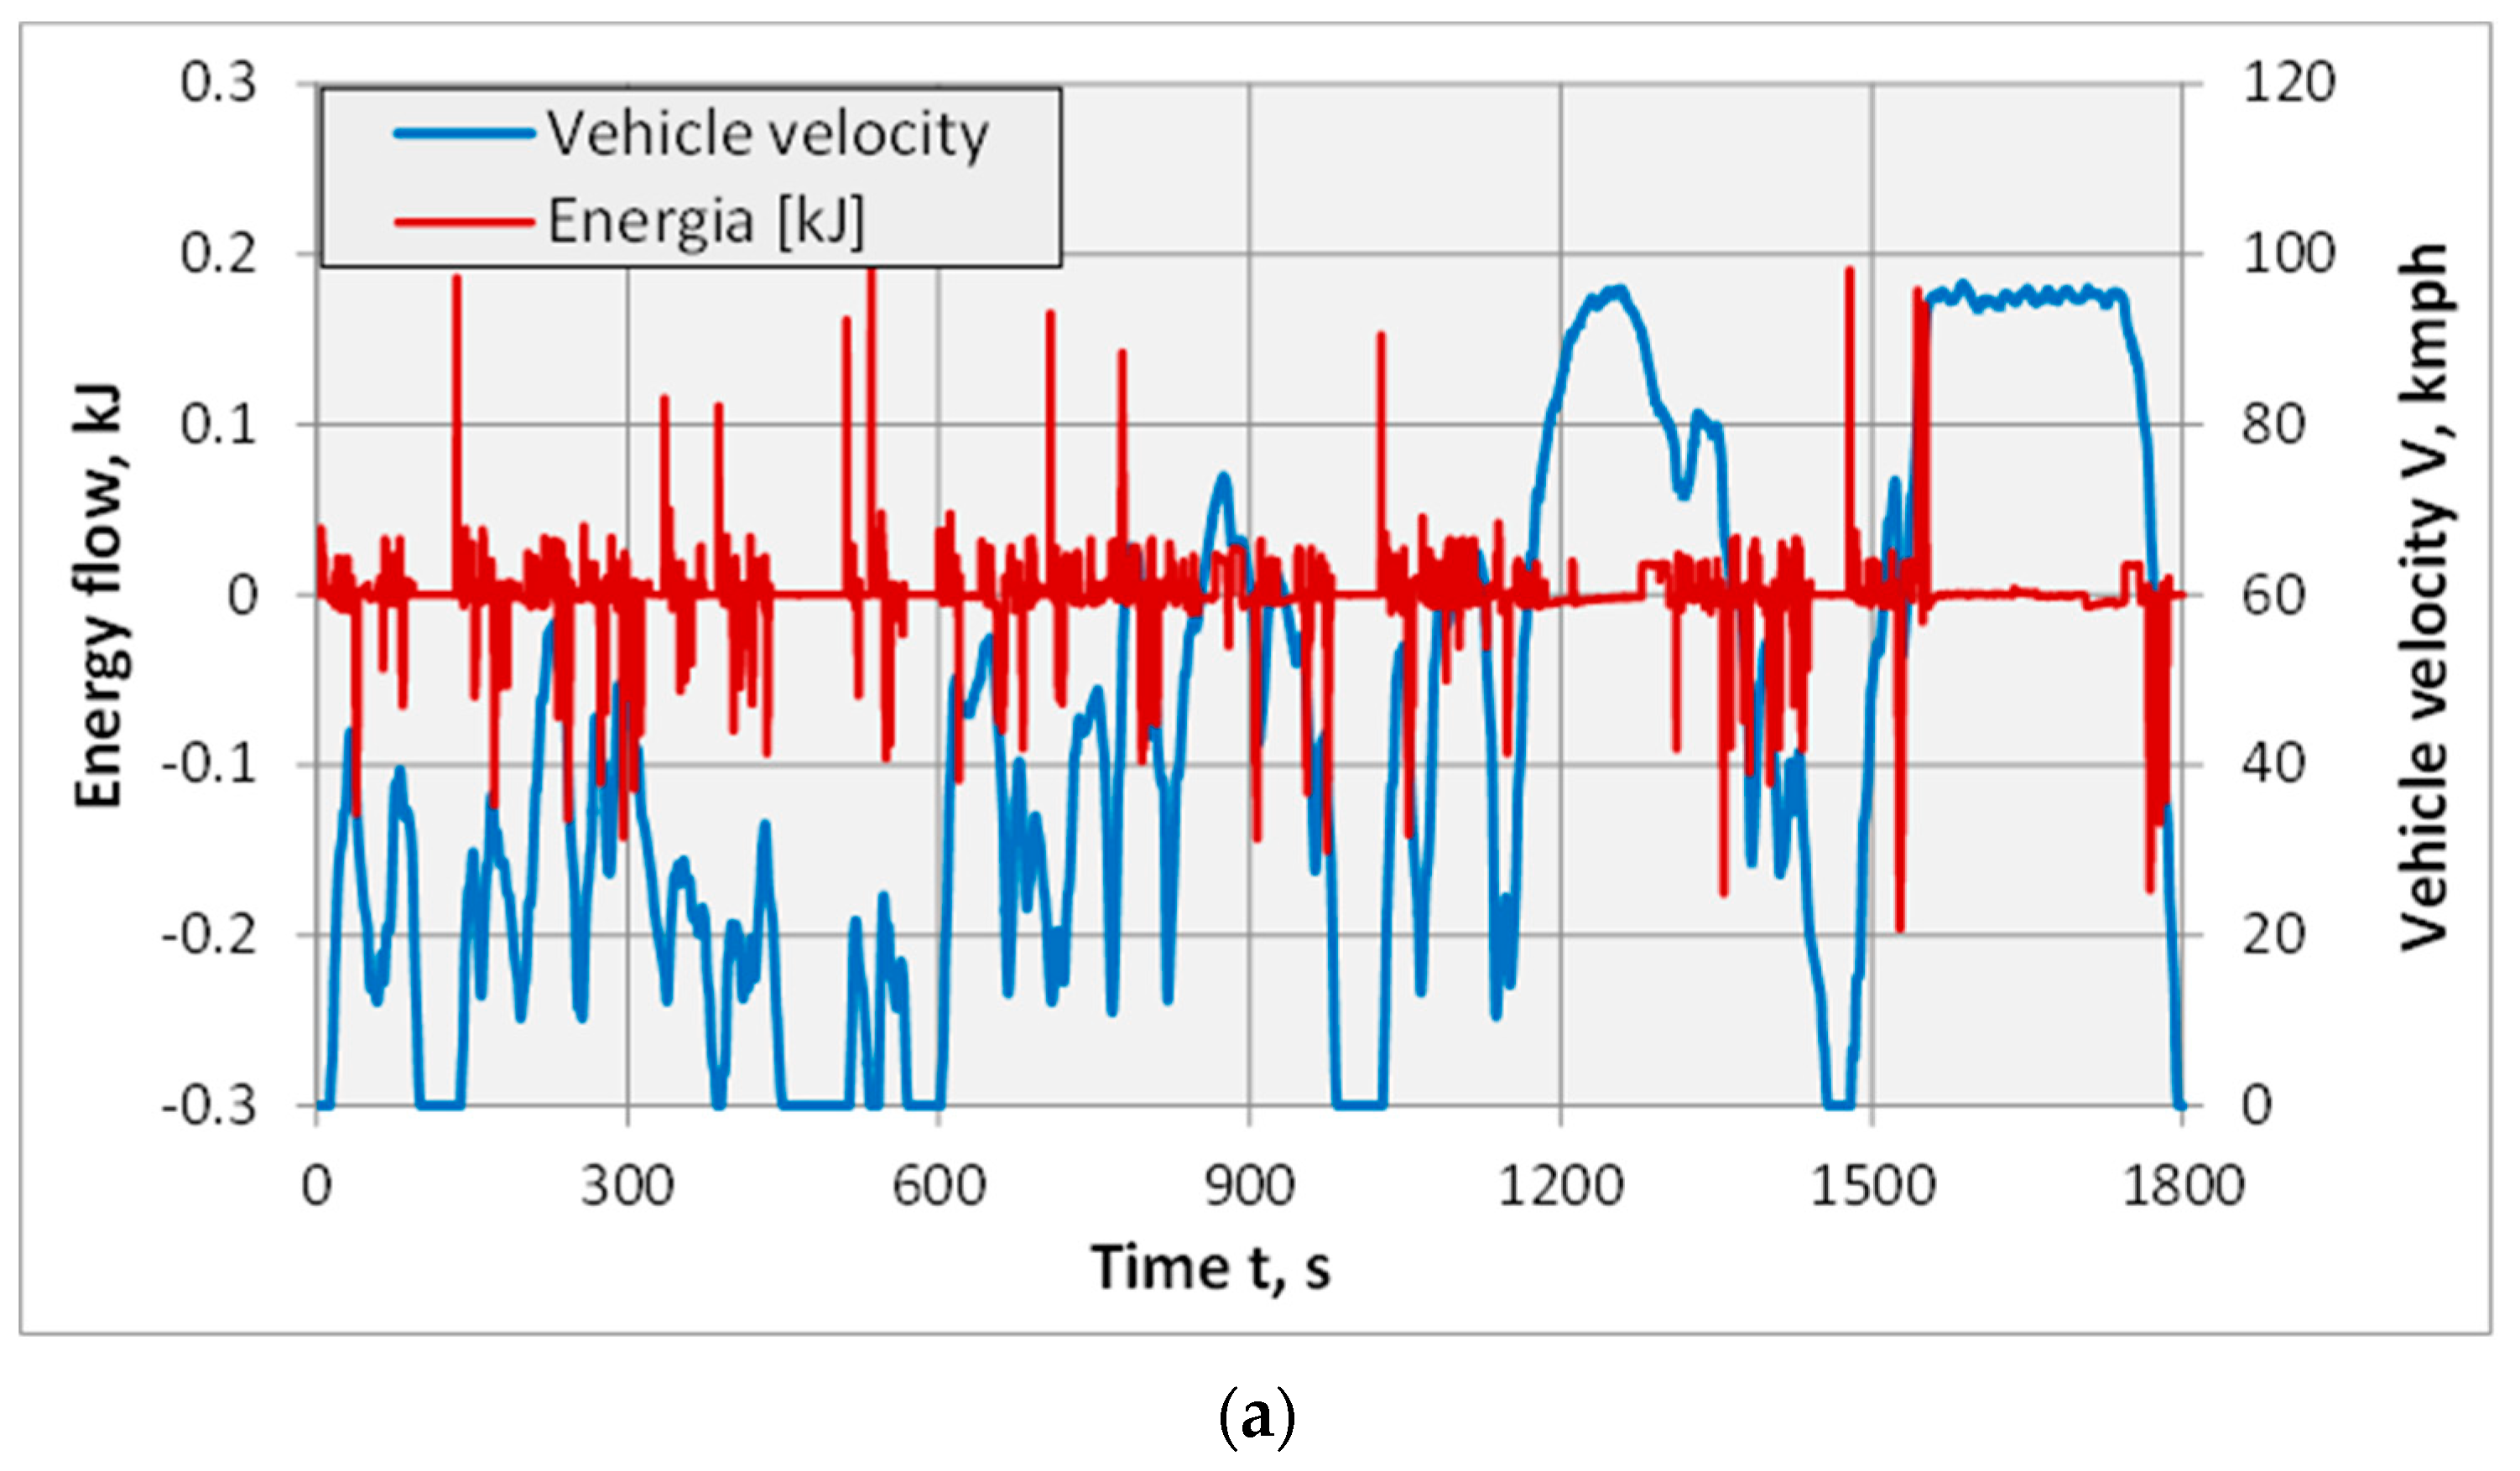
During deceleration, hybrid and electric vehicles recover energy. The hybrid drive car uses a generator-starter that allows energy recovery during deceleration.
Figure 7 shows the electricity used and recovered by a hybrid car during the test. Positive values represent energy consumption, and negative values represent recovered energy (
Figure 7a).
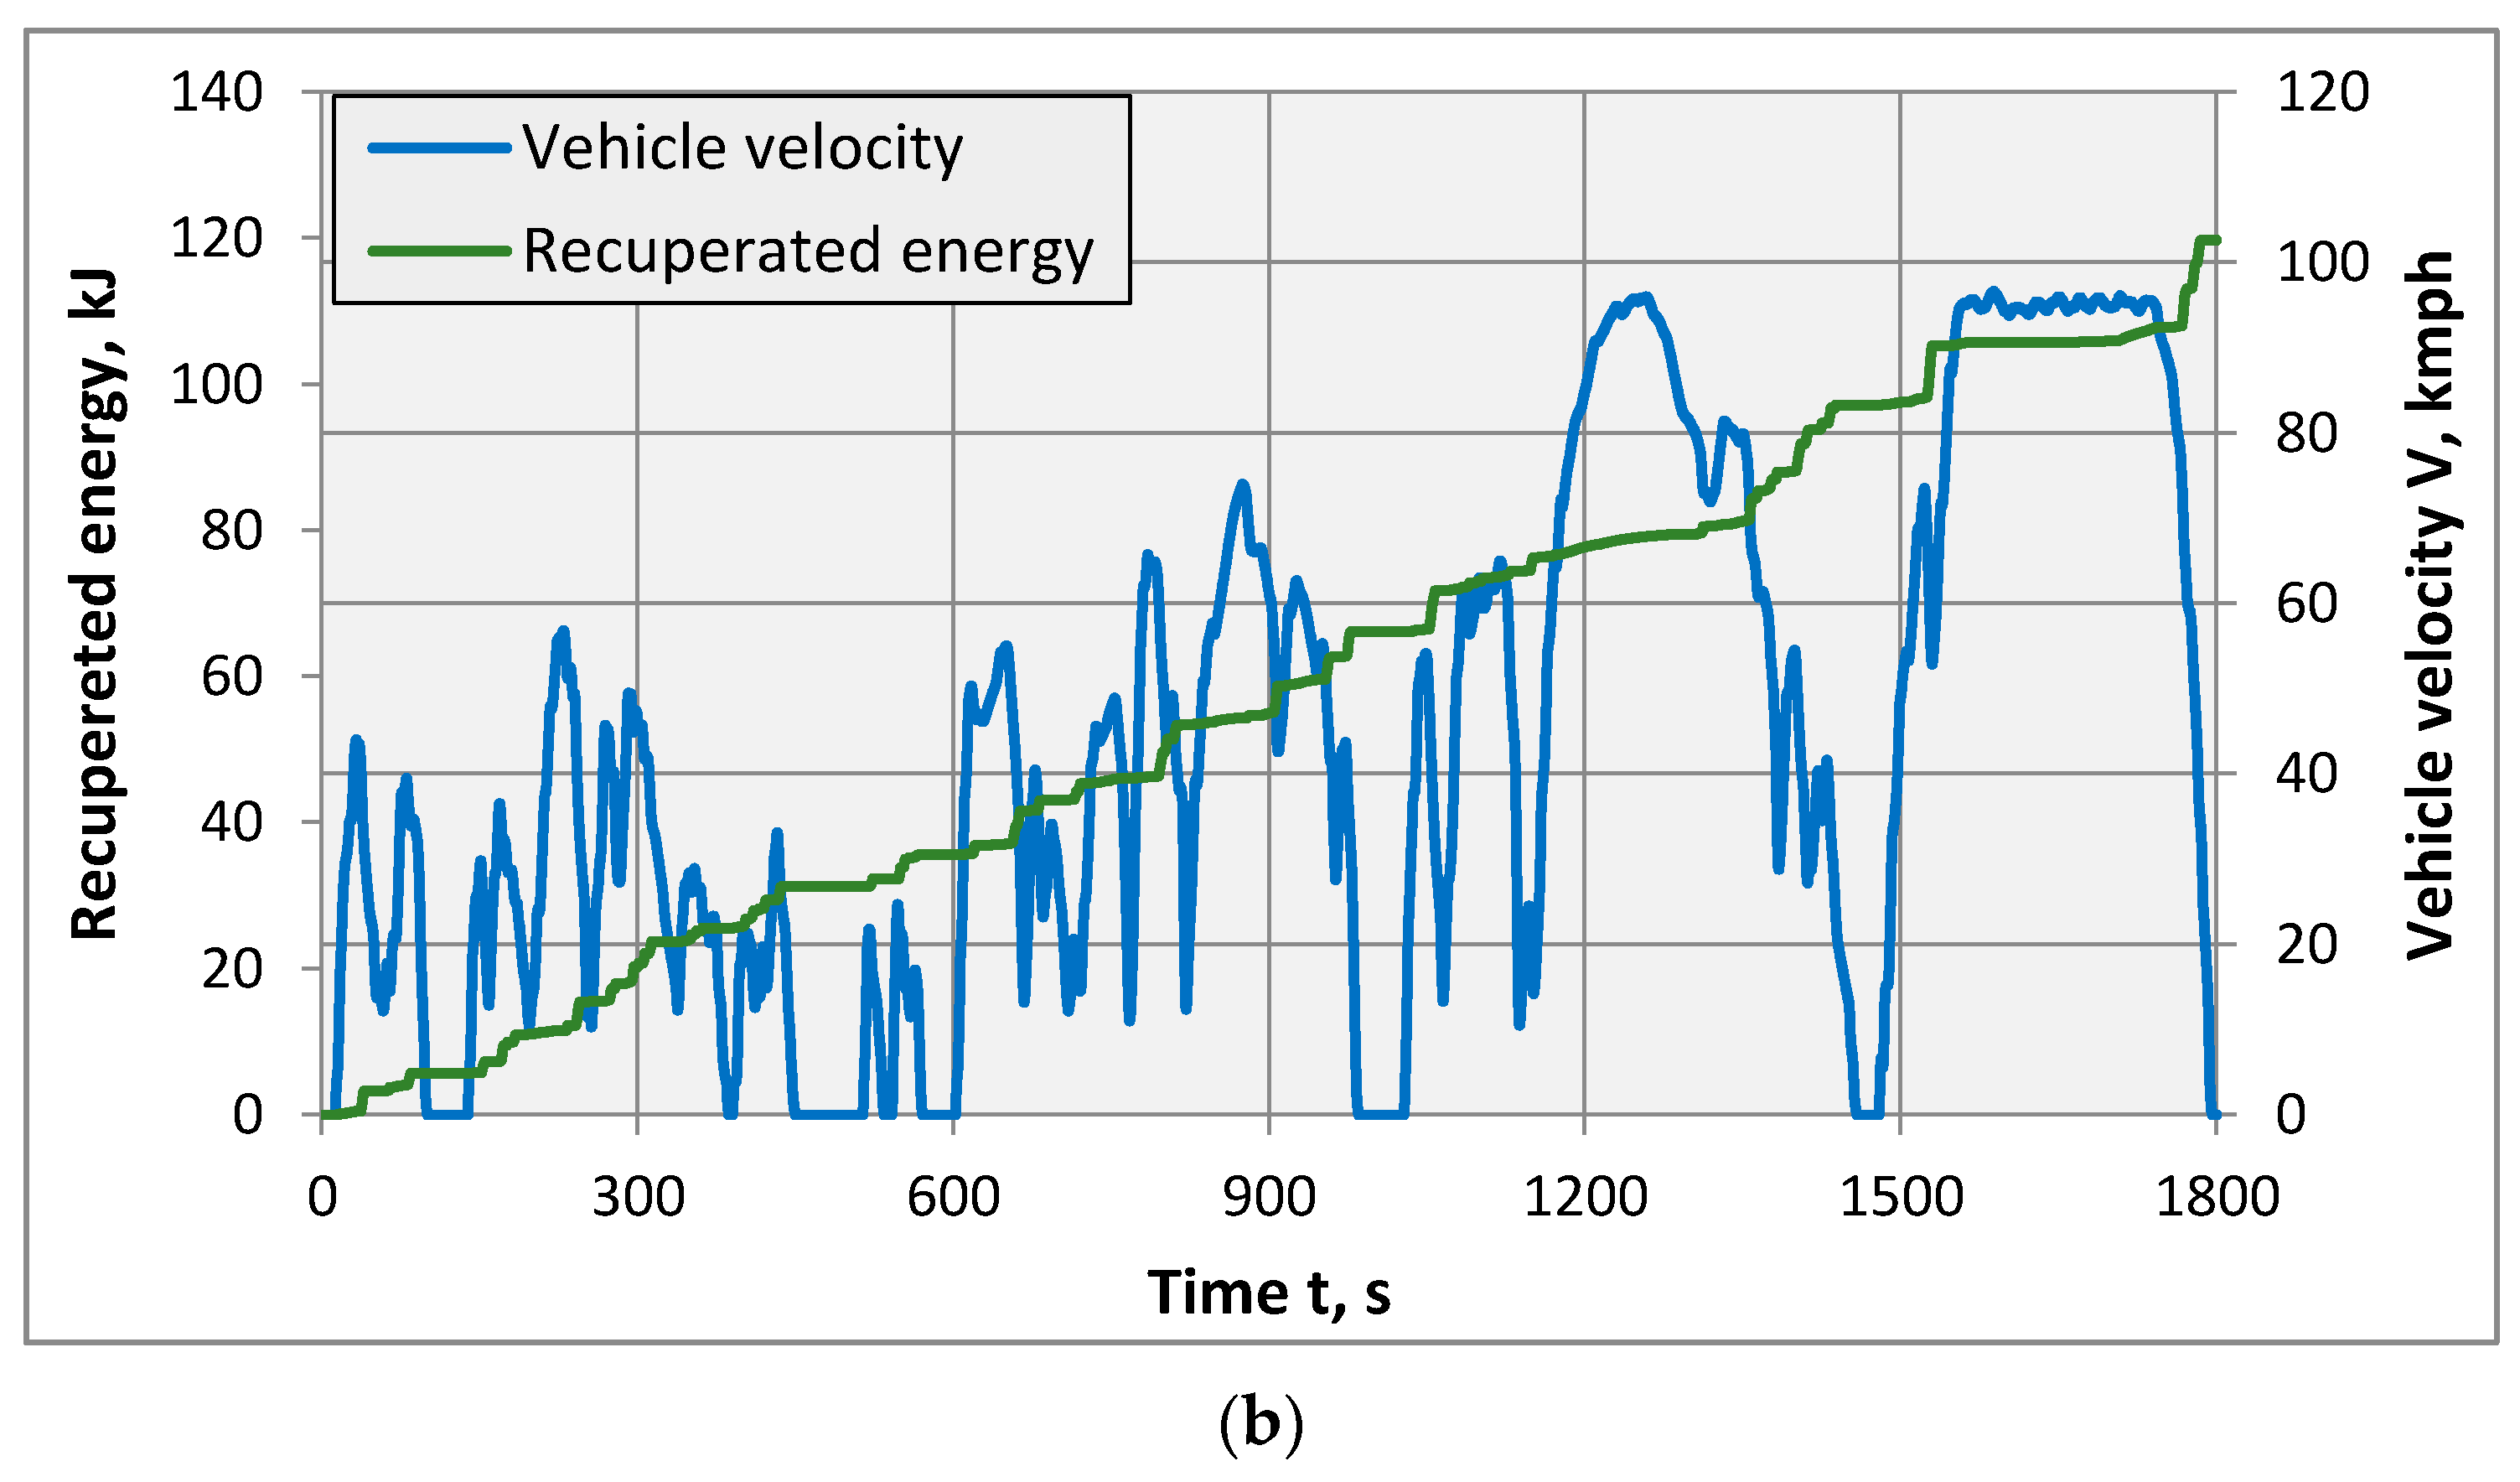
Figure 7b shows the total recovered energy. The amount of energy recovered is ~120 kJ.
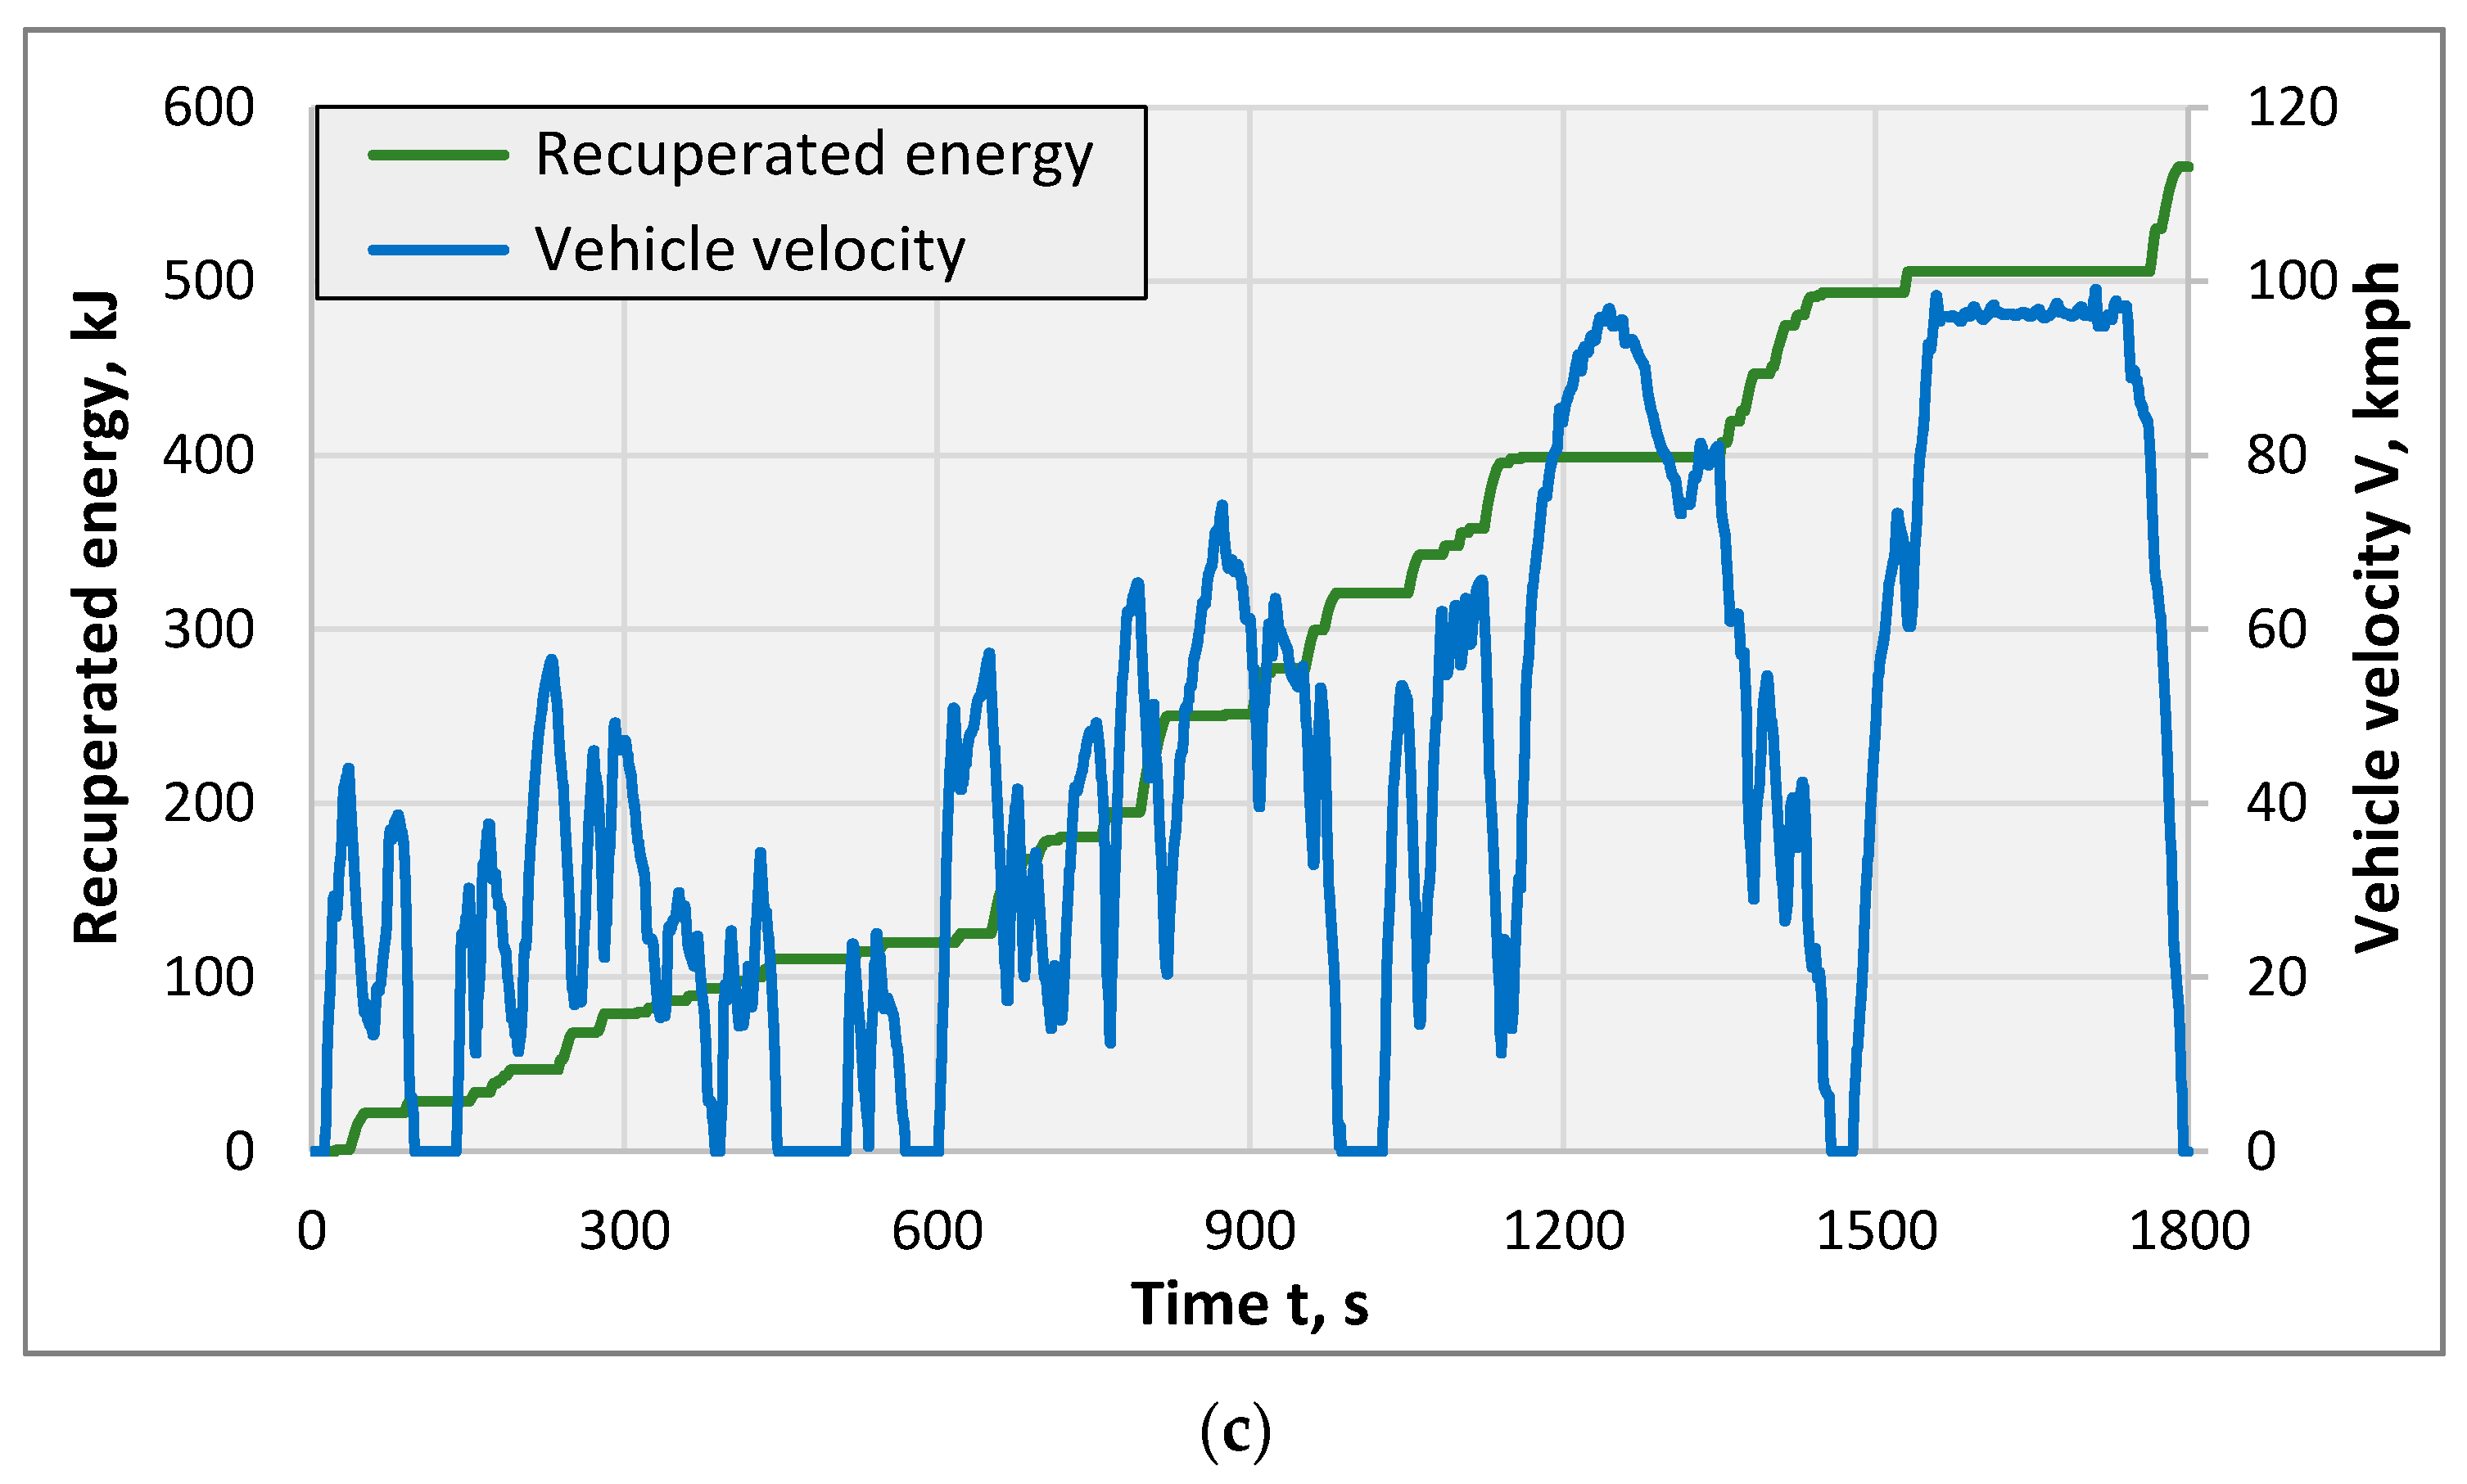
Figure 8 shows the energy consumption of an electric car during the WLTP test. An electric-drive car recovers energy each time it reduces its speed, so the recovered energy is almost five times greater and amounts to ~565 kJ.
Figure 8b shows the energy used, including the recovered energy and the energy consumption without taking into account its recovery.
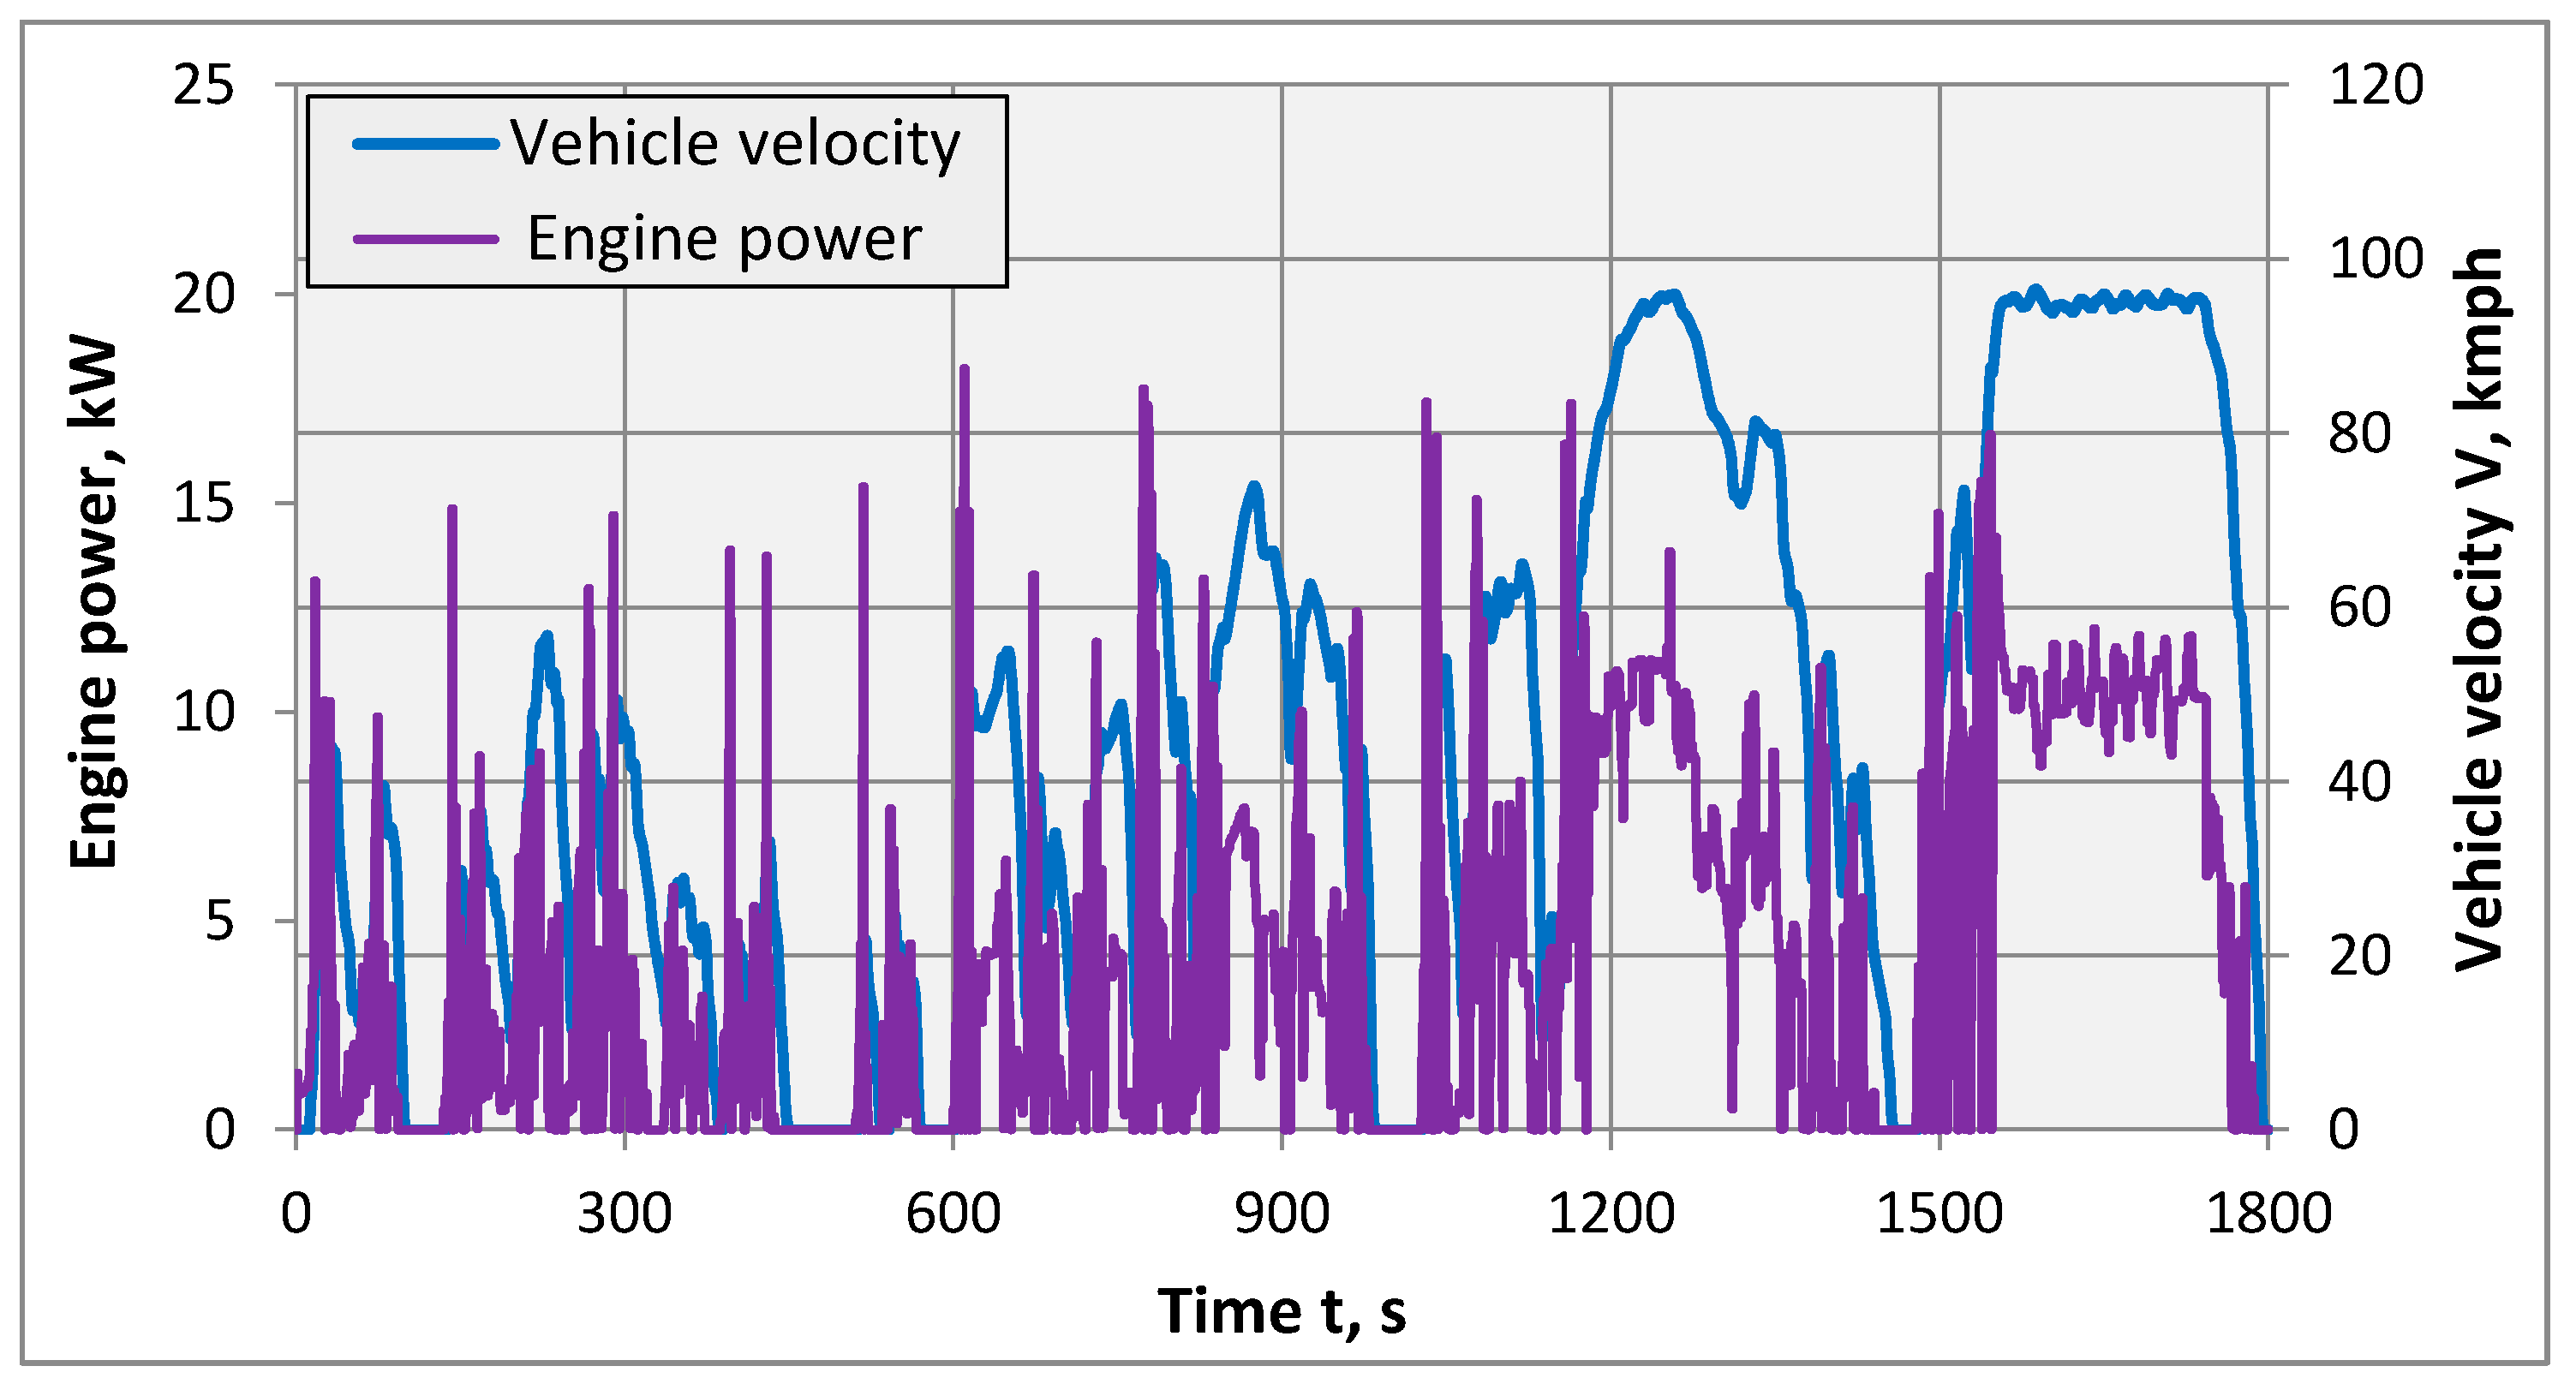
Figure 9 and
Figure 10 show a comparison of the power generated by the engines of both vehicles during the test.
Figure 9 does not take into account the power generated by the electric motor of the hybrid car because its share in driving the car was relatively small.
During the highway part of the WLTP test in a hybrid car, the maximum power of the combustion engine does not exceed 17 kW, and when driving at constant speed, the engine power oscillates around 12 kW.
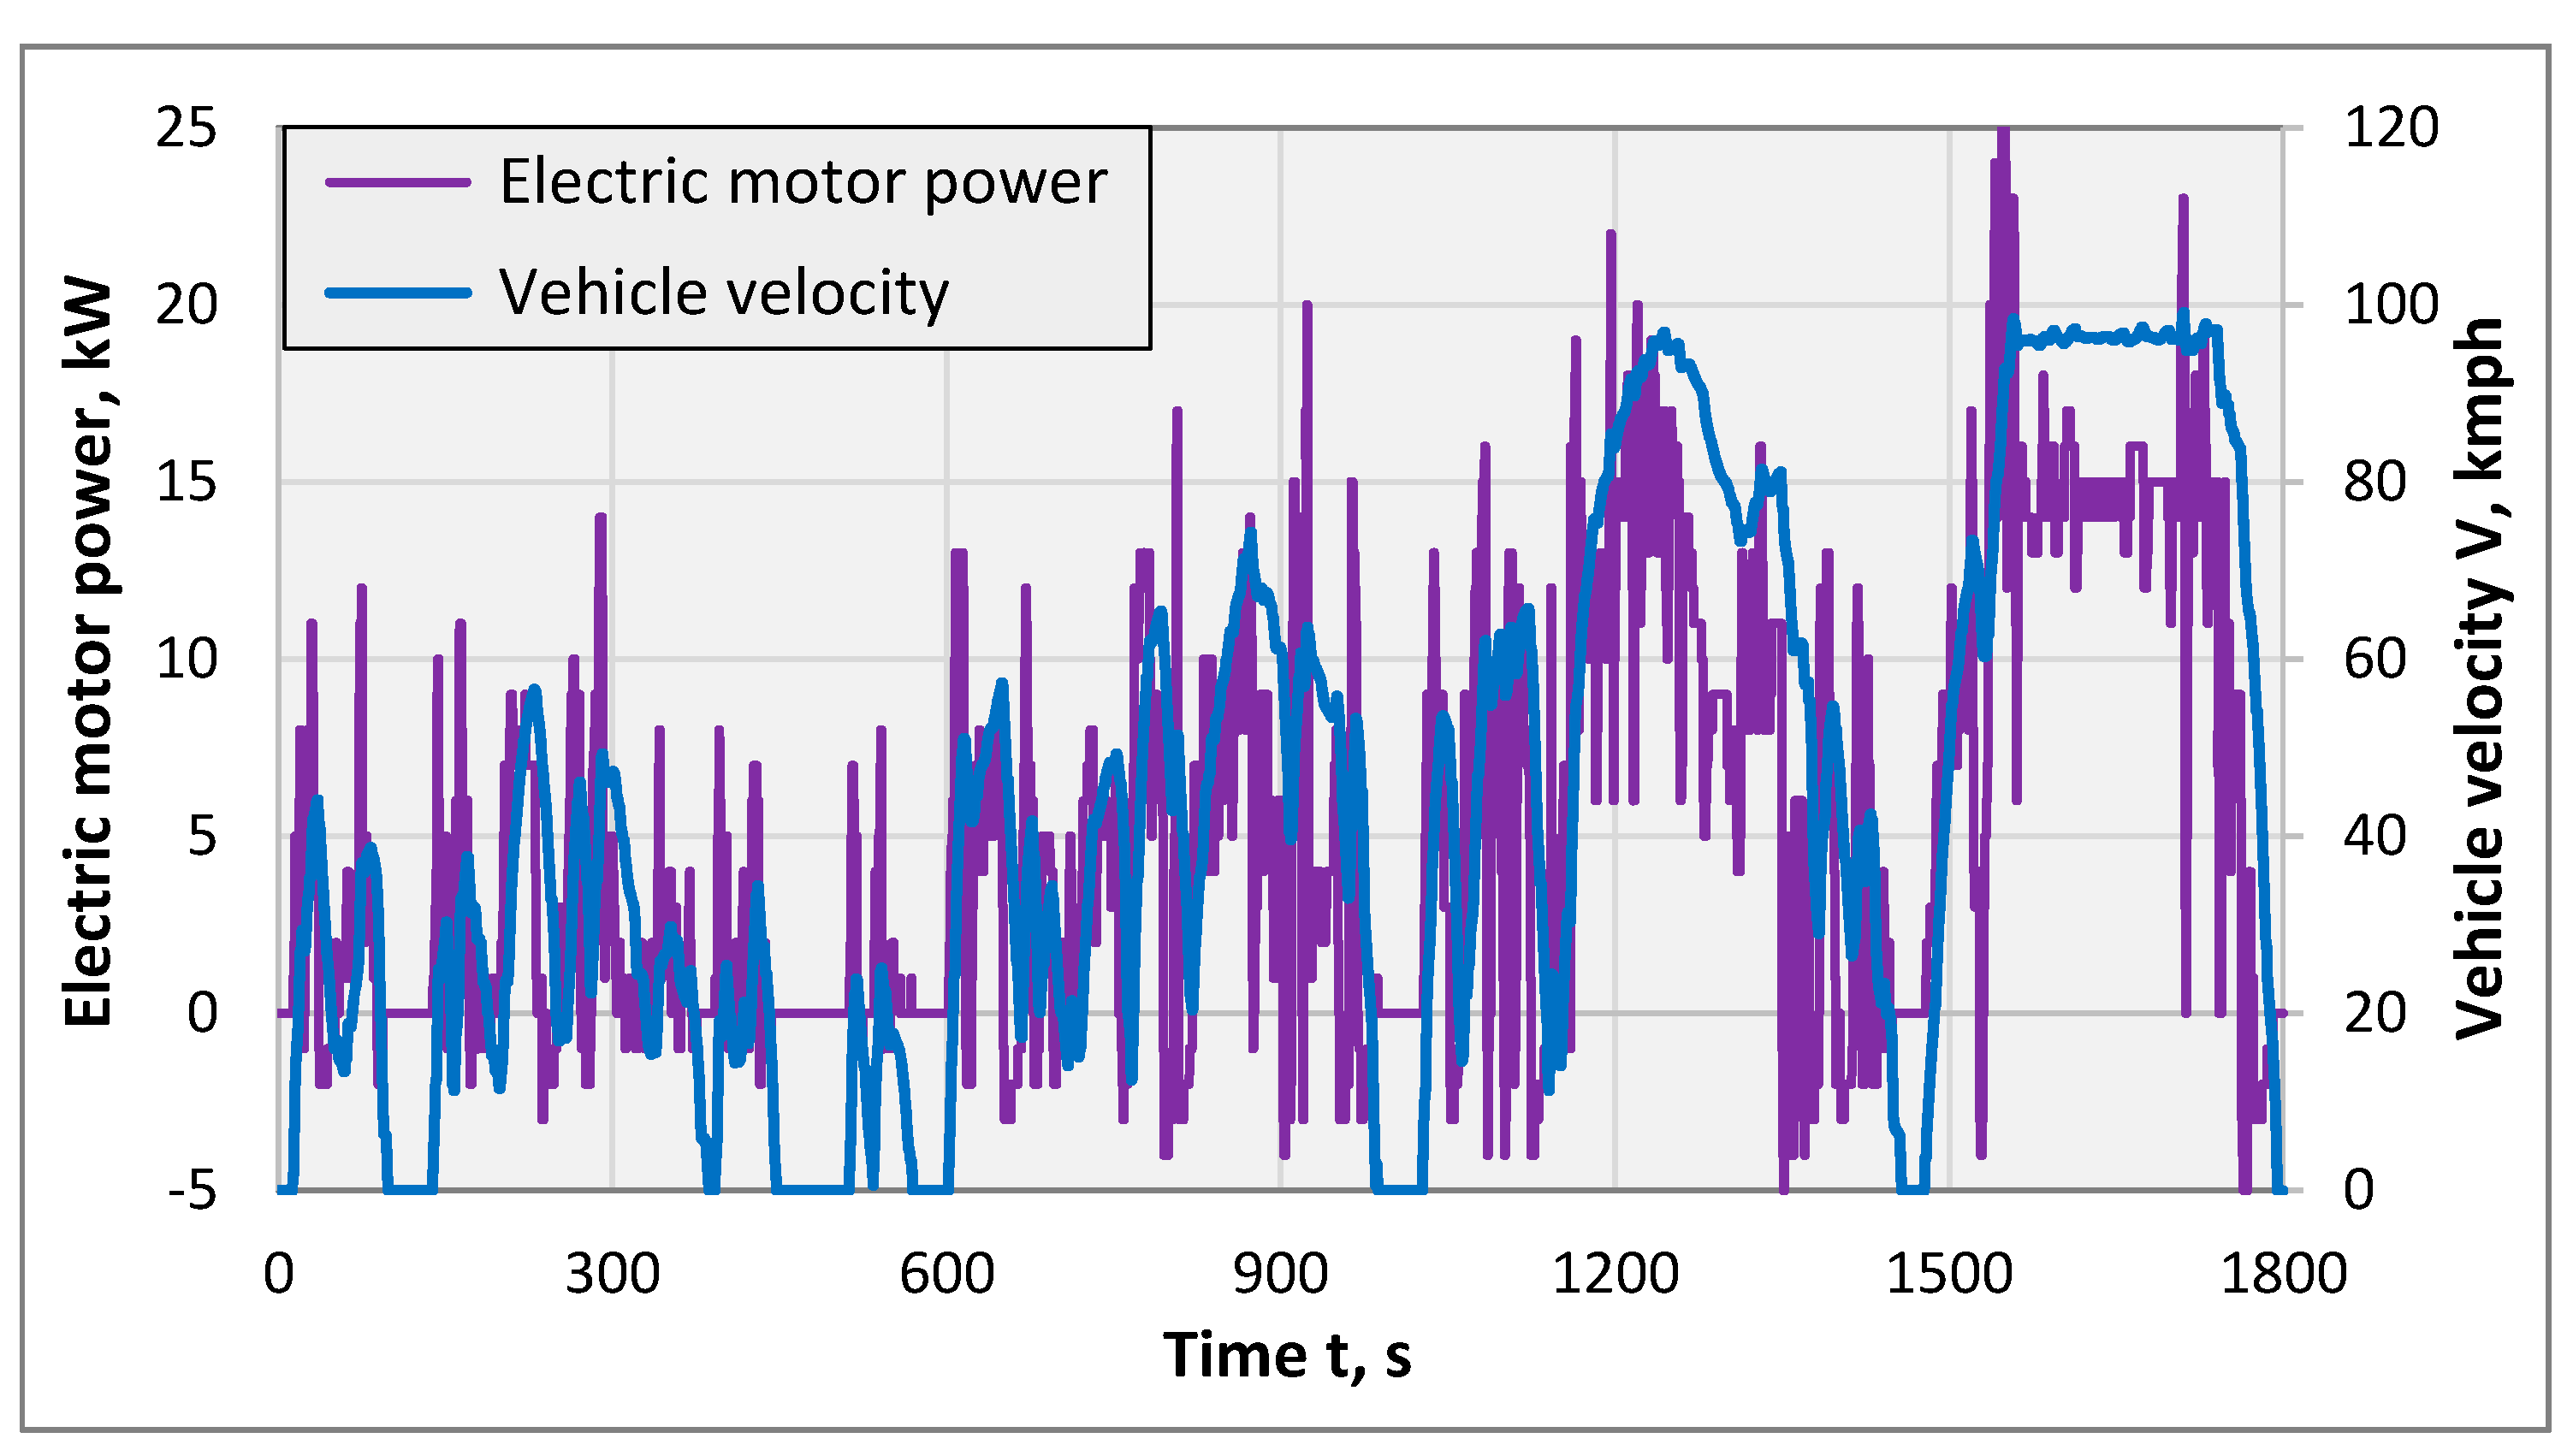
Figure 10 shows the power generated by the electric motor. During the highway part of the test, the maximum engine power values do not exceed 25 kW, and when driving at constant speed, the engine power oscillates around 14.5 kW.
Figure 11 and
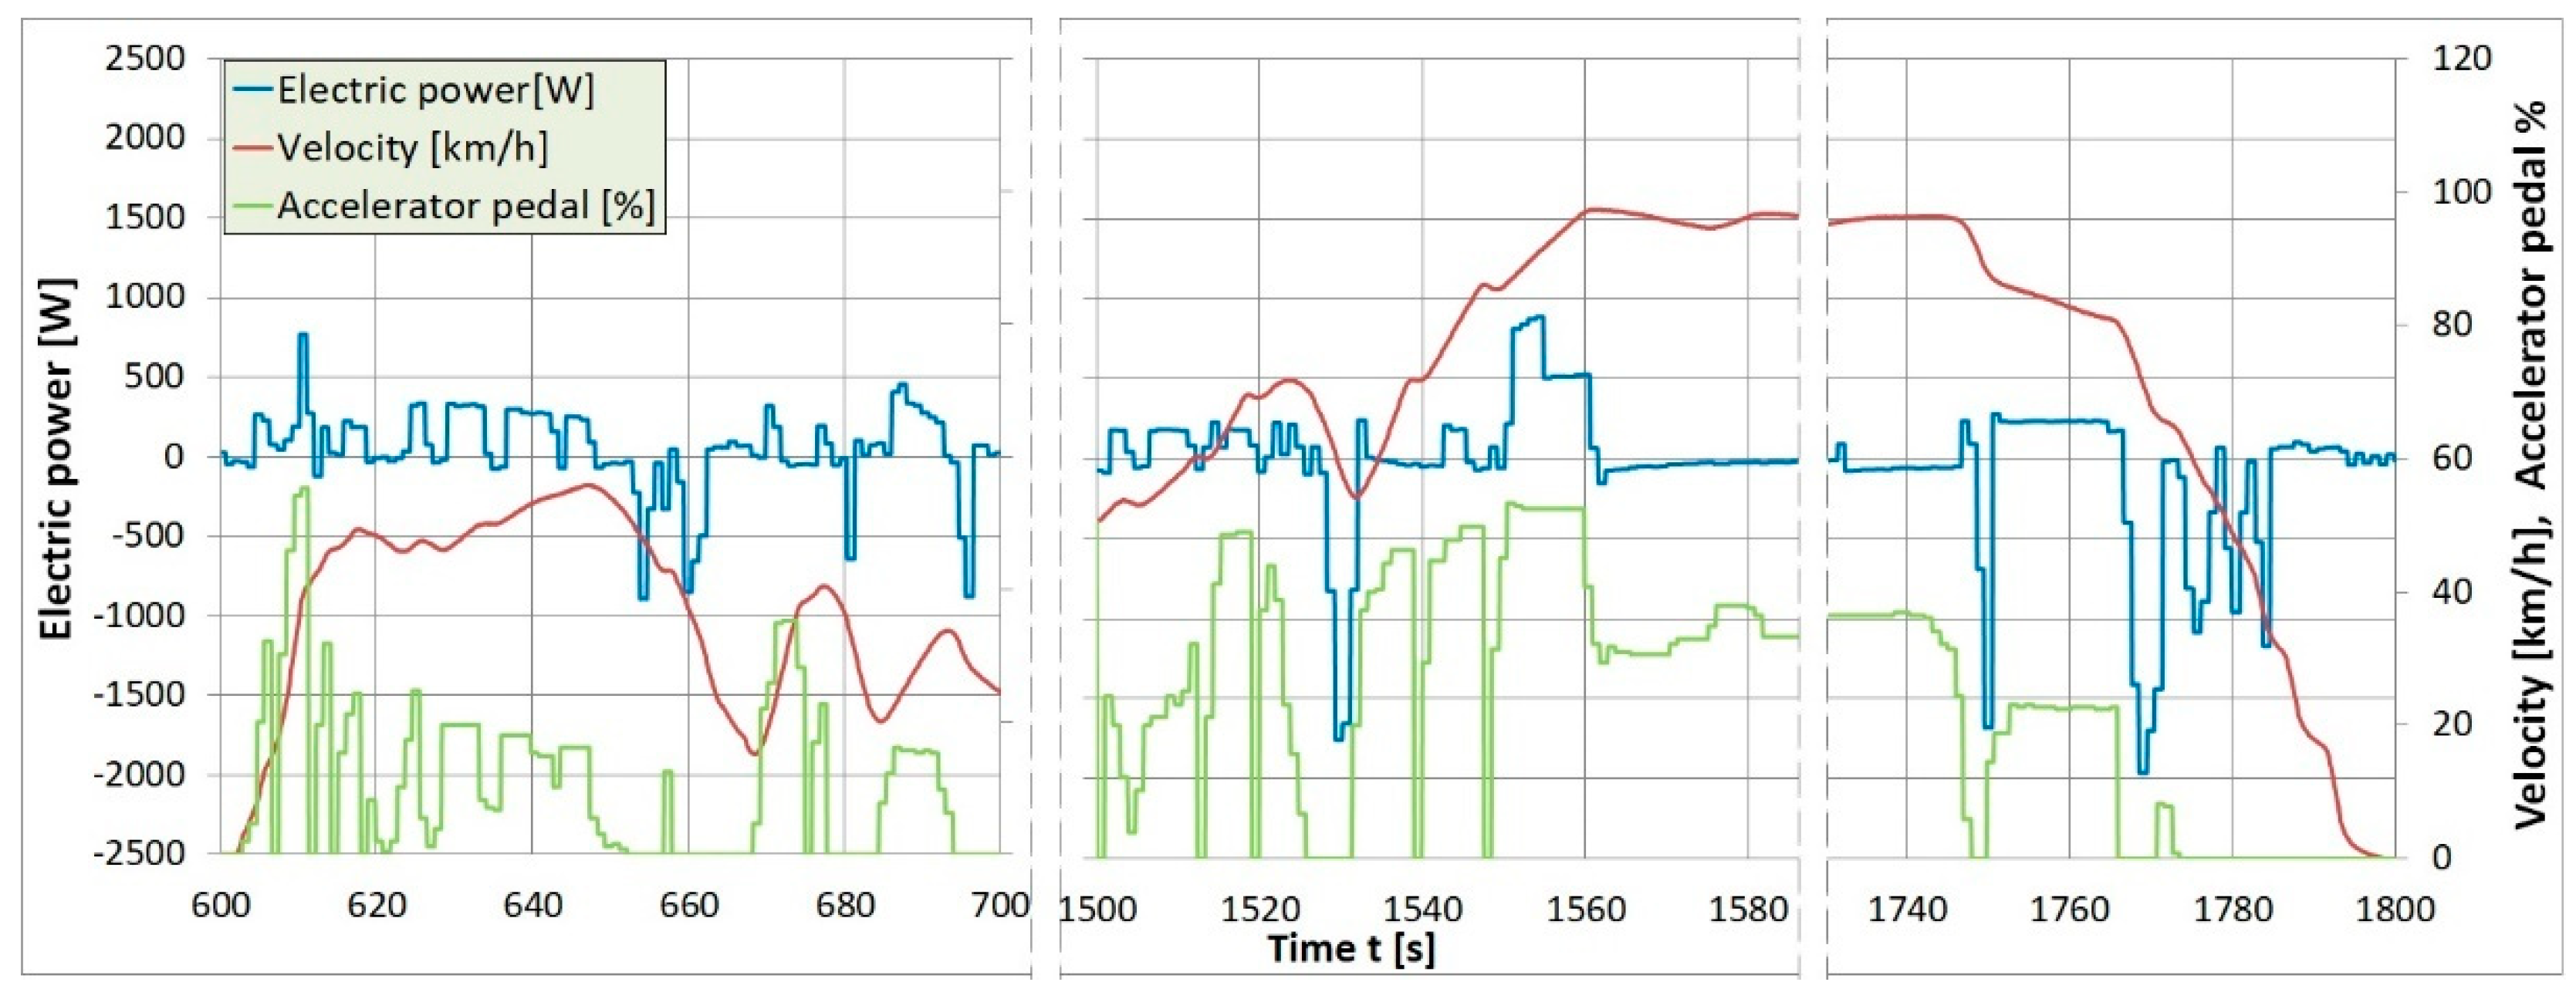
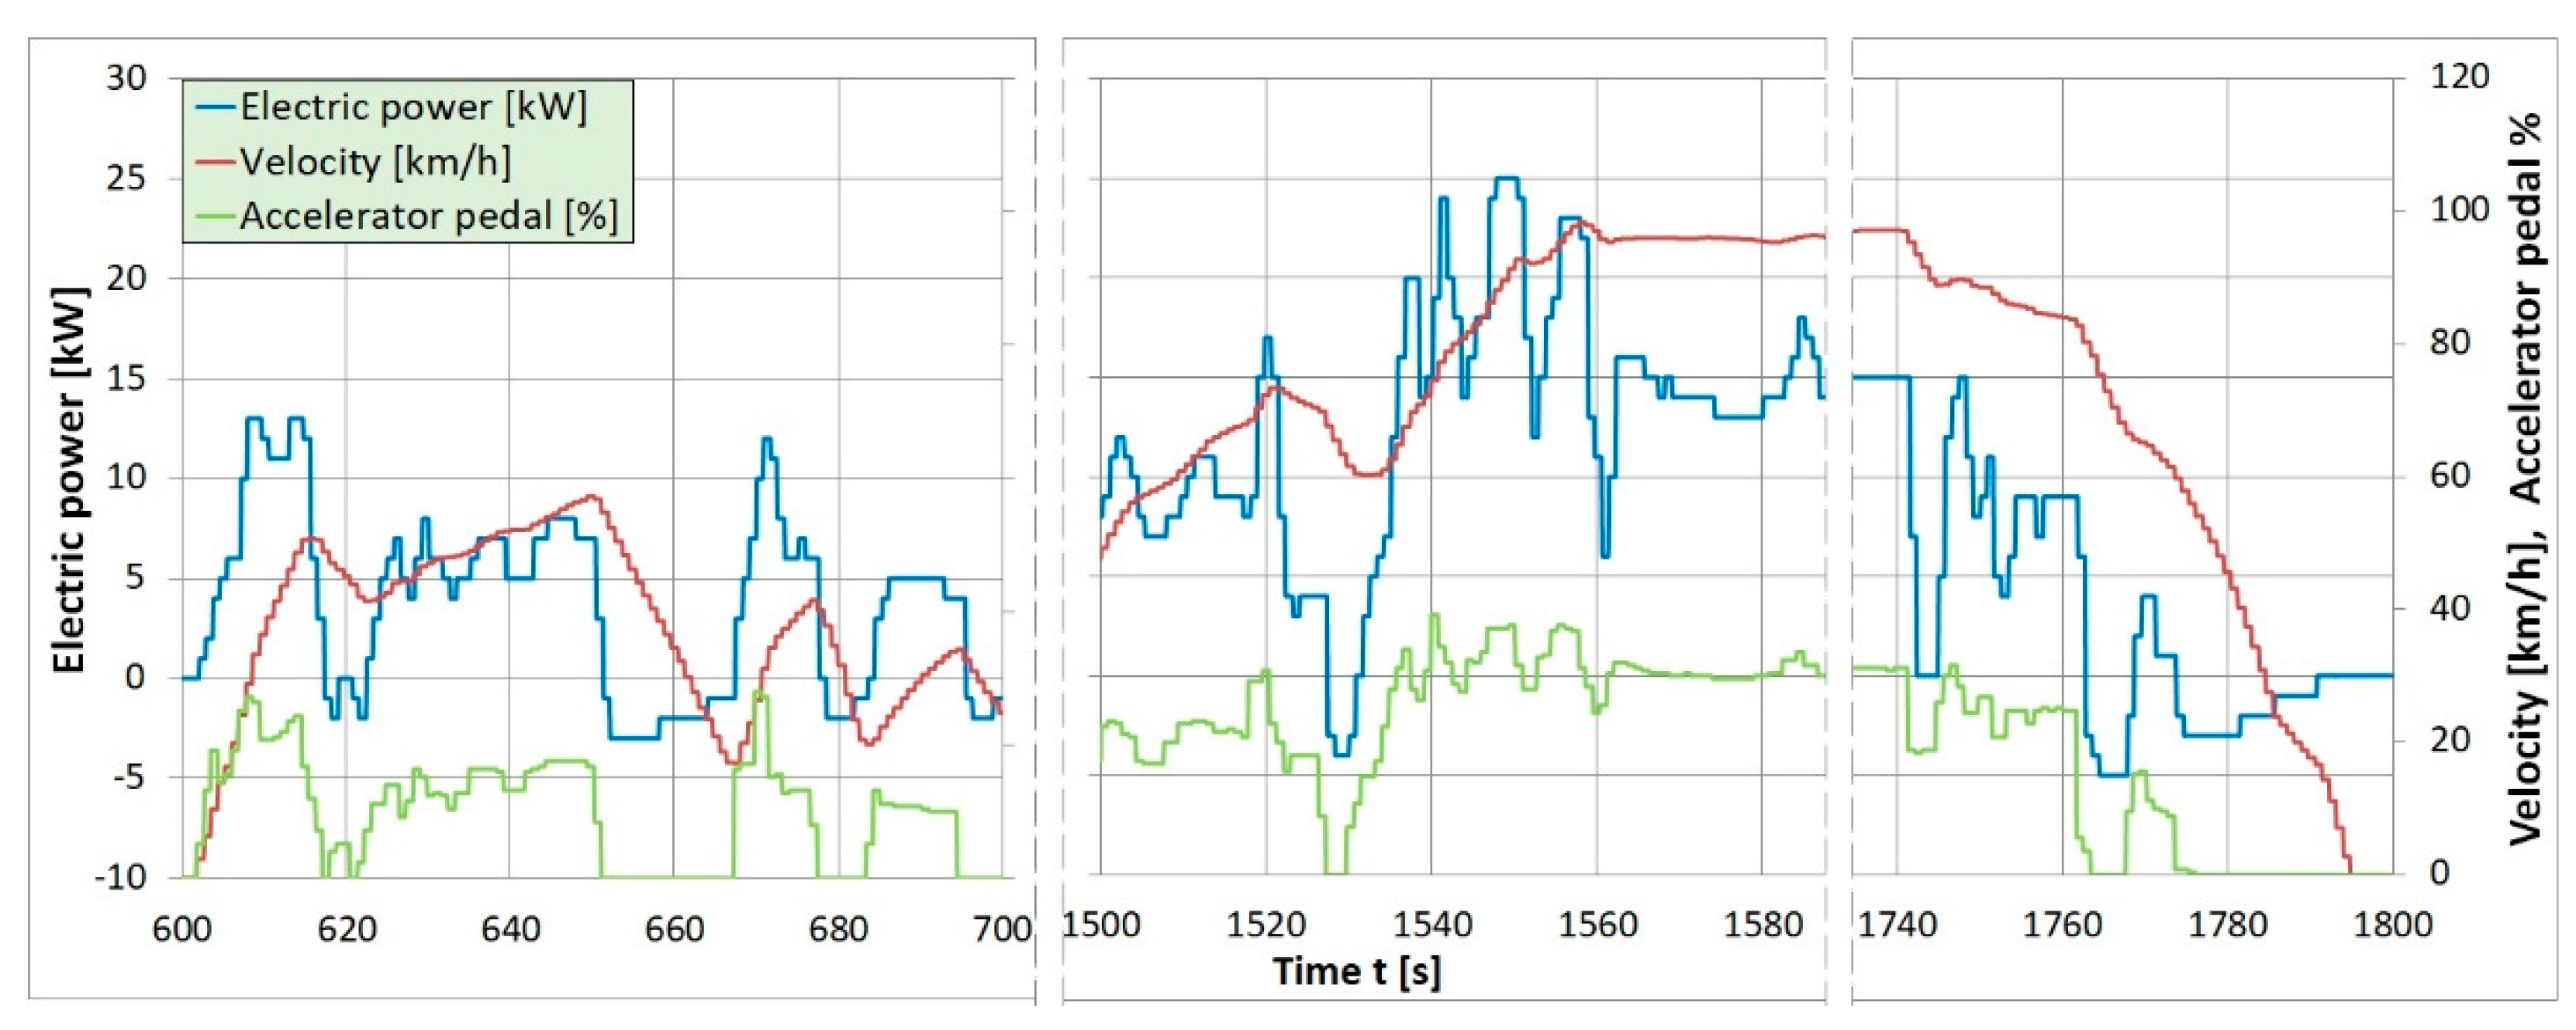
Figure 12 show the operation of the electric engine in a hybrid drive and electric-drive car in selected fragments of the WLTP test.
Figure 11 shows the power generated by the electric motor of a hybrid drive car during acceleration (positive values on the graph) and during deceleration of the vehicle (negative values on the graph) for selected fragments of the test. The figure also shows the driving speed and the position of the accelerator pedal. As shown in the chart, during intense acceleration, the electric motor supports the combustion engine, and during low-intensity acceleration, power is also generated, which causes additional load on the combustion engine and its operation in a more efficient range. When reducing the driving speed, energy is recovered. This type of operation does not depend on the driving speed, as shown at ~50 and ~100 km/h. When accelerating the car, the electric motor generates power to accelerate the car, and when decelerating, energy is recovered.
Figure 12 shows the power generated by the electric motor of the BEV during acceleration (positive values on the graph) and during deceleration of the vehicle (negative values on the graph). The figure also shows the driving speed and the position of the accelerator pedal. When accelerating the car, the electric motor generates power used to accelerate the car, and when decelerating, energy is recovered. In this car, the electric motor was the driving source; hence, the power curve generated by the electric motor is similar to the curve of the accelerator pedal position.
Based on tests on a chassis dynamometer, it was determined that the efficiency of the drivetrain of a vehicle with an electric-drive system is = ~95.4%. The demand for additional energy may increase after turning on road lights by ~1.4%, air conditioning up to 10.7%, and the heating up to 30.2%.
6. Summary and Conclusions
The implementation of diagnostic scanners enabling the reading and recording of operating parameters of vehicle drive systems allowed for the analysis of energy consumption and its use by the tested cars.
Comparison of the energy consumed during the test in hybrid combustion-electric and electric vehicles allows the following conclusions to be drawn:
The weight of an electric car is greater than that of a hybrid car, which is mainly a consequence of the weight of the battery. This makes the energy demand in this car ~18% higher, especially in the highway part of the test: during acceleration, up to 30%, and while driving at a constant speed, up to ~17%.
The average value of the energy recovery coefficient k during the WLTP test was ~0.05, and temporarily, during intense braking, it even reached 0.22. In both tested vehicles, the values of this coefficient are similar due to the way it is determined from the vehicle’s motion resistance, which does not differ significantly in the case of both tested vehicles.
In a vehicle with a hybrid drive, the power of the electric machine determines the amount of energy recovered during the test. This car recovered 0.2 kJ of energy and instantaneous power of up to 2 kW. In the case of an electric car, the amount of energy recovered is higher and amounted to ~0.5 kJ, with an instantaneous power of 4 kW. The use of a higher-power generator-starter in the hybrid system would enable greater energy recovery.
Turning on additional devices in an electric car (lights, air conditioning, heating) resulted in an increase in energy consumption from a few (headlights) to up to ~30% (heating).


