1. Introduction
Internal combustion engines (ICEs) have been a predominant factor in the growth and interconnectivity of society [
1] ever since their introduction nearly 145 years ago [
2]. The integral nature of ICEs to our everyday life, with over 99% of all global transport being powered by ICEs [
3], means that they will continue to be choice for the movement of people and goods for the coming decades [
4]. While light duty ICEs may have some form of hybridization or electrification in the near future, heavy duty vehicles (mainly Class 7 and 8 trucks) will continue to be powered using ICEs. Heavy duty vehicles will see a continual increase in vehicle miles traveled according to the US Energy Information Administration’s Annual Energy Outlook [
5], with heavy duty trucks estimated to travel approximately 500 billion vehicle miles by 2050. An increase in the vehicle miles traveled inevitably leads to more emissions associated with combustion, mainly carbon dioxide (CO
2), oxides of nitrogen (NO
x), carbon monoxide (CO), and unburned hydrocarbons (UHC). Emissions which are harmful to the environment and to public health are heavily regulated globally. For example, the California Air Resources Board recently implementing amendments to Title 13 of the California Code of Regulations [
6], which state that the NO
x limits for heavy-duty diesel engines cannot exceed 0.05 g per brake horsepower/hour (g/bhp-h) for model years 2024–2026. The NO
x limit is further restricted to 0.02 g/bhp-h for any 2027 model year and newer vehicles. UHCs and CO emissions are also restricted to 0.14 and 15.5 g/bhp-h, respectively. To meet the needs of these stringent regulations, advanced combustion engine strategies will need to be researched and implemented. Strategies such as dual-fuel low-temperature combustion (DFLTC) and reactivity-controlled compression ignition (RCCI) are potential pathways to maintain compliance with emissions regulations.
The concept of using two fuels at the same time in an ICE is not a novel one, with studies from Boyer [
7] and Elliot et al. [
8] showcasing it as early as the 1950s. DFLTC and RCCI take advantage of using two fuels, a low-reactivity fuel (LRF) which has a high resistance to auto-ignition (low cetane number) and a high-reactivity fuel (HRF), which has a high cetane number to achieve low engine-out NO
x emissions by reducing local temperatures and low soot emissions by separating fuel mixture preparation and combustion. DFLTC is not the only approach to reducing local temperatures during combustion; for example, exhaust gas recirculation (EGR) is a well-recognized strategy for NO
x reduction in conventional diesel combustion. DFLTC and RCCI are not the only LTC concepts, with homogeneous charge compression ignition (HCCI) [
9,
10] and gasoline compression ignition [
11,
12] being two examples of other LTC concepts that have been considered due to their emissions benefits. An advantage that DFLTC and RCCI have over these other strategies is the ability to control combustion phasing through the inherent reactivity stratification levels achieved while requiring minimal modifications to existing compression ignition engines. Another benefit is the wide variety of LRF and HRF fuels that can be used together, including renewable fuels. Fuel combinations such as diesel/ammonia [
13,
14], diesel/natural gas (NG) [
15,
16,
17,
18,
19], diesel/propane [
20,
21], diesel/methanol [
22], diesel/gasoline [
22,
23], and primary reference fuels (n-heptane and isooctane) [
24,
25] have been studied previously. In addition to different HRF/LRF fuel combinations in DFLTC, other efficiency and emissions improvement strategies include the use of variable compression ratios and friction reduction approaches (cf. Ref. [
26]), variable valve actuation to achieve overexpanded operation, etc.; however, these strategies are beyond the scope of the present work.
The low NO
x and soot emissions with DFLTC are accompanied by higher CO and UHC as well as higher cycle-to-cycle variations in the combustion process [
27]. One strategy that could be implemented to address these challenges is to use multiple HRF injections instead of single HRF injection. Carlucci et al. [
28] used a biodiesel–syngas fuel combination and split the pilot injection into two separate injections on a 510.1 cc displacement engine. They concluded that a second injection that occurs 10 to 30 crank angle degrees (CAD) after the first injection, with the first injection occurring within 35 to 20 degrees before compression top dead center (dBTDC) can ensure the highest fuel conversion efficiencies for the biodiesel–syngas dual-fuel combustion. Yadav et al. [
29] used diesel and butanol on a three-cylinder 1.5 L turbocharged engine at an engine speed of 1800 RPM. It was found that by introducing a post-injection, the brake thermal efficiency increased as compared to a single injection case at the same load, and the smoke measurements were also lower. A post-injection quantity of 1.5 mg/cycle, with the injection occurring 9.7 CAD after the main injection, was found to be optimal. Bartolucci et al. [
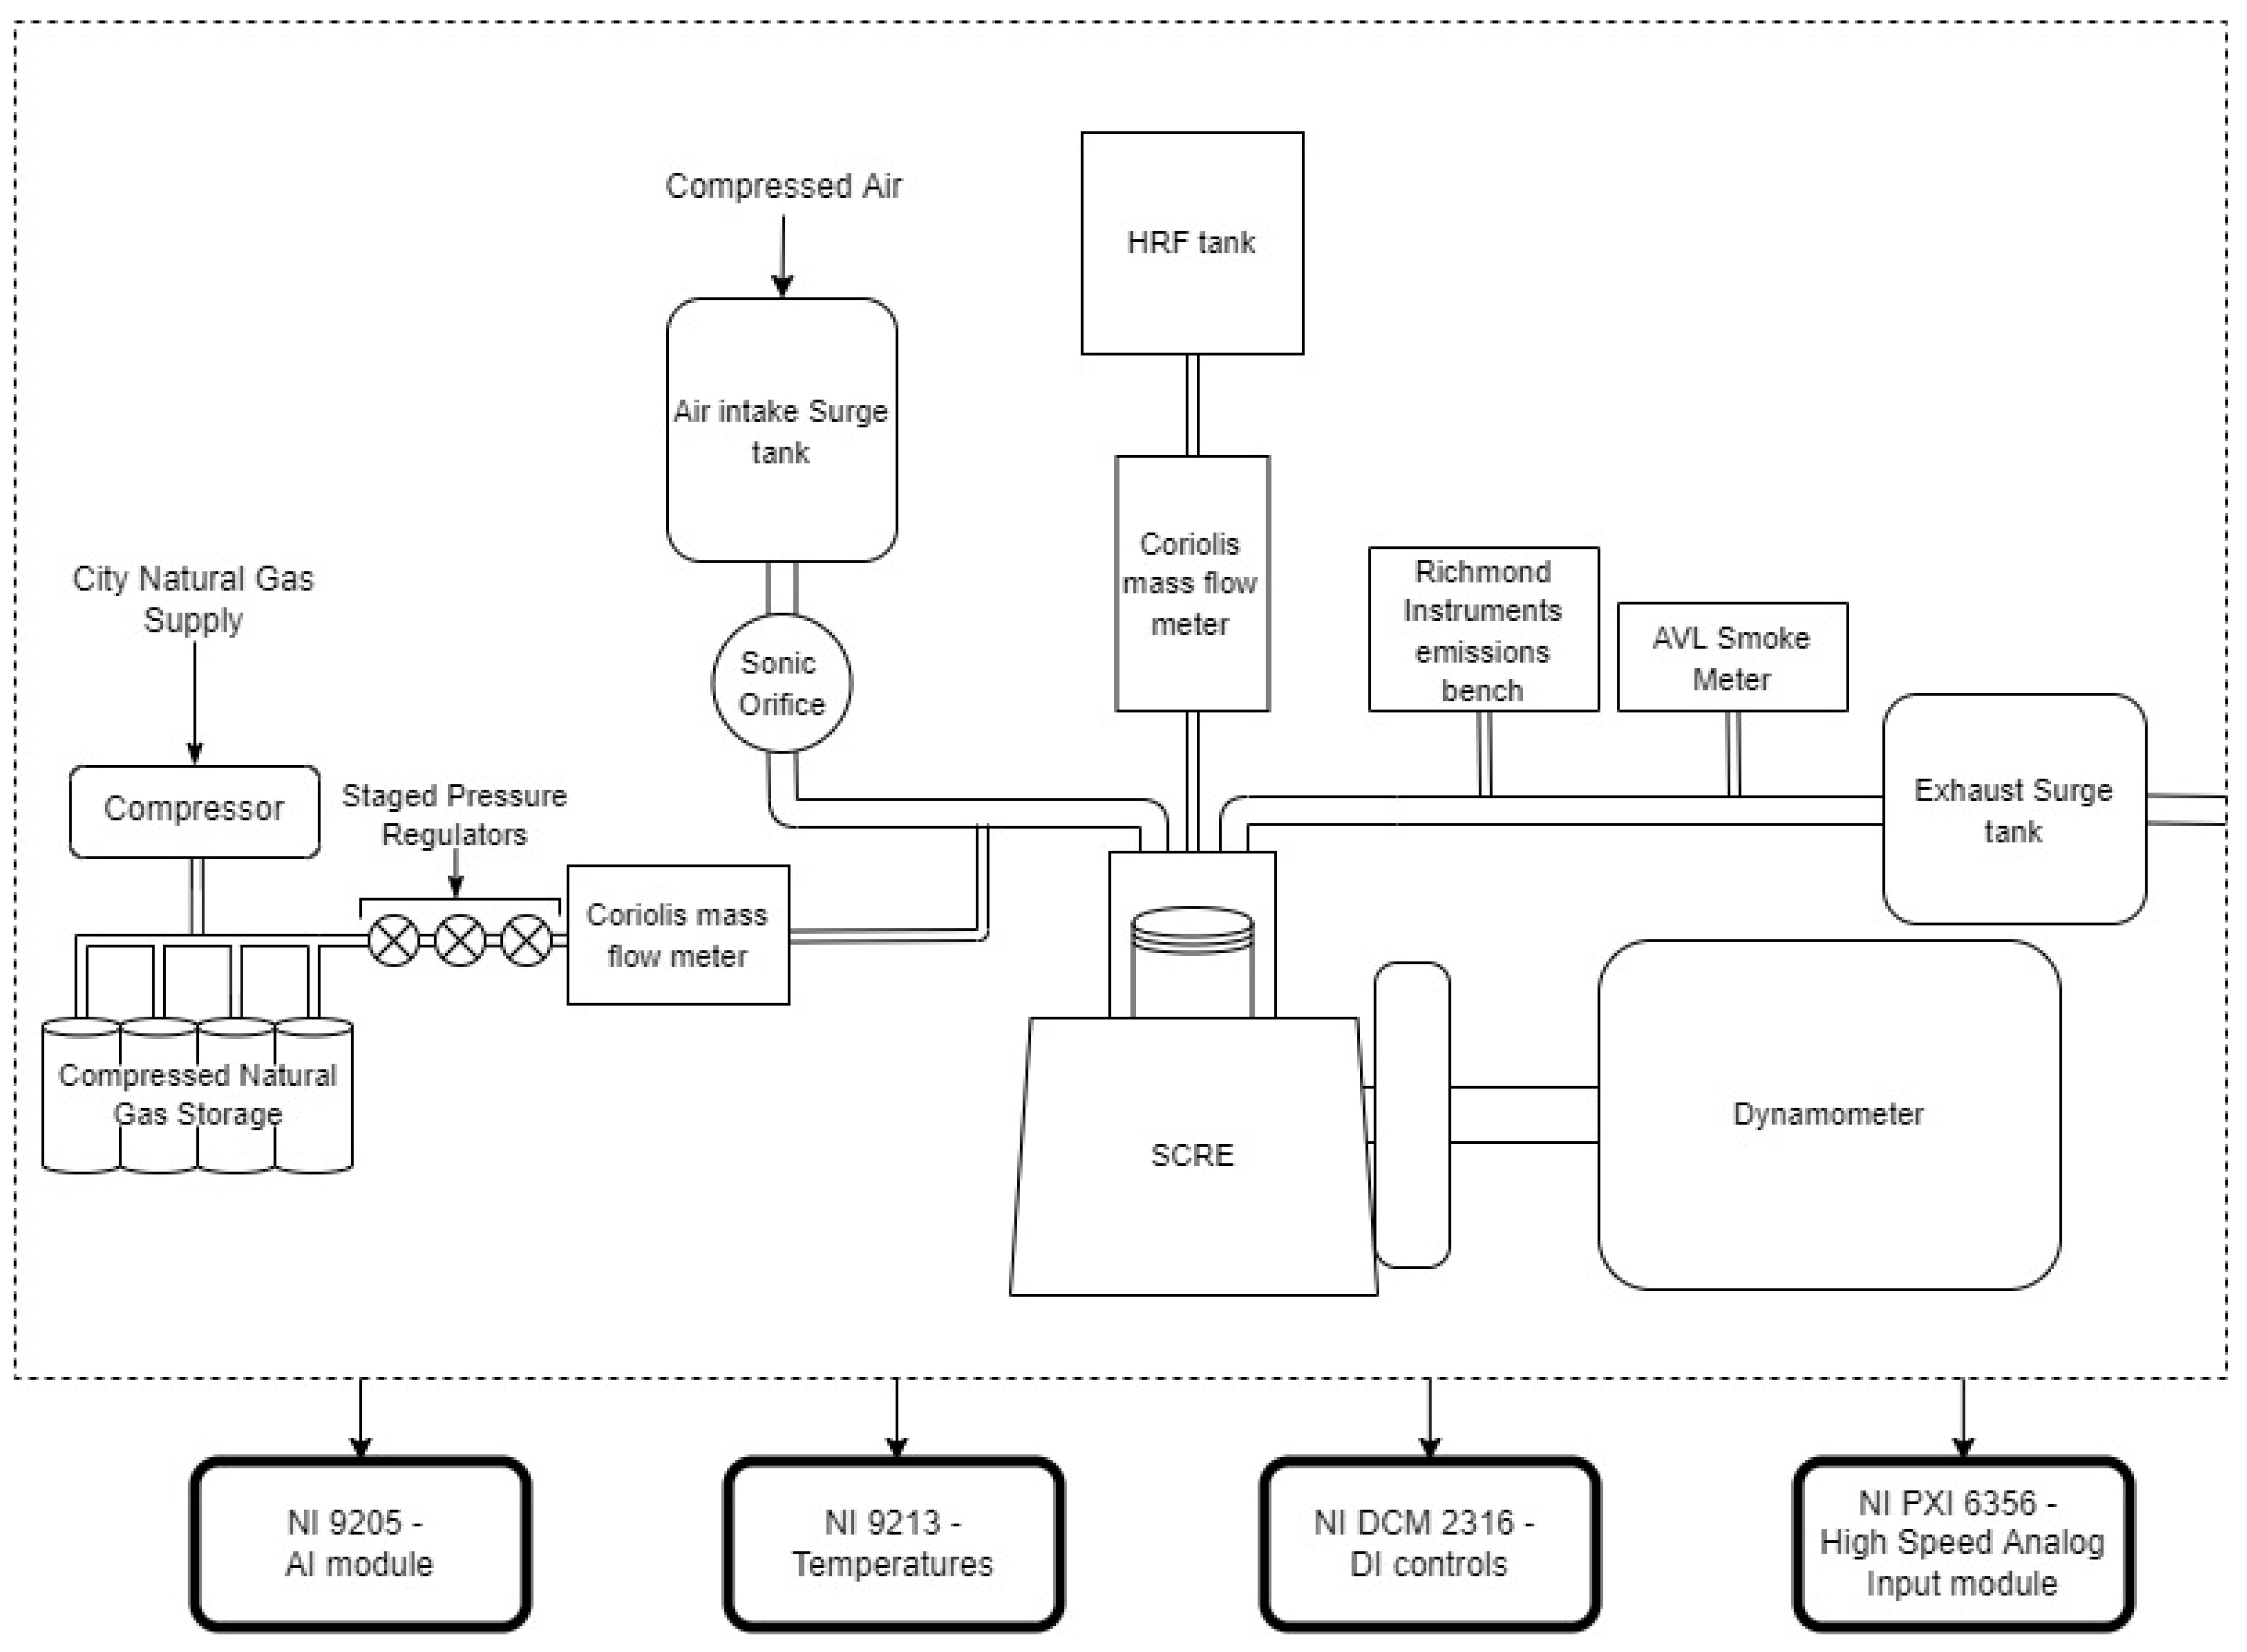
30] numerically investigated the benefits of using a split-injection strategy with diesel and NG at 5 bar brake mean effective pressure on a 1.8 L single-cylinder research engine (SCRE) operating at 1500 RPM. After validating an early injection timing of 310 CAD with experimental results, the effects of using multiple injections and different rail pressures were studied. The second injection was added 65 degrees after the first injection (i.e., after TDC). Introducing the second injection without increasing the rail pressure showed a higher amount of CO and UHC than for the single-injection case alone, and this was corroborated by experimental results. However, increasing the rail pressure from 500 bar to 1200 bar significantly decreased the CO and HC, while also maintaining a NO
x value less than 1 g per kilowatt hour (g/kWh), because of a greater number of observed ignition locations which resulted in faster methane reaction rates. Hariharan et al. [
31] specifically targeted the reduction in UHC and CO emissions on a 1.8 L SCRE operating at 1500 RPM in the dual-fuel mode using a split-injection strategy. Parameters such as the second injection duration, the percent energy substitution (
PES), and the rail pressure were studied. Close-coupled injections (injection events spaced within 15 CAD of one another) showed advanced combustion phasing, as well as increased combustion efficiency. However, the NO
x emissions with close-coupled injections were six times as high as the baseline diesel–methane dual-fuel point. It was also shown that rail pressure had a significant impact on the efficiency emissions tradeoffs, and the indicated fuel conversion efficiency (
IFCE) increased with rail pressure, with a maximum value of ~50% being observed.
Split injection may be a possible solution to DFLTC’s cyclic combustion variations problem at low loads; however, there is still the issue of possible soot formation, or particulate matter (PM), with near-TDC second injection of diesel. The use of oxymethylene ether (OME) fuel blends has garnered increasing research interest to mitigate PM emissions [
32,
33,
34,
35,
36,
37,
38]. Being oxygenated fuels with fewer (or no) carbon–carbon bonds, OMEs can help reduce PM emissions [
35]. García et al. [
36] numerically showed the benefits of using OME with dual-fuel combustion, with gasoline as the LRF, on a series hybrid setup using a 0-D vehicle model. The well-to-wheel CO
2 analysis showed that the use of an optimized series hybrid architecture along with OME–gasoline dual-fuel combustion improves upon current commercial trucks by 25%. Garcia et al. [
37] demonstrated the use of OME fuels in a four-cylinder 1.6 L engine. The engine was fueled with three different fuel blends, each with a different amount of OME fuel and Fischer–Tropsch diesel on a volume basis; three different speed/load points were considered for the study. It was found that the fuel blends with higher OME amounts reduced PM by at least 5 mg/kWh, as compared to diesel when using baseline engine calibrations. The fuel consumption for these higher OME fuel blends increased, however, due to the reduced lower heating value (
LHV) of the blend accompanying higher percentages of OME fuels in the blends. NO
x emissions could not be directly correlated with the decreased soot, because they could either be lower or higher than the baseline diesel reference depending on the engine load. However, NO
x could be reduced with respect to the diesel baseline (at the expense of PM, UHC, and CO emissions) if the engine calibration were optimized. Overall, the well-to-wheel brake-specific CO
2 was reduced for the fuel blend that was entirely composed of OME and Fischer–Tropsch diesel. Tong et al. [
38] successfully demonstrated the use of polyoxymethylene dimethyl ether (POMDME), a type of OME fuel, as the HRF in a dual-fuel RCCI configuration with gasoline as the LRF. The experiments were conducted on a modified six-cylinder heavy-duty diesel engine, where one of the six cylinders was isolated from the rest for the purposes of testing. Low PM values were obtained for the POMDME–gasoline combustion regardless of the POMDME injection timing and the POMDME-to-gasoline fuel proportion. A slight penalty in NO
x emissions was observed compared to diesel–gasoline operation. Stoichiometric equivalence ratios were also deemed to be achievable with the POMDME dual-fuel method, meaning the use of three-way catalysts could be explored in the future.
The primary goals of the present work are to improve efficiency and combustion stability and to reduce UHC, CO, and NO
x emissions in DFLTC of NG by utilizing POMDME and diesel as HRFs. In this work, it must be noted that NG provides most of the fuel energy input (baseline ~80%) with the remainder provided by either POMDME or diesel. In other words, the DFLTC concept presented here utilizes two fuels simultaneously (POMDME–NG or diesel–NG), and therefore is fundamentally different from bi-fuel combustion that involves combustion of one of two fuels at a given time (e.g., gasoline or E85 ethanol in flex-fuel vehicles). The present work leverages the Spray-TArgeted Reactivity Stratification (STARS) concept introduced by Narayanan et al. [
39] for DFLTC along with other control parameters. The STARS concept utilizes a split-injection strategy to minimize the cycle-to-cycle variations that are inherent in dual-fuel combustion by allowing for a more distributed ignition within the cylinder (due to higher stratification levels) which lead to faster burn rates, higher combustion efficiencies, and lower UHC and CO emissions. The present study builds upon previous research by Hariharan et al. [
40], which studied pathways for reducing UHC and CO emissions using both diesel–natural gas as well as POMDME–natural gas DFLTC. Their study demonstrated that by strategically varying six control parameters, UHC and CO reductions of ~85% and ~92%, respectively, can be achieved.
3. Results and Discussion
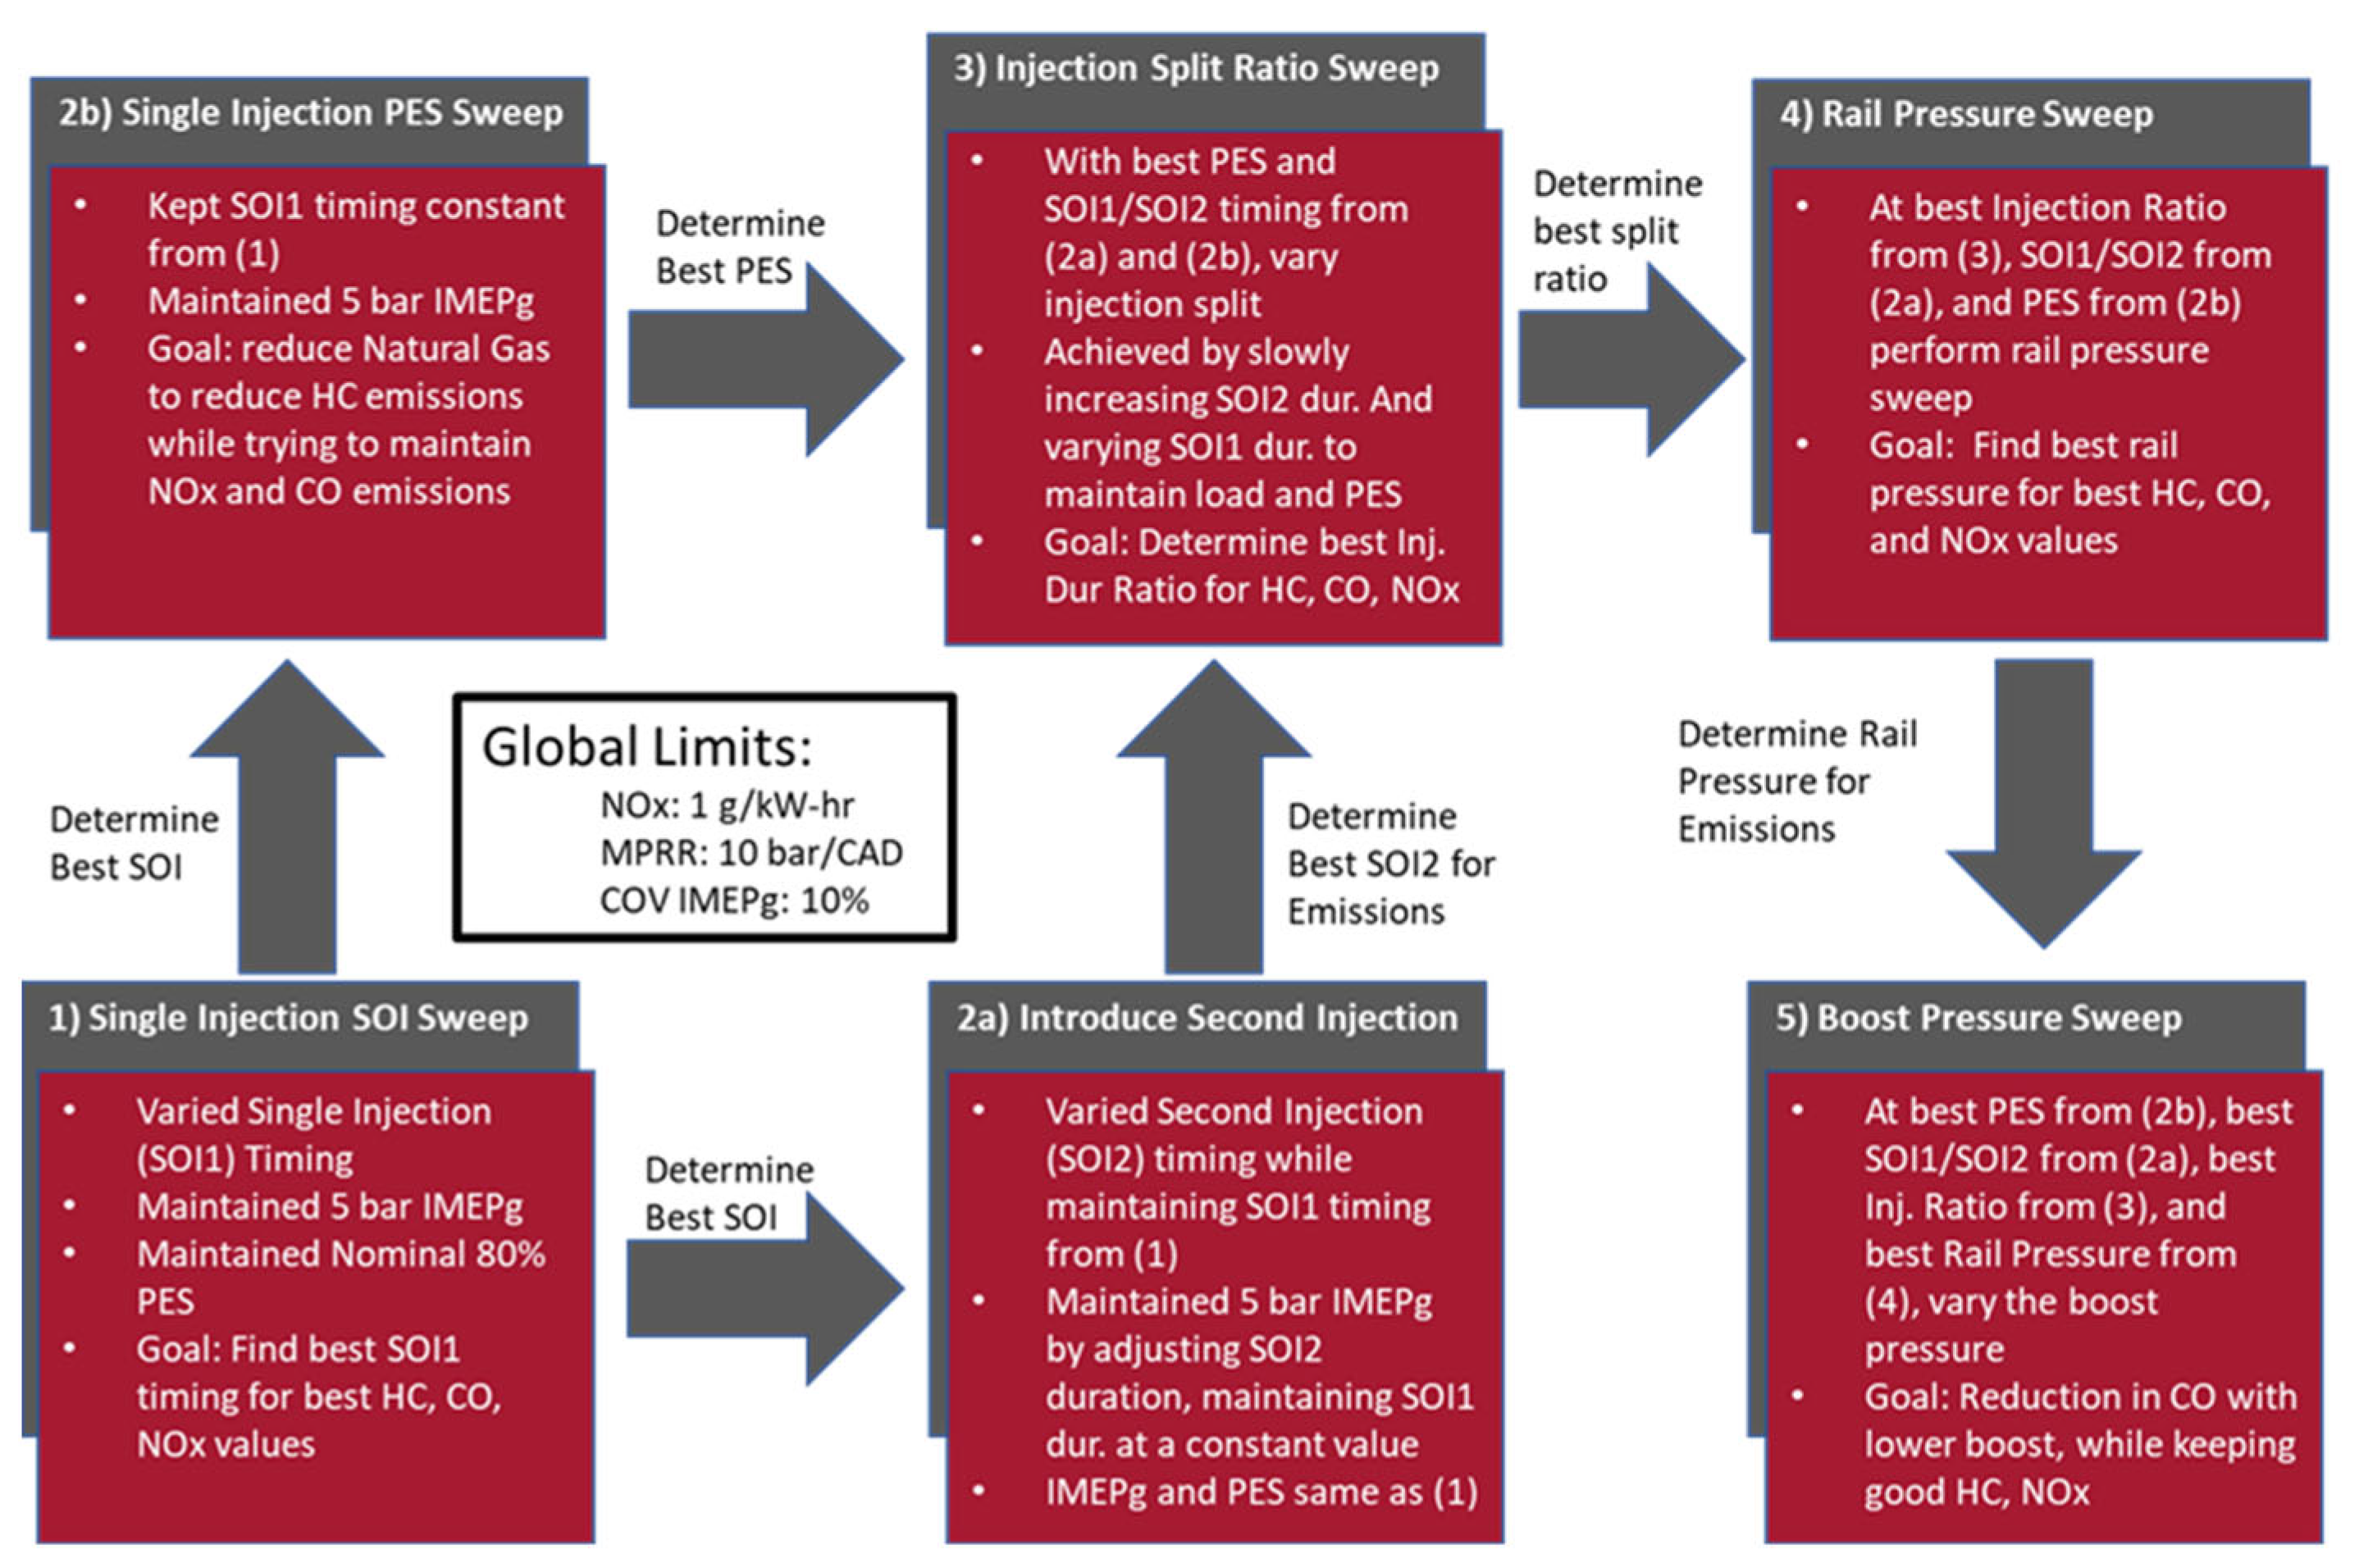
The experimental results are presented sequentially for each step of the experimental procedure described in
Figure 2. For each step, both diesel–NG and POMDME–NG operation are discussed.
3.1. Step 1: SOI1 Sweep
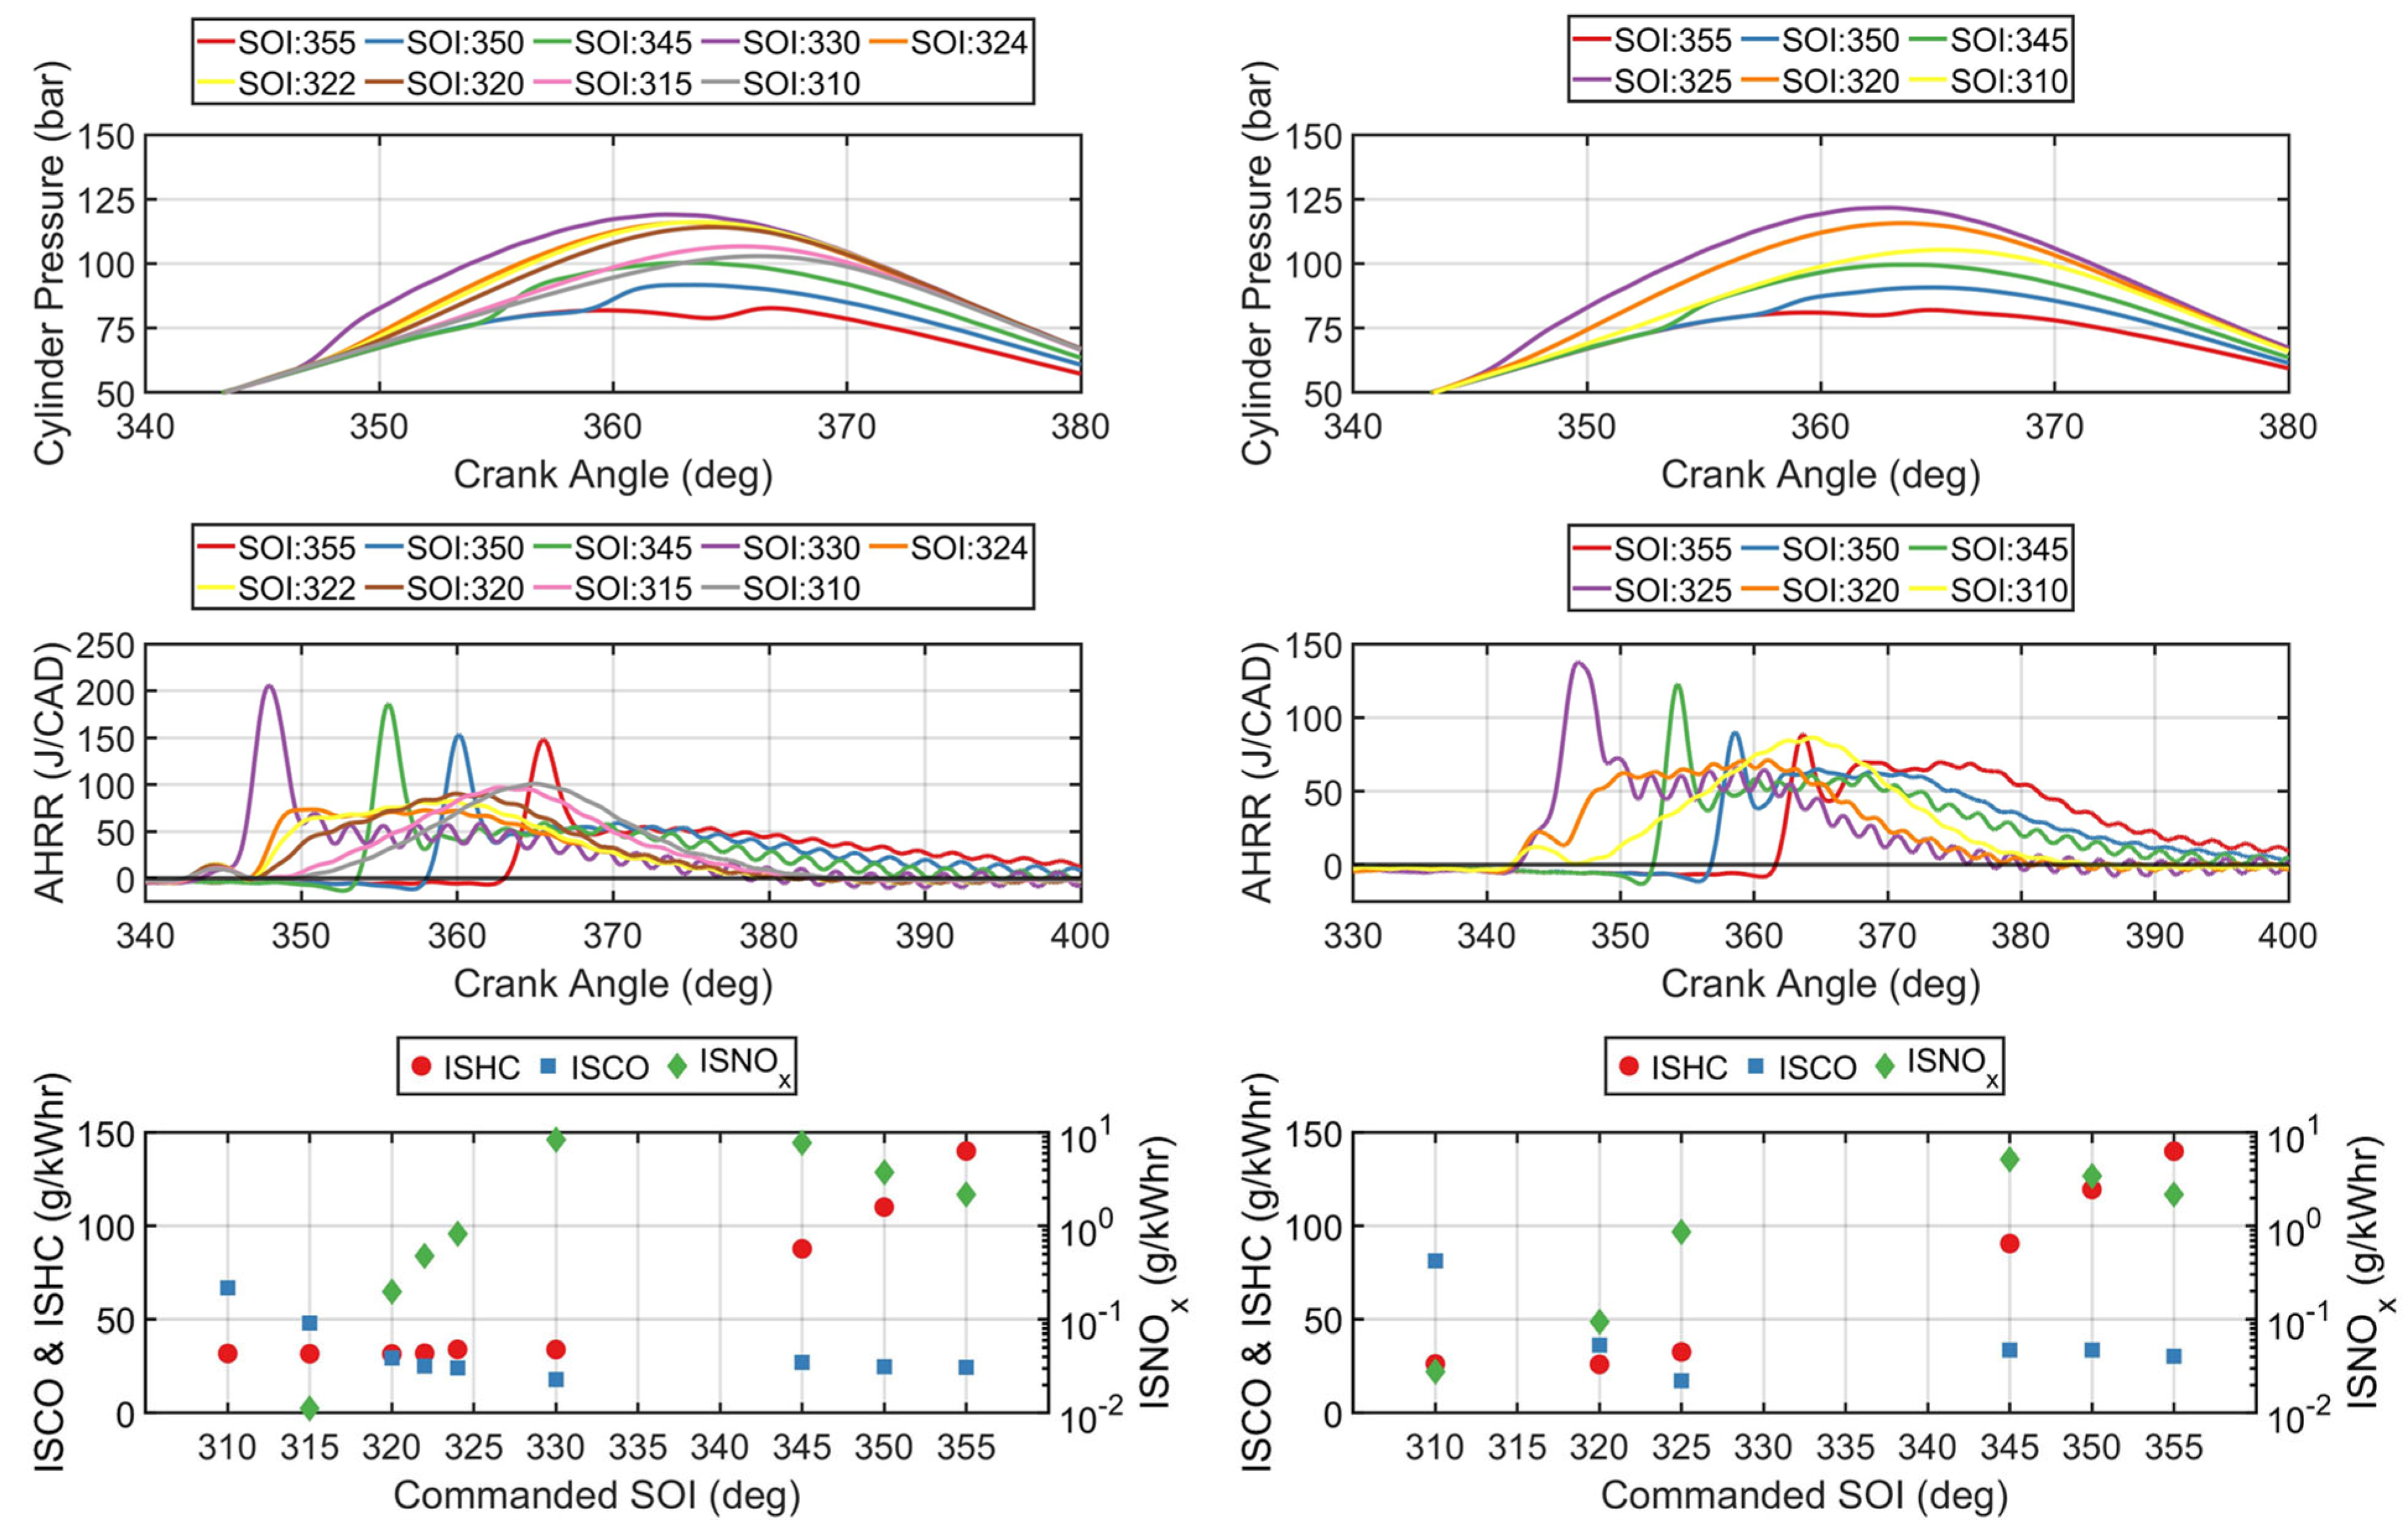
A wide SOI1 range from 310 CAD to 355 CAD was considered for both fuel combinations. Injection timings earlier than 310 CAD resulted in
COVIMEP values greater than the 10% NTE limit.
Figure 3 shows the cylinder pressure curves, AHRR profiles, and emissions for both diesel–NG and POMDME–NG operation. As the SOI1 was advanced from 355 to 330 CAD for diesel–NG, the location of peak AHRR advanced and ISNO
x increased, while ISHC decreased. The same phenomenon occurred with POMDME–NG. In addition, for both fuels, the peak cylinder pressure increased until the MPRR limit was reached, at which point the SOI1 had to be significantly advanced to reduce MPRR and to avoid the MPRR-limited region. Further advancement of SOI1 resulted in lower peak cylinder pressures and also retarded the location of peak AHRR. Correspondingly, the ISNO
x decreased dramatically as the SOI1 was advanced toward 310 CAD (note the logarithmic NO
x scale). This phenomenon has been seen previously in various studies [
44,
45,
46]. There was also a change in the shape of the AHRR profile from a two-stage AHRR shape to a single-stage “Gaussian” AHRR shape as SOI1 was advanced toward 310 CAD. This AHRR shape transformation has been observed in several previous studies and the underlying reasons have been discussed in a recent paper by the present authors [
47]. The lower ISNO
x at earlier SOI1s was likely due to the increased time available for fuel–air mixing, resulting in fewer regions in the combustion chamber for which the equivalence ratio (φ) is near-stoichiometric, leading to lower local temperatures. The avoidance of high local temperatures is key to NO
x reduction, since the main mechanism for NO
x formation (the Zel’dovich thermal mechanism) under these conditions requires temperatures > 1900 K [
48].
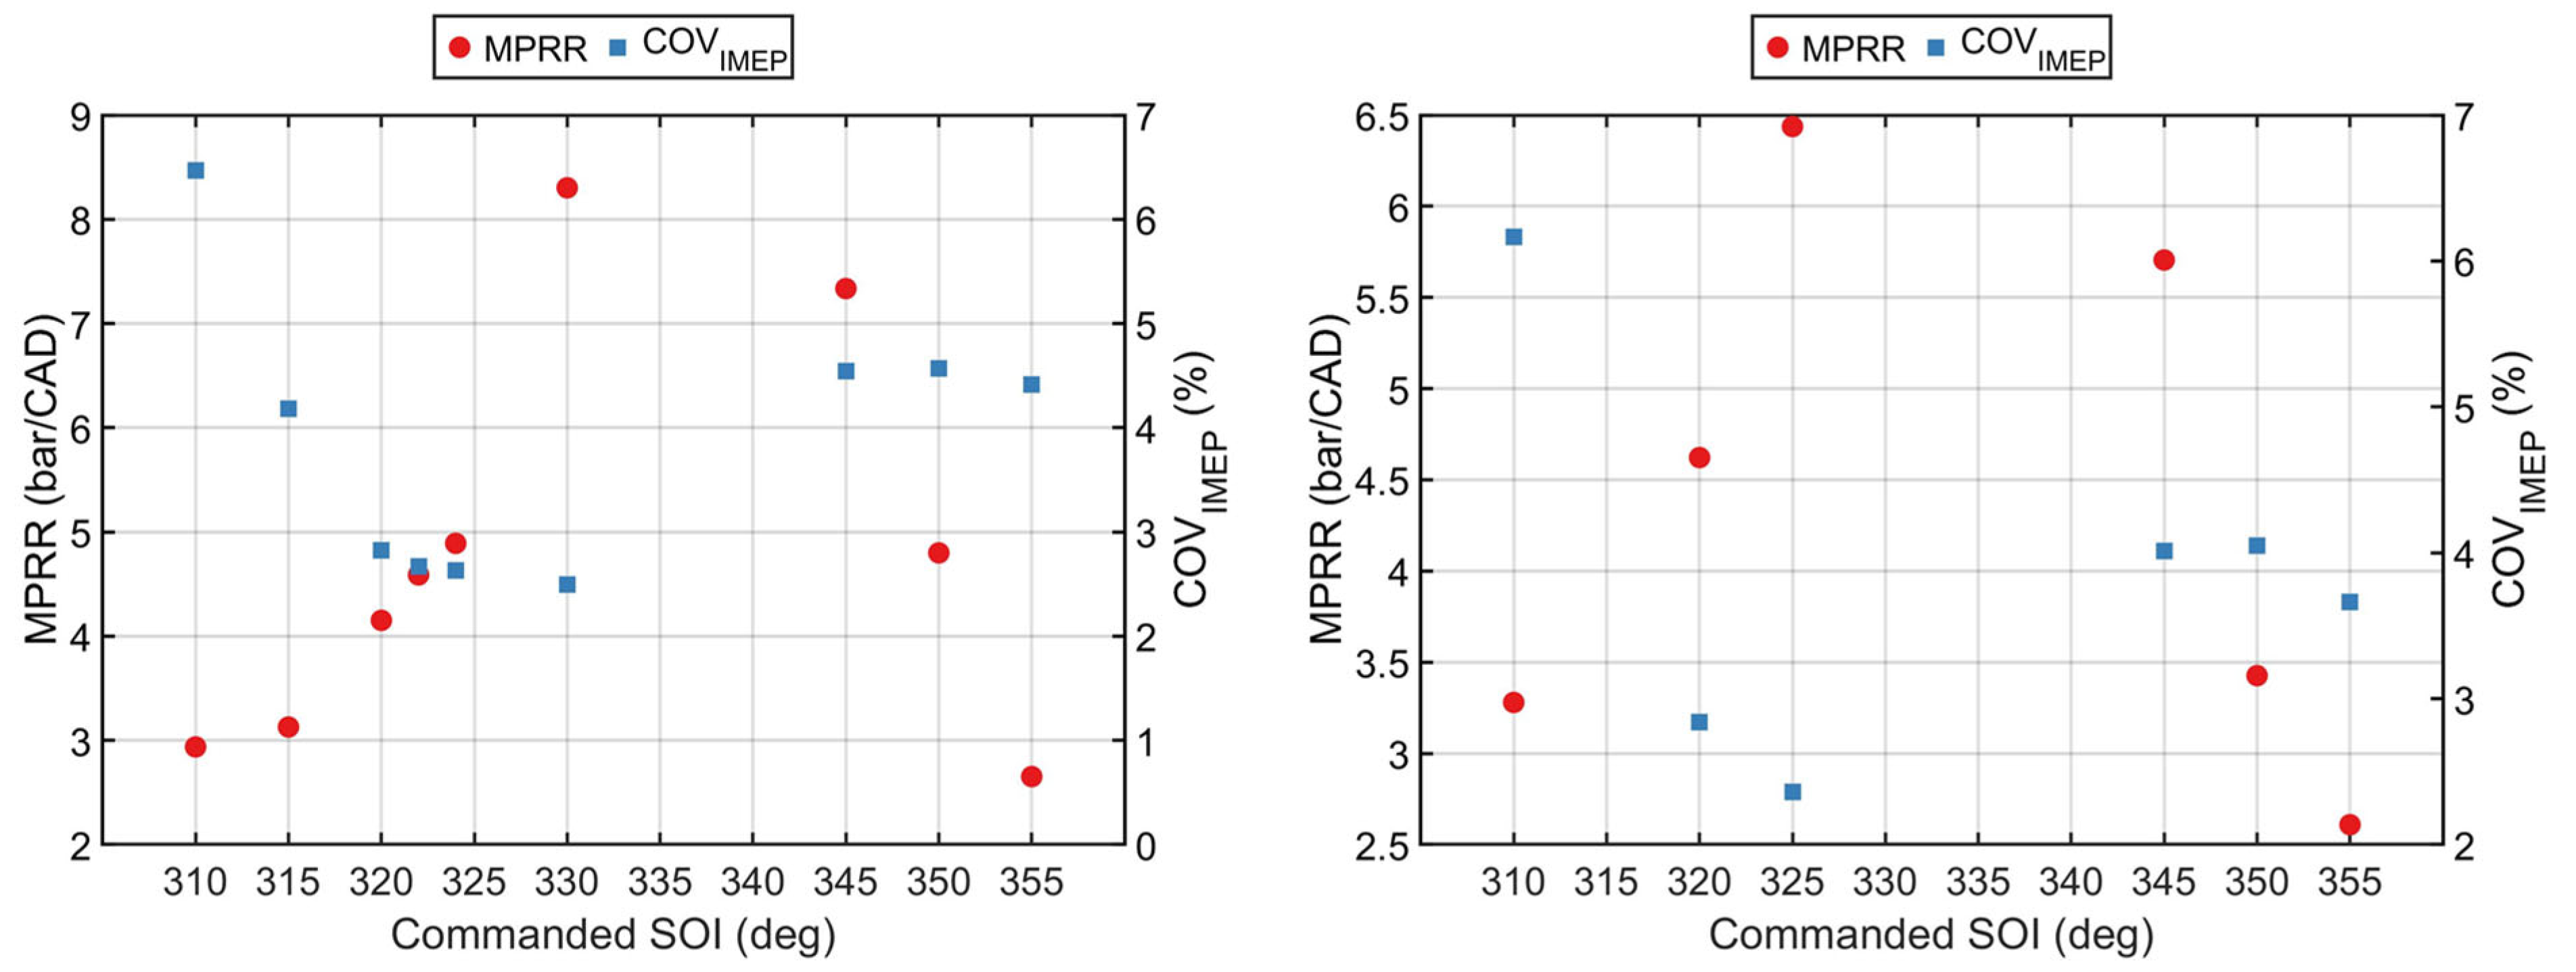
The SOI1 advancement from 325 to 310 CAD increased ISCO emissions, but the ISHC emissions stayed nearly invariant. To explain this, the
COVIMEP is presented in
Figure 4, along with MPRR for both fuel combinations. At the very advanced SOI1s, the
COVIMEP for diesel–NG was 6.5%, and for POMDME–NG it was 6.2%. This indicates that the combustion is quite unstable at these conditions due to high cycle-to-cycle variability. This variability also likely led to partial fuel oxidization to CO, but not complete oxidation to CO
2. Additionally, the higher CO emissions were also accompanied by shorter residence times of high in-cylinder bulk gas temperatures. For these operating conditions, most of the ISHC likely arises from the crevices, late burning, and some from bulk quenching for partially firing cycles. For very late SOI1s, the ISHC emissions were very high due to delayed combustion phasing and late burning; however, they decreased with SOI1 advancement to ~325 CAD. Further advancement of the SOI1 timing beyond 325 CAD may not lead to more distributed ignition of the unburned NG, meaning the amount of unburned NG remains invariant on a global basis.
The SOI1s of 310 CAD and 320 CAD were chosen for the subsequent steps for diesel–NG and POMDME–NG operation, respectively. The 310 CAD SOI1 for diesel–NG was chosen due to virtually zero ISNO
x emissions (unmeasurable by our emissions bench, and hence not represented on the log scale for ISNO
x in
Figure 3). When performing the POMDME–NG experiments, 320 CAD SOI1 was chosen due to its higher
IFCE and comparable ISNO
x compared to 310 SOI1 (39.8% vs. 38.2%), which offered a better starting point for performing the remainder of the experiments.
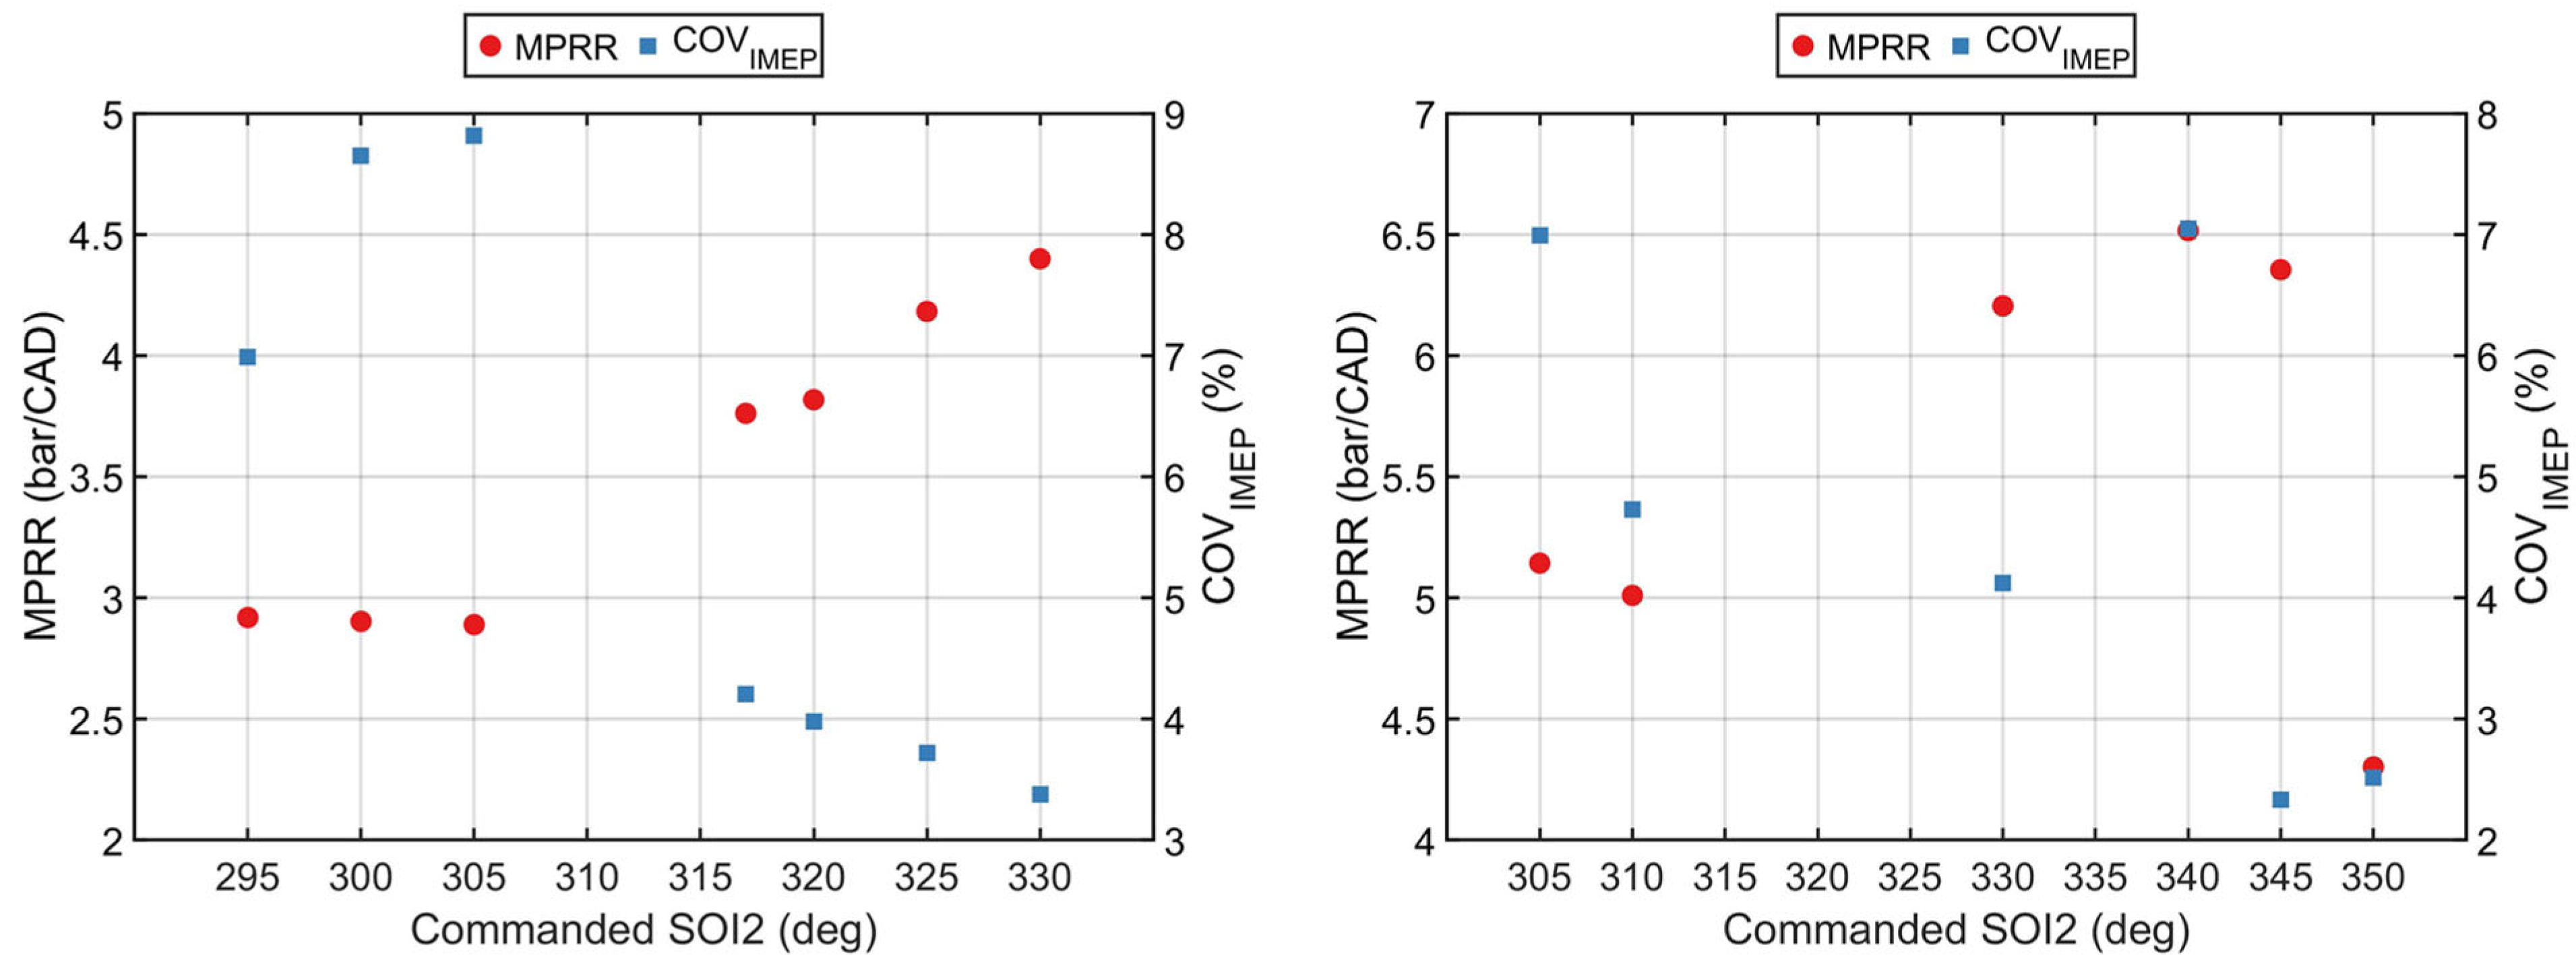
3.2. Step 2a: Split Injection (STARS) Sweep
The goal of STARS is to improve combustion stability (lower
COVIMEP) using multiple injections. The authors also expected a concomitant improvement in ISCO emissions and possibly also ISHC emissions with STARS.
Figure 5 shows
COVIMEP along with the MPRR for both fuel combinations at each SOI2 value.
For diesel–NG DFLTC, which had a
COVIMEP of 6.5% for the baseline single-injection case, introducing a second injection (SOI2) after the 310 CAD SOI1 from step 1 reduced the
COVIMEP, whereas SOI2s earlier than 310 CAD increased the
COVIMEP. The
COVIMEP results for POMDME–NG combustion were less conclusive, i.e., injections that occurred before or after the fixed 320 CAD SOI1 from step 1 produced both higher and lower
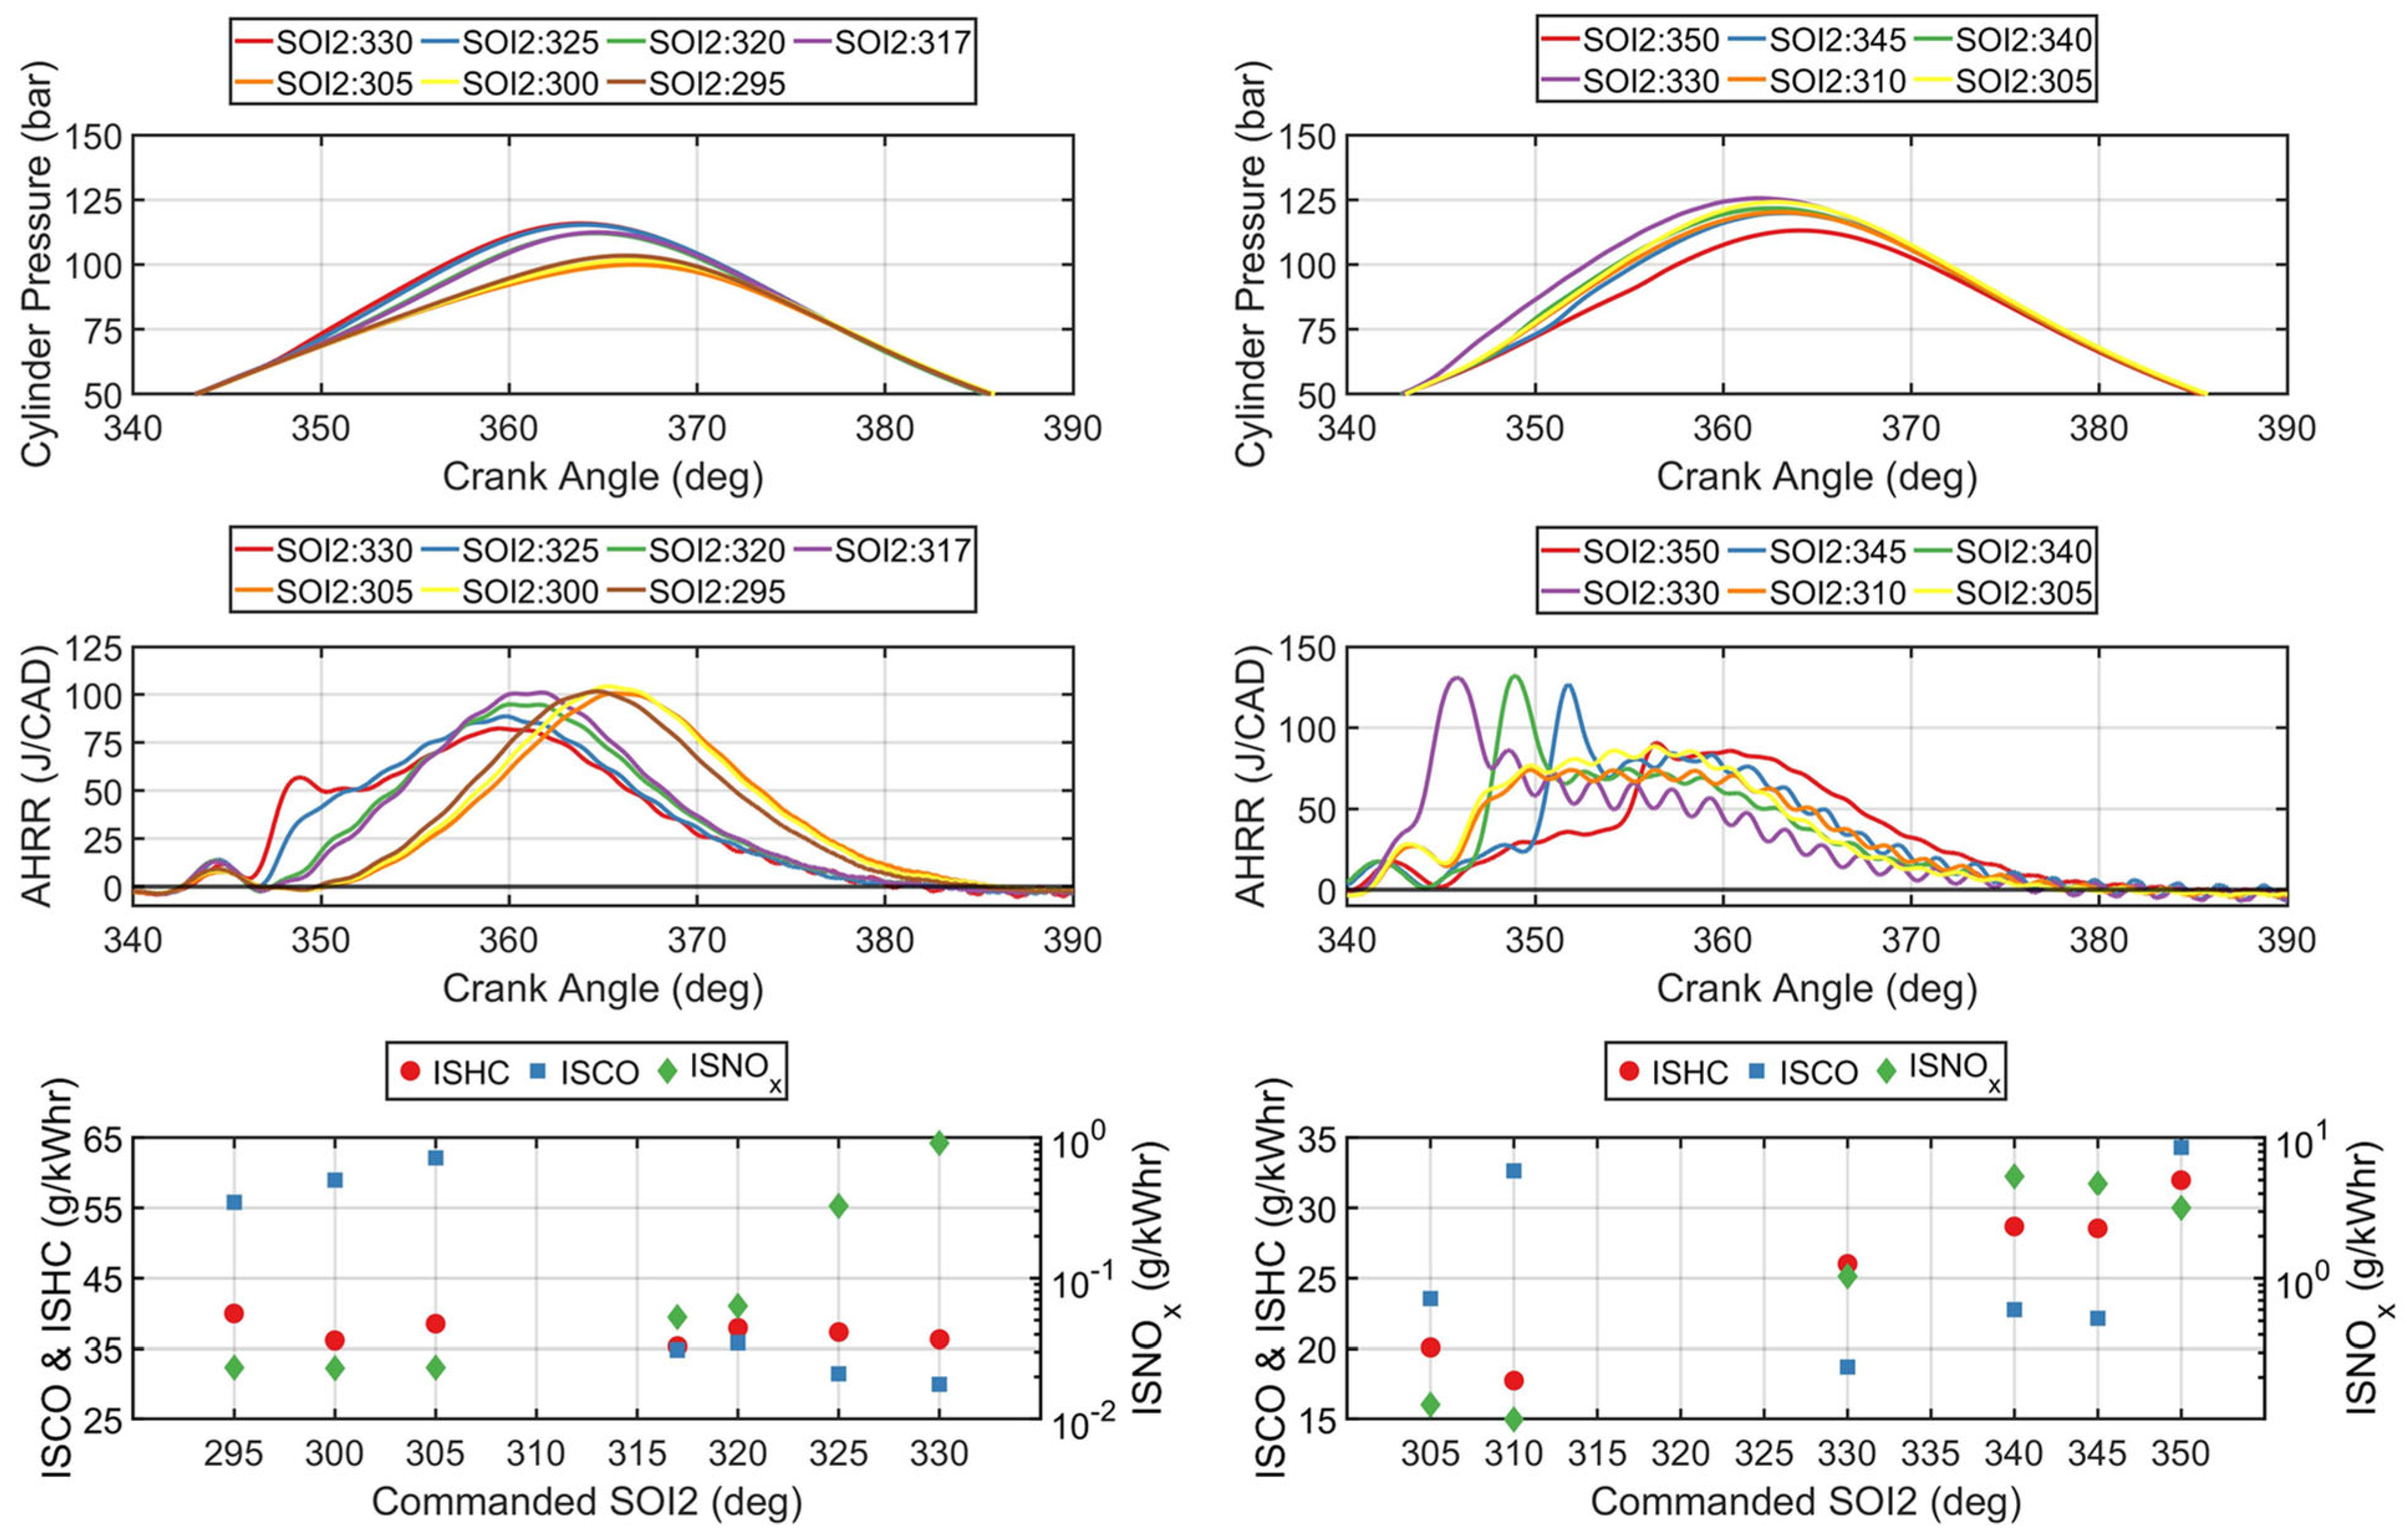
COVIMEP values compared to the 6.2% value. To determine the impact of SOI2 on combustion, the cylinder pressure, AHRR, and emissions results for each SOI2 are presented in
Figure 6.
Injections occurring after the fixed 310 CAD SOI1 had lower ISCO values than those that occur before the 310 CAD SOI1 for diesel–NG combustion. However, the ISCO values for all SOI2s considered in the diesel–NG sweep were lower than the ISCO value (66.7 g/kWh) for the single-injection baseline from step 1. A similar trend was observed for POMDME–NG, where the ISCO values for all SOI2s were less than the ISCO value for the single injection of 320 CAD considered from step 1. The ISNOx trends are also similar to the SOI1 trends seen in step 1, which is likely due to the increased mixing times available for early SOIs, thereby allowing for lower local equivalence ratios, and therefore, lower local temperatures and lower ISNOx emissions.
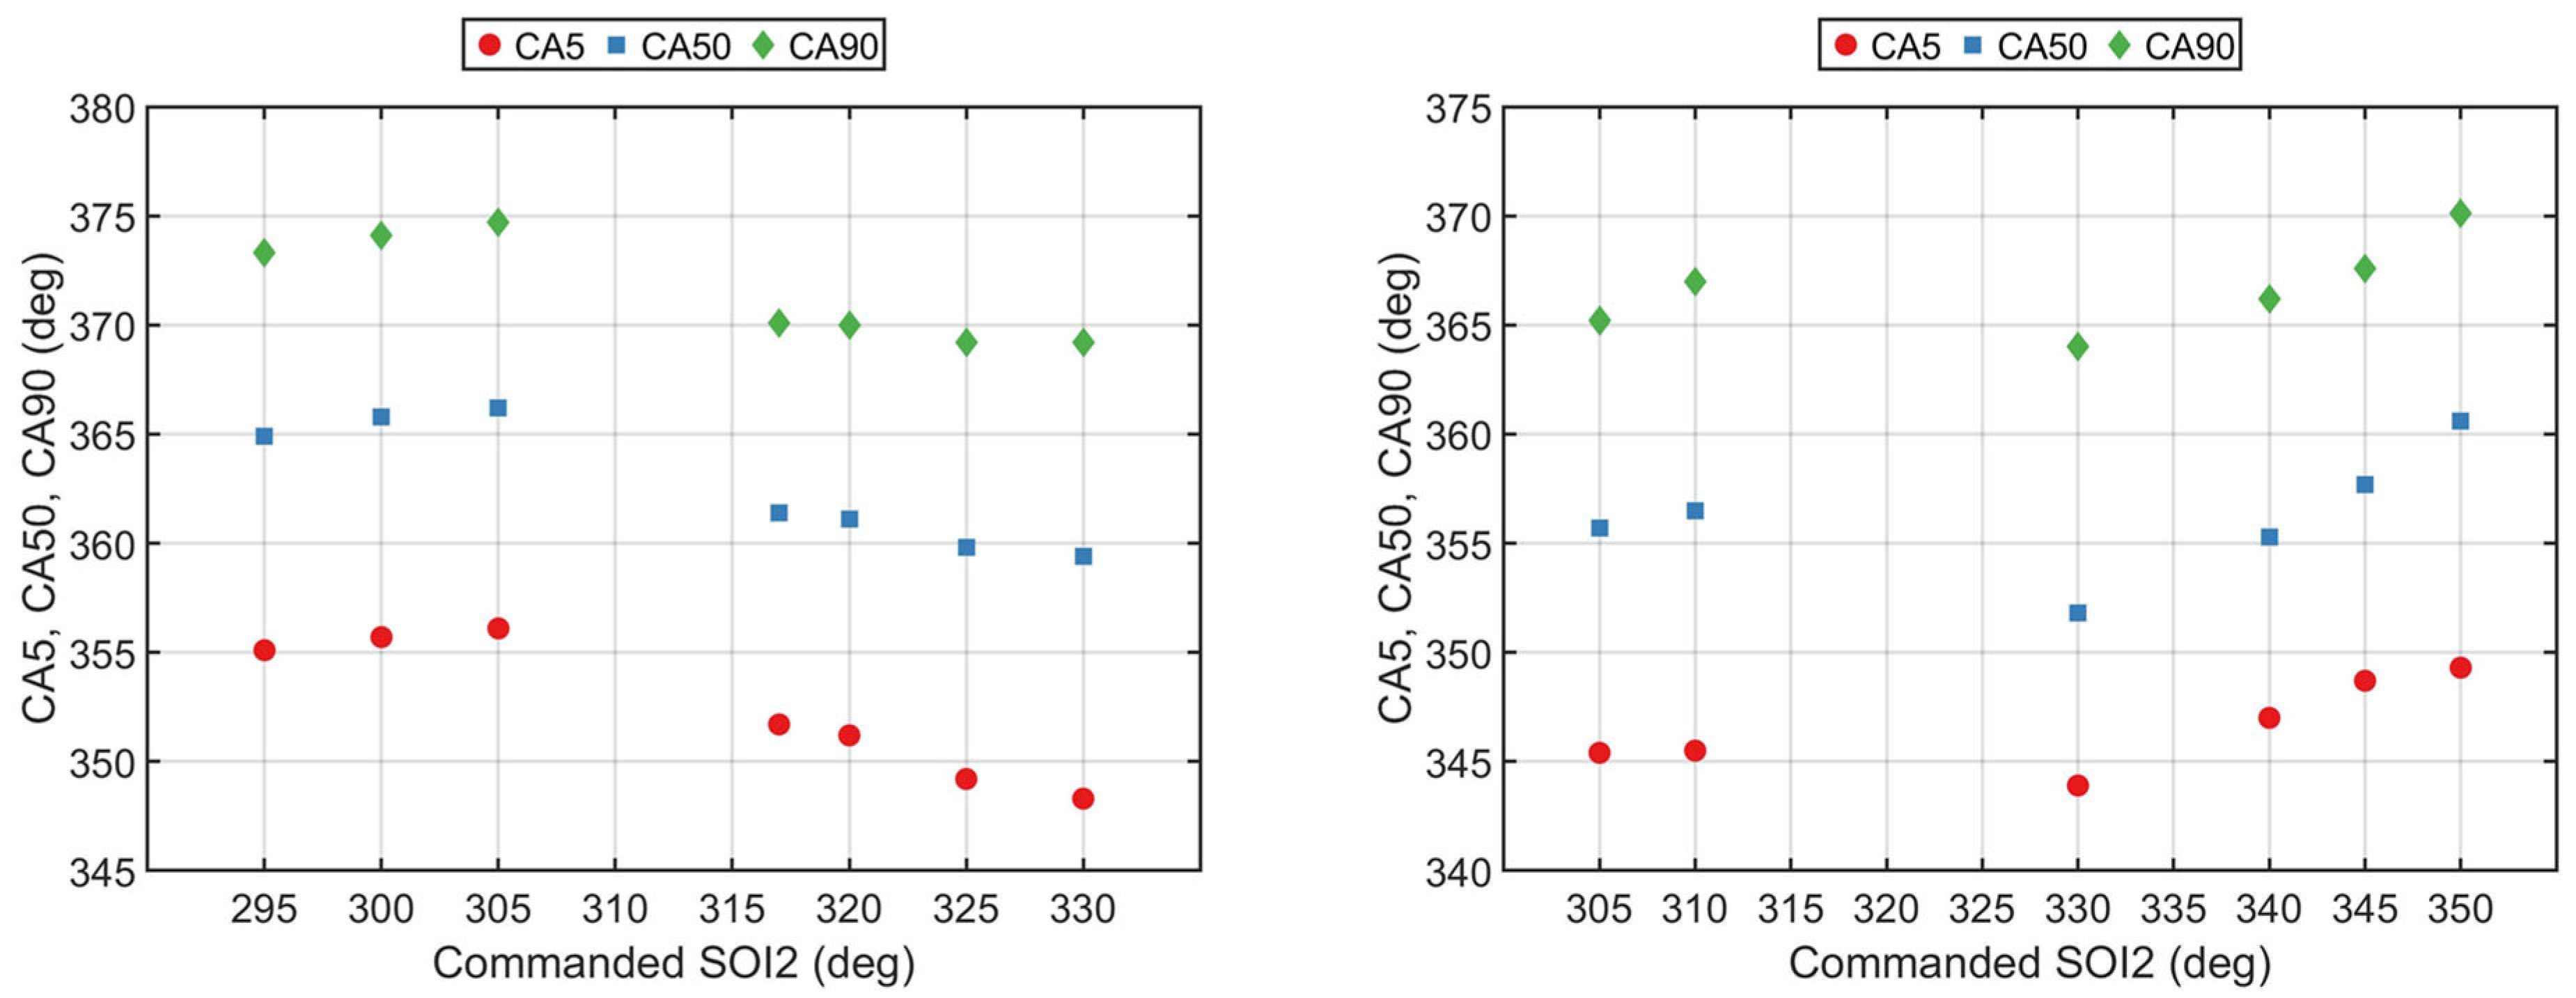
The AHRR curves for diesel–NG show that changing SOI2 has an impact on the location of the peak AHRR, with SOI2s of 295, 300, and 305 CAD (all of which occurred before the fixed 310 CAD SOI1 from step 1) having the most retarded locations of peak AHRR with respect to TDC of 364.6, 365.2, and 365.5 CAD, respectively. Once the SOI2 occurs after the fixed 310 SOI1, the peak AHRR location shifts to near TDC for SOI2s of 317, 320, 325, and 330 CAD. A similar AHRR behavior occurs with POMDME–NG, with the exception that the peak AHRR location starts to retard closer to TDC as the SOI2 location is retarded closer to TDC. To observe these trends better, the CA5, CA50, and CA90 locations for each SOI2 are plotted for both fuel combinations in
Figure 7.
The CA5, CA50, and CA90 occurred earlier in the cycle as soon as SOI2 occurs after SOI1 for diesel–NG; for POMDME–NG, there was a similar trend for SOI2 = 330 CAD. However, when the SOI2 was further retarded, the CA5, CA50, and CA90 values occurred later in the cycle. This can be attributed to the time allowed for fuel–air mixing, as SOI2 timings that occur before SOI1 will inevitably have more time for mixing than for later SOI2s, which leads to more homogenization of the fuel–air mixture.
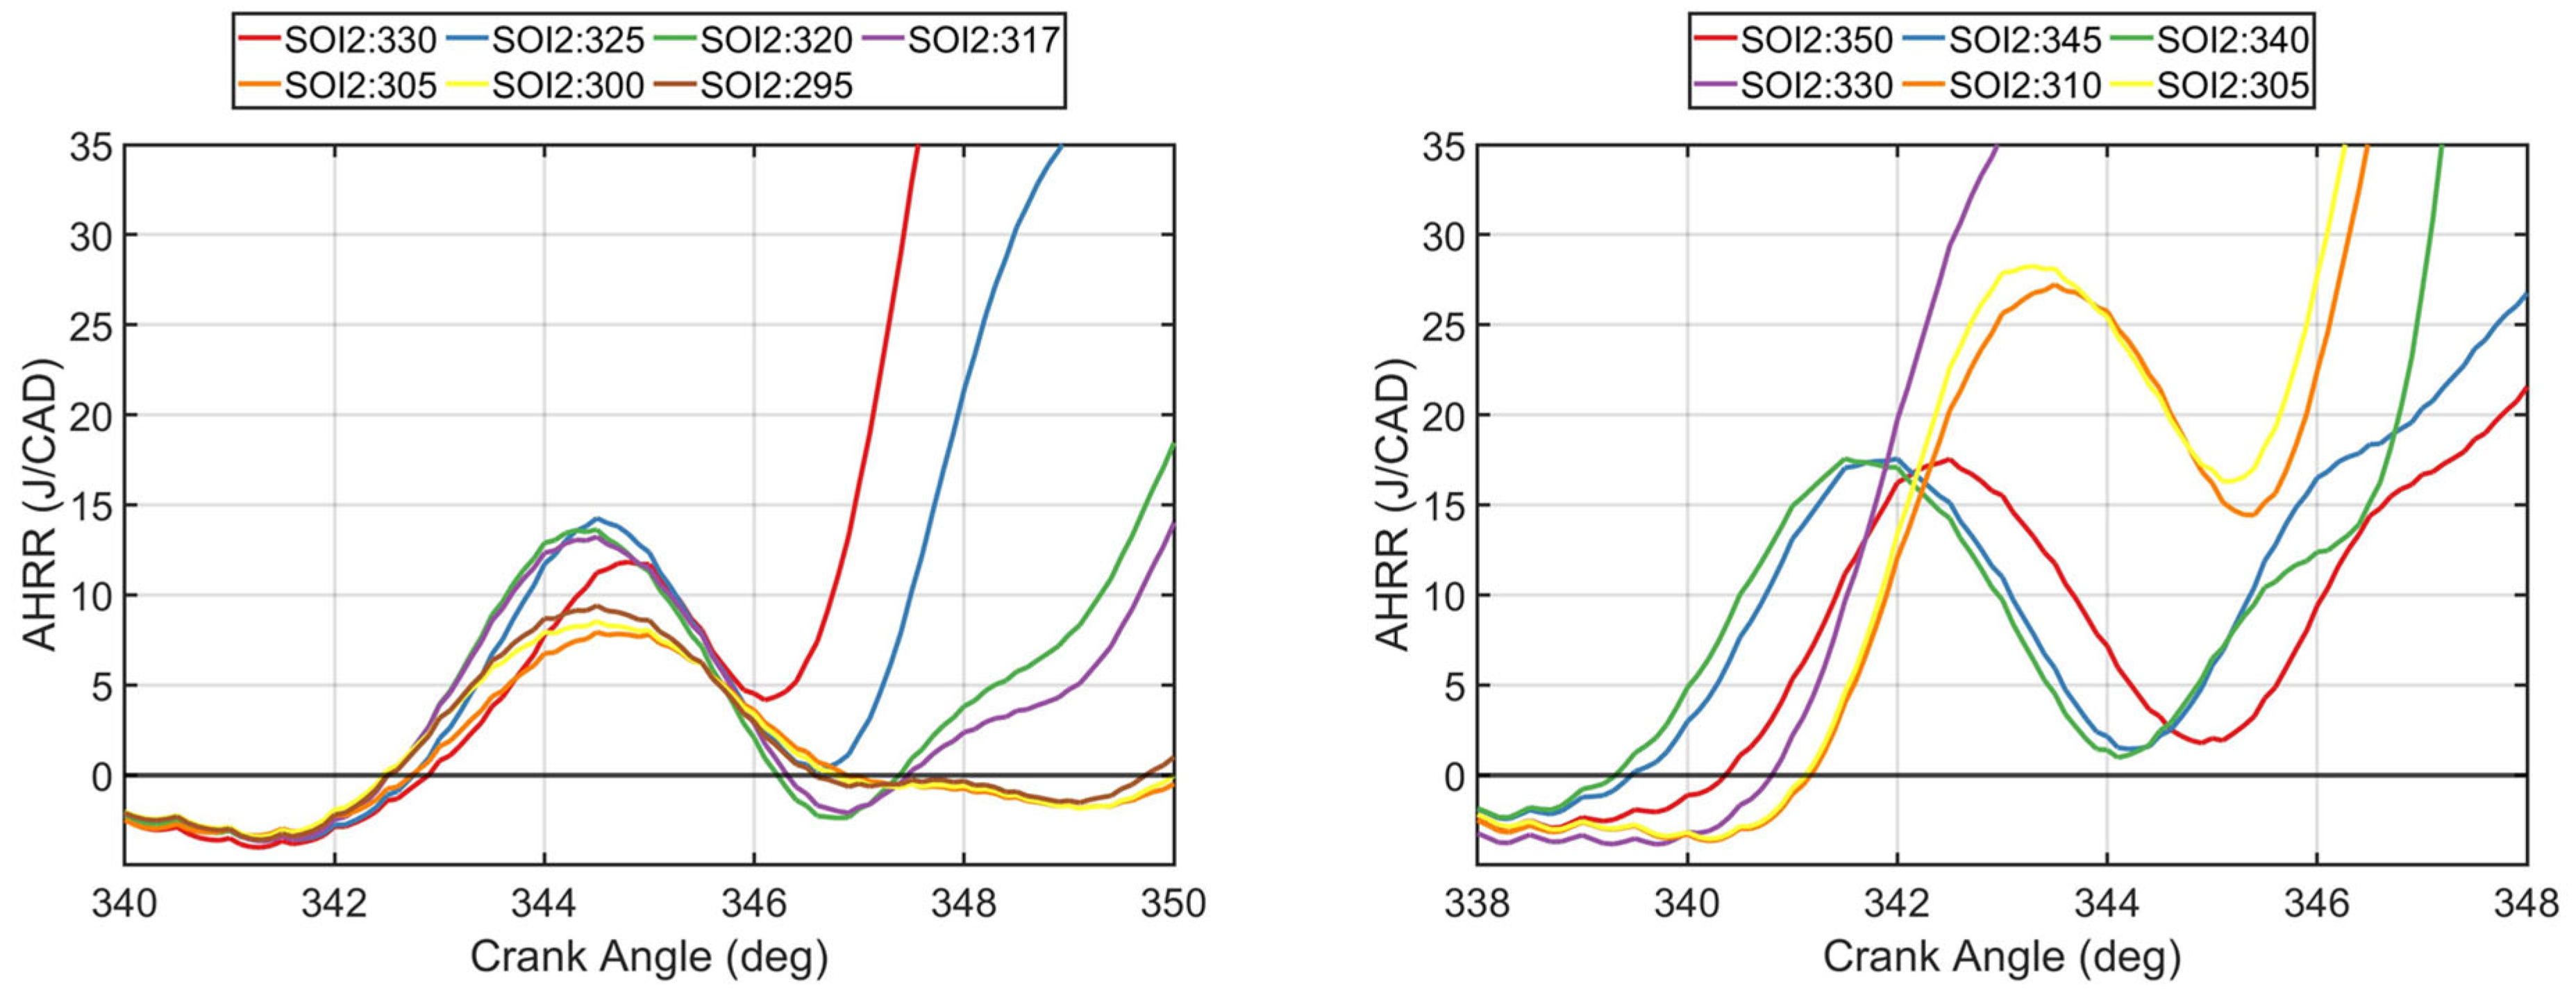
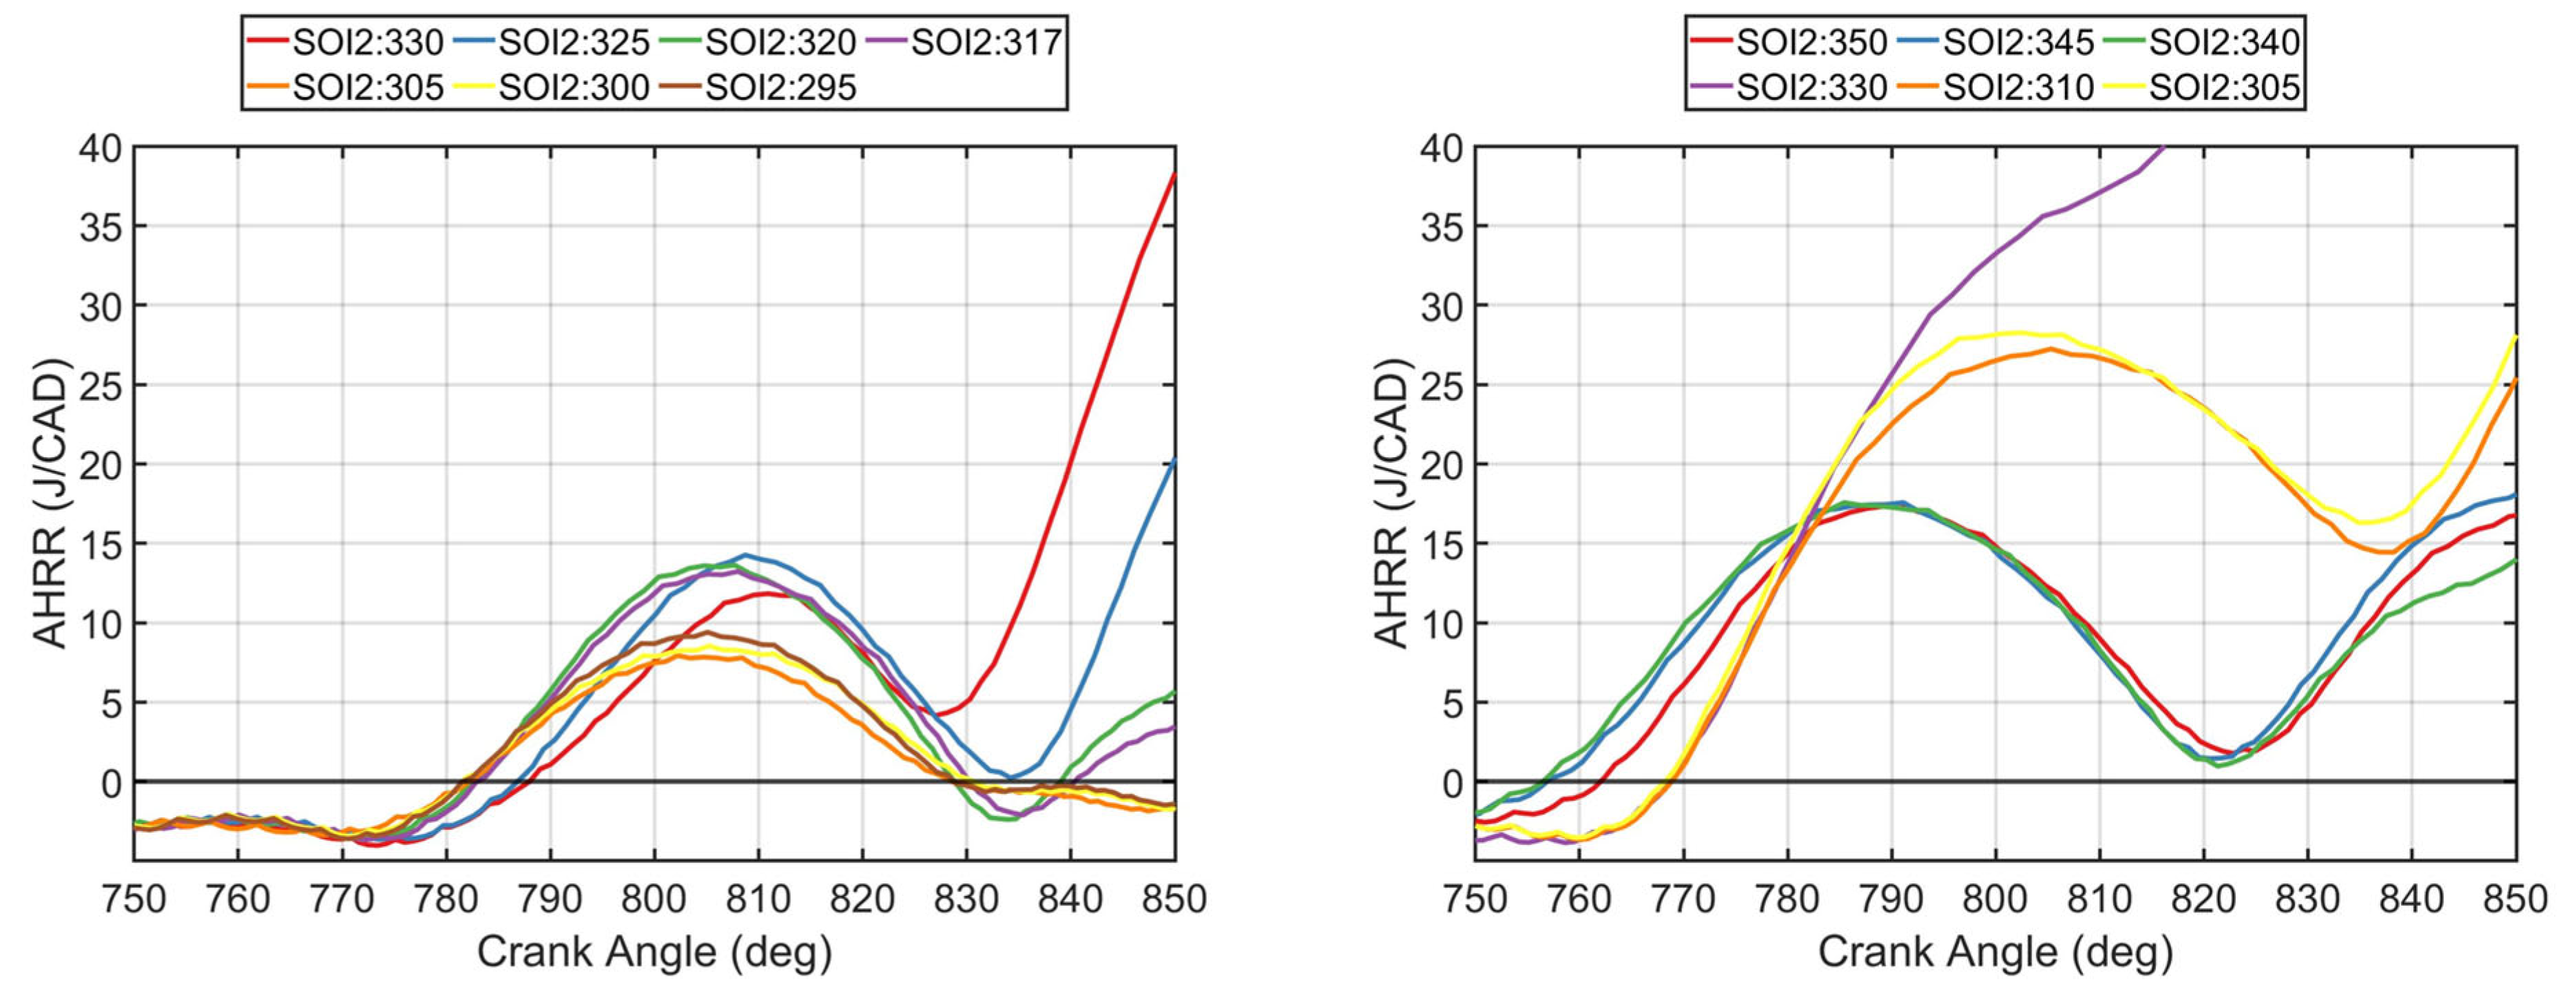
Another interesting observation regards the manifestation of the low-temperature heat release (LTHR) portion of the AHRR profile for both diesel–NG and POMDME–NG combustion.
Figure 8 shows this LTHR region for both fuel combinations. There is a stark contrast within this LTHR region between diesel–NG and POMDME–NG. Diesel–NG shows a very consistent LTHR profile, which never exceeds 15 J/CAD of peak LTHR; POMDME–NG, on the other hand, shows a very erratic LTHR profile, with the SOI2 timings that occur before the fixed 320 SOI1 having much higher LTHR than for SOI2s that occur after the fixed 320 CAD SOI1.
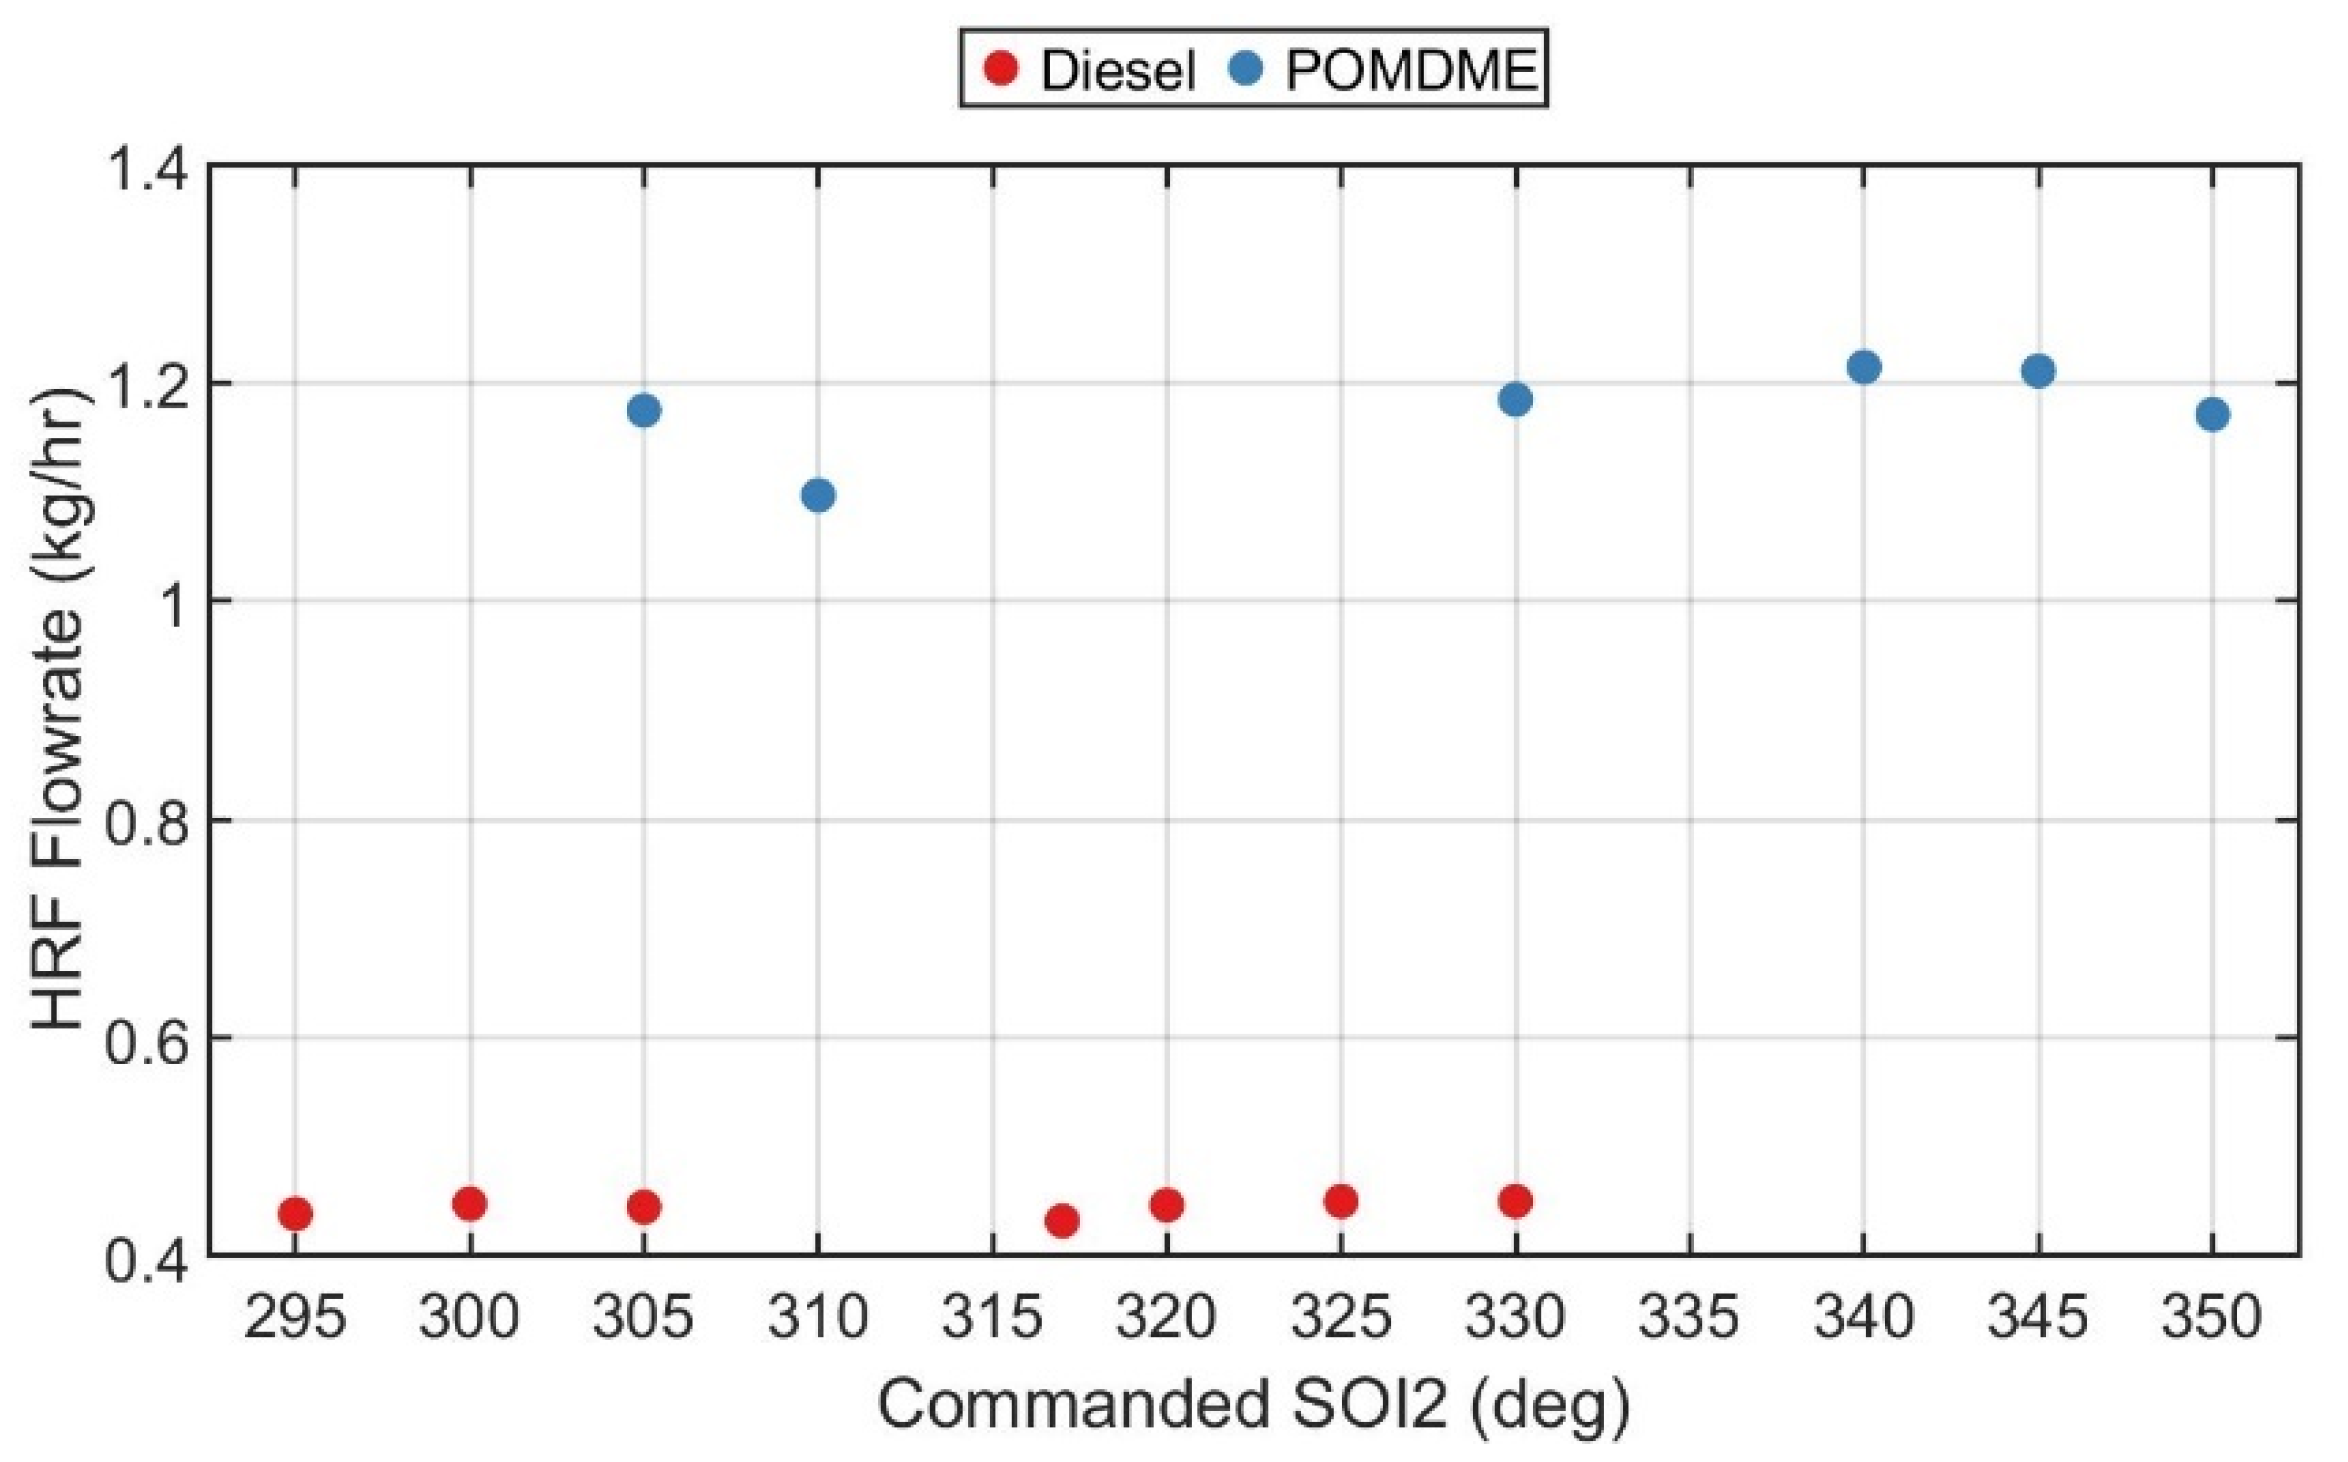
The differences in LTHR profiles for both fueling combinations could be due to a few different factors. First, the timing of SOI1 could impact LTHR, with diesel having a fixed SOI1 timing of 310 CAD and POMDME having a fixed SOI1 timing of 320 CAD. This means that diesel–NG combustion will have at least 10 CAD more time for mixing than POMDME. In addition to this effect, POMDME requires much higher fueling rates compared to diesel, as evident from
Figure 9, due to the lower
LHV of POMDME. This likely leads to higher local equivalence ratio stratification levels for POMDME than for diesel, resulting in more significant changes to the LTHR profiles for the former.
It is also noteworthy to compare the differences between the LTHR curves for SOI2s that occur before their respective SOI1s for both diesel–NG and POMDME–NG. In
Figure 8, as mentioned previously, similar peak LTHR values as well as similar onset of LTHR locations are observed for all diesel SOI2s, whereas for POMDME, 310 and 305 SOI2s had significantly different LTHR curves. To further understand the possible reasons for this behavior, the LTHR was plotted vs. the calculated in-cylinder bulk gas temperature in
Figure 10.
From
Figure 10, it is evident that for diesel–NG combustion, there are only minor differences between the different SOI2 in-cylinder bulk gas temperatures, with the start of LTHR occurring consistently between 770 and 780 K. POMDME–NG combustion, however, shows LTHR onset temperatures between 760 K and 770 K for SOI2s of 305, 310, and 330, but shows temperatures that are near 750 K or lower for SOI2s of 340, 345, and 350. Firstly, it is clear from these plots that POMDME’s higher reactivity compared to diesel has an impact on the low-temperature chemistry, since all the temperatures at the onset of LTHR are lower compared to diesel. Secondly, the changes in LTHR behavior seen in POMDME–NG operation can be attributed to a phenomenon that is occurring locally within the cylinder. It is posited that for SOI2 values of 340, 345, and 350 CAD in POMDME operation the LTHR component is mostly due to the fuel which has been properly mixed from the SOI 320 CAD injection event. Conversely, the SOI2s that occur before the SOI1 of 320 CAD show more intense LTHR. This could mean that more of the overall fuel mixture is taking part in the low-temperature chemical reactions. However, without detailed chemical kinetic simulations, nor without knowing the local thermodynamic conditions within the combustion chamber, no definitive explanations can be put forth for these LTHR trends for POMDME–NG compared to diesel–NG.
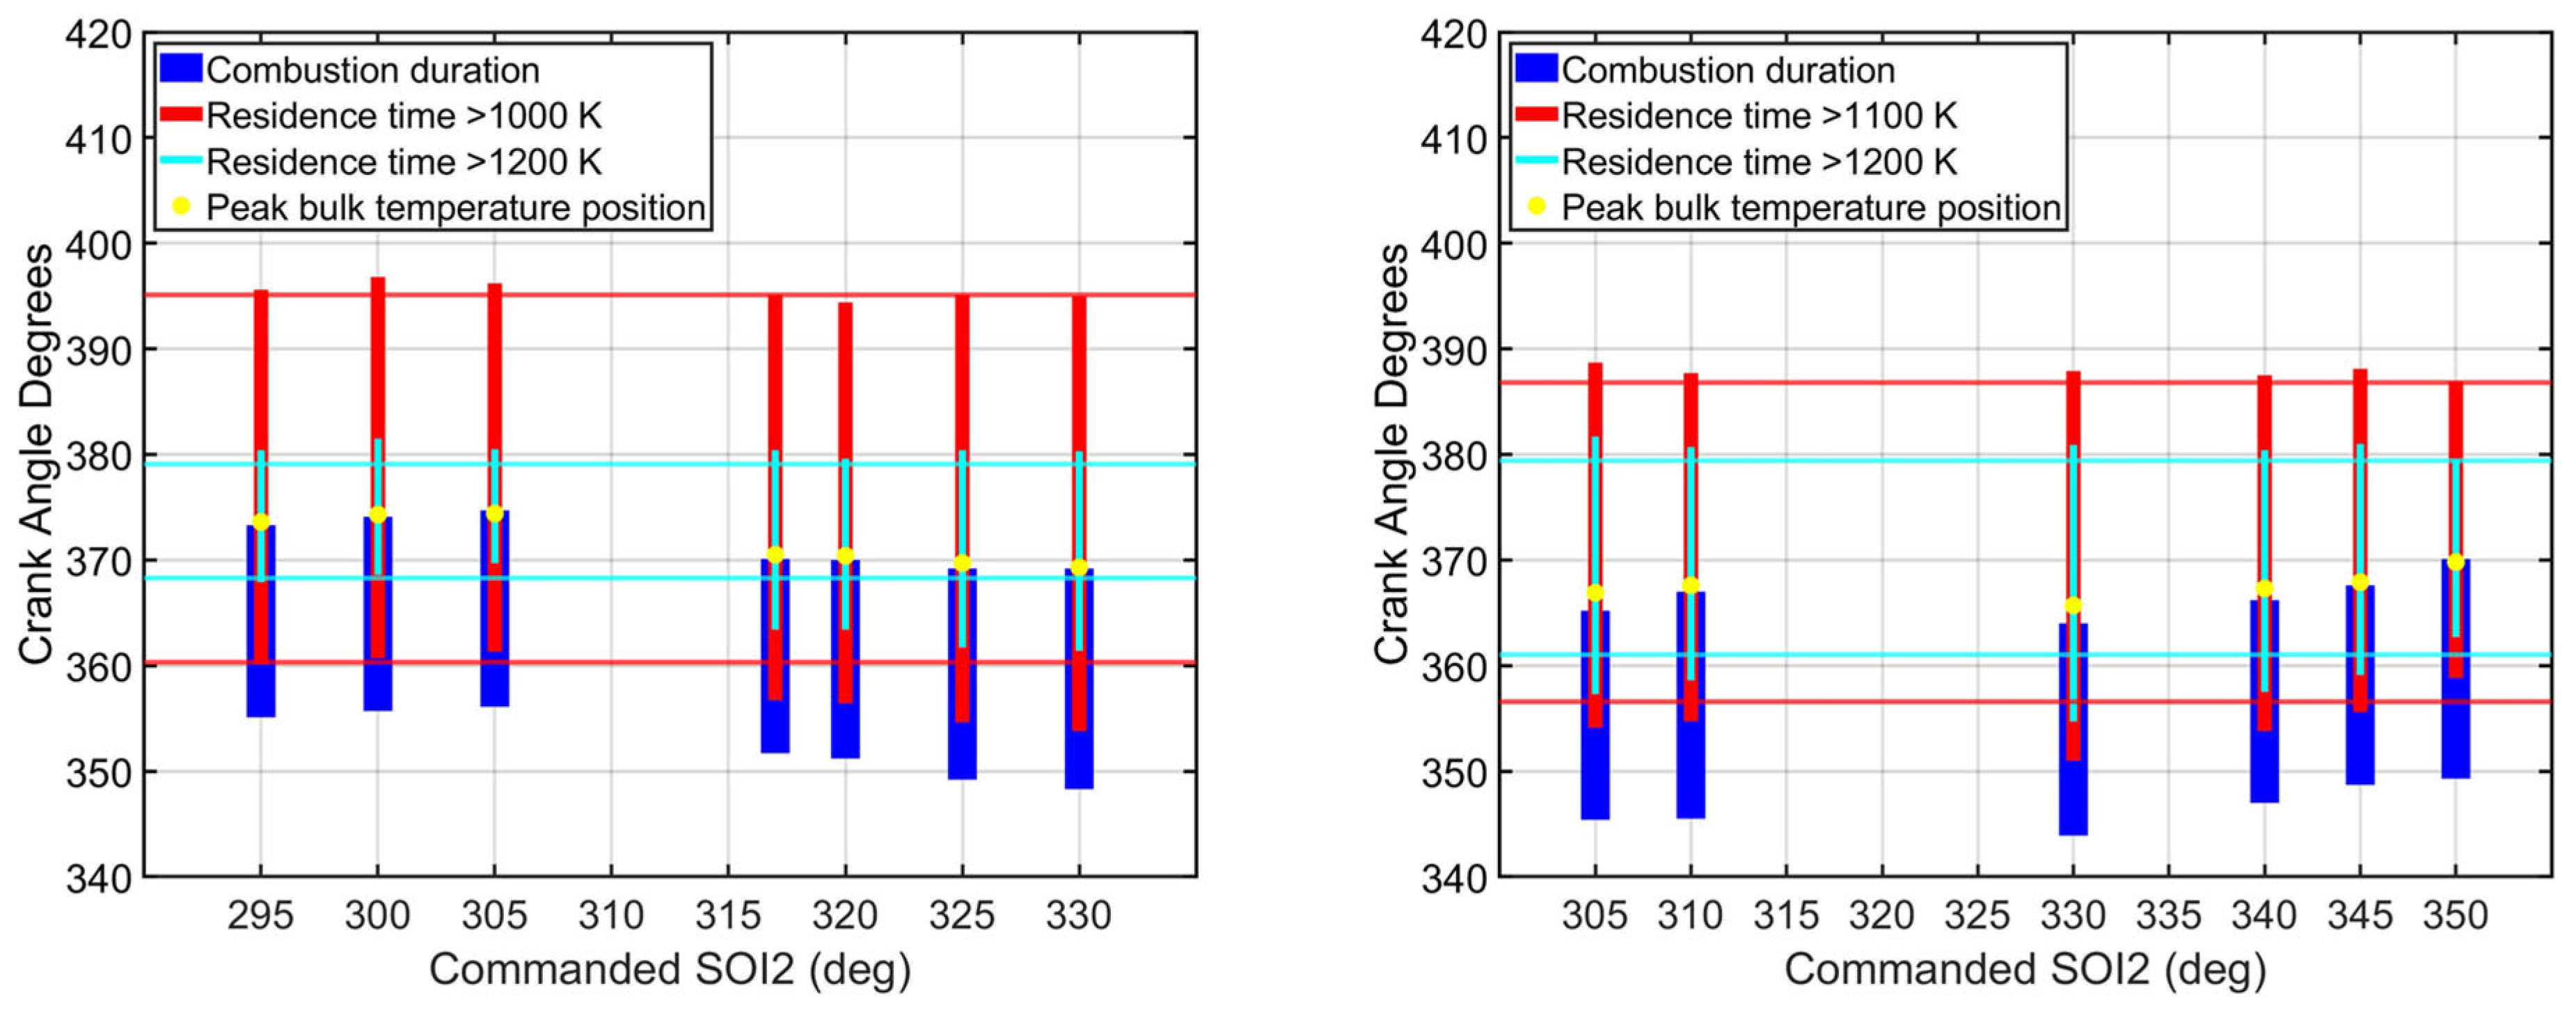
Finally, the reduction in ISCO that occurs with introducing a second injection needs to be addressed. Not only did the cycle-to-cycle variability decrease for some SOI1-SOI2 combinations, but also the in-cylinder bulk gas temperatures were higher for longer durations of time. To visualize this, residence times above a threshold bulk gas temperature were calculated and plotted in
Figure 11. It has been shown that, in HCCI combustion, for example, the lowest peak temperature needed for complete CO oxidation is 1500 K [
49]. This might be a reasonable starting point threshold peak temperature to study residence times even for DFLTC. However, for the low-load DFLTC studied here, peak in-cylinder temperatures for the SOI2 sweep never approached 1500 K. In fact, the maximum in-cylinder temperature was 1296 K for diesel–NG and 1351 K for POMDME. It should be noted that these temperatures are bulk gas temperatures, not local temperatures, which can certainly exceed 1500 K, leading to local CO-to-CO
2 conversion in some regions within the cylinder. Nonetheless, two residence time threshold temperatures were considered, and they were calculated as 10% of the maximum temperature achieved for a given SOI2 sweep, and 20% of the maximum temperature achieved for the SOI2 sweep, both of which were rounded to the nearest integer and to two significant digits. For example, in the diesel–NG SOI2 sweep, the maximum temperature for any SOI2 was 1296 K; therefore, the cutoff temperatures were set at 1200 K and 1000 K for 10% and 20%, respectively. This process was repeated for each sweep, for both fuels. In general, the longer the residence times at high temperatures, the greater the opportunity for oxidizing CO to CO
2 within the combustion chamber.
In
Figure 11, the residence times for the ‘best’ operating points from the SOI1 sweep are also shown, for comparison, as horizontal lines, with red corresponding to the 20% threshold and cyan corresponding the 10% threshold. It is clear from
Figure 11 that the residence times for every SOI2, for both diesel–NG as well as POMDME–NG are longer at the given threshold temperatures. For diesel–NG, the residence times for 295, 300, and 305 CAD SOI2s were close to the residence times observed with the SOI1 sweep in step 1; however, the ISCO was still lower than the 310 CAD SOI1 chosen from step 1, but was higher than for the 317, 320, 325, and 330 CAD SOI2s. This indicates that the residence time plots and the respective thresholds that were used in
Figure 11 can be correlated to the reduction in ISCO emissions.
3.3. Step 2b: PES Sweep
As with Step 2a, the SOI1s of 310 CAD and 320 CAD for diesel–NG and POMDME –NG operation, respectively, are considered for the
PES sweep. The goal of the
PES sweep is to determine, at these SOI1s, the impact of
PES on emissions, specifically ISHC and ISCO emissions.
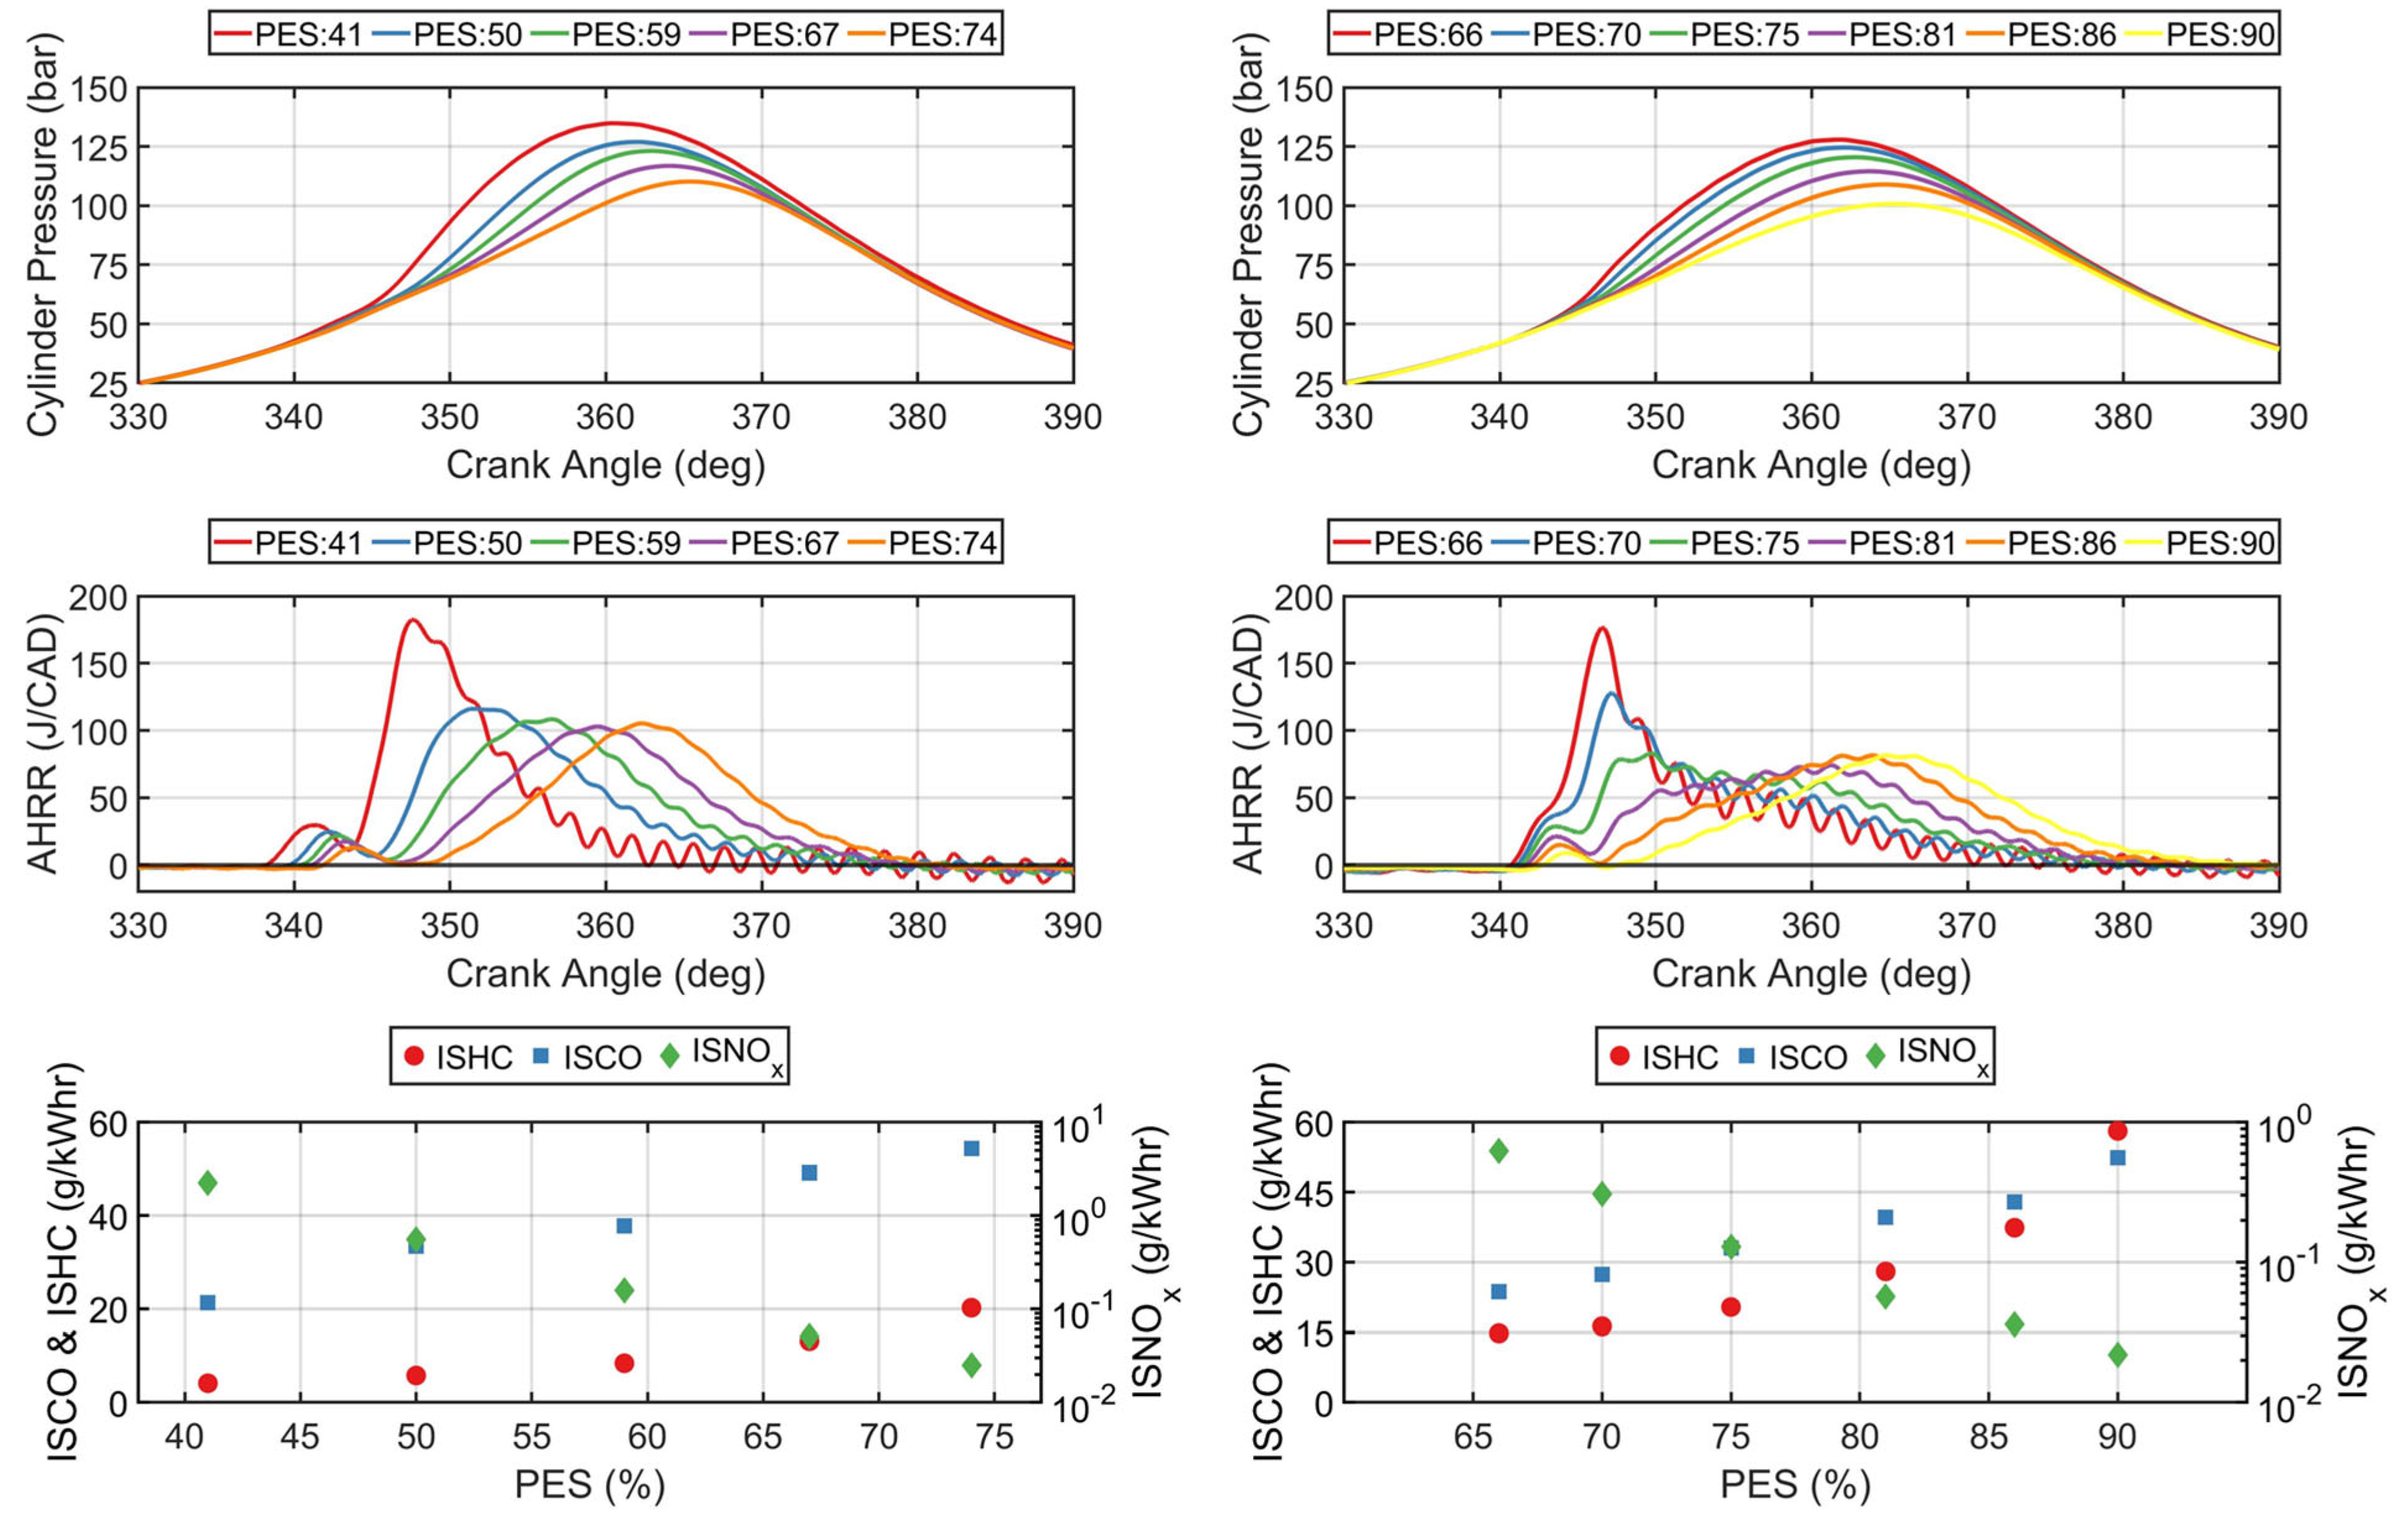
Figure 12 shows the cylinder pressure, AHRR, and emissions for each
PES for both fueling combinations.
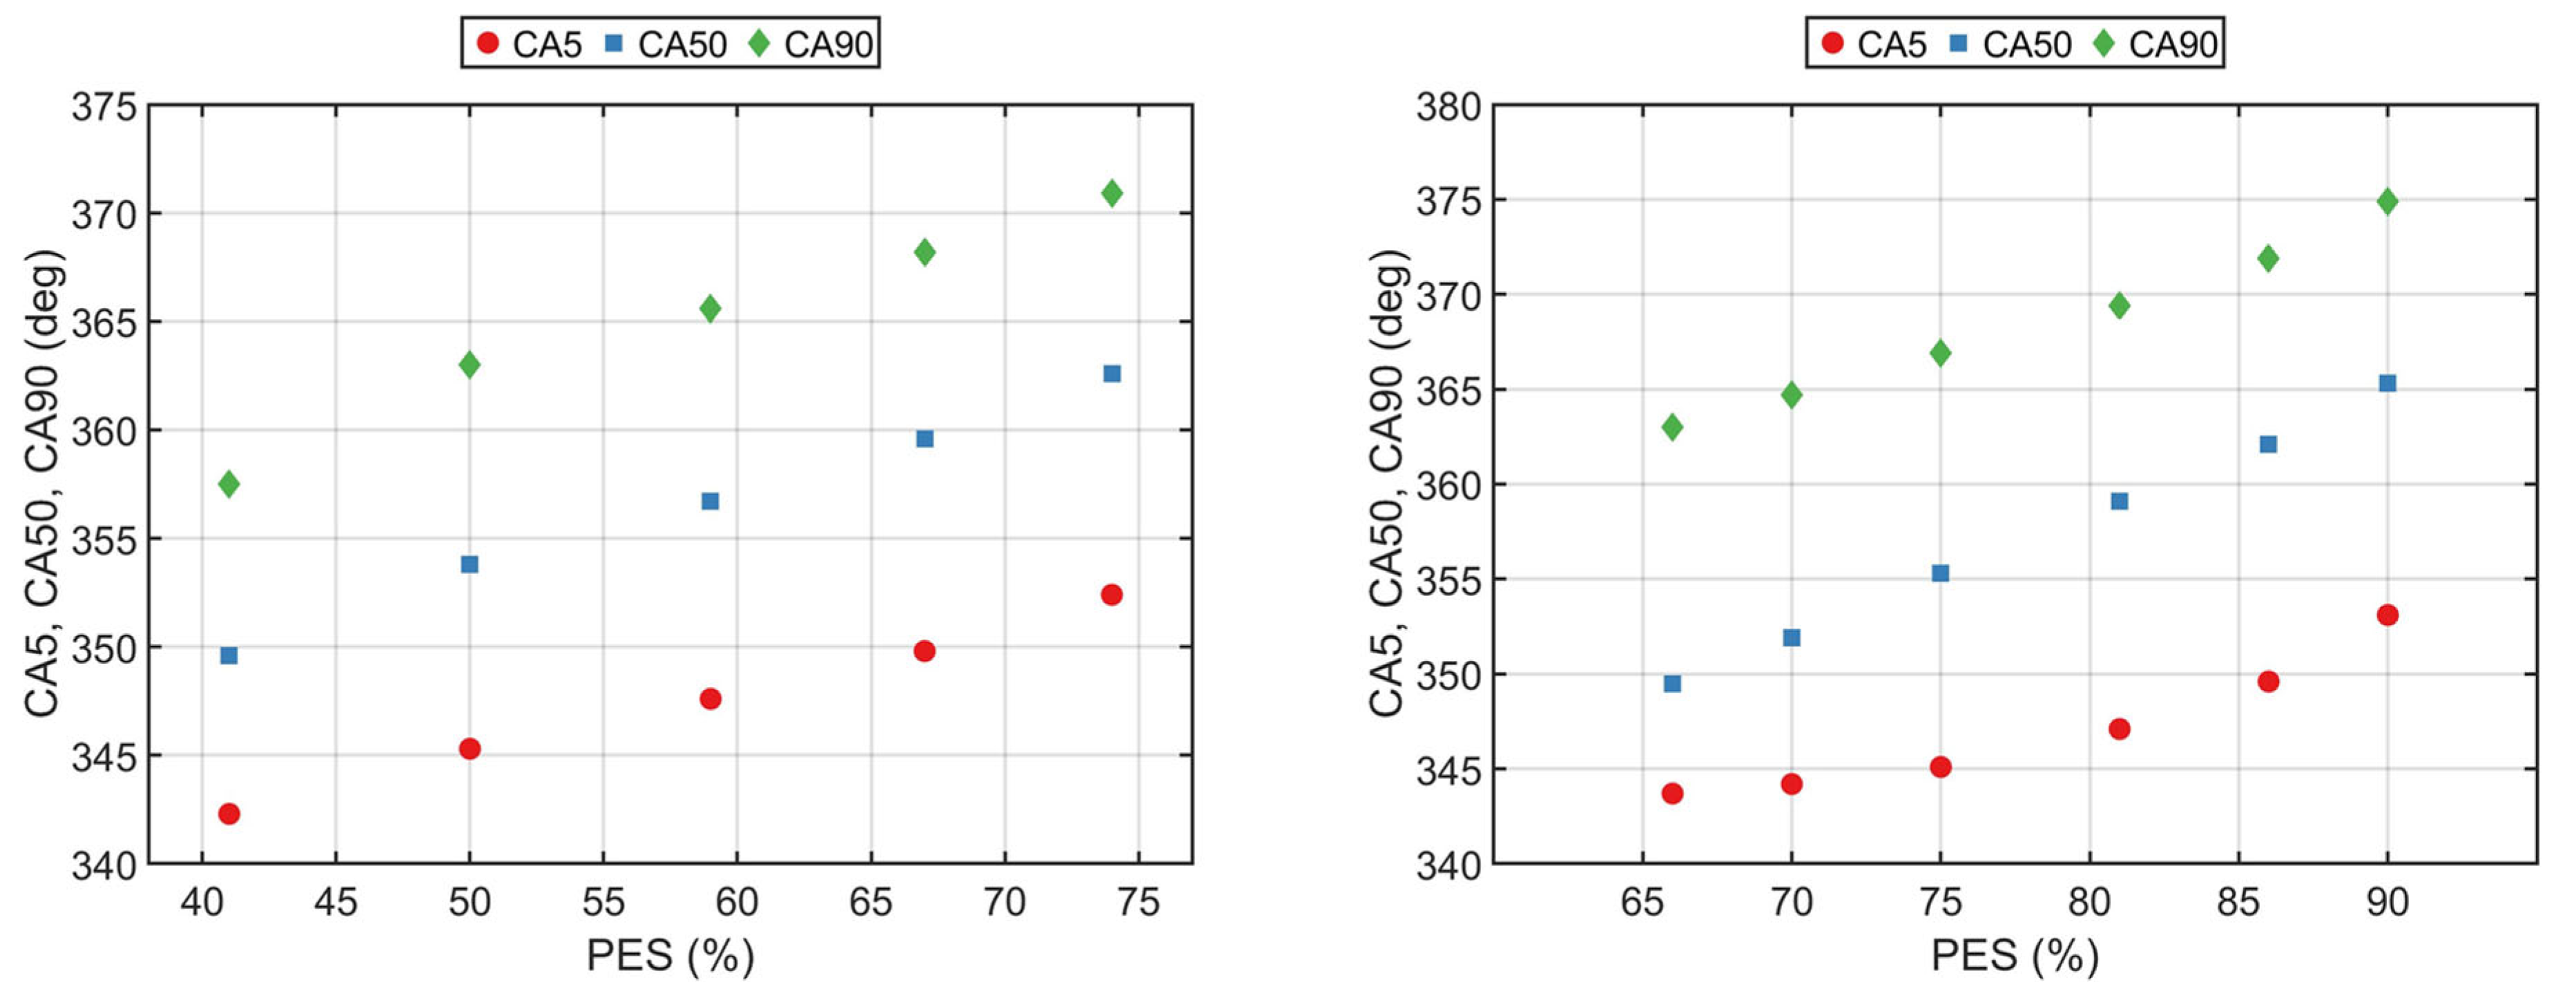
As
PES was decreased, for both fueling combinations, the peak cylinder pressure increased, and the location of the peak cylinder pressure advanced. AHRR profiles also show this advancement in the location of peak AHRR and increased peak AHRR values with decreasing
PES. This phenomenon can be seen in the CA5, CA50, and CA90 trends shown in
Figure 13. As
PES was decreased, the CA5, CA50, and CA90 all advanced linearly, with diesel–NG and POMDME–NG showing an advancement in combustion phasing. The combustion advancement with decreasing
PES was accompanied by ISCO and ISHC reductions due to higher in-cylinder bulk gas temperatures and ISNO
x increase due to higher local temperatures.
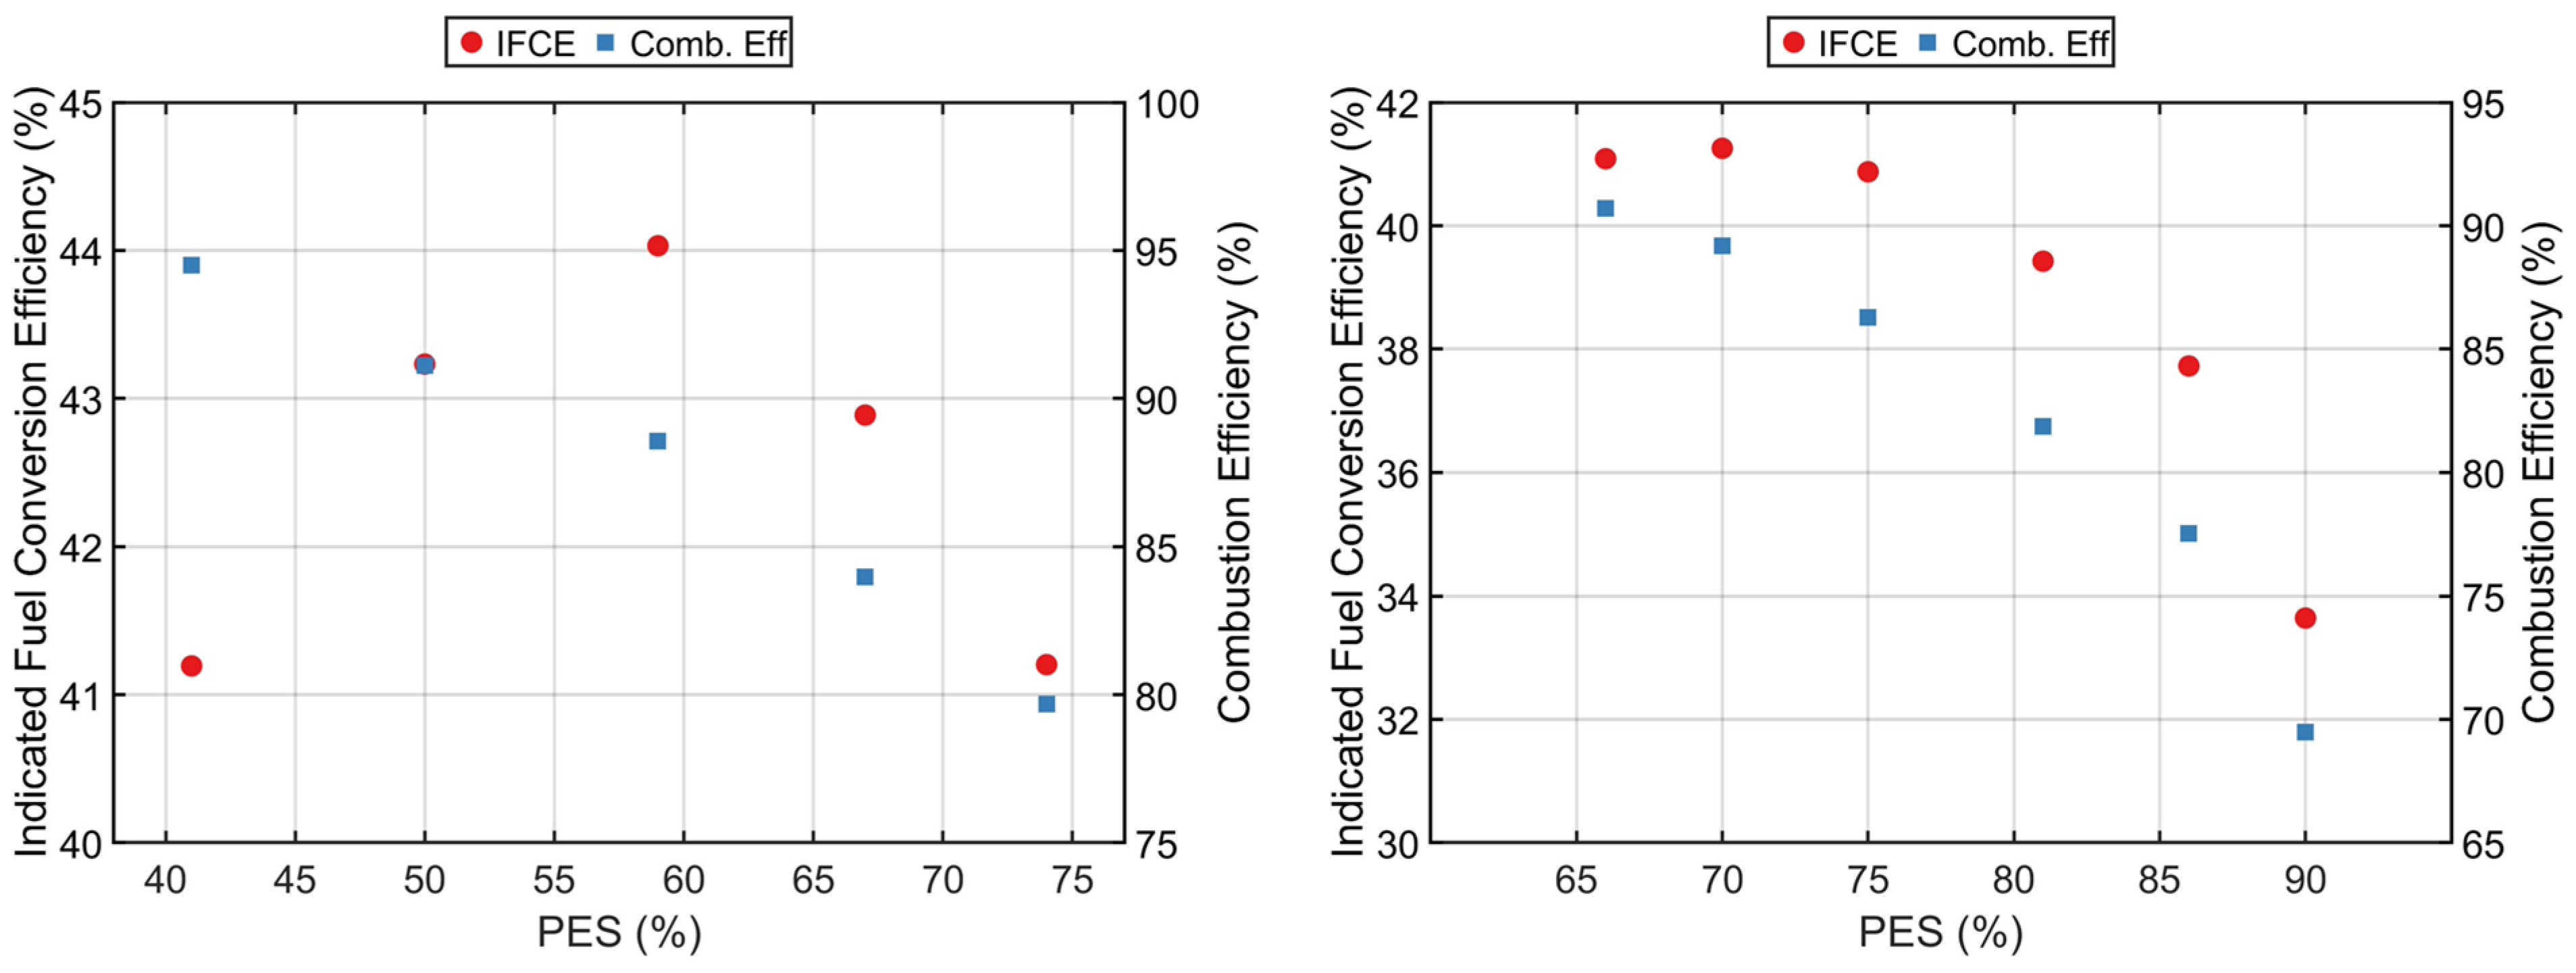
By reducing the PES, multiple outcomes arise that help reduce the ISHC and ISCO emissions. First, the advancement of the combustion phasing for both fuel combinations facilitates the reduction in the total combined HRF and LRF quantities needed to achieve 5 bar IMEP, thereby increasing
IFCEs as seen in
Figure 14. In fact,
IFCE increased from 41.2% at ~75% PES to as high as 44% at ~60% PES for diesel–NG and increased from 33.6% at 90% PES to as high as 41.3% at 70% PES for POMDME–NG combustion. Second, the combustion efficiency (also shown in
Figure 14) increased, due in part to the more robust distributed ignition centers likely with a higher quantity of HRF fuel dispersed throughout the combustion chamber at lower PES values. Combustion efficiencies approached 95% for diesel–NG operation and exceeded 90% for POMDME–NG operation.
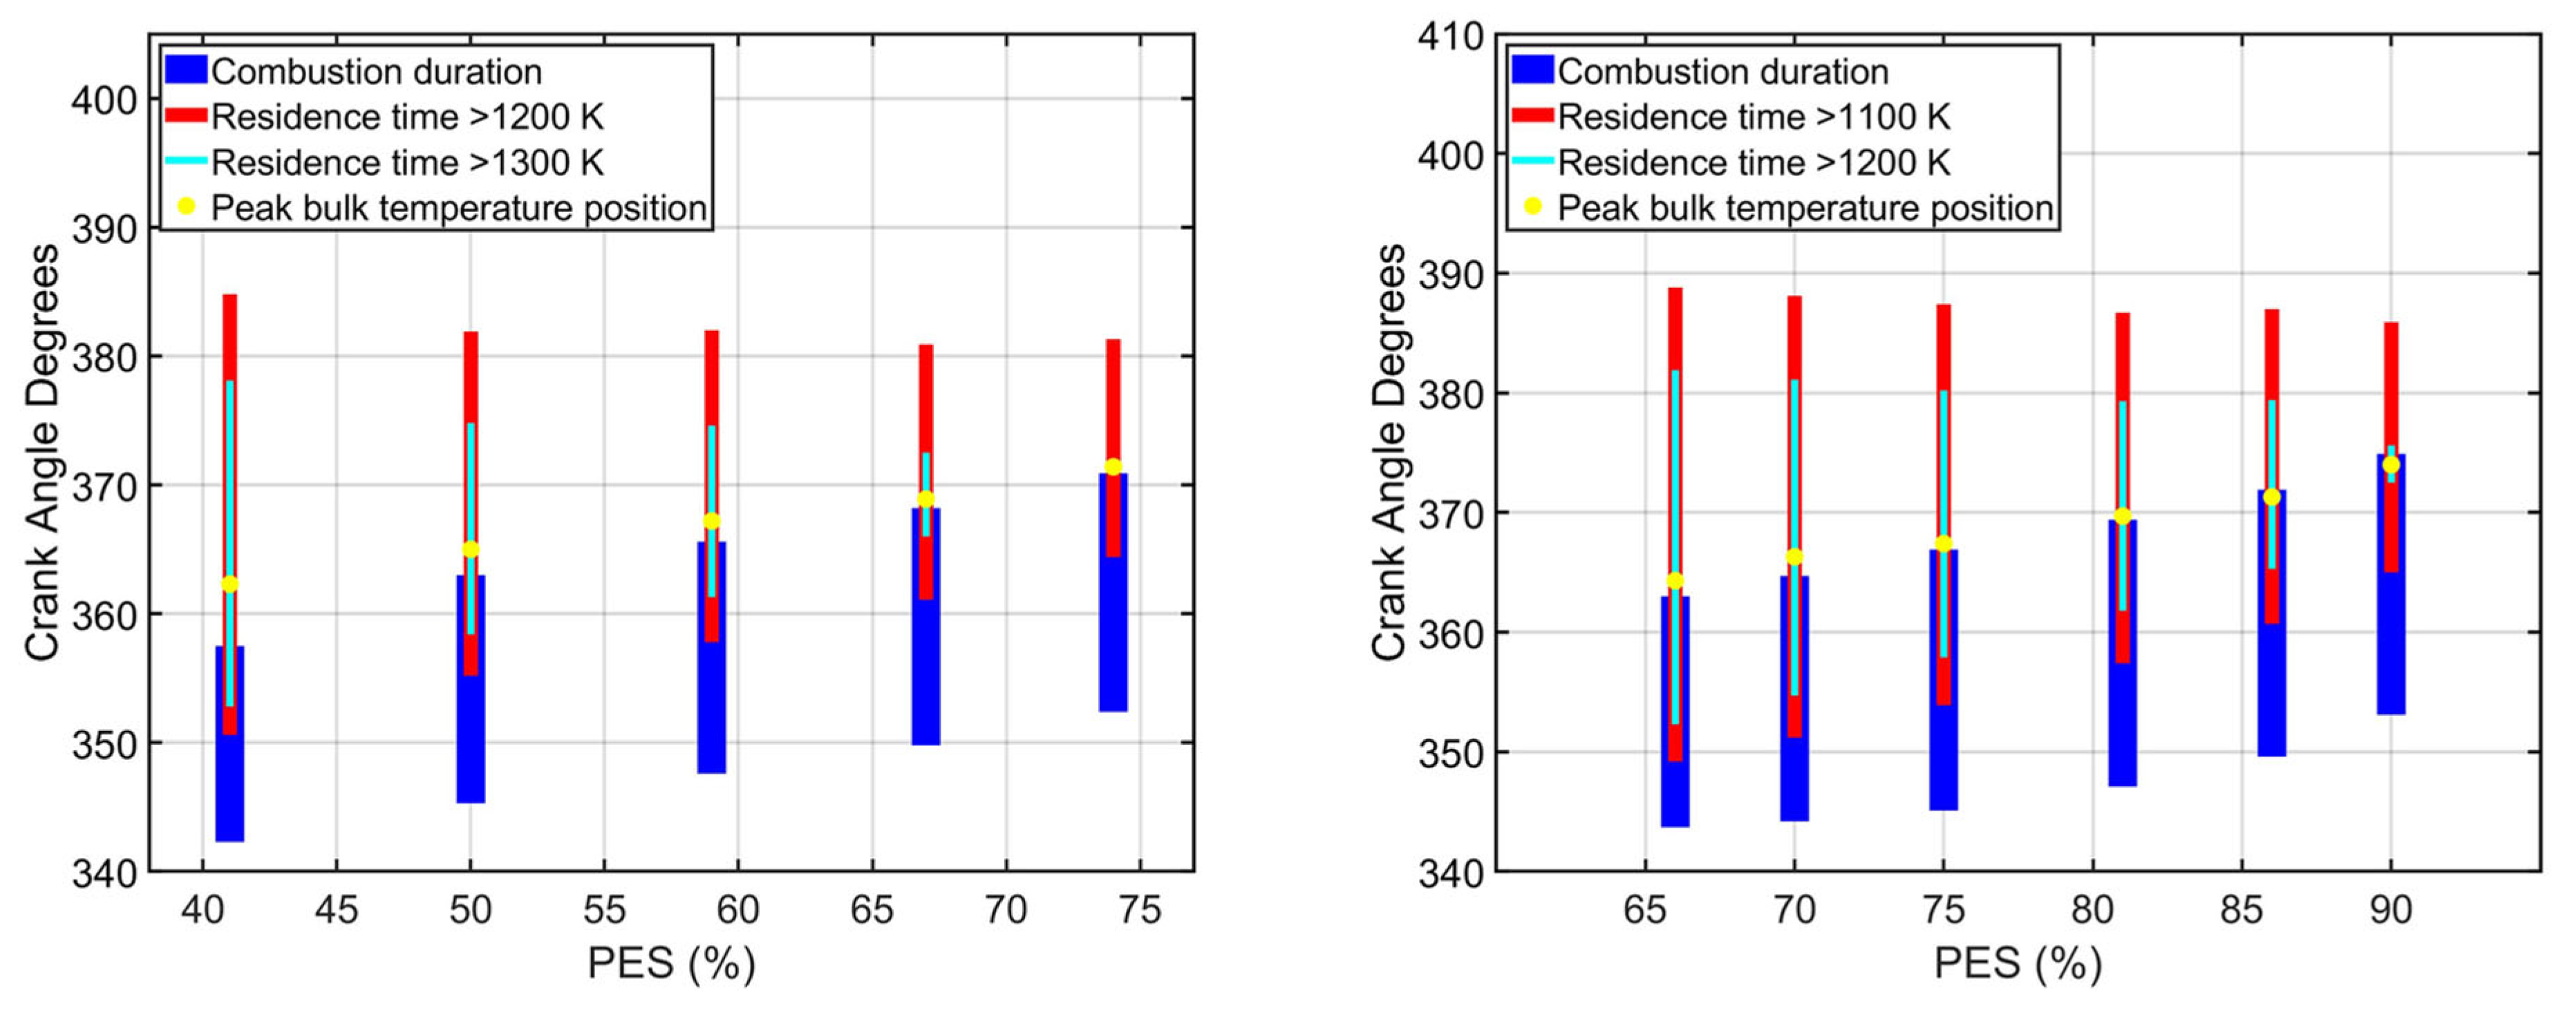
Finally, the residence time plots are shown in
Figure 15 for diesel–NG and POMDME–NG. As was carried out previously, the lower threshold was taken as 20% of the peak temperature that occurred for any
PES within the sweep, and the upper threshold was 10%. As
PES decreased for each fueling combination, the residence time that was spent above these threshold values increased. This indicates that there is a longer duration of time within the cycle for which higher temperatures occur, resulting in greater CO oxidation to CO
2 as evident from
Figure 12.
3.4. Step 3: Injection Split Ratio Sweep
When performing the injection split ratio sweep, the results from steps 2(a) and 2(b) were combined to set SOI1 and SOI2, as well as a PES value that was fixed during the experiments. For diesel–NG operation, the SOI2 of 300 CAD was chosen. This falls before the SOI1 of 310 CAD, which was set from step 1; however, the nomenclature of SOI2 is still retained since it was introduced as the second injection within the framework presented in this study. The SOI2 of 300 CAD was chosen mainly due to its low NOx compared to SOI2s that had longer injection dwells. NOx was expected to be a limiting factor when the boost pressure sweep was performed and consequently, it was decided to minimize NOx at this stage. A PES of 50% was chosen from step 2b, due to the high-IFCE as well as low-NOx values. While the NOx values for this point were near the cutoff of 1 g/kWh, the results were for a single-injection case; therefore, by combining this with the STARS strategy from step 2a, it was thought that NOx values could be reduced.
For POMDME–NG operation, an SOI2 of 310 CAD was chosen. The rationale behind choosing an SOI2 of 310 CAD is much the same as for diesel–NG operation, in that the NOx values were very low. A PES of 75% was chosen due to its good IFCE and NOx.
For the injection split ratio sweep, the SOI1 and SOI2 were fixed from step 1 and step 2(a), respectively, while allowing for the injection durations to vary at constant IMEP and
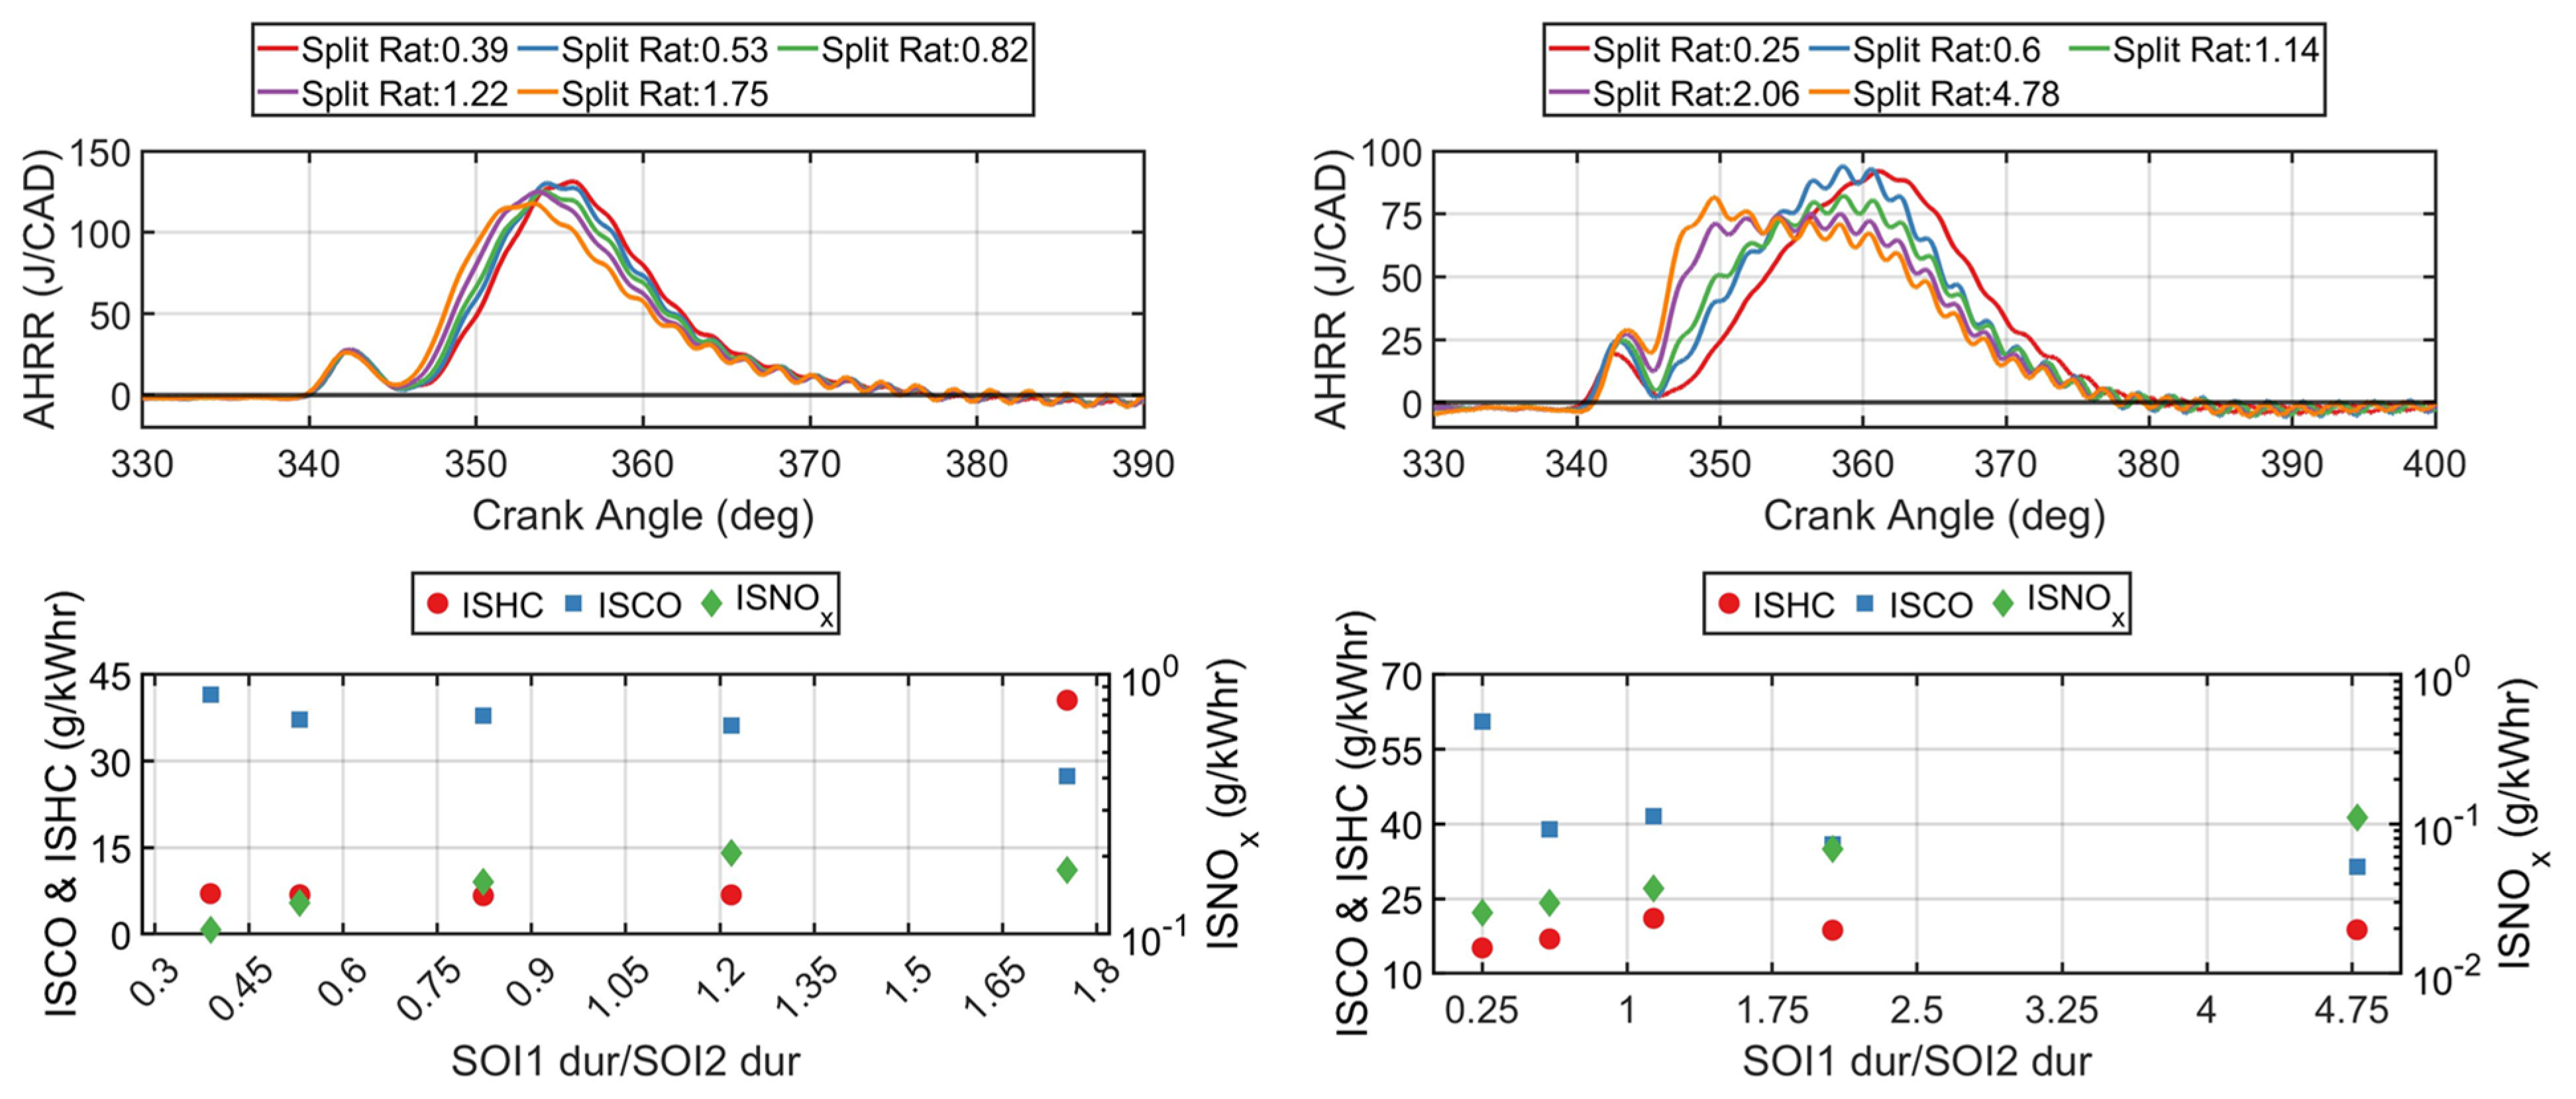
PES. It was hypothesized that the injection split ratio could give finer control over in-cylinder reactivity stratification, which could lead to greater reduction in ISCO and ISHC. The injection split ratio is defined as the ratio of the commanded injection duration of SOI1 to that of SOI2. This was varied for both diesel–NG and POMDME–NG combustion. The AHRR and emissions curves for this sweep are shown in
Figure 16.
Diesel–NG operation shows a nearly invariant heat release profile with injection split ratio. The emissions are relatively invariant as well, with the exception being an increase in ISHC emissions to over 40 g/kWh at a split ratio of 1.75, which appears to be an outlier within the dataset. The changes in the shape of AHRR in POMDME–NG operation may be attributed to the fact that the coupled injections occur later compared to diesel–NG operation, meaning there is less time for mixing and there is a larger amount of mass of fuel for POMDME compared to diesel (due to the lower
LHV of POMDME), which compounds the mixing limitation. It is evident, though, that for POMDME–NG operation, the higher injection split ratio did improve the ISCO emissions, bringing ISCO down from ~60 g/kWh to just over 30 g/kWh. This, once again, can be explained with the residence time plot shown in
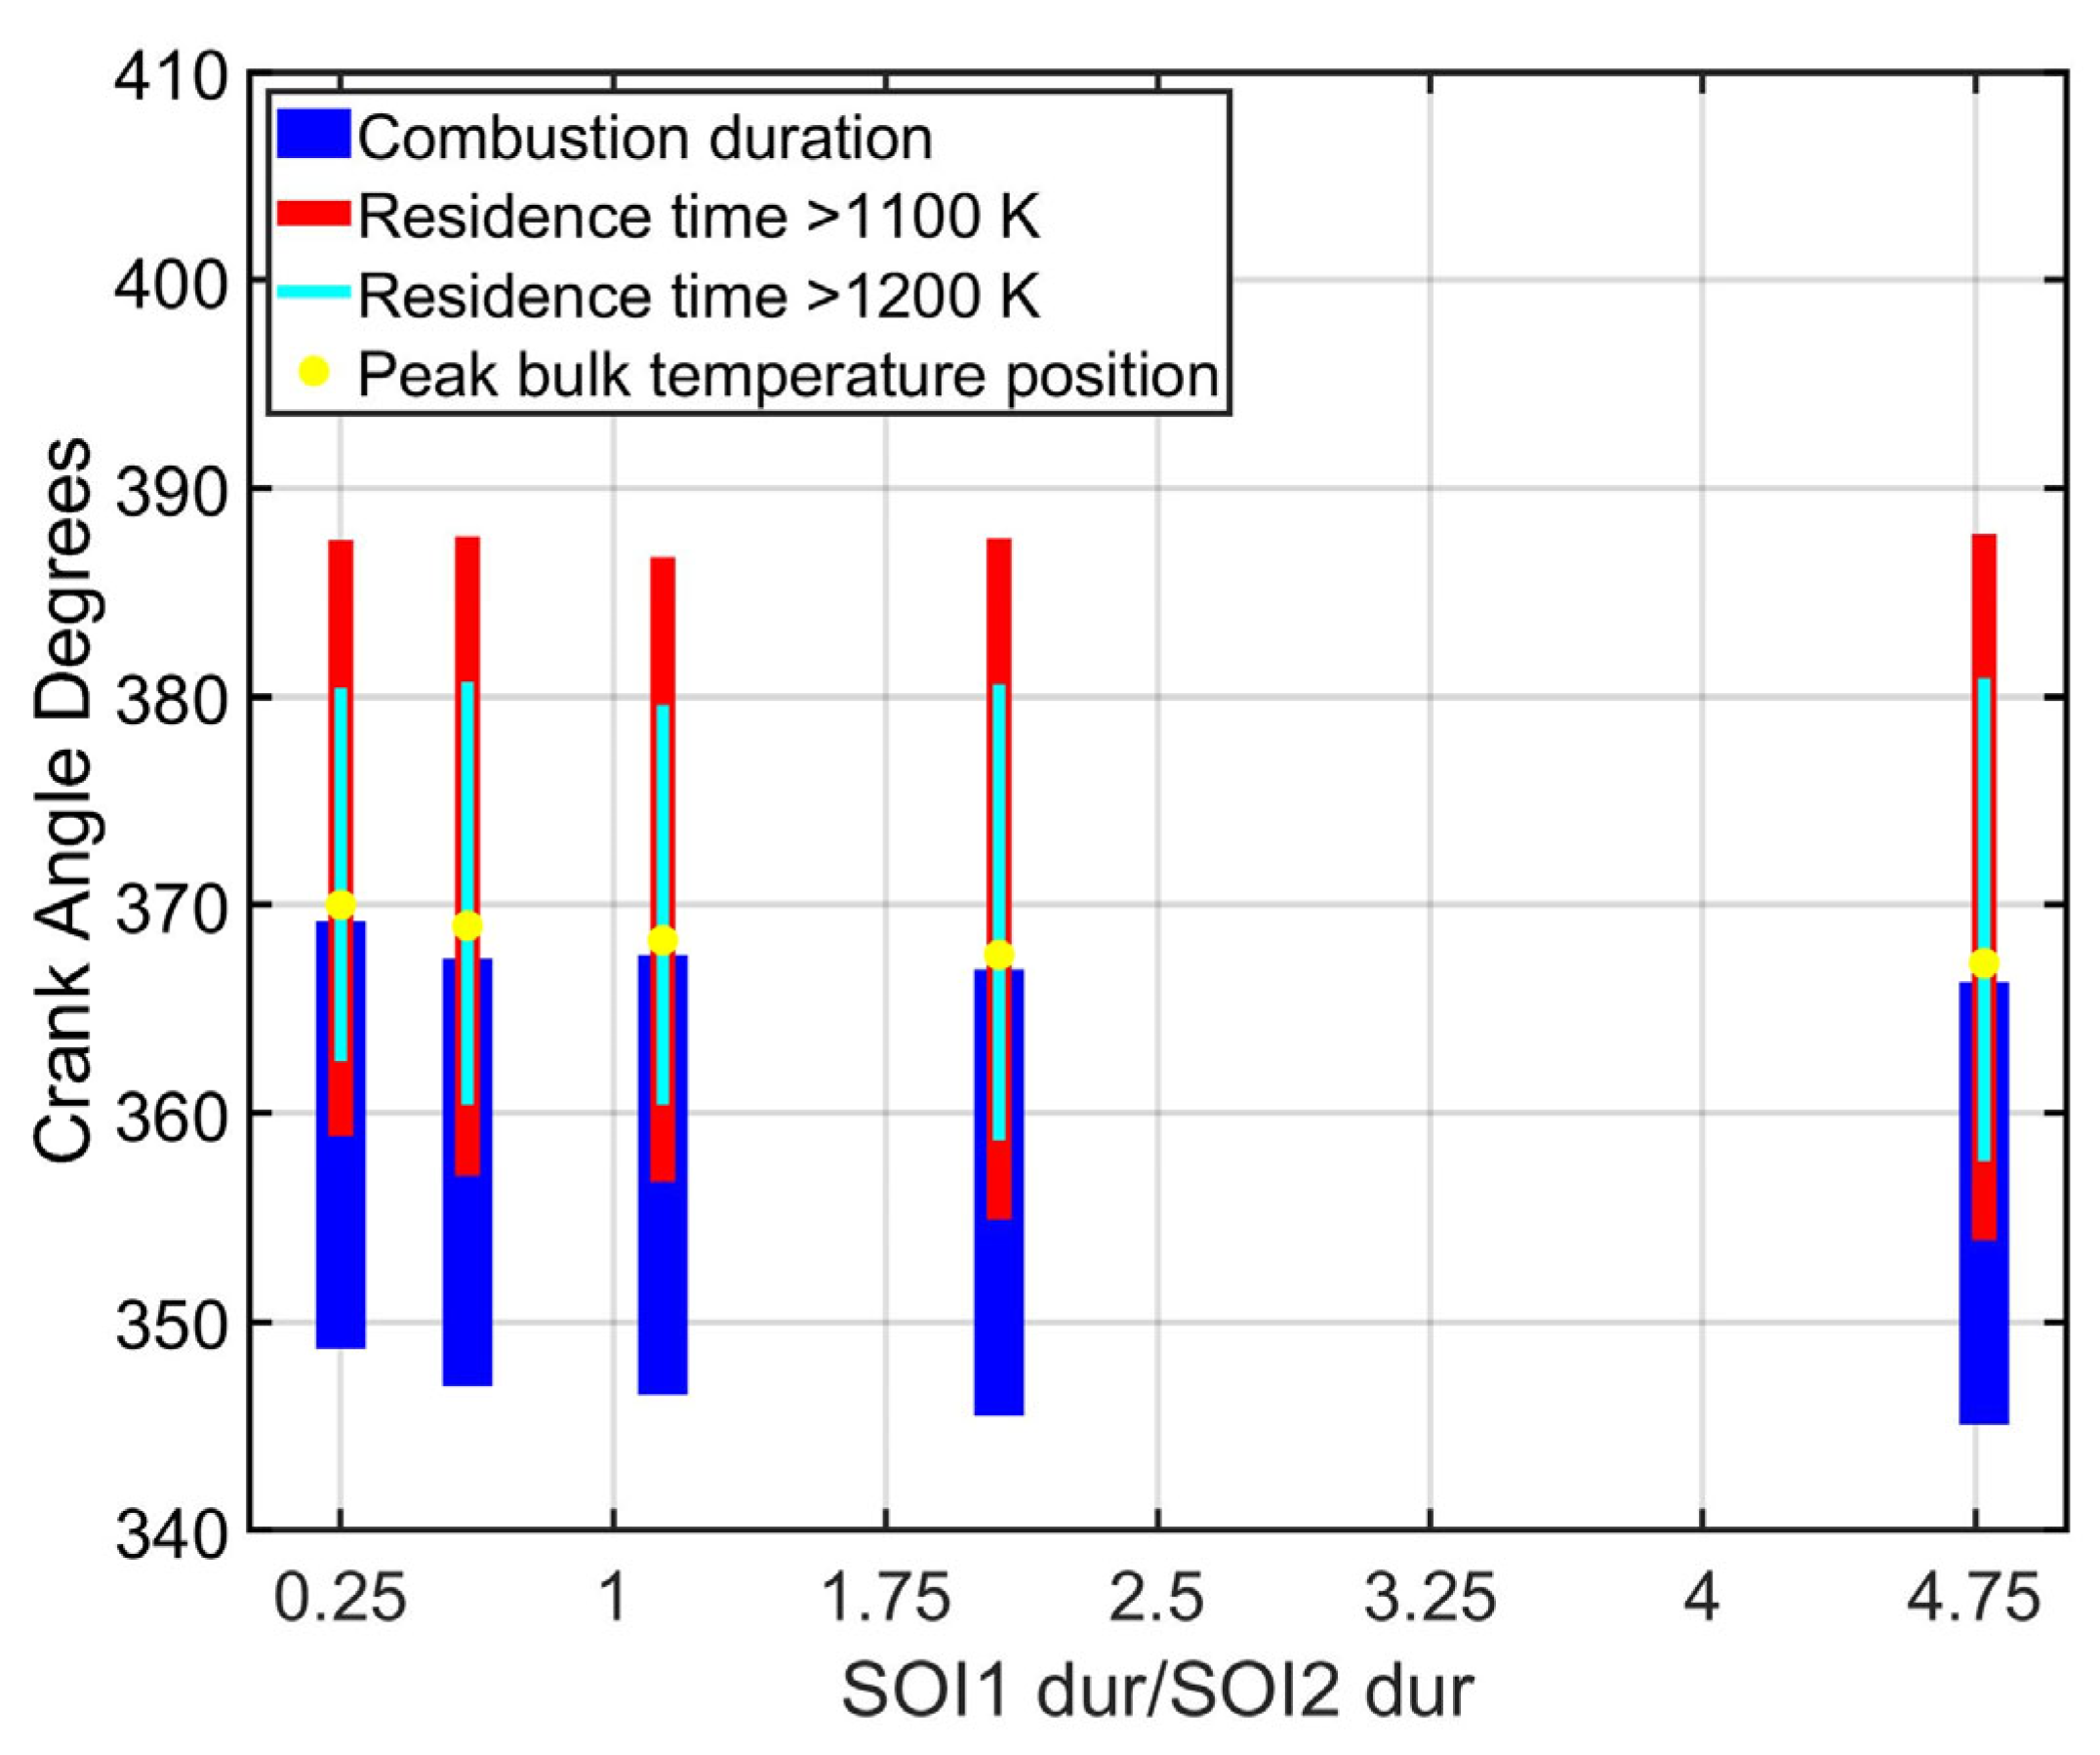
Figure 17.
The combustion duration shifts to starting earlier in the cycle for higher injection split ratios, and the temperature exceeds 1200 K sooner compared to other injection split ratios. The time for which the temperature stays above 1200 K is also prolonged at the 4.75 injection split ratio. This resulted in lower ISCO, but only slightly higher ISNOx emissions, and therefore the injection split ratio of 4.75 was chosen for POMDME to move forward. For diesel–NG operation, the injection ratio sweep did not produce any significant emissions reductions. Therefore, the 0.82 injection split ratio was chosen as it was close to equal weighting between the injection durations.
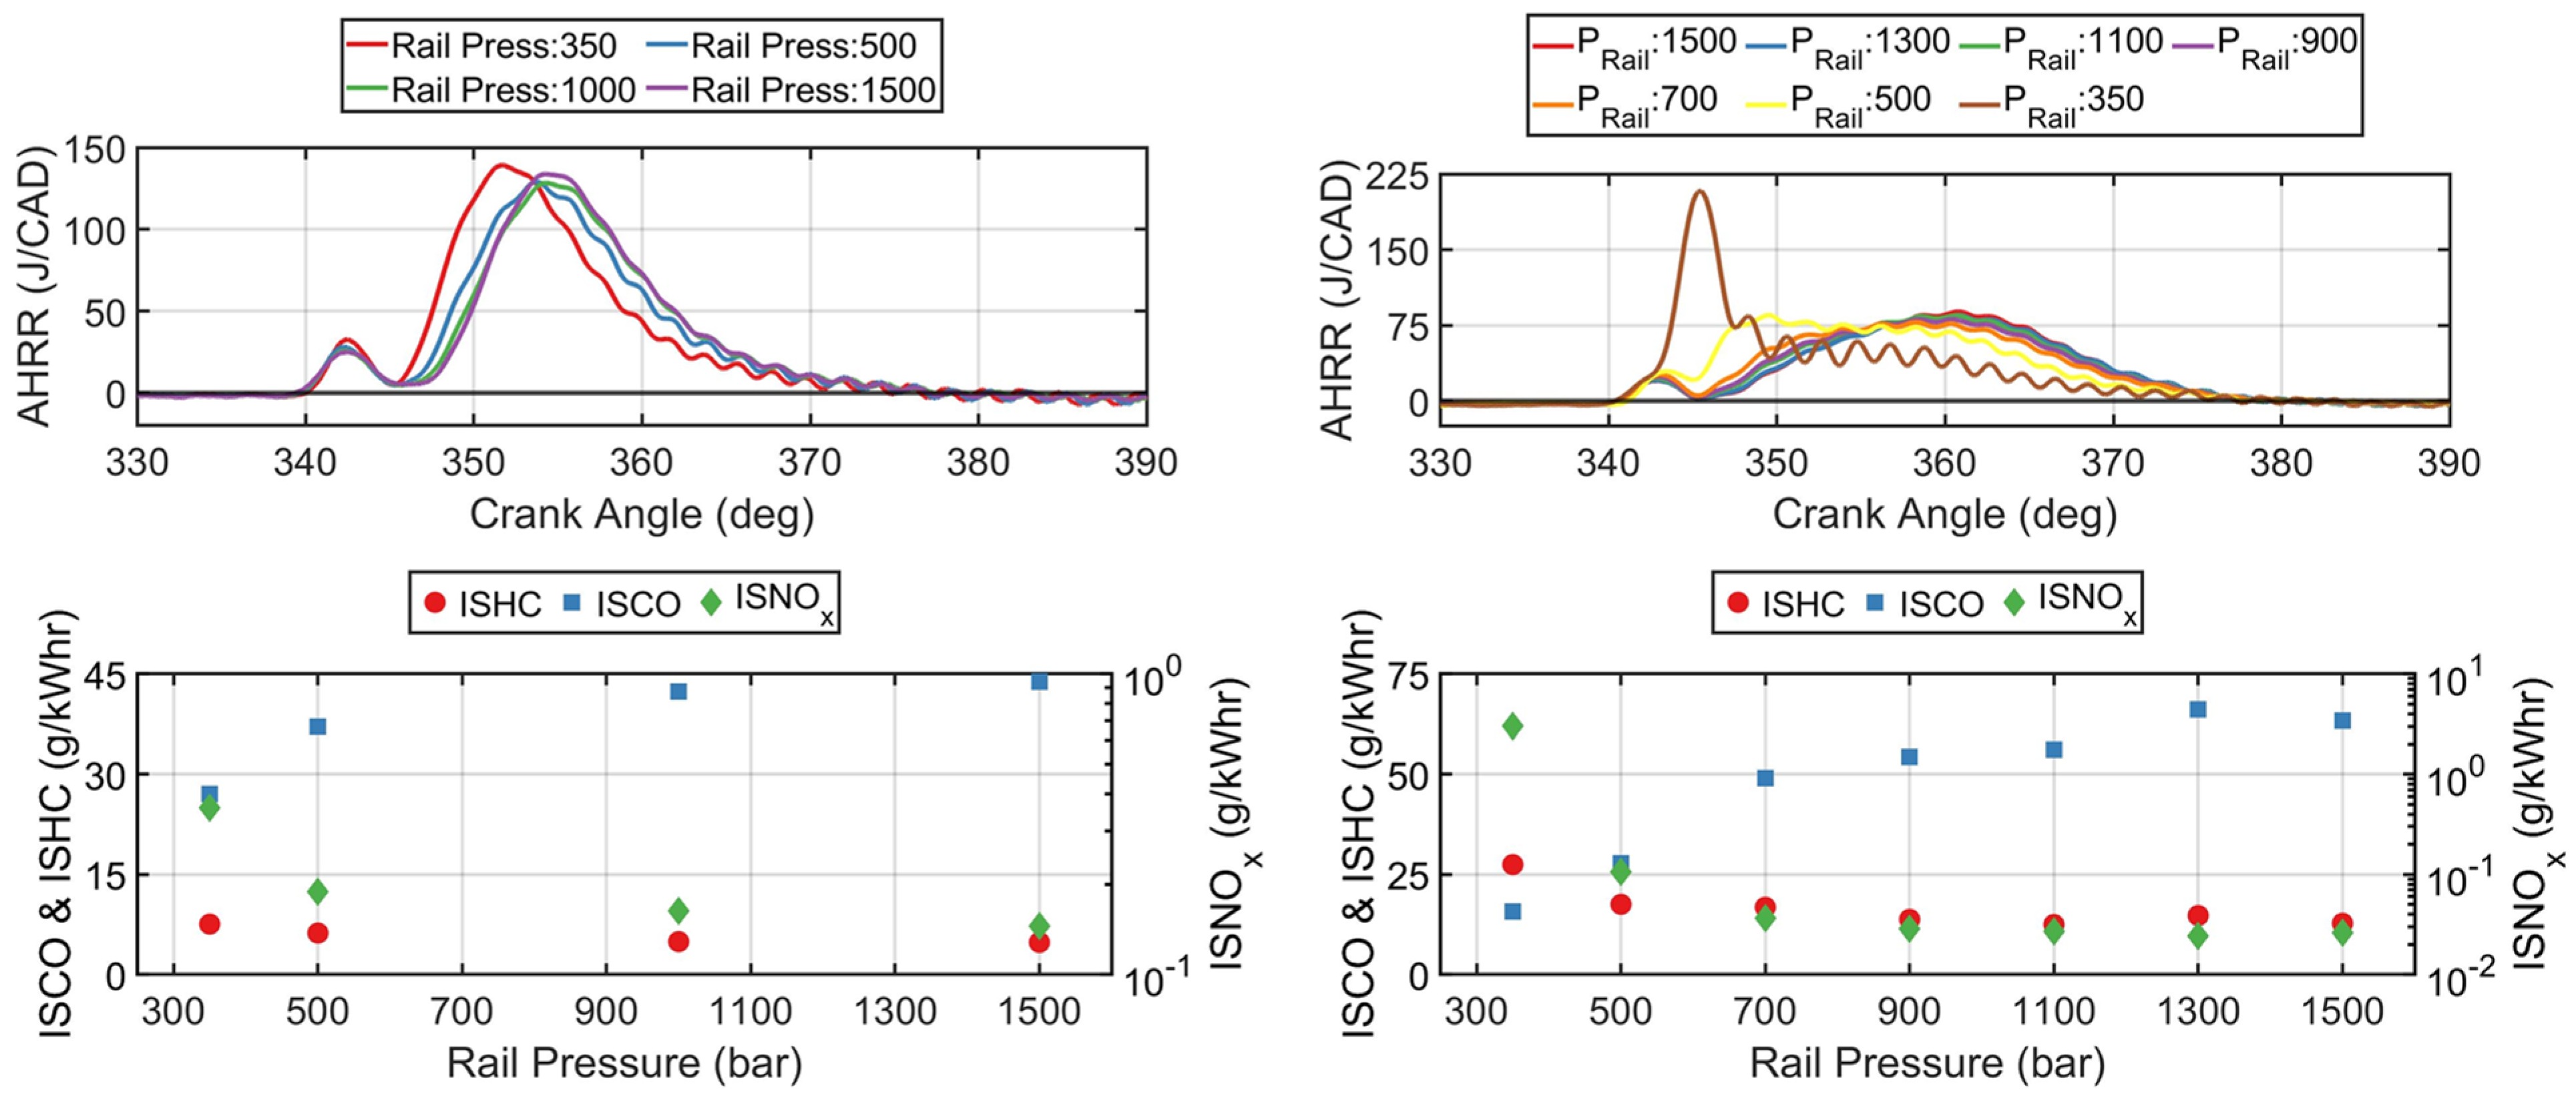
3.5. Step 4: Rail Pressure Sweep
Rail pressure has been shown to impact dual-fuel emissions in the literature [
30,
31]. The AHRR and emissions values for both fueling combinations are shown in
Figure 18. Interestingly, the rail pressure effects on dual-fuel emissions observed in this work are different from trends previously observed in the literature. The differences may have been caused by the close-coupled (or short-dwell) strategy chosen in the present work for multiple injections and the relatively lower
PES conditions chosen for the rail pressure sweep. For example, Bartolucci et al. [
30] observed a decrease in the CO emissions for higher rail pressures, albeit for a long dwell between the multiple injections as opposed to close-coupled multiple injections used in the present work. In a similar fashion, Hariharan et al. [
31] showed an improvement in the efficiency–emissions tradeoffs when increasing the rail pressure. By comparison, as shown in
Figure 17, the ISCO decreases when rail pressure is decreased for both fueling combinations. The explanation for the differences from this study and the previous literature could be due to the differences in
PES between the studies and possibly due the use of long-dwell injections in previous studies compared to the close-coupled injections employed in the present study. The literature examples used
PES values of 75% or higher for diesel–NG, whereas for diesel–NG operation in this study, a
PES of 50% was used. The higher amount of diesel, combined with close-coupled early injections, likely resulted in some spray impingement on the walls of the combustion chamber at higher rail pressures. This would lead to partial burning of the diesel and less active combustion spread in the surrounding NG–air mixture, potentially leading to higher CO emissions. The higher rail pressures could also be contributing to an over-leaning of the local fuel–air mixture (caused by the increased mixing due to higher spray momentum), which can inhibit complete fuel oxidation.
Differences are also evident in how rail pressure affects the AHRR curves when comparing diesel–NG and POMDME–NG combustion. For diesel–NG combustion, the AHRR curve is minimally affected when rail pressure is changed from the baseline pressure of 500 bar. POMDME–NG combustion, however, shows a much more pronounced change in the shape of the AHRR, with the 350-bar rail pressure case exhibiting a very high peak AHRR compared to the other rail pressures. This likely explains why ISNOx increases, since there are likely higher local temperatures due to the more intense AHRR profile for 350-bar rail pressure.
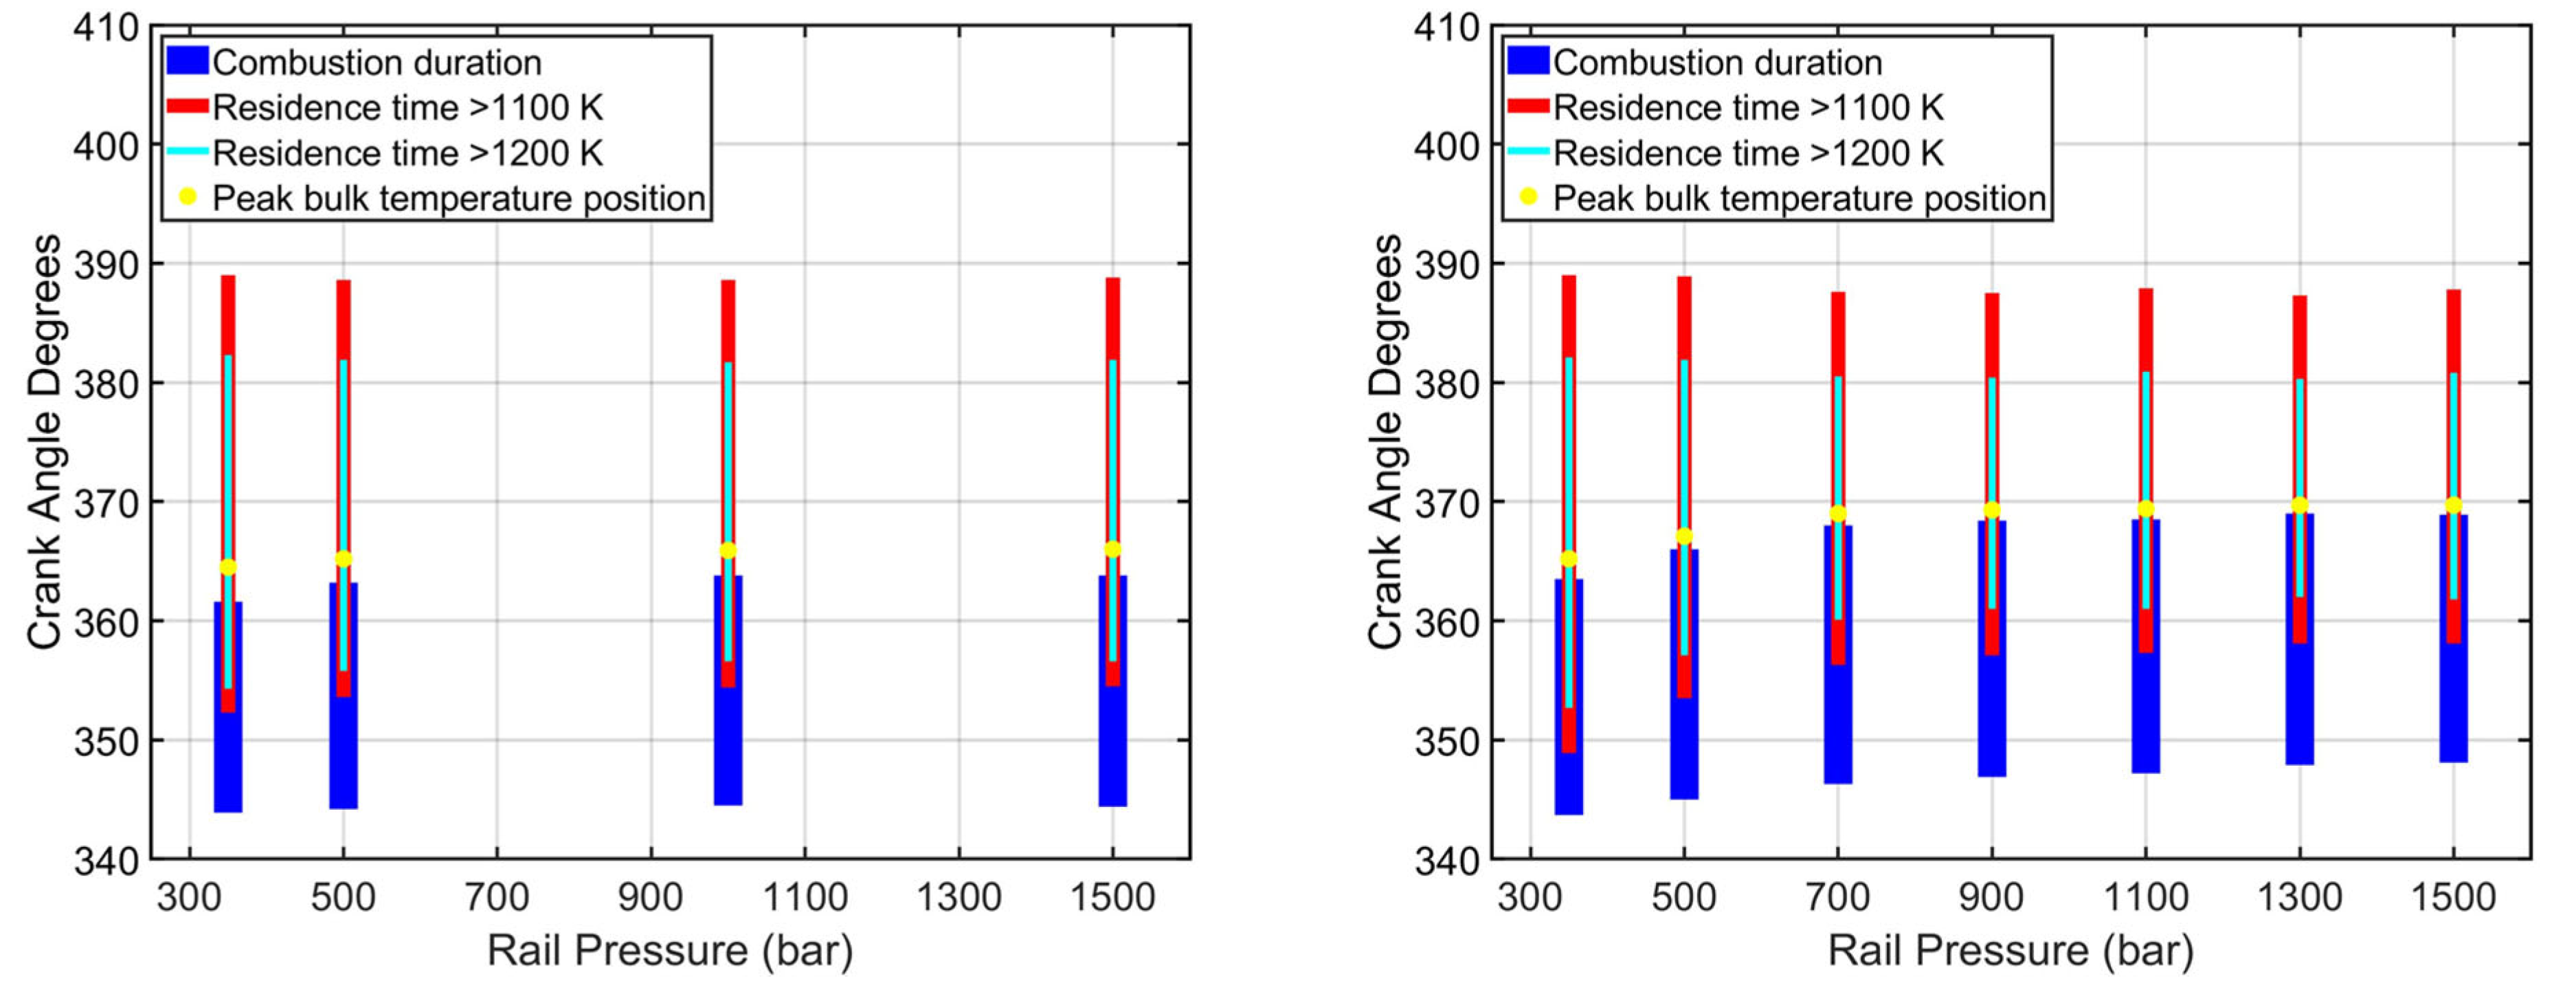
As noted previously, the residence time plots (shown in
Figure 19) for diesel–NG and POMDME–NG combustion provide insights into the ISCO reductions at low rail pressures. For both fueling combinations, the calculated threshold temperatures were the same, with the 10% and 20% cutoffs being 1200 K and 1100 K, respectively. The rail pressures of 1000 bar and 1100 bar were chosen for diesel–NG and POMDME–NG combustion, respectively, for the subsequent boost pressure sweep. Even though these rail pressures actually led to higher ISCO emissions compared to 500 bar, which was used in step 3, the ISNO
x decreased slightly, and the ISHC also improved for POMDME–NG combustion. Therefore, the higher injection pressures were preferred.
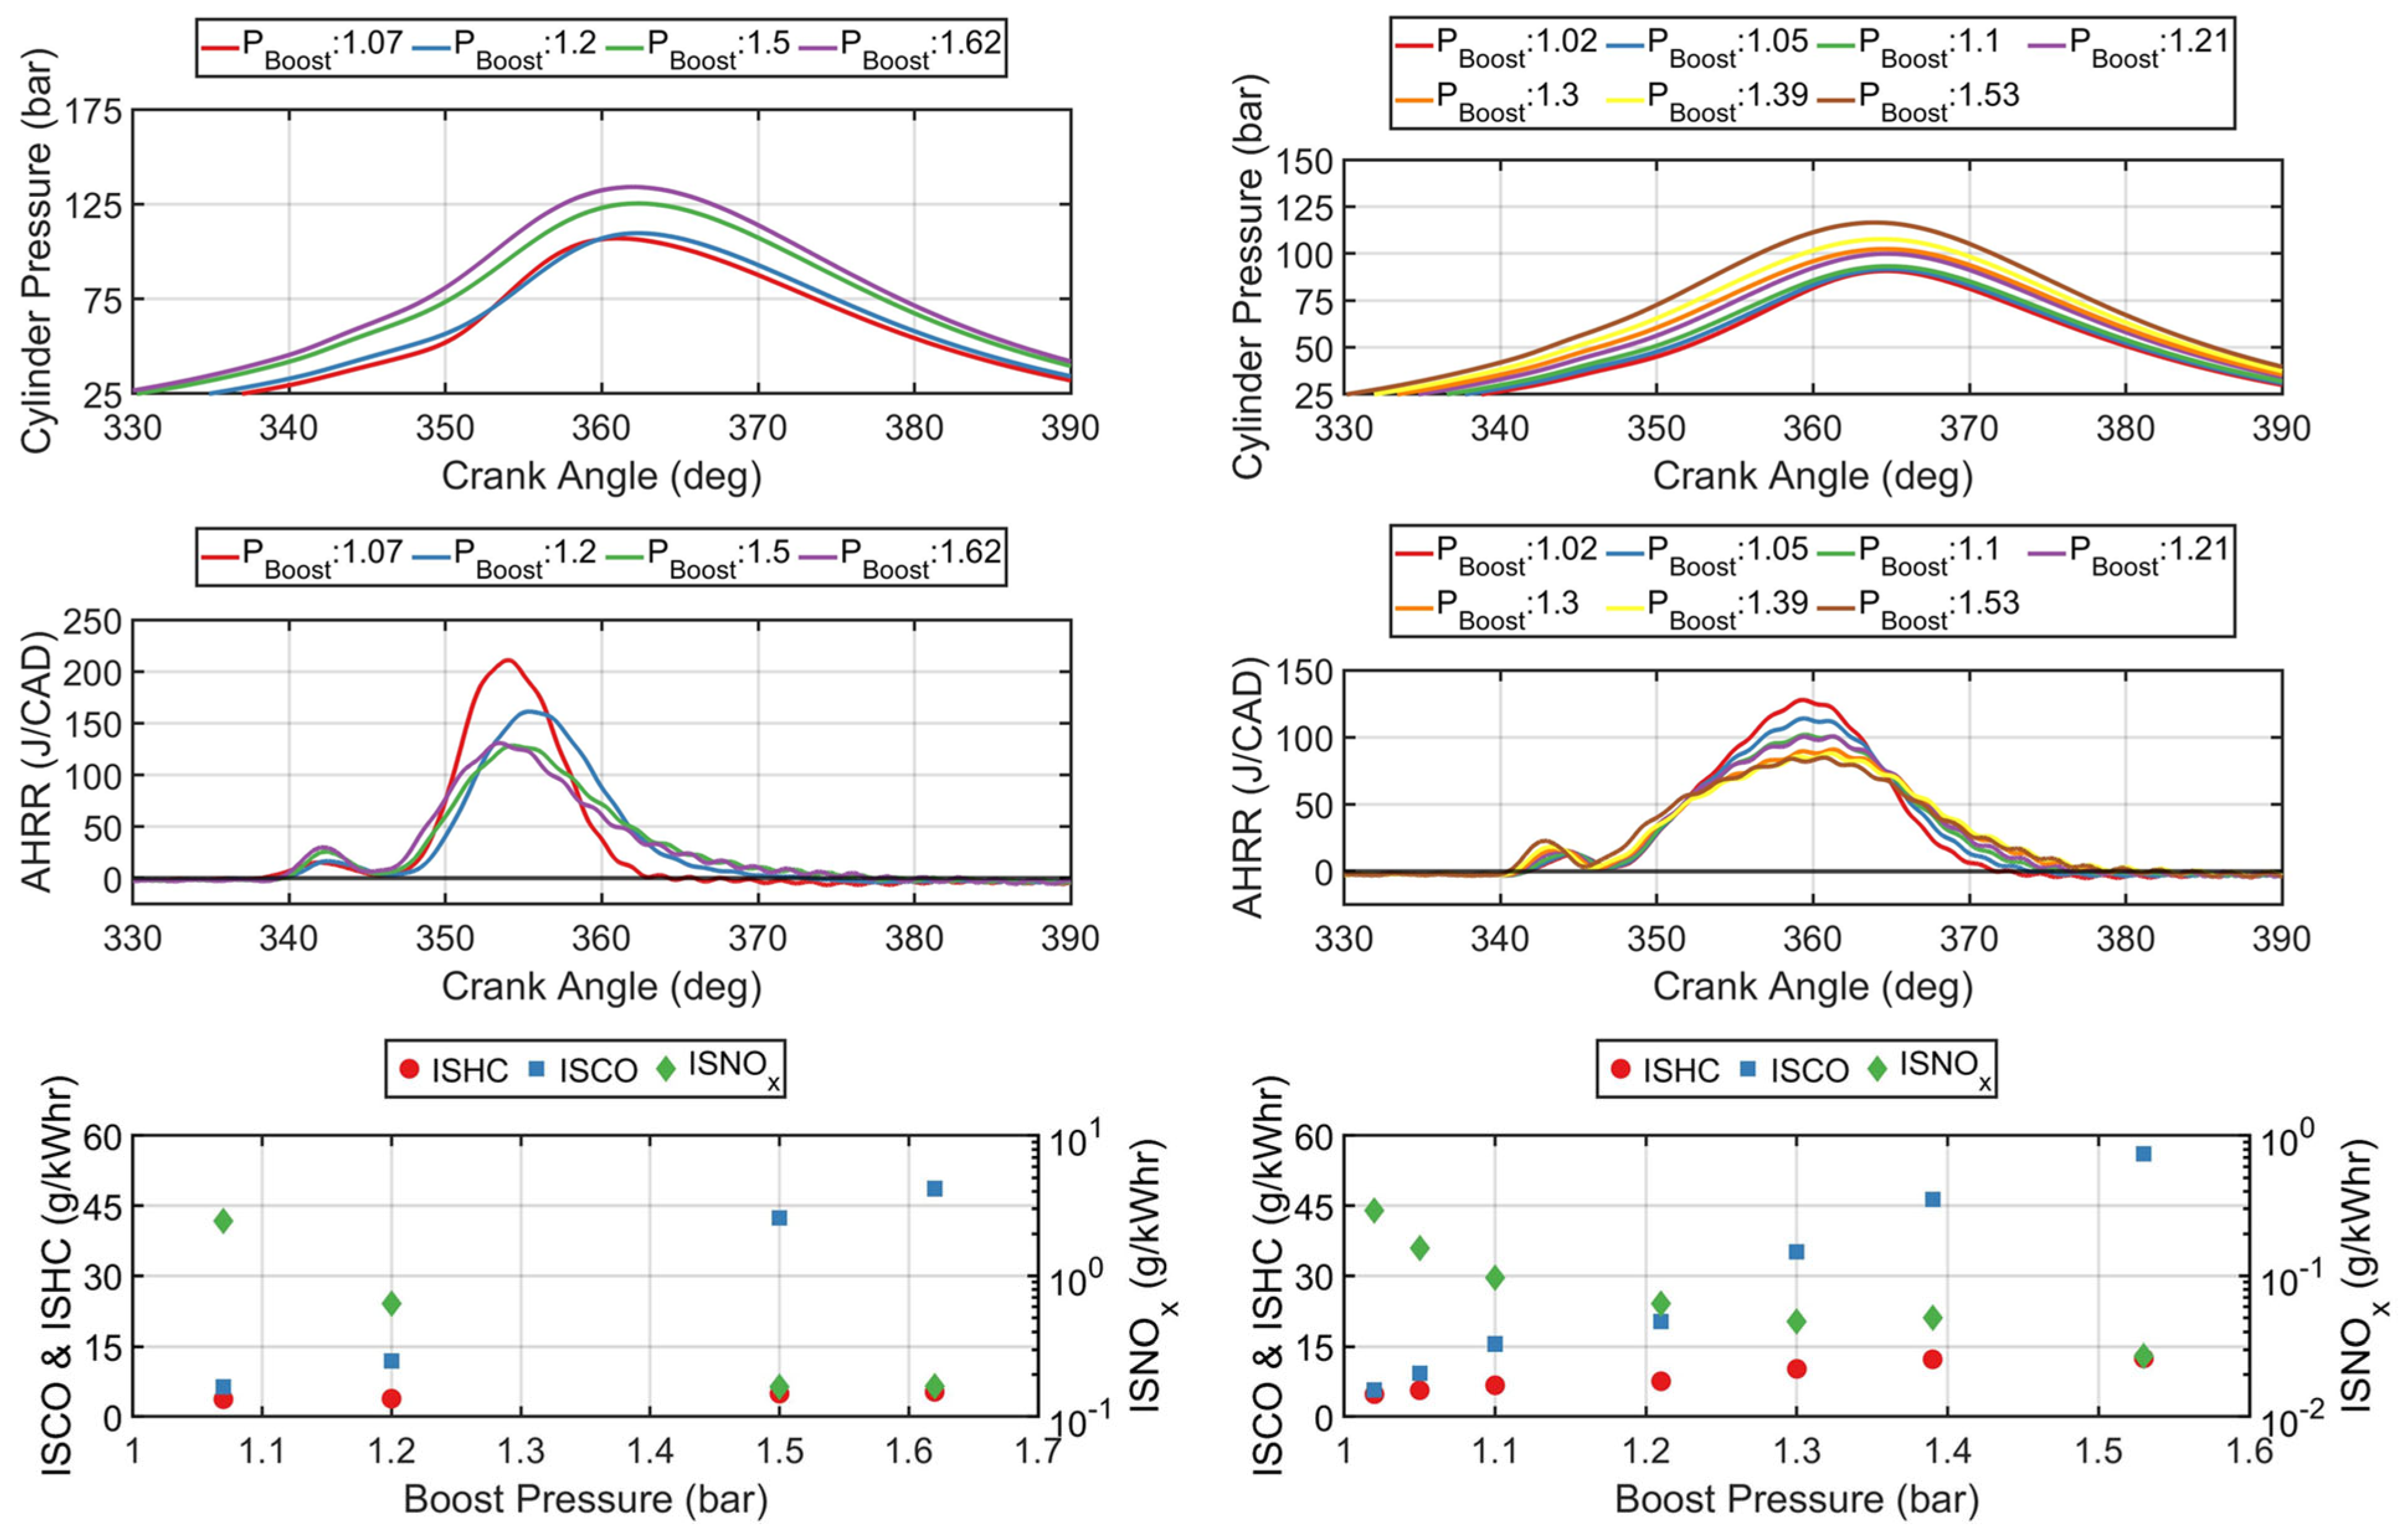
3.6. Step 5: Absolute Boost Pressure Sweep
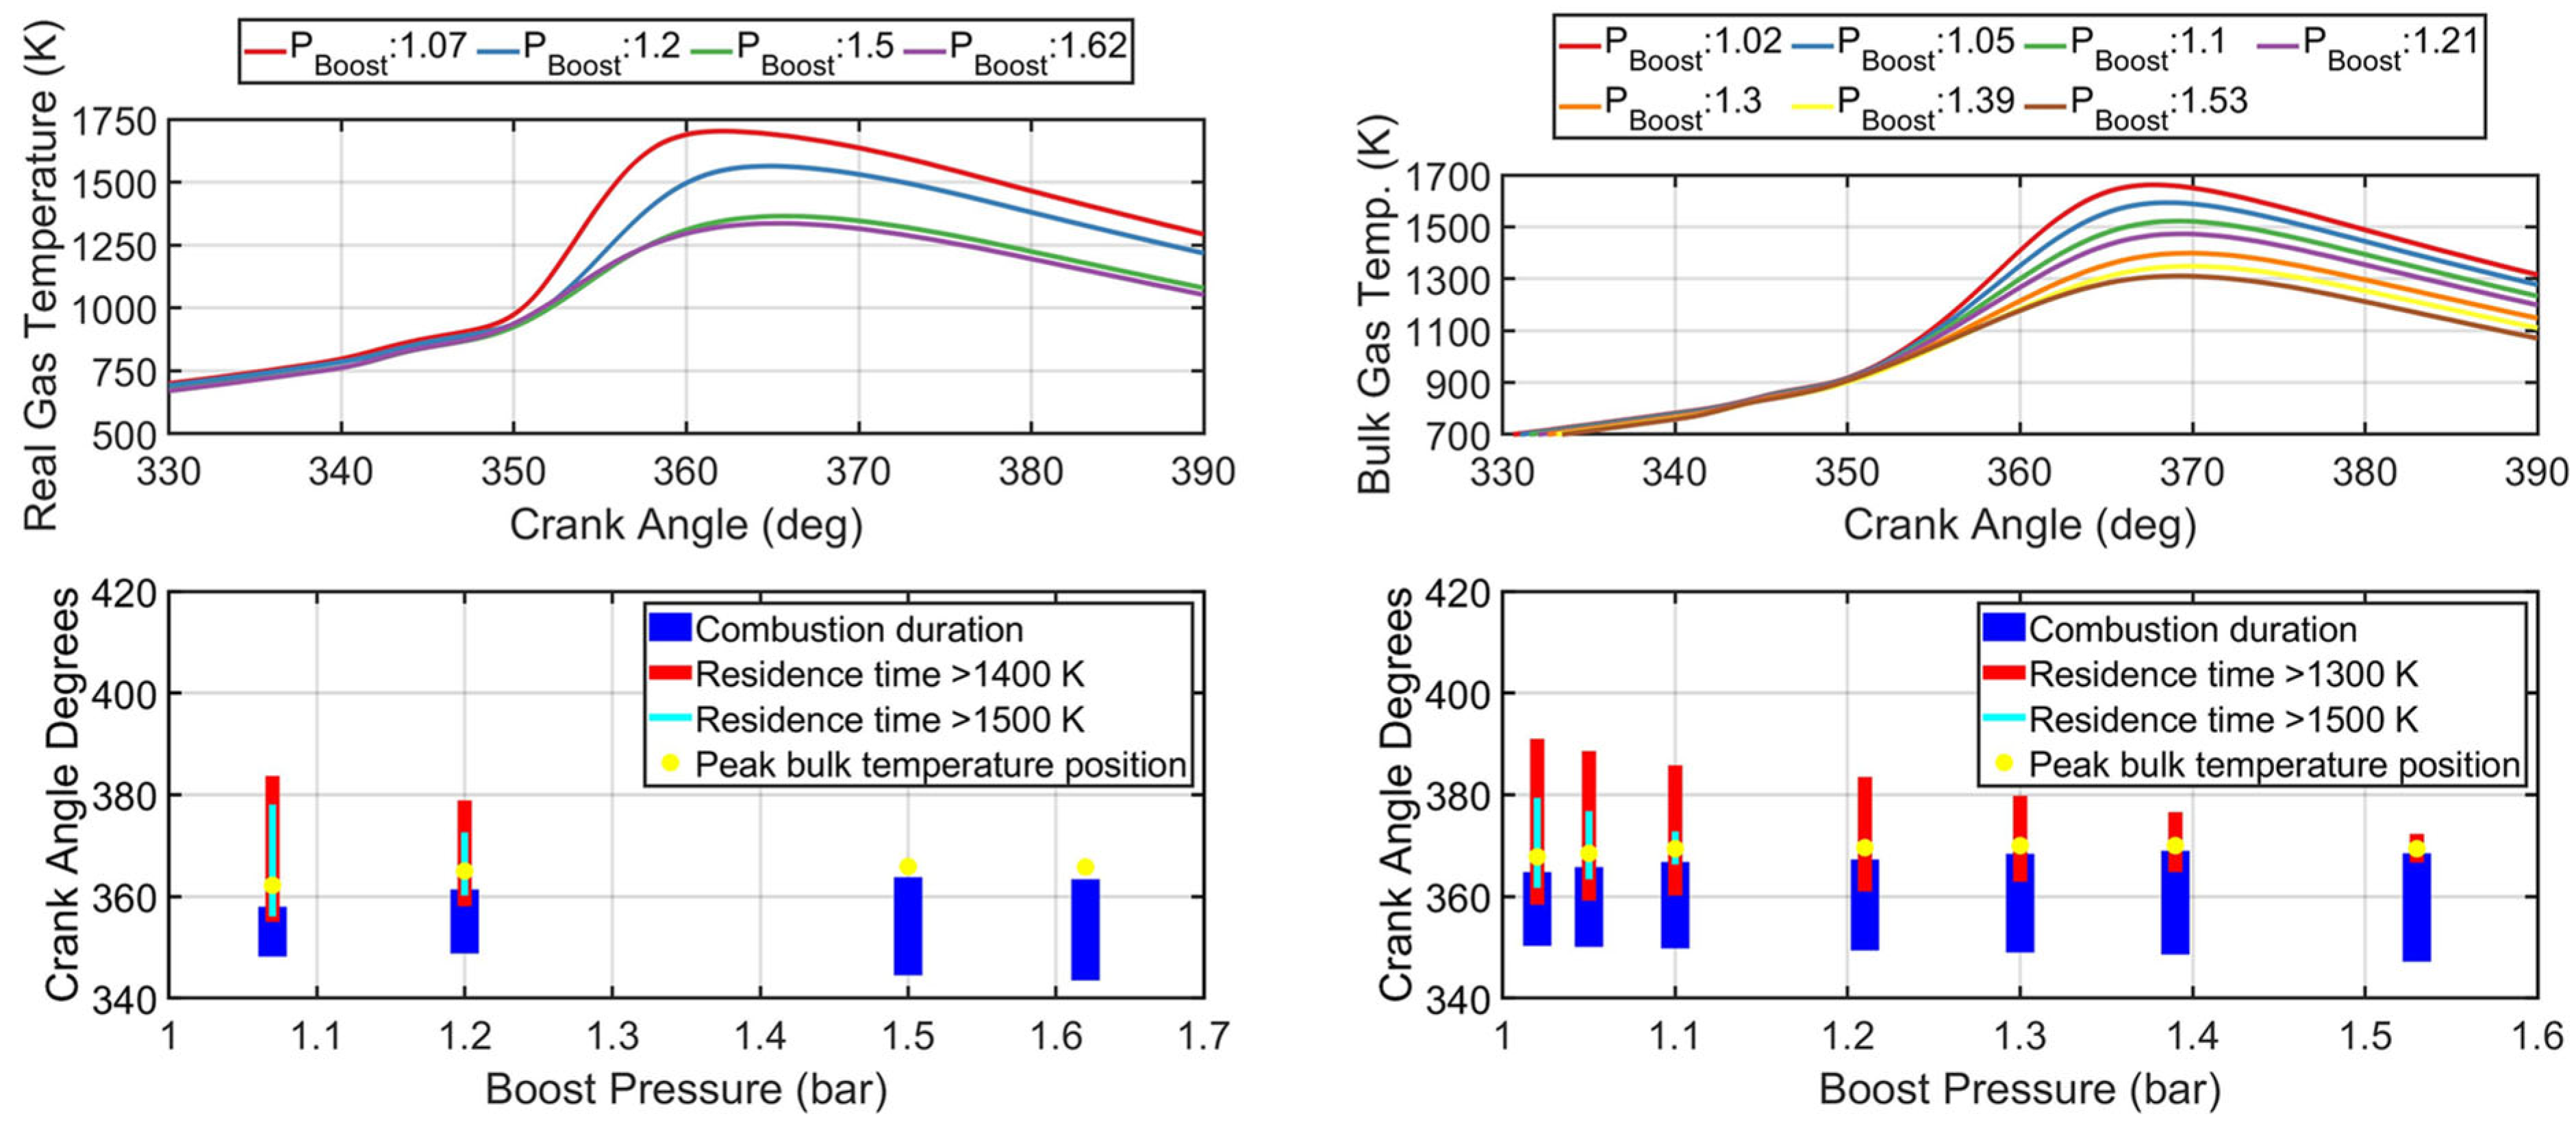
The intake boost pressure is an important lever that is known to affect DFLTC. By reducing the boost pressure, the air flow rate will decrease for a given engine speed, leading to higher global φ values and higher in-cylinder temperatures The cylinder pressure, AHRR, and emissions for the boost pressure sweep from nearly naturally aspirated conditions (~1.02–1.07 bar) to a slightly higher than baseline boost pressure of 1.6 bar are shown in
Figure 20 for both fueling combinations. Overall cylinder pressures, including peak cylinder pressures, decrease as the intake pressure is decreased. This is intuitive since the pressure at TDC for a given engine speed is directly dependent on the compression ratio and the pressure at the start of the closed portion of the cycle, which is reduced as intake pressure decreases. The peak AHRR, on the other hand, increases as the boost pressure is decreased for both fuel combinations. As boost pressure is reduced, the air flow into the cylinder is reduced, leading to higher overall equivalence ratios and the likely presence of more locally rich areas within the cylinder, ultimately resulting in higher local temperatures, faster rate of heat release, and higher peak AHRR values. The ISCO emissions dramatically decrease for both fuel combinations with decreasing boost pressures, with ISCO values under 10 g/kWh at low boost pressures. This ISCO reduction is accompanied by higher ISNO
x emissions, and this tradeoff can be explained better using the in-cylinder bulk gas temperature and residence time trends shown in
Figure 21.
Peak bulk gas cylinder temperatures increased as the boost pressure reduced. This directly led to longer residence times for which high bulk gas temperatures persisted. For the baseline 1.5 bar boost pressure, with baseline diesel–NG combustion, no residence time above the calculated thresholds was ever registered. For POMDME–NG combustion, however, finite residence times were observed above the 20% threshold at the higher boost pressures. In general, the longer residence times allowed for more complete CO oxidation within the cylinder, thereby reducing the ISCO emissions. Moreover, the faster combustion process likely led to higher local temperatures, resulting in higher ISNOx emissions. ISHC emissions decreased slightly (for POMDME–NG) or remained nearly invariant (for diesel–NG) throughout the boost pressure sweep. With fumigation of NG as the LRF in DFLTC, most of the ISHC emissions may be expected to be unburned methane arising either from the cold crevice regions or from bulk gas quenching. With the lower in-cylinder densities accompanying lower boost pressures, the mass of unburned NG–air mixture trapped within the crevices may be expected to decrease, leading to lower ISHC emissions. However, the relative invariance in ISHC emissions with boost pressure for diesel–NG combustion indicates that the impact of reducing crevice trapped mass on ISHC at lower boost pressures is minimal for this engine at these specific operating conditions.


 ,
, 


