2. Literature Review
In recent times, scholars have conducted multi-objective optimization research concerning low building energy consumption and thermal comfort. Their primary focus has been on examining the interaction between optimization algorithms and simulation tools.
Regarding optimization algorithms, several studies have been conducted. Caldas et al. focused on office buildings, considering factors associated with different orientations and exterior windows as variables, with total building energy consumption as the optimization objective [
2]. Magnier examined building equipment and envelope structure as variables, utilizing the Non-dominated Sorting Genetic Algorithm-II (NSGA-II) algorithm combined with the ANN algorithm to target building energy consumption and thermal comfort as optimization objectives [
3]. Yuan Fang et al. centered on the design of external windows in office buildings. They simulated building performance using the Grasshopper platform and Ladybug and Honeybee plug-in, analyzing the impact of these windows on energy consumption and proposing relevant optimization strategies [
4]. Li Haiquan proposed a multi-objective building energy-saving model based on a genetic algorithm, focusing on parameters such as body shape coefficient and windward area [
5]. Benedek Kiss explored a multi-objective optimization technique, specifically the Direct MultiSearch method, applied to a case study involving a multi-story residential building [
6]. Giouri ED investigated the exterior windows of high-rise office buildings, analyzing their influence on energy consumption and proposing corresponding optimization strategies [
7]. Badr Chegari utilized a multi-objective optimization method based on an intelligent agent model, employing machine learning tools like ANN and the MOPSO algorithm for optimization [
8]. Facundo Bre introduced an effective method involving metamodels for solving multi-objective optimization problems in building performance, combining NSGA-II with an artificial neural network (ANN) metamodel [
9]. Aiman Albatayneh conducted a sensitivity analysis (SA) using the Design Builder software Version 6.1 package, assessing 12 design variables simultaneously for their impact on heating and cooling loads through regression methods [
10].
Regarding the interaction of simulation tools, Ehsan Asadi investigated existing external wall insulation and other envelope structures as components. They considered building energy consumption and thermal comfort as optimization objectives and conducted research using GenOpt and MATLAB Version 8.0 [
11]. Erlendsson focused on the effective lighting level within residential atrium spaces. They utilized the Grasshopper platform and Honeybee plug-in to study the impact of glass size and material in atriums [
12]. E. Belloni and colleagues investigated a novel aerogel glazing system (AGS) employing a simulation model to calculate the annual energy demand of a reference building in Tokyo. Through building performance simulation, it was demonstrated that AGS could reduce energy requirements in cold climates, concurrently decreasing the consumption associated with heating, cooling, and lighting [
13]. Benedek Kiss introduced a modular parametric optimization framework for a multi-apartment building. The framework has key components including geometry, shell structure, installation, and heating energy. It integrates advanced building modeling, life cycle assessment (LCA), energy calculations, and environmental optimization methods, both single and multi-objective [
14]. Zhang Anxiao’s research centered on primary and secondary schools in cold areas. They aimed to optimize building energy consumption and room thermal comfort, employing multi-objective optimization theory and algorithms to verify the feasibility of a multi-objective optimization platform [
15]. Yang Zhao and associates conducted a study on the thermal comfort of semi-outdoor spaces within a university building in Guangzhou, China, utilizing questionnaires for evaluation. The results revealed that both air temperature and mean radiant temperature within the courtyards were notably elevated. Planting trees in these courtyards could reduce the Physiological Equivalent Temperature (PET) from “very hot” to “hot”, thereby aiding in the improvement of thermal comfort [
16]. Erminia Attaianese and her team proposed an integrated method for creating sustainable indoor architectural environments, emphasizing Indoor Environmental Quality (IEQ) and overall building quality. They validated this approach through a subjective survey carried out at the University of Salerno’s Fisciano Campus in Italy [
17]. Liu Qianqian’s study considered envelope structure factors as optimization variables, focusing on building energy consumption, lighting environment, and renovation economic cost. They utilized Rhino and Grasshopper for multi-objective optimization, examining objective optimization during the design phase of neural networks [
18].
Table 1 presents a more systematic representation of the literature on achieving low building energy consumption and enhancing thermal comfort.
Upon reviewing existing research, several key observations emerge:
(1) In the realm of architectural optimization design, intelligent parametric design and optimization algorithms have progressively become commonly utilized methods in architecture. This is particularly evident in the comprehensive platforms based on Grasshopper.
(2) Using multi-objective optimization to improve building energy efficiency mainly centers on integrating various algorithms to optimize building structure, design, envelope, and equipment. This approach aims to enhance both energy efficiency and overall comfort levels.
(3) Research on integrating parametric building design and performance simulation is limited. More specifically, there is a shortage of studies that utilize multi-objective optimization algorithms within the context of campus public buildings, particularly when examining student centers.
Drawing from the aforementioned existing research, this study focuses on the student center in China. The research leverages the Grasshopper platform for building performance simulation analysis alongside a multi-objective optimization module to analyze the current state and outcomes of computer simulations. The aim is to identify existing issues in the usage of university student centers, considering key evaluation criteria for energy-saving design in public buildings. Subsequently, the study focuses on two primary goals: reducing building energy consumption and enhancing indoor thermal comfort. It reforms and optimizes the main factors influencing energy conservation in buildings. The innovation of this study lies in integrating the establishment of parameterized building models, building performance analysis, and multi-objective algorithm optimization on the same platform, avoiding errors in data exchange and repeated modeling between traditional platforms. Comparing the results of the optimization scheme with the initial simulation data of the building model, a comprehensive analysis is conducted to derive energy-saving optimization strategies for the student center. This study introduces fresh insights and theoretical references for architectural design methodologies specific to university student centers, considering regional climate characteristics in China.
3. Methodology
3.1. Morphological Characteristics of University Student Centers in China
Alongside the continuous evolution of modern college education concepts, the student center has become an integral part of campuses, drawing widespread attention due to its distinctive architectural characteristics and functionalities. Referring to pertinent content in “China’s Architectural Design Data Set” (3rd edition) [
35], functional types are summarized in
Table 2. Given the inclusive and diverse nature of student centers, organizing their interior spaces must not only ensure the autonomy of each functional room and the distinction between active and quiet areas but also prioritize flexibility in usage and the integration of various functions. Following the guidelines outlined in “Code for the Architectural Design of Cultural Centers” JGJ/T 41-2015 [
36] and relevant specifications in the Architectural Design Data Set (3rd edition), plans are primarily categorized into three types (centralized combined type, series combined type, and courtyard enclosed type), as illustrated in
Table 3.
Although factors such as geographical location, environment, university scale, and construction period vary among colleges and universities, the functional types of student centers across these institutions are fundamentally similar. However, spatial organization is influenced by geographical conditions and climate characteristics. This study employs a literature review, map consultation, and site visits. Several student centers in Beijing, Tianjin, Nanjing, Guangzhou, Xi’an, and other cities were investigated. Due to space constraints,
Table 4 presents eight representative university student centers in China.
Through investigation, we observed distinctive characteristics in the function and utilization of the student center, primarily manifested as follows:
(1) Functional diversity: The student center integrates educational, social, and recreational functions, offering adaptable space to address diverse needs.
(2) Layout response to climate: As depicted in
Table 4, student centers in southern regions predominantly adopt series and courtyard layouts, while in the north, centralized layouts prevail.
(3) Integration of spaces in varied scales: The design of the student center encompasses extensive areas such as halls, medium-sized spaces like activity and rehearsal rooms, and smaller spaces including offices and service rooms. The combination, utilization, and management of these spaces are notably intricate.
(4) Unique utilization patterns: The peak usage of student centers differs significantly from teaching buildings; it tends to concentrate more during after-school hours, including nights and non-class periods, and particularly on weekends.
3.2. Typical Case Study
This study chose a university student center located in Xi’an, Shaanxi Province, northern China for several reasons:
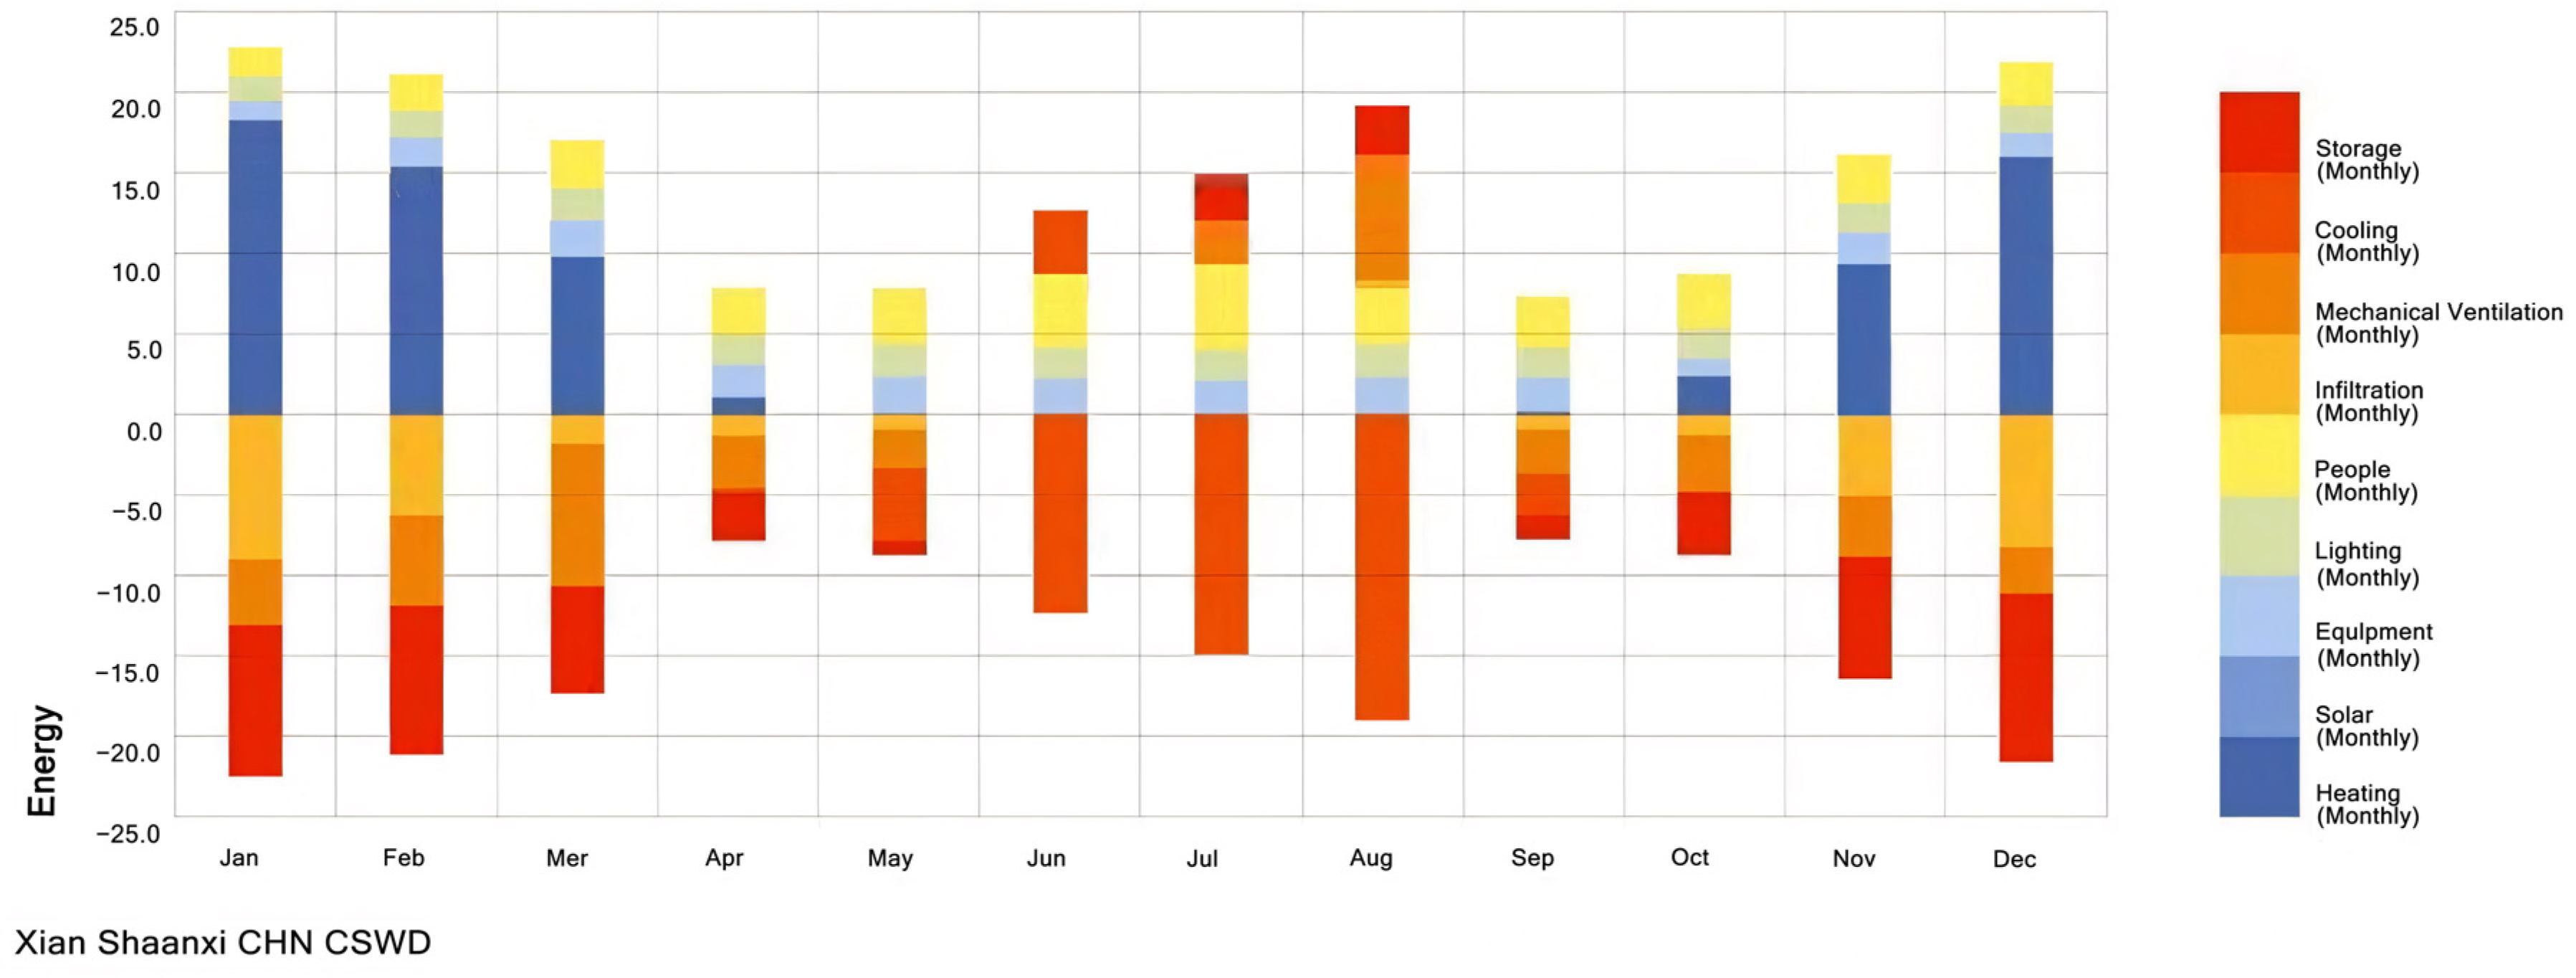
(1) The Xi’an region is situated in a cold zone with a warm temperate continental monsoon climate, characterized by distinct cold, warm, dry, and wet seasons. Buildings in this area must meet insulation design requirements and consider natural ventilation and shading design. Additionally, Xi’an is home to numerous universities with extensive building areas. The prevalence of high energy consumption without adequate indoor thermal comfort maintenance, particularly among major universities in the area, underscores the need for research and optimization of the thermal environment in academic buildings. Findings from this region can provide valuable insights for buildings in other cold regions.
(2) China has a substantial inventory of “non-green” buildings characterized by low energy utilization and high operating energy consumption. With the introduction of the “dual-carbon” target, the green and energy-saving renovation of existing buildings is poised to become the prevailing trend in China’s construction industry.
(3) Research reveals that some previously constructed student center buildings were constrained by factors such as outdated building energy efficiency standards, materials, technology, and equipment. Issues such as obsolete heating equipment, aging power lines and envelope structures, severe condensation, mold growth in indoor corners, and peeling of inner wall finishes have become increasingly prominent. The inadequate thermal performance of envelope structures results in indoor heat loss, elevated building energy consumption, and challenges in maintaining comfortable indoor temperatures.
(4) The existing research literature predominantly focuses on the spatial design of student centers, neglecting building performance and physical environment optimization design. Therefore, this study aims to explore energy-saving optimization design concepts and plans for this building type. The findings will facilitate improved operation, construction, and maintenance of student center buildings.
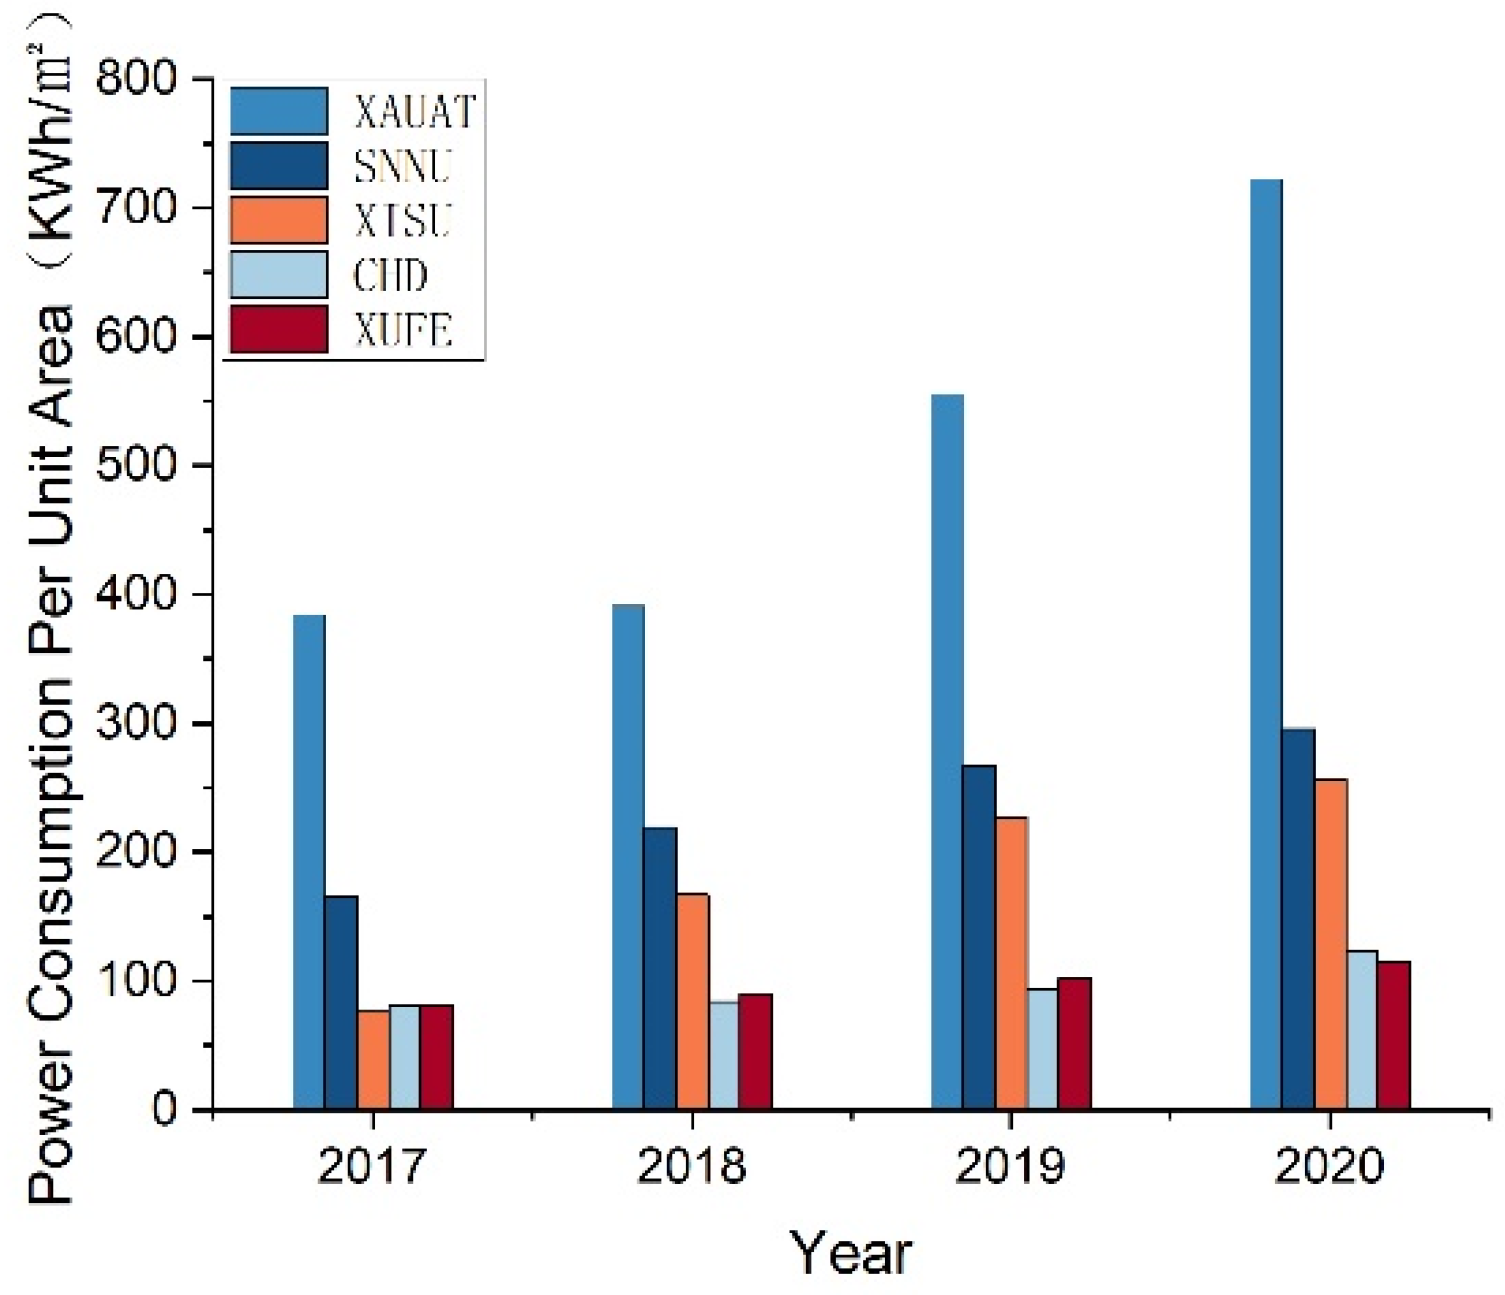
This study conducted a large-scale survey on student centers in universities in Xi’an, and selected 5 representative student centers constructed after 2000 as research cases for detailed investigation. The reason for selecting cases after 2000 is that during the investigation, it was found that some older student centers have been abandoned or repurposed, and lack good renovation value. These 5 universities represent the disciplines of liberal arts, science, and engineering in the Xi’an region, include Chang’an University (CHD), Xi’an International Studies University (XISU), Xi’an University of Finance and Economics (XUFE), Shaanxi Normal University (SNNU), and Xi’an University of Architecture and Technology (XAUAT). An overview of the case study buildings is provided in
Table 5.
We visited the management departments of five universities and obtained the completion drawings of the student centers, along with the total electricity consumption data of the buildings from 2017 to 2020. We discovered that all the student centers operate upon central air conditioning for cooling (electricity consumption) indoors in summer and centralized heating (natural gas) for indoor spaces in winter. It is observed that the total power consumption and power consumption per unit area of the student centers have consistently increased annually over the past four years, as depicted in
Figure 1 and
Figure 2. These buildings, due to their comprehensive nature and combination of variously sized spaces, demonstrate low continuity in space utilization. The interior space of the building presents distinct usage requirements based on different functional divisions. During the construction phase, energy conservation considerations were not given significant priority. Combined with the effects of aging and wear during the building’s use, it currently experiences poor thermal comfort and high energy consumption. Consequently, it fails to meet present-day requirements for energy conservation and consumption reduction, posing challenges in maintaining a comfortable indoor environment.
Considering the characteristics of the student center outlined above, including layout, spatial design, and usage features, and in conjunction with the fact that China issued the “Design Standard for Energy Efficiency of Public Buildings” GB50189-2005 [
37] in 2005, this study ensures the comprehensiveness and integrity of relevant data. As a result, the CHD student center is chosen as the specific research subject. Despite being constructed in 2004, the building lacked comprehensive energy-saving measures during construction. It presents a non-energy-efficient structure with a simplistic envelope design, inadequate thermal insulation, and numerous energy-related issues.
3.3. Numerical Simulation
3.3.1. Setting Parameters for Typical Case Model
To examine the correlation between the building design of the student center and its impact on energy consumption and thermal comfort, this study utilized the Design Builder software package to simulate the case study. Climate data and building parameters were employed to parameterize elements such as building form, orientation, envelope structure, and other factors [
9]. Simulation parameters were established following the calculation guidelines for physical properties of commonly used building materials, as outlined in Appendix B of the “Code for Thermal Design of Civil Buildings” GB 50176-2016 [
38], and were based on the construction drawing practices of existing typical case models. Notably, the CHD Student Center lacks insulation material in its exterior walls and roof.
3.3.2. Basic Parameters of Heat Source in the Room
The model parameters were set in line with the actual characteristics of the case building, encompassing metrics such as the per capita area and room occupancy rate, the energy consumption rate of lighting and equipment per unit, lighting power density, switching times, and operational periods of the building’s air conditioning and heating system [
39]. Specific configurations are outlined as follows:
(1) Per capita area and occupancy: The area per person is set at 6 m
2; activity energy is 70 W; the thermal resistance unit of clothing is specified as ‘clo’, the occupants can adjust clothing according to their thermal feelings. Based on the Evaluation Standard for Indoor Thermal Environment in Civil Buildings GB/T 50785-2012, according to normal office clothing, when occupants wear thin pans and short-sleeve shirts, clo = 0.50 in summer; when occupants wear long-sleeve shirts, trousers, warm jackets, and long sleeved and pants underwear, clo = 1.2 in winter [
39,
40].
(2) Lighting and equipment energy consumption per unit area indoors: Lighting power density is 9 W/m², triggering lamps when the working surface illumination falls below 500 lx. Fresh air volume is 30 [m3/(h)], and electrical equipment power density is 15 W/m2.
(3) Operational schedule for public university buildings: Electrical equipment, room occupancy, and lighting have flexible timings, operating 7 days a week from 8:00 am to 10:00 pm based on the University’s activity center usage. Lamp operation is limited to this period.
(4) Air conditioning and heating system operation: The cooling temperature is set to 26 °C, and the heating temperature to 18 °C [
41]. Fan operation is synchronized with the student center’s schedule, and inactive during other times. The study focused solely on indoor energy consumption and thermal comfort, excluding fan and coil models that might affect energy usage. Annual energy consumption calculations encompass cooling, heating, lighting, and other equipment.
After conducting field investigations on student centers in Xi’an, a representative typical building case was selected for parametric modeling and subsequent building performance simulation. Considering the climate characteristics of Xi’an, simulation analyses were conducted to assess building energy consumption and indoor thermal comfort. These simulation outcomes serve as a comparative data set for the optimization design scheme detailed in the subsequent paper. Illustrated in
Figure 3 is a schematic diagram depicting the process and platform for building performance analysis.
3.4. Simulation of Energy Consumption and Thermal Comfort
3.4.1. Accuracy Verification of Typical Cases
Before conducting a building performance simulation, it is crucial to validate the accuracy of the model and the software’s parameter settings. In this study, the measured outdoor temperature and humidity in Xi’an on 6 July 2021, were compared with the software-simulated data for verification. This comparison is depicted in
Figure 4,
Figure 5 and
Figure 6.
By organizing the measured data from outdoor measuring points, the results of outdoor simulations were compared against them. To simplify calculations, some simulation parameters were set to an ideal state. Consequently, the simulated outdoor humidity measurement points may register higher than the actual measurements, but they consistently reflect the trends of each measurement point. Upon comparison, the disparity between simulated temperature and humidity values and the measured values at various times of the day is less than 10%. This indicates that the software simulation results are largely in line with the test results, validating the feasibility of the software model and parameter settings.
3.4.2. Simulation Analysis of Energy Consumption
In this study, the Ladybug and Honeybee plug-in is used to calculate annual heating energy consumption, cooling energy consumption, artificial lighting energy consumption, and other equipment energy consumption to obtain annual comprehensive building energy consumption and comprehensive energy consumption per unit area. The visual results of building energy consumption and its data are depicted in
Figure 7.
As depicted in
Figure 7, the annual energy consumption analysis of the CHD Student Center reveals a total energy consumption of 183.57 kW·h/m
2 per unit area, with an accumulated annual heat consumption of 82.15 kW·h/m
2. The primary cause for this lies in the aging of the envelope structure and excessive heat transfer coefficient. During winter, the primary heat loss occurs through the envelope, while in summer, air conditioning is predominantly used for interior comfort. Addressing this issue requires further optimization of the envelope and shade design, particularly for summer conditions.
3.4.3. Simulation Analysis of Indoor Thermal Comfort in Typical Buildings
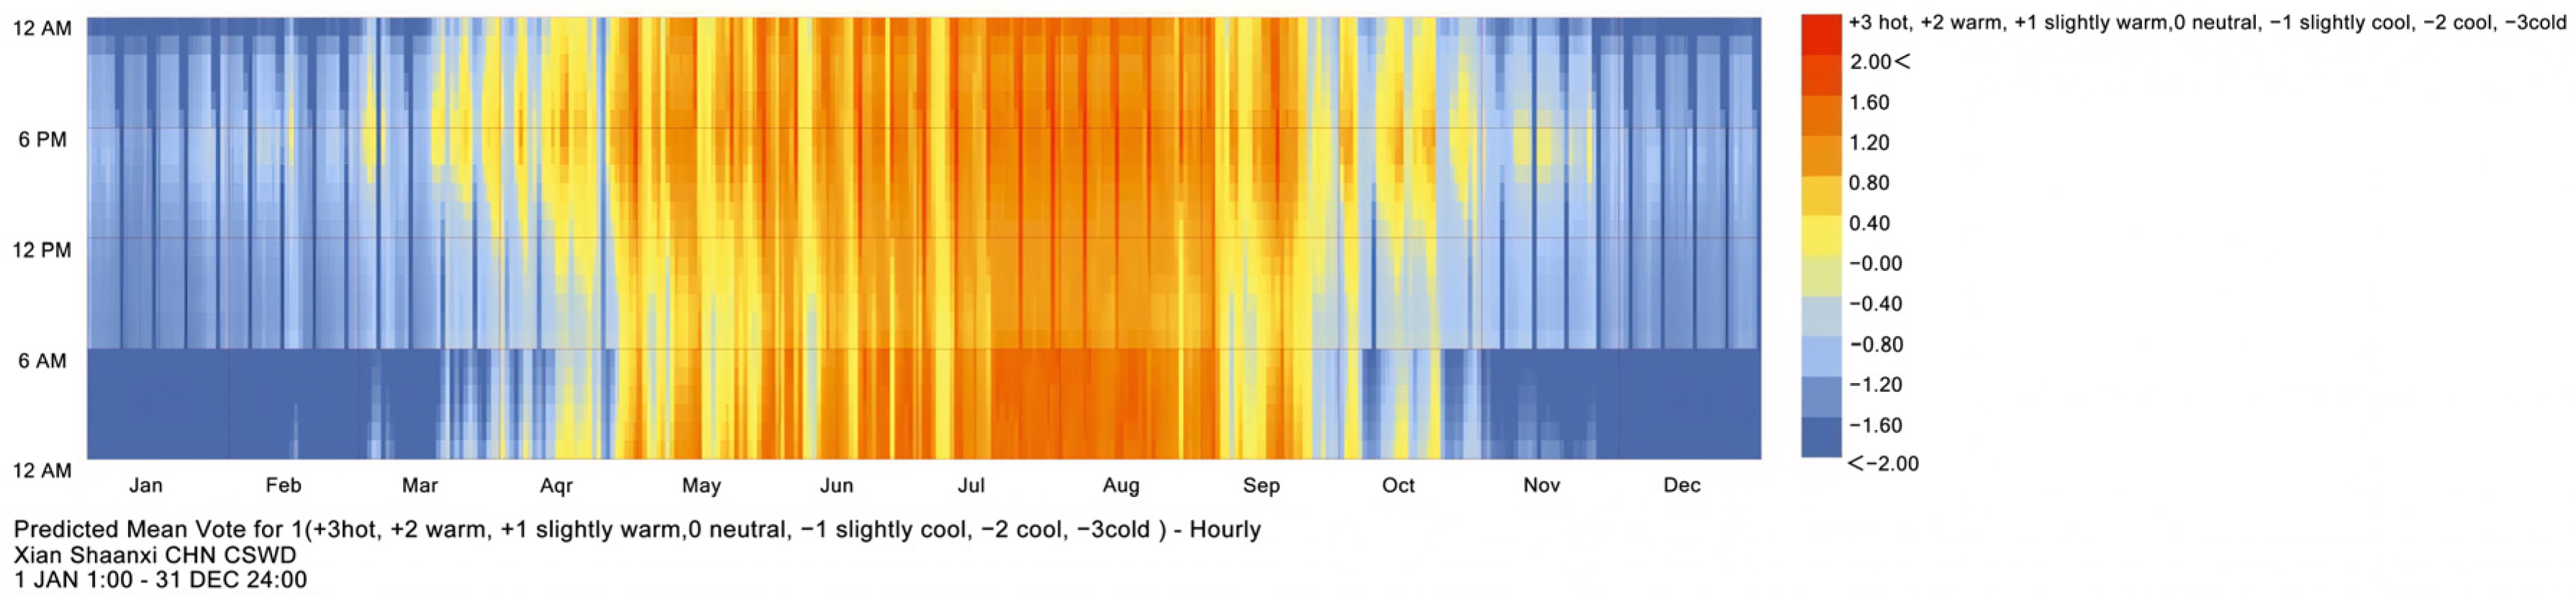
The PMV-PPD index chosen for this study reflects the indoor thermal comfort within buildings. The visualized results and data illustrating PMV for indoor thermal comfort throughout the year are presented in
Figure 8.
According to the simulation results of thermal comfort, the percentage of people with unsatisfactory indoor expectations in the CHD Student Center throughout the year is 23.7%, the absolute value of PMV at this time is 0.89, and the annual indoor discomfort time is 2179.75 h.
The heat transfer coefficient (U value) of each building envelope component is compared with the specified limit value in the building energy-saving design standards across various periods to ascertain compliance with energy-saving design requirements. The comparative results are displayed in
Table 6.
Based on the comprehensive findings from field investigations, data testing, and software simulation analyses, the university student center exhibits several issues concerning the thermal performance of its envelope structure, building energy consumption, and indoor thermal comfort:
(1) Thermal performance of the enclosure structure: The table reveals that the CHD Student Center, in its architectural design, does not adhere to building energy conservation requirements. Consequently, the thermal performance of the building envelope exceeds the current codes and standards. There exists substantial potential for energy-saving optimization in the building envelope design.
(2) Building energy consumption: As per the specifications outlined in the “Standard for Energy Consumption of Buildings” GB/T 51161-2016 [
43], the prescribed value for Xi’an’s annual unit area heat consumption index stands at 0.21GJ/(m
2·a), equivalent to 58.333 kW·h/m
2. However, based on the energy consumption simulation results, the CHD Student Center demonstrates an annual cumulative heat consumption per unit area of 82.15 kW·h/m
2, surpassing Xi’an’s building heat consumption index limit.
(3) Building thermal comfort: According to the standard outlined in the “Evaluation Standard for Indoor Thermal Environment in Civil Buildings” GB/T 50785-2012 [
39], a thermal environment with a Predicted Percentage of Dissatisfied (PPD) of ≤10% signifies comfort, while the indoor thermal environment should ideally range between −0.5 and +0.5 for Predicted Mean Vote (PMV). Based on the thermal comfort simulation results, the CHD Student Center experiences an unsatisfactory indoor environment throughout the year, with 23.7% of individuals dissatisfied, and a PMV of 0.89, categorized as a grade III standard. This indicates low satisfaction among occupants regarding the humidity and thermal environment. Analysis of the construction drawings reveals that the thermal performance of each component of the building envelope exceeds the current code limit. This situation is detrimental to creating a favorable indoor thermal environment in the building, making it challenging to maintain comfortable conditions.
4. Results and Discussion
Based on the status of student centers in Xi’an and simulation analysis results, it has been discovered that the CHD Student Center has significant potential for energy conservation in terms of both building energy consumption and indoor thermal comfort. Expanding on this assessment and considering the actual influencing factors, a transformative design was implemented. This involved adjusting the external wall insulation materials and thickness, types of external windows, roof insulation materials and thickness, external sunshades, and more. These modifications were evaluated against the heat transfer coefficient specified in the “Design Standard for Energy Efficiency of Public Buildings” GB50189-2015 [
42]. Using a multi-objective optimization module, the optimal Pareto solution set was computed to identify the most fitting scheme that meets the heat transfer coefficient prerequisites. The process of multi-objective optimization, along with the resulting optimal design concepts relevant to comparable existing buildings in the Xi’an area, is depicted in
Figure 9: schematic diagram of the multi-objective optimization research process and technical platform.
4.1. Multi-Objective Optimization Experiment Design
The meteorological data selected in this simulation study are the data of typical meteorological years in Xi’an. The schedule of heating and cooling equipment, the opening conditions of ventilation and lighting, and the activity schedule adopted by indoor personnel were consistent with the initial case simulation.
To sum up, the parameter settings of optimization variables in this study are shown in
Table 7.
Referring to the algorithm parameter settings from previous studies [
8], a comparative test was conducted regarding the parameter settings in this study. In optimizing the parameter settings of the algorithm, the configuration utilized in this study ensures the algorithm’s performance while effectively balancing the optimization of building energy consumption and indoor thermal comfort. The optimization algorithm’s parameter settings for this study are detailed in
Table 8.
4.2. Optimize the Analysis of Experimental Results
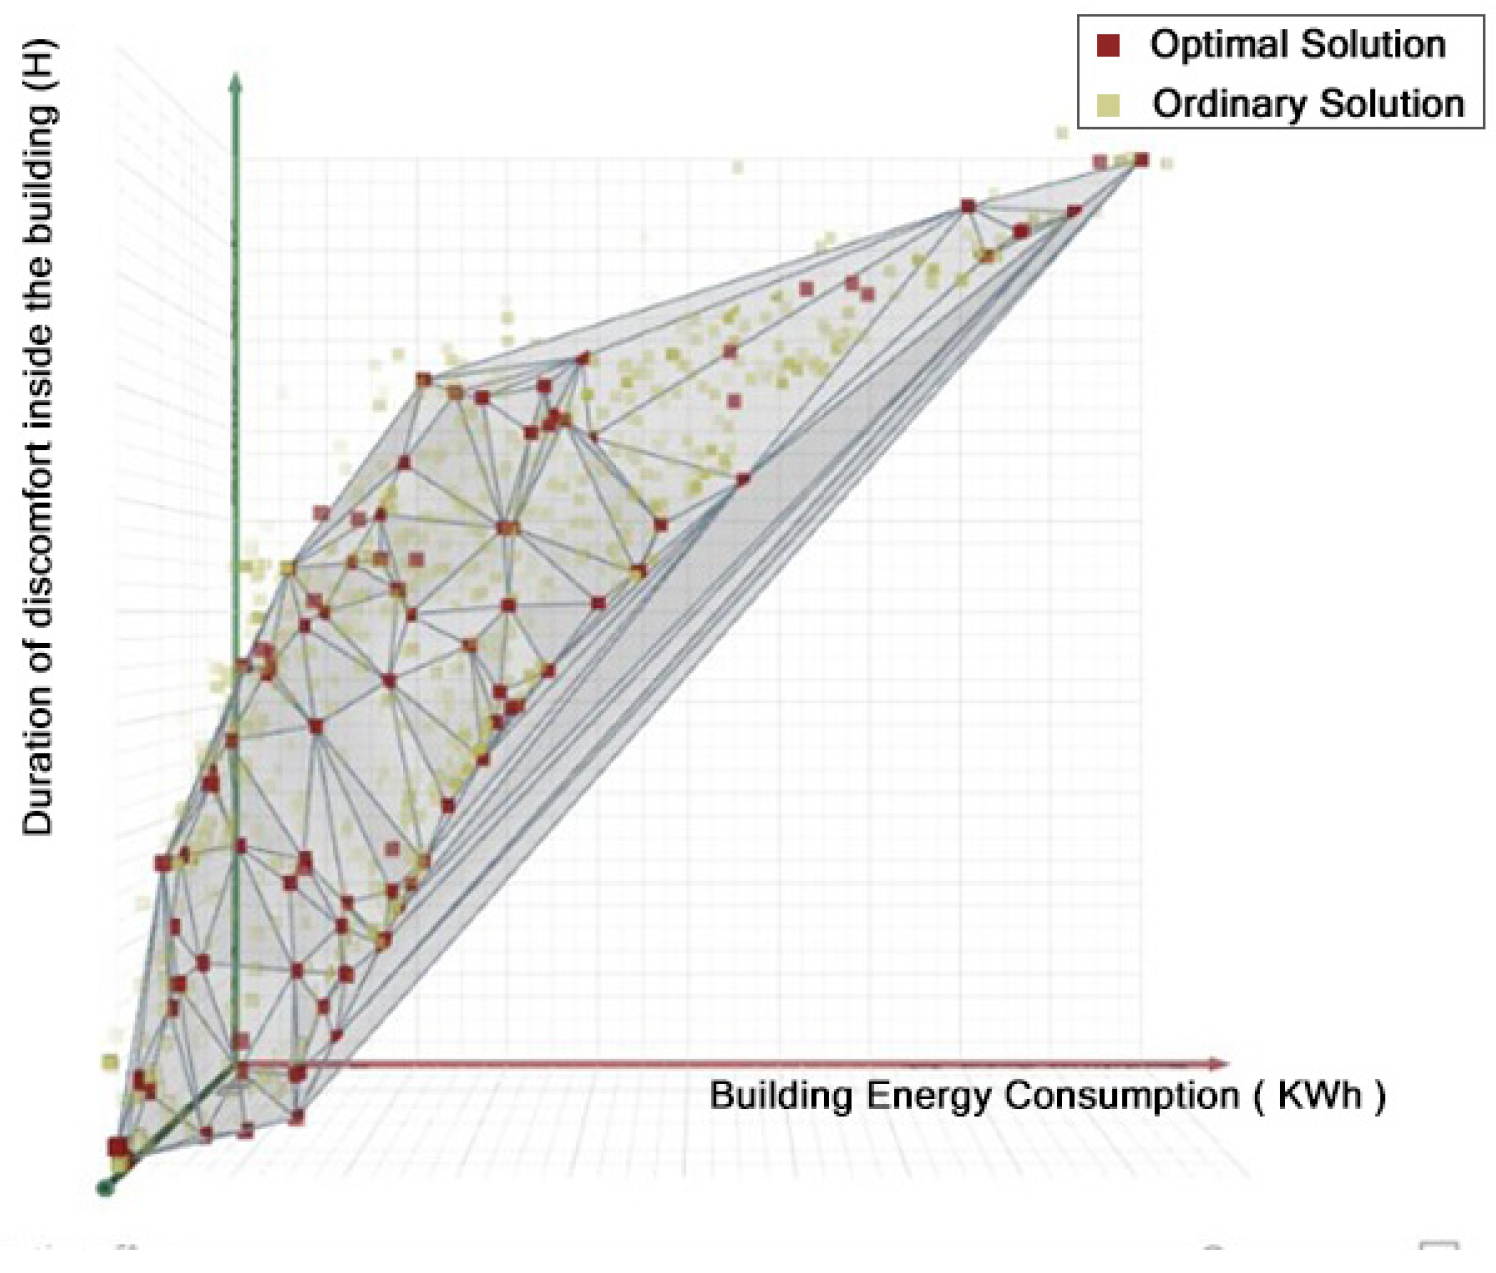
In this study, the optimization algorithm module of the software was used to simulate the building energy consumption and the uncomfortable duration inside the building, etc., corresponding to the Pareto scatter plots of 5, 25, 45, and 50 generations (
Figure 10,
Figure 11,
Figure 12 and
Figure 13), until the point distribution reached a stable convergence state. The dark red cube is Pareto’s optimal solution set.
Figure 10,
Figure 11,
Figure 12 and
Figure 13 illustrate that the Pareto optimal solution sets are interconnected to form a Pareto front surface. The overall shape closely resembles a convex paraboloid centered around the coordinate origin. Observing the fluctuation in the solution set of the 50th-generation frontier surface indicates that this optimization set has converged. The resulting optimal solution set obtained from this convergence can be utilized for further research and analysis. The iterative process of the multi-objective optimization simulation, comprising approximately 2500 operations, unveiled a dense trend in the distribution of the Pareto solution set. The relatively stable position within this distribution can be regarded as the state of convergence for the set.
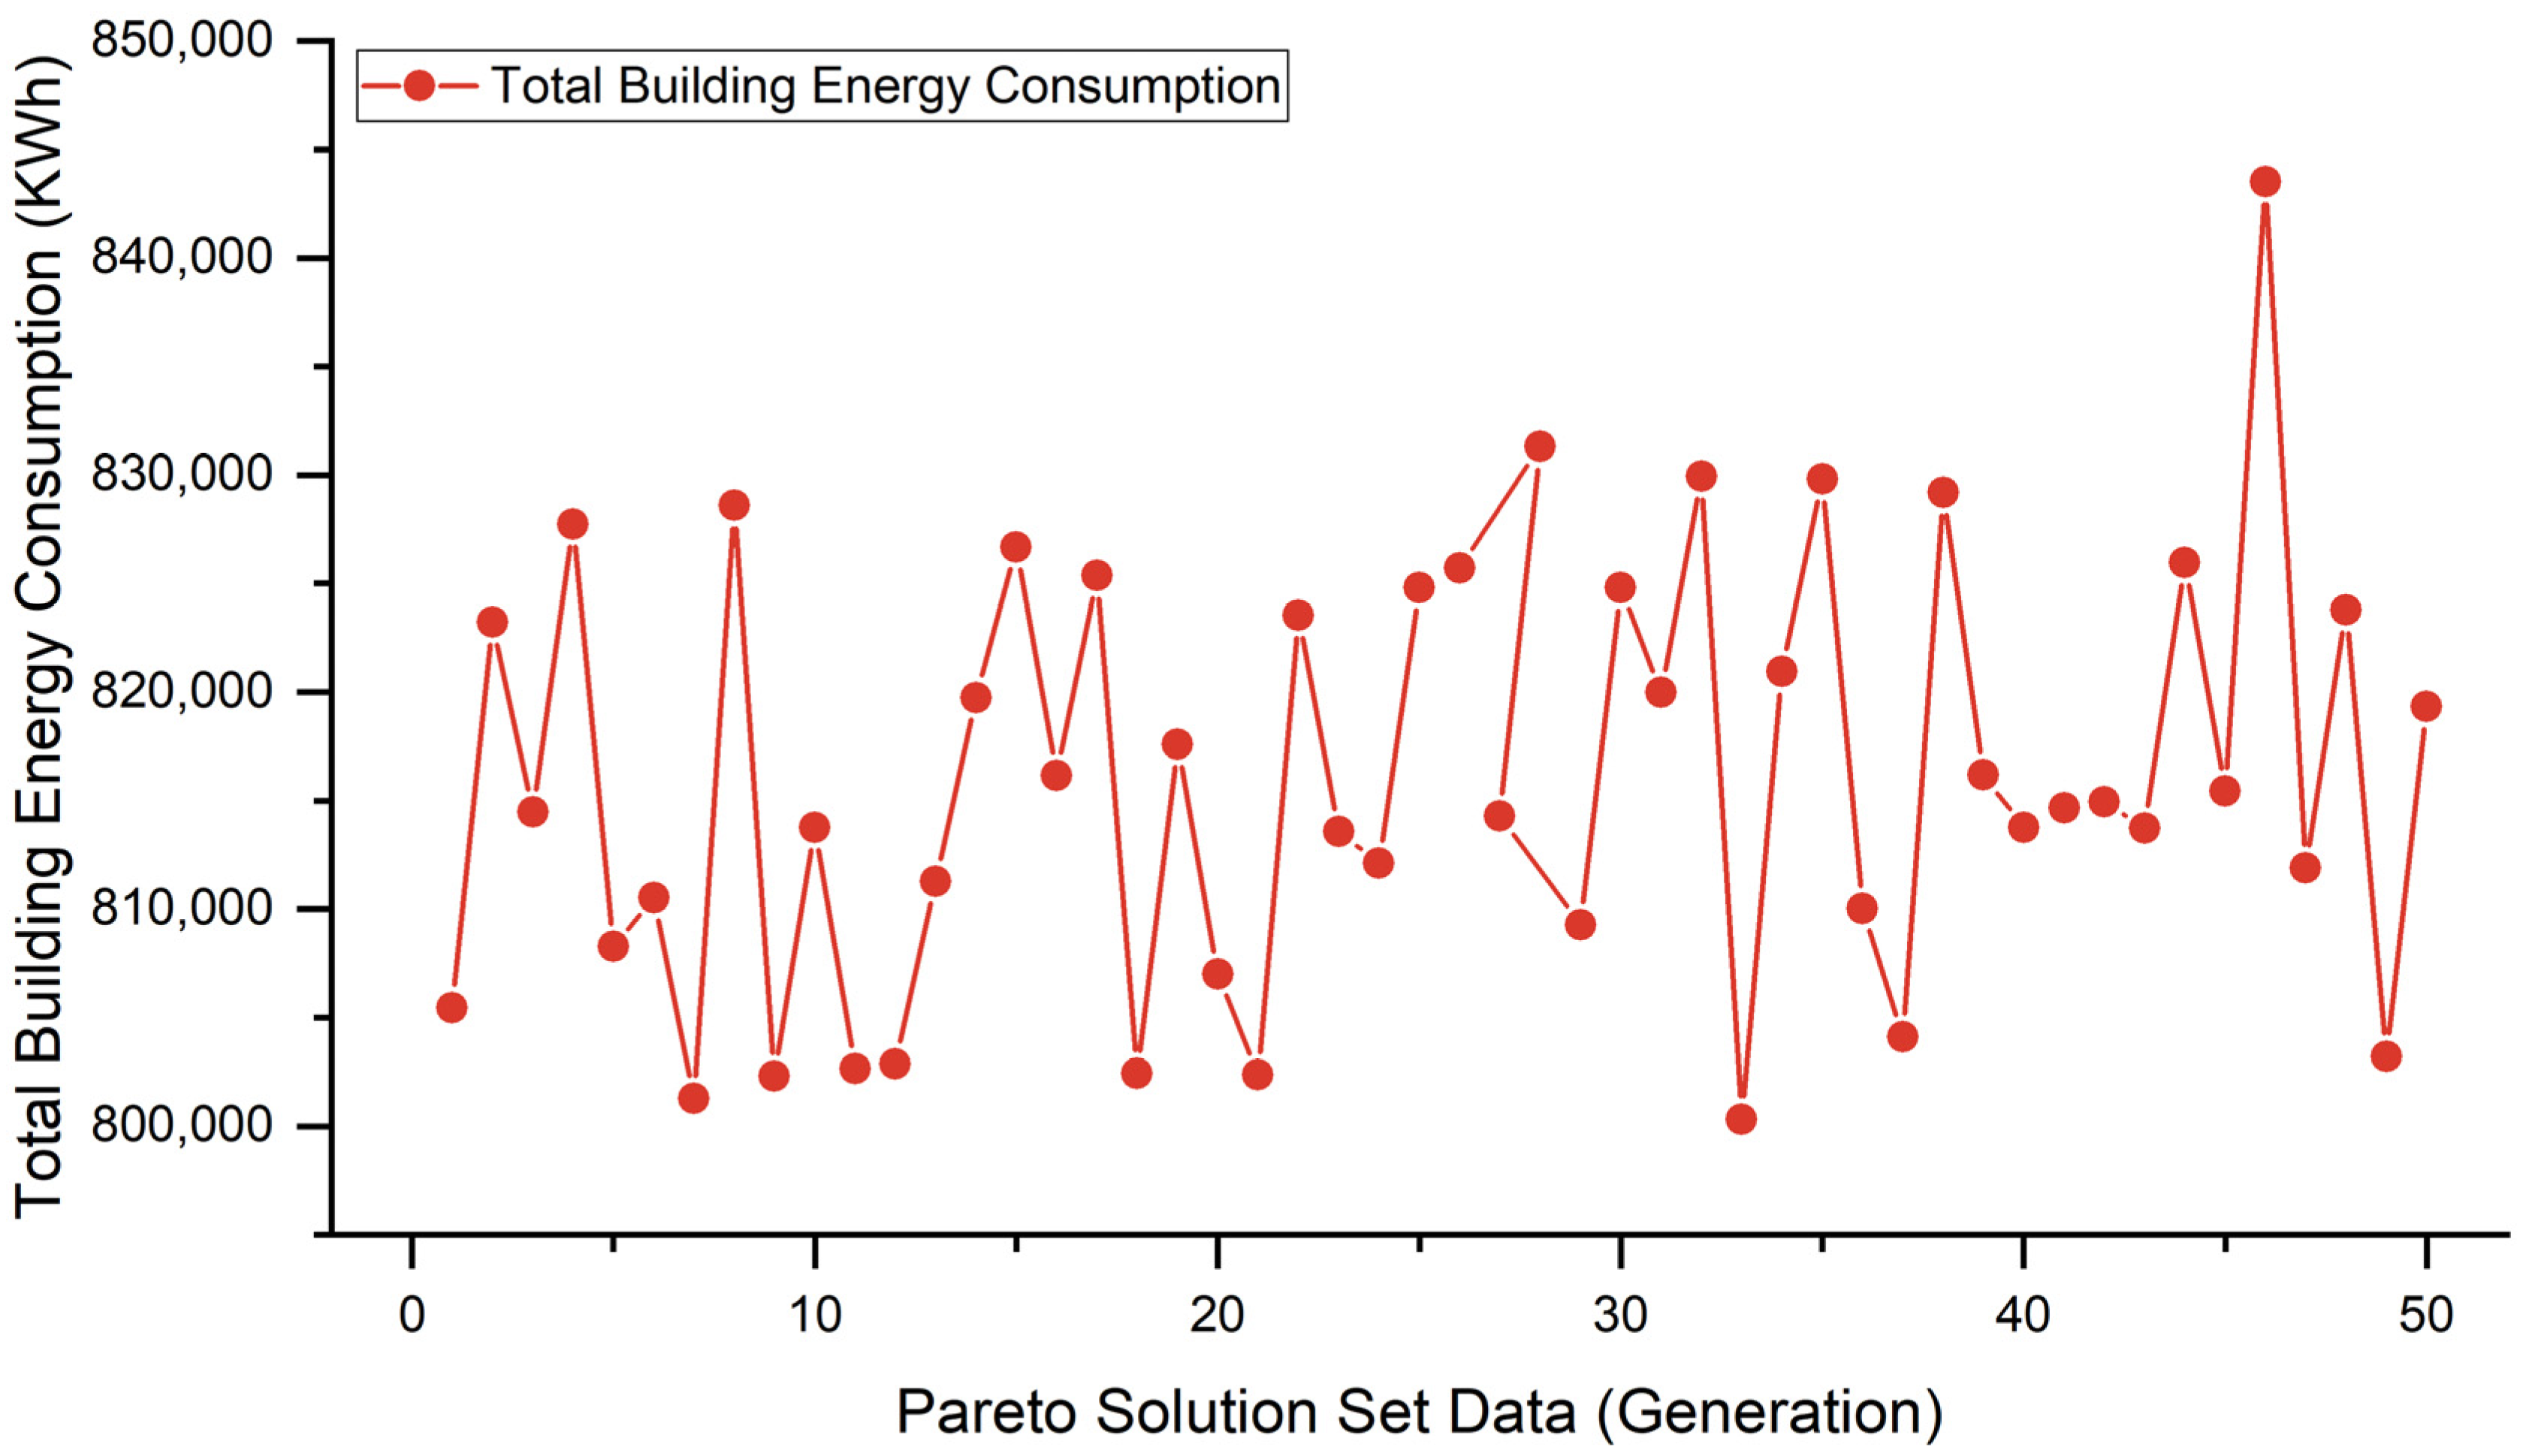
(1) Analysis of total building energy consumption
Analysis of the 50th-generation Pareto solution set data obtained from the multi-objective optimization study of the CHD Student Center indicates a notable reduction in building energy consumption following the optimization process. The annual energy consumption after optimization ranges between 800,000 kWh and 830,000 kWh. Specifically, the 33rd-generation Pareto solution set (depicted in
Figure 14) generated the minimum energy consumption of 800,322.19 kWh through energy consumption optimization simulations. Conversely, the maximum energy consumption was recorded from the 46th-generation Pareto solution set, resulting in 843,523.24 kWh. Overall, in the 50th-generation data set, the building’s energy consumption demonstrates a significant reduction compared to the pre-optimization consumption of 1,964,153.07 kWh.
(2) Indoor thermal comfort analysis of buildings
Examining the impact of multi-objective optimization on the discomfort duration within the building, an analysis was conducted using the 50th-generation Pareto solution set data from the multi-objective optimization study of the CHD Student Center. This analysis generated a relationship diagram between the discomfort duration within the building and the Pareto solution set (see
Figure 15). The discomfort duration values mostly range between 800 h and 1600 h. As per the multi-objective optimization research, the minimum discomfort duration is recorded in the 8th generation, amounting to 753.52 h. Conversely, the maximum discomfort duration resulting from the multi-objective optimization research occurs in the 21st generation, with a value of approximately 2168.75 h. Overall, across the 50 generations, the building’s indoor discomfort duration exhibits a notable decrease compared to the indoor thermal discomfort duration of 2179.75 h before the optimization.
(3) Analysis of variable optimization design
Optimization of wall insulation structure: An analysis of the 50th-generation Pareto solution set reveals that the optimization primarily centers on two types of wall insulation structures: W2 (XPS, 150 mm thickness) and W4 (EPS, 150 mm thickness). Within these options, the XPS board configuration dominates the solution set, suggesting its superior performance in terms of energy consumption and comfort at a thickness of 150 mm.
Optimization of roof insulation structure: An analysis of the Pareto solution set highlights the preference for solutions centered around R1, R2, and R4 (involving XPS and EPS insulation panels with 100 mm and 150 mm thicknesses, respectively). Due to the relatively small roof insulation area, the optimization process does not significantly increase the thickness of the insulation material. This indicates that both XPS and EPS exhibit effective insulation properties, with 150 mm thickness being the prevalent choice.
Selection of external window glass type: The results from multi-objective optimization indicate that G1 (3 mm + 12 Ar + 3 mmLow glass) and G3 (3 mm + 12 Ar + 3 mm ordinary glass) window types are preferred. In particular, the G1 type holds a notably higher proportion within the solution concentration, highlighting its distinct advantages in optimization.
Optimization of horizontal shading: Data analysis shows that S2 (0.5 m overhang horizontal shading) in the southwest direction contributes more effectively to enhancing the energy efficiency and comfort of the building interior. Pareto solution sets without horizontal sunshade (S1) also exist, but their proportion is small.
(4) Weighing scheme analysis
In this study, the scheme provided by the 29th-generation Pareto solution set has been chosen as the optimization scheme (see
Figure 16). Based on the multi-objective optimization point diagram of the building, the thermal insulation structure of the external wall has been adjusted to a 150 mm-thick XPS board from the original structural design. The roof’s insulation structure has also been set to a 150 mm-thick XPS board. Additionally, the external window glass has been replaced with a 3 mm + 12 Ar + 3 mmLowE structure, and a 0.5 m horizontal sunshade has been installed on the building’s southwest side. Simulation results demonstrate a notable reduction in the building’s energy consumption, bringing it down to 809,273.24 kWh—considerably lower than the pre-optimization consumption of 1,964,153.07 kWh. Moreover, the discomfort duration inside the building has decreased to 1024.19 h. The corresponding parameters of this solution set are detailed in
Table 9.
In the research process, if there is an optimal solution or solution set scheme, will compare the benchmark values in the building energy efficiency design codes or building comfort standards, including the Evaluation Standard for Indoor Thermal Environment in Civil Buildings GB/T 50785-2012 and the Design Standard for Energy Efficiency of Public Buildings GB50189-2015. When there is no optimal solution set, it is necessary to calculate the data of the non-optimal solution set calculated in Ladybug and Honeybee software Version 0.0.65, calculate the heat transfer coefficients of the corresponding parts of the model, such as the exterior windows, exterior walls, and roof, and then compare them with the benchmark heat transfer coefficients in the standard. Based on this, select the optimal solution that meets the heat transfer coefficient requirements. Based on this, compare the energy consumption and uncomfortable time length of the selected solution to determine the optimal solution.
4.3. Multi-Objective Optimization of Optimal Solution Set
Calculate the energy-saving rate of the envelope structure according to the “Standard for Green Performance Calculation of Civil Buildings“ JGJ/T 449-2018 [
44]. The calculation formula is as follows (Equation (1)):
In the formula, the following are defined:
ηE—total building optimization rate, %;
EB—the total building comprehensive energy consumption after optimization, kWh;
E0—total building comprehensive energy consumption after initial building model, kWh.
After evaluating the building’s energy consumption and thermal comfort performance target optimization rate, we compared the multi-objective optimization data with the original building data. The annual comprehensive energy consumption was reduced by approximately 58.8% following optimization. Simultaneously, the annual indoor thermal comfort duration increased by about 53.0%. This validates and analyzes the energy-saving optimization scheme for the CHD Student Center as an effective transformation strategy, detailed in
Figure 17 and
Figure 18, and
Table 10.
After conducting a comparative analysis of the annual comprehensive energy consumption and indoor thermal comfort values before and after the optimization plan, it is concluded that the case building’s annual comprehensive energy consumption was reduced by 58.8% after implementing optimization measures, now being 75.36 kW·h/m2, much lower than the 183.57 kW·h/m2 before the renovation; the heat consumption index is 38.19 kW·h/m2, reduced by 46.5%, which meets the limit value of 58.333 kW·h/m2 for the building heat consumption index in Xi’an according to the “Standard for Energy Consumption of Buildings” GB/T 51161-2016. The indoor thermal comfort duration has increased by 53.0%, and the percentage of indoor dissatisfaction expected throughout the year is 11.2%. According to the “Evaluation Standard for Indoor Thermal Environment in Civil Buildings” GB/T 50785-2012, it is classified as Level II standard and basically meets the comfort requirements. These verification results demonstrate the rationale and feasibility of the optimization process.
Based on the above analysis, it can be seen that unlike single-factor optimization, multi-objective optimization can be optimized from both energy consumption and thermal comfort perspectives. For various practical cases, it is necessary to reasonably adjust the various influencing factors involved in multi-objective optimization based on the actual situation of the case, and ensure the optimal optimization plan through repeated adjustments. Not only that, other variables can be added during the optimization process and multi-objective joint optimization design can be carried out to obtain the Pareto solution set through simulation calculation. In addition, targeted economic strategies can also be proposed based on analysis of the actual situation, such as adjusting material thickness reasonably, selecting appropriate material categories, etc., thus forming the optimal plan to achieve the maximum economic benefits.
5. Conclusions
This study focuses on the university student center buildings in China and proposes a multi-objective optimization design method for achieving thermal comfort while maintaining low energy consumption. The study illustrates this method through practical examples, leading to the following conclusions:
(1) The university student center serves diverse functions, encompasses various spaces, exhibits high total energy consumption, and displays energy usage patterns distinct from other university buildings. It demonstrates significant potential for energy savings.
(2) The Octopus multi-objective optimization module is employed to conduct research, facilitating the simultaneous optimization of building comprehensive energy consumption and indoor thermal comfort. This approach allows for comprehensive design optimization involving elements such as the building’s exterior wall (insulation material type and thickness), exterior windows (glass material type and thickness), roof (insulation material type and thickness), and external sunshade (length of horizontal sunshade). Initially, this scheme aids architects in making informed design decisions during the project’s early stages, fostering energy-conserving building design. Furthermore, it generates more practical transformation technical schemes. In this study, the annual comprehensive energy consumption of the building is reduced by 58.8%, while the indoor thermal comfort duration increases by 53.0%, demonstrating the feasibility and soundness of the optimization design method.
(3) The multi-objective optimization platform considers multiple factors globally, utilizing a multi-objective optimization algorithm to prevent insufficient consideration of individual factors. Moreover, this process generates multiple visualized optimization schemes, allowing designers to select options based on different objectives. This ensures that all objective functions achieve an optimal state, significantly enhancing the efficiency and effectiveness of building transformation optimization.
In the optimization of university student center design, this study focused solely on analyzing building energy consumption and indoor thermal comfort, while other variables were not extensively compared or discussed. Future optimization experiments could benefit from employing multi-objective optimization algorithms to consider comprehensive factors such as site selection, space layout, and building equipment selection, enabling a more holistic examination of the university student center. Additionally, conducting more in-depth analyses and comparisons of building performance across various climate zones in subsequent research, through detailed data or statistical analysis, would facilitate broader conclusions.


 office
  event and management occupancy
  hall
hall  multi-purpose room
  others


