The Risk of Financial Bubbles in Renewable Energy Markets


Abstract
1. Introduction
2. Financial Bubbles and Market Saturation
2.1. Literature Review
2.2. Theoretical Framework
2.3. Bubble Mechanism
3. Materials and Methods
3.1. Data Sources
- Net-Zero Scenario (NZS): reflects an accelerated transition to renewable energy with challenging deployment targets.
- Economic Transition Scenario (ETS): represents a more conservative trajectory, with gradual market expansion.
3.2. Modeling Approach
- Kp is the market capacity or potential (maximum) value of the invested capital in the market;
- K0 is the initial value of the investment;
- Ka is the accumulated investment (the amount of the capital in terms of its value) over periods;
- i is the interest or growth rate;
- t is the duration of the investment or the number of periods of the investment.
- t is the duration of the investment or the number of periods of the investment;
- Kp is the market capacity or maximum absorptive capacity of the market, representing the theoretical upper limit of installed capacity given current technology and market conditions over the entire period, in GW;
- Ka is the predicted total installed renewable energy capacity at a given each year, in GW;
- K0 is the initial installed renewable energy capacity in the beginning of the period, in GW;
- r is the logistic growth rate.
3.3. Scenario Analysis
- Medium-Term Scenario (10–12 Years). The Juglar cycle refers to an economic cycle characterized by fluctuations in investment and business activities; it is rooted in the interplay between investment, credit, and economic productivity. It typically spans a period of 7 to 11 years and is considered a medium-term business cycle. This period captures late signs of market saturation and speculative growth between investment, credit, and economic productivity in the sector [37,38].
- Long-Term Scenario (25 Years). The Kuznets cycle (long swing or infrastructure investment cycle) refers to economic fluctuations with an estimated duration of 15 to 25 years. This type of cycle is driven by structural transformations such as urbanization, demographic shifts, and infrastructure investment. This timeframe, according to the Kuznets cycle, examines the link to infrastructure development: the cycle is particularly evident in patterns of investment in transportation, housing, utilities, and public works, which have long gestation periods and require significant capital. [37,39,40].
3.4. Assumptions and Limitations
- The model relies on functional relationships, with installed capacity as the independent variable and growth rate as the dependent variable. Other variables are treated as constant, unique to each scenario, period length, and sector.
- Market capacity (), the duration of the investment (t), and the initial value of the investment (K0) remain constant over time, a simplification consistent with prior saturation models [4,6]. Market capacity () and the initial value of the investment (K0) are unique for each period, scenario, and sector analysis. Reliability and the accuracy of fixed variables are not assessed.
- The reliability and accuracy of the forecast for the key variable (installed capacity) (Ka) are not assessed, and the market is assumed to develop according to the calculated scenarios.
- Investment costs per unit of installed capacity are assumed to be stable to isolate saturation effects [5].
- External shocks (e.g., geopolitical events, technological disruptions) are not explicitly modeled, aligning with prior studies [41].
- Investment time lag. Infrastructure or renewable energy investments have long gestation periods, where capital is allocated, and returns (saturation in installed capacity) are not immediately realized. Saturation and possible bubbles in related financial markets appear before saturation in installed capacity [42].
4. Results
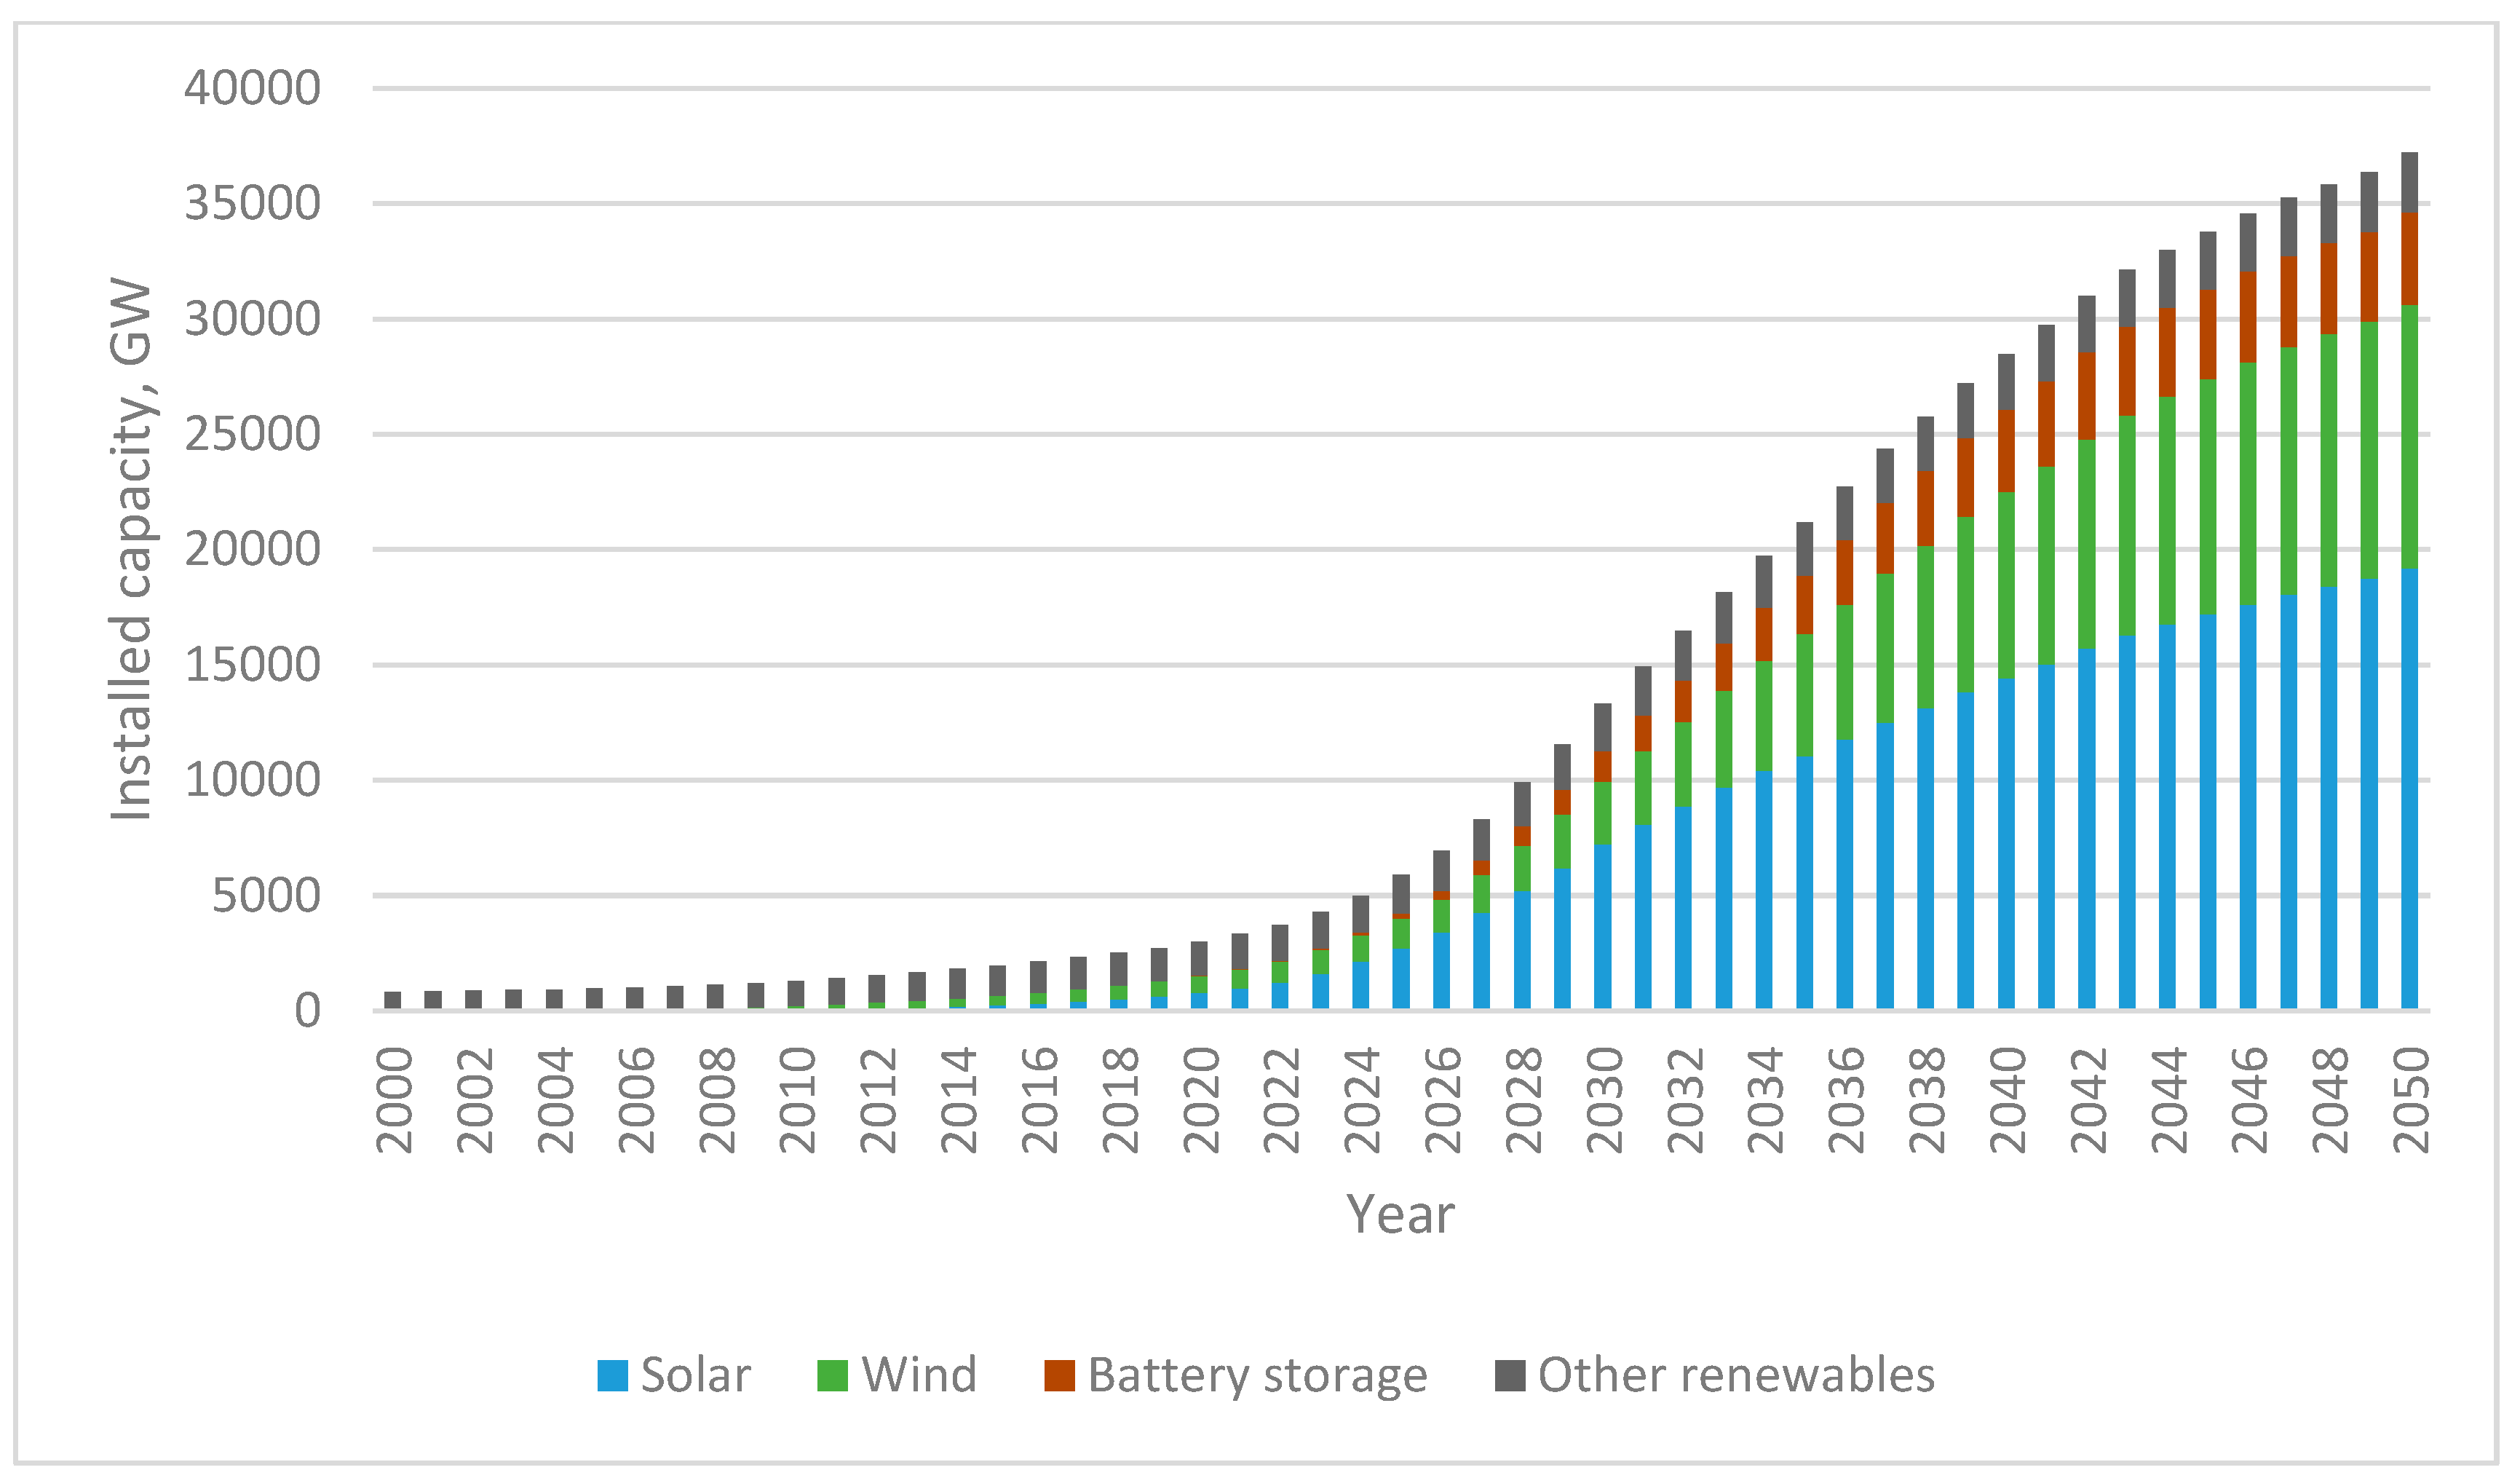
4.1. Renewable Energy Growth Trends Under NZS and ETS
4.2. Renewable Energy Growth: Solar, Wind and Battery Storage
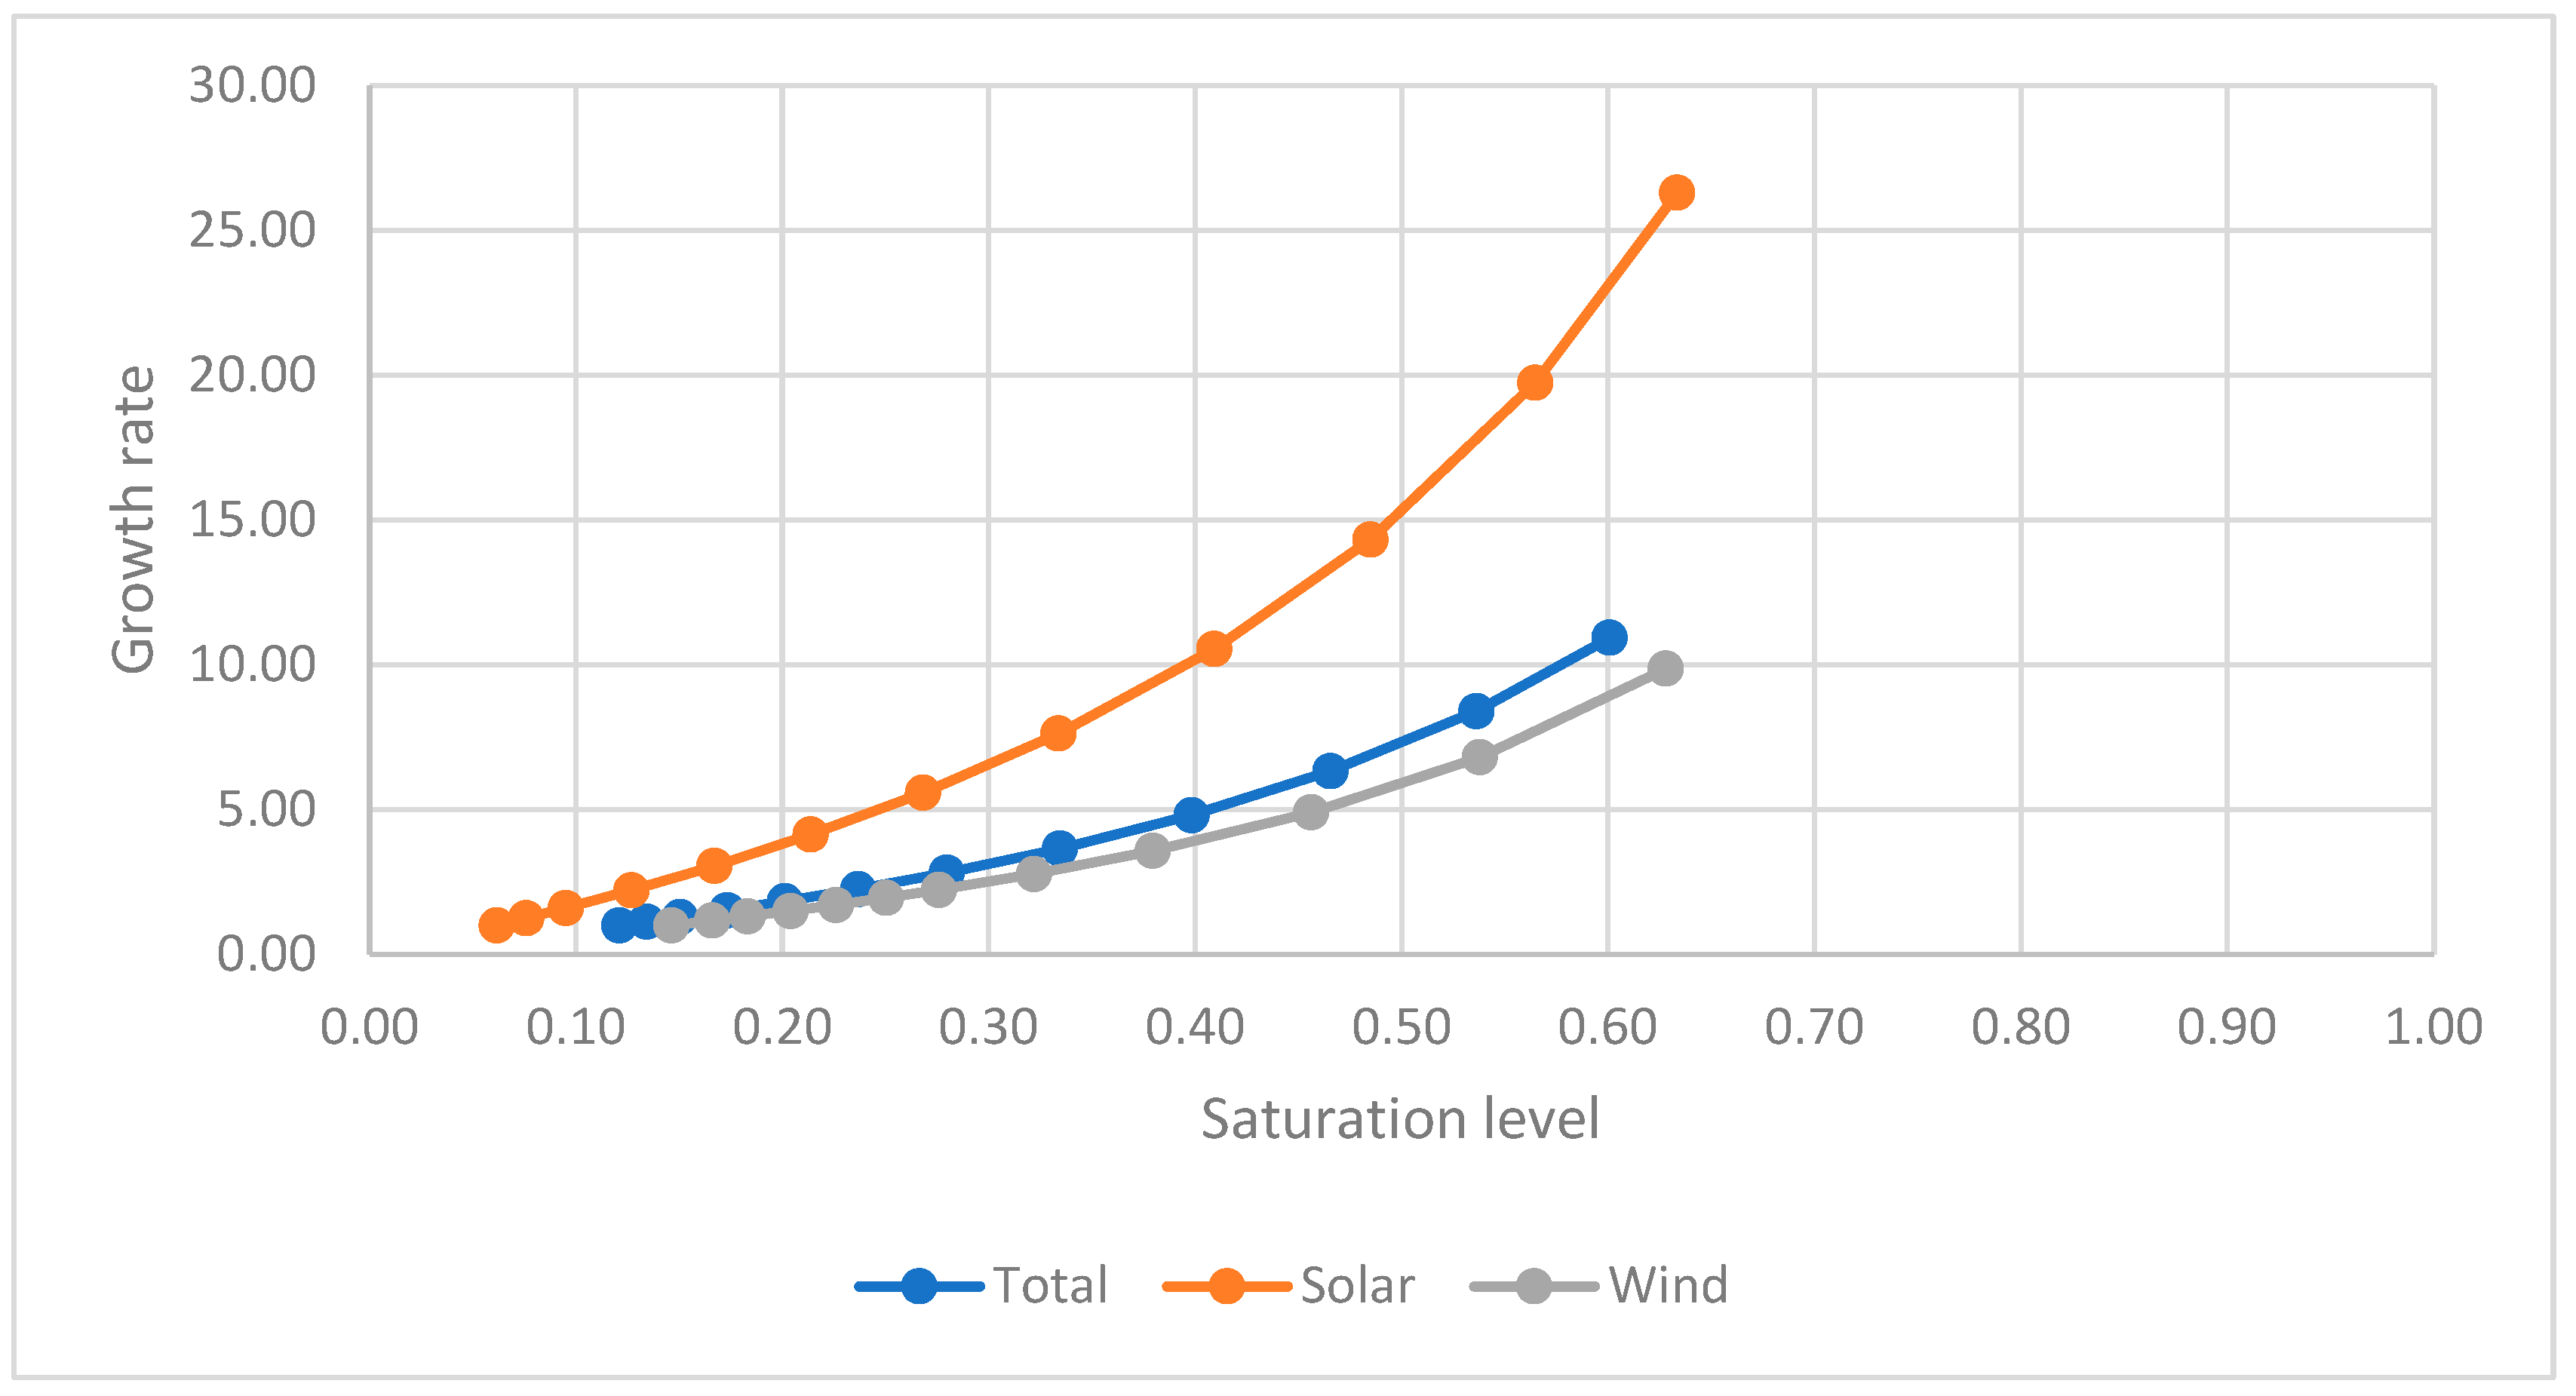
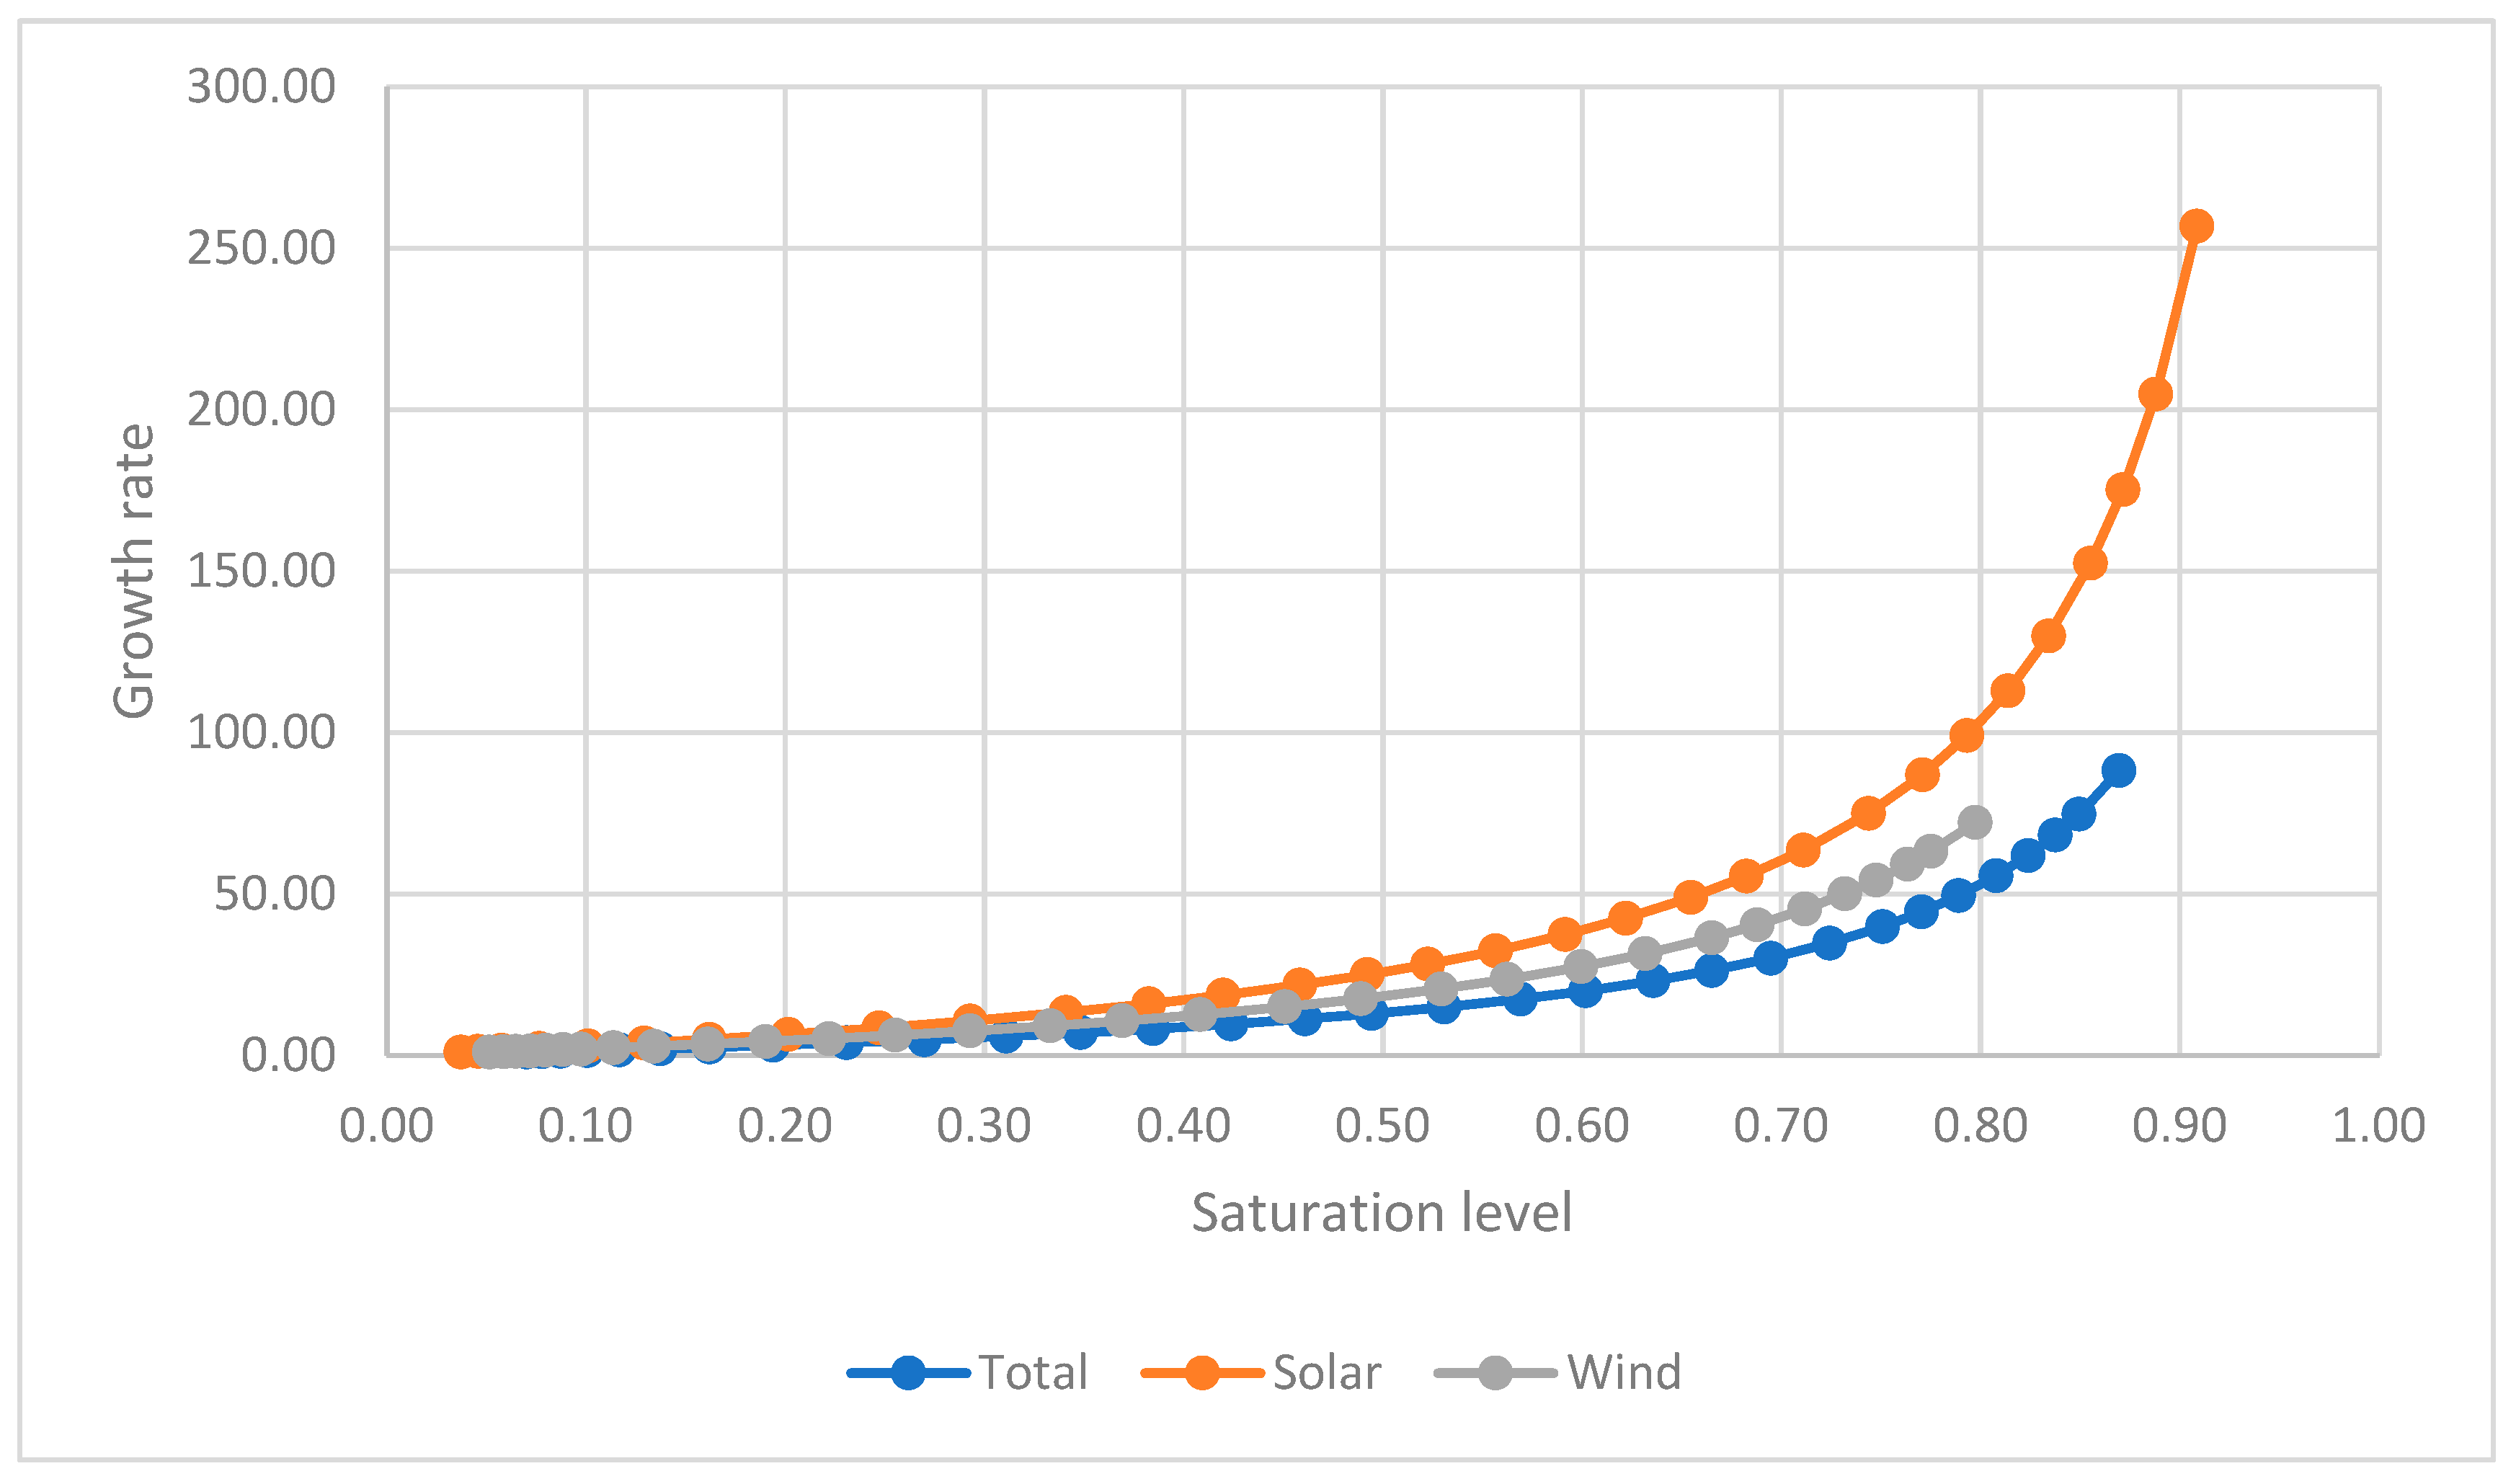
4.2.1. Solar and Wind Energy Trends
- Solar Energy. The results show the bifurcation point (~70% saturation) arriving at different times according to the scenario and period: for the long period, in 2041 (NZS) and in 2039 (ETS); for the medium period, only in 2030 (ETS). Overheating (~90% saturation) is expected in long periods by 2048 (ETS) and 2050 (NZS). Solar energy follows a faster saturation trajectory. Policy support, reducing costs, and growing efficiency all help to foster this explosive development. The great investment flows into solar, however, render it more susceptible to financial bubbles and speculative expansion.
- Wind Energy. Reaching the bifurcation point (~70%) around 2031 (ETS, medium term), and for the long term by 2045 (NZS) and by 2038 (ETS). Overheating (~90% saturation) is expected in the long period by 2049 (ETS). Wind power has a slower saturation curve. Longer project schedules, more expensive infrastructure, and grid integration restrictions all affect the slower expansion of the sector. Wind energy seems less prone to overheating than solar; hence, it is a rather low-risk investment in terms of financial saturation.
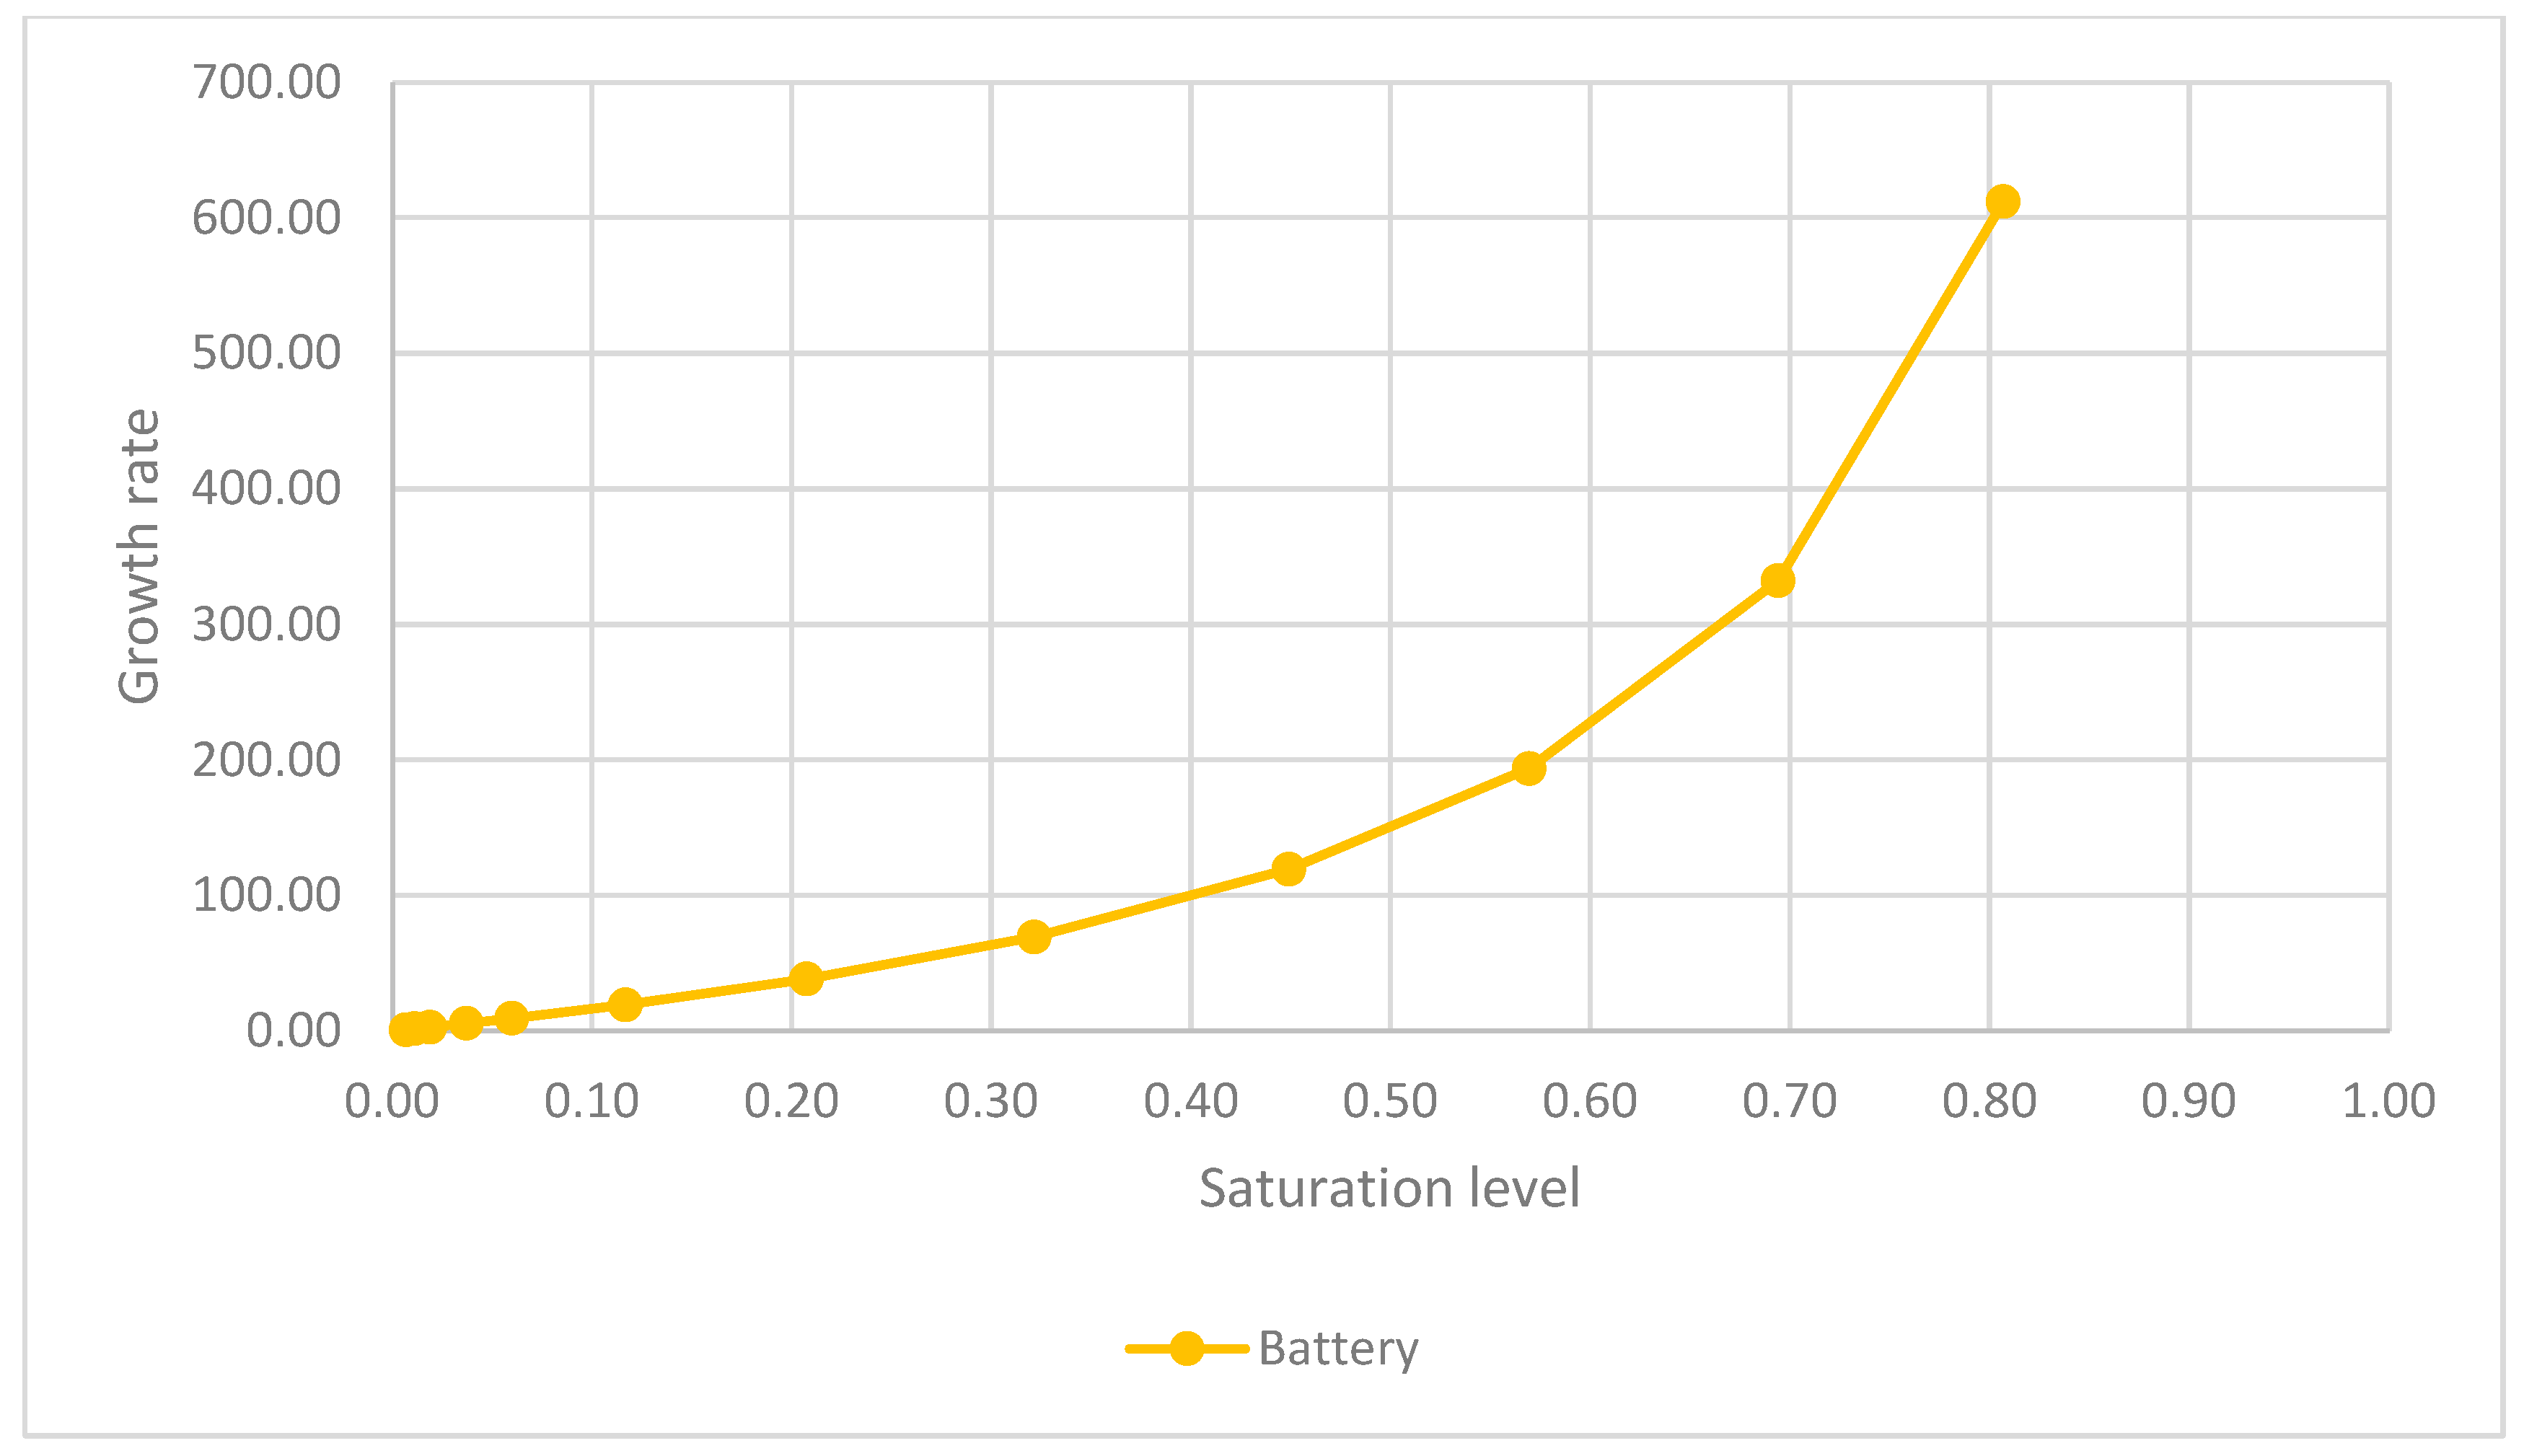
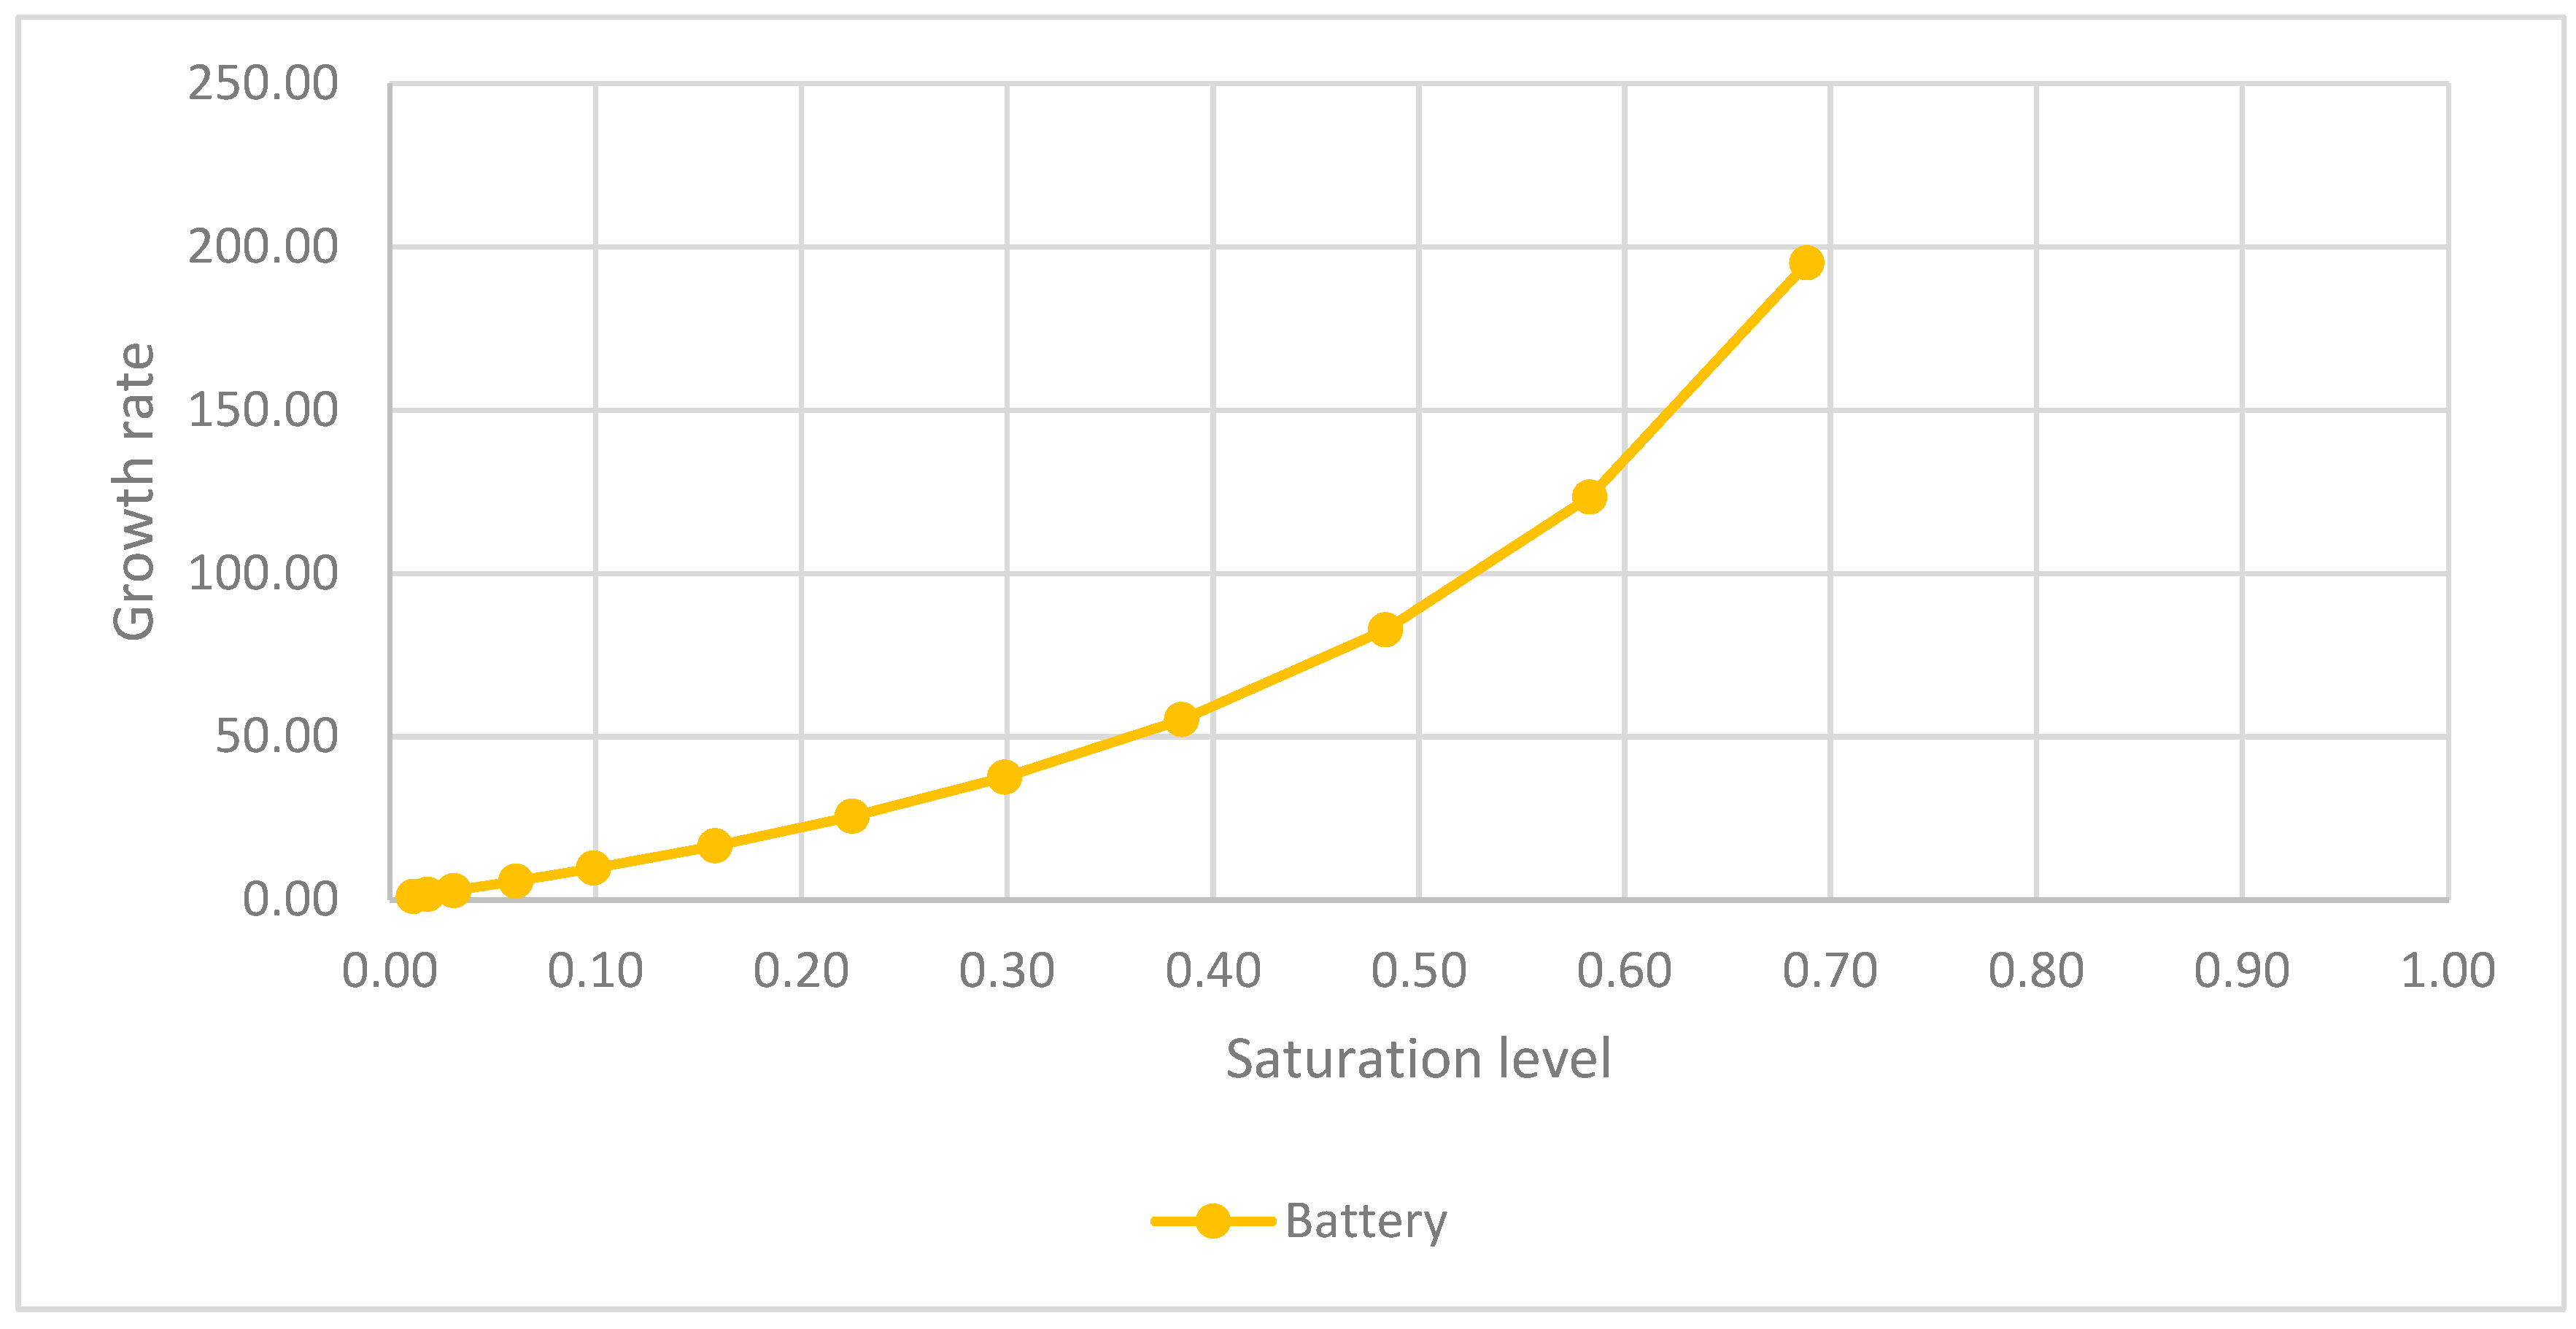
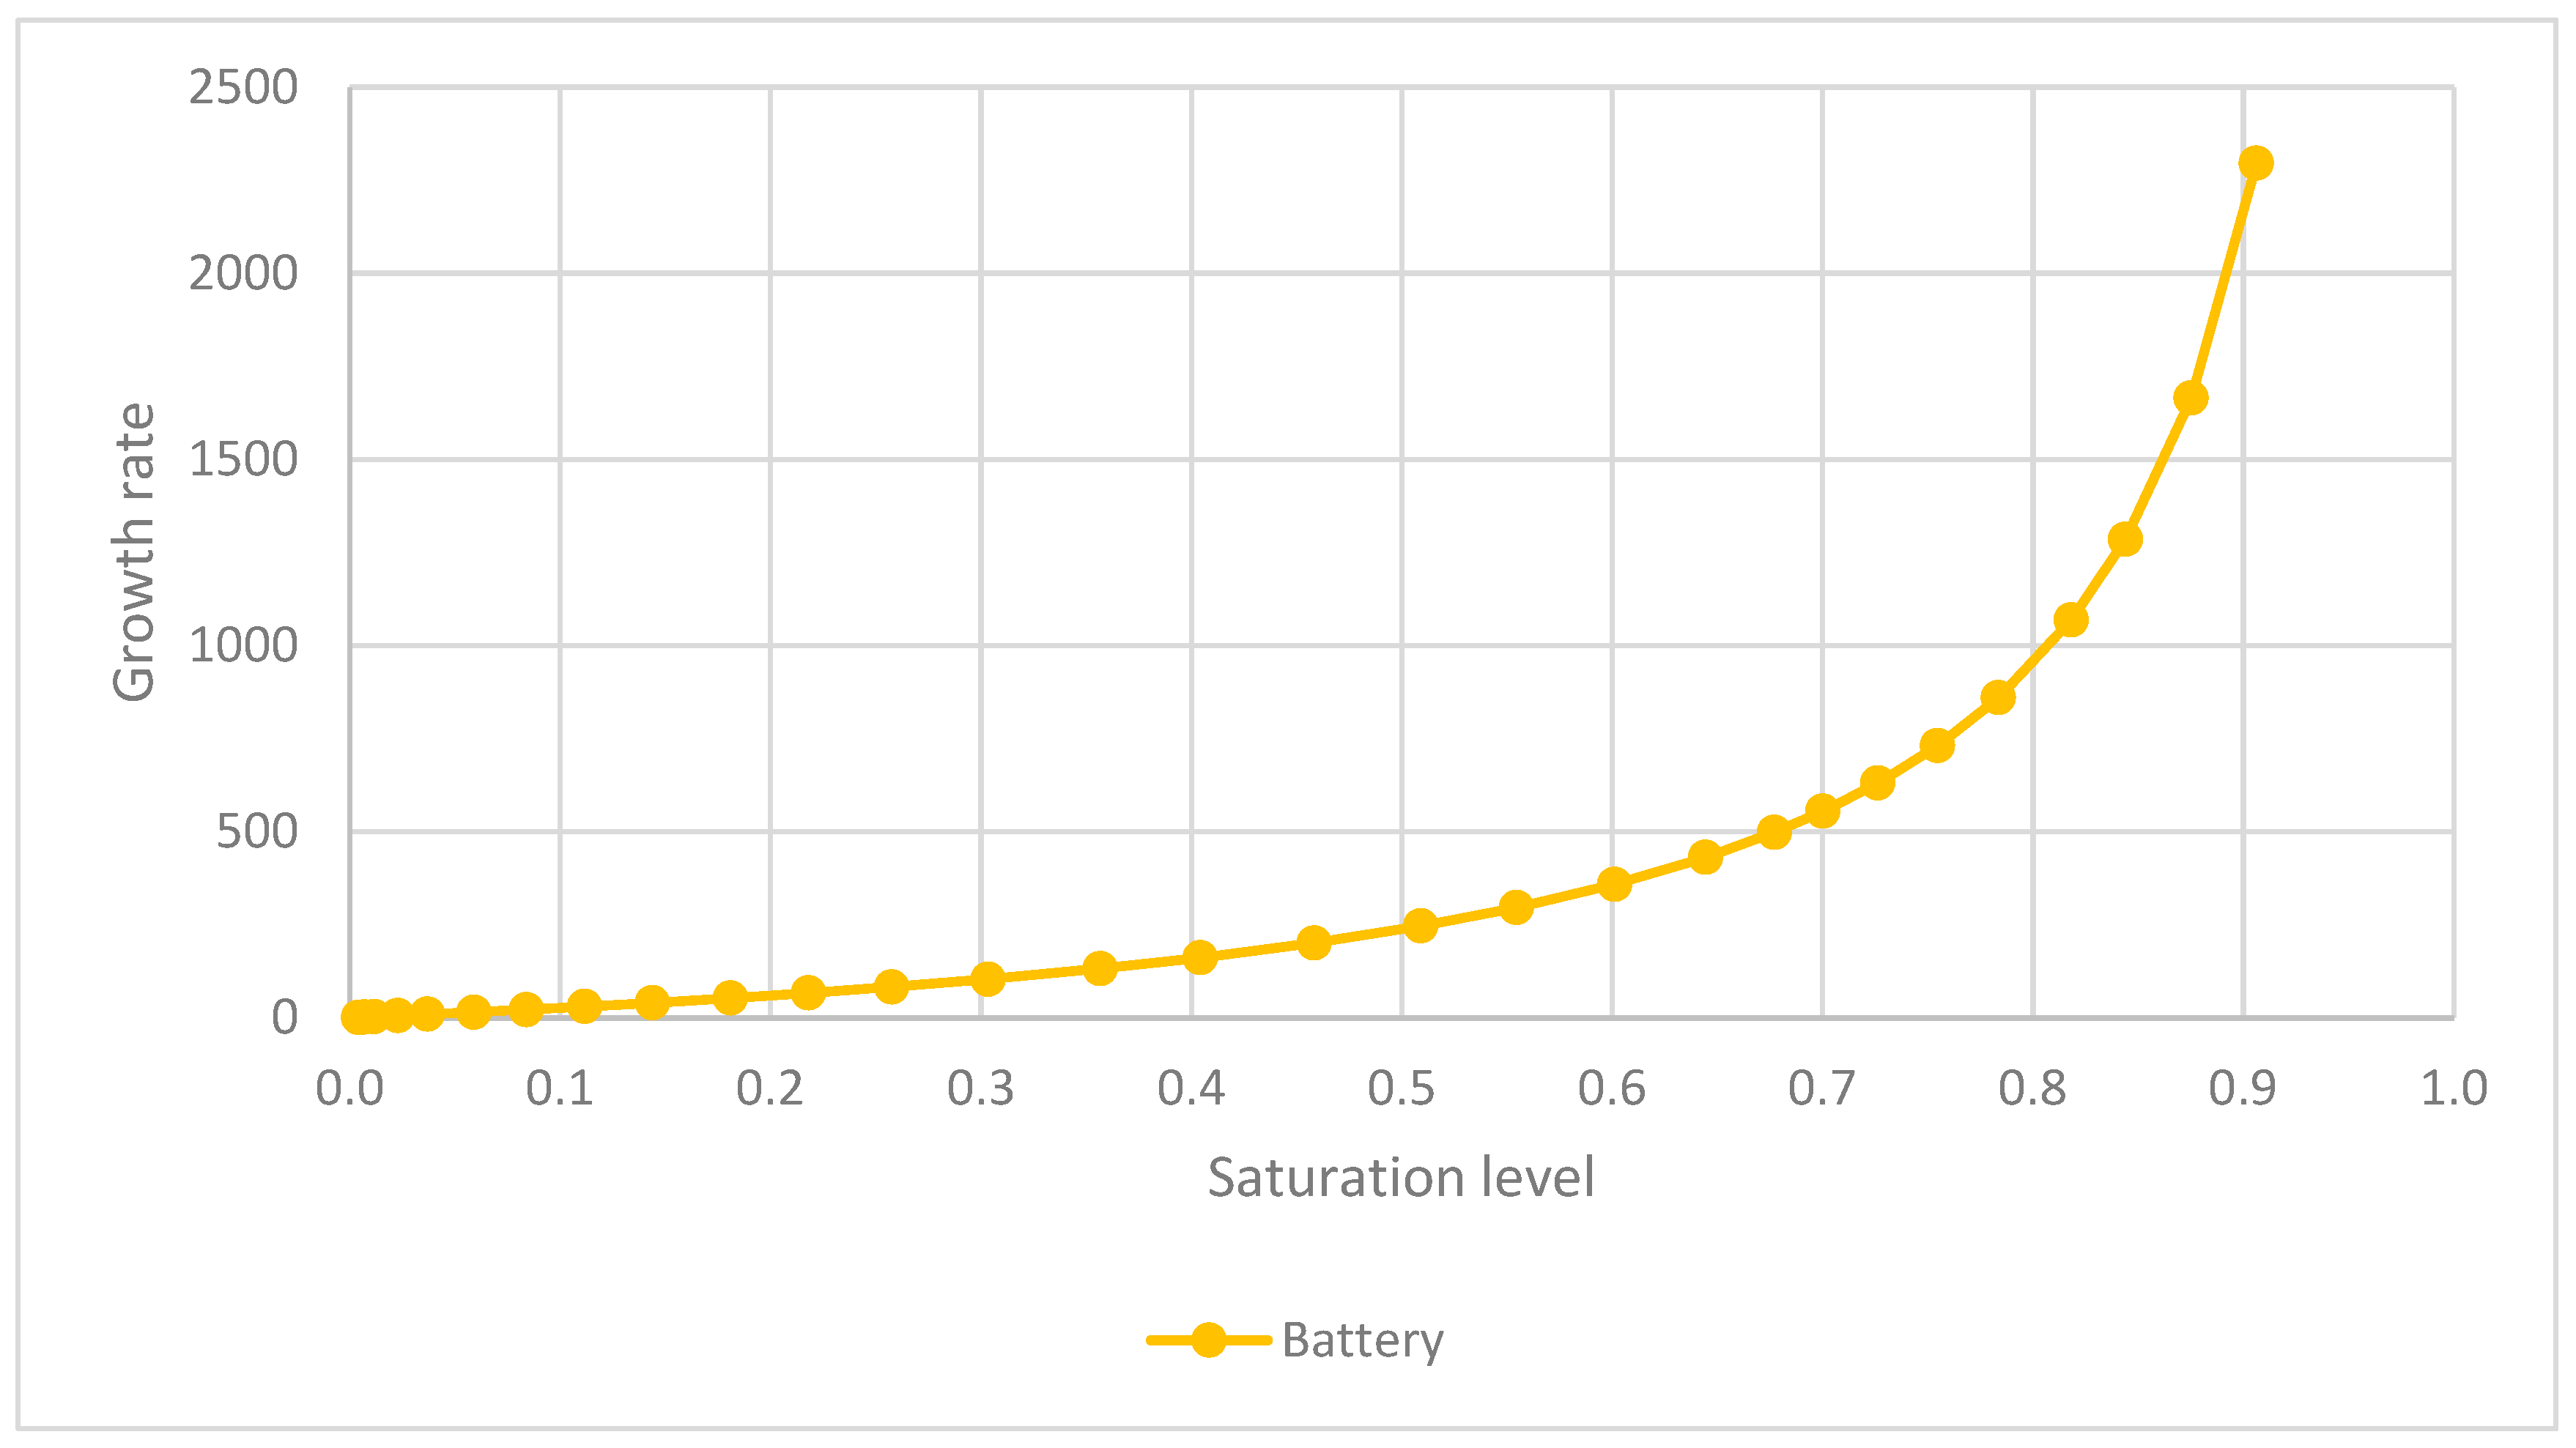
4.2.2. Battery-Storage Market Trends
- Unlike solar and wind, battery storage is expected to reach its bifurcation point (~70% saturation) as early as 2031 (NZS, medium term) and by 2038 (NZS) and 2042 (ETS) for long periods. This therefore initiates a highly speculative period. Battery markets may reach overheating (~90% saturation) by 2048 (ETS, long term), hence raising the probability of a financial bubble.
- The sector’s accelerated growth is driven by technological advancements and declining battery costs, making it a focal point for investors. However, the rapid capital influx increases the risk of overvaluation, making battery storage the most vulnerable sector to speculative investment cycles.
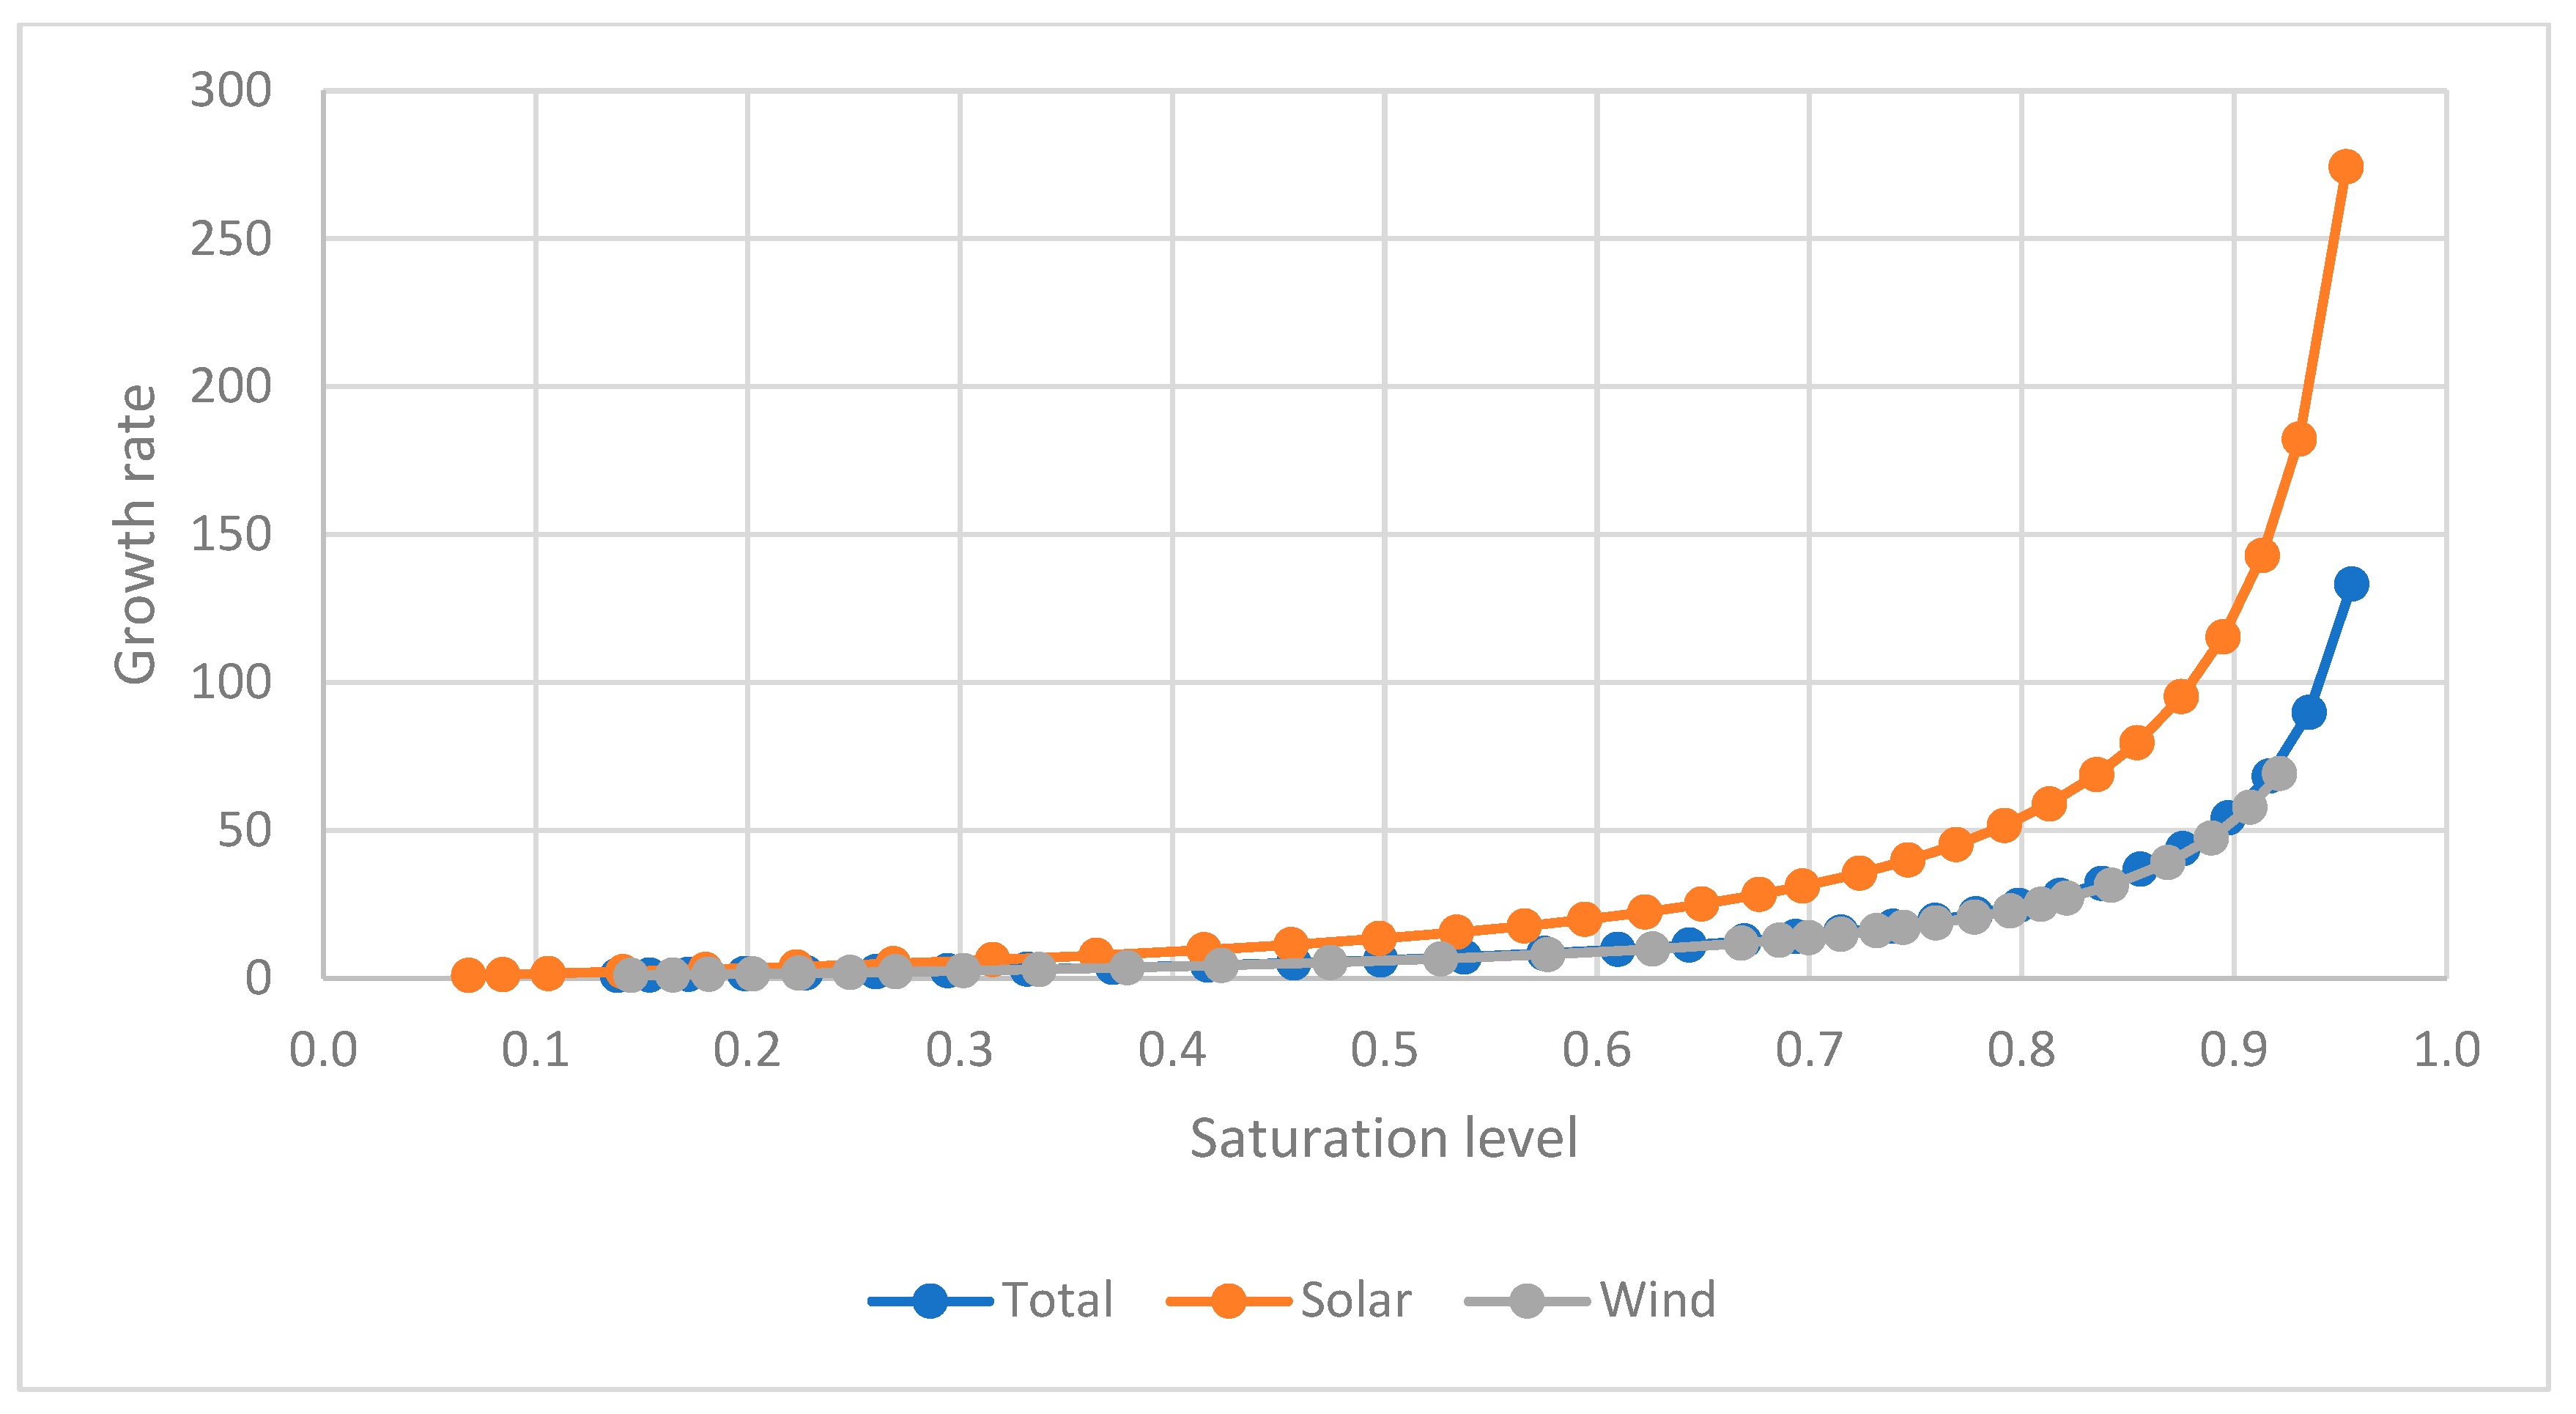
4.3. Financial Saturation and Risk of Speculative Bubbles
4.3.1. Identifying Speculative Phases
- Moderate Growth Phase (below 70% saturation):
- Investment is primarily fundamental and based on market needs.
- Growth remains stable, with limited speculative behavior.
- Heating Phase (~70% saturation, bifurcation point):
- Speculative behavior starts amplifying investment cycles, leading to price overvaluation.
- Investment inflows exceed fundamental demand, creating conditions for a financial bubble.
- Overheating Phase (~90% saturation, risk of bubble burst):
- Market reaches saturation, and new investment no longer yields proportional returns.
- High risk of speculative corrections, driven by shifting investor sentiment.
4.3.2. Sectoral Risk Comparison
- Battery storage is the most vulnerable sector, with bifurcation (70%) expected by 2031 (NZS, medium term) and by 2038 (NZS) and 2042 (ETS) for the long term and overheating (~90%) by 2048 (ETS, long term). Rapid technological advances and aggressive investor speculation increase the risk of overvaluation.
- Solar energy follows, with its bifurcation expected around 2041 (NZS) and 2039 (ETS) for the long term and 2030 (ETS) for the medium term, and overheating (~90% saturation) expected in the long term by 2048 (ETS) and 2050 (NZS). High policy-driven incentives contribute to speculative surges.
- Wind energy is the least vulnerable, with a longer development cycle and more stable investment trends, delaying speculative saturation.
4.3.3. Regulating Speculation in Renewable Energy Markets
- Gradual subsidy reductions instead of abrupt policy shifts to maintain market stability.
- Encouraging long-term investment models over short-term speculative strategies.
5. Discussion
5.1. Comparison with Existing Literature
- Battery storage is the most speculative sector. The findings reflect earlier studies showing that newer technologies with fast growth rates—such as battery storage—are more prone to financial speculation [4,5]. Early bifurcation of battery storage (2031 in the medium term, 2042 in the long term) and expected overheating (~2048) point to this industry being most vulnerable financially.
- High investment volatility of solar energy. Policy-driven incentives, including feed-in tariffs (FiTs), have helped overcome price rises and crashes (e.g., Spain’s solar market collapse) according to historical studies of solar-energy investment cycles [6,9]. This work supports these results by determining 2030 (medium term) and 2039 (long term) as the crucial solar PV bifurcation point.
- Unlike solar and battery storage, wind energy shows reduced saturation risks, which corresponds with past research stressing longer investment cycles and infrastructural restrictions as natural stabilizing forces [10].
5.2. Policy and Investment Implications
5.2.1. Managing Speculative Risks in Renewable Energy Markets
- Gradual Phase-Out of Incentives:
- Governments should avoid abrupt subsidy removals, as seen in past crises (e.g., Spain’s FiT reduction in 2013) [6].
- Instead, gradual reductions in incentives can help maintain investment stability while preventing speculative surges.
- Stronger Financial Oversight:
- Regulatory bodies should monitor financial saturation levels (~70% and ~90% thresholds) to intervene if speculative risks increase.
- Financial stress tests for high-growth renewable energy sectors could prevent overleveraging and mitigate market crashes.
- Diversification of Investment Models:
- Encouraging long-term infrastructure investments (e.g., Power Purchase Agreements) over short-term speculative capital flows would reduce financial instability.
- Governments could support public–private partnerships that focus on sustainable financing.
5.2.2. Implications for Investors
- Battery-Storage Investment Risks: Investors should carefully evaluate market values and refrain from too strong short-term speculation given the great chance of overheating in the battery sector by 2031 and 2038 in different periods.
- The volatility of the solar business calls for hedging techniques like diversified portfolios balancing solar investments with more reliable energy sources.
- Wind energy as a reduced-risk option: Because of its slower saturation trajectory and reduced speculative risks, investors looking for consistent, long-term returns might give wind energy top priority.
5.3. Long-Term Sustainability of Renewable Energy Markets
- Slowness in investments, postponing the energy changeover.
- Loss of public trust, so lowering political and financial backing for next initiatives.
- Market corrections, therefore raising the capital cost for sustainable energy.
- Energy markets should concentrate on sustainable, policy-driven investment strategies instead of speculative development patterns if we are to guarantee long-term stability.
5.4. Limitations of the Research
- Forecast Dependency: The analysis relies heavily on forecast data from Bloomberg’s New Energy Outlook (NEO). While these projections are based on robust methodologies, they remain subject to uncertainties related to future market conditions, technological advancements, and policy changes. The accuracy of the study’s conclusions is inherently tied to the reliability of these forecasts.
- Simplified Model Assumptions: The financial saturation model employed in this study simplifies several variables, such as treating market capacity (Kp) as constant over time. In reality, market capacity is likely to evolve due to technological progress, policy shifts, and infrastructure investments. Future research could refine the model by incorporating dynamic changes in market capacity.
- Time-Lag Complexity: The time lag between financial saturation and market saturation is a critical factor in bubble formation, but its precise dynamics were not fully captured. Quantifying this lag more accurately and understanding its implications across different sectors would enhance the predictive capability of the model.
- Sectoral Generalizations: While the study identifies distinct growth trajectories and saturation dynamics across sectors, it does not delve deeply into sub-sectoral variations or regional differences. For example, market dynamics in developed regions may differ significantly from those in emerging economies.
- Exclusion of External Shocks: The study does not explicitly account for external shocks, such as geopolitical events, macroeconomic instability, or sudden technological disruptions, which could significantly alter market behavior and saturation dynamics.
- Behavioral Factors: Although speculative behavior and investor psychology are discussed conceptually, their quantitative impact on bubble formation was not analyzed. Integrating behavioral finance frameworks could offer deeper insights into how market sentiment influences speculative growth.
6. Conclusions
- Financial bubbles in renewable energy markets emerge as markets approach saturation. The study confirms that bifurcation (~70% saturation) marks the onset of speculative investment, while overheating (~90% saturation) signals a heightened risk of market corrections.
- The model is based on functional relationships, with installed capacity as the independent variable and growth rate as the dependent variable, while other variables remain constant for each scenario and sector. Their accuracy is not assessed. The forecast reliability for the installed capacity is not evaluated, assuming market development follows predefined scenarios. Additionally, the model accounts for investment time lags, recognizing that financial market saturation and potential bubbles may occur before physical capacity saturation.
- The conclusions and recommendations should be seen as theoretical and direction-setting rather than directive. Market capacity and the fulfillment of forecast scenarios are key variables that will determine the accuracy of the study results. Therefore, in order to be able to rely on the results of the studies, it is necessary to assess whether there is no significant change in the capacity of the market and whether the market is evolving according to the scenarios identified. Further studies are recommended to assess the impact of these variables on the accuracy of the estimates.
- Battery storage is the most vulnerable sector to speculative investment. With bifurcation expected by 2031 (NZS, medium term), and by 2038 (NZS) and 2042 (ETS) for the long term, as well as overheating by 2048 (ETS, long term), rapid growth and investor enthusiasm increase the likelihood of market overvaluation.
- Solar PV shows high volatility due to policy-driven investment cycles. The sector is projected to reach bifurcation by 2041 (NZS) and 2039 (ETS) for the long term, and 2030 (ETS) for the medium term, with overheating expected in the long term by 2048 (ETS) and 2050 (NZS), with past market fluctuations indicating sensitivity to policy shifts and financial speculation.
- Wind energy follows a more stable growth trajectory. With a bifurcation point about 2031 (ETS, medium term), by 2045 (NZS) and by 2038 (ETS) for the long term, with overheating at the long term by 2049 (ETS), wind energy benefits from longer investment cycles and infrastructure constraints, making it less prone to financial overheating.
- Strategic regulatory oversight is needed to prevent speculative risks. Gradual subsidy reductions, financial monitoring of market saturation, and diversified investment models can reduce the impact of speculative booms and crashes.
- Ensuring financial stability in renewable energy markets is essential for the energy transition. If speculative bubbles burst, the consequences could delay renewable deployment, increase financing costs, and undermine investor confidence, ultimately affecting climate targets and energy security.
- Future research should refine financial saturation models and assess regional differences. Expanding models to include geopolitical risks and economic factors can improve accuracy, while comparative studies across global markets will provide further insights into policy effectiveness.
Author Contributions
Funding
Data Availability Statement
Acknowledgments
Conflicts of Interest
Abbreviations
| ETS | Economic Transition Scenario |
| FiT | Feed-in Tariff |
| IEA | International Energy Agency |
| MDPI | Multidisciplinary Digital Publishing Institute |
| NEO | New Energy Outlook |
| NZS | Net-Zero Scenario |
| PPA | Power Purchase Agreement |
| PV | Photovoltaic |
| PPPs | Public–Private Partnerships |
| RE | Renewable Energy |
References
- International Energy Agency (IEA). World Energy Outlook 2024; IEA: Paris, France, 2024; Available online: https://www.iea.org/reports/world-energy-outlook-2024 (accessed on 27 January 2025).
- BloombergNEF. New Energy Outlook 2024; BloombergNEF: London, UK, 2024; Available online: https://about.bnef.com/ (accessed on 27 January 2025).
- European Commission. The European Green Deal; European Commission: Brussels, Belgium, 2024; Available online: https://commission.europa.eu/strategy-and-policy/priorities-2019-2024/european-green-deal_en (accessed on 27 January 2025).
- IISD. Fiscal Deficit Forces Spain to Slash Renewable Energy Subsidies; IISD Blog: Tokyo, Japan, 2024; Available online: https://www.iisd.org/gsi/subsidy-watch-blog/fiscal-deficit-forces-spain-slash-renewable-energy-subsidies (accessed on 27 January 2025).
- Blanchard, O.; Watson, M. Bubbles, Rational Expectations and Financial Markets. In Crises in the Economic and Financial Structure; Wachtel, P., Ed.; Lexington Books: Lexington, MA, USA, 1982; pp. 295–315. [Google Scholar]
- Minsky, H.P. The Financial Instability Hypothesis. Challenge 1977, 20, 20–27. [Google Scholar] [CrossRef]
- World Bank. Global Financial Development Database 2022; World Bank: Washington, DC, USA, 2022; Available online: https://www.worldbank.org/en/publication/gfdr/data/global-financial-development-database (accessed on 27 January 2025).
- International Energy Agency (IEA). Global Energy Investment in Clean Energy and in Fossil Fuels, 2015–2023; IEA: Paris, France, 2023; Available online: https://www.iea.org/data-and-statistics/charts/global-energy-investment-in-clean-energy-and-in-fossil-fuels-2015-2023 (accessed on 27 January 2025).
- Hürlimann, C. Valuation of Renewable Energy Investments: Practices Among German and Swiss Investment Professionals; Springer: Cham, Switzerland, 2019. [Google Scholar]
- Afilipoaei, A.; Carrero, G. A Mathematical Model of Financial Bubbles: A Behavioral Approach. Mathematics 2023, 11, 4102. [Google Scholar] [CrossRef]
- Lim, C. The Financial Instability Hypothesis Applied to the 2007 Financial Crisis. Challenge 2018, 61, 20–30. [Google Scholar]
- Girdzijauskas, S. Draudimas; Kiekybinė Finansinė Analizė; Naujasis lankas: Kaunas, Lithuania, 2002. [Google Scholar]
- Girdzijauskas, S. Insights into Financial Saturation Theory: Economic Crises Perspectives; Vilnius University Press: Vilnius, Lithuania, 2024. [Google Scholar]
- Shiller, R.J. Measuring Bubble Expectations and Investor Confidence. J. Psychol. Financ. Mark. 2000, 1, 49–60. [Google Scholar] [CrossRef]
- Akin, I.; Akin, M. Behavioral Finance Impacts on US Stock Market Volatility: An Analysis of Market Anomalies. In Behavioural Public Policy; Cambridge University Press: Cambridge, UK, 2024; pp. 1–25. [Google Scholar]
- Allen, F.; Gale, D. Bubbles and Crises. Econ. J. 2000, 110, 236–255. [Google Scholar] [CrossRef]
- Calvo, G. On Capital Inflows, Liquidity and Bubbles; Mimeographed document; Columbia University: New York, NY, USA, 2011; Available online: https://www.columbia.edu/~gc2286 (accessed on 27 January 2025).
- Sathya, N.; Gayathiri, R. Behavioral Biases in Investment Decisions: An Extensive Literature Review and Pathways for Future Research. J. Inf. Organ. Sci. 2024, 48, 117–131. [Google Scholar] [CrossRef]
- Jlassi, M.; Bensaïda, A. Herding Behavior and Trading Volume: Evidence from the American Indexes. Int. Rev. Manag. Bus. Res. 2014, 3, 705–722. [Google Scholar]
- Bhanu, B.K. Behavioral Finance and Stock Market Anomalies: Exploring Psychological Factors Influencing Investment Decisions. Commer. Econ. Manag. 2023, 23. [Google Scholar]
- Andraszewicz, S. Stock Markets, Market Crashes, and Market Bubbles. In Psychological Perspectives on Financial Decision Making; Springer: Cham, Switzerland, 2020; pp. 205–231. [Google Scholar]
- Jones-Albertus, R.; Cole, W.; Denholm, P.; Feldman, D.; Woodhouse, M.; Margolis, R. Solar on the Rise: How Cost Declines and Grid Integration Shape Solar’s Growth Potential in the United States. MRS Energy Sustain. 2018, 5, E4. [Google Scholar]
- Milder, S. A Struggle to Remake the Market: Feed-in Rates and Alternative Energy in 1980s West Germany. Contemp. Eur. Hist. 2022, 31, 593–609. [Google Scholar] [CrossRef]
- Nobias. Tesla: Nobias Summary; Nobias: New York, NY, USA, 2021; Available online: https://nobias.com/spotlight-finance/2021/2/27/tesla-nobias-summary (accessed on 27 January 2025).
- Business Insider. ‘Quantum’ Leap for EV Battery Stock QS May Not Last; Markets Insider: Limassol, Cyprus, 2023; Available online: https://markets.businessinsider.com/news/stocks/tesla-surge-will-it-help-reflate-the-ev-bubble-1032438788 (accessed on 27 January 2025).
- U.S. Environmental Protection Agency. Summary of Inflation Reduction Act Provisions Related to Renewable Energy; EPA: Washington, DC, USA, 2022. Available online: https://www.epa.gov/green-power-markets/summary-inflation-reduction-act-provisions-related-renewable-energy (accessed on 27 January 2025).
- Brunet, A.; Shafe, M. Beyond Enron: Regulation in Energy Derivatives Trading. Northwest. J. Int. Law Bus. 2007, 27, 665. [Google Scholar]
- Nix, A.; Decker, S.; Wolf, C. Enron and the California Energy Crisis: The Role of Networks in Enabling Organizational Corruption. Bus. Hist. Rev. 2021, 95, 765–802. [Google Scholar] [CrossRef]
- Fan, Y. Dissecting the Dot-Com Bubble in the 1990s NASDAQ. arXiv 2022, arXiv:2206.14130. [Google Scholar]
- Potrykus, M. Dot-Com and AI Bubbles: Can Data from the Past Be Helpful to Match the Price Bubble Euphoria Phase Using Dynamic Time Warping? Financ. Res. Lett. 2023, 67, 105799. [Google Scholar] [CrossRef]
- Zeeshan Shirazi, S.; Mohammad Zeeshan Shirazi, S. Review of Spanish Renewable Energy Policy to Encourage Investment in Solar Photovoltaic. J. Renew. Sustain. Energy 2012, 4, 063116. [Google Scholar] [CrossRef]
- Bacaër, N. Verhulst and the Logistic Equation (1838). In A Short History of Mathematical Population Dynamics; Bacaër, N., Ed.; Springer: London, UK, 2011; pp. 35–39. [Google Scholar] [CrossRef]
- Kapitsa, S. Paradoxes of Growth: World Population and the Global Demographic Transition; Glagoslav Publications: London, UK, 2010; 134p. [Google Scholar]
- Gryshova, I.; Shabatura, T.; Girdzijauskas, S.; Streimikiene, D.; Ciegis, R.; Griesiene, I. The Paradox of Value and Economic Bubbles: New Insights for Sustainable Economic Development. Sustainability 2019, 11, 6888. [Google Scholar] [CrossRef]
- Karasa, D.; Girdzijauskas, S.A. Analysis of the Green Stock Market Bubble Based on Financial Saturation Theory. Transform. Bus. Econ. 2023, 22, 920. Available online: http://www.transformations.knf.vu.lt/63a/article/anals (accessed on 27 January 2025).
- Girdzijauskas, S.; Streimikiene, D.; Mialik, A. Economic Growth, Capitalism and Unknown Economic Paradoxes. Sustainability 2012, 4, 2818–2837. [Google Scholar] [CrossRef]
- Grinin, L. A Mathematical Model of Juglar Cycles and the Prospects of World Economic Development. Math. Model. Nat. Phenom. 2010, 5, 98–113. Available online: https://www.semanticscholar.org/paper/A-Mathematical-Model-of-Juglar-Cycles-and-the-Grinin/782c8b0b787cf79bf38e14304f870b552643ebbb (accessed on 27 January 2025).
- Bordo, M.D.; Jeanne, O. Boom-Busts in Asset Prices, Economic Instability, and Monetary Policy. NBER Macroecon. Annu. 2002, 17, 213–259. Available online: https://www.jstor.org/stable/2060134 (accessed on 27 January 2025).
- Selivanova, Y.S. Changes in Renewables Support Policy and Investment Protection under the Energy Charter Treaty: Analysis of Jurisprudence and Outlook for Current Arbitration Cases. ICSID Rev. Foreign Investment. Law J. 2018, 33, 433–455. [Google Scholar] [CrossRef]
- Kuznets, S. Economic Growth and Structure: Selected Essays; Norton: New York, NY, USA, 1965. [Google Scholar]
- Haken, H. Synergetics—A Universal Principle beyond Physics. In Self-Organizing Systems; Springer: Berlin/Heidelberg, Germany, 2011; pp. 503–513. [Google Scholar] [CrossRef]
- Schwartz, H.M.; McCarthy, J.; Adamo, S. Speculative Bubbles and Sustainability in Financial Markets. J. Behav. Financ. 2012, 13, 167–179. [Google Scholar] [CrossRef]


| ETS | ||||||||
|---|---|---|---|---|---|---|---|---|
| Long-Term | Mid-Term | |||||||
| Stage | Total | Solar | Wind | Battery | Total | Solar | Wind | Battery |
| Heating (2nd period) start or bifurcation, year | 2038 | 2039 | 2038 | 2042 | 2030 | 2030 | 2031 | - |
| Boiling (3rd period) start, year | 2048 | 2048 | 2049 | 2048 | - | - | - | - |
| NZS | ||||||||
| Long-Term | Mid-Term | |||||||
| Total | Solar | Wind | Battery | Total | Solar | Wind | Battery | |
| Heating (2nd period) start or bifurcation, year | 2042 | 2041 | 2045 | 2038 | - | - | - | 2031 |
| Boiling (3rd period) start, year | - | 2050 | - | - | - | - | - | - |
Disclaimer/Publisher’s Note: The statements, opinions and data contained in all publications are solely those of the individual author(s) and contributor(s) and not of MDPI and/or the editor(s). MDPI and/or the editor(s) disclaim responsibility for any injury to people or property resulting from any ideas, methods, instructions or products referred to in the content. |
© 2025 by the authors. Licensee MDPI, Basel, Switzerland. This article is an open access article distributed under the terms and conditions of the Creative Commons Attribution (CC BY) license (https://creativecommons.org/licenses/by/4.0/).
Share and Cite
Mikalauskas, I.; Karaša, D. The Risk of Financial Bubbles in Renewable Energy Markets. Energies 2025, 18, 1400. https://doi.org/10.3390/en18061400
Mikalauskas I, Karaša D. The Risk of Financial Bubbles in Renewable Energy Markets. Energies. 2025; 18(6):1400. https://doi.org/10.3390/en18061400
Chicago/Turabian StyleMikalauskas, Ignas, and Darius Karaša. 2025. "The Risk of Financial Bubbles in Renewable Energy Markets" Energies 18, no. 6: 1400. https://doi.org/10.3390/en18061400
APA StyleMikalauskas, I., & Karaša, D. (2025). The Risk of Financial Bubbles in Renewable Energy Markets. Energies, 18(6), 1400. https://doi.org/10.3390/en18061400