Article

Multi-Objective Optimization of Blockage Design Parameters Affecting the Performance of PEMFC by OEM-AHP-EWM Analysis

1
Vehicle Energy and Safety Laboratory, Department of Mechanical Engineering, Ningbo University of Technology, Ningbo 315336, China
2
CATARC Automotive Test Center (Ningbo) Co., Ltd., Ningbo 315336, China
3
Department of Science, Institute for Information Technologies Kragujevac, University of Kragujevac, Jovana Cvijića bb, 34000 Kragujevac, Serbia
*
Author to whom correspondence should be addressed.
Energies 2025, 18(6), 1407; https://doi.org/10.3390/en18061407
Submission received: 13 January 2025 / Revised: 2 March 2025 / Accepted: 8 March 2025 / Published: 12 March 2025

Abstract

:
Adding blockages to the gas flow channels in the bipolar plates has a significant effect on the performance of the proton exchange membrane fuel cell (PEMFC). The design parameters of the gas flow channels with blockages mainly include the blockage shape (S), blockage number (N), blockage height (H), and channel–rib width ratio (CRWR) value. This paper systematically examines the combined effects of S, N, H, and CRWR value on current density (I), pressure drop (ΔP), net output power (Wnet), and non-uniformity of oxygen distribution (NU) of PEMFC through the application of the orthogonal experimental method (OEM). To provide a comprehensive optimization strategy, a novel multi-criteria decision framework is introduced, which integrates the analytic hierarchy process (AHP) and entropy weight method (EWM) to balance different evaluation objectives. Results from the AHP-EWM analysis reveal that the weight values of I, ΔP, Wnet, and NU are 0.415, 0.08, 0.325, and 0.18, respectively. The CRWR value exhibits the greatest effect on the comprehensive performance of PEMFC, followed by H, N, and S. The optimal design parameter combination identified in this paper is a triangular blockage with nine blockages, a height of 0.8 mm, and a CRWR value of 0.25, corresponding to the highest comprehensive score of 31.8306 among the 25 groups of orthogonal experiments. This paper provides a new optimization perspective and certain guidance for the performance optimization direction of PEMFC.

1. Introduction

Since the 1960s, proton exchange membrane fuel cells (PEMFCs) have developed rapidly due to their advantages of high energy efficiency and zero pollution [1]. Currently, they are widely applied to automotive applications, distributed generation systems, and large vessels [2,3,4,5], and the installed power of PEMFCs has also increased significantly [5,6]. Therefore, they are considered to be the most promising energy conversion devices in the 21st century. However, the production of fuel cells with high performance, high reliability, and long-term durability at low cost remains a top priority for research and development [7,8]. For example, the limited lifespan of PEMFCs still hinders their commercialization. Over prolonged operation periods, the performance of PEMFCs gradually deteriorates due to intricate operational conditions and component aging, eventually reaching the minimum acceptable threshold [9]. Hence, Prognosis and Health Management (PHM) is vital for PEMFCs to enable proactive interventions to prevent fuel cell failures, consequently prolonging the life of the PEMFCs. To achieve this target, different investigations from various aspects of PEMFCs have been conducted. For example, researchers are committed to improving the original catalysts [10,11], developing novel proton exchange membranes (PEM) [12,13,14], and proposing bio-inspired flow channel designs [15,16].
Adding blockages in the gas flow channel is also an effective and popular method to further improve the performance of PEMFCs, which has a great influence on the transportation of reactants and drainage capacity during the operation of PEMFCs. Therefore, researchers have conducted a series of comparative analyses and optimization studies on different blockages [17]. Perng et al. [18] studied the performance of PEMFCs with different numbers of rectangular blockages in the anode and cathode flow channels and demonstrated that the net power of PEMFCs with five blockages was 8% higher than that of PEMFCs without blockages. They [19] also examined the influence of various angles and heights of trapezoid blockages on the performance and illustrated that the trapezoidal blockage with an angle of 60° and a height of 1.125 mm increased the net power of PEMFCs by about 90% compared with the conventional straight flow channel (CSFC). Similarly. Yin et al. [20] found that when the trapezoidal blockage leading angle and trailing angle both were 45°, the average current density was increased by 10.7% and 6.4% in comparison with the CSFC and the blockage with a trailing angle of 90°. In addition, when the number of trapezoidal blockages was five, the drainage capacity of the PEMFCs was remarkable. Wang et al. [21] proposed a parallel trapezoid blockage plate (PTBP) and a staggered trapezoid blockage plate (STBP), and revealed that compared with the CSFC and PTBP, the maximum net power of the STBP increased by 6.39% and 2.54%, respectively. Chen et al. [22] designed the wave flow channel and simulated the effects of different flow channel minimum depths and wavelengths on the performance of PEMFCs. The results showed that the minimum depth and wavelength of the optimal flow channel were 0.45 mm and 2 mm, and the current density was 23.8% higher than that of the CSFC at 0.4 V. Cai et al. [23] used a genetic algorithm to optimize the influence of channel center amplitude and the number of waves on current density and pressure drop of PEMFCs. The results demonstrated that the output power density of the optimal channel with a center amplitude of 0.305 mm and the number of waves of 3.52 was increased by 2.2% in comparison with the CSFC.
In addition to adding blockages to the gas flow channel mentioned above, changing the channel–rib width ratio (CRWR) is also one of the important factors affecting the performance of PEMFCs. Kerkoub et al. [24] studied the effects of six different CRWR values on the performance of PEMFCs based on parallel, serpentine, and interdigitated flow channels and found that reducing the CRWR value could improve the performance of PEMFCs; the serpentine flow field had the best performance under the same CRWR value conditions. At high operating current densities, the massive accumulation of liquid water in the gas diffusion layer (GDL) will lead to flooding and impede gas diffusion, resulting in rapid degradation of cell performance [25]. Jeon [26] investigated the effect of CRWR on water transport behavior using a multiphase lattice Boltzmann method and found that a large CRWR value would help enhance water removal in the GDL, but if the CRWR value was very large, it may lead to mass transport limitations. Xia et al. [27] found that increasing CRWR value was beneficial to gas diffusion in porous electrodes, but the longer electron motion paths led to higher ohmic losses and revealed that the optimal CRWR value was about 1, with a peak power density of 0.428 W/cm2. Varghese et al. [28] also proved the above conclusion and demonstrated that the performance of PEMFCs decreased mainly due to the contact resistance between the bipolar plate (BP) and GDL surface as the CRWR value increased. Wang et al. [29] showed that increasing the rib area ratio to 30% could reduce the electrical resistance of fuel cells and improve performance. Compared with the rib area ratio of 70%, rib area ratios of 20% and 30% improved the performance of PEMFCs by 24.3%.
In conclusion, it can be seen that adding blockages and changing the CRWR value both have a significant influence on the performance of PEMFCs. However, although the above-mentioned literature has explored the effect of individual design parameters on the efficiency of PEMFC, there is still a lack of comprehensive research to examine the synergistic effects of these factors on the performance of PEMFCs systematically and efficiently. In this paper, the combined effects of blockage shape, blockage number, blockage height, and CRWR value are systematically studied using the orthogonal experimental method (OEM), and a new method for optimizing the performance of PEMFCs using a multi-criteria decision framework is introduced. The framework integrates the analytic hierarchy process (AHP) and the entropy weight method (EWM) to balance the performance objectives, providing a more comprehensive optimization strategy. There are three steps to this work: (i) the experimental matrix is designed using an L25(56) orthogonal table, effectively reducing the number of simulations while considering four design parameters for each of the five levels; (ii) multi-objective evaluation methods (AHP-EWM) are applied to determine the relative importance of performance objectives such as current density, pressure drop, net output power, and non-uniformity of oxygen distribution; and (iii) analysis of range (ANOR) and analysis of variance (ANOVA) are conducted to determine the most optimal design parameters to optimize the PEMFC configuration with the objective of comprehensive scores. This method not only reduces the computational complexity but also deepens the understanding of the interaction between different design parameters. This study provides certain guidance for the performance of PEMFC optimization.

2. Models

2.1. Physical Model

A three-dimensional physical model of a single-channel PEMFC unit with blockages is established in Figure 1. The PEMFCs mainly include an anode bipolar plate (ABP), anode gas diffusion layer (AGDL), anode microporous layer (AMPL), anode catalyst layer (ACL), proton exchange membrane (PEM), cathode bipolar plate (CBP), cathode gas diffusion layer (CGDL), cathode microporous layer (CMPL), and cathode catalyst layer (CCL). The length (L) of BP is 23 mm, the width (W) is 2 mm, and the height (H) is 1.5 mm; the height (h) of the gas flow channel is 1 mm; and the thicknesses of the GDL, the microporous layer (MPL), the catalyst layer (CL), and the PEM are 0.3 mm, 0.05 mm, 0.0129 mm, and 0.108 mm, respectively. The other relevant physical and operating parameters are listed in detail in Table 1.

2.2. Numerical Model

2.2.1. Governing Equations

To simplify the calculation process for PEMFCs, several commonly accepted assumptions were employed, detailed as follows [30,31]:
(1)
The PEMFC model was considered to operate under non-isothermal, steady-state conditions.
(2)
The gas mixtures were treated as incompressible and conform to ideal gas.
(3)
The flow of inlet reactants within the channel was presumed to be laminar.
(4)
The impact of gravity was disregarded.
(5)
Porous materials were assumed to possess homogeneous and isotropic properties.
Based on the aforementioned assumptions, the governing equations for PEMFCs can be summarized as follows [32]:
Continuity equation:
ρ u = S c
where ρ, u, and Sc are the density, velocity vector, and mass source.
Momentum equation:
ε ρ u u = ε P + ε μ u + S m
where ε, P, μ, and Sm are the porosity, pressure, viscosity, and momentum source. The Sm can be stated as:
Anode and cathode channels:
S m = 0
Porous zones:
S m = μ K ε 2 u
where K is the permeability.
Conservation of species:
ρ w i j = 1 N D i j _ e f f M M j w j + w j M M + x j w j P P + w i ρ u = S i
where w, Dij_eff, x, M, and Si are the mass fraction, effective binary diffusion coefficient, molar fraction, molecular mass, and source term of different species. The Si can be stated as:
Hydrogen :   S H 2 = j a 2 F M H 2
Oxygen :   S O 2 = j c 4 F M O 2
Water :   S H 2 O = j c 2 F M H 2 O
The Dij_eff is described by Bruggeman’s correlation as follows:
D i j _ e f f = ε 1.5 D i j
D i j = D i j _ r e f T T 0 1.5
where Dij, Dij_ref, T, and T0 are the binary diffusivity, reference binary diffusivity, operating temperature, and reference temperature.
Conversation of charge:
σ s φ s = S φ s
σ m φ m = S φ m
where σ, φ, and Sφ are the electric conductivity, phase potential, and source term of the current. The subscripts ‘s’ and ‘m’ are solid and membrane. The Sφ can be stated as:
Anode   catalyst :   S φ s = j a         S φ m = j a
Cathode   catalyst :   S φ s = j c         S φ m = j c
where j is the transfer current density and subscripts ‘a’ and ‘c’ are anode and cathode, which can be obtained from the Bulter–Volmer function as follows:
j a = a i 0 , a r e f C H 2 C H 2 , r e f 0.5 α a + α c R T F η a
j c = a i 0 , c r e f C O 2 C O 2 , r e f exp α c R T F η c
where a, i0, α, F, η, and R are the electrocatalytic surface area, exchange current density, transfer coefficient, Faraday’s constant, activation overvoltage, and universal gas constant.

2.2.2. Boundary Conditions

The boundary conditions for the numerical simulation were set as follows:
(1) The symmetric boundary conditions were employed on both sides of the x-axis;
(2) The no-flux condition was applied to the external boundaries and the no-slip condition was used to all flow channel walls;
(3) The anode current collector was set to zero and the cathode current collector was set to the operating voltage;
(4) The inlet and outlet of the gas flow channel were set as mass flow rate and pressure outlet. The value of the mass flow rate at the inlets can be obtained from the following equations [33,34]:
m a = ρ g a ζ a I ref A act 2 F C H 2 A in a   m c = ρ g c ζ c I ref A act 4 F C O 2 A in c
C H 2 = P g a + Δ P g a R H a P sat R T   C H 2 O a = R H a P sat R T
ρ g a = C H 2 a M H 2 + C H 2 O a M H 2 O
C O 2 = 0.21 P g c + Δ P g c R H c P sat R T   C H 2 O c = R H c P sat R T   C N 2 c = 0.79 P g c + Δ P g c R H c P sat R T
ρ g c = C H 2 a M H 2 + C H 2 O a M H 2 O
Y i = M i C i M i C i
where ζ, Aact, Iref, Ain, and C are the stoichiometry ratio, active area, reference current density, inlet area, and molar concentrations, respectively.

2.3. Model Validation and Grid Independence Test

2.3.1. Model Validation

To ensure the reliability of the computational model results, the PFF with an active area of approximately 5.3 cm2 from Zhang et al. [35] was selected. The operating pressure was 253,312.5 Pa, the operating temperature was 353.15 K, the stoichiometry ratios of oxygen and hydrogen were both 2.0, and their relative humidities were both 30%. The polarization curves obtained from both numerical simulation and experiment under identical operating conditions were compared, as presented in Figure 2. The root mean square error between the two sets of data was 0.048, demonstrating that the PEMFC model is validated and dependable.

2.3.2. Mesh Validation

The numerical simulation in this paper was conducted using the ICEM 2020 R1 software to mesh the three-dimensional model and the PEMFC module included with ANSYS Fluent 2020 R1 to simulate different operating conditions. The PEMFC unit with a single channel was established for grid independence to eliminate the influence of the grid on the simulation results. Table 2 shows the calculation results of current density for five different grid sizes when the operating voltage was 0.4 V. It can be seen from the table that the relative error of current density between Grid 4 and Grid 5 was only 0.1%. Therefore, taking into account the simulation accuracy and computational efficiency, Grid 4 with a grid size of 136,275 was chosen as the basic number of grids for all PEMFC models.

3. Research Methods

Figure 3 is a flowchart of the multi-criteria decision framework, which mainly combines the OEM-AHP-EWM analysis. A detailed introduction to these three methods will be provided.

3.1. OEM Introduction

For multi-objective optimization experiments, if the control variable method is used to individually study the effects of different design parameters and their combinations, numerous simulation cases are required, which will cost huge computing resources and time costs. For example, if there are four operation parameters and the five levels are selected for each operating parameter, a total of 54 = 625 groups of simulation cases would be needed to comprehensively evaluate each combination. To address this issue, the orthogonal experimental method is usually used to arrange experiments due to its advantages of fewer experiments and higher efficiency. Therefore, in this section, an orthogonal table was used to arrange the simulation cases, thus minimizing the computational workload. This approach enables a systematic and efficient analysis of the effects of different parameter combinations, optimizing resource usage without compromising the integrity of the results.
The shapes (S), numbers (N), and heights (H) of blockages, along with the CRWR value, have a significant influence on the performance of PEMFC. Therefore, these factors with different design combinations were selected as the research object. As illustrated in Figure 4, the shapes of blockage S were triangular (Tri), wave (Wav), rectangular (Rec), trapezoidal (Tra), and sectorial (Sec); the numbers of blockage N were 3, 4, 5, 7, and 9; the heights of blockage H (mm) were 0.4, 0.5, 0.6, 0.7, and 0.8; the CRWR values were 4, 3, 1.5, 1, and 0.25. The orthogonal levels and factors are listed in Table 3. According to the principle of orthogonal experimental design, the L25(56) orthogonal table was adopted, as shown in Table 4.

3.2. AHP Introduction

The AHP method is a decision-making method that integrates both qualitative and quantitative analysis to calculate the weights of different evaluation objectives. According to the nine-level scale method of AHP theory, experts are required to score the relative importance of different evaluation objectives within the same level to form a judgment matrix. The judgment matrix is then normalized to calculate the weights of the evaluation objective. To ensure the reliability of the results, the consistency index (CI) and consistency ratio (CR) are solved for consistency checking. The relevant equations are presented as follows:
C I = λ max n n 1
C R = C I R I
where λmax is maximum characteristic roots and n is the total number of influencing factors, n = 4. RI is random consistency index, which is selected from Table 5. If CR < 0.1, the consistency of the judgment matrix is considered acceptable [36].

3.3. EWM Introduction

The EWM method is an objective weighting method used to determine the weights of each evaluation objective in decision analysis. Firstly, the evaluation matrix is constructed, and the matrix is next normalized to eliminate any scale differences between the criteria. After the normalization, the entropy value of the different evaluation objectives is calculated, which reflects the degree of dispersion or uncertainty associated with the objective. Finally, the weight value of each evaluation objective is calculated. The equations used in this method are as follows:
M = m 11 m 12 m 1 b m 21 m 22 m 2 b m a 1 m a 2 m a b Normalizing   process n i j = m i j m i j min j m i j max j m i j min j ( Positive   objective ) n i j = m i j max j m i j m i j max j m i j min j ( Negative   objective ) N = n 11 n 12 n 1 b n 21 n 22 n 2 b n a 1 n a 2 n a b
E j = 1 ln a i = 1 a p i j ln p i j
p i j = n i j / i = 1 a n i j
d j = 1 E j
W j = d j / i = 1 a d j
where M is the original matrix, N is the normalization matrix, a is number of nodes, b is number of factors, mij is value of each parameter, Ej is entropy, dj is degree of diversification, and Wj is weight.

3.4. Evaluation Objectives

The performance of PEMFCs is described from four key evaluation objectives, namely current density (I), pressure drop (ΔP), net output power (Wnet), and non-uniformity of oxygen distribution (NU). The solutions for the last three objectives mentioned above are as follows:
(1) Pressure drop (ΔP) is solved by the pressure difference between the inlet (Pin) and outlet (Pout) on the cathode side, and the equation is as follows:
Δ P = P in P out
(2) Net output power (Wnet) is defined as the difference between the gross power produced (Wfuel cell) and the energy consumed (Wp) in the PEMFC, and the equation is as follows:
W net = W fuel   cell - W p
W p = Δ P × A ch × u in
where Ach is the area of the inlet and uin is the inlet velocity.
(3) Non-uniformity of oxygen distribution (NU) is calculated as the uniformity of oxygen distribution at the surface of GDL and CL at the cathode side, and the equation is as follows:
N = f f ¯ 2 d S f ¯ 2 d S
f ¯ = f d S d S
where f is the value of oxygen molar concentration.

4. Results and Discussion

4.1. Data Acquisition by OEM

According to the sequence of cases designed in the orthogonal table, numerical simulations were conducted for each set of parameter combinations. The relevant data obtained from these simulations were systematically recorded and are presented in Table 6.

4.2. Analyses of AHP and EWM

4.2.1. Weights Calculation Using AHP

(1)
Construct and normalize the data judgment matrix
Experts were invited to score the current density, pressure drop, net power, and non-uniformity of oxygen concentration according to the nine-level scale method. The scoring results are listed in Table 7. The scoring results were formed into a data judgment matrix A. Then, each column of the scoring results in Table 7 was normalized to form the normalized data, as listed in Table 8. The method of processing data was to divide the data in each column by the sum of the columns to obtain normalized data.
The original judgment matrix A was as follows:
A = 1 7 2 5 1 / 7 1 1 / 6 1 / 3 1 / 2 6 1 4 1 / 5 3 1 / 4 1
(2)
Calculate weights of evaluation objectives
The weight of each evaluation objective was obtained by taking the average of the values in each row. The corresponding weights of evaluation objectives obtained were I = 0.51, ΔP = 0.05, Wnet = 0.33, and NU = 0.11, respectively. These weights provided a quantitative basis for the overall performance evaluation framework.
(3)
Consistency checking
The weights solved above were formed into a weight vector w. The weight vector w = [0.51, 0.05, 0.33, 0.11]. Multiplying judgment matrix A with weight vector w:
A w = 0.51 ,   0 . 05 ,   0 . 33 ,   0 . 11 1 7 2 5 1 / 7 1 1 / 6 1 / 3 1 / 2 6 1 4 1 / 5 3 1 / 4 1 = 2.107 0.219 1.360 0.459
Further, solving for the maximum characteristic roots λmax:
λ max = 1 n n = 1 n A w i w i = 1 4 4.165 + 4.027 + 4.1716 + 4.040 = 4.101
According to Equations (23) and (24), the value of CR was calculated to be approximately 0.0374, which was well below the threshold of 0.1. This low CR value indicates that the judgment matrix performs a high level of internal consistency, and the calculated weights were acceptable.

4.2.2. Weights Calculation Using EWM

(1)
Construct and normalize the original data matrix
The original data matrix M was composed of 25 groups of orthogonal experimental data with four evaluation objects. Then the Min–Max normalization method was used to normalize the original matrix, rescaling the data to a uniform range, typically between 0 and 1, to obtain the normalized matrix N. The results are shown below (only partial normalized matrix data is displayed):
M = 1.1101 3.31 0.2043 0.3439 1.1098 4.76 0.2042 0.3418 1.1266 9.53 0.2073 0.3395 1.1078 27.60 0.2038 0.3408 N = 0.9083 1 0.9095 0.2921 0.9075 0.9963 0.9080 0.4101 0.9519 0.9840 0.9526 0.5393 0.9022 0.9375 0.9023 0.4663
(2)
Calculate the Ej and dj for each criterion
According to Equations (26)–(28), the entropy Ej and degree of diversification dj of each evaluation object were calculated as shown in Table 9.
(3)
Calculate the Wj for each criterion
According to Equation (29), the value of weight for each criterion was calculated as I = 0.32, ΔP = 0.11, Wnet = 0.32, and NU = 0.25, respectively.

4.2.3. Determination of Comprehensive Weights by AHP-EWM

The comprehensive weight (Wcom) is solved by Equation (39), which is obtained from the weight data calculated by the AHP method (WAHP) and EWM method (WEWM), respectively. This method has been applied in multiple fields [33,37]. By integrating these two methods, the AHP-EWM method balances subjective expert judgment with objective data dispersion, resulting in a more robust weighting model. The weights solved by AHP, EWM, and AHP-EWM are listed in Table 10.
W com = α W AHP + β W EWM
β = 1 α
where α and β are the resolution factor, with α usually taken as 0.5 [37].

4.3. Analysis of ANOR and ANOVA

Based on the orthogonal experimental data in Section 4.1, the comprehensive score calculated by the AHP-EWM weight method was used as the main evaluation object of PEMFCs, as listed in Table 11 and Figure 5. To further investigate the influence of different factors, the ANOR and ANOVA were used to analyze the above data by Minitab 21.
The range value R represents the difference between the maximum value and the minimum value of the average numerical simulation results at each level under single-factor conditions. The larger the range value R, the greater the influence weight of this factor on performance objectives. The results of ANOR for the comprehensive score are listed in Table 12. According to the data of ANOR, the influence ability of each factor was CRWR value > H > N > S. The CRWR value affects the performance of PEMFCs by influencing electron transport, reactant distribution, and pressure loss. A higher CRWR value will reduce contact area and increase Ohmic losses, but it will improve reactant distribution and reduce pressure losses, although this may lead to uneven flow distribution. In contrast, a lower CRWR value enhances electron conduction and water removal, but increases local resistance. Subsequently, the ANOVA was further conducted. With a degree of freedom (DOF) consideration, the critical F-value at α = 0.025 was F(0.025, 4, 8) = 5.053, and the calculated ANOVA results are shown in Table 13. According to the data of ANOVA, the influence ability of each factor was CRWR value > H > N > S. The influence orders of ANOR and ANOVA were consistent.
In addition, Figure 6 illustrates the effect curve of ANOR analysis, which identifies the optimal design parameter combination for the PEMFC configuration. This optimal design parameter combination is triangular blockage with a number of nine, a height of 0.8 mm, and a CRWR value of 0.25. The optimal combination corresponds to Case No. 5. Based on the comprehensive weighting calculated using the AHP-EWM method, this configuration achieved a comprehensive score of 31.8306, which is the highest score among the 25 groups of orthogonal experiments.
The OEM-AHP-EWM method was introduced in this paper, which was utilized to provide a multi-dimensional evaluation framework. This comprehensive evaluation capability makes it possible to fully consider the influence of different factors on the performance of PEMFCs, thereby leading to more accurate optimization conclusions.

5. Conclusions

In this paper, the combined effects of the shape, number, height of blockage, and CRWR value on the performance of PEMFCs were systematically investigated using OEM. Additionally, multi-objective optimization and performance evaluation of PEMFC were conducted by integrating the AHP and EWM. The main conclusions are as follows:
(1)
The AHP-EWM analysis revealed that current density (I) and net output power (Wnet) are the most critical factors in PEMFC performance evaluation, with weights of 0.415 and 0.325, respectively. In contrast, the weights assigned to pressure drop (ΔP) and non-uniformity of oxygen distribution (NU) were 0.08 and 0.18, emphasizing the dominant role of current density in the overall performance evaluation.
(2)
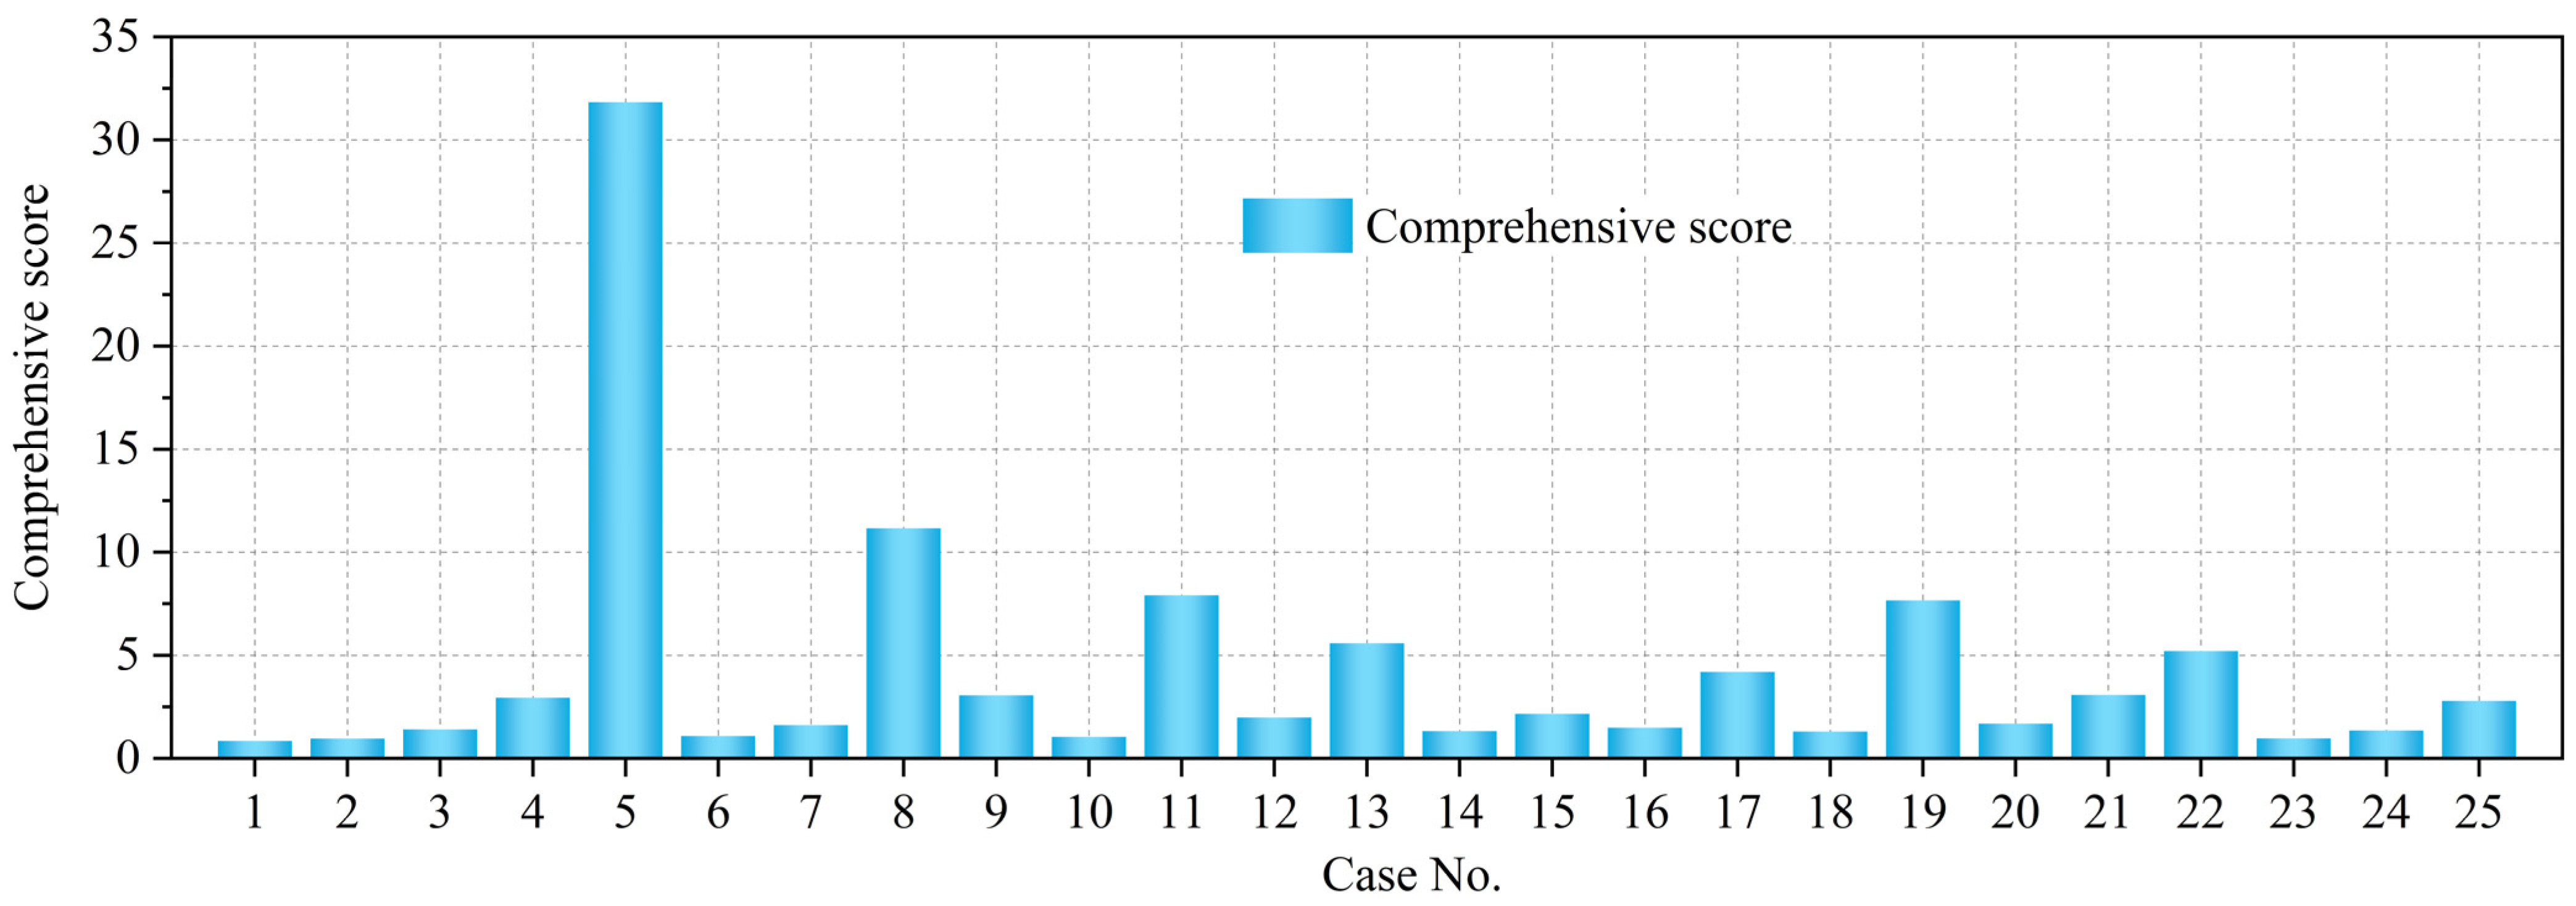
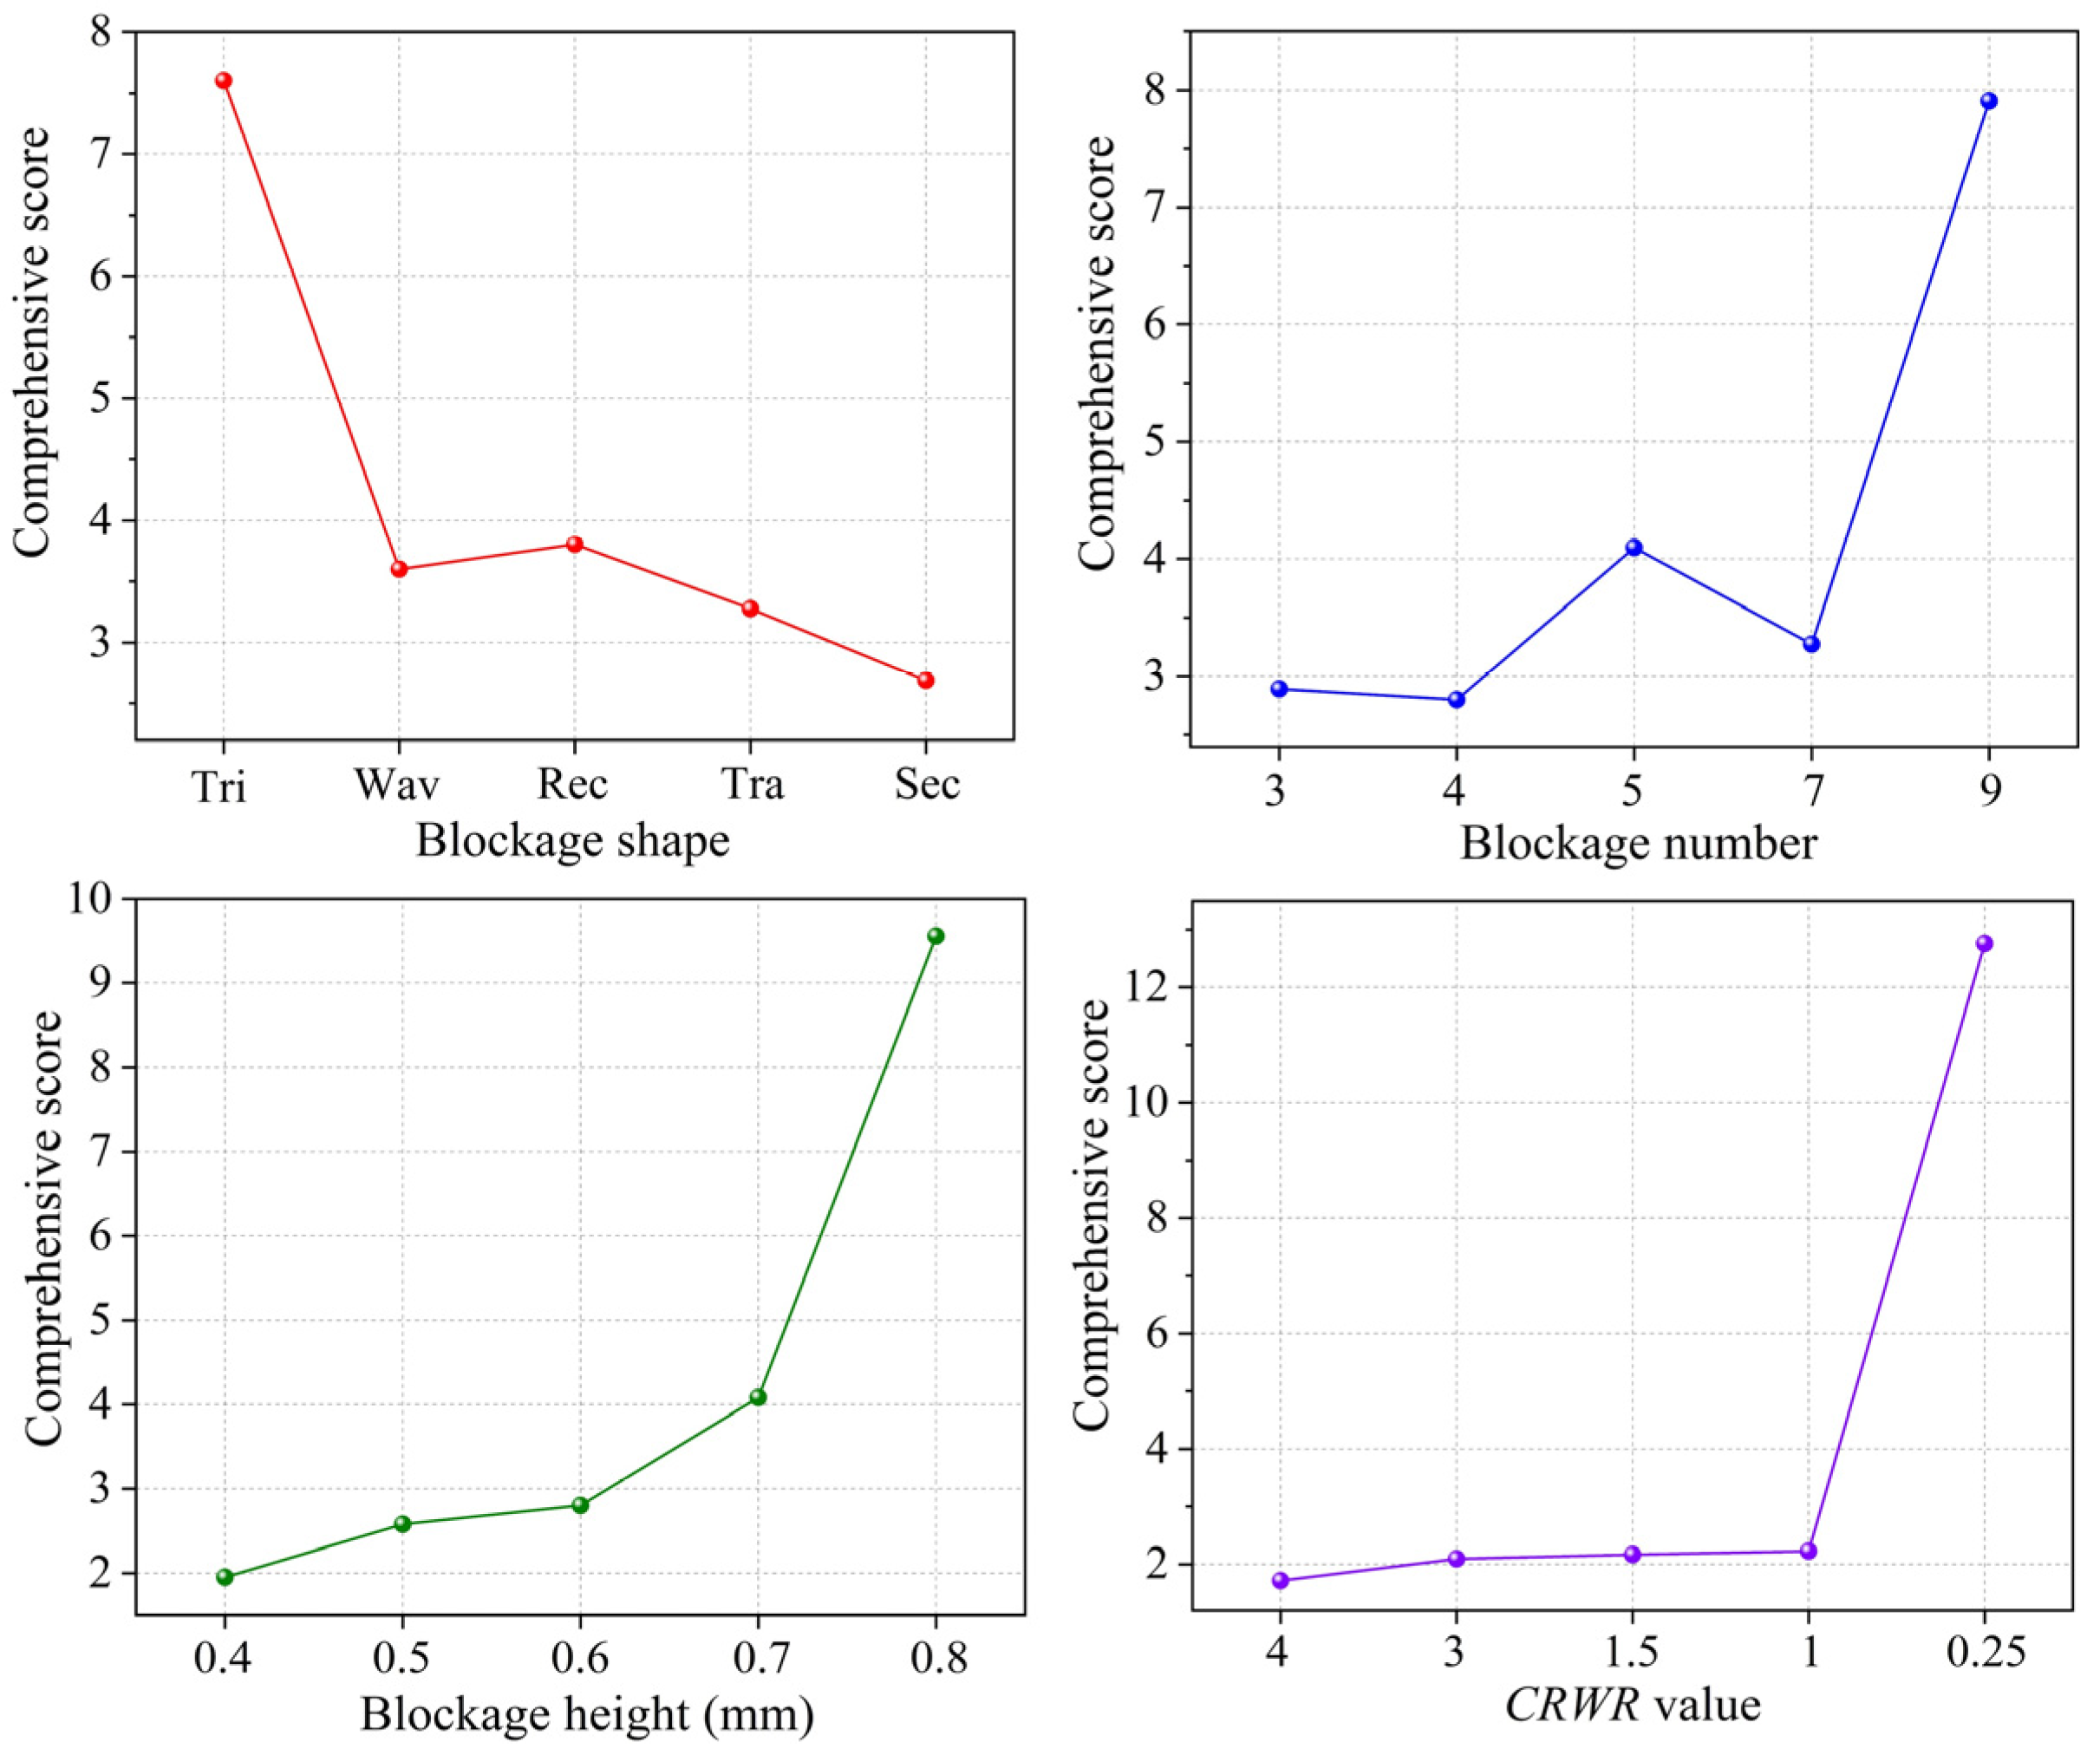
Based on the determined weight distribution, the 25 groups of orthogonal experiments were comprehensively scored. These scores were then analyzed using ANOR and ANOVA methods. The significance ranking of the four design parameters was CRWR value > H > N > S, indicating that CRWR value yields the greatest impact on the comprehensive performance of PEMFC.
(3)
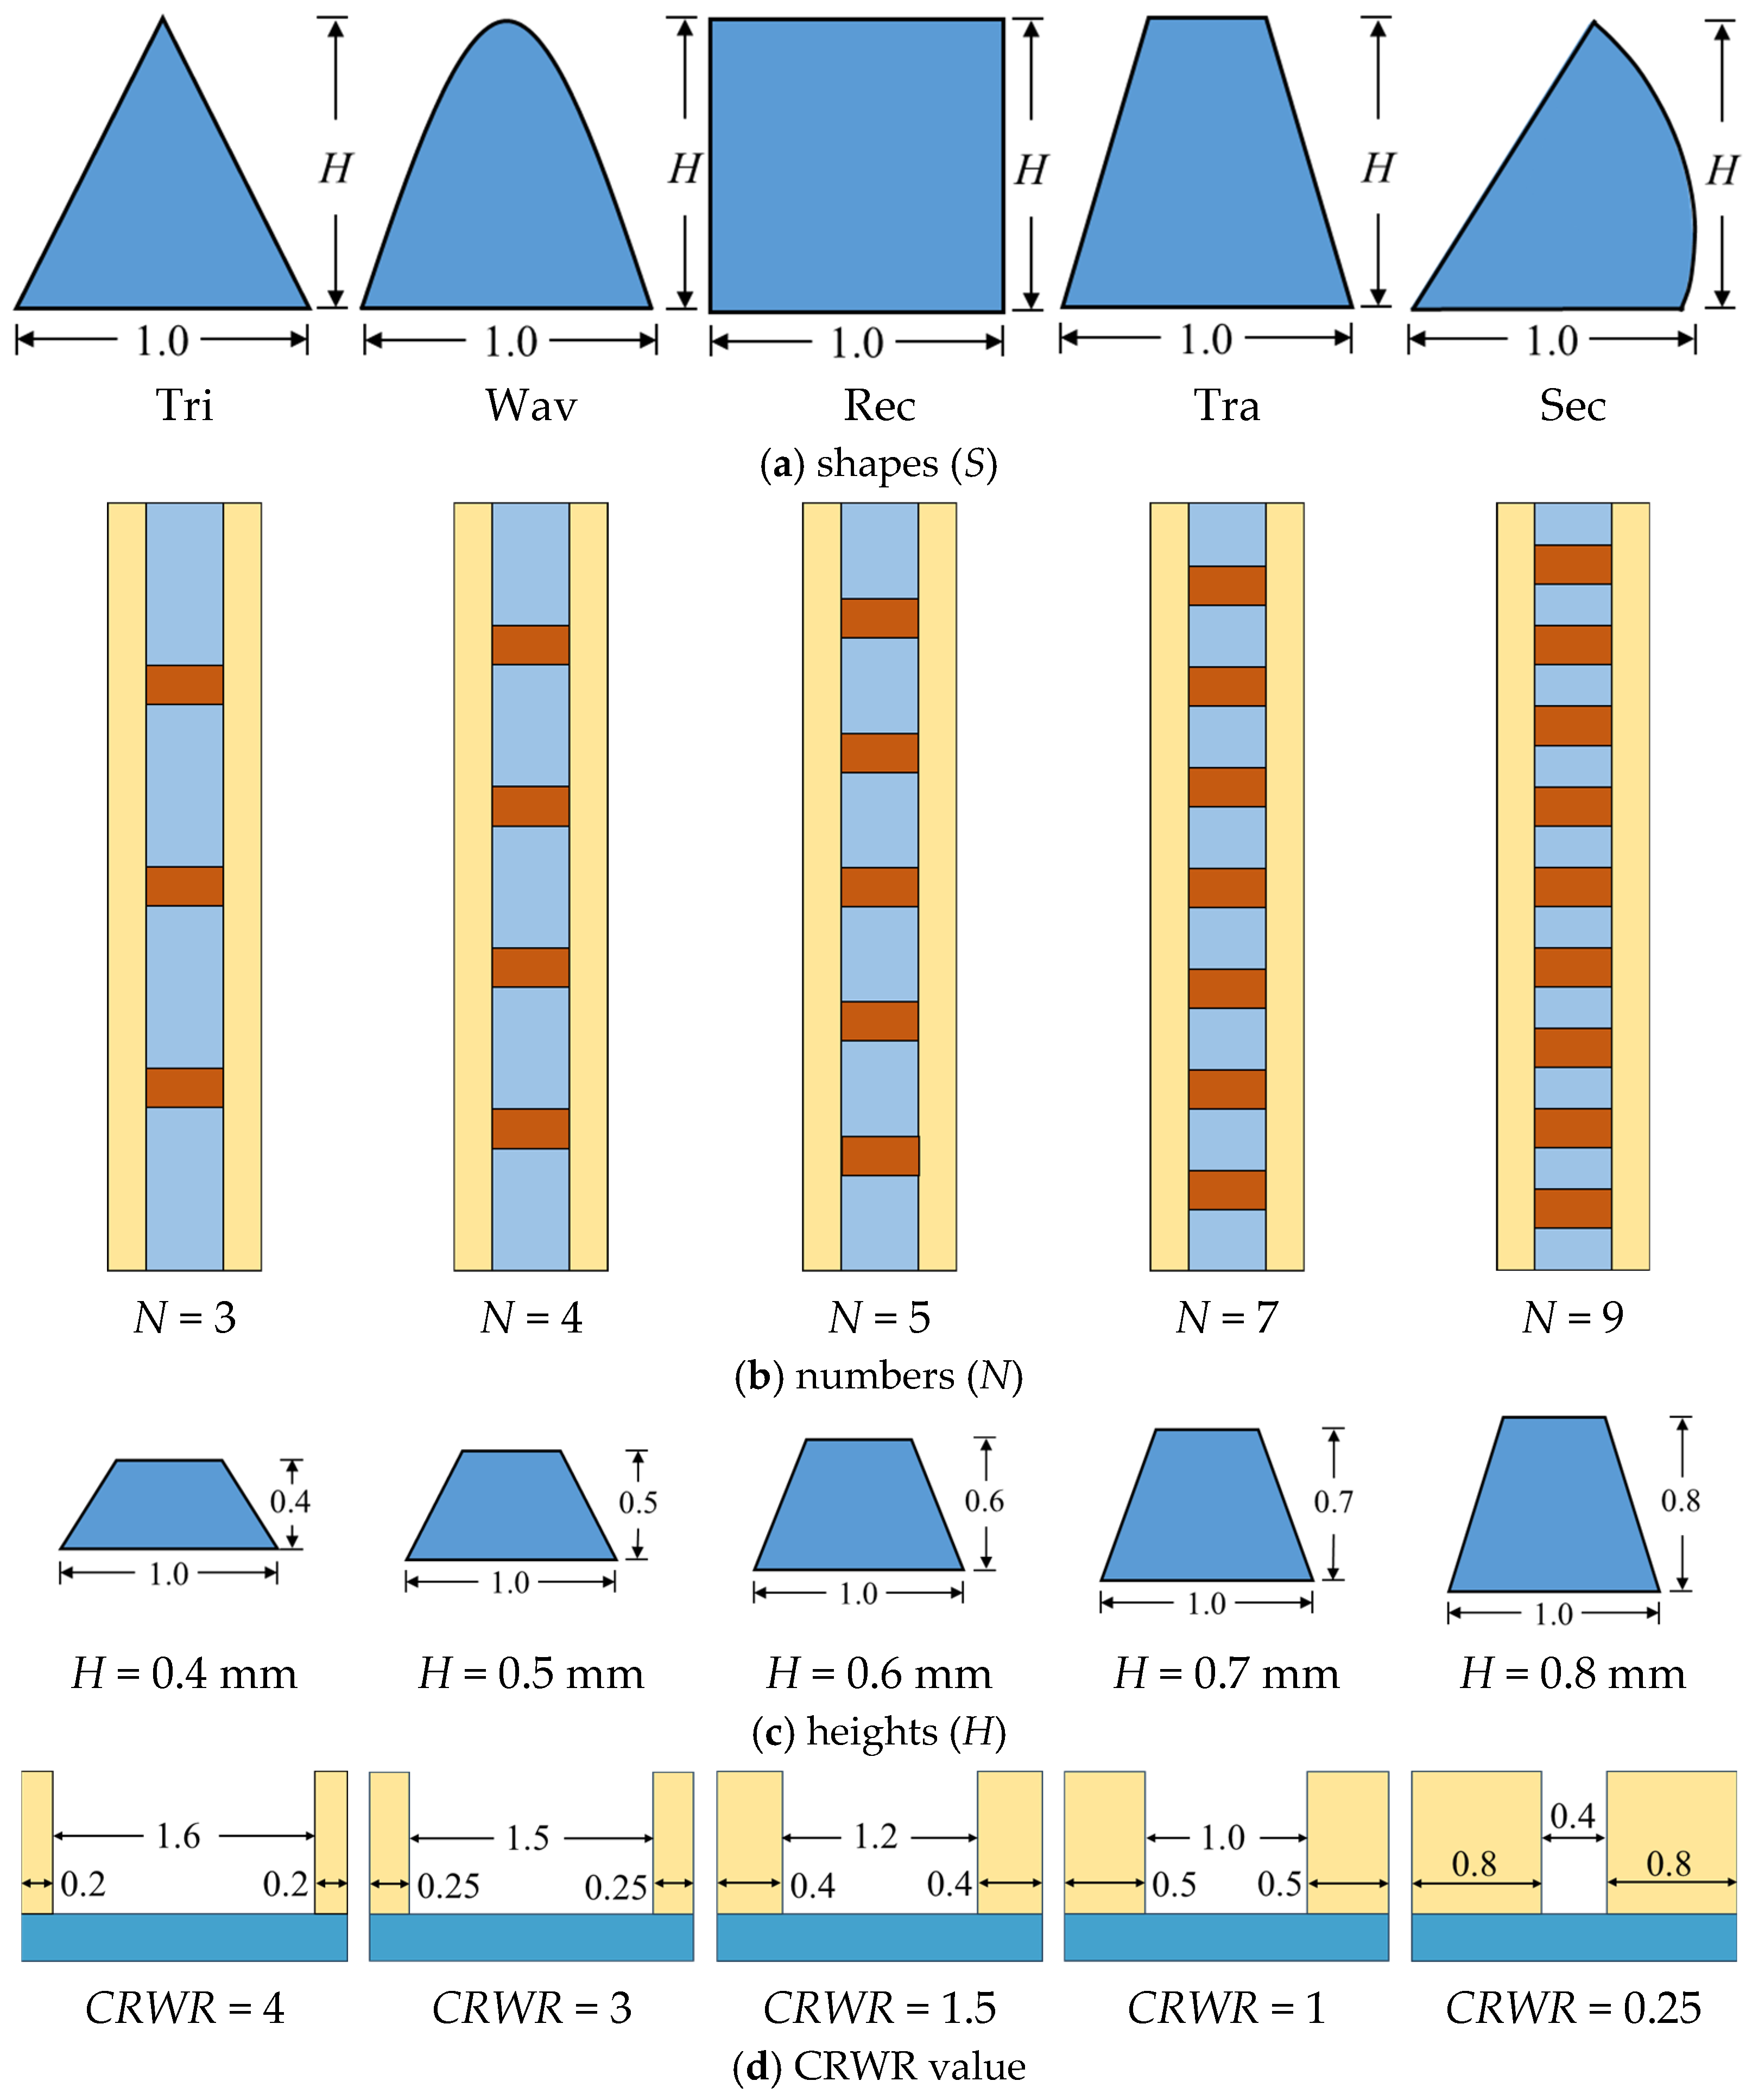
The optimal combination of design parameters was identified as a triangular blockage shape, with nine blockages, a height of 0.8 mm, and a CRWR value of 0.25. This configuration achieved the highest comprehensive score of 31.8306, demonstrating the best balance among current density, net output power, pressure drop, and oxygen distribution uniformity.

Author Contributions

Methodology, X.C.; Software, X.Z.; Validation, Q.Y.; Resources, X.Z.; Data curation, H.J.; Writing—original draft, H.J.; Writing—review & editing, Q.Y.; Supervision, N.J.; Project administration, X.C.; Funding acquisition, X.C. All authors have read and agreed to the published version of the manuscript.

Funding

This work was supported by the National Natural Science Foundation of China (51971113), Inter-Governmental S&T Cooperation Project (Research Personnel Exchange Program Between China & Serbia, China & North Macedonian), Natural Science Foundation of Zhejiang Province (LY21A020002, LQ23A020001), General Project of Zhejiang Provincial Department of Education (Y202456499), Foundation of State Key Laboratory of Automotive Simulation and Control (20210235), Natural Science Foundation of Ningbo Municipality (2023J179, 2023J389), Scientific Cultivation Project of Ningbo University of Technology (2022TS15, 2022TS17).

Data Availability Statement

The original contributions presented in this study are included in the article. Further inquiries can be directed to the corresponding author.

Conflicts of Interest

Author Xiaoyong Zhu was employed by the CATARC Automotive Test Center (Ningbo) Co., Ltd. The remaining authors declare that the research was conducted in the absence of any commercial or financial relationships that could be construed as a potential conflict of interest.

References

  1. Zhang, G.; Qu, Z.; Tao, W.-Q.; Mu, Y.; Jiao, K.; Xu, H.; Wang, Y. Advancing next-generation proton-exchange membrane fuel cell development in multi-physics transfer. Joule 2024, 8, 45–63. [Google Scholar] [CrossRef]
  2. Gómez, J.C.; Serra, M.; Husar, A. Controller design for polymer electrolyte membrane fuel cell systems for automotive applications. Int. J. Hydrogen Energy 2021, 46, 23263–23278. [Google Scholar] [CrossRef]
  3. Pahon, E.; Bouquain, D.; Hissel, D.; Rouet, A.; Vacquier, C. Performance analysis of proton exchange membrane fuel cell in automotive applications. J. Power Sources 2021, 510, 230385. [Google Scholar] [CrossRef]
  4. Andújar, J.M.; Segura, F.; Durán, E.; Rentería, L.A. Optimal interface based on power electronics in distributed generation systems for fuel cells. Renew. Energy 2011, 36, 2759–2770. [Google Scholar] [CrossRef]
  5. Rivarolo, M.; Rattazzi, D.; Lamberti, T.; Magistri, L. Clean energy production by PEM fuel cells on tourist ships: A time-dependent analysis. Int. J. Hydrogen Energy 2020, 45, 25747–25757. [Google Scholar] [CrossRef]
  6. U.S. Department of Energy (DOE). Fuel Cell Technologies Market Report 2016; U.S. Department of Energy (DOE): Washington, DC, USA, 2016.
  7. Jiao, K.; Xuan, J.; Du, Q.; Bao, Z.; Xie, B.; Wang, B.; Zhao, Y.; Fan, L.; Wang, H.; Hou, Z.; et al. Designing the next generation of proton-exchange membrane fuel cells. Nature 2021, 595, 361–369. [Google Scholar] [CrossRef]
  8. Zhang, G.; Wu, L.; Tongsh, C.; Qu, Z.; Wu, S.; Xie, B.; Huo, W.; Du, Q.; Wang, H.; An, L.; et al. Structure Design for Ultrahigh Power Density Proton Exchange Membrane Fuel Cell. Small Methods 2023, 7, 2201537. [Google Scholar] [CrossRef]
  9. Meng, X.; Sun, C.; Mei, J.; Tang, X.; Hasanien, H.M.; Jiang, J.; Fan, F.; Song, K. Fuel cell life prediction considering the recovery phenomenon of reversible voltage loss. J. Power Sources 2025, 625, 235634. [Google Scholar] [CrossRef]
  10. Öner, E.; Öztürk, A.; Yurtcan, A.B. Utilization of the graphene aerogel as PEM fuel cell catalyst support: Effect of polypyrrole (PPy) and polydimethylsiloxane (PDMS) addition. Int. J. Hydrogen Energy 2020, 45, 34818–34836. [Google Scholar] [CrossRef]
  11. Shahgaldi, S.; Hamelin, J. Improved carbon nanostructures as a novel catalyst support in the cathode side of PEMFC: A critical review. Carbon 2015, 94, 705–728. [Google Scholar] [CrossRef]
  12. Thangarasu, S.; Oh, T.H. Progress in poly(phenylene oxide) based cation exchange membranes for fuel cells and redox flow batteries applications. Int. J. Hydrogen Energy 2021, 46, 38381–38415. [Google Scholar] [CrossRef]
  13. Liu, Q.; Li, X.; Zhang, S.; Wang, Z.; Chen, Y.; Zhou, S.; Wang, C.; Wu, K.; Liu, J.; Mao, Q.; et al. Novel sulfonated N-heterocyclic poly(aryl ether ketone ketone)s with pendant phenyl groups for proton exchange membrane performing enhanced oxidative stability and excellent fuel cell properties. J. Membr. Sci. 2022, 641, 119926. [Google Scholar] [CrossRef]
  14. Shang, Z.; Hossain, M.M.; Wycisk, R.; Pintauro, P.N. Poly(phenylene sulfonic acid)-expanded polytetrafluoroethylene composite membrane for low relative humidity operation in hydrogen fuel cells. J. Power Sources 2022, 535, 231375. [Google Scholar] [CrossRef]
  15. Zhang, S.; Liu, S.; Xu, H.; Liu, G.; Wang, K. Performance of proton exchange membrane fuel cells with honeycomb-like flow channel design. Energy 2022, 239, 122102. [Google Scholar] [CrossRef]
  16. Wang, Y.; Si, C.; Qin, Y.; Wang, X.; Fan, Y.; Gao, Y. Bio-inspired design of an auxiliary fishbone-shaped cathode flow field pattern for polymer electrolyte membrane fuel cells. Energy Convers. Manag. 2021, 227, 113588. [Google Scholar] [CrossRef]
  17. Rocha, C.; Knöri, T.; Ribeirinha, P.; Gazdzicki, P. A review on flow field design for proton exchange membrane fuel cells: Challenges to increase the active area for MW applications. Renew. Sustain. Energy Rev. 2024, 192, 114198. [Google Scholar] [CrossRef]
  18. Perng, S.-W.; Wu, H.-W.; Chen, Y.-B.; Zeng, Y.-K. Performance enhancement of a high temperature proton exchange membrane fuel cell by bottomed-baffles in bipolar-plate channels. Appl. Energy 2019, 255, 113815. [Google Scholar] [CrossRef]
  19. Perng, S.-W.; Wu, H.-W. A three-dimensional numerical investigation of trapezoid baffles effect on non-isothermal reactant transport and cell net power in a PEMFC. Appl. Energy 2015, 143, 81–95. [Google Scholar] [CrossRef]
  20. Yin, Y.; Wu, S.; Qin, Y.; Otoo, O.N.; Zhang, J. Quantitative analysis of trapezoid baffle block sloping angles on oxygen transport and performance of proton exchange membrane fuel cell. Appl. Energy 2020, 271, 115257. [Google Scholar] [CrossRef]
  21. Wang, X.; Qin, Y.; Wu, S.; Shangguan, X.; Zhang, J.; Yin, Y. Numerical and experimental investigation of baffle plate arrangement on proton exchange membrane fuel cell performance. J. Power Sources 2020, 457, 228034. [Google Scholar] [CrossRef]
  22. Chen, X.; Yu, Z.; Yang, C.; Chen, Y.; Jin, C.; Ding, Y.; Li, W.; Wan, Z. Performance investigation on a novel 3D wave flow channel design for PEMFC. Int. J. Hydrogen Energy 2021, 46, 11127–11139. [Google Scholar] [CrossRef]
  23. Cai, G.; Liang, Y.; Liu, Z.; Liu, W. Design and optimization of bio-inspired wave-like channel for a PEM fuel cell applying genetic algorithm. Energy 2020, 192, 116670. [Google Scholar] [CrossRef]
  24. Kerkoub, Y.; Benzaoui, A.; Haddad, F.; Ziari, Y.K. Channel to rib width ratio influence with various flow field designs on performance of PEM fuel cell. Energy Convers. Manag. 2018, 174, 260–275. [Google Scholar] [CrossRef]
  25. Yan, S.; Yang, M.; Sun, C.; Xu, S. Liquid Water Characteristics in the Compressed Gradient Porosity Gas Diffusion Layer of Proton Exchange Membrane Fuel Cells Using the Lattice Boltzmann Method. Energies 2023, 16, 6010. [Google Scholar] [CrossRef]
  26. Jeon, D.H. Effect of channel-rib width on water transport behavior in gas diffusion layer of polymer electrolyte membrane fuel cells. J. Power Sources 2019, 423, 280–289. [Google Scholar] [CrossRef]
  27. Xia, L.; Xu, Q.; He, Q.; Ni, M.; Seng, M. Numerical study of high temperature proton exchange membrane fuel cell (HT-PEMFC) with a focus on rib design. Int. J. Hydrogen Energy 2021, 46, 21098–21111. [Google Scholar] [CrossRef]
  28. Varghese, G.; Venkatesh Babu, K.P.; Joseph, T.V.; Chippar, P. Combined effect of channel to rib width ratio and gas diffusion layer deformation on high temperature—Polymer electrolyte membrane fuel cell performance. Int. J. Hydrogen Energy 2022, 47, 33014–33026. [Google Scholar] [CrossRef]
  29. Wang, J.; Zhang, H.; Cai, W.; Ye, W.; Tong, Y.; Cheng, H. Effect of varying rib area portions on the performance of PEM fuel cells: Insights into design and optimization. Renew. Energy 2023, 217, 119185. [Google Scholar] [CrossRef]
  30. Zhang, S.-Y.; Qu, Z.-G.; Xu, H.-T.; Talkhoncheh, F.-K.; Liu, S.; Gao, Q. A numerical study on the performance of PEMFC with wedge-shaped fins in the cathode channel. Int. J. Hydrogen Energy 2021, 46, 27700–27708. [Google Scholar] [CrossRef]
  31. Jiao, K.; Wang, B.; Du, Q.; Wang, Y.; Zhang, G.; Yang, Z.; Deng, H.; Xie, X. Water and Thermal Management of Proton Exchange Membrane Fuel Cells; Elsevier: Amsterdam, The Netherlands, 2021. [Google Scholar]
  32. Zhang, S.; Mao, Y.; Liu, F.; Xu, H.; Qu, Z.; Liao, X. Multi-objective optimization and evaluation of PEMFC performance based on orthogonal experiment and entropy weight method. Energy Convers. Manag. 2023, 291, 117310. [Google Scholar] [CrossRef]
  33. Li, Y.; Lu, C.; Liu, G.; Chen, Y.; Zhang, Y.; Wu, C.; Liu, B.; Shu, L. Risk assessment of wetland degradation in the Xiong’an New Area based on AHP-EWM-ICT method. Ecol. Indic. 2023, 153, 110443. [Google Scholar] [CrossRef]
  34. Zhang, G.; Wu, J.; Wang, Y.; Yin, Y.; Jiao, K. Investigation of current density spatial distribution in PEM fuel cells using a comprehensively validated multi-phase non-isothermal model. Int. J. Heat Mass Transf. 2020, 150, 119294. [Google Scholar] [CrossRef]
  35. Zhang, G.; Duan, F.; Qu, Z.; Bai, H.; Zhang, J. Airfoil flow field for proton exchange membrane fuel cells enhancing mass transfer with low pressure drop. Int. J. Heat Mass Transf. 2024, 225, 125420. [Google Scholar] [CrossRef]
  36. Fu, X.-L.; Ni, H.; Zhou, A.; Jiang, Z.-Y.; Jiang, N.-J.; Du, Y.-J. An integrated fuzzy AHP and fuzzy TOPSIS approach for screening backfill materials for contaminant containment in slurry trench cutoff walls. J. Clean. Prod. 2023, 419, 138242. [Google Scholar] [CrossRef]
  37. Kong, M.; Ye, X.; Liu, D.; Li, C. Comprehensive evaluation of medical waste gasification low-carbon multi-generation system based on AHP–EWM–GFCE method. Energy 2024, 296, 131161. [Google Scholar] [CrossRef]
Figure 1. A single-channel PEMFC unit with blockages.
Energies 18 01407 g001
Figure 2. Comparison of numerical data and experimental result [35].
Energies 18 01407 g002
Figure 3. Flowchart of the multi-criteria decision framework.
Energies 18 01407 g003
Figure 4. Schematic diagrams of different design factors.
Energies 18 01407 g004
Figure 5. The trend of AHP-EWM comprehensive score.
Energies 18 01407 g005
Figure 6. Effect curve of ANOR.
Energies 18 01407 g006
Table 1. Physical and operating parameters.
ParametersValueUnit
Porosity (GDL, MPL, CL)0.6, 0.5, 0.3/
Permeability (GDL, MPL, CL)1 × 10⁻¹¹, 1 × 10⁻¹², 1 × 10⁻¹³m2
Contact angle (GDL, MPL, CL)120, 120, 100°
Open circuit voltage1.15V
Operating temperature343.15K
Operating pressure101,325Pa
Relative humidity (anode, cathode)30%, 100%/
Reference current density10,000A/m2
Reference concentration (anode, cathode)56.4, 3.39mol/m3
Standard entropy change (anode, cathode)130.68, 32.55J/(mol·K)
Stoichiometric ratio (anode, cathode)1.5, 2.0/
Surface/volume ratio200,000m−1
Concentration exponent (anode, cathode)1.0, 1.0/
Proton conduction coefficient1/
Proton conduction exponent1/
Ionomer volume fraction in CL0.3/
Equivalent weight of PEM1100kg/kmol
Exchange coefficient (anode, cathode)0.5, 0.5/
Thermal conductivity (BP, GDL, MPL, CL)20, 10, 1, 1W/(m·K)
Electrical conductivity (BP, GDL, MPL, CL)20,000, 8000, 5000, 5000S/m
Specific heat capacity (BP, PEM, GDL, MPL, CL)1580, 833, 568, 3300, 3300J/(kg·K)
Table 2. Influence of grid sizes on the numerical results.
Grid SizesCurrent Density (A/cm2)Relative Error
Grid 140,8430.99020.99%
Grid 260,4350.99450.58%
Grid 390,0600.99760.26%
Grid 4136,2751.0003-
Grid 5203,8991.00140.1%
Table 3. Orthogonal levels and factors table.
LevelsFactors
SNH (mm)CRWR Value
1Tri30.44
2Wav40.53
3Rec50.61.5
4Tra70.71
5Sec90.80.25
Table 4. L25(56) Orthogonal experiment table.
Case
No.
Factors
SNHCRWR Value
No.FactorNo.FactorNo.FactorNo.Factor
11Tri1310.414
21Tri2420.523
31Tri3530.631.5
41Tri4740.741
51Tri5950.850.25
62Wav1320.531.5
72Wav2430.641
82Wav3540.750.25
92Wav4750.814
102Wav5910.423
113Rec1330.650.25
123Rec2440.714
133Rec3550.823
143Rec4710.431.5
153Rec5920.541
164Tra1340.723
174Tra2450.831.5
184Tra3510.441
194Tra4720.550.25
204Tra5930.614
215Sec1350.841
225Sec2410.450.25
235Sec3520.514
245Sec4730.623
255Sec5940.731.5
Table 5. RI index value table.
n123456789
RI index000.520.891.121.261.361.411.46
Table 6. Numerical results of orthogonal table.
Case No.Evaluation Objectives
I (A/cm2)ΔP (Pa)Wnet (W)NU
11.11013.310.20430.3439
21.10984.760.20420.3418
31.084110.520.19950.3368
41.063229.810.19560.3385
50.8875391.830.16310.3491
61.06616.580.19620.3363
71.036613.340.19070.3342
80.8310133.850.15280.3347
91.144830.710.21060.3411
101.11685.760.20550.3439
110.802593.490.14760.3356
121.133817.450.20860.3400
131.144062.360.21050.3385
141.08219.430.19910.3411
151.056120.040.19430.3444
161.117011.320.20550.3400
171.096045.240.20160.3369
181.02799.580.18910.3364
190.815790.310.15000.3379
201.140613.660.20990.3439
211.043931.640.19210.3313
220.766559.810.14100.3426
231.12024.890.20610.3412
241.12669.530.20730.3395
251.107827.600.20380.3408
Table 7. Scoring results from experts.
ObjectivesI (A/cm2)ΔP (Pa)Wnet (W)NU
I (A/cm2)1725
ΔP (Pa)1/711/61/3
Wnet (W)1/2614
NU1/531/41
Table 8. Normalized data.
ObjectivesI (A/cm2)ΔP (Pa)Wnet (W)NU
I (A/cm2)0.5430.4120.5840.484
ΔP (Pa)0.0780.0590.0490.032
Wnet (W)0.2710.3530.2930.387
NU0.1090.1760.0730.0967
Table 9. The values of Ej and dj.
I (A/cm2)ΔP (Pa)Wnet (W)NU
Ej0.95950.98590.95930.9688
dj0.040540.01410.04070.0312
Table 10. Weight of AHP, EWM, and AHP-EWM.
MethodsWeight Values
I (A/cm2)ΔP (Pa)Wnet (W)NU
AHP0.510.050.330.11
EWM0.320.110.320.25
AHP-EWM0.4150.080.3250.18
Table 11. AHP-EWM comprehensive score of orthogonal tables.
Case No.Comprehensive ScoreCase No.Comprehensive Score
10.8538 141.3296
20.9693 152.1666
31.4170 161.4971
42.9505 174.2002
531.8306 181.3150
61.0931 197.6729
71.6195 201.6963
811.1628 213.0865
93.0617 225.2104
101.0530 230.9845
117.9206 241.3584
121.9955 252.7953
135.5929
Table 12. Result of ANOR.
ObjectivesFactors
SNHCRWR Value
Comprehensive scorek138.0212 14.4511 9.7618 8.5918
k217.9901 13.9949 12.8864 10.4707
k319.0052 20.4722 14.0118 10.8352
k416.3815 16.3731 20.4012 11.1381
k513.4351 39.5418 47.7719 63.7973
k1/47.6042 2.8902 1.9524 1.7184
k2/43.5980 2.7990 2.5773 2.0941
k3/43.8010 4.0944 2.8024 2.1670
k4/43.2763 3.2746 4.0802 2.2276
k5/42.6870 7.9084 9.5544 12.7595
R4.9172 5.1094 7.6020 11.0411
Table 13. Result of ANOVA.
ObjectivesVariableDOFSSMSF ValueSignificance
Comprehensive scoreS476.2619.071.08
N491.4922.871.30
H4191.6147.902.71
CRWR value4459.40114.856.51*
Error8141.2417.66
Total24960.00
“*” represents significance.
Disclaimer/Publisher’s Note: The statements, opinions and data contained in all publications are solely those of the individual author(s) and contributor(s) and not of MDPI and/or the editor(s). MDPI and/or the editor(s) disclaim responsibility for any injury to people or property resulting from any ideas, methods, instructions or products referred to in the content.

