
Spatial Evolution and Scenario Simulation of Carbon Metabolism in Coal-Resource-Based Cities Towards Carbon Neutrality: A Case Study of Jincheng, China

Abstract
1. Introduction
2. Materials and Methods
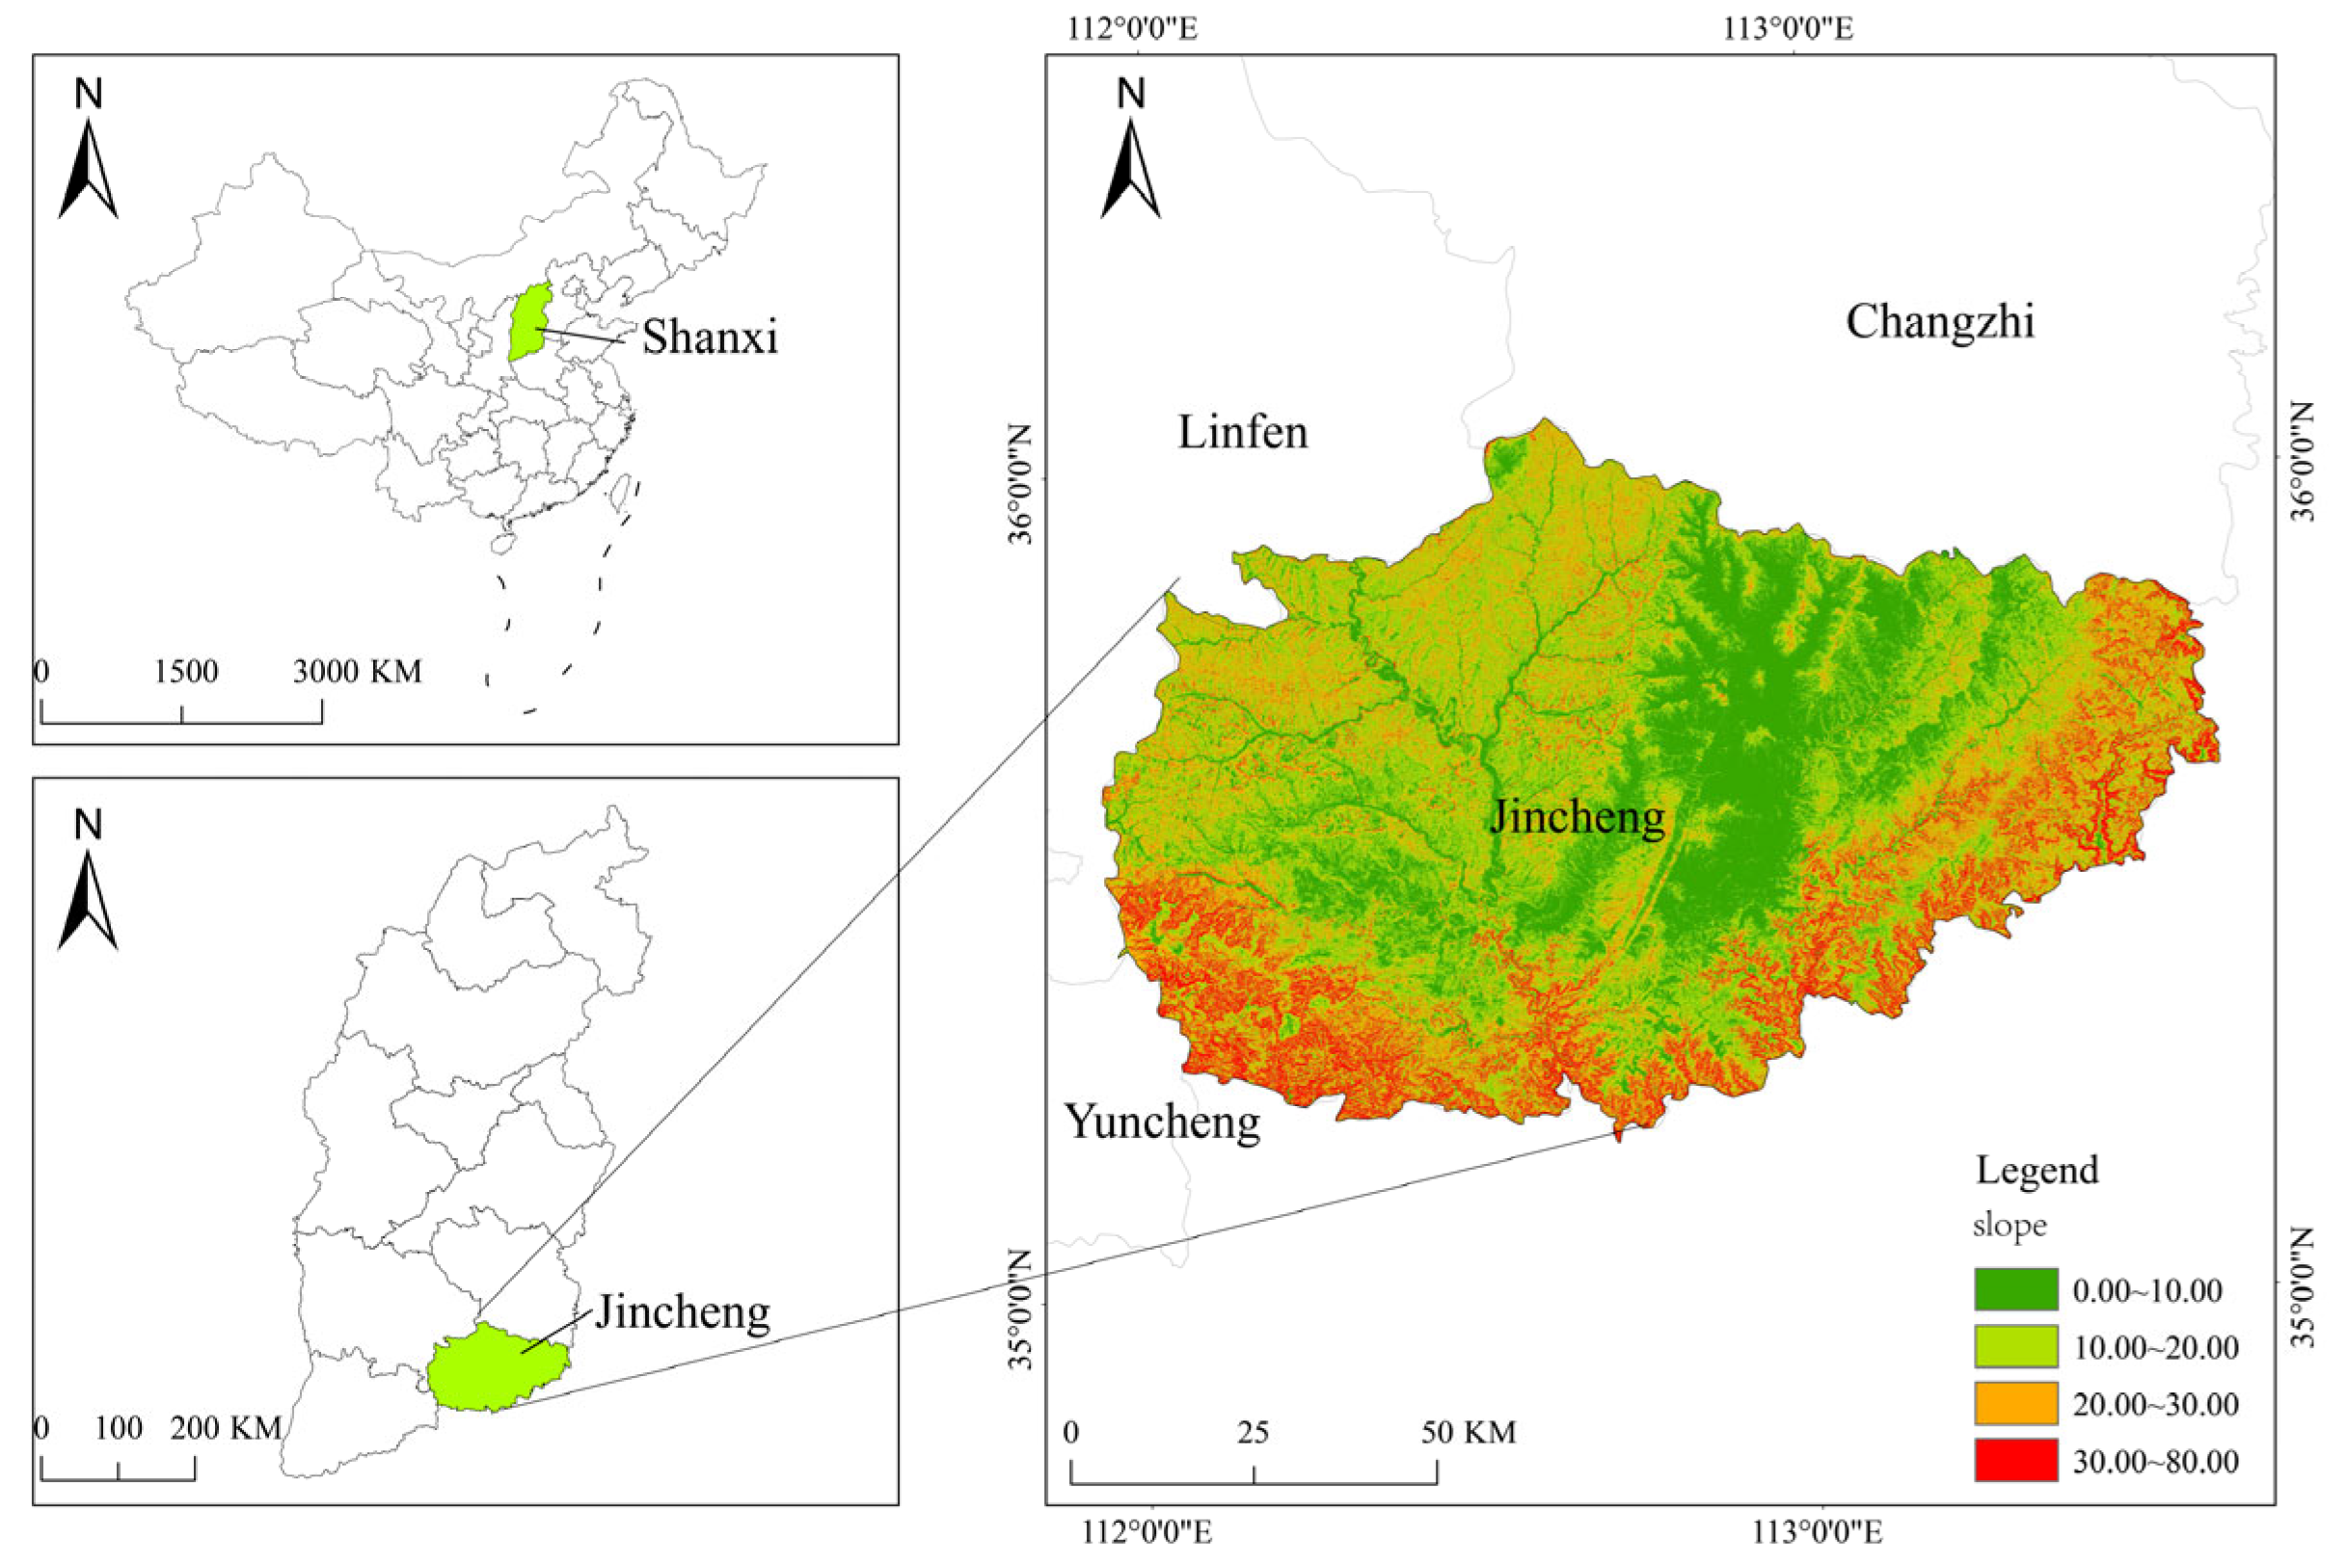
2.1. Study Area
2.2. Data Sources
2.3. Methods
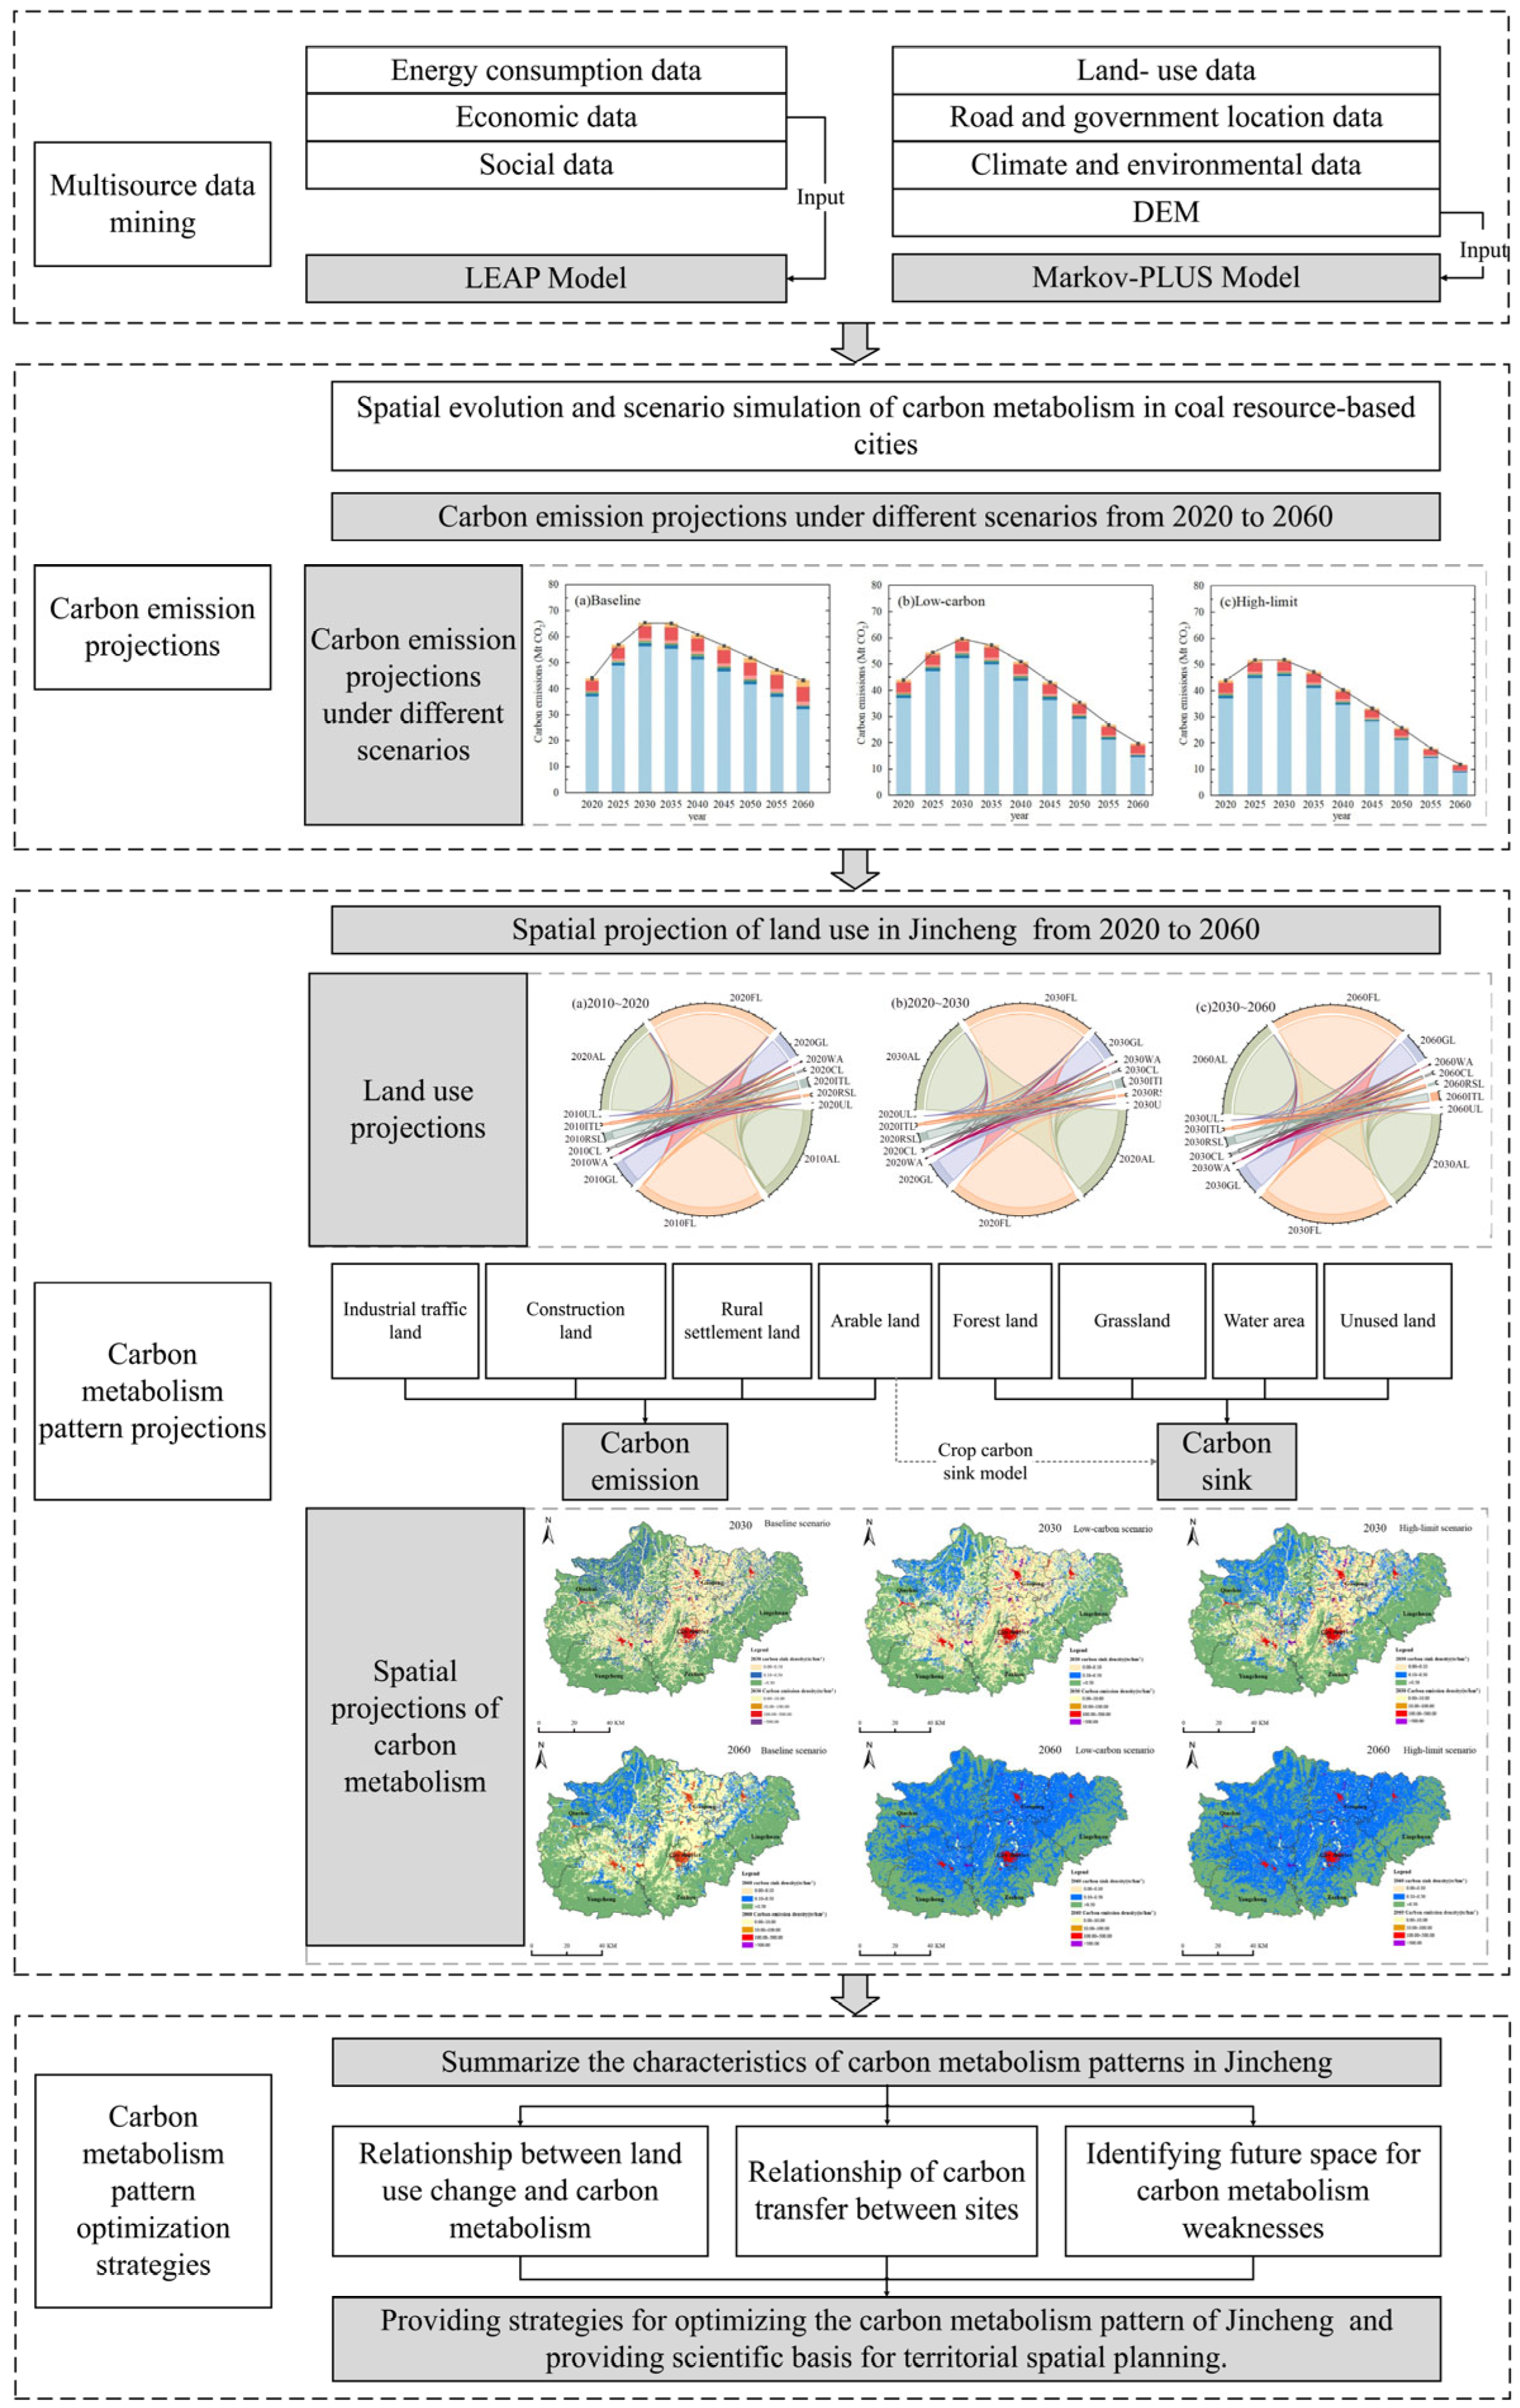
2.3.1. Research Strategy
2.3.2. LEAP Model

| Scenario Measures | Description of Measures | Baseline Scenario | Low-Carbon Scenario | High-Limit Scenario |
|---|---|---|---|---|
| Baseline scenario measures | Current policy measures and technology levels | √ | √ | √ |
| Optimization of the industrial structure | Increase the proportion of the tertiary sector to 50.00% by 2030 and 70.00% by 2060 | − | √ | √ |
| Conversion efficiency improvement | Thermal power efficiency is projected to increase to 45.50% by 2030 and 47.50% by 2060 | − | √ | √ |
| Energy efficiency improvement | Projections for the reduction rate of the sectoral energy intensity based on regression analysis of data from 2000 to 2020 | − | √ | √ |
| Clean energy alternatives | Increase the share of non-fossil energy generation to 80.00% by 2060 | − | − | √ |
| Accelerated electrification | The sectoral share of electricity consumption is projected to increase further. By 2060, 80.00% of electricity will be used in the industrial sector and 75.00% in the transport sector [35] | − | − | √ |
| CCUS technology | Scale application of CCUS by 2030. A total of 40.00% of total installed coal power capacity with carbon capture devices and 90.00% of carbon dioxide capture from coal CCUS by 2060 [36] | − | − | √ |
| Sector | CO2 Emissions/Mt CO2 | Percentage/% |
|---|---|---|
| Agriculture | 0.31 | 0.70 |
| Industry | 37.05 | 84.24 |
| Construction | 0.20 | 0.45 |
| Transportation | 1.04 | 2.37 |
| Wholesale and retail | 0.52 | 1.19 |
| Other tertiary industries | 1.00 | 2.28 |
| Residential | 3.86 | 8.77 |
| Total | 43.98 | 100.00 |
2.3.3. Carbon-Sink Calculation Model
| Land Type | Forest Land | Grassland | Water Area | Unused Land |
|---|---|---|---|---|
| Carbon-sink coefficient | −0.5810 | −0.0210 | −0.0248 | −0.0005 |
2.3.4. Markov–PLUS Model
| Land Type | Arable Land | Forest Land | Grassland | Water Area | Construction Land | Rural Settlement Land | Industrial and Transport Land | Unused Land |
|---|---|---|---|---|---|---|---|---|
| 2020~2030 (hm2) | 0.00 | 0.52 | 0.57 | 0.69 | 0.70 | 0.84 | 1.00 | 0.62 |
| 2030~2040 (hm2) | 0.86 | 1.00 | 0.45 | 0.46 | 0.40 | 0.17 | 0.00 | 0.48 |
| 2040~2060 (hm2) | 0.33 | 1.00 | 0.24 | 0.36 | 0.30 | 0.08 | 0.00 | 0.33 |
2.3.5. Carbon Metabolism Model
3. Results
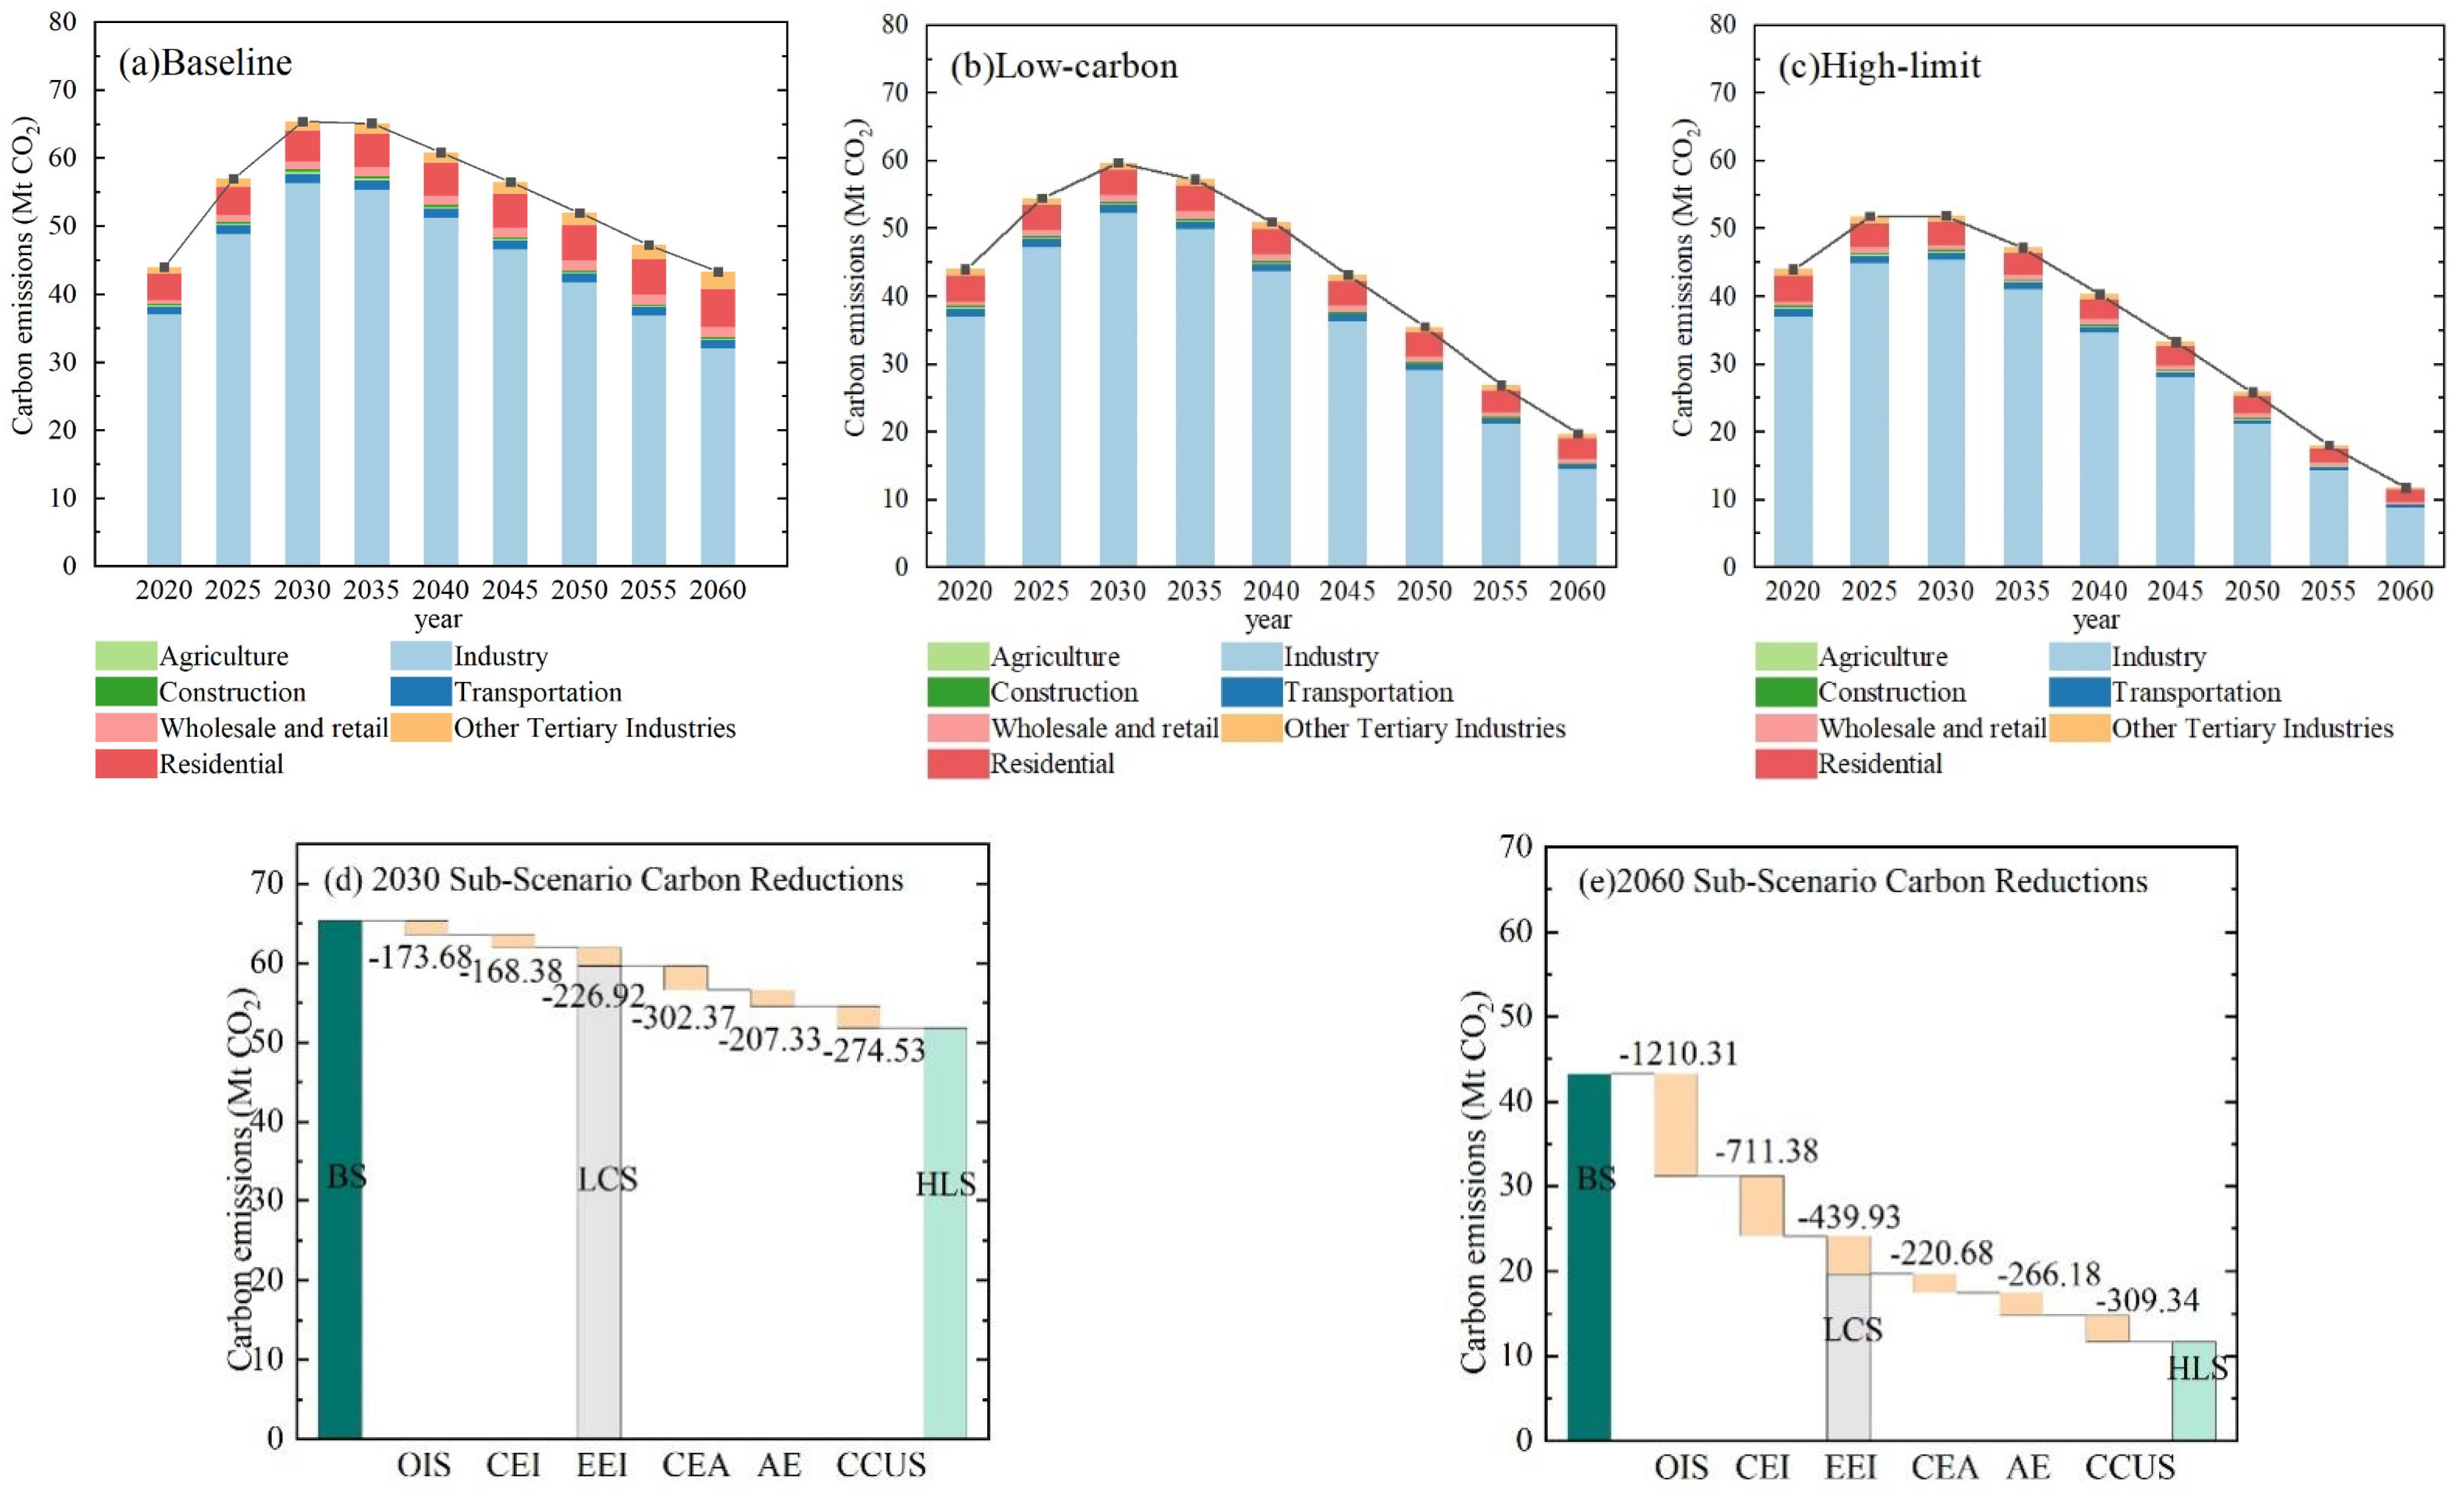
3.1. Analysis of Urban Carbon-Emission Scenario Projections
| Year | Total Energy Demand/104tce | MAPE/% | |
|---|---|---|---|
| Actual Value | Baseline Scenario Forecast | ||
| 2020 | 1868.80 | 1817.20 | 1.38% |
| 2021 | 1958.00 | 1924.79 | 0.85% |
| 2022 | 1996.60 | 2032.371 | 0.90% |
3.2. Urban Land Projections
| Land Area (hm2) | Arable Land | Forest Land | Grassland | Water Area | Construction Land | Rural Settlement Land | Industrial Traffic Land | Unused Land |
|---|---|---|---|---|---|---|---|---|
| 2020 | 334,808.46 | 456,640.13 | 94,573.66 | 3435.69 | 10,581.98 | 31,608.28 | 10,638.65 | 125.69 |
| 2030 | 334,770.52 | 456,402.39 | 94,455.78 | 3495.02 | 10,753.86 | 31,290.52 | 11,120.70 | 123.76 |
| 2060 | 334,712.82 | 457,224.01 | 93,074.54 | 3570.36 | 11,930.40 | 29,349.33 | 12,432.33 | 118.76 |
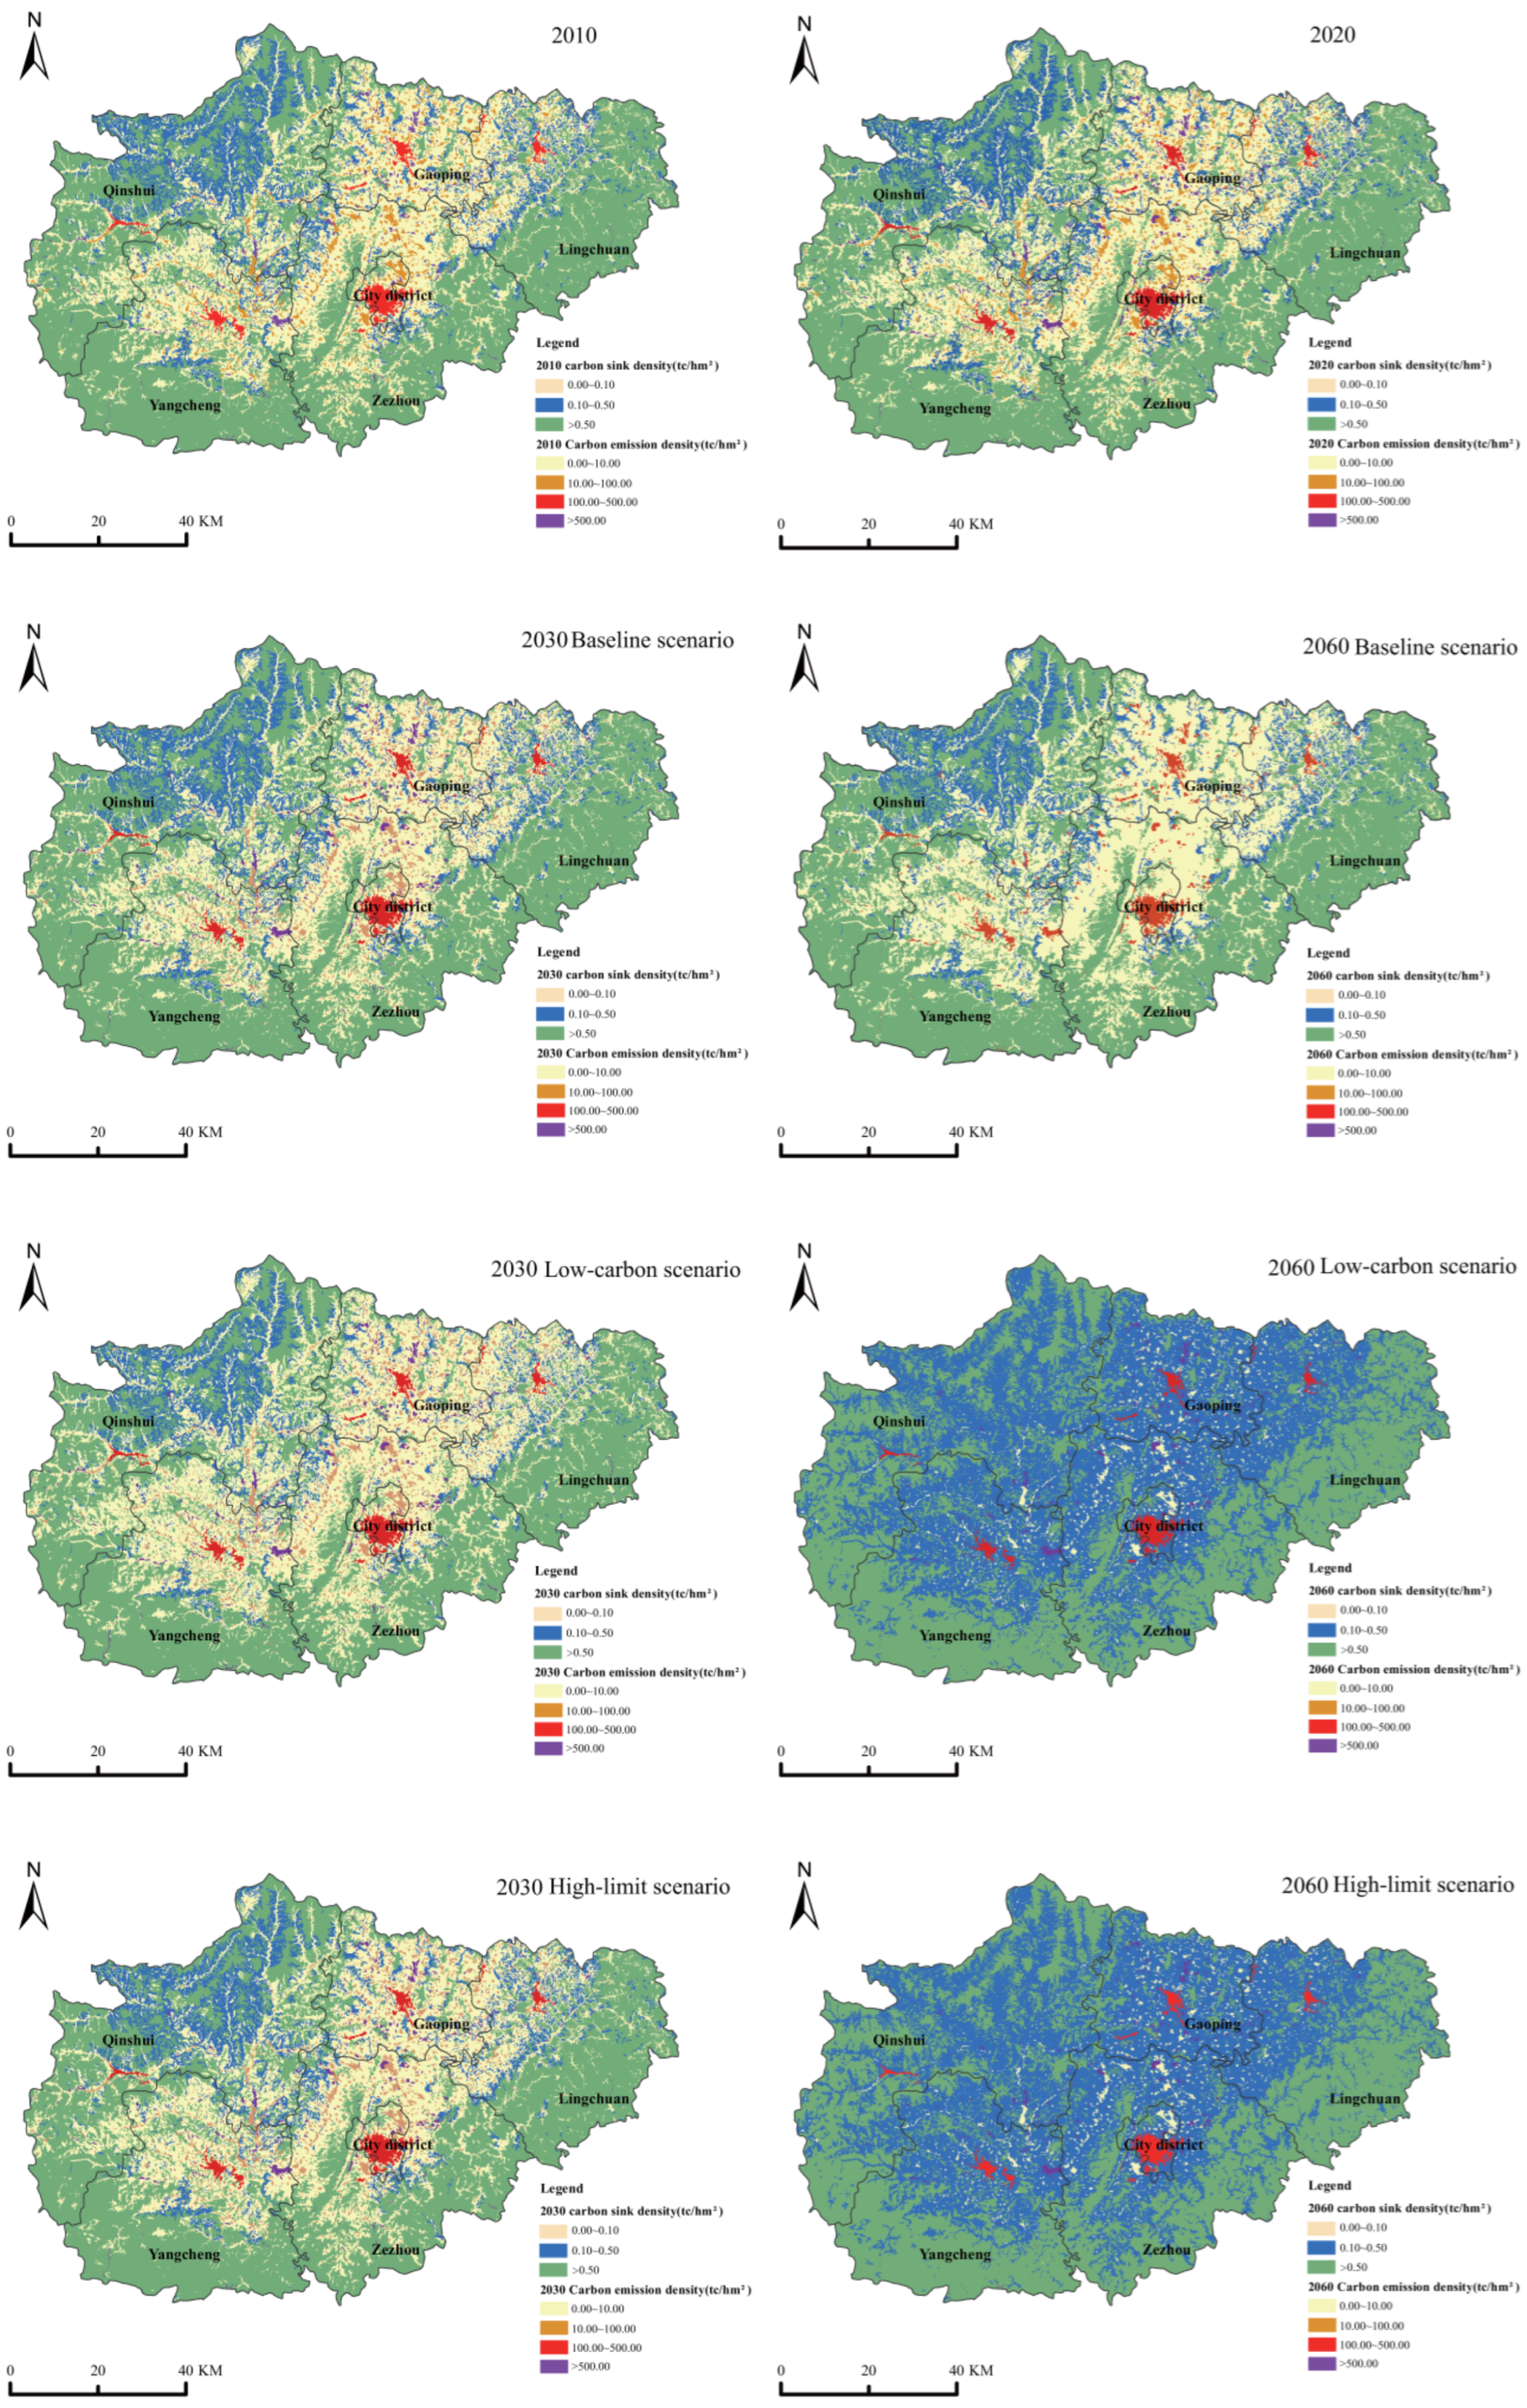
3.3. Spatial and Temporal Characteristics of Land-Use Carbon Transfer Under Different Scenarios
| Project | 2010~2020 | Scenario Simulation | 2020~2030 | 2030~2040 | 2040~2060 | ||||
|---|---|---|---|---|---|---|---|---|---|
| Carbon Transferred (Mt) | Direction | Carbon Transferred (Mt) | Direction | Carbon Transferred (Mt) | Direction | Carbon Transferred (Mt) | Direction | ||
| Positive carbon transfer | 161.8 | + | BS | 341.00 | + | 251.37 | + | 246.59 | + |
| LCS | 312.20 | + | 203.05 | + | 139.36 | + | |||
| HLS | 263.70 | + | 164.67 | + | 97.44 | + | |||
| Negative carbon transfer | −516.31 | − | BS | −65.15 | − | −0.56 | − | −1.19 | - |
| LCS | −59.56 | − | −0.44 | − | −0.71 | - | |||
| HLS | −50.31 | − | −0.33 | − | −0.35 | - | |||
| Net carbon transfer | −354.51 | − | BS | 275.85 | + | 250.82 | + | 245.39 | + |
| LCS | 252.65 | + | 202.61 | + | 138.65 | + | |||
| HLS | 213.38 | + | 164.33 | + | 97.09 | + | |||
| H1 | 94.23 | I&T→UCL | BS | 297.63 | I&T→FL | 222.23 | I&T→FL | 286.75 | I&T→FL |
| LCS | 87.28% | 88.41% | 82.73% | ||||||
| HLS | 272.28 | 179.57 | 166.75 | ||||||
| Proportion of contribution | 58.24% | BS | 87.21% | 88.46% | 82.91% | ||||
| LCS | 230.00 | 145.78 | 80.96 | ||||||
| 87.22% | 88.53% | 83.09% | |||||||
| H2 | 365.53 | UCL→I&T | BS | 49.72 | RSL→I&T | 0.49 | RSL→UCL | 1.06 | RSL→UCL |
| LCS | 76.31% | 88.75% | 89.03% | ||||||
| HLS | 45.45 | 0.37 | 0.54 | ||||||
| Proportion of contribution | 70.80% | BS | 76.31% | 85.65% | 61.03% | ||||
| LCS | 38.38 | 0.27 | 0.17 | ||||||
| 76.29% | 81.21% | 48.63% | |||||||
4. Discussion
5. Conclusions
Author Contributions
Funding
Data Availability Statement
Conflicts of Interest
Nomenclature
| FL | Forest land |
| GL | Grassland |
| WA | Water area |
| UL | Unused land |
| AL | Arable land |
| I&T | Industrial traffic land |
| UCL | Urban construction land |
| RSL | Rural settlement land |
| BS | Baseline scenario |
| LCS | Low-carbon scenario |
| HLS | High-limit scenario |
| OIS | Optimization of the industrial structure |
| CEI | Conversion efficiency improvement |
| EEI | Energy efficiency improvement |
| CEA | Clean-energy alternatives |
| AE | Accelerated electrification |
| CCUS | Carbon capture, utilization, and storage |
| LEAP | the LOW EMISSIONS ANALYSIS PLATFORM |
| FLUS | Future Land-Use Simulation Model |
| CA–Markov | Cellular Automata–Markov Model |
| PLUS | Patch-Generating Land-Use Simulation Model |
| Markov-PLUS | Markov–Patch-Generating Land-Use Simulation Model |
| Ci | Carbon exchange rate of land |
| Si | Land area |
| ki | Carbon-sink coefficient of land |
| Ccrops | Carbon exchange rate of arable land |
| Pi | Economic yield of crop |
| Hi | Economic coefficient of crop |
| ri | Water content of crop |
| fi | Carbon uptake rate of crop |
| Wi | Net carbon metabolism density of land |
| Vi | Net carbon emissions of land |
| Carbon flow | |
| CA | CO2 emissions from energy consumption |
| Ei | Annual energy consumption for different energy types |
| CVi | Net calorific value of energy type |
| Fi | Emission factor for energy type |
| Unit conversion coefficient | |
| H1 | Positive carbon transfer |
| H2 | Negative carbon transfer |
References
- Li, S.; Yao, L.; Zhang, Y.; Zhao, Y.; Sun, L. China’s provincial carbon emission driving factors analysis and scenario forecasting. Environ. Sustain. Indic. 2024, 22, 100390. [Google Scholar] [CrossRef]
- Feng, X.; Zhao, Y.; Yan, R. Does carbon emission trading policy has emission reduction effect?—An empirical study based on quasi-natural experiment method. J. Environ. Manag. 2024, 351, 119791. [Google Scholar] [CrossRef] [PubMed]
- Azurza-Zubizarreta, O.; Basurko-PerezdeArenaza, I.; Zelarain, E.; Villamor, E.; Akizu-Gardoki, O.; Villena-Camarero, U.; Campos-Celador, A.; Barcena-Hinojal, I. Urban Energy Transitions in Europe, towards Low-Socio-Environmental Impact Cities. Sustainability 2021, 13, 11641. [Google Scholar] [CrossRef]
- Khan, I.; Zakari, A.; Ahmad, M.; Irfan, M.; Hou, F. Linking energy transitions, energy consumption, and environmental sustainability in OECD countries. Gondwana Res. 2022, 103, 445–457. [Google Scholar] [CrossRef]
- Cheung, T.T.T.; Fuller, S.; Ossenbruegge, J. Mobilising change in cities: A capacity framework for understanding urban energy transition pathways. Environ. Policy Gov. 2023, 33, 531–545. [Google Scholar] [CrossRef]
- Zhu, E.Y.; Qi, Q.Y.; Sha, M. Identify the effects of urbanization on carbon emissions (EUCE): A global scientometric visualization analysis from 1992 to 2018. Environ. Sci. Pollut. Res. 2021, 28, 31358–31369. [Google Scholar] [CrossRef]
- Shu, Y.X.; Deng, N.X.; Wu, Y.M.; Bao, S.M.; Bie, A. Urban governance and sustainable development: The effect of smart city on carbon emission in China. Technol. Forecast. Soc. Change 2023, 193, 13. [Google Scholar] [CrossRef]
- Long, R.; Li, H.; Wu, M.; Li, W. Dynamic evaluation of the green development level of China’s coal-resource-based cities using the TOPSIS method. Resour. Policy 2021, 74, 102415. [Google Scholar] [CrossRef]
- Huang, H.; Shi, C. Analysis of the Path Optimization of the Sustainable Development of Coal-Energy Cities Based on TOPSIS Evaluation Model. Energies 2023, 16, 857. [Google Scholar] [CrossRef]
- Lu, Z.L.; Zhang, X.B.; Liu, Y.L.; Yang, L.Y.; Yi, L. Identifying weak areas of urban land use carbon metabolism in high-density city. Therm. Sci. 2024, 28, 791–809. [Google Scholar] [CrossRef]
- Lu, Z.; Wu, Y.; Huang, T.; Liu, J.; Zheng, H.; Liu, X. Optimizing urban carbon metabolism pattern based on LEAP-LANDIS scenario simulation. J. Arid Land Resour. Environ. 2023, 37, 10–20. [Google Scholar]
- Yang, F.; Zhang, G.-C.; Sun, J.; Xie, F.-J.; Chuai, X.-W.; Sun, R.-L. Study of Peak Carbon Emission of a City in Yangtze River Delta Based on LEAP Model. Huan Jing Ke Xue = Huanjing Kexue 2024, 45, 104–114. [Google Scholar] [PubMed]
- Dong, J.; Li, C.B. Scenario prediction and decoupling analysis of carbon emission in Jiangsu Province, China. Technol. Forecast. Soc. Change 2022, 185, 11. [Google Scholar] [CrossRef]
- Sanders, M.; Serebriakova, A.; Fragkos, P.; Polzin, F.; Egli, F.; Steffen, B. Representation of financial markets in macro-economic transition models-a review and suggestions for extensions. Environ. Res. Lett. 2022, 17, 20. [Google Scholar] [CrossRef]
- Xu, M.K.; Liao, C.P.; Huang, Y.; Gao, X.Q.; Dong, G.L.; Liu, Z. LEAP model-based analysis to low-carbon transformation path in the power sector: A case study of Guangdong-Hong Kong-Macao Greater Bay Area. Sci. Rep. 2024, 14, 18. [Google Scholar] [CrossRef]
- Ren, H.B.; Wu, Q.; He, W.G.; Wang, W.; Luo, X.; Li, Q.F.; Jiang, Z.P. Research on Regional low-carbon development path based on LEAP model: Taking the Lin-gang Special Area as an example. Energy Rep. 2022, 8, 327–335. [Google Scholar] [CrossRef]
- Emodi, N.V.; Emodi, C.C.; Murthy, G.P.; Emodi, A.S.A. Energy policy for low carbon development in Nigeria: A LEAP model application. Renew. Sustain. Energy Rev. 2017, 68, 247–261. [Google Scholar] [CrossRef]
- Nieves, J.A.; Aristizábal, A.J.; Dyner, I.; Báez, O.; Ospina, D.H. Energy demand and greenhouse gas emissions analysis in Colombia: A LEAP model application. Energy 2019, 169, 380–397. [Google Scholar] [CrossRef]
- Liu, D.; Yang, D.; Huang, A. LEAP-Based Greenhouse Gases Emissions Peak and Low Carbon Pathways in China’s Tourist Industry. Int. J. Environ. Res. Public Health 2021, 18, 1218. [Google Scholar] [CrossRef]
- Yang, L.; Lin, H.; Li, D.; Yue, C.; Zhu, H.; Zhang, F.; Li, H. Analysis of Uncertainty of Estimation of Greenhouse Gas Emissions from NaturalWetlands in China. Wetl. Sci. 2022, 20, 104–110. [Google Scholar]
- Liang, X.L.; Liu, Z.P.; Zhai, L.; Ji, L.; Feng, Y.J.; Sang, H.Y. Spatial terrestrial carbon emissions/sequestrations evolution based on ecological network analysis in Beijing-Tianjin-Hebei urban agglomeration. Ecol. Eng. 2023, 189, 12. [Google Scholar] [CrossRef]
- Marchi, M.; Capezzuoli, F.; Fantozzi, P.L.; Maccanti, M.; Pulselli, R.M.; Pulselli, F.M.; Marchettini, N. GHG action zone identification at the local level: Emissions inventory and spatial distribution as methodologies for policies and plans. J. Clean. Prod. 2023, 386, 16. [Google Scholar] [CrossRef]
- Yeo, I.A.; Yoon, S.H.; Yee, J.J. Development of an urban energy demand forecasting system to support environmentally friendly urban planning. Appl. Energy 2013, 110, 304–317. [Google Scholar] [CrossRef]
- Deng, Y.; Jiang, W.Y.; Wang, Z.Y. Economic resilience assessment and policy interaction of coal resource oriented cities for the low carbon economy based on AI. Resour. Policy 2023, 82, 8. [Google Scholar] [CrossRef]
- Wu, H.J.; Deng, K.L.; Dong, Z.F.; Meng, X.R.; Zhang, L.; Jiang, S.Y.; Yang, L.; Xu, Y.H. Comprehensive assessment of land use carbon emissions of a coal resource-based city, China. J. Clean. Prod. 2022, 379, 15. [Google Scholar] [CrossRef]
- Kuang, Y.M.; Fan, Y.J.; Bin, J.; Fan, M. Impact of the digital economy on carbon dioxide emissions in resource-based cities. Sci. Rep. 2024, 14, 16. [Google Scholar] [CrossRef]
- Hu, N.; Zheng, B. Natural resources, education, and green economic development. Resour. Policy 2023, 86, 7. [Google Scholar] [CrossRef]
- Badeeb, R.A.; Szulczyk, K.R.; Zahra, S.; Mukherjee, T.C. Innovation dynamics in the natural resource curse hypothesis: A new perspective from BRICS countries. Resour. Policy 2023, 81, 11. [Google Scholar] [CrossRef]
- Bian, Z.; Zhong, S. The impact of economic growth target on carbon emission efficiency in resource-based cities. China Environ. Sci. 2023, 43, 4395–4408. [Google Scholar]
- Li, J.; Ma, Z.Y.; Sun, H.W.; Chen, W.H. Driving factor analysis and dynamic forecast of industrial carbon emissions in resource-dependent cities: A case study of Ordos, China. Environ. Sci. Pollut. Res. 2023, 30, 92146–92161. [Google Scholar] [CrossRef]
- Yan, D.; Kong, Y.; Ye, B.; Shi, Y.K.; Zeng, X.Y. Spatial variation of energy efficiency based on a Super-Slack-Based Measure: Evidence from 104 resource-based cities. J. Clean. Prod. 2019, 240, 11. [Google Scholar] [CrossRef]
- Xu, W.; Zheng, J.; Zhou, J.; Chen, X.; Liu, C. Transformation performance characteristics of resource-based cities and their carbon emission reduction effects. J. Nat. Resour. 2023, 38, 39–57. [Google Scholar] [CrossRef]
- Wang, J.; Zhang, Z. Land Use Change and Simulation Analysis in the Northern Margin of the Qaidam Basin Based on Markov-PLUS Model. J. Northwest For. Univ. 2022, 37, 139–148,179. [Google Scholar]
- Wang, J.; Chang, J.; Deng, Y.; Lin, Y.; Wu, H. Redevelopment strategy of closed coal mine industrial plaza:A case study of Fenghuangshan Mine in Jincheng, China. Coal Geol. Explor. 2022, 50, 179–190. [Google Scholar]
- Yu, Y.; Liu, B.; Zhu, X.; Zhang, J.; Wang, B.; Wang, M.; Yang, J.; Bai, Y.; Yang, F. Low-carbon Development Path of Ordos Based on LEAP Model. Environ. Sci. 2024, 45, 5097–5105. [Google Scholar]
- Cai, B.; Qin, K.; Yang, M.; Xue, Y.; Pei, F.; Li, C.; Chen, Y. Optimization of the power transition pathway considering the large-scale development of coal power with CCUS. Clean Coal Technol. 2024. [Google Scholar] [CrossRef]
- Tian, Y.; Zhang, J. Regional Differentiation Research on Net Carbon Effect of Agricultural Production in China. J. Nat. Resour. 2013, 28, 1298–1309. [Google Scholar]
- Shang, Y.; Wang, L.; Jia, J.; Zhai, Y.; Chen, Y. Study on Carbon Flow Transfer Path of the Evolution of the Spatial and Temporal Pattern of the Production-Living-Ecological Space in Bin County. Res. Soil Water Conserv. 2024, 31, 326–335. [Google Scholar]
- Fang, J.Y.; Guo, Z.D.; Piao, S.L.; Chen, A.P. Terrestrial vegetation carbon sinks in China, 1981–2000. Sci. China Ser. D-Earth Sci. 2007, 50, 1341–1350. [Google Scholar] [CrossRef]
- Duan, X.; Wang, X.; Lu, F.; Ouyang, Z.Y. Carbon sequestration and its potential by wetland ecosystems in China. Acta Ecol. Sin. 2008, 28, 463–469. [Google Scholar]
- Lai, L.; Huang, X.J.; Liu, W.L.; Zhao, D. Adjustment for regional ecological footprint based on input-output technique: A case study of Jiangsu Province in 2002. Acta Ecol. Sin. 2006, 26, 1285–1292. [Google Scholar]
- Li, J.; Chen, S.-L.; Li, C.-X.; Zhou, P. Land carbon metabolism in Xiamen-Zhangzhou-Quanzhou region based on ecological network analysis. Ying Yong Sheng Tai Xue Bao = J. Appl. Ecol. 2023, 34, 1375–1383. [Google Scholar]
- Hyndman, R.J.; Koehler, A.B. Another look at measures of forecast accuracy. Int. J. Forecast. 2006, 22, 679–688. [Google Scholar] [CrossRef]


Disclaimer/Publisher’s Note: The statements, opinions and data contained in all publications are solely those of the individual author(s) and contributor(s) and not of MDPI and/or the editor(s). MDPI and/or the editor(s) disclaim responsibility for any injury to people or property resulting from any ideas, methods, instructions or products referred to in the content. |
© 2025 by the authors. Licensee MDPI, Basel, Switzerland. This article is an open access article distributed under the terms and conditions of the Creative Commons Attribution (CC BY) license (https://creativecommons.org/licenses/by/4.0/).
Share and Cite
Zhu, L.; Cao, M.; Wang, W.; Zhang, T. Spatial Evolution and Scenario Simulation of Carbon Metabolism in Coal-Resource-Based Cities Towards Carbon Neutrality: A Case Study of Jincheng, China. Energies 2025, 18, 1532. https://doi.org/10.3390/en18061532
Zhu L, Cao M, Wang W, Zhang T. Spatial Evolution and Scenario Simulation of Carbon Metabolism in Coal-Resource-Based Cities Towards Carbon Neutrality: A Case Study of Jincheng, China. Energies. 2025; 18(6):1532. https://doi.org/10.3390/en18061532
Chicago/Turabian StyleZhu, Li, Mengying Cao, Wenyuan Wang, and Tianyue Zhang. 2025. "Spatial Evolution and Scenario Simulation of Carbon Metabolism in Coal-Resource-Based Cities Towards Carbon Neutrality: A Case Study of Jincheng, China" Energies 18, no. 6: 1532. https://doi.org/10.3390/en18061532
APA StyleZhu, L., Cao, M., Wang, W., & Zhang, T. (2025). Spatial Evolution and Scenario Simulation of Carbon Metabolism in Coal-Resource-Based Cities Towards Carbon Neutrality: A Case Study of Jincheng, China. Energies, 18(6), 1532. https://doi.org/10.3390/en18061532