Abstract
In recent years, increasing the proportion of quartz sand in the hydraulic fracturing of shale gas has become one of the primary approaches to reduce development costs. However, the lack of industry standards for evaluating quartz sand specifically for shale gas hydraulic fracturing has constrained its widespread application in this context. Therefore, based on indoor comparative experiments, statistical analysis of product indicators, and field production data of shale gas, this study experimentally analyzed the particle size, turbidity, density, crush rate, embedment depth, friction coefficient, and packing coefficient of quartz sand used in shale gas hydraulic fracturing to define performance criteria. Certain evaluation methods deviate from the practical application of shale fracturing, and it is necessary to carry out specific experimental methods and performance indicators. The results indicate that for quartz sand used in shale gas hydraulic fracturing, it is recommended to increase five particle size specifications, maintain turbidity values below 250 FTU (formazine turbidity unit), ensure visual density does not exceed 2.75 g/cm3, and limit the crush rate to below 18%, embedment depth to below 0.15, packing coefficient to below 0.8, and friction coefficient to below 0.5. This work establishes evaluation standards and performance requirements for the optimal selection of quartz sand, aiming to reduce fracturing costs and enhance production efficiency in shale gas reservoirs.
1. Introduction
Compared with conventional gas reservoir fracturing [1], multi-stage fracturing in horizontal wells to form complex volume fracture networks has been one of the key technologies for the effective development of shale gas [2,3]. Proppant and fracture morphology directly determines the efficiency of shale gas extraction [4,5,6,7]. Based on the support of proppants, the complex volume fracture network becomes the important passage for the transfusion of shale gas [8,9,10,11]. Overseas studies investigating the impact of varying proppant quantities and types on the net proceeds of gas wells have revealed that, despite ceramsite exhibiting significantly higher conductivity than quartz sand, at equivalent proppant levels, the price of ceramsite is CNY 1500–1800 per ton, and the price of quartz sand is CNY 500–900 per ton, with the higher cost of ceramsite leading to increased gas extraction costs [12]. Consequently, the net proceeds from ceramsite are lower than those from quartz sand, which is unfavorable for the efficient development of shale gas within the current oil price environment [13,14,15]. International oil and gas prices have been low since 2014 [16]; therefore, reducing costs and increasing efficiency have been the main ideas in the development of shale gas. In North America, besides speeding up drilling and completion, reducing the amounts of ceramsite and increasing the ratio of quartz sand in fracturing significantly reduces the cost of fracturing materials, which achieves the efficient development of shale gas under low gas prices [17,18,19,20,21,22].
At present, sandy materials from Australia, China, Poland, and Oman are used in North American shale gas reservoirs [23,24,25]. Some quartz sands have a turbidity higher than 250 FTU or a crushing rate exceeding 10%; these materials are identified as non-conforming products due to certain performance deficiencies that fail to align with the industry’s performance criteria. Nevertheless, these materials have a special role in the fracturing development of oil and gas reservoirs and are always applied [26,27,28,29,30,31,32,33]. As a whole, the overall trend of proppant in shale gas fracturing in America is that the proportion of ceramsite particles gradually decreases; without ceramsite, the proportion of quartz sand increases, especially in quartz sand with low particle size [34,35,36,37,38,39,40]. Proppants are very important in improving shale gas well production, but there are some disagreements in selecting a proppant. Currently, the application of quartz sand still holds a strong position, considering the cost of fracturing and its economic effect [41,42,43,44,45,46,47,48,49,50].
Herskovits et al.’s [51] research shows that over the last several decades, the industry has generated a large amount of proppant performance data using designated API methods. However, recent studies validate that correlations and conclusions generated from standard API testing do not accurately predict ceramic proppant performance in unconventional reservoirs. The aforementioned study suggests that the modified API RP 19-C procedure for testing proppant performance under thin layer/monolayer conditions yields results that better correlate with well production data trends.
Melcher et al.’s [52] research shows that selecting appropriate proppants is an important part of hydraulic fracture completion design. Proppant selection choices have increased in recent years as regional sands have become the proppant of choice in many liquid-rich shale plays. The authors present a brief historical perspective on proppant selection, followed by various detailed studies of how different proppant types have performed in various unconventional onshore US basins, along with economic analyses.
Recently, combined proppants with quartz sand and ceramsite particles have been used in the Changning-Weiyuan block of Sichuan, China, and combined proppants with powder ceramsite and coated sand are mainly used in the Jiaoshiba block of Chongqing, China [53,54]. The current method of fracturing quartz sand used in development is mainly distributed in Qingtongxia in Ningxia province, Chifeng in Neimenggu province, and other areas. Shale gas resources are mainly concentrated in Sichuan, and the transportation cost of quartz sand from the north to Sichuan and other places is high. The cost of proppants will be greatly reduced if the sand source can be localized because the price of localized quartz sand is CNY 300–500 per ton [55,56,57,58]. At present, there are no performance evaluation and technology indicators for the industry standards for shale fracturing proppants. The evaluation standards of proppant performance are the same both at home and abroad and are mainly formulated for the use of quartz sand in sandstone reservoir fracturing and gravel filling operations. The existing standard experimental evaluation methods exhibit numerous differences compared to those specifically tailored for shale fracturing proppants. Firstly, the existing standards employ a liquid solution of 12% HCl with 3% HF for acid solubility testing, whereas in current shale fracturing operations, only 15% HCl is used to reduce fracturing pressure. Secondly, the sandstone reservoir fracturing targeted by the standard adopts gel fracturing fluid, which has a strong sand-carrying capacity and uniformly migrates to the depth of the fracture, while shale fracturing construction adopts slippery water-carrying sand, which has weak sand-carrying performance. Proppants settle and accumulate in the formation of fractures to form sand banks, and proppants gradually advance in the front of the sand banks. The existing evaluation methods do not evaluate the accumulation characteristics of proppants. Thirdly, in terms of performance indicators, the double-winged fractures formed near the well during the fracturing process of the sandstone reservoir are the main flow channels of fluid, and the matrix permeability of the sandstone reservoir is relatively high, which requires higher proppant performance indicators to meet the needs of the matrix seepage of sandstone reservoirs. In addition, complex fracture networks are formed near the well during the fracturing process of shale reservoirs. In a single fracture, the law of seepage and desorption of the adjacent shale reservoir matrix can be satisfied. The shale reservoir matrix has extremely low permeability and relatively low requirements for proppant performance indicators. Finally, the complex fracture network formed by the shale reservoir becomes a fluid flow channel [59,60,61,62,63,64,65,66,67]. To sum up, there are many differences between the existing standard evaluation methods and their application in shale fracturing, and targeted experimental methods and performance indicators need to be developed.
Therefore, there is an urgent need to establish a quartz sand evaluation system specifically for shale gas fracturing. This manuscript combines the characteristics of shale reservoirs with the reduction in development costs by analyzing ideal proppant parameters such as particle size, turbidity, density, breaking rate, embedding degree, friction coefficient, accumulation coefficient, and so on. The performance indicators that are suitable for shale gas fracturing are certain in the end. Relevant research results can provide support and assurance for the early laboratory selection and on-site quality control of quartz sand used in shale gas fracturing, help to promote the localization of quartz sand sources, reduce fracturing investment costs, and have great significance for the efficient and low-cost development of shale gas.
2. Data and Methods
The performance of proppants is directly related to the effectiveness of fracturing production, so the performance requirements for proppants are constantly increasing. The standardization of proppants helps to enhance international competitiveness and ensure their recognition and use in different regions and projects. At present, there are two standards for the performance evaluation of proppants [68,69], mainly based on the hydraulic fracturing requirements of conventional oil and gas wells. The experimental parameters and technical indicators for evaluating proppant performance in shale gas volumetric fracturing significantly differ from those used in conventional oil and gas wells. In breaking rate and turbidity, the standard industry technology indicators at home are higher than those abroad. Current evaluation methods focus on the performance parameters under normal pressure and lack the influence of formation pressure conditions, such as temperature, on the liquid. Certain evaluation methods deviate from the practical application of shale fracturing, and it is necessary to carry out specific experimental methods and performance indicators. The differences between the current proppant standards and the actual application of shale fracturing are shown in Table 1.

Table 1.
The differences between the current proppant standards and the actual application of shale fracturing.
3. Results and Discussion
3.1. Particle Size
According to the current industry standard in China [68], the types and screening standards of proppant particle sizes are required. There are 11 kinds of particle size types in ISO 13503-2:2006 and SY/T 5108-2014. Only 30/50 mesh, 40/70 mesh, and 70/140 mesh can be applied to shale gas fracturing construction [69], while other particle sizes are bigger. The actual type of proppant used accounts for 27.3% of the current industry standard proppant types.
At the same time, different particle sizes of proppant combinations are used to achieve graded support for fractures of different scales to meet the requirement of shale gas graded support [13,14,15,64,67].
Dahl et al. [70] studied adding 325 mesh silica powder or powder ceramic with a median particle size of less than 30 μm to fracturing fluid before injecting conventional proppants to support microcracks and increase oil and gas production. The on-site application results in the Barnett shale gas well showed that the production of wells with added microproppants increased from 40% to 55% compared to control wells within 210 days of production after being pressurized.
The utilization of fine proppants with particle sizes such as 100/120 mesh and 200 mesh in the grading of proppants abroad has not been included in the existing industry standards for particle size classification. This omission hinders the widespread application of non-standard particle-size proppants. In 2019, 100 mesh or 200 mesh quartz sand was the most commonly used quartz sand for hydraulic fracturing in the United States [71].
Based on the current situation of domestic proppant use and foreign development, the particle size of quartz sand used in shale fracturing is shown in Table 2.
Table 2.
The particle size of quartz sand.
3.2. Turbidity
Turbidity is a means of characterizing small particles on the surface of ceramic proppant falling off in the water. After oil and gas passages are formed, small particles from the proppant’s turbidity fall off and migrate between the particles. It is easy to plug the fractures formed by the proppant, thereby reducing the effect of fracturing. The current experimental evaluation method of proppant turbidity only considers the turbidity source during proppant production but not during proppant application. In addition, in the current turbidity parameter indicators of proppants, the turbidity values of ceramic particles and quartz sand are empirical parameters that lack theoretical basis and experimental support [18]. In order to simulate the effect of proppant turbidity on shale gas flow in geological formations, the influence of turbidity on fracture conductivity is used to study a reasonable range of turbidity values. Fracture conductivity refers to the ability of rock fractures or pores to conduct fluids (such as natural gas, oil, etc.) during the hydraulic fracturing process. This capability is contingent upon the dimensions, connectivity, and nature of the filling material (such as proppants) within the fractures or pores. It is crucial for the development of reservoirs like shale gas, as it influences the efficiency of fluid movement and extraction within the rock matrix. Therefore, the method of evaluating proppant turbidity using fracture conductivity is proposed.
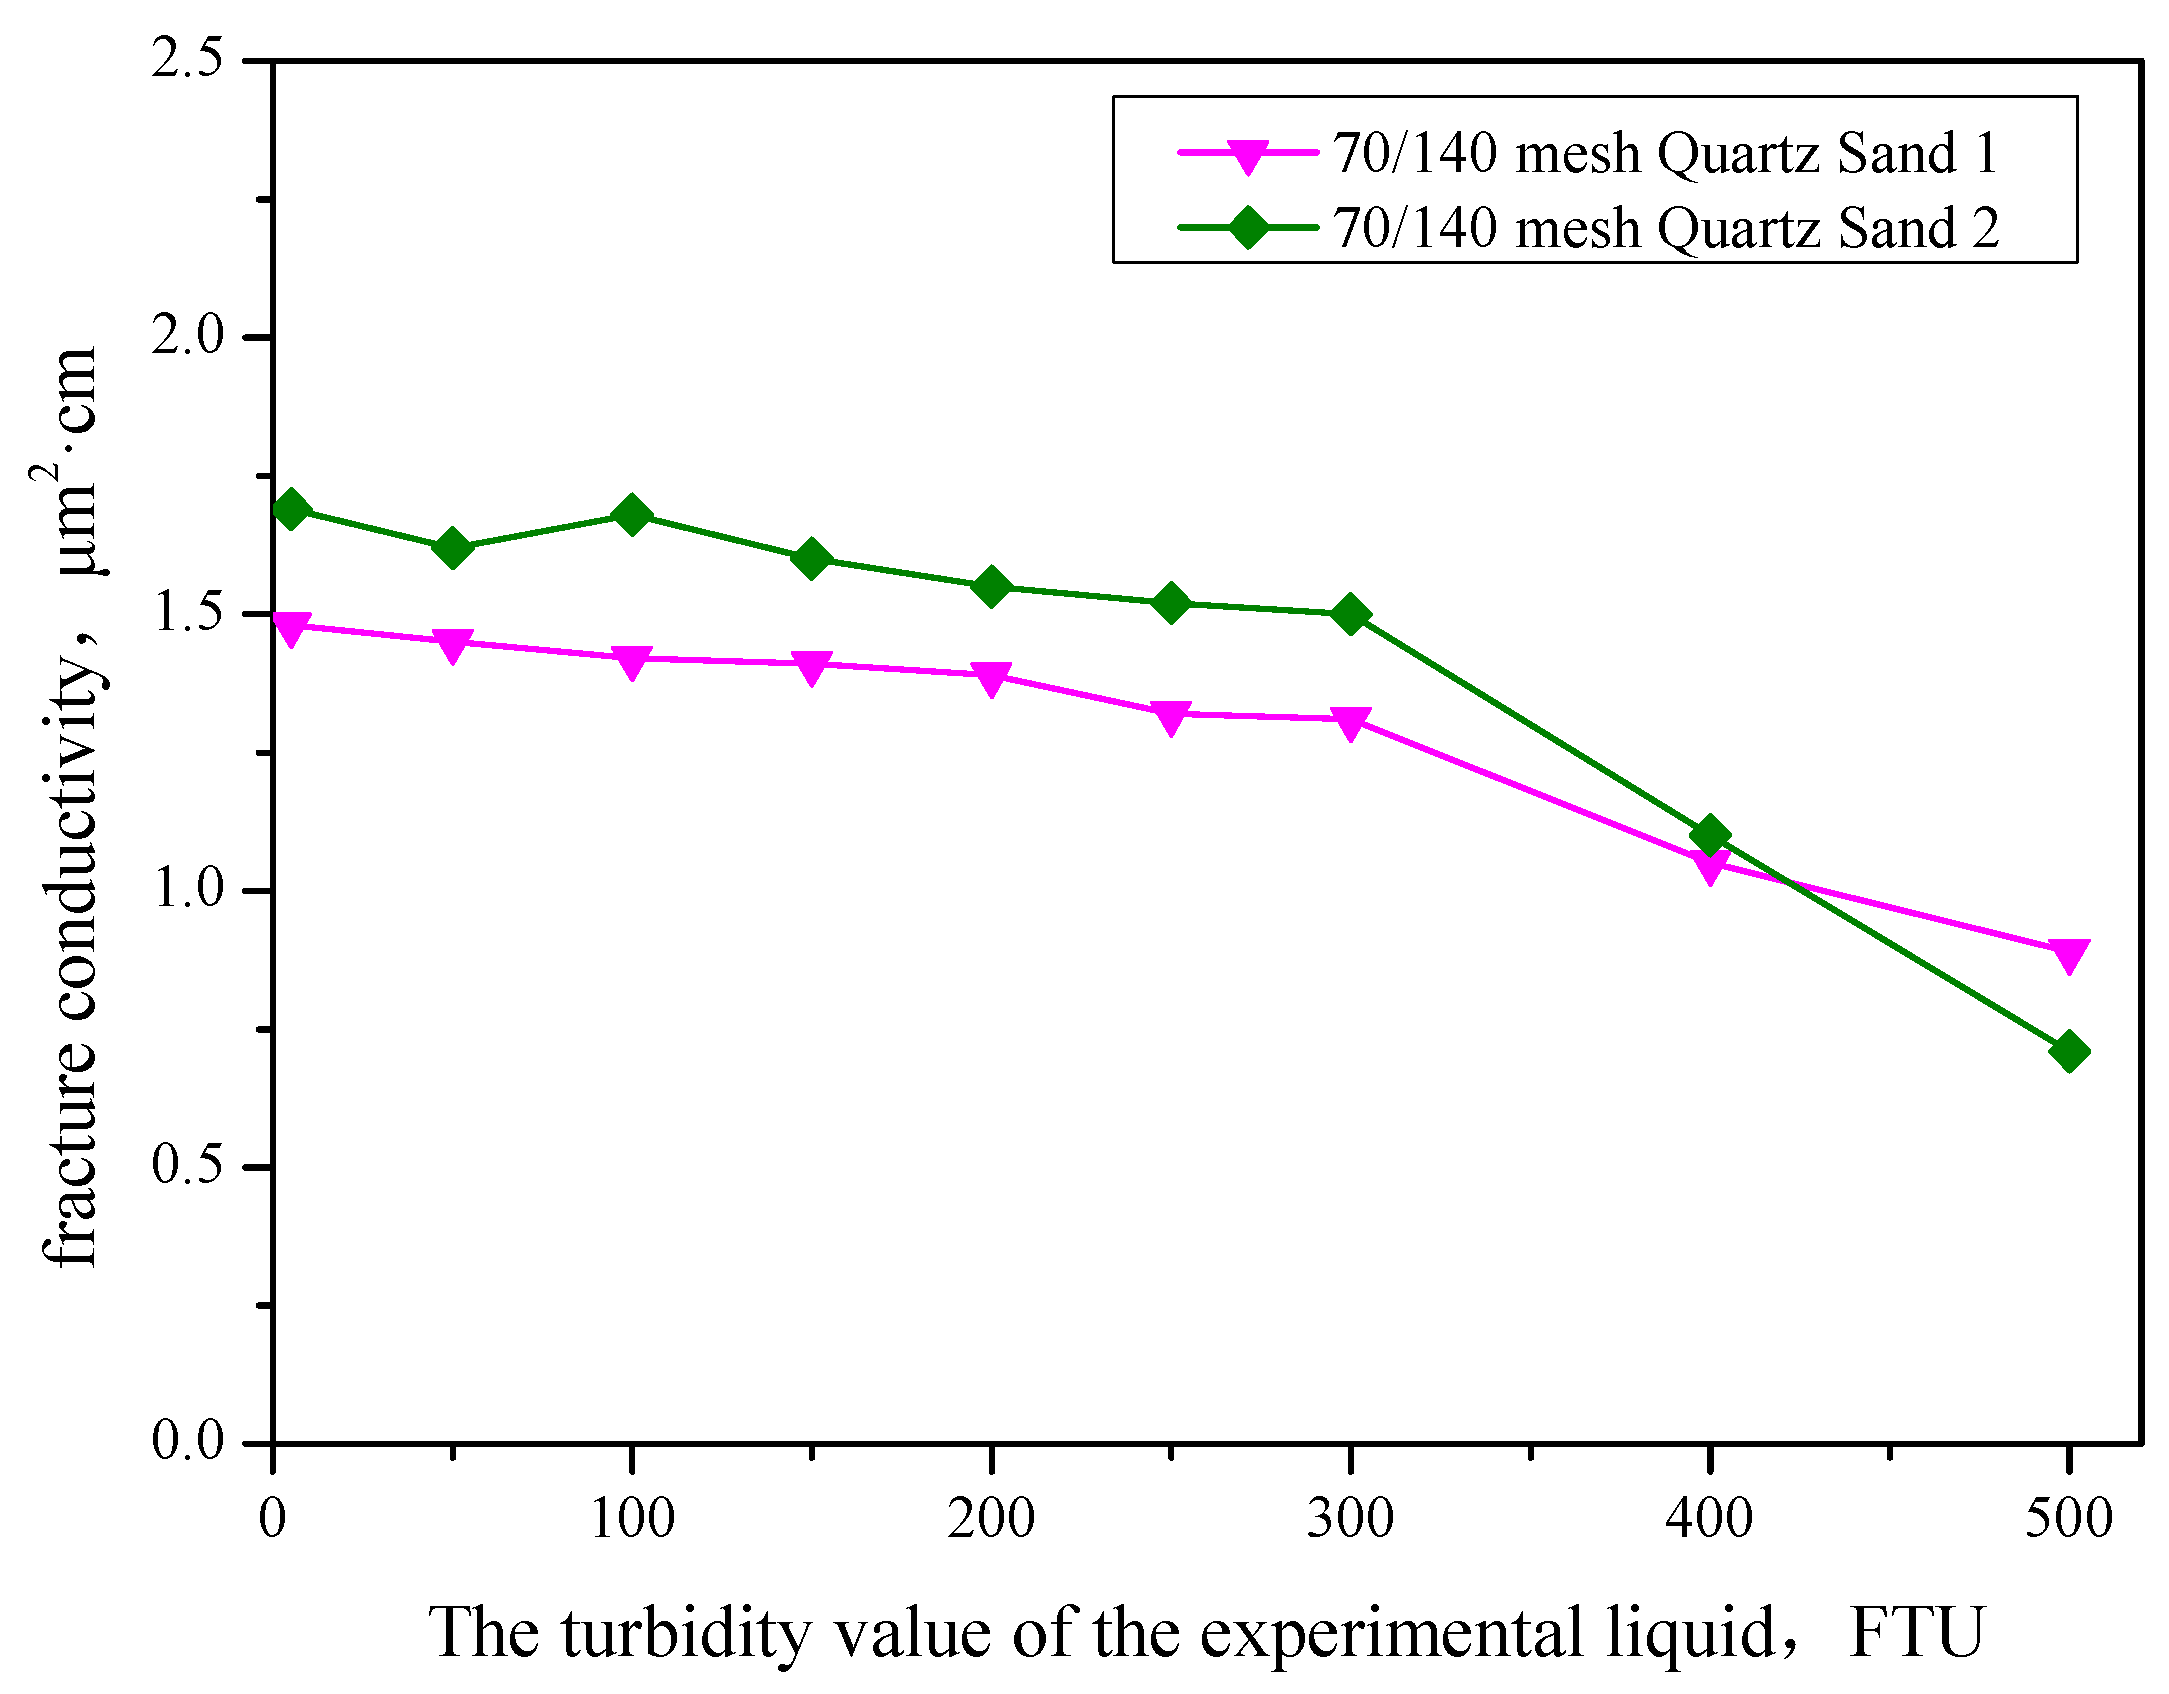
As shown in Figure 1, the different turbidity of liquids is used to carry out the conductivity experiments. The proppant concentration is 2.5 kg/m2, and the closing pressure is 69 MPa, with the closure of 69 MPa coming from the closure pressure of shale gas formations and the product specifications of proppants in two proppant standards.
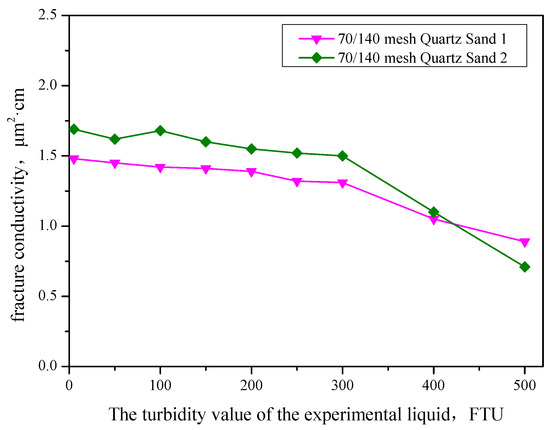
Figure 1.
The conductivity experiment under different turbidity (the experimental result is the average of three repeated experiments).
As can be seen from Figure 1, the influence of turbidity on the conductivity is relatively low. When the turbidity is 250 FTU, the conductivity decreases by 10.05% and 10.81%. After the fracturing of the proppant, particles are formed, which move along with the fluid in the proppant filling layer. When the turbidity exceeds 250 FTU, the number of particles in the fluid increases, causing partial blockage of the proppant filling layer, a decrease in permeability, and a decrease in diversion capacity. When the turbidity is higher than 250 FTU, the decrease rate of fracture conductivity exceeds 10%, so the turbidity index is set to 250 FTU. These experimental conclusions are consistent with the research findings of Anschutz et al. [72], who also believe that both the level and mineral composition of the turbulence itself can significantly impact the permeability and conductivity of a stimulated resource.
3.3. Density
The vertical settlement of quartz sand in slickwater impacts the gas well production index, while horizontal migration affects the effective support area, which is significantly smaller in volume compared to the reservoir reconstruction volume. The migration and placement of quartz sand directly influence the reconstruction effect. The current proppant industry standard has no requirement for the density of the proppant. However, the viscosity of slickwater for shale gas fracturing is low, so the sand carrying of slickwater mainly relies on its displacement [18,19,20,21]. The settlement rate is directly proportional to the density contrast between the proppant and fracturing fluid; therefore, the proppant density should not be excessively high.
Experiments are carried out on the settlement rate of different density proppants in smooth water to determine the apparent density performance indicators of proppants for shale fracturing, as shown in Figure 2.
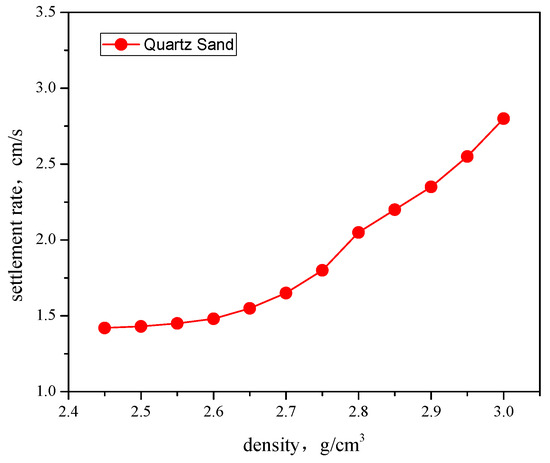
Figure 2.
The experimental comparison on the settlement rate of quartz sand (the experimental result is the average of three repeated experiments).
As can be seen from Figure 2, when the density of quartz sand falls within the range of 2.45–2.75 g/cm3, the settling rate increases slowly with increasing density, with a slope of less than 1. In the 2.75–3.0 g/cm3 range, the settling rate increases more rapidly with increasing quartz sand density, with a slope greater than 1. Therefore, to ensure optimal lateral transport of quartz sand and achieve the most effective support area, the apparent density of quartz sand should be below 2.75 g/cm3. The related research results and Anschutz et al.’s [72] research conclusion are consistent, as they believe that the density of proppants should be lower than 2.71 g/cm3 and the settling of proppants in liquids should also be lower.
3.4. Breaking Rate
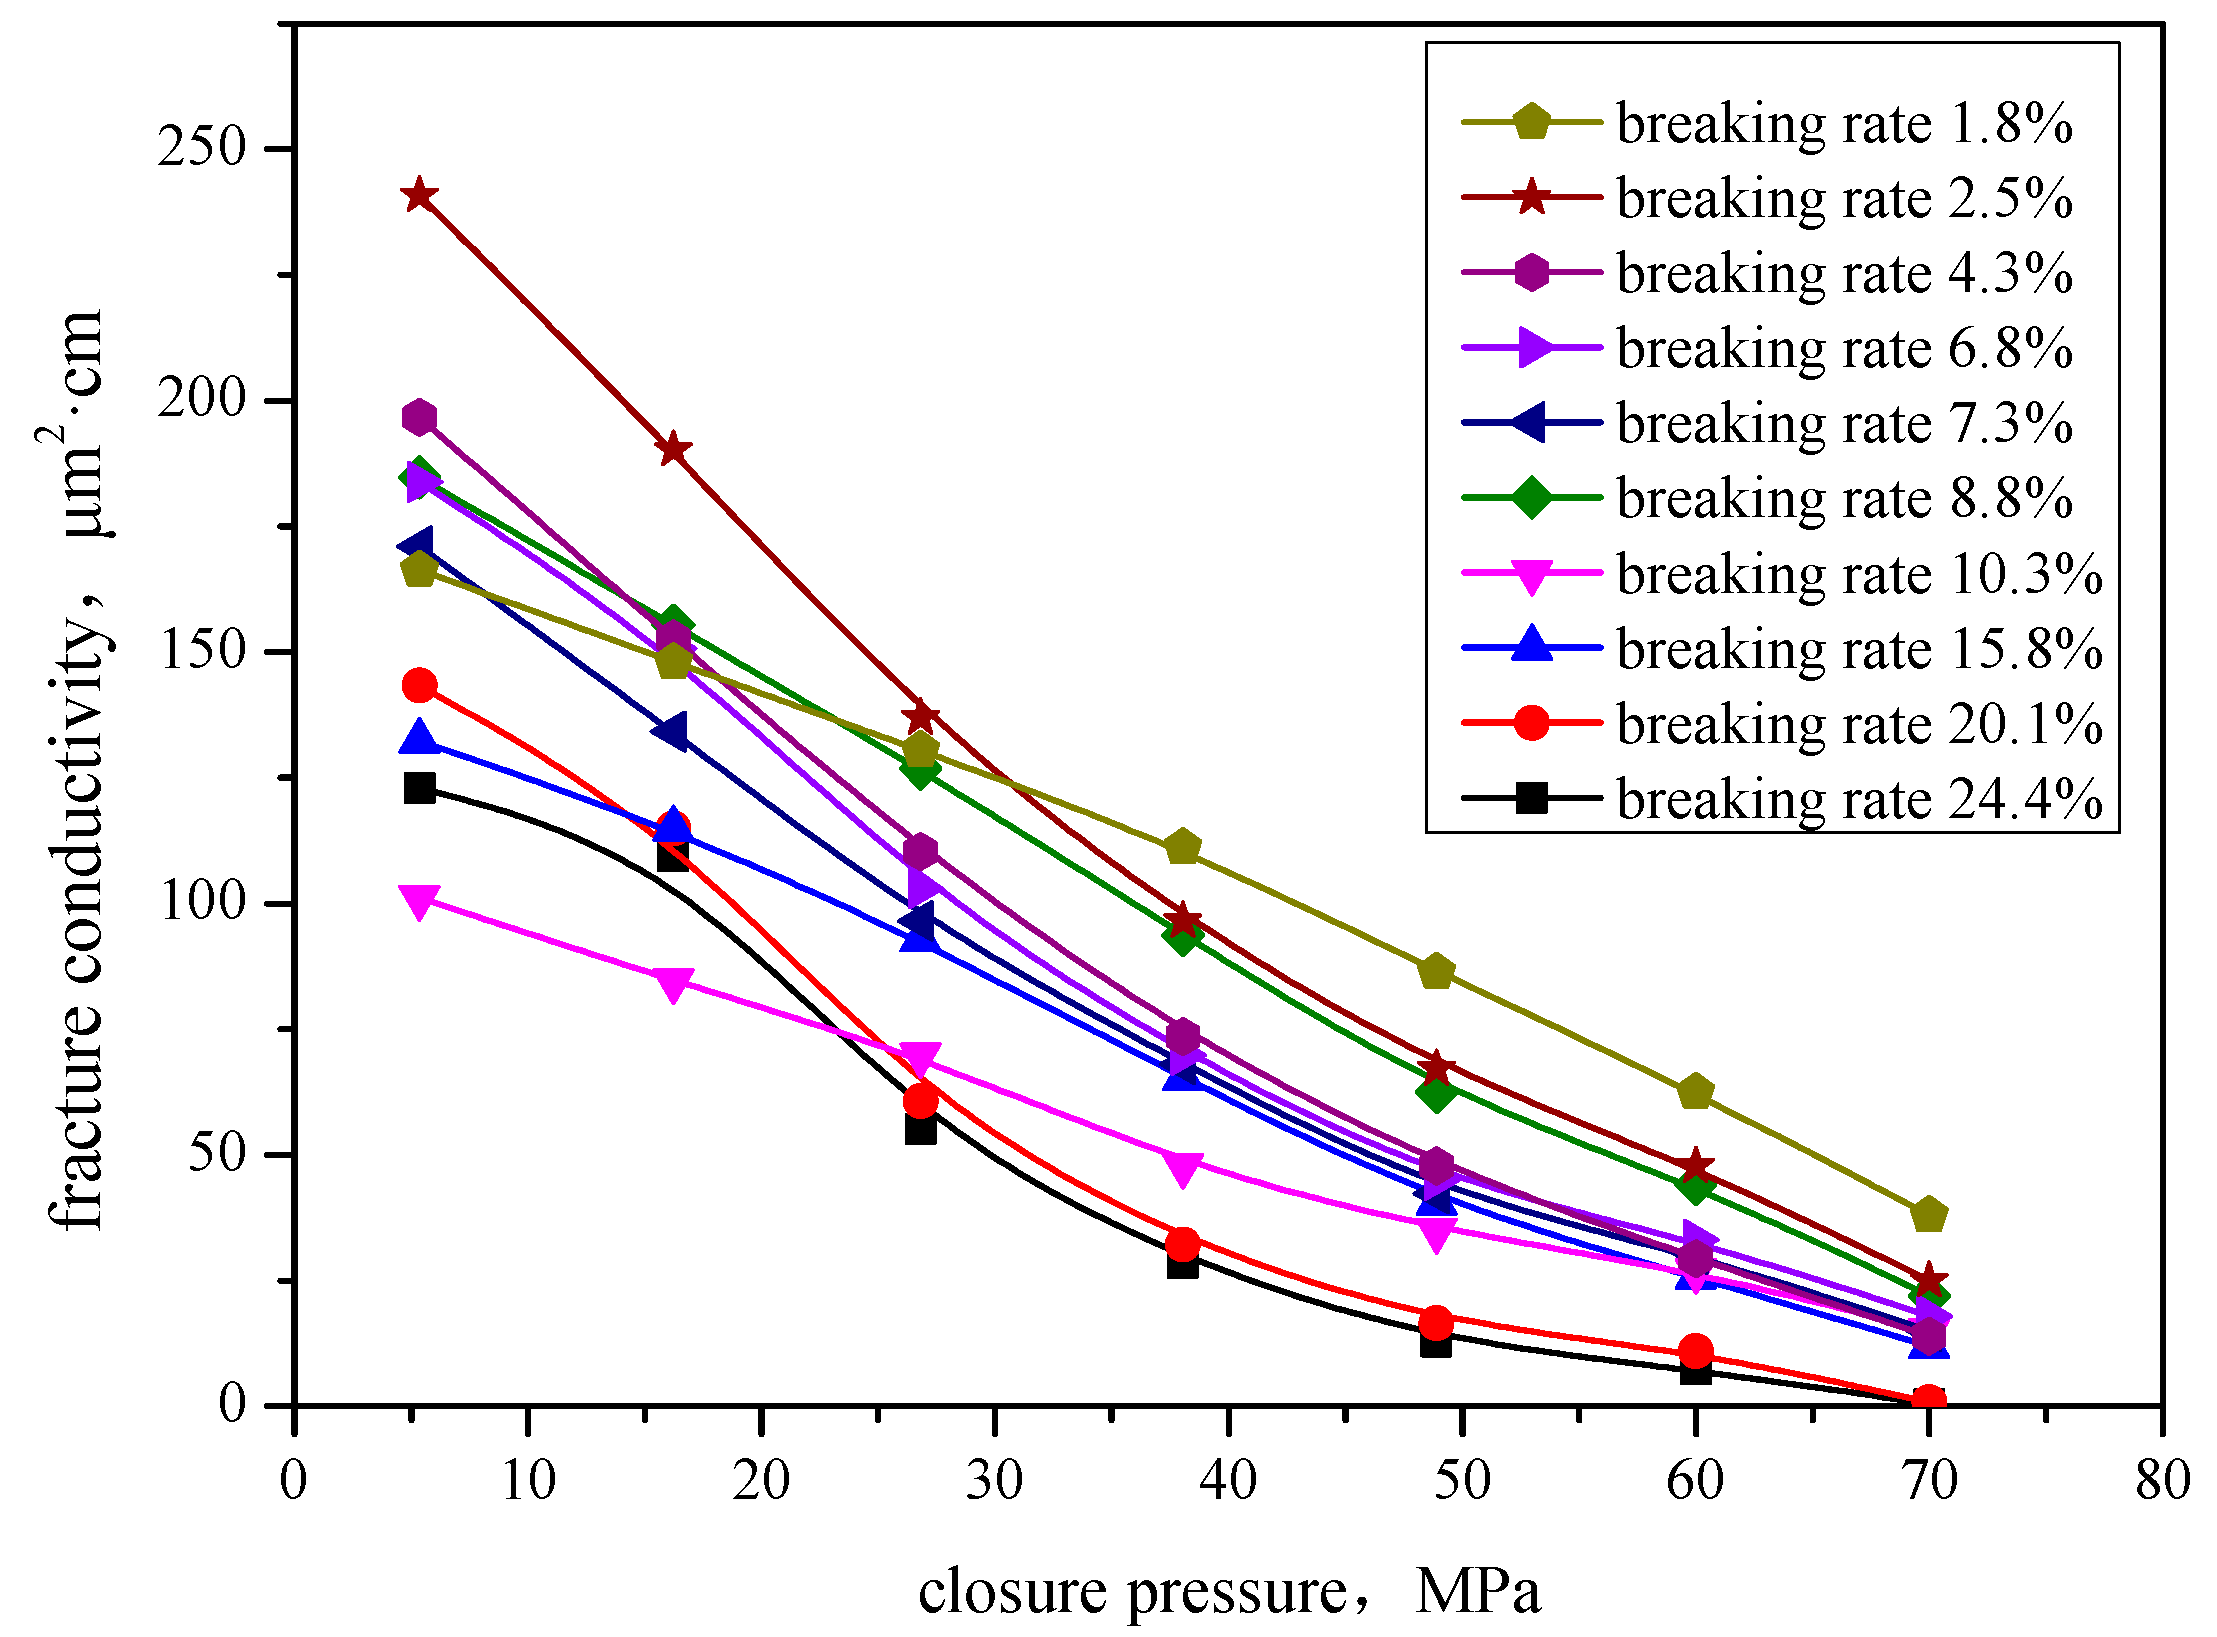
The breaking rate is used to determine and compare the performance of the proppant on anti-breaking. The proppant breaking rate is one of the most important parameters analyzed, providing measurements of proppant quality production, and the value of the breaking rate is the evaluation indicator. The breaking rate refers to the breaking mass of a certain volume of proppant under rated pressure. The breaking rate of a proppant is controlled by factors such as the proppant type, chemical and mineral components, particle size range and composition, roundness and sphericity, and density [66,69]. Even if the same type of proppant, the same particle size range and particle size composition, and other factors (such as sphericity) are different, the breaking rate still differs greatly. The relationship between the breaking rate and the conductivity of 10 different samples under the same closing pressure is shown in Figure 3.
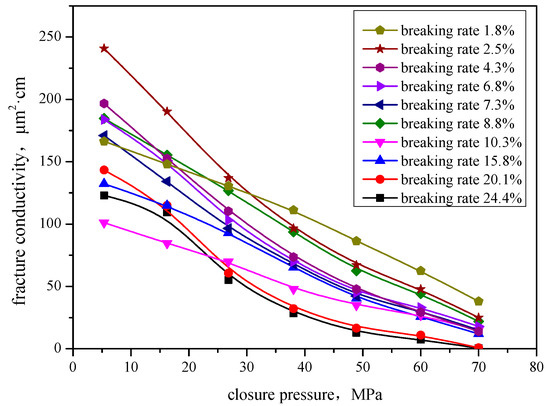
Figure 3.
The conductivity under different breaking rates (the experimental result is the average of three repeated experiments).
As can be seen from Figure 3, the breaking rate of the sample is inversely proportional to the conductivity under the same closing pressure, meaning the greater the greater the breaking rate, the lower the conductivity. Under low closing pressure, the proppant has not been broken, and the conductivity is less affected by the breaking rate. When the closing pressure is higher than 30 MPa, the proppant gradually breaks, and the tiny particles formed will enter the space between the proppants, which will affect the liquid flow. The conductivity significantly decreases with the increase in the breaking rate; the larger the breaking rate is under the same closing pressure, the lower the conductivity is. As a result, the breaking rate should not be more than 18%. The relevant understanding is consistent with the research findings of Tian et al. [73]. The study proposes an innovative crushing rate evaluation method by analyzing hydraulic crushing and steel crushing rates. The results show that two types of crushing evolution occur during the fracturing process for micro-proppants. Under a load of 70 MPa, the hydraulic breaking rate is about 20%. Numerical simulation results showed that due to the presence of micro-proppants, the effectively propped area of the fracture network would sharply increase, accompanied by an over 40% increase in the initial hydrocarbon production rate.
3.5. Embedding Degree
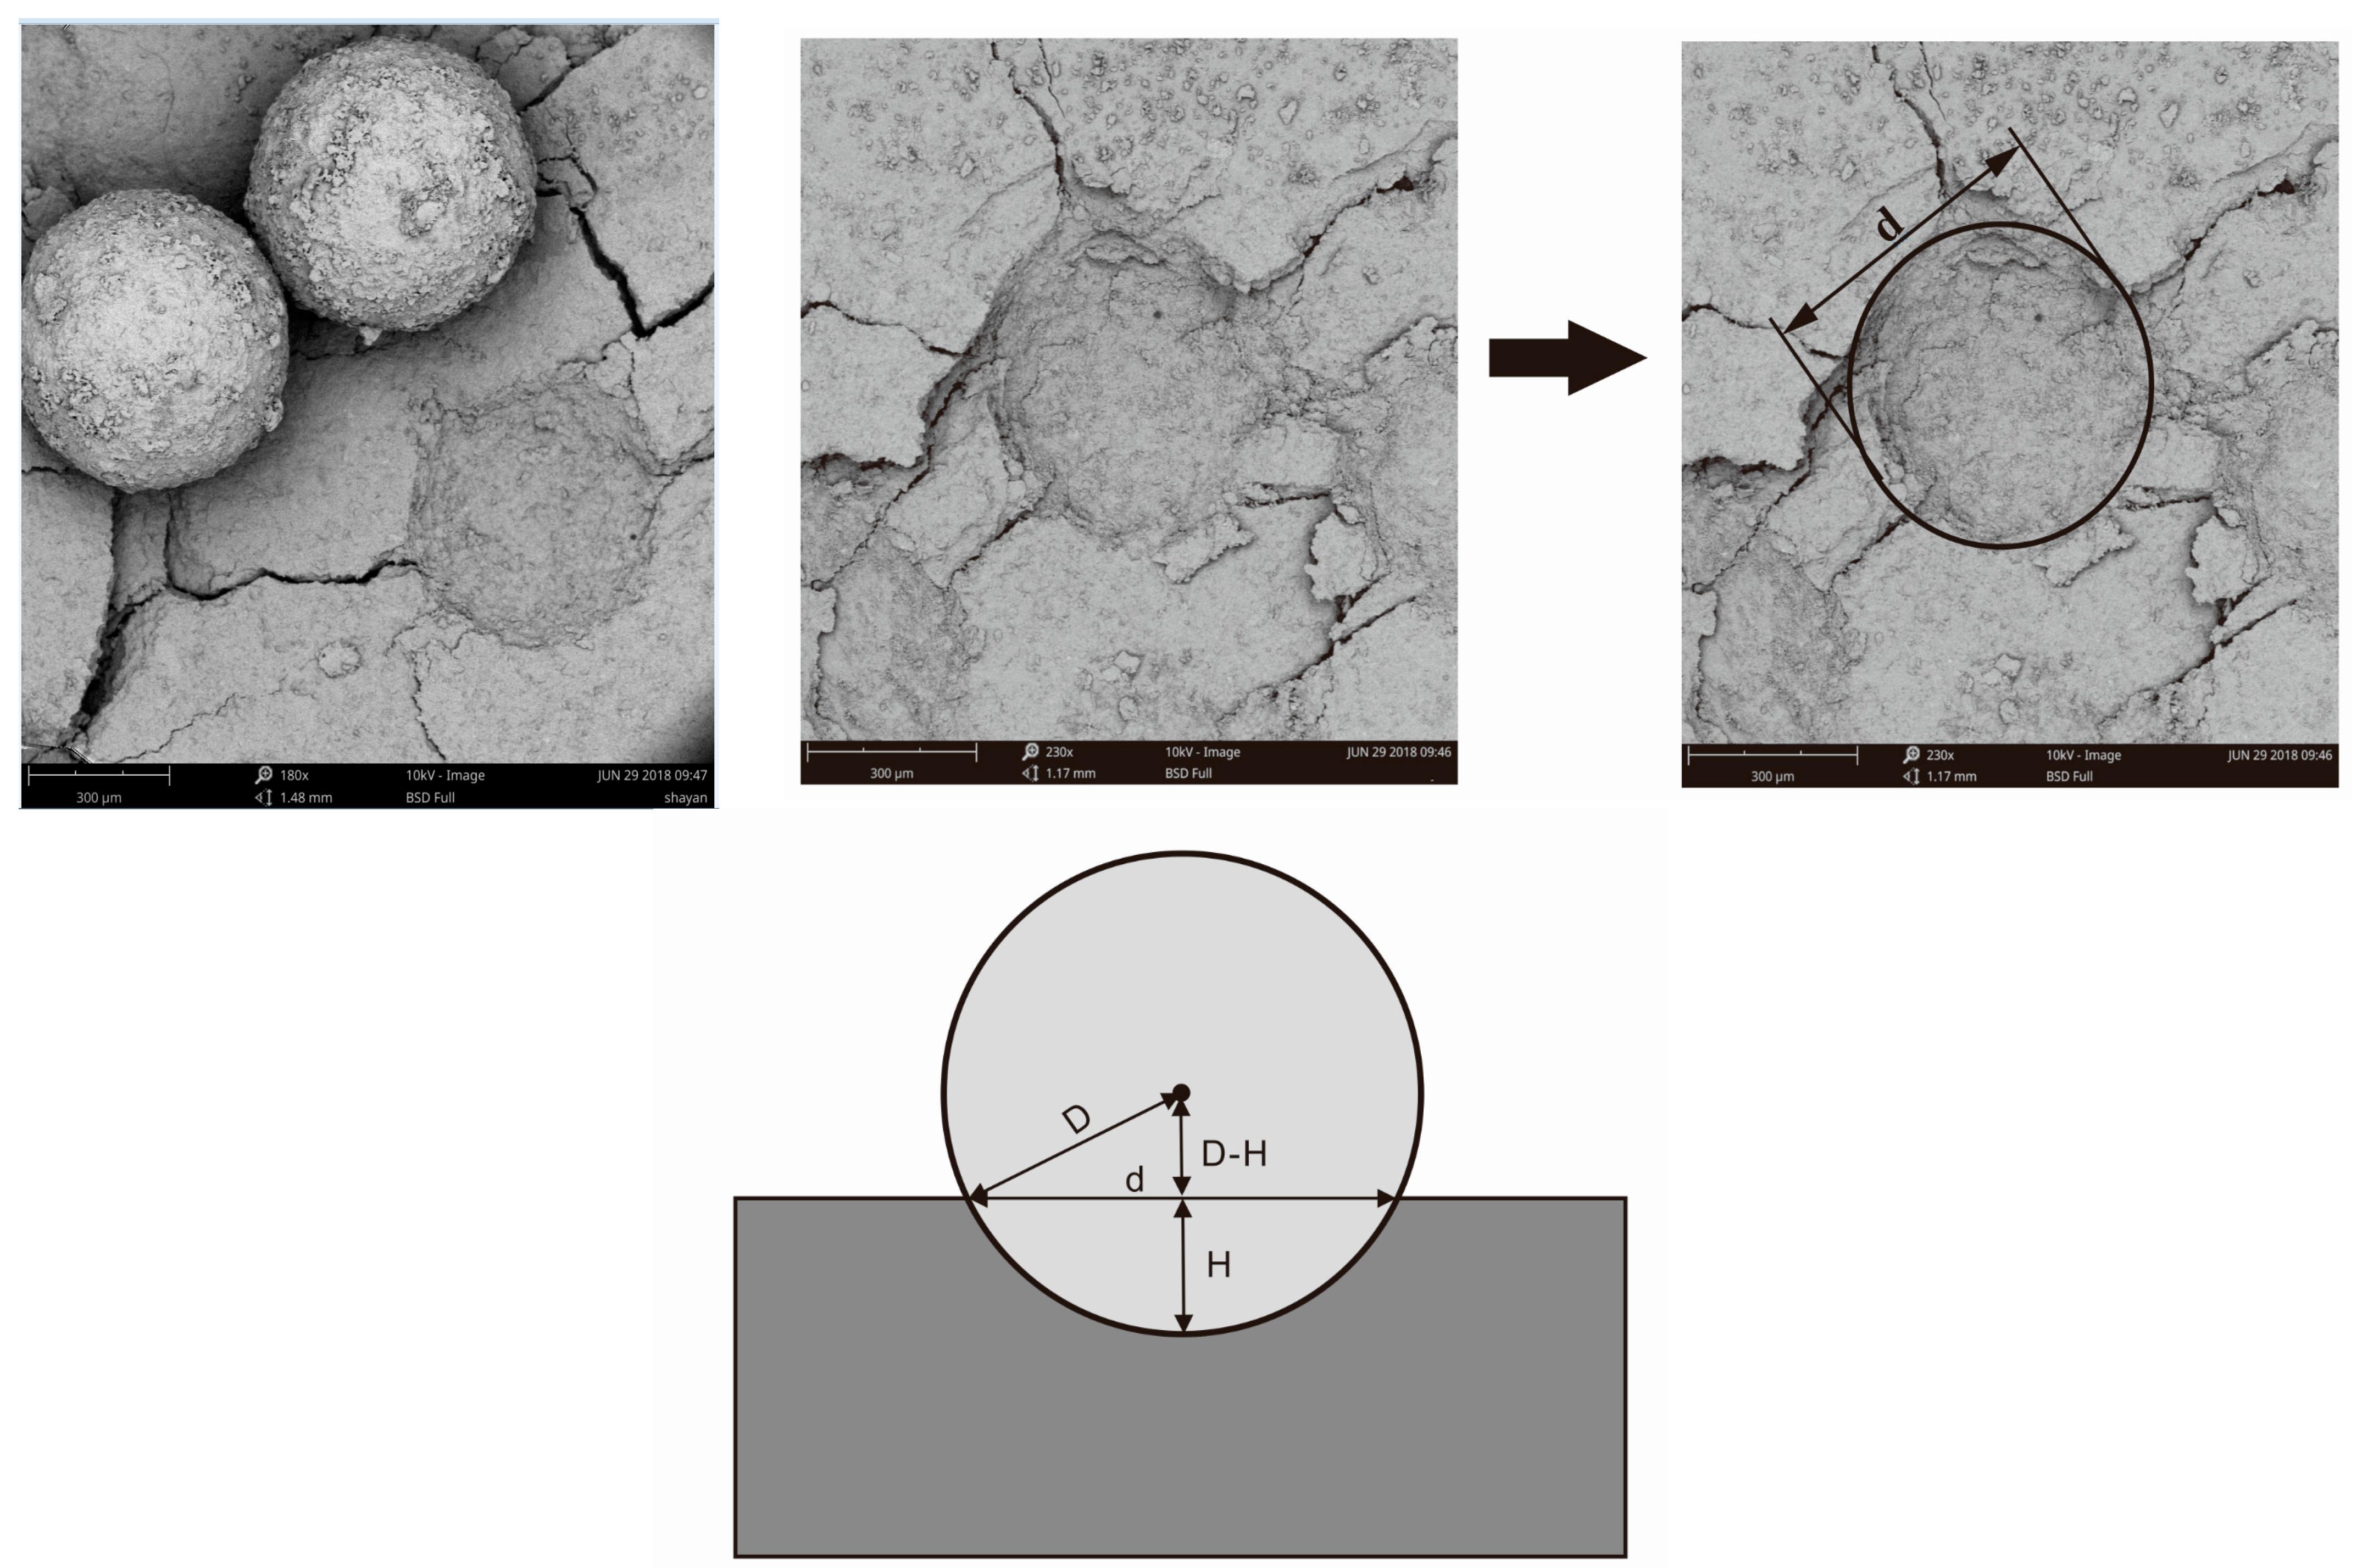
The influence of closing pressure can cause the proppant to embed in the fracture wall. The embedding degree is a measure of the support agent’s ability to embed into the fracture wall, which will reduce the width of supporting fractures, decrease the conductivity, and shorten the effective period of fracturing. A smaller embedding degree indicates a stronger fracture conductivity [14,23,60,61,62]. Therefore, it is necessary to research the embedding of proppants and provide a theoretical basis for selecting one. At present, the evaluation of proppant insertion is mainly based on experimental laboratory studies and theoretical calculation models. The embedding depth of the proppant is evaluated by means of scanning electron microscopy, and then the embedding degree of the proppant is evaluated, as shown in Figure 4.
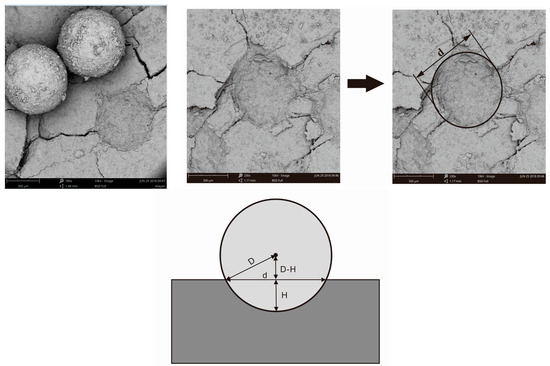
Figure 4.
Proppant insertion and calculation model diagram.
According to the diameter of the proppant embedding groove and the proppant radius, the following formula is shown:
where D is the average radius of the proppant sample, μm; d is the diameter of the proppant embedding groove, μm; H is the microcosmic embedding depth of the proppant, μm.
D2 = (d/2)2 + (D − H)2,
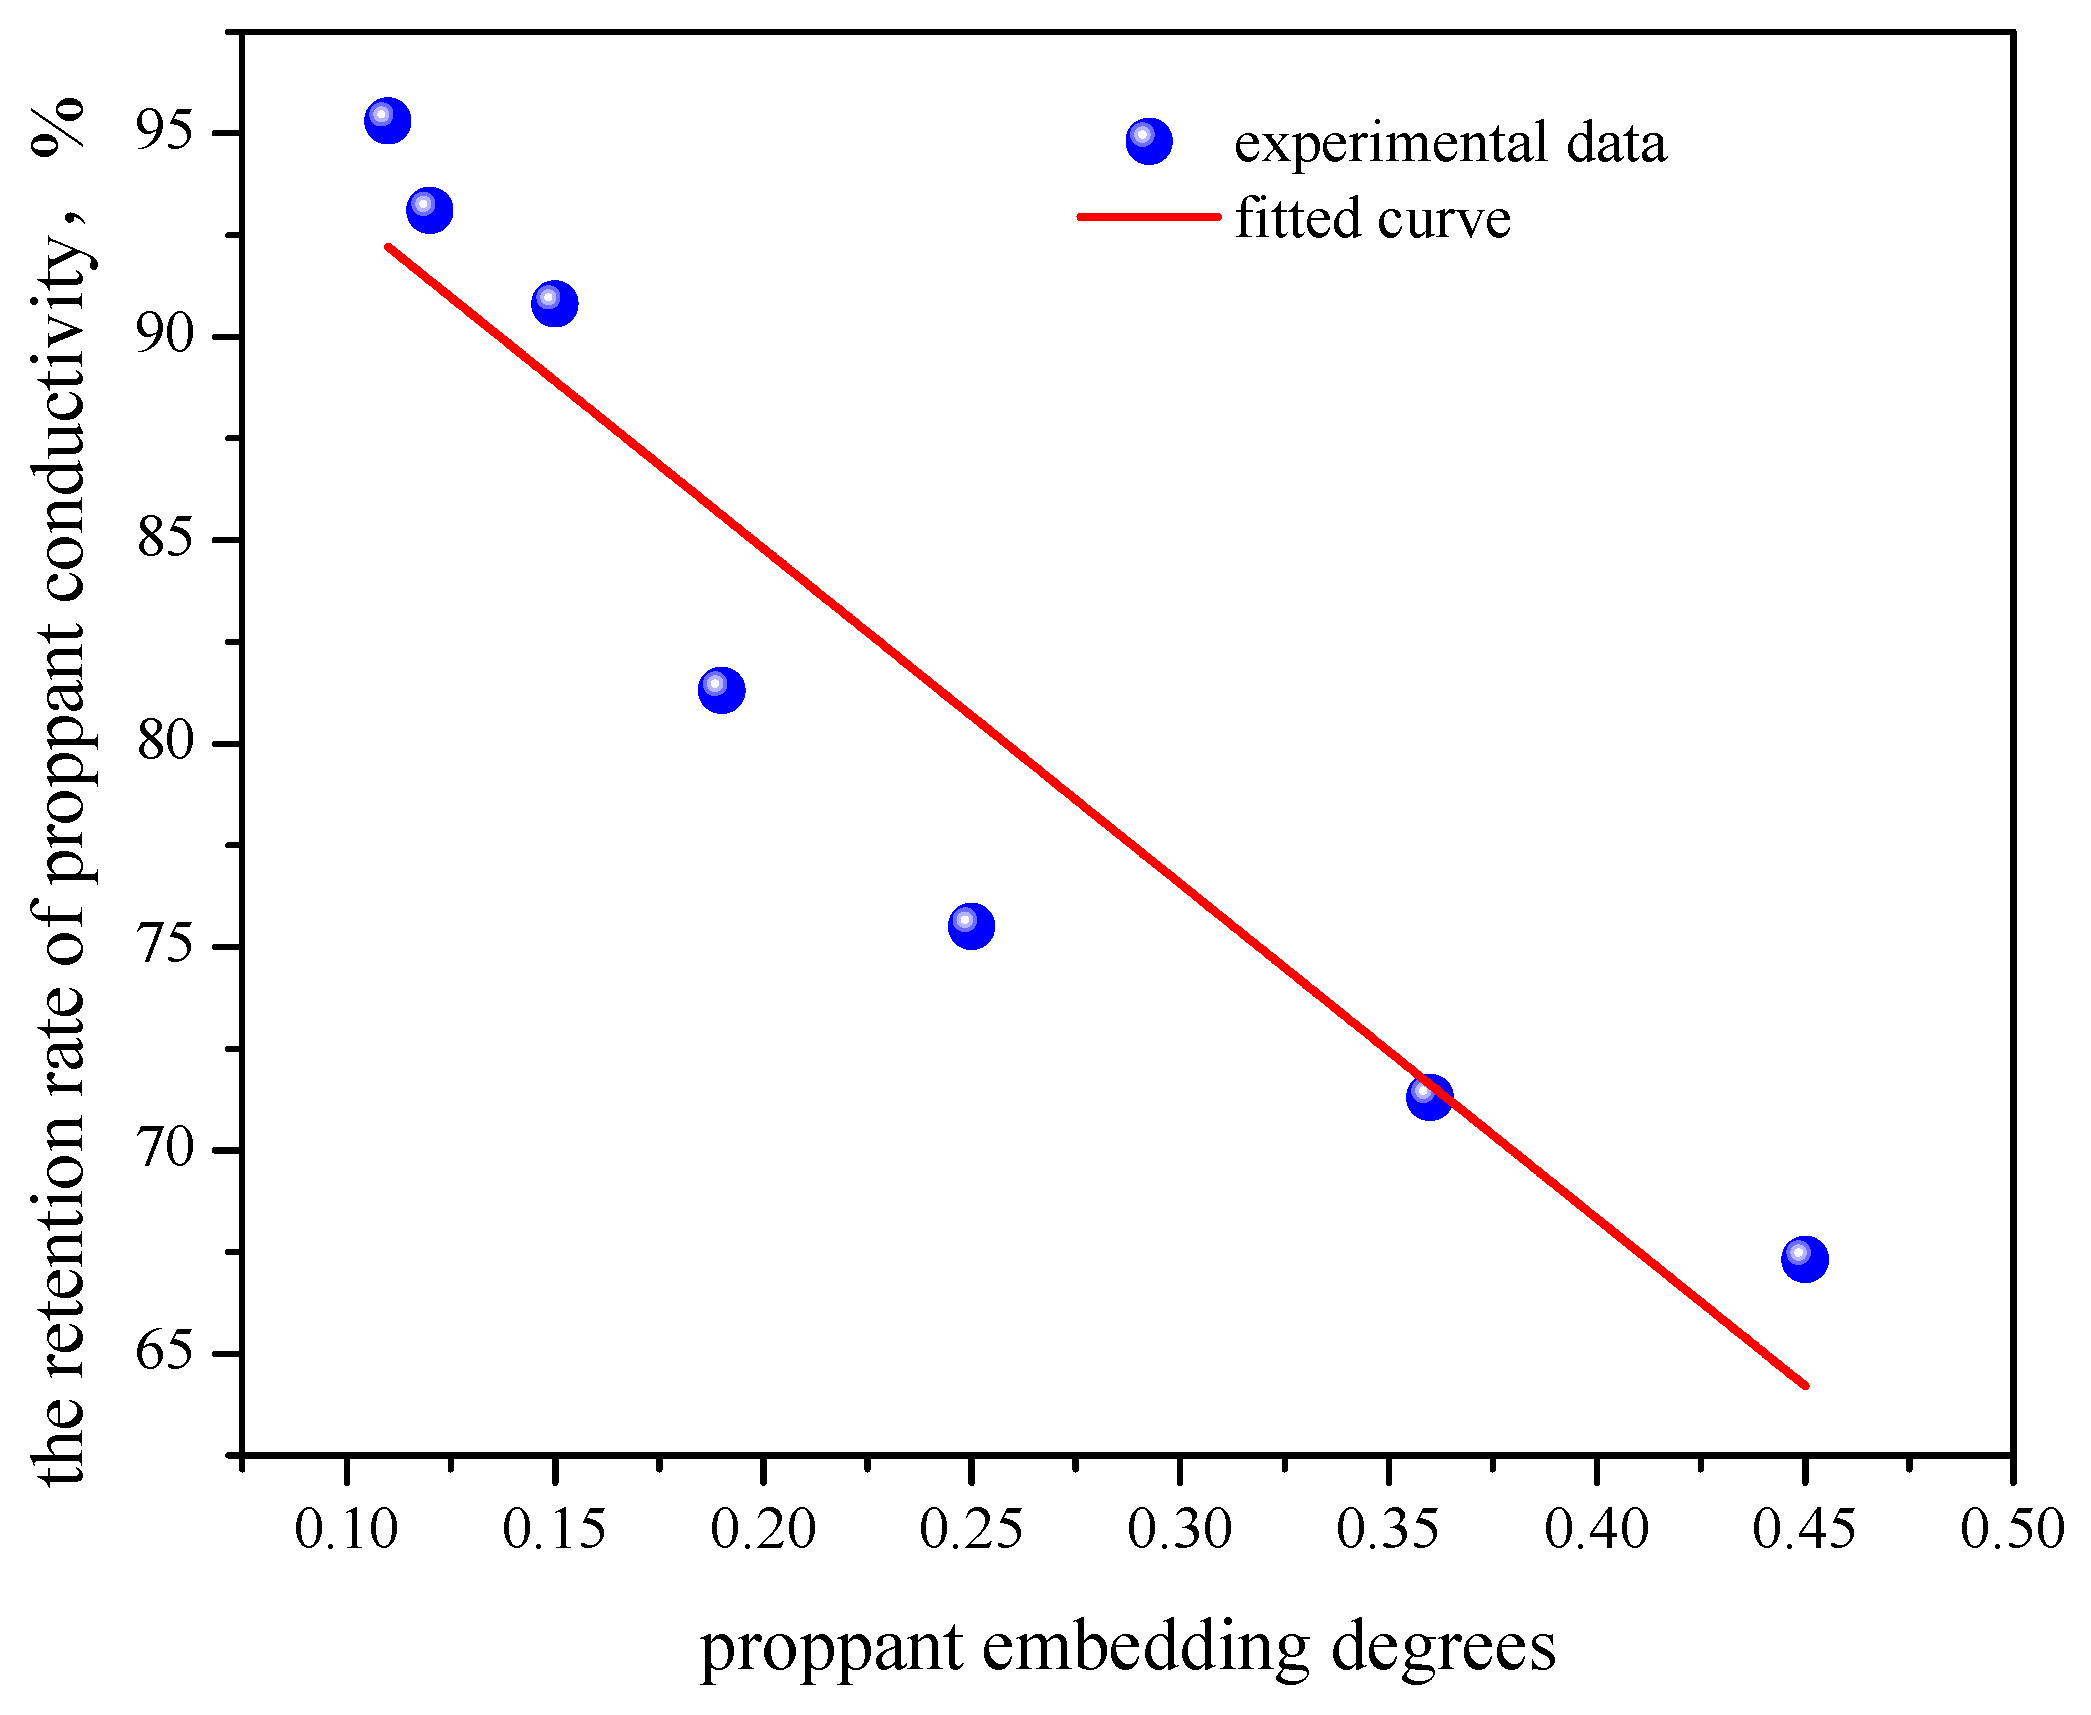
For evaluating the retention rate of proppant conductivity under different embedding degrees, the embedding degree is the ratio of the proppant embedment depth to the proppant particle radius. The conductivity experiment is carried out, and the concentration of the proppant is 2.5 kg/cm2, the size is 40/70 mesh, and the placement layer is 3, as shown in Figure 5.

Figure 5.
The retention rate of proppant conductivity under different embedding degrees (the experimental result is the average of three repeated experiments).
As can be seen from Figure 5, when the embedding degree of quartz sand proppant is 0.20~0.45, the retention rate of conductivity is low. When the embedding degree of quartz sand proppant is less than 0.15, the retention rate of conductivity is more than 90%. As a result, the embedding degree of quartz sand on shale gas fracturing should be less than 0.15. This is consistent with Margaret Benge’s research investigating proppant embedding [74].
3.6. Accumulation Coefficient
Due to the poor carrying capacity of slickwater during hydraulic fracturing operations, initially pumped quartz sand settles rapidly. This leads to the rapid settling of the initially pumped quartz sand at the bottom of the fractures near the wellbore, which gradually forms sand dams. This phenomenon affects the pumping rate. Subsequently, the quartz sand pumped in later stages is also influenced by the presence of sand dams, causing rapid settling and accumulation on the sand dams formed earlier. The varying degrees of accumulation result in different sand dam morphologies, directly impacting the subsequent transport of quartz sand. Consequently, it is necessary to design equipment and experimental methods that effectively evaluate the accumulation coefficient of quartz sand [45,50,51,52,53]. The experimental equipment used for the accumulation coefficient is shown in Figure 6.
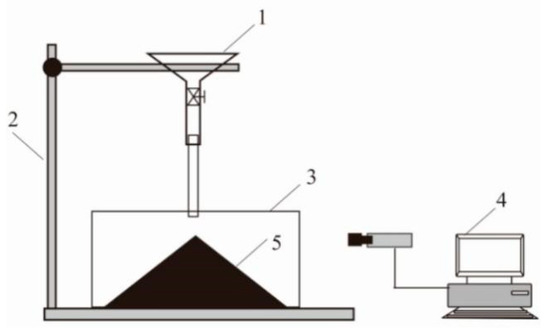
Figure 6.
The experimental evaluation equipment of quartz sand accumulation coefficient. (1) Proppant storage, (2) adjustable support, (3) visual fractures, (4) data collection and processing, and (5) sand embankment accumulated by proppant.
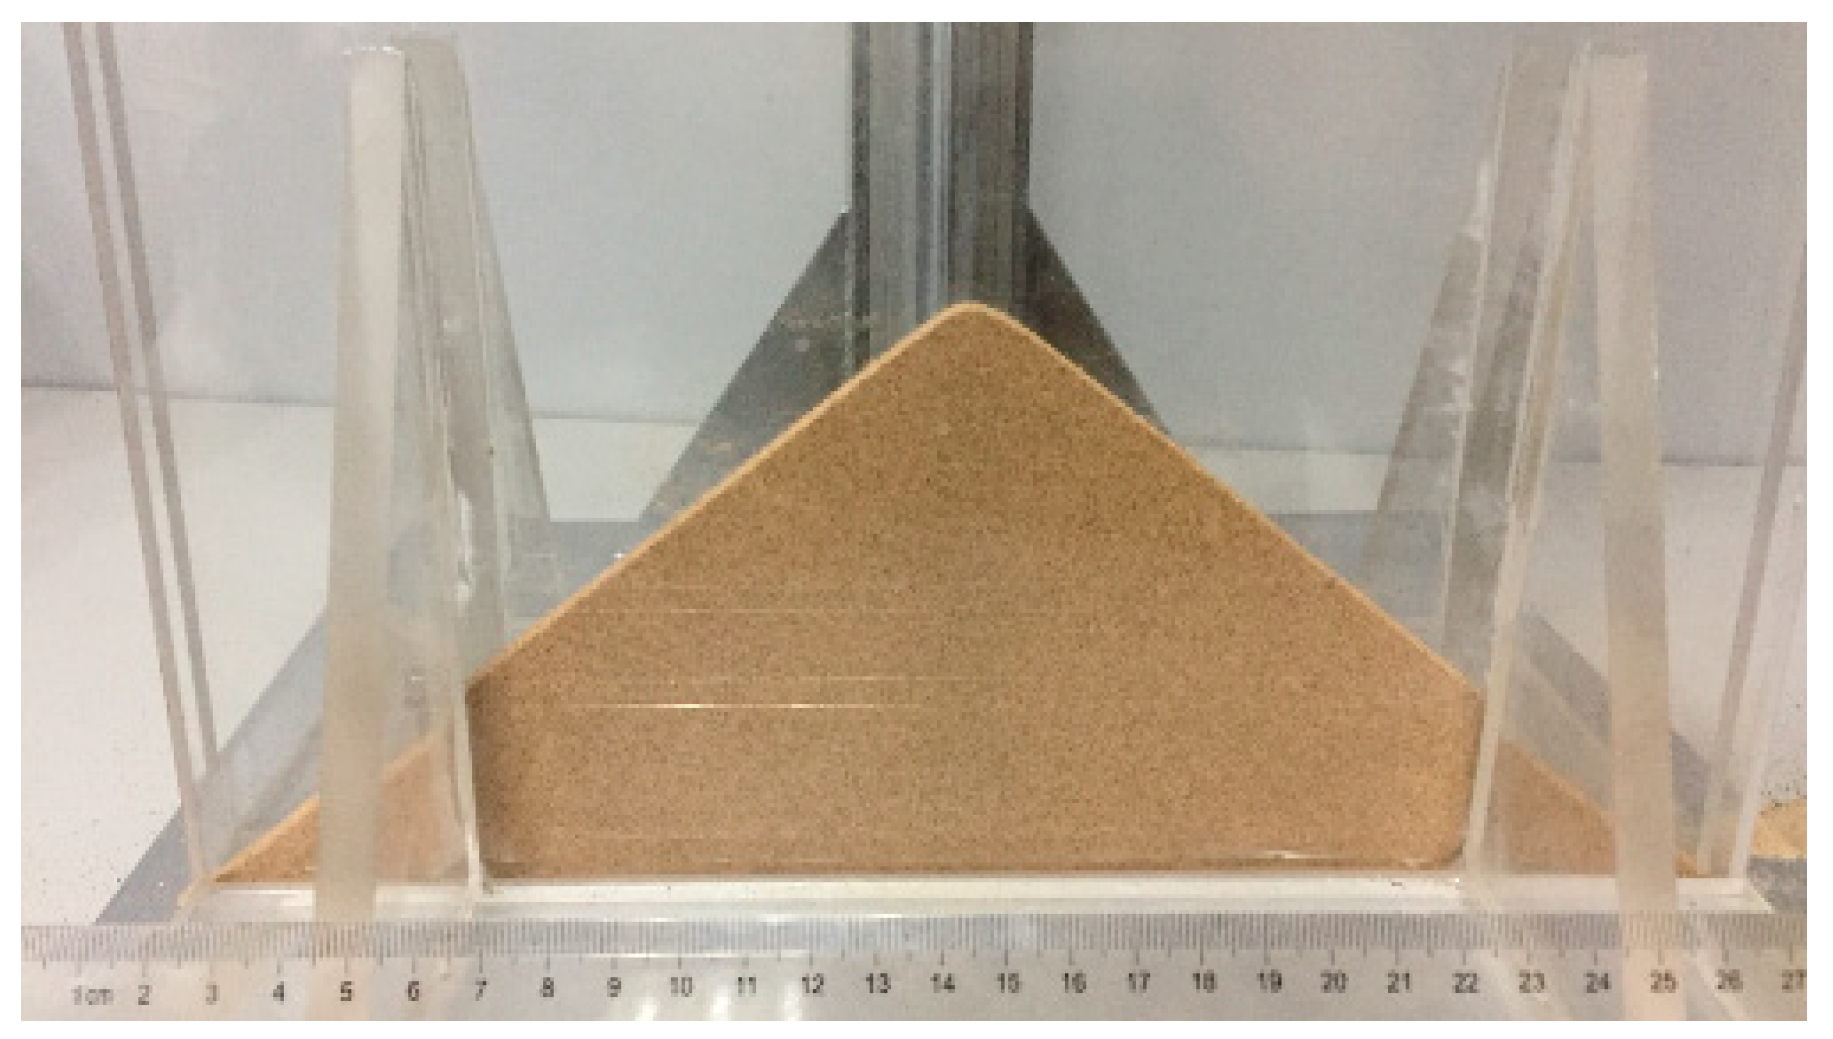
After adjusting and fixing the location of proppant storage, a certain volume of proppant is taken, and the bottom of the proppant storage is opened. The proppant moves down under the action of gravity, enters the visual fractures, and accumulates to form a sand embankment at the bottom of the visual fractures. According to the relationship between the final form of the sand embankment and the bottom of the visual fractures, the ratio of the height of the sand embankment to the half-width of the sand embankment (i.e., the tangent value of the angle between the final shape edge of the sand bank and the bottom of the visible crack) is used as the accumulation coefficient of quartz sand. The experimental results are shown in Figure 7 and Figure 8.

Figure 7.
The experimental result of accumulation coefficient.
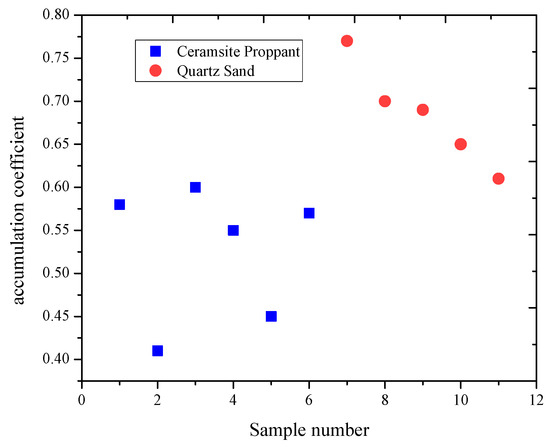
Figure 8.
The accumulation coefficient of different quartz sand samples (the experimental result is the average of three repeated experiments).
As can be seen from Figure 7 and Figure 8, based on the experimental result, the smaller the accumulation coefficient, the smaller the frictional effect between proppants, which is conducive to the migration of proppants towards the deep part of the fracture. As a consequence, the accumulation coefficient of quartz sand should be less than 0.8.
3.7. Friction Coefficient
During extensive proppant placement, the proppant injected in later stages tends to advance along the sand embankment, causing friction against the shale fracture wall. Eventually, the proppant on the sand embankment gradually moves forward [30,45]. When the proppant migrates to the far part of the fracture, the greater the friction between the proppant and shale fracture, the greater the difficulty of construction, which leads to a large amount of proppant accumulating near the well. If the friction between the proppant and shale fractures is less, the proppant is more conducive to the migration of the proppant to the far part of the fracture, and the construction difficulty is less so that the remote fracture can also form effective support, and, finally, the support fracture with high conductivity can be effectively formed in the deep fracture. The evaluation equipment used to determine the friction coefficient of the shale and proppant is shown in Figure 9.
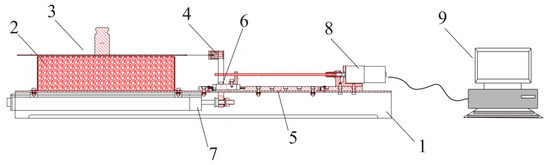
Figure 9.
The evaluation equipment on the friction coefficient of shale and proppant. (1) Base unit, (2) proppant storage unit, (3) shale sample, (4) sensor unit, (5) linear guide rail unit, (6) slide block unit, (7) displacement sensor unit, (8) synchronous motor unit, and (9) data acquisition part.
Enough proppant samples are placed in the proppant storage unit to ensure that the proppant sample is flush with the edge of the storage unit. The rock sample is selected to artificially split to form a fracture and weighed and recorded as m1. The rough surface of the shale rock sample is oriented towards the proppant surface. Based on the weight of the shale rock sample, the weight m is used to balance the shale rock sample so that m + m1 is a fixed value during the movement of all shale samples to ensure the same force on the proppant surface. The data acquisition unit and synchronous motor are opened, and the static friction force Fjm, dynamic friction force Fd, and motion speed Vp are recorded in the process of the synchronous motor driving the slider. The static friction coefficient μj = Fj/f, dynamic friction force Fd, and normal force f = (m + m1) g are used to calculate the static friction coefficient μj = Fj/f and dynamic friction coefficient μd = Fj/f between shale fractures and the proppant.
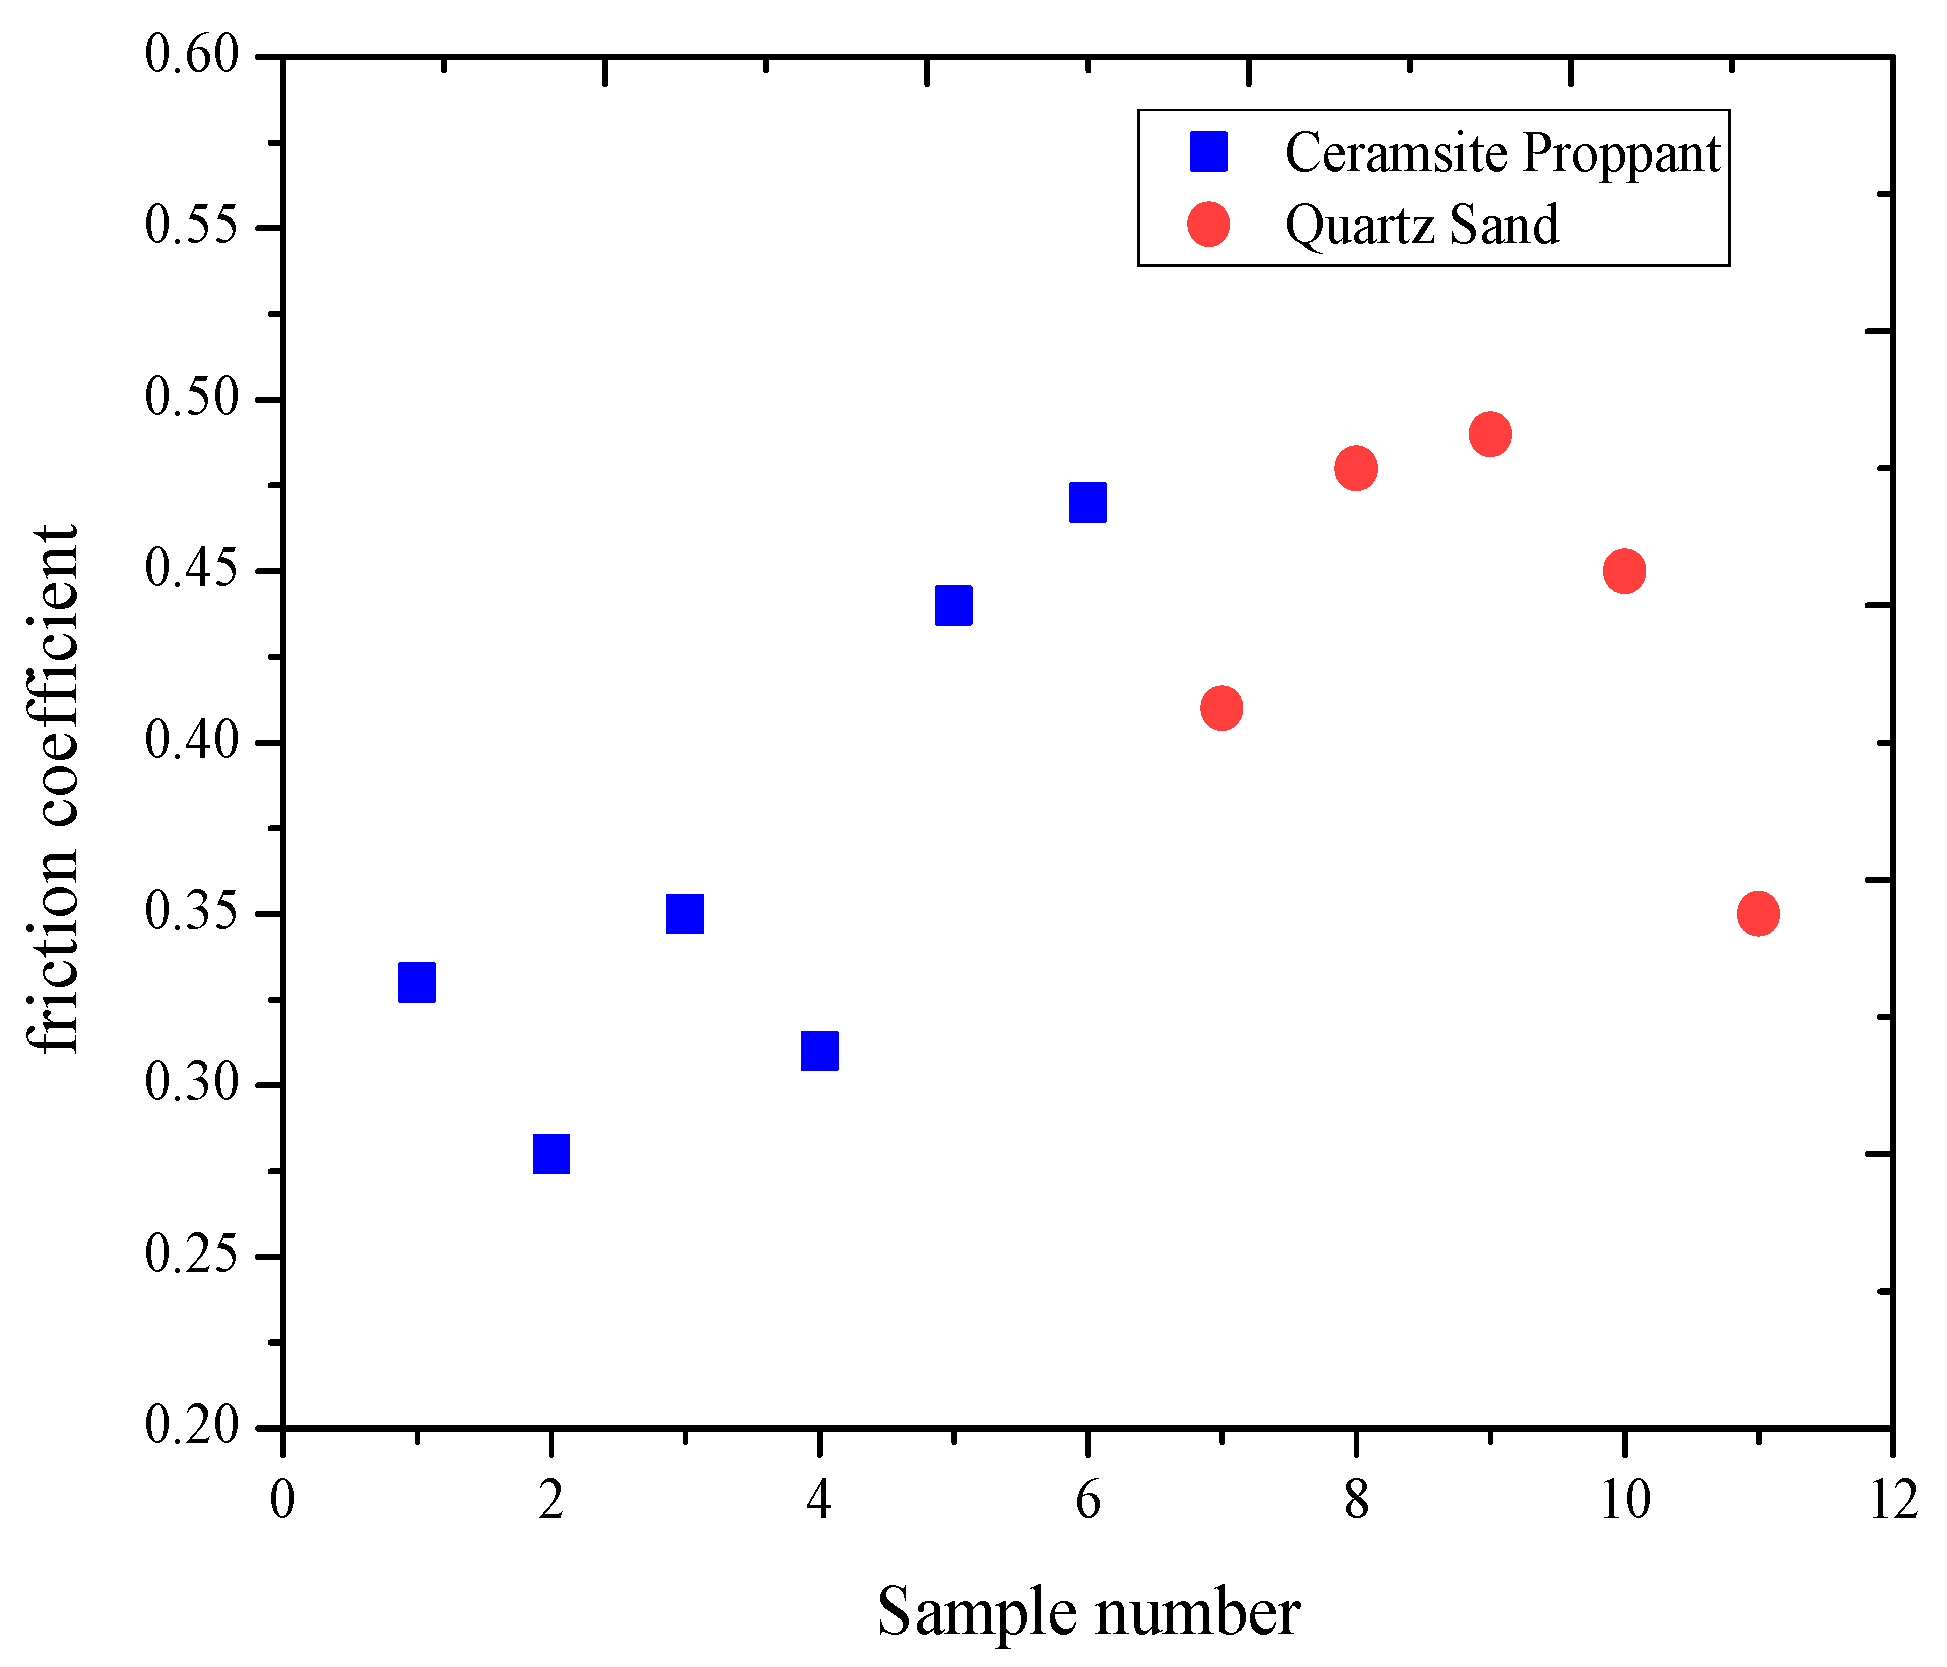
As can be seen from Figure 10, the experimental statistics show the friction characteristics between different proppants and the same fracture and between the same proppant and different fractures. The smaller the static friction coefficient and dynamic friction coefficient, the smaller the friction effect between shale fractures and proppant, and the more favorable the proppant migration to the deep fracture. Therefore, the friction coefficient of quartz sand should be less than 0.5.
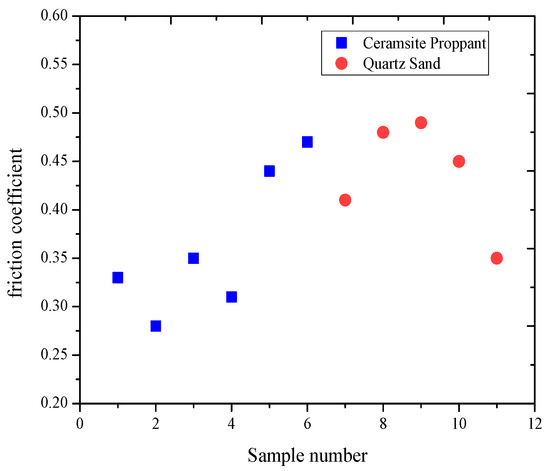
Figure 10.
The friction coefficient of different quartz sand samples (the experimental result is the average of three repeated experiments).
3.8. Application
To further verify the effect of quartz sand replacing ceramic particles, a field test of quartz sand replacing ceramic particles is carried out in a gas well named CNH26-X. The reservoir physical properties of well CNH26-X are shown in Table 3.
Table 3.
The reservoir physical properties of well CNH26-X.
According to simulating the influence of different proppants on production the whole well quartz sand is tested. The size combination of particles is 70/140 mesh and 40/70 mesh, simulating the influence of different proppant proportions on production. The test is designed according to 40/70 mesh quartz sand, accounting for 30% of the total sand content. The CNH26-X well is constructed with a displacement of 14 m3/min and a construction pressure between 60–75 MPa. The mode of continuous sand addition is adopted throughout the whole process. The main body sand concentration in the sand addition process is between 120–160 kg/m3 [19,20,21,48,64]. The smooth construction parameters of construction pressure are shown in Table 4.
Table 4.
The construction parameters of well CNH26-X.
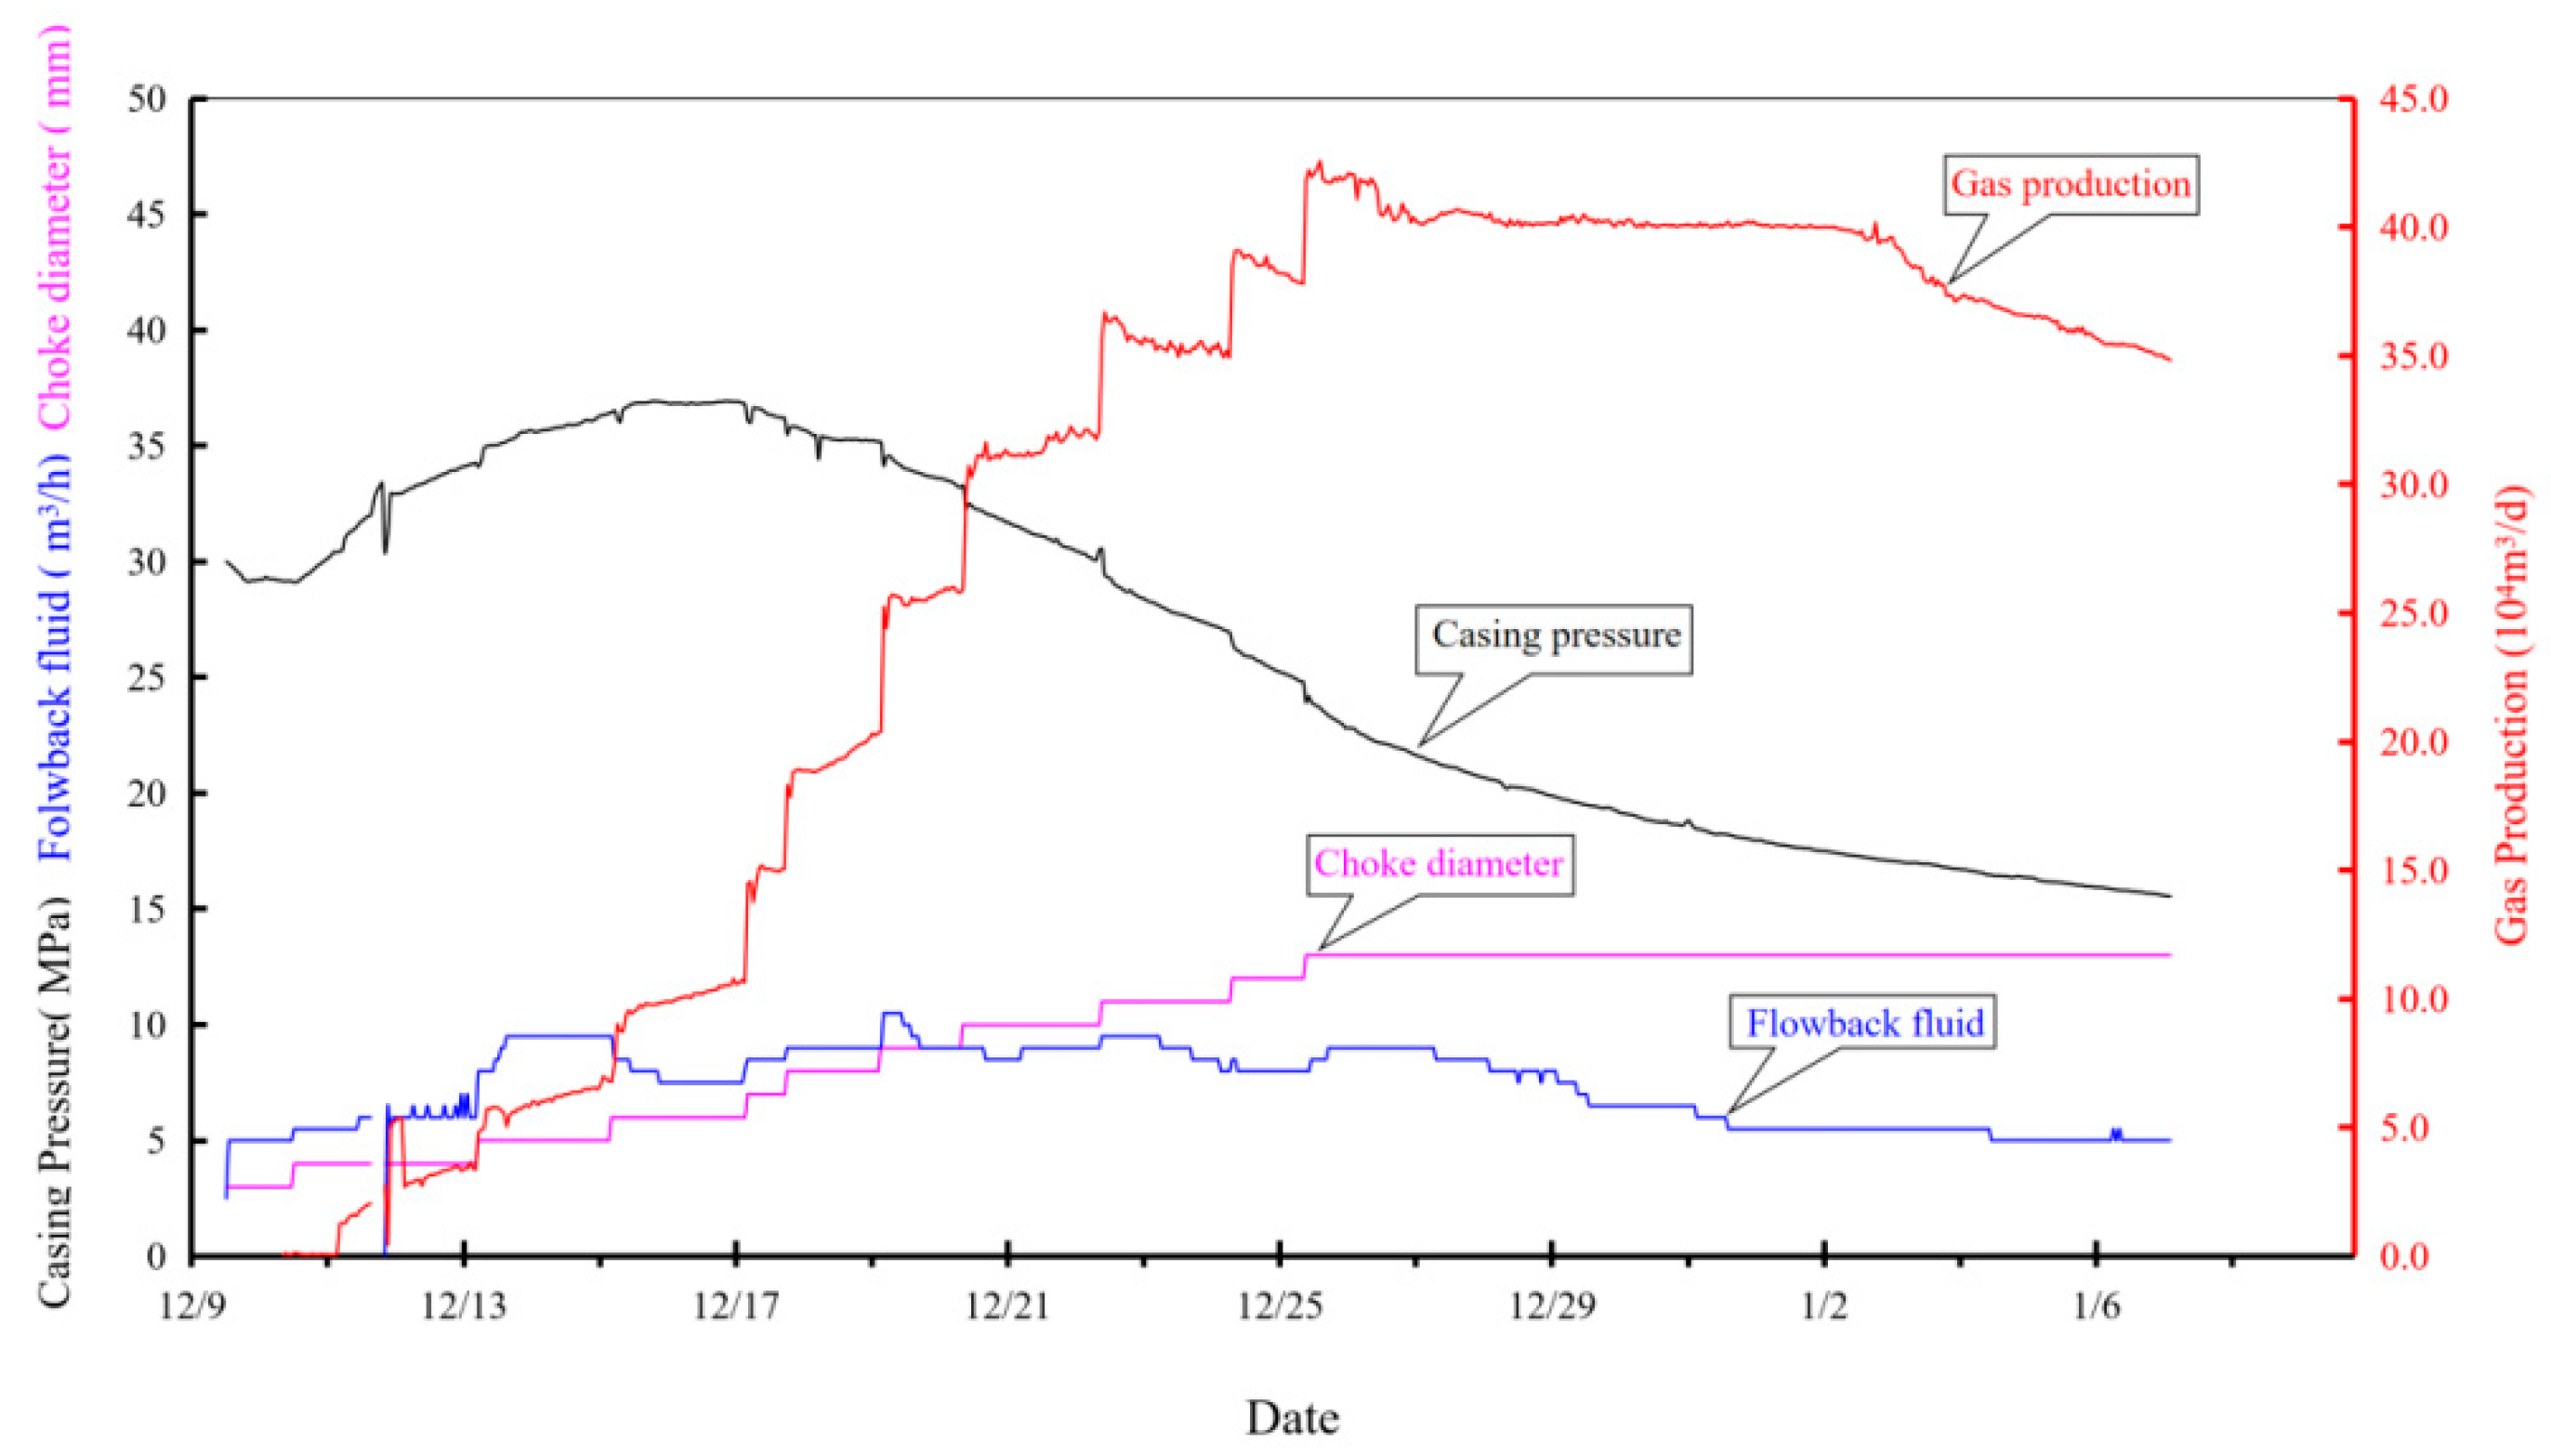
The pressure of the opening well is 30.0 MPa. After 29 days of drainage, a 13 mm oil nozzle is used to discharge the liquid; the pressure is 15.54 MPa, the flowback rate is 15.19%, and the test output is 40 × 104 m3/d, as shown in Figure 11. Field application shows that quartz sand is used instead of ceramic particles to meet the demand for post-press production.

Figure 11.
The production curve after the fracturing of well CNH26-X.
4. Conclusions
- (1)
- At present, there is no recognized industry standard for quartz sand for shale gas fracturing. Instead, the evaluation methods and performance requirements of quartz sand for shale gas fracturing mainly refer to the current national, oil and gas industry, and enterprise standards for sandstone reservoirs and thus cannot be fully applied to shale gas reservoirs.
- (2)
- Based on on-site production data, laboratory evaluation, and product statistical analysis, the performance indices suitable for shale gas fracturing proppants are finally determined. Quartz sand used for shale gas fracturing should be increased by five particle sizes, turbidity value should not be higher than 250 FTU, apparent density should not be higher than 2.75 g/cm3, breaking rate should not exceed 18%, and proppant embedding should be less than 0.15. The accumulation coefficient should be less than 0.8, and the friction coefficient should be less than 0.5.
- (3)
- The quartz sand in a single well in shale gas fracturing increased from 20–30% to more than 60–70%. Relevant research results can provide assurance and support for the early laboratory selection and on-site quality control of quartz sand used in shale gas fracturing, which is of great significance to promote the localization of quartz sand sources and reduce the investment cost of fracturing.
Author Contributions
Methodology, F.L.; Formal analysis, H.P. (Hanxi Peng); Investigation, P.S.; Data curation, X.Z.; Writing—original draft, H.P. (Huan Peng), J.S., W.C. and G.C.; Writing—review & editing, J.Y., F.N. and Z.L. All authors have read and agreed to the published version of the manuscript.
Funding
This research received no external funding or This research was funded by Southwest Oil and Gas Field Company, Petrochina grant number No. 20210302-05, No. 20210305-22, No. 20220310-02, No. 20230312-01, and No. 20230302-11. And The APC was funded by Southwest Petroleum University.
Data Availability Statement
The original contributions presented in this study are included in the article. Further inquiries can be directed to the corresponding author.
Conflicts of Interest
Authors Huan Peng, Jian Yang and Fei Liu were employed by the company PetroChina. Author Xiaofang Zhang was employed by the company Sichuan Shale Gas Exploration and Development Co., Ltd. The remaining authors declare that the research was conducted in the absence of any commercial or financial relationships that could be construed as a potential conflict of interest.
References
- Montgomery, C.T.; Smith, M.B. Hydraulic Fracturing: History of an Enduring Technology. J. Pet. Technol. 2010, 62, 26–40. [Google Scholar] [CrossRef]
- Figueiredo, B.; Tsang, C.F.; Rutqvist, J.; Niemi, A. Study of hydraulic fracturing processes in shale formations with complex geological settings. J. Pet. Sci. Eng. 2018, 152, 361–374. [Google Scholar] [CrossRef]
- Wang, Y.; Li, X.; Zhang, Y.X.; Wu, Y.S.; Zheng, B. Gas shale hydraulic fracturing: A numerical investigation of the fracturing network evolution in the Silurian Longmaxi formation in the southeast of Sichuan Basin, China, using a coupled FSD approach. Environ. Earth Sci. 2016, 75, 1093. [Google Scholar] [CrossRef]
- Li, Q.; Li, Q.; Cao, H.; Wu, J.; Wang, F.; Wang, Y. The Crack Propagation Behaviour of CO2 Fracturing Fluid in Unconventional Low Permeability Reservoirs: Factor Analysis and Mechanism Revelation. Processes 2025, 13, 159. [Google Scholar] [CrossRef]
- Li, Q.; Li, Q.; Wu, J.; Li, X.; Li, H.; Cheng, Y. Wellhead Stability During Development Process of Hydrate Reservoir in the Northern South China Sea: Evolution and Mechanism. Processes 2025, 13, 40. [Google Scholar] [CrossRef]
- Gao, Y.; Wang, D.; Chen, Z.; Li, Y.; Shen, S.; Li, D.; Liang, X.; Huang, Z. Numerical Simulation of Seepage in Shale Oil Reservoirs Under Hydraulic Fracturing: From Core-Scale Experiment to Reservoir-Scale Modeling. Energies 2024, 17, 5636. [Google Scholar] [CrossRef]
- Gao, Y.; Wang, X.; Jiang, H.; Ding, S. Numerically Coupled Thermo-Hydro-Mechanical Analyses of Ultra-Heavy Oil Reservoirs during the Micro-Fracturing Stage. Energies 2022, 15, 3677. [Google Scholar] [CrossRef]
- Fan, Y.; Peng, H.; Chen, G.; Peng, J.; Han, H.; Qin, Y.; Wang, L.; Liu, D. Experimental study of the influences of different factors on the acid-rock reaction rate of carbonate rocks. J. Energy Storage 2023, 63, 107064. [Google Scholar] [CrossRef]
- Peng, Y.; Li, Y.; Zhao, J. A Novel Approach to Simulate the Stress and Displacement Fields Induced by Hydraulic Fractures under Arbitrarily Distributed Inner Pressure. J. Nat. Gas Sci. Eng. 2016, 35, 1079–1087. [Google Scholar] [CrossRef]
- Zhao, J.; Peng, Y.; Li, Y.; Xiao, W. Analytical Model for Simulating and Analyzing the Influence of Interfacial Slip on Fracture Height Propagation in Shale Gas Layers. Environ. Earth Sci. 2015, 73, 5867–5875. [Google Scholar] [CrossRef]
- Patel, S.; Wilson, I.; Sreenivasan, H.; Naveen, P.; Gupta, P.; Krishna, S. Proppant transportation and placement in fractures by water and liquid nitrogen: A numerical simulation. Comput. Part. Mech. 2024, 11, 721–743. [Google Scholar] [CrossRef]
- Yang, M.; Economides, M.J. Natural Proppants for Hydraulic Fracture Production Optimization in Eagle Ford Shale. In Proceedings of the SPE Western Regional Meeting, Bakersfield, CA, USA, 23 March 2012. [Google Scholar] [CrossRef]
- Roostaei, M.; Nouri, A.; Fattahpour, V.; Chan, D. Numerical simulation of proppant transport in hydraulic fractures. J. Pet. Sci. Eng. 2018, 163, 119–138. [Google Scholar] [CrossRef]
- Li, H.; Wang, K.; Xie, J.; Li, Y.; Zhu, S. A new mathematical model to calculate sand-packed fracture conductivity. J. Nat. Gas Sci. Eng. 2016, 35, 567–582. [Google Scholar] [CrossRef]
- Jiang, C.; Jia, L.; Zhang, B.; He, Y.; Kirumba, G. Comparison of quartz sand, anthracite, shale and biological ceramsite for adsorptive removal of phosphorus from aqueous solution. J. Environ. Sci. (China) 2014, 26, 466–477. [Google Scholar] [CrossRef]
- Denis, P.; Radoslav, K. Investigation of the characteristics of an oil jet pump when using a group ground drive. J. Eng. Res. 2023, 11, 100004. [Google Scholar] [CrossRef]
- Yang, M.; Economides, M.J.; Wei, C.; Gao, C. Hydraulic Fracture Design Flaws-Proppant Selection. In Proceedings of the SPE Annual Technical Conference and Exhibition, New Orleans, LA, USA, 30 September–2 October 2013. [Google Scholar] [CrossRef]
- Mack, M.G.; Coker, C.E. Proppant Selection for Shale Reservoirs: Optimizing Conductivity, Proppant Transport and Cost. In Proceedings of the Unconventional Resources Conference—Canada, Calgary, AB, Canada, 5–7 November 2013. [Google Scholar]
- Hu, K.; Sun, J.; Wong, J.; Hall, B.E. Proppants Selection Based on Field Case Studies of Well Production Performance in the Bakken Shale Play. In Proceedings of the SPE Western North American and Rocky Mountain Joint Meeting, Denver, CO, USA, 16–18 April 2014. [Google Scholar] [CrossRef]
- Feng, L.; Mohammed, S.; Al-Muntasheri, G.A.; Chang, F.F. A comprehensive review on proppant technologies. Petroleum 2016, 2, 26–39. [Google Scholar] [CrossRef]
- Patel, P.S.; Robart, C.J.; Ruegamer, M.; Yang, A. Analysis of US Hydraulic Fracturing Fluid System and Proppant Trends. In Proceedings of the SPE Hydraulic Fracturing Technology Conference, The Woodlands, TX, USA, 3–5 February 2014. [Google Scholar] [CrossRef]
- Li, H.; Huang, B.; Zhao, X.; Wu, Z.; Jiao, X.; Han, X.; Sun, Z. Effects of fluid and proppant properties on proppant transport and distribution in horizontal hydraulic fractures of coal under true-triaxial stresses. J. Nat. Gas Sci. Eng. 2022, 108, 104795. [Google Scholar] [CrossRef]
- Bolintineanu, D.S.; Rao, R.R.; Lechman, J.B.; Romero, J.A.; Jove-Colon, C.F.; Quintana, E.C.; Bauer, S.J.; Ingraham, M.D. Simulations of the effects of proppant placement on the conductivity and mechanical stability of hydraulic fractures. Int. J. Rock Mech. Min. Sci. 2017, 100, 188–198. [Google Scholar] [CrossRef]
- Shamsi, M.M.M.; Nia, S.F.; Jessen, K. Dynamic conductivity of proppant-filled fractures. J. Pet. Sci. Eng. 2016, 151, 183–193. [Google Scholar] [CrossRef]
- Peng, Y.; Zhao, J.; Sepehrnoori, K.; Li, Y.; Li, Z. The Influences of Stress Level, Temperature, and Water Content on the Fitted Fractional Orders of Geomaterials. Mech. Time-Depend. Mater. 2020, 24, 221–232. [Google Scholar] [CrossRef]
- Maley, D.; Boyer, J.; O’neil, B.; Zhang, K. Surface modification of proppant to improve transport and placement. In Proceedings of the International Petroleum Technology Conference, Kuala Lumpur, Malaysia, 10–12 December 2014; OnePetro: Richardson, TX, USA, 2014. [Google Scholar]
- Han, J.; Pirogov, A.; Li, C.; Hurt, R.; Sookprasong, A.; Kim, J.M. Maximizing Productivity with Ultra-Lightweight Proppant in Unconventional Wells: Simulations and Field Cases. In Proceedings of the SPE Asia Pacific Hydraulic Fracturing Conference, Beijing, China, 24–26 August 2016. [Google Scholar]
- Hu, K.; Schmidt, A.; Barhaug, J.; Wong, J.; Tian, J.; Hall, B.E. Sand, Resin-Coated Sand or Ceramic Proppant? The Effect of Different Proppants on the Long-Term Production of Bakken Shale Wells. In Proceedings of the SPE Annual Technical Conference and Exhibition, Houston, TX, USA, 28–30 September 2015. [Google Scholar] [CrossRef]
- Ramlan, A.S.; Zin, R.M.; Bakar, N.F.A.; Othman, N.H. Recent progress on proppant laboratory testing method: Characterisation, conductivity, transportation, and erosivity. J. Pet. Sci. Eng. 2021, 205, 108871. [Google Scholar] [CrossRef]
- Paterniti, M.; Kundert, D.; Ramurthy, M.; Craig, D. Production Review of Current Stimulation Techniques in the Jonah Field. In Proceedings of the SPE Hydraulic Fracturing Technology Conference, The Woodlands, TX, USA, 3–5 February 2013. [Google Scholar]
- Fan, J.; Bailey, T.P.; Sun, Z.; Zhao, P.; Uher, C.; Yuan, F.; Zhao, M. Preparation and properties of ultra-low density proppants for use in hydraulic fracturing. J. Pet. Sci. Eng. 2017, 163, 100–109. [Google Scholar] [CrossRef]
- Li, H.; Lu, Y.; Zhou, L.; Han, S.; Gou, Y. A new constitutive model for calculating the loading-path dependent proppant deformation and damage analysis of fracture conductivity. J. Nat. Gas Sci. Eng. 2017, 46, 365–374. [Google Scholar] [CrossRef]
- Tasqué, J.E.; Vega, I.N.; Marco, S.; Raffo, P.A.; D’Accorso, N.B. Ultra-light weight proppant: Synthesis, characterization, and performance of new proppants. J. Nat. Gas Sci. Eng. 2021, 85, 103717. [Google Scholar] [CrossRef]
- Peng, H.; Fan, Y.; Peng, J.; Gao, X.; Gou, X.; Yin, Y. Experimental Evaluation and Application of New Size Proppant for Unconventional Reservoir Fracturing. Fresenius Environ. Bull. 2022, 31, 2898–2907. [Google Scholar]
- Deng, S.; Li, H.; Ma, G.; Huang, H.; Li, X. Simulation of shale–proppant interaction in hydraulic fracturing by the discrete element method. International J. Rock Mech. Min. Sci. 2014, 70, 219–228. [Google Scholar] [CrossRef]
- Peng, Y.; Zhao, J.; Sepehrnoori, K.; Li, Z. Fractional model for simulating the viscoelastic behavior of artificial fracture in shale gas. Eng. Fract. Mech. 2020, 228, 106892. [Google Scholar] [CrossRef]
- Peng, H.; Fan, Y.; Peng, J.; Han, H.; Gao, X.; Wang, L.; Gou, X.; Yin, Y.; Zhou, Y. Research and Application of a Proppant Transport Experimental Device for Complex Fractures in the Unconventional Reservoir. Geofluids 2022, 2022, 8356470. [Google Scholar] [CrossRef]
- Peng, H.; Li, W.; Liu, J.; Peng, J.; Han, H.; Liu, J.; Liu, D.; Yang, Z. Experimental Study for the Effects of Different Factors on the Sand-Carrying Capacity of Slickwater. Geofluids 2023, 2023, 7897165. [Google Scholar] [CrossRef]
- Peng, Y.; Zhao, J.; Sepehrnoori, K.; Li, Z.; Feng, X. Study of Delayed Creep Fracture Initiation and Propagation Based on Semi-analytical Fractional Model. Appl. Math. Model. 2019, 72, 700–715. [Google Scholar] [CrossRef]
- Yao, S.; Chang, C.; Hai, K. A review of experimental studies on the proppant settling in hydraulic fractures. J. Pet. Sci. Eng. 2022, 208, 109211. [Google Scholar] [CrossRef]
- Rivas, E.; Gracie, R. A Monolithic Coupled Hydraulic Fracture Model with Proppant Transport. Comput. Methods Appl. Mech. Eng. 2020, 372, 113361. [Google Scholar] [CrossRef]
- Yatin, S.; Islam, S.Z.; Hossain, M. Effect of Fracture Roughness on the Hydrodynamics of Proppant Transport in Hydraulic Fractures. J. Nat. Gas Sci. Eng. 2020, 80, 103401. [Google Scholar]
- Sahai, R.; Moghanloo, R.G. Proppant Transport in Complex Fracture Networks—A Review. J. Pet. Sci. Eng. 2019, 182, 106199. [Google Scholar] [CrossRef]
- Bello, A.; Ozoani, J.; Kuriashov, D. Proppant Transport in Hydraulic Fractures by Creating a Capillary Suspension. J. Pet. Sci. Eng. 2022, 208, 109508. [Google Scholar] [CrossRef]
- Aslannezhad, M.; Kalantariasl, A.; You, Z.; Iglauer, S.; Keshavarz, A. Micro-proppant placement in hydraulic and natural fracture stimulation in unconventional reservoirs: A review. Energy Rep. 2021, 7, 8997–9022. [Google Scholar] [CrossRef]
- Ahmad, F.A.; Miskimins, J.L. Proppant Transport and Behavior in Horizontal Wellbores Using Low Viscosity Fluids. In Proceedings of the SPE Hydraulic Fracturing Technology Conference and Exhibition, The Woodlands, TX, USA, 5–7 February 2019. [Google Scholar] [CrossRef]
- Yu, J.; Wang, J.; Li, Y.; El-Fayoumi, A.; Wu, R.; Liu, X.; Rijken, P.; Rathbun, A.P.; Elsworth, D. Permeability—Friction Relationships for Propped Fractures in Shale. Rock Mech. Rock Eng. 2023, 56, 9085–9098. [Google Scholar] [CrossRef]
- Zhao, J.; Peng, Y.; Li, Y.; Tian, Z. Applicable Conditions and Analytical Corrections of Plane Strain Assumption in the Simulation of Hydraulic Fracturing. Pet. Explor. Dev. 2017, 44, 454–461. [Google Scholar] [CrossRef]
- Feng, Y.C.; Ma, C.Y.; Deng, J.G.; Li, X.; Chu, M.; Hui, C.; Luo, Y. A comprehensive review of ultralow-weight proppant technology. Pet. Sci. 2021, 18, 807–826. [Google Scholar] [CrossRef]
- Isah, A.; Hiba, M.; Al-Azani, K.; Aljawad, M.S.; Mahmoud, M. A Comprehensive Review of Proppant Transport in Fractured Reservoirs: Experimental, Numerical, and Field Aspects. J. Nat. Gas Sci. Eng. 2021, 88, 103832. [Google Scholar] [CrossRef]
- Herskovits, R.; Fuss-Dezelic, T.; Shi, J.; Wilcox, C.; Todd, K. Sand and Ceramic Proppant Performance in Thin Layer/Monolayer Conditions Subjected to Cyclic Stress. In Proceedings of the SPE Eastern Regional Meeting, Canton, OH, USA, 13–15 September 2016. [Google Scholar] [CrossRef]
- Melcher, H.; Mayerhofer, M.; Agarwal, K.; Lolon, E.; Oduba, O.; Murphy, J.; Ellis, R.; Fiscus, K.; Shelley, R.; Weijers, L. Shale Frac Designs Move to Just-Good-Enough Proppant Economics. In Proceedings of the SPE Hydraulic Fracturing Technology Conference and Exhibition, The Woodlands, TX, USA, 4–6 February 2020. [Google Scholar] [CrossRef]
- Liao, Z.; Li, X.; Ge, L.; Yang, Z.; Zhu, J.; Xue, Q.; Wang, H. Lightweight proppants in unconventional oil and natural gas development: A review. Sustain. Mater. Technol. 2022, 33, e00484. [Google Scholar] [CrossRef]
- Jiang, T.; Zhang, S.; Wang, H.; Bian, X.; Zhong, G.; Wei, R.; Zhou, J.; Xiao, B.; Kao, J. Case Study: Dual Temporary Plugging & High Proppant Intensity Fracturing Stimulation Technique in Deep Shale Gas Play in Sichuan Basin, China. In Proceedings of the 56th U.S. Rock Mechanics/Geomechanics Symposium, Santa Fe, NM, USA, 26–29 June 2022. [Google Scholar] [CrossRef]
- Radwan, A. A Multifunctional Coated Proppant: A Review of Over 30 Field Trials in Low Permeability Formations. In Proceedings of the SPE Annual Technical Conference and Exhibition, San Antonio, TX, USA, 9–11 October 2017. [Google Scholar] [CrossRef]
- Palisch, T.; Duenckel, R.; Wilson, B. New Technology Yields Ultrahigh-Strength Proppant. SPE Prod. Oper. 2015, 30, 76–81. [Google Scholar] [CrossRef]
- Gorucu, S.E.; Shrivastava, V.; Nghiem, L.X. Numerical Simulation of Proppant Transport in Hydraulically Fractured Reservoirs. In Proceedings of the SPE Reservoir Simulation Conference, On-Demand, 26 October 2021; OnePetro: Richardson, TX, USA, 2021. SPE-203927-MS. [Google Scholar]
- Peng, H.; Yang, J.; Peng, J.; Pu, J.; Liu, Q.; Su, J.; Liu, J. Experimental Investigation of the Mechanism of Supercritical CO2 Interaction with Tight Sandstone. Front. Energy Res. 2022, 10, 984144. [Google Scholar] [CrossRef]
- Li, N.; Cheng, Q.; Gong, Z. Release kinetics of rare earth tracer from polymer-coated proppants for hydraulic fracture analysis. Geoenergy Sci. Eng. 2023, 227, 211782. [Google Scholar] [CrossRef]
- Fan, F.; Li, F.-X.; Tian, S.-C.; Sheng, M.; Khan, W.; Shi, A.-P.; Zhou, Y.; Xu, Q. Hydrophobic epoxy resin coated proppants with ultra-high self-suspension ability and enhanced liquid conductivity. Pet. Sci. 2021, 18, 1753–1759. [Google Scholar] [CrossRef]
- Tabatabaei, M.; Dahi Taleghani, A.; Cai, Y.; Santos, L.; Alem, N. Surface Modification of Proppant Using Hydrophobic Coating To Enhance Long-Term Production. SPE Prod. Oper. 2021, 36, 116–127. [Google Scholar] [CrossRef]
- Peng, H.; Yang, J.; Peng, J.; Han, H.; Gou, X.; Jia, Y. Source Analysis and Countermeasure Research of Sand Production after Hydraulic Fracturing in Tight Sandstone Gas Reservoir. Lithosphere 2022, 2022, 8342062. [Google Scholar] [CrossRef]
- Shaoul, J.R.; Park, J.; Langford, M. The Effect of Resin-Coated Proppant and Proppant Production on Convergent-Flow Skin in Horizontal Wells With Transverse Fractures. SPE Prod. Oper. 2020, 35, 214–230. [Google Scholar] [CrossRef]
- Peng, H.; Zhou, L.; Yang, J.; Peng, J.; Han, H.; Gou, X.; Wang, Z. Influence of Supercritical CO2 on the Formation Sensitivity of Tight Sandstone. Front. Energy Res. 2022, 10, 922941. [Google Scholar] [CrossRef]
- Guo, T.; Zhang, S.; Qu, Z.; Zhou, T.; Xiao, Y.; Gao, J. Experimental study of hydraulic fracturing for shale by stimulated reservoir volume. Fuel 2014, 128, 373–380. [Google Scholar] [CrossRef]
- Zou, C.; Dong, D.; Wang, Y.; Zou, C.; Dong, D.; Wang, Y.; Li, X.; Huang, J.; Wang, S.; Guan, Q.; et al. Shale gas in China: Characteristics, challenges and prospects (II). Pet. Explor. Dev. 2015, 43, 182–196. [Google Scholar] [CrossRef]
- Keshavarz, A.; Badalyan, A.; Carageorgos, T.; Bedrikovetsky, P.; Johnson, R. Graded proppant injection into coal seam gas and shale gas reservoirs for well stimulation. In Proceedings of the Spe European Formation Damage Conference & Exhibition, Budapest, Hungary, 3–5 June 2015; OnePetro: Budapest, Hungary, 2015. [Google Scholar] [CrossRef]
- ISO 13503-2:2006; The Evaluation Standards for Proppant Performance Abroad: Petroleum and Natural Gas Industries—Completion Fluids and Materials—Part 2: Measurement of Properties of Proppants Used in Hydraulic Fracturing and Gravel-Packing Operations. ISO: Geneva, Switzerland, 2006.
- SY/T 5108-2014; The Evaluation Standards for Proppant Performance in China: Methods for Testing Performance of Proppants for Hydraulic Fracturing and Gravel Packing. ChineseStandard.net: Beijing, China, 2014.
- Dahl, J.; Nguyen, P.; Dusterhoft, R.; Calvin, J.; Siddiqui, S. Application of micro-proppant to enhance well production in unconventional reservoirs: Laboratory and field results. In Proceedings of the SPE Western Regional Meeting, Garden Grove, CA, USA, 27–30 April 2015. [Google Scholar]
- Olmen, B.D.; Anschutz, D.A.; Brannon, H.D.; Stribling, K.M. Evolving Proppant Supply and Demand: The Implications on the Hydraulic Fracturing Industry. In Proceedings of the SPE Annual Technical Conference and Exhibition, Dallas, TX, USA, 24–26 September 2018. [Google Scholar] [CrossRef]
- Anschutz, D.; McGill, M.; Fleming, S.; Landis, C.; Cage, T. Turbidity in Frac Sand from Proximity Mines in the Permian Basin: Is it Detrimental to the Fracture System? In Proceedings of the SPE Hydraulic Fracturing Technology Conference and Exhibition. The Woodlands, TX, USA, 4–6 February 2025. [Google Scholar] [CrossRef]
- Tian, Y.; Zhou, F.; Aljawad, M.S.; Weijermars, R.; Wu, M.; Li, B. Laboratory Tests and Well Rate Models of Crushed Micro-Proppants to Improve Conductivity of Hydraulic Microfractures. In Proceedings of the International Petroleum Technology Conference, Riyadh, Saudi Arabia, 21–23 February 2022. [Google Scholar] [CrossRef]
- Benge, M.; Lu, Y.; Katende, A.; Rutqvist, J.; Crandall, D.; Haecker, A.; King, G.; Renk, J.B.; Radonjic, M.; Bunger, A. Connecting Geomechanical Properties with Potential for Proppant Embedment and Production Decline for the Emerging Caney Shale, Oklahoma. In Proceedings of the SPE/AAPG/SEG Unconventional Resources Technology Conference, Houston, TX, USA, 26–28 July 2021. [Google Scholar] [CrossRef]


Disclaimer/Publisher’s Note: The statements, opinions and data contained in all publications are solely those of the individual author(s) and contributor(s) and not of MDPI and/or the editor(s). MDPI and/or the editor(s) disclaim responsibility for any injury to people or property resulting from any ideas, methods, instructions or products referred to in the content. |
© 2025 by the authors. Licensee MDPI, Basel, Switzerland. This article is an open access article distributed under the terms and conditions of the Creative Commons Attribution (CC BY) license (https://creativecommons.org/licenses/by/4.0/).