Abstract
As of 2023, China’s transportation energy carbon emissions account for over 10%, which has a significant impact on achieving “dual carbon” goals. China has successively issued various policies to address pollution emissions in the transportation industry. This study mainly analyzes the synergistic effects of pollution reduction and carbon reduction measures implemented in this industry. We selected 2023 as the base year, focused on promoting new energy vehicles (NEVs), advocating bus transit (ABT), and advancing rail transit (ART) as the three major emission reduction policies, and analyzed their synergistic effects on air pollutant control and greenhouse gas emission reduction. Based on national scale data on driving conditions, energy consumption, and emission factors, the synergistic emission reductions in greenhouse gases and air pollutants brought about by the three policies were first calculated. Then, using the coordinate system of synergistic control effects, cross elasticity analysis of pollutants, and normalization evaluation methods, the multi pollutant synergistic control capabilities of each policy were quantified. Quantitative results revealed that the NEV substitution policy achieved a CO2 reduction of 100.966 million tons in 2023, alongside reductions of 1.0196 million tons (CO), 59,506 tons (NOx), 103,500 tons (NMHC), 6266 tons (PM10), and 3071 tons (SO2). Based on the APeq ranking, its comprehensive benefits (APeq = 166,734.52) significantly outperform ART (APeq = 97,414.89) and ABT (APeq = 19,796.80). The main research conclusion shows that replacing private gasoline cars with new energy vehicles can have a synergistic emission reduction effect on all five types of air pollutants and greenhouse gases involved in this study, with a positive synergistic effect. Moreover, the policy development priority is relatively better based on the synergistic emission reduction equivalent. Both buses and rail transit have not brought about SO2 emission reduction, nor have they had a positive synergistic effect on SO2 and CO2 emission reduction. On this basis, buses also contribute to NOx emissions. For other air pollutants, both rail transit and buses can have a synergistic effect of reducing pollution and carbon emissions.
1. Introduction
The formulation of China’s 2030 “carbon peak” and 2060 “carbon neutrality” targets has determined the strategic position of greenhouse gas emissions reduction in China’s governance of environmental issues [1,2]. In 2023, the China Meteorological Administration released the “China Greenhouse Gas Bulletin (2023)” to provide data support for the achievement of the “dual carbon” target. The report shows that, as of 2023, China’s CO2 emissions are still on the rise compared to the previous year [3]. The transportation sector is an important contributor to greenhouse gas emissions and urgently needs low-carbon transformation [4,5]. At present, China’s energy structure is still dominated by fossil fuels, which not only brings a large amount of carbon emissions but also exacerbates air pollutant emissions. Collaborative governance of climate change and air pollution issues is an efficient pathway to solve this homogeneity problem and improve emission reduction efficiency [6].
Currently, an increasing number of researchers are focusing on the emission reduction effects of policies aimed at reducing emissions in the transportation industry. As a replacement for high-polluting and high-energy-consuming fuel vehicles, new energy vehicles rely more on electric propulsion, significantly reducing dependence on fossil fuels and consequently lowering carbon emissions and air pollutant emissions stemming from urban road transportation [7,8,9]. Cai et al. [10] first analyzed, from a macro perspective, the policies aimed at improving the energy structure and transportation structure in China’s road transportation sector, as well as the varying emission reduction effects that can be achieved through different combinations of policy systems. Zhang et al. [11] and Li et al. [12] conducted a study on the impact of new energy vehicle policies on pollutant emission reduction, primarily examining the emission reduction potential of various new energy vehicle models from the perspective of subsidy policies for new energy vehicles. Aqib Zahoor et al. [13] also analyzed the feasibility of achieving carbon neutrality through new energy vehicle policies but focused more on the additional carbon emissions caused by the construction of supporting infrastructure for new energy vehicles. Xue et al. [14] has relatively improved the policy scope of the research, focusing on the promotion and development of new energy vehicles, optimization of transportation structure, and adjustment of energy structure as the main research objects, setting up different scenarios to predict the medium- and long-term greenhouse gas emission reduction effect.
In the field of public transportation, Lu et al. [15] took Tianjin as a case study, focusing their research on the construction of urban low-carbon transportation structures, and they propose that the ownership of new energy vehicles is a key influencing factor in optimizing urban passenger transport structures. Wei et al. [16] categorized public transportation into trolleybuses, urban rail transit, and urban public transportation and analyzed their environmental impacts separately, providing a basis for relevant policy formulation. Ding et al. [17] explored the impact of vehicle emission standards and increasing the proportion of new energy vehicles on emission reduction in this field. Wang et al. [18] revealed the quantitative correlations and sensitivity variations between urban public transportation policies and carbon reduction outcomes through empirical modeling, while Yu et al. [19] further demonstrated the irreplaceable role of public transit optimization in low-carbon urban mobility systems. Building on these findings, 17 Chinese cities have set specific targets to increase green travel shares, offering regional exemplars for policy implementation. To enhance emission reduction efficiency and promote the coordinated control of air pollutants and greenhouse gases, it is also particularly important [20,21,22,23,24]. Zeng et al. [25] utilized the LMDI and Kaya constant equations to study the driving factors affecting the synergistic effect of road transportation. Bian et al. [26] and Jiao et al. [27] took Xiamen and Guangzhou as examples, respectively, to analyze the synergistic effects of different types of vehicles on pollution reduction and carbon reduction in urban road transportation. Li Yunyan et al. [28] analyzed the synergistic effects of pollution reduction and carbon reduction in road mobile sources in Beijing in 2016, focusing on simulating and evaluating the emission reduction effects of different scenarios in the future. However, they did not consider the differences in the acceptance of public transportation or new energy vehicles between citizens in developed and less developed cities, and there are limitations in using only some cities as research cases. This study is grounded in the synergy effect theory, focusing on the coupled mechanism of “pollution-carbon reduction” under multi-policy interactions. Synergy effect theory emphasizes that systemic policy design can simultaneously achieve environmental quality improvement and greenhouse gas control [1]. This theoretical framework provides the methodological foundation for quantifying policy priorities.
Existing studies have extensively explored the synergistic effects of emission reduction policies in China’s transportation sector [23,25]. However, most focus on single policies or regional scales, with methodologies relying on static elasticity coefficients or single-pollutant weighting [24]. For instance, Zeng et al. [25] quantified the pollution–carbon synergy in road transport via cross-elasticity models but overlooked multi-policy interactions. While Wang et al. [23] proposed a national-scale framework, they neglected the counteracting effects of dynamic power structure transitions. In terms of synergistic effect research, it is more commonly divided based on vehicle types, comparing the synergistic effects of pollution reduction and carbon reduction brought about by different vehicle types. Thus, the question “how can a comprehensive evaluation framework be developed to assess the synergistic effects of pollution and carbon reduction policies across China’s transportation sector, thereby informing more integrated and effective climate and environmental strategies?” is addressed in this study.
The implementation of emission reduction policies in China’s transportation sector faces multifaceted challenges. Regional development disparities lead to heterogeneous policy outcomes, coupled with persistent reliance on high-emission diesel vehicles. Meanwhile, delayed transitions in the power structure limit the emission reduction potential of electrified transport. Additional complexities arise from uneven distribution of charging infrastructure between urban and rural areas, and insufficient cross-sectoral policy coordination mechanisms. To better assess the synergy effect in reducing air pollution and carbon emissions brought about by emission reduction policies, this study takes three emission reduction measures already implemented in China’s transportation sector (promoting new energy vehicles, advocating bus transit, and advancing rail transit) as the research subjects. Firstly, it calculates the greenhouse gas and air pollutant emission reductions brought about by each of these policies from 2016 to 2023. Then, using 2023 as the base year, it analyzes the synergistic effects of these three policies on greenhouse gas emission reduction and the control of various air pollutants (CO, NOx, NMHC, SO2, and PM10). The timeframe of 2016–2023 was selected for three reasons. First, 2016 marked the launch of China’s 13th Five-Year Plan, during which systematic low-carbon transportation policies were implemented, providing a full cycle for policy impact evaluation. Second, by 2023, the new energy vehicle fleet had grown over 20-fold compared to 2016, and the coverage of bus and rail transit infrastructure had expanded significantly, ensuring sufficient data to capture dynamic policy effects. Third, 2023 served as a mid-term checkpoint for China’s “dual carbon” goals, making this period critical for assessing synergistic outcomes to inform future policy refinements. Furthermore, it ranks the priority of the development of these three policies, compares the synergistic control effects of different policies on air pollutants and greenhouse gases, and thereby provides medium-term and long-term policy development suggestions for the transportation sector, promoting green transformation and sustainable development in the industry.
The theoretical, practical, and empirical contributions of this study are threefold: (1) Theoretical Contribution: This study proposes a novel integrated framework to assess multi-policy synergistic effects in the transportation sector, combining the synergy control coordinate system, cross-elasticity coefficients, and APeq normalization. This framework addresses gaps in dynamic correlation analysis and multi-pollutant weight integration in the existing literature. (2) Practical Contribution: By quantifying the prioritization of three policies using national-scale data, the research findings offer direct decision-making support for optimizing transportation policies under China’s “dual carbon” goals. (3) Empirical Contribution: This research uncovers the counteracting effects of coal-dominated power structures and regional diesel fleet retention on NOx and SO2 emissions, providing critical evidence for cross-sector governance (e.g., clean energy transition and the phase-out of high-emission vehicles).
2. Materials and Methods
This study selects the emission reduction policies adopted by China’s transportation industry as the research object, analyzing the synergistic effects of air pollutant control and greenhouse gas emission reduction brought about by relevant emission reduction measures in 2023. The research boundary encompasses the energy pollutant emissions consumed during the operation of new energy vehicles, buses, and rail transit, as well as during the production of the required electric energy. The air pollutants involved in this study mainly include CO, NOx, NMHC, SO2, and PM10, with these based on data authority and completeness, considering policy objectives, and greenhouse gases, with the aim of primarily targeting CO2 emissions. According to the “Ten Major Actions for Energy Conservation and Carbon Reduction Deployed by the State Council” issued by the Ministry of Transport of the People’s Republic of China in 2024 [29], the policy objectives targeted by this study are set as promoting new energy vehicles (NEVs), advocating bus transit (ABT), and advancing rail transit (ART). The “new energy vehicle (NEV)” policy in this study includes both battery electric vehicles (BEVs) and plug-in hybrid electric vehicles (PHEVs). To precisely evaluate policy synergy effects, we separately calculated the direct electricity-related emissions of BEVs and the hybrid-mode emission reductions in PHEVs; then, we aggregated the contributions from both vehicle types.
2.1. Synergistic Emission Reduction Calculation for NEV Policies
2.1.1. Emissions of Pollutants from Traditional Fuel-Powered Vehicles
Traditional fuel-powered vehicles utilize only one type of energy during operation; thus, the pollutant emissions from traditional fuel-powered vehicles are calculated by multiplying the emission factors with the operational baseline data. The specific calculation is expressed as Equation (1).
where i, h, Ni, Li, and EFi,h are the type of vehicle, the air pollutants or CO2, the inventory of the i-type of vehicle, the annual average mileage (km) of the i-type of vehicle, the emission factor for the h-type air pollutants, or CO2 of the i-type of vehicle, respectively.
2.1.2. Emission Reduction in Electric Vehicles
Electric vehicles primarily operate on electric power. Therefore, when considering the electric energy consumed by the drive system of pure electric vehicles, air pollutants and greenhouse gases are emitted during the power generation process, while the emissions during operation are virtually zero. The electric emissions of new energy vehicles can be calculated using the following Equation (2).
where Pi, ωi, EVh, and k are the inventory of the i-type of vehicle, the electricity consumption per 100 km (kwh/100 km) for the i-type of vehicle, the emission factor for the h-type of air pollutant or CO2, and the transmission loss rate from the output area to the input area, calculated at 6% (National Energy Administration, 2017) [30], respectively.
Therefore, the emission reductions in pure electric vehicles can be regarded as the difference between the pollutant emissions of an equivalent number of traditional fuel vehicles and the emissions from the electricity required by new energy vehicles. The calculation formula is expressed as Equation (3).
where Δ, Efpv, and Eepv are the emission reductions in pollutants from electric vehicles, the emission of pollutants from traditional fuel vehicles, and the electricity-related pollutant emissions from new energy vehicles, respectively.
2.1.3. Emission Reductions in Plug-In Hybrid Electric Vehicles
Plug-in hybrid electric vehicles primarily operate in the form of a hybrid of gasoline and electricity. Therefore, the emissions of plug-in hybrid electric vehicles are calculated separately for fuel emissions and electric emissions. The fuel emission reduction can be regarded as the product of the equivalent amount of pollutant emissions from traditional gasoline vehicles and the fuel efficiency ratio. The reduction in pollutant emissions from plug-in hybrid electric vehicles can be calculated as Equation (4).
where Δ and are the emission reductions in pollutants from plug-in hybrid electric vehicles and the fuel-saving rate of plug-in hybrid electric vehicles relative to conventional fuel-powered vehicles, respectively.
Among them, the fuel-saving rate of plug-in hybrid electric vehicles relative to traditional fuel vehicles can be calculated using the “Outline for Testing the Fuel-saving Rate and Maximum Electric Power Ratio of Energy-saving and New Energy Vehicles” compiled by the China Machinery Vehicle Technology Service Center (2009) [31]. The specific calculation formula is in Equation (5).
where λ is the fuel-saving rate of plug-in hybrid electric vehicles relative to gasoline-powered vehicles (based on the fuel consumption of plug-in hybrid electric vehicles, it can be concluded that the fuel-saving rate of hybrid electric vehicles is 37.5%), and CFPV and CPHEV are the fuel consumption of traditional fuel-powered vehicles and the fuel consumption of plug-in hybrid electric vehicles, respectively.
This study involves data on the inventory of vehicles from ‘Xingyuan Data’ (https://www.stardata360.com/, accessed on 18 June 2023), urban transportation vehicle types (such as vehicle type, annual average mileage, and energy consumption per 100 km), which are presented in Table 1.

Table 1.
Annual average driving distance and 100 km energy consumption of different types of vehicles.
This study is based on the proportion of vehicles under different emission standards, combined with vehicle composition characteristics, fuel characteristics, and actual operational parameters, and analyzed motor vehicle exhaust emission factors using the COPERT model. The analysis of carbon emissions from new energy vehicles is simplified to emissions from fossil energy during power generation, so the emission factors for the electricity demand of new energy vehicles are adopted from the 2023 China regional power grid baseline emission factor data.
2.2. Synergistic Emission Reductions Calculation for ABT Policy
By comparing the passenger efficiency and emission characteristics of buses and cars, the emission reduction effects of the “advocating bus transit” policy on greenhouse gases and air pollutants are quantified. The emissions from buses are calculated as the total emissions of fuel-powered buses and new energy buses. The annual passenger volume of buses is used to deduce the number of private cars required for the same number of passengers, thereby calculating the emissions from private cars. The data on the national fleet size and passenger volume of gasoline and electric buses from 2016 to 2023 are sourced from the “China City Statistical Yearbook” and the annual reports of the Ministry of Transport. The average annual mileage of private cars and buses is referenced from the “Annual Report on Environmental Management of Motor Vehicles in China”. The annual passenger volume of buses is converted into the number of private cars required for equivalent passenger capacity, using the following Equation (6).
where Ncar, Qbus, and Rcar are the equivalent number of cars (in 10,000 units), the annual passenger capacity of buses (in billions of passenger trips), and the annual passenger volume per private vehicle (passengers per vehicle), respectively.
The detailed calculation method for the pollutant emissions of traditional fuel-powered vehicles has been provided in Section 2.1. By comparing the emissions of buses and private cars, it is concluded that under the premise of equivalent passenger capacity, taking a bus trip can lead to a reduction in pollutant emissions compared to driving a private car. The formula is in Equation (7).
where Δ, Ecar, and Ebus are the emission reductions achieved through the policy of “promoting public bus transportation”, the emissions of pollutants from cars under the premise of equivalent passenger capacity, and the total emissions of pollutants from fuel-powered and electric buses under the premise of equivalent passenger capacity, respectively. The calculation method of Ebus is given in the following Equation (8).
where Nm, Lm, EFm,q, Pn, ωi, Ln, and EWh are the inventory of the m-type of bus, the annual average mileage (km) of the m-type of bus, the emission factor for the h-type air pollutants or CO2 of the m-type of bus, the inventory of the n-type of bus, the electricity consumption per 100 km (kwh/100 km) for the n-type of bus, the annual average mileage (km) of the n-type of bus, and the emission factor for the h-type air pollutants or CO2, respectively.
2.3. Synergistic Emission Reductions Calculation for ART Policy
Rail transit emission reductions are calculated through three phases: (1) direct emissions from electricity consumption; (2) equivalent emissions from private car trips for the same passenger volume; and (3) net reductions by comparing rail transit and car emissions. The emission of pollutants from rail transit is calculated through electricity consumption data and electricity emission factors, using the following Equation (9).
where and are the annual emissions of pollutant i from rail transit (in tons), the annual power consumption of rail transit (in kWh), and data sourced from the statistical annual reports of the National Energy Administration and the Urban Rail Transit Association, respectively. is the emission factor of pollutant i from the power grid (in g/kWh), utilizing the “Baseline Emission Factors for Regional Power Grids in China (2023)” published by the Ministry of Ecology and Environment [34], with the CO2 emission factor referencing the national average (0.6205 kg CO2/kWh), and other pollutants (CO, NOx, PM10, HC, SO2) calculated based on the weighted method of fuel structure.
The calculation methods for emissions from fuel-powered cars and the methods for converting car numbers based on passenger capacity are detailed in Section 2.1 and Section 2.2, respectively. By comparing the emissions from rail transit with those from cars, it can be concluded how much reduction in air pollutants can be achieved by choosing rail transit over cars under the premise of equivalent passenger capacity. The formula is in Equation (10).
where Δ, Ecar, and Erail are the emission reductions achieved through the policy of “promoting public bus transportation”, the emissions of pollutants from cars under the premise of equivalent passenger capacity, and the emissions of pollutants from rail transit under the premise of equivalent passenger capacity, respectively.
2.4. Measurement Methods of Synergistic Effects
2.4.1. The Coordinate System for the Synergistic Control Effect
Utilizing the synergetic control effect coordinate system method, the impact of a certain emission reduction measure on different pollutants is expressed in the form of a two-dimensional coordinate system. In this system, the abscissa represents the emission reduction effect of the measure on a specific air pollutant, while the ordinate indicates the emission reduction effect on greenhouse gases. Each point corresponds to a reduction measure, and its position reflects its emission reduction effect and synergy status. Points within the first quadrant indicate that the emission reduction measure can simultaneously reduce emissions of both types of pollutants; points within the second quadrant signify a decrease in carbon emissions but a potential increase in the emission of air pollutants; points within the third quadrant represent a potential simultaneous increase in emissions of both types of pollutants; and points located in the fourth quadrant indicate a reduction in air pollutant emissions but a potential increase in carbon emissions. The emission reduction effects of air pollutants and CO2 can be represented by the size of the angle β between the line connecting a point to the origin and the horizontal and vertical axes.
2.4.2. Cross-Elasticity Analysis of Air Pollutant Emission Reduction
The degree of synergy between the control of air pollutants and the reduction in greenhouse gases is evaluated using the cross-elasticity analysis of pollutant reduction. This method relies on the elasticity coefficient of air pollutants with respect to CO2, which reflects the sensitivity of CO2 to changes in different pollutants. The elasticity coefficient index can be used to assess the effectiveness of each emission reduction measure in the synergistic control of air pollutants and greenhouse gases and to measure the degree of synergy between various pollutants. Taking the cross-elasticity formula for the reduction in air-pollutant SO2 and greenhouse gas CO2 as an example, the formula is in Equation (11).
where , , and are the coefficient of cross-elasticity for emission reductions between SO2 and CO2, the rate of change in CO2 emissions, and the rate of change in SO2 emissions, respectively.
If Els is positive, it indicates that the emission reduction measure exhibits a synergistic effect in reducing pollution and carbon emissions; conversely, if Els is negative or 0, it signifies that the emission reduction measure lacks such a synergistic effect. When Els exceeds 1, the emission reduction measure demonstrates a positive synergistic effect, with a greater impact on CO2 than on the target air pollutants. If 1 > Els > 0, the emission reduction measure has a positive synergistic effect and has a higher impact on the target air pollutants than on CO2. When Els equals 1, it signifies that the emission reduction measure has a positive synergistic effect, with equal impact on both CO2 and air pollutants.
2.4.3. Normalization of Emission Reduction Effect
In assessing synergistic effects, it is necessary to employ a normalization method to quantify the synergistic control effects of multiple pollutants. This approach facilitates a comprehensive evaluation of the synergistic control effects of different pollutants on a uniform scale through the construction of a synergistic emission reduction equivalent. The Air Pollutant Equivalence (APeq) index is used to reflect the overall effect of synergistic emission reductions in air pollutants and greenhouse gases. Taking the key emission reduction targets in the energy conservation and emission reduction field of urban transportation departments at the current stage, such as SO2, NOx, PM10, CO, NMHC, and CO2, as examples, the normalization calculation formula is in Equation (12).
where α, β, γ, θ, and η represent the equivalent coefficients corresponding to various air pollutants.
The calculation of this indicator primarily utilizes the standard values for air quality of various pollutants. Since the standards for air quality are based on the combined effects of different pollutants, a higher standard value indicates a lesser environmental impact from that pollutant, while a lower standard value indicates a greater environmental impact from that specific pollutant. Taking the air pollutant equivalent coefficient α for SO2 as 1, the equivalent coefficient for other pollutants is the ratio of the SO2 concentration to various pollutants in the 24 h average value of the secondary standard, as stipulated in the “Ambient Air Quality Standards (GB 3095-2012)” [35]. The concentration limits and corresponding equivalent coefficients for various air pollutants and greenhouse gases are detailed in Table 2.
Table 2.
Equivalent coefficient index for collaborative emission reduction in air pollutants.
Based on the results presented in Table 2, the calculation formula for APeq can be expressed as Equation (13).
The synergy control coordinate system method visually presents the synergistic effects of a single emission reduction measure on different pollutants through a two-dimensional coordinate system. However, its limitations are reflected in three aspects: (1) Simplification of Static Analysis: The method is based on static positioning of emission reductions in a specific year, making it difficult to dynamically reflect the evolution of synergistic effects between pollutants and greenhouse gases during long-term policy implementation. (2) Oversimplification of Multi-Dimensional Indicators: The coordinate system focuses only on the two-dimensional relationship between pollutants and CO2, failing to fully quantify cross-impacts and weight differences among multiple pollutants. (3) Ambiguity in Policy Prioritization: While coordinate quadrants distinguish the directionality of synergistic effects, they cannot explicitly rank the comprehensive priorities of policies in multi-pollutant synergistic control.
To address these limitations, this study further introduces cross-elasticity coefficient analysis and synergistic emission reduction equivalent (APeq) methods. Cross-elasticity coefficients quantify the dynamic correlation between pollutant reduction rates and CO2 reduction rates (e.g., Equation (11)), overcoming the shortcomings of static analysis. The APeq method (Equations (12) and (13)) normalizes multi-pollutant synergistic effects into a unified index based on environmental impact equivalence coefficients, integrating weight differences and enabling quantitative policy prioritization. The combination of these methods enhances the dynamic and multi-dimensional analysis of synergistic effects, thereby improving the scientific rigor of the research.
3. Results and Discussion
3.1. Research Cases
In 2016, the national vehicle fleet surpassed 290 million units [36], with carbon emissions from road transportation accounting for 84.6% of the total emissions in the transportation sector, becoming a core source of air pollution and greenhouse gas emissions. To address this challenge, the country has systematically promoted emission reduction policies in transportation since the implementation of the 13th Five-Year Plan, including the “New Energy Vehicle Industry Development Plan (2021–2035)” [37] and the “Green Transportation Development Plan for the 14th Five-Year Plan” [38] focusing on three major areas: the promotion of new energy vehicles (NEVs), advocating bus transit (ABT), and advancing rail transit (ART). Using 2023 as the base year, this study quantifies the collaborative emission reduction contributions of these three policies towards several pollutants, including CO2, CO, NOx, NMHC, SO2, and PM10. The promotion of new energy vehicles (NEVs) directly reduces exhaust emissions by replacing fuel-powered vehicles; the strategy prioritizing public transportation reduces energy consumption per passenger and combines with the expansion of the rail transit network to achieve a decoupling of “transport volume-emissions”. By 2023, the national fleet of new energy vehicles had reached 20.41 million units, an increase of over 20 times compared to 2016; the fleet of buses had increased by over 100,000 units compared to 2016, with the proportion of new energy buses also rising from 27.47% in 2016 to 81.17% in 2023; and the operational mileage of rail transit exceeded 11,000 km, with an average annual growth rate of 15% [39]. However, significant regional differences in policy implementation exist, with developed regions such as the Beijing–Tianjin–Hebei region and the Yangtze River Delta region having a new energy vehicle penetration rate exceeding 40%, while some western provinces still rely on traditional diesel vehicles, urgently requiring a nationwide scale collaborative effect study to optimize policy layout.
3.2. Accounting for Collaborative Emission Reductions and Priority Ranking
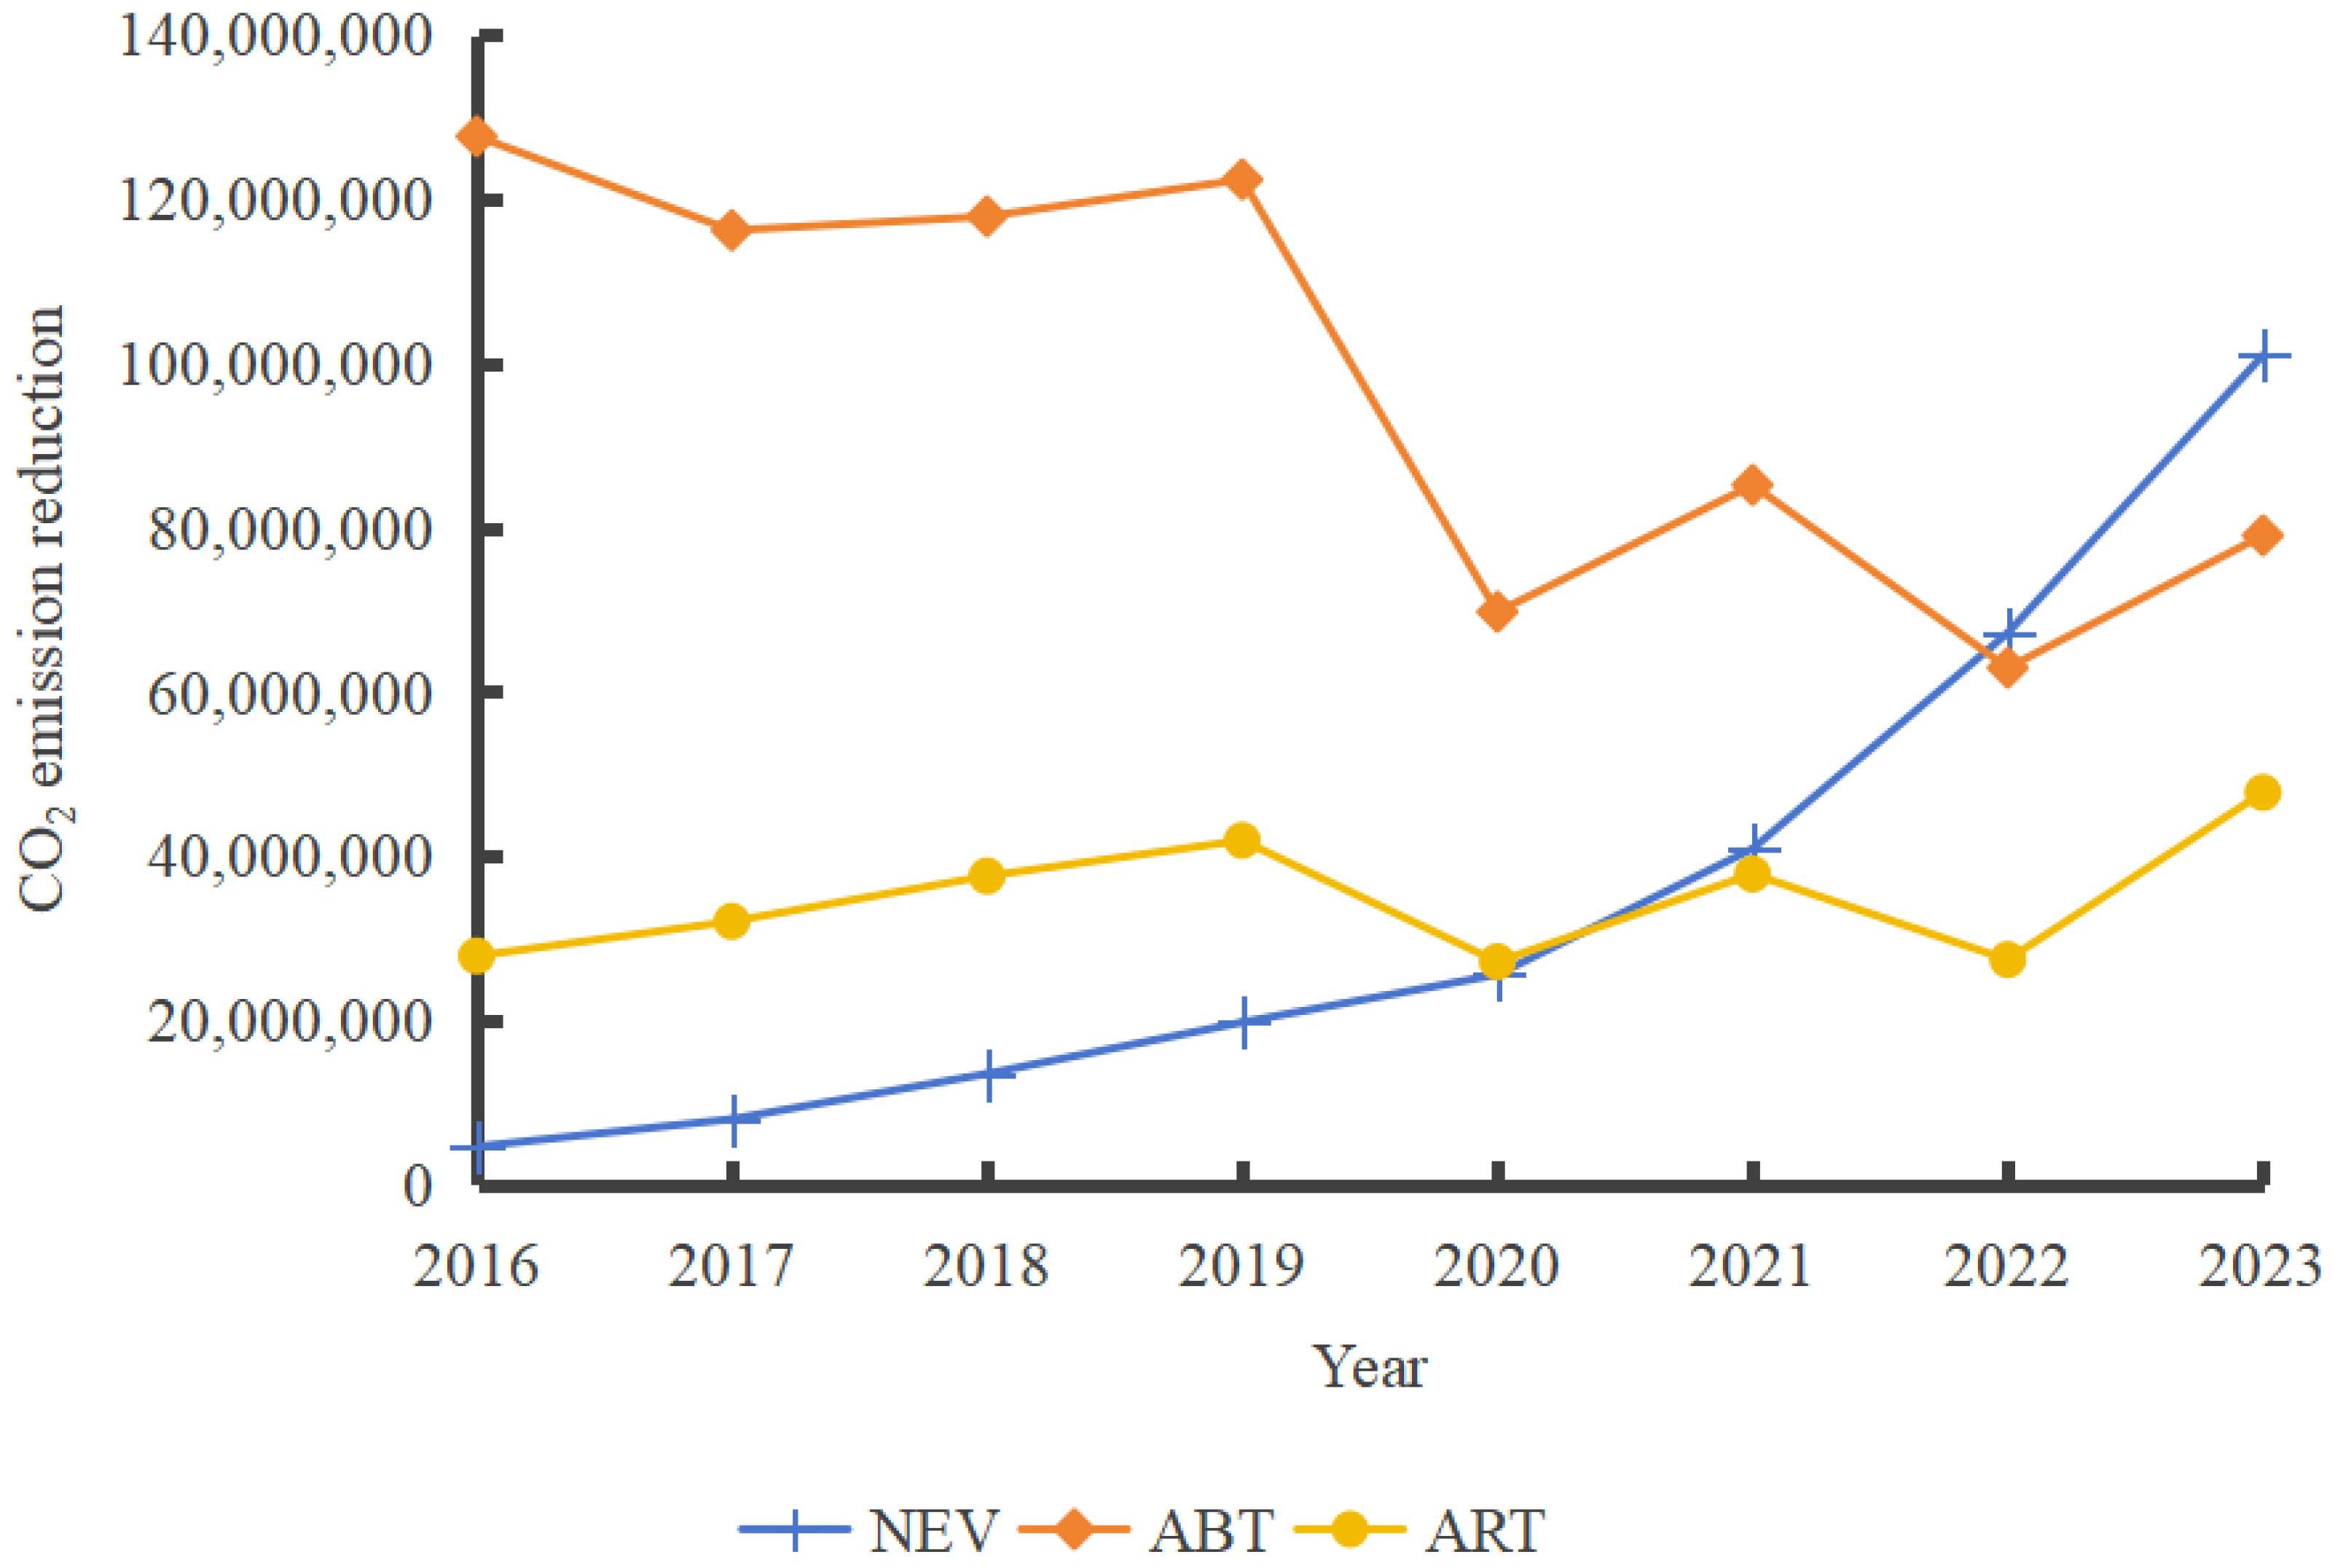
In the methodology section of Section 2, a detailed introduction was provided on the calculation methods for the synergistic emission reductions brought about by three emission reduction policies in the transportation industry. The above calculation results indicate that the CO2 emission reductions brought about by the three emission reduction policies from 2016 to 2023 exhibit varying trends. Among them, the CO2 emission reductions brought about by the promotion of new energy vehicles (comprising both pure electric vehicles and plug-in hybrid electric vehicles) have shown a steady annual increase, reaching a total of 100.966 million tons in 2023, which is also the highest CO2 emission reduction among the three policies during this period.
Policies advocating for the use of public transportation and the promotion of rail transit, both aimed at improving the structure of citizens’ travel and thereby reducing emissions, saw a decline in CO2 emissions and emission reductions due to the COVID-19 pandemic in 2020 and 2022 as shown in Figure 1, leading to an overall decrease in emissions. In 2021, there was a temporary increase in emission reductions. Notably, the policy promoting the use of public transportation reached its peak in CO2 emission reductions in 2019, amounting to 122.352 million tons. However, in 2023, the reduction under this policy only reached 79.0403 million tons. This is largely attributed to the diversification of citizens’ travel modes, which has led to a decrease in the passenger capacity of buses compared to their peak period. Conversely, the CO2 emission reductions from rail transit reached their highest point in 2023, reflecting an increasing trend in citizens choosing rail transit for their travel. On the other hand, it also indicates the rapid growth in the construction and operational mileage of China’s rail transit, significantly reducing the rate of greenhouse gas emissions.

Figure 1.
Emission reductions of CO2 brought by the three policies from 2016 to 2023.
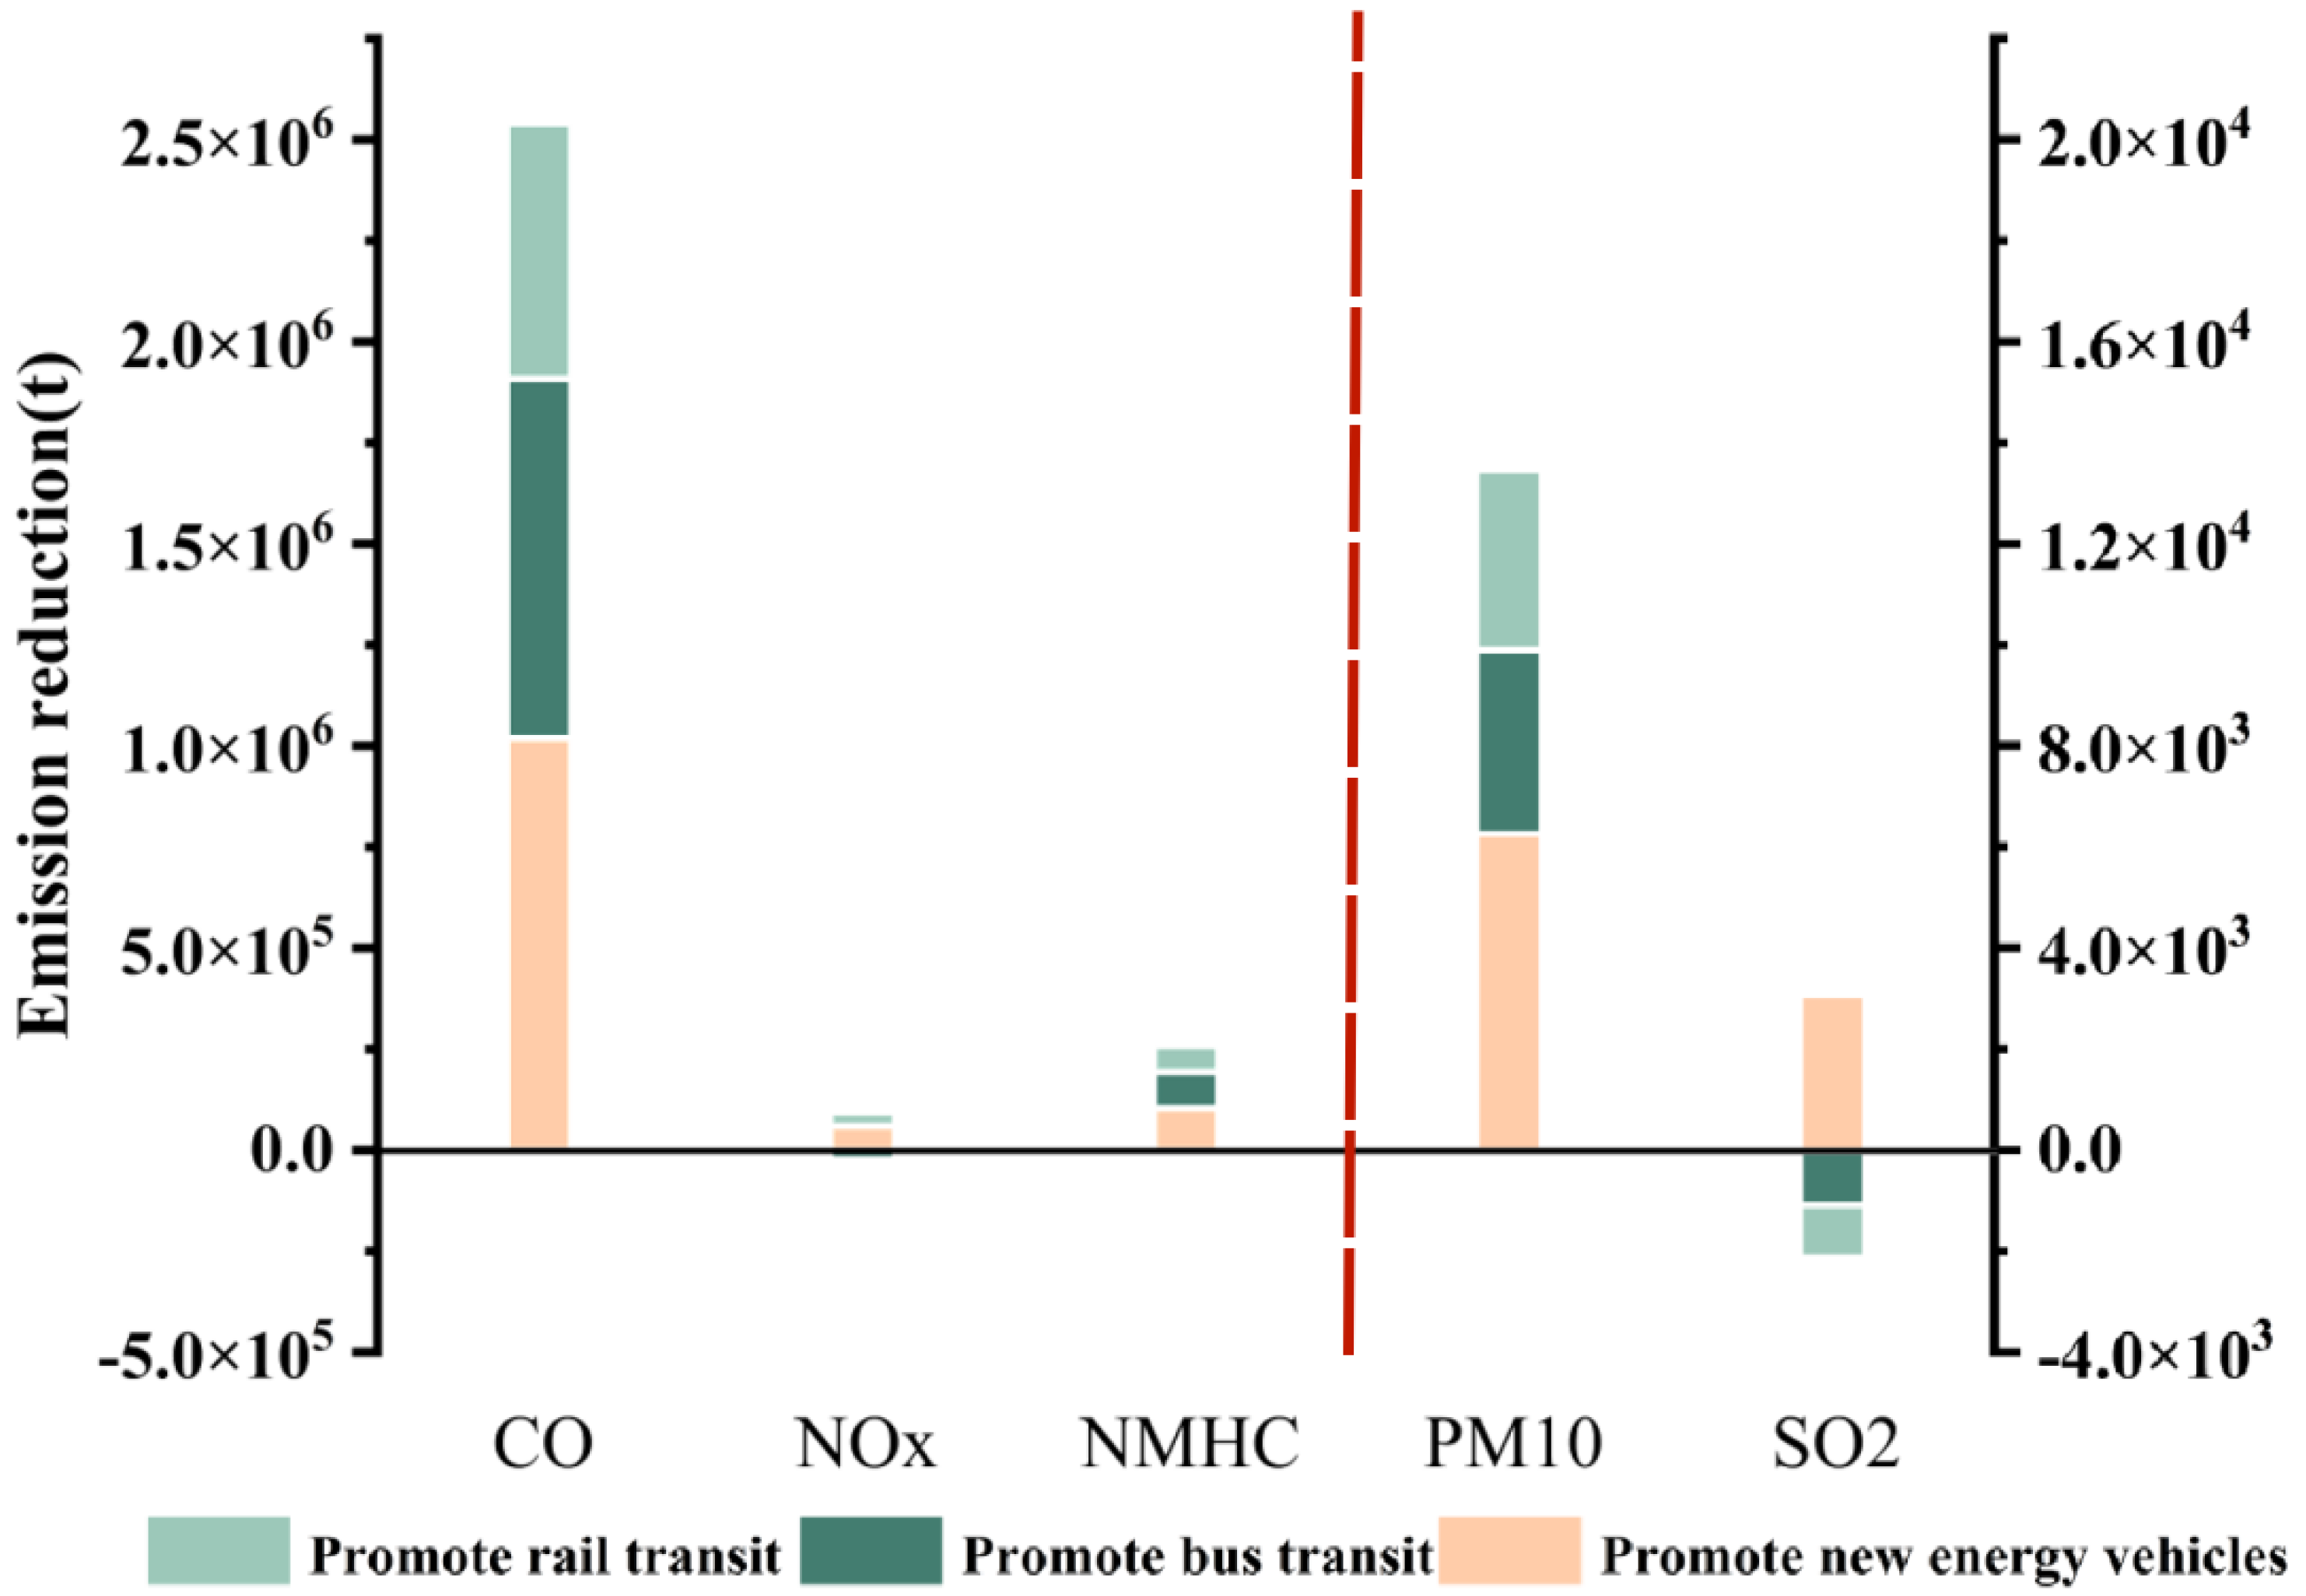
The three emission reduction policies studied have contributed to the reduction in air pollutants CO, NMHC, and PM10 during the period of 2016–2023, as shown in Figure 2. Notably, the policy advocating for bus travel accounted for 59.42% of the total CO emission reduction. Among these, the promotion of new energy vehicles (NEVs) has a comprehensive effect on reducing the five types of air pollutants studied, offering the most comprehensive emission reduction among the three policies and being the only measure that can reduce SO2 emissions. From 2016 to 2023, a total of 8540 tons of SO2 were reduced. Compared to the promotion of new energy vehicles (NEVs), the effect of rail transit (ART) on air pollutant reduction is slightly inferior, focusing primarily on reducing emissions of CO, PM10, NOx, and NMHC, with respective reductions of 632,300 tons, 3540 tons, 33,700 tons, and 64,600 tons in 2023. The promotion of bus transit (ABT) only limits the emissions of CO, PM10, and NMHC, but shows an increasing trend in NOx and SO2 emissions. This may be attributed to the continued use of high-emission diesel buses in some areas and the current reliance on electricity for low-carbon travel modes, while China’s energy structure, dominated by thermal power, indirectly leads to an increase in sulfur emissions.

Figure 2.
Emission reduction in air pollutants (CO, NOx, NMHC, PM10, SO2) brought by the three policies in 2023. In the figure, the reduction amounts of CO, NOx, and NMHC correspond to the left y-axis, while the reduction amounts of PM10 and SO2 correspond to the right y-axis.
Based on the collaborative emission reduction equivalent calculation method, the APeq values for three emission reduction measures in China’s transportation sector in 2023 were calculated separately. The emission reduction measures were then ranked from highest to lowest according to the collaborative emission reduction equivalents of CO2 and air pollutants, as shown in Table 3.
Table 3.
Priority ranking of three emission reduction policies implemented in China’s transportation industry.
Among the implemented measures, the one with the highest collaborative emission reduction equivalent is the promotion of new energy vehicles (NEVs), with a calculated APeq of 166,734.52 tons per year, indicating that this policy represents the optimal policy path for current pollution reduction and carbon reduction synergistic effects. Rail transit (ART) comes next, but its balanced emission reduction contribution is significant. The measure advocating for bus transit (ABT) has the smallest collaborative emission reduction control equivalent, at 19,796.80 tons per year, suggesting that the increase in emissions of certain pollutants (such as NOx) offsets some of the other emission reduction benefits, necessitating targeted optimization.
3.3. Synergistic Effect Analysis
3.3.1. Analysis of the Coordinate System for the Synergistic Control Effect
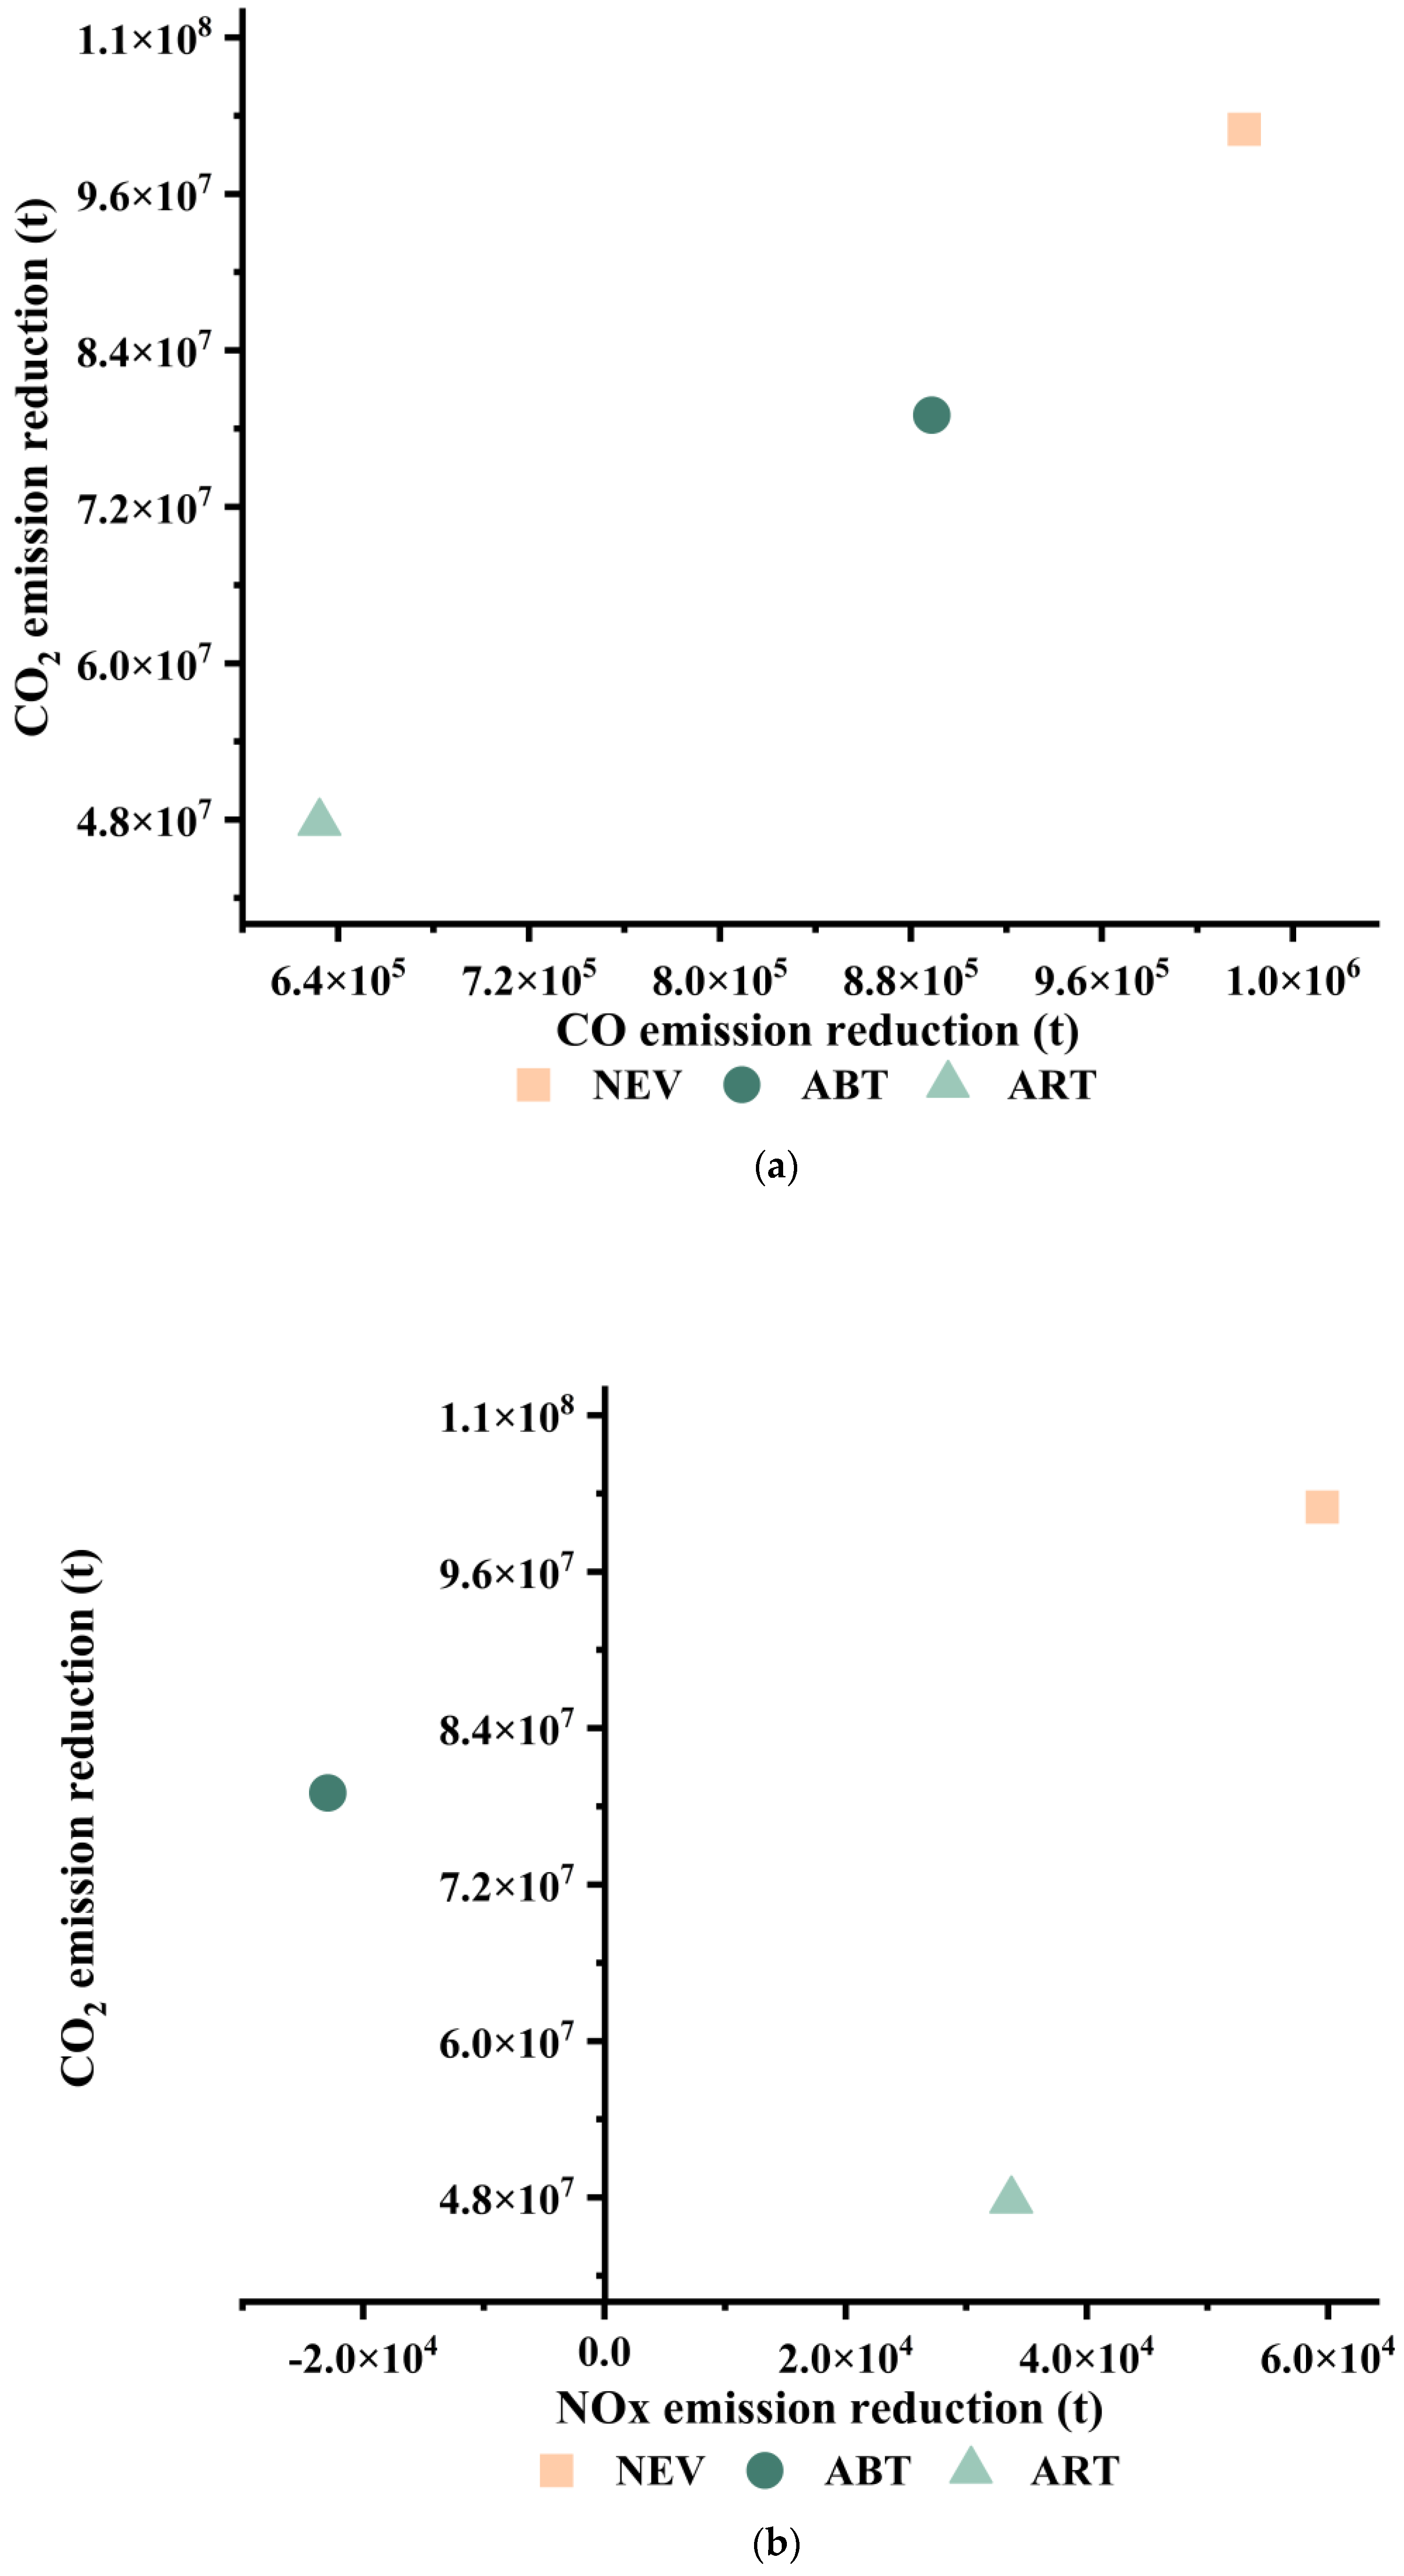
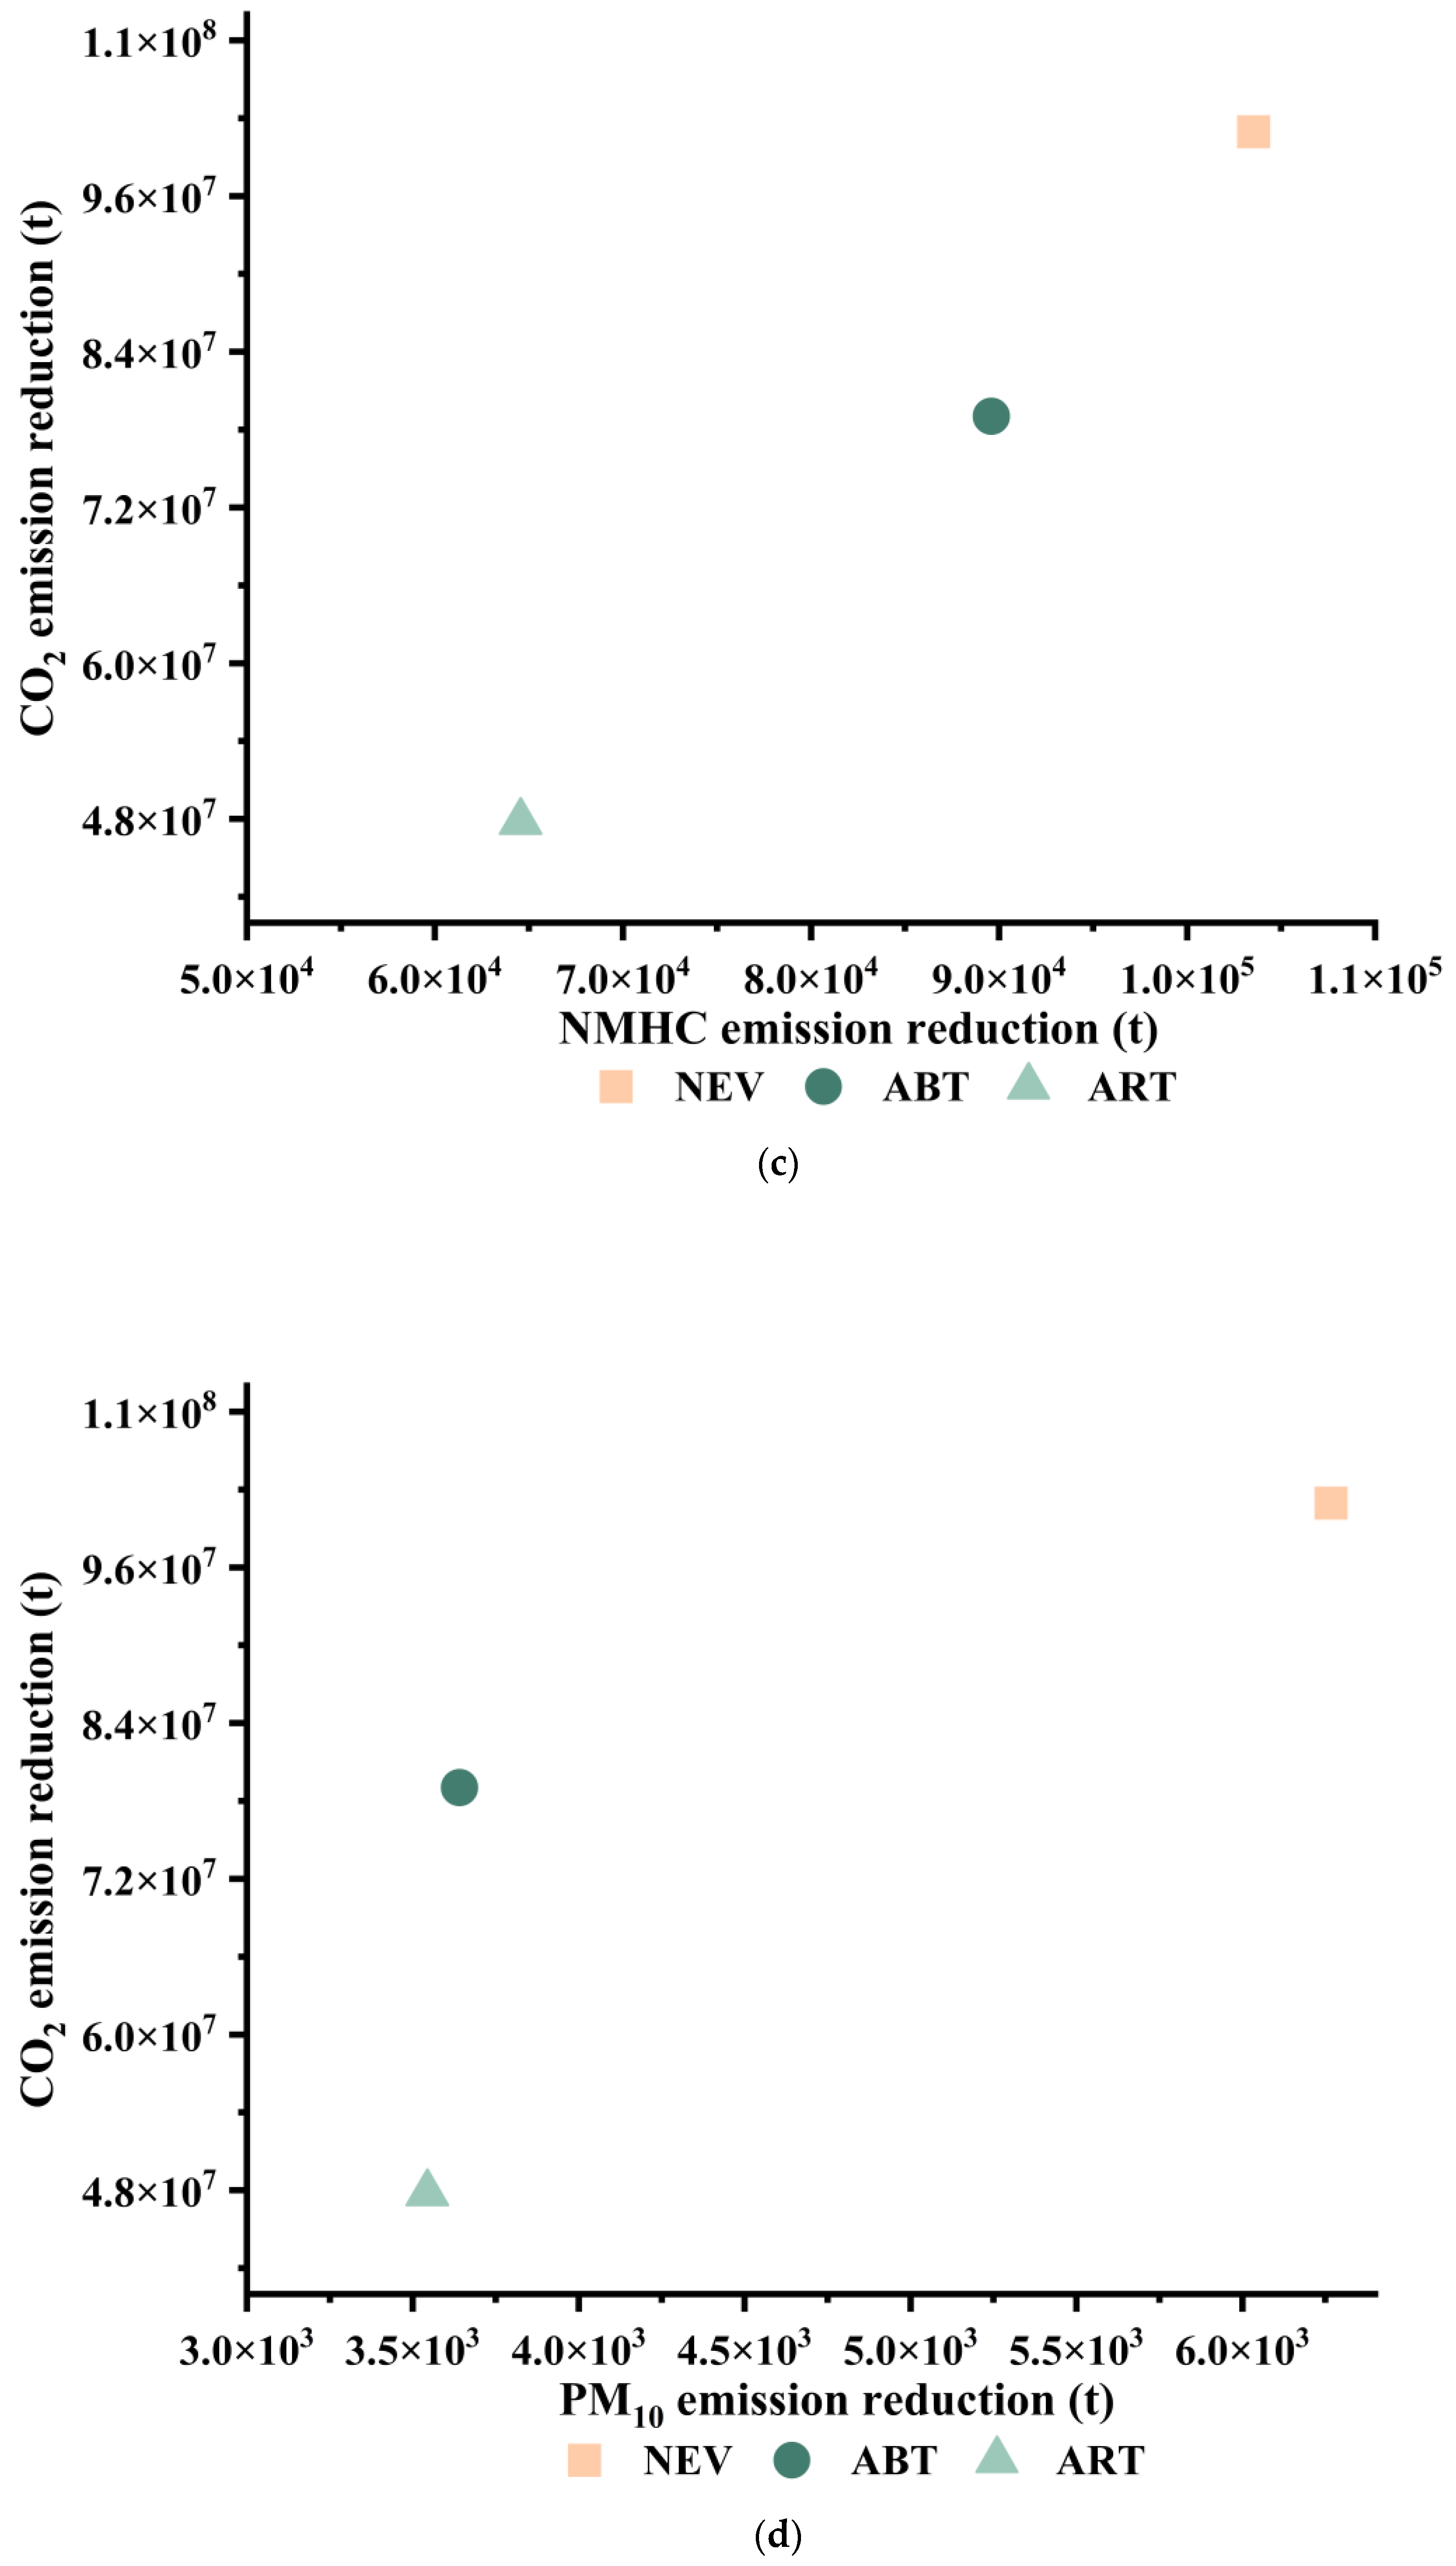
The coordinate system for the synergistic emission reduction degree of three emission reduction policies is plotted based on the synergistic control effect coordinate system method, as shown in Figure 3.


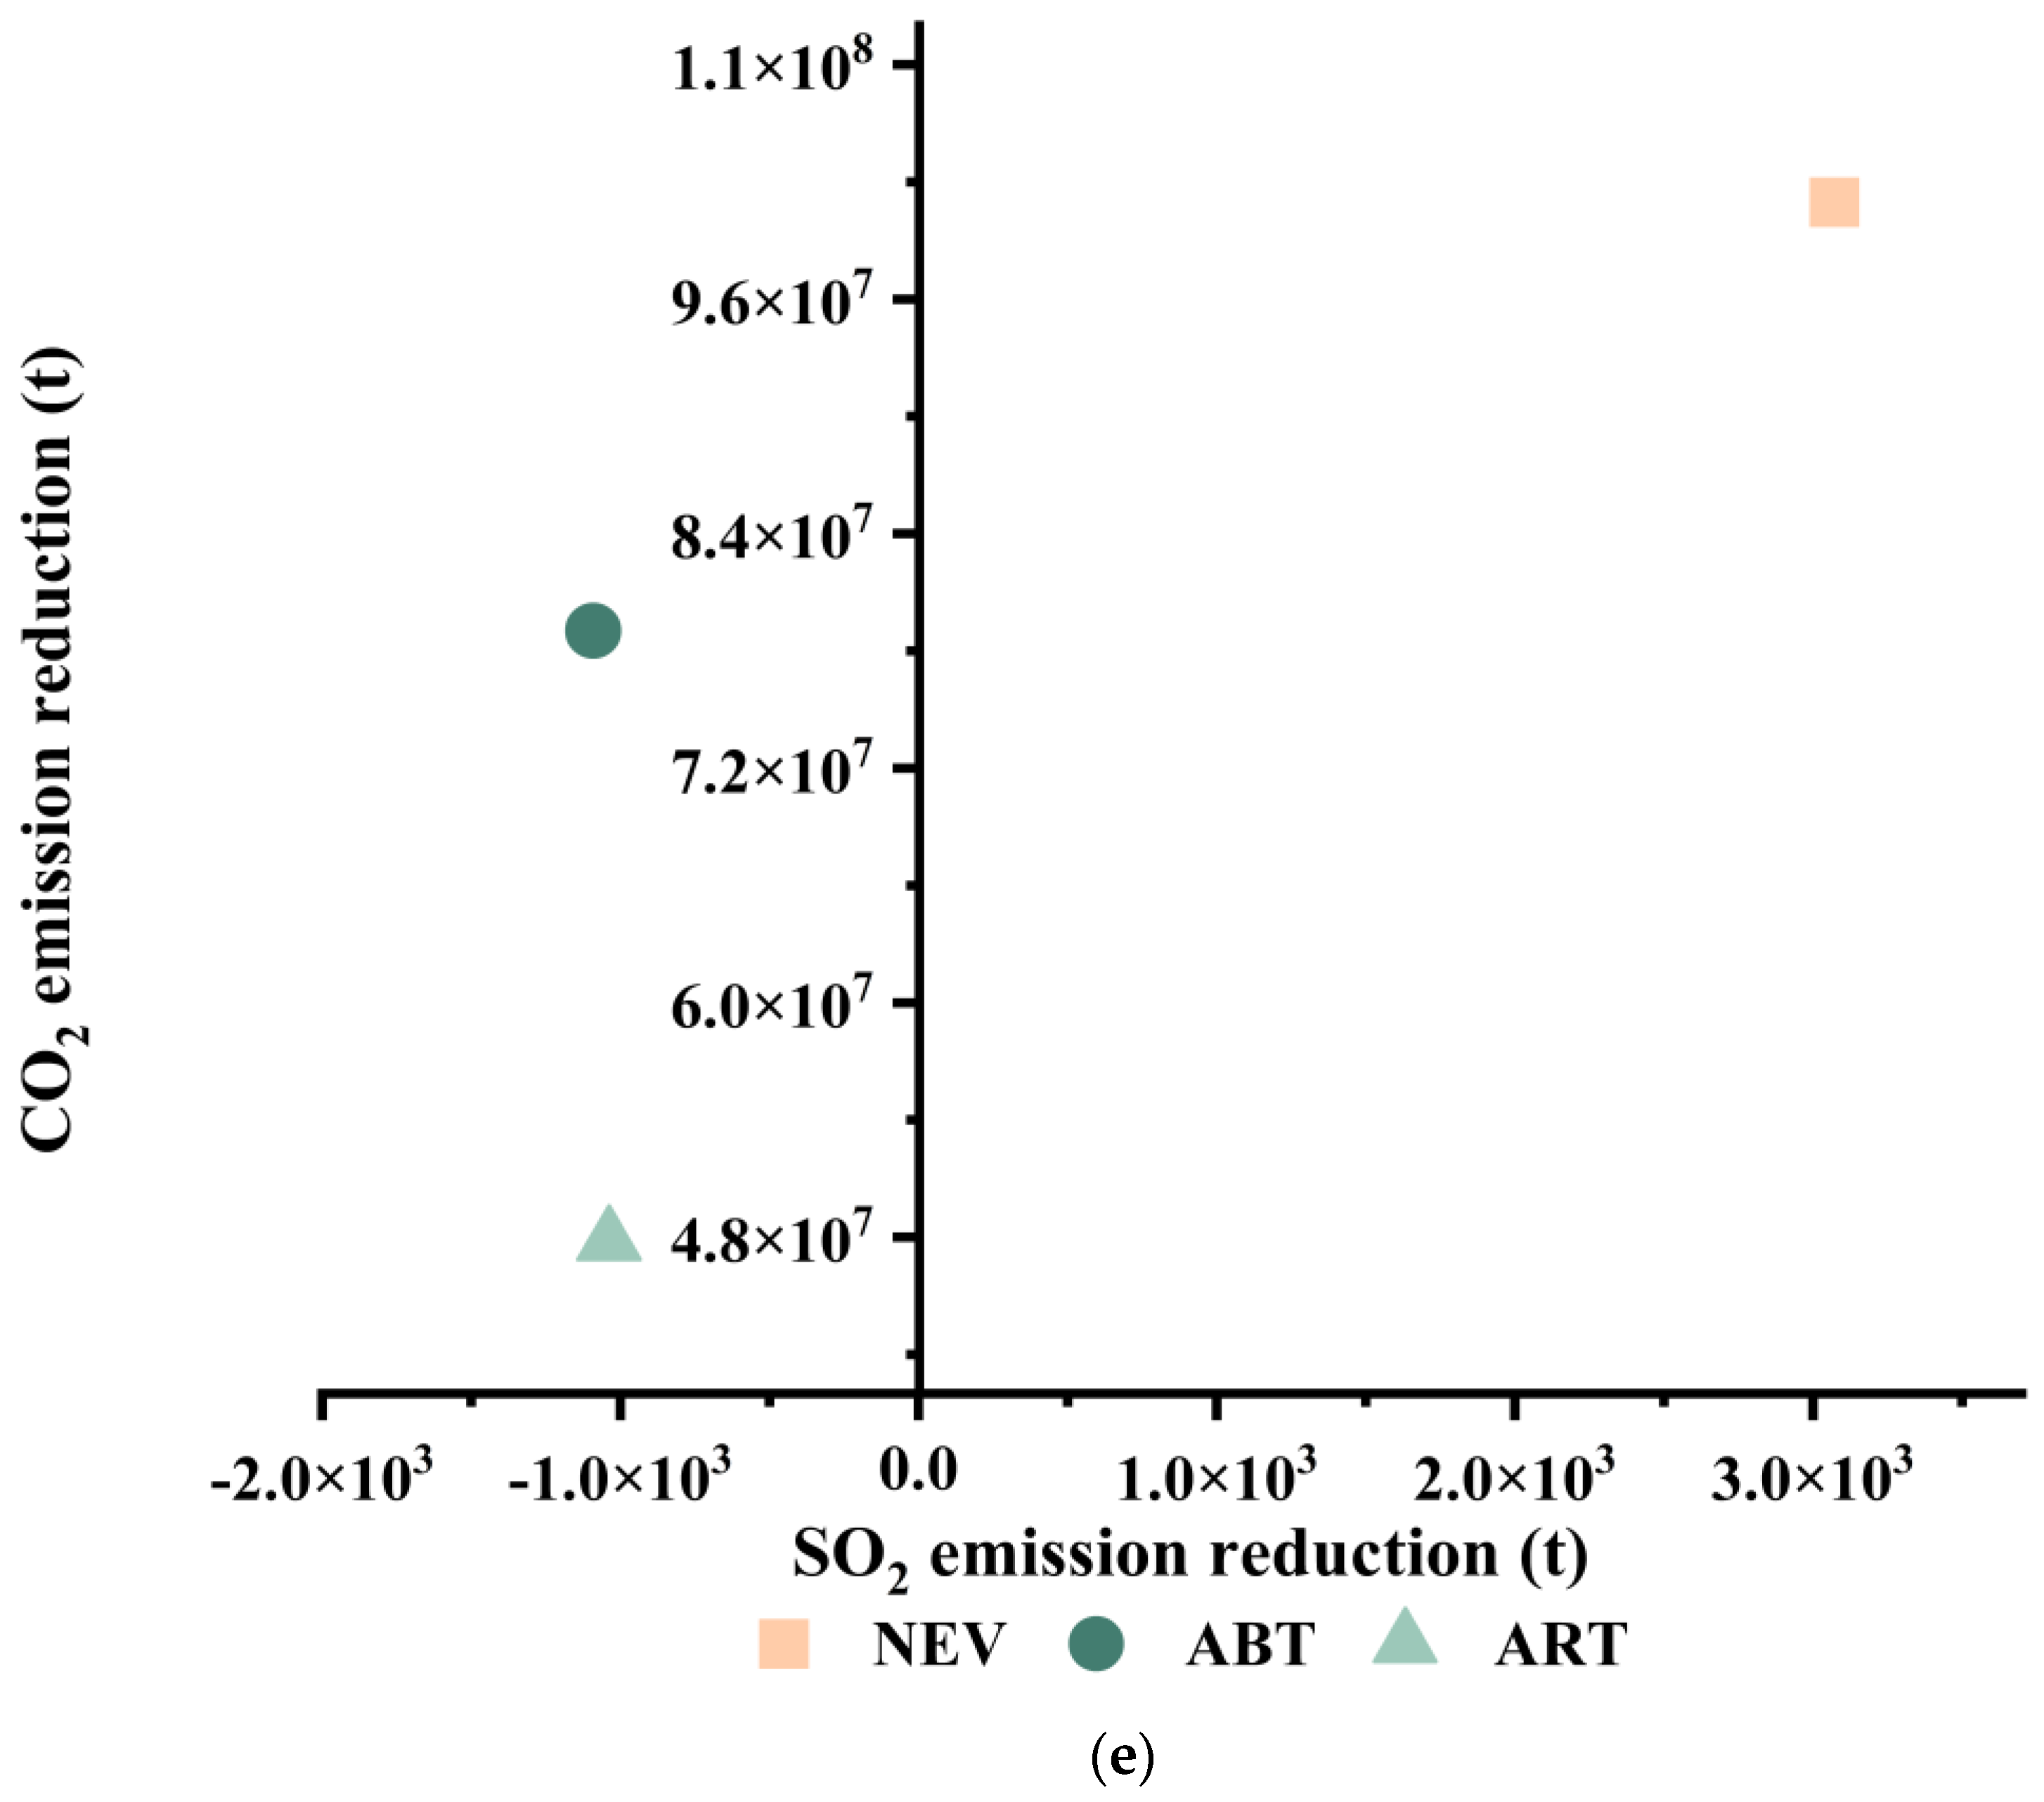
Figure 3.
Synergy and co-benefits according to the coordinate system of CO, NOx, NMHC, PM10, SO2, and CO2 under the three emission reduction policies in 2023. The abscissa represents the emission reduction effect of the measure on a specific air pollutant, while the ordinate indicates the emission reduction effect on CO2. (a) CO, (b) NOx, (c) NMHC, (d) PM10, (e) SO2.
It is evident from the coordinate system that the coordinates for the air pollutants CO, NOx, PM10, and NMHC, resulting from the promotion of new energy vehicles (NEVs) and the advancement of rail transit (ART), are all located in the first quadrant. This indicates that both policies can bring about synergistic control of CO2, CO, NOx, PM10, and NMHC, reducing greenhouse gas emissions while also decreasing the emission of air pollutants, thus generating a positive synergistic effect. Furthermore, for the pollutant SO2, the only point located in the first quadrant is the policy promoting the use of new energy vehicles (NEVs), and this policy’s position in the coordinate system for the synergistic control of other air pollutants is higher than that of the other two policies. This suggests that this policy brings about a better synergistic control effect for CO2 and the other five types of air pollutants, which aligns with the calculation results of the synergistic emission reduction equivalents in Section 3.2, indicating that the policy promoting new energy vehicles (NEVs) has a relatively higher priority. The points for the NOx and SO2 pollutants, advocated through the bus travel policy (ABT), are located in the second quadrant of the coordinate system, indicating that this policy does not produce a positive synergistic effect on CO2 and the aforementioned pollutants. Although it reduces CO2 emissions, it indirectly increases the emission of air pollutants.
The air pollutants that can achieve a synergistic effect of reducing pollution and carbon emissions under all three policies are CO, NMHC, and PM10. For these three types of pollutants, the points are located in the first quadrant of the coordinate system. As for SO2, except for the promotion of new energy vehicles (NEVs) where the point is in the first quadrant, the points for the other two policies are in the second quadrant. This indicates that while the other two emission reduction policies bring about CO2 emission reductions, they exacerbate SO2 emissions, without producing a positive synergistic effect. Among them, the SO2 produced by rail transit is not significantly different from that produced by buses, but it is slightly lower.
3.3.2. Analysis of Cross-Elasticity of Pollutant Emission Reduction
Using the formula for the cross-elasticity coefficient of pollutant emission reductions, the elasticity coefficients of CO2 with respect to CO, NOx, PM10, NMHC, and SO2 under three emission reduction policies in the transportation sector can be calculated. The specific results are presented in the Table 4 below.
Table 4.
Summary of cross elasticity Elsa/b of pollutant emission reduction for three emission reduction measures in the transportation industry.
Among them, Elsc/c1, Elsc/n, Elsc/p1, Elsc/h, and Elsc/s represent the cross-elasticity coefficients of CO, NOx, PM10, NMHC, and SO2, respectively. Table 4 indicates that the elasticity coefficients for CO, NOx, PM10, and NMHC in the promotion of new energy vehicles (NEVs) are all greater than 0 and fall between 0 and 1. This suggests that the promotion of new energy vehicles (NEVs) has a higher degree of collaborative control over these types of air pollutants compared to CO2. Furthermore, the SO2 cross-elasticity coefficient for this policy is greater than 1, indicating that the policy of replacing fuel vehicles with new energy vehicles can lead to collaborative emission reductions in both SO2 and CO2, with a greater impact on CO2 reduction than on SO2 collaborative control. The policy advocating for bus transit (ABT) exhibits diverse collaborative control effects for different pollutants. The elasticity coefficients for CO, NMHC, and PM10 are all greater than 0, but the coefficients for CO and NMHC are less than 1. This suggests that this policy can simultaneously produce collaborative control over CO2 reduction for these three pollutants, with a higher degree of collaborative control for CO and NMHC than for CO2. The elasticity coefficients for NOx and SO2 in the policy promoting bus transit (ABT) are both less than 0, indicating that as of 2023, the substitution of private cars with bus transit has not effectively controlled the emissions of these two pollutants and does not exhibit collaborative emission of CO2. The policy promoting rail transit (ART) shows relatively stable elasticity coefficients for different pollutants. Except for SO2, which has a negative value, the elasticity coefficients for the other four pollutants fall between 0 and 1. This suggests that taking rail transit does not lead to collaborative control over SO2 and CO2, but it can simultaneously control CO, NOx, PM10, NMHC, and CO2, exhibiting a positive collaborative effect. Furthermore, the policy’s collaborative control effect on the four pollutants is superior to that on CO2.
4. Results
This study evaluated the synergistic effects of three transportation policies (NEVs, ABT, and ART) on multiple pollutants and CO2 through an integrated framework combining synergy control coordinates, cross-elasticity coefficients, and APeq normalization.
The policy synergy effect varies significantly. The results demonstrate that NEV policies achieve the highest comprehensive benefits (APeq = 166,734.52), with synergistic reductions covering all five air pollutants and CO2, outperforming rail transit (APeq = 97,414.89) and bus transit (APeq = 19,796.80). Notably, bus and rail transit policies increased SO2 emissions by 2129.03 tons in 2023 due to coal-dominated power structures, highlighting the critical role of grid decarbonization in cross-sectoral governance. Compared to existing studies [25], the dynamic framework of this research reveals non-linear sensitivity disparities between air pollutants and CO2 reductions (through cross-elasticity coefficients), offering new insights for multi-objective policy optimization.
Based on the calculation results of the normalized collaborative emission reduction equivalent (APeq), an assessment of the synergistic effects of the three major policies on pollution reduction and carbon reduction was conducted, leading to the conclusion that the development priority is “NEV > ART > ABT”. Considering the comprehensive conditions of overall emission reduction and the effectiveness of emission reduction, promoting new energy vehicles (NEVs) can reduce both air pollutants and greenhouse gases, offering the best synergistic benefits.
In 2023, the coordinate points for the coordinated control effect of SO2 and CO2 emissions from rail transit (ART) and buses (ABT) were located in the second quadrant, indicating that these two policies can reduce carbon emissions, but, at the same time, they increased SO2 emissions (a total of 2129.03 tons of SO2 emissions from rail and buses transit). This reflects that the reliance on coal-fired power remains a core bottleneck. To achieve the coordinated emission reduction effect of SO2 and CO2, it is first necessary to address the emission of pollutants at the power plant end.
5. Discussion
Policy Optimization Paths and Priorities: The policy measures for achieving collaborative control of greenhouse gases and air pollutants in the transportation sector should prioritize the development of new energy vehicles as a replacement for fuel-powered private cars. National and local government subsidies will positively incentivize the proportion of urban new energy private cars and infrastructure investment, maximizing the environmental benefits of pure electric vehicles and achieving greenhouse gas emission reduction effects.
We should adjust the energy structure and focus on increasing the proportion of green electricity. Measures such as adopting clean energy generation in the power industry and reducing the proportion of fossil energy use can change the emission factors of electricity. By breaking through with cross-regional green electricity trading and energy storage technology, the cleanliness of electricity can be achieved, reducing the power emissions from new energy buses and rail transit. This will promote the use of new energy buses and rail transit, thereby achieving the effect of reducing CO2 and air pollutant emissions.
We should increase the proportion of new energy buses and address policy implementation heterogeneity. Additionally, we should mandate the withdrawal of high-emission diesel vehicles from the market, enhance public awareness of low-carbon travel, and implement certain incentives for choosing public transportation, thereby increasing the ridership rate of public transportation. The penetration rate of new energy vehicles in the western region is less than 50% of that in the eastern region. It is recommended to establish differentiated regional targets, such as prioritizing the development of electric buses with hydropower support in the southwest region.
Based on the comprehensive analysis of the aforementioned research conclusions, and after comparing the three major emission reduction policies currently implemented in the national transportation industry, it is concluded that the promotion of new energy vehicle policies (NEVs) possesses a comprehensive synergistic effect in reducing both air pollutants and greenhouse gases, thus having a higher priority for policy development. Meanwhile, advocating bus transit (ABT) and advancing rail transit policies (ART) only achieve a synergistic emission reduction effect for certain air pollutants and greenhouse gases. The research results further indicate that, if we are to vigorously develop new energy travel modes, it is imperative to have a supporting clean energy structure and public facility construction, thereby maximizing the emission reduction effects brought about by the emission reduction policies. Empirical findings suggest prioritizing NEV adoption by charging infrastructure investments and region-specific subsidies, alongside green power quota mechanisms for buses and rail transit to reduce coal dependency. Future research should quantify regional heterogeneity using provincial grid factors and traffic data and extend to multi-GHG synergy analysis (e.g., CH4, N2O) to inform granular policy design.
Author Contributions
J.Z. is responsible for writing the article and data collection; P.J. provided guidance for article writing and provided supervision of the process of this study; Y.C. assisted in receipt collection and provided guidance for article writing. All authors have read and agreed to the published version of the manuscript.
Funding
This research was funded by the Shanghai Science and Technology Commission (23ZR1404100), the Sino-German Center (M-0049), and Fudan Tyndall Centre of Fudan University (IDH6286315).
Acknowledgments
We would like to acknowledge the support from the founders and also thank the researchers and institutes for their help and support for this work.
Conflicts of Interest
The authors declare no conflicts of interest.
References
- Wang, Y.; Guo, C.H.; Chen, X.J.; Jia, L.Q.; Guo, X.N.; Chen, R.S.; Zhang, M.S.; Chen, Z.Y.; Wang, H.D. Carbon peak and carbon neutrality in China: Goals, implementation path, and prospects. China Geol. 2021, 4, 720–746. [Google Scholar] [CrossRef]
- Zeng, N.; Jiang, K.J.; Han, P.F.; Hausfather, Z.; Cao, J.J.; Kirk-Davidoff, K.; Ali, S.; Zhou, S. The Chinese Carbon-Neutral Goal: Challenges and Prospects. Adv. Atmos. Sci. 2022, 39, 1229–1242. [Google Scholar] [CrossRef]
- 2023 China Greenhouse Gas Bulletin. Available online: https://www.cma.gov.cn/zfxxgk/gknr/qxbg/202412/t20241209_6734975.html (accessed on 9 December 2024).
- Ou, X.M.; Yuan, Z.Y. Development Paths for China’s Transport Sector under the Carbon Neutrality Goal. Chin. J. Urban Environ. Stud. 2022, 10, 41–56. [Google Scholar] [CrossRef]
- Wu, X.F.; Harrison, R.M.; Yan, J.; Wu, T.R.; Shen, Y.; Cui, Y.Y.; Liu, X.Y.; Yi, H.W.; Shi, Z.B.; Xue, Y.F. Present and future emission characteristics of air pollutants and CO2 from the Beijing transport sector and their synergistic emission reduction benefits. Atmos. Pollut. Res. 2023, 14, 101844. [Google Scholar] [CrossRef]
- Wang, B.; Wang, Y.F.; Zhao, Y.Q. Collaborative Governance Mechanism of Climate Change and Air Pollution: Evidence from China. Sustainability 2021, 13, 67–85. [Google Scholar] [CrossRef]
- Shang, H.R.; Sun, Y.T.; Huang, D.S.; Meng, F.X. Life cycle assessment of atmospheric environmental impact on the large-scale promotion of electric vehicles in China. Resour. Environ. Sustain. 2024, 15, 2666–9161. [Google Scholar] [CrossRef]
- Xie, Y.; Wu, D.S.; Zhu, S.J. Can new energy vehicles subsidy curb the urban air pollution? Empirical evidence from pilot cities in China. Sci. Total Environ. 2021, 754, 0048–9697. [Google Scholar] [CrossRef]
- Peng, J.Y. Research on the Impact of New Energy Vehicles on China’s Industrial Policy Innovation. In Proceedings of the 6th International Conference on Economic Management and Green Development (Part7), San Francisco, CA, USA, 8 June 2022; The University of Western: London, ON, Canada, 2023; Volume 4, pp. 6–13. [Google Scholar]
- Feng, X.Z.; Cai, B.F. A Review on Policies of Reducing Carbon Emission in China’s Urban Road Transport System. China Popul. Resour. Environ. 2012, 22, 10–15. (In Chinese) [Google Scholar]
- Zhang, L.H.; Wang, L.W.; Chai, J.X. Influence of new energy vehicle subsidy policy on emission reduction of atmospheric pollutants: A case study of Beijing, China. J. Clean. Prod. 2020, 275, 124069. [Google Scholar] [CrossRef]
- Li, J.C.; Jiang, M.R.; Li, G. Does the New Energy Vehicles subsidy policy decrease the carbon emissions of the urban transport industry? Evidence from Chinese cities in Yangtze River Delta. Energy 2024, 298, 131322. [Google Scholar] [CrossRef]
- Zahoor, A.; Mehr, F.; Mao, G.Z.; Yu, Y.J.; Sápi, A. The carbon neutrality feasibility of worldwide and in China’s transportation sector by E-car and renewable energy sources before 2060. J. Energy Storage 2023, 61, 106696. [Google Scholar] [CrossRef]
- Xue, L.L.; Liu, D.Z. Towards Carbon Neutrality: Medium—And Long-Term Emission Reduction Strategies for China’s Road Transport Sector, 2nd ed.; World Resources Institute: Beijing, China, 2022; pp. 7–19. (In Chinese) [Google Scholar]
- Lu, F.Q.; Hao, H.J.; Bi, H.L. Evaluation on the development of urban low-carbon passenger transportation structure in Tianjin. Res. Transp. Bus. Manag. 2024, 55, 101142. [Google Scholar] [CrossRef]
- Wei, L.H.; Chang, C.Z.; Wei, P.H. Research on Development Strategies of China Urban Public Transport. Appl. Mech. Mater. 2015, 744–746, 2086–2089. [Google Scholar] [CrossRef]
- Ding, L.Y.; Qian, Y.; Wang, W.J.; Qiao, G.L. Current Situation of Energy Saving and Emission Reduction of Urban Public Transportation and Green Development Suggestion. In Proceedings of the 2016 International Conference on Intelligent Transportation, Big Data & Smart City (ICITBS), Changsha, China, 17 September 2016; pp. 14–17. [Google Scholar]
- Wang, Z.G.; Wang, J.Y.; He, D.Q. Transit Policies and Potential Carbon Dioxide Emission Impacts Some Insights from China’s Recent Transit Priority Policies. Transp. Res. Rec. 2012, 2287, 98–104. [Google Scholar] [CrossRef]
- Yu, Y.Y.; Luo, Q.Y.; Gong, S.R.; Zhao, Q.H.; Zhao, H.F.; You, H.J. Analysis of Carbon Peaking Action Policies in Transportation Sector in China. In Proceedings of the 2023 Panda Forum on Power and Energy (PandaFPE), Chengdu, China, 27 April 2023; pp. 1663–1667. [Google Scholar]
- Wei, B.X.; Liu, X.H. Regional differences, influencing factors, and governance policy options for air pollutants: A comparative analysis based on the Yangtze River Delta, Beijing-Tianjin-Hebei region, and the Pearl River Delta. Bull. Sci. Technol. 2019, 35, 197–202. (In Chinese) [Google Scholar]
- Hanaoka, T.; Masui, T. Exploring effective short-lived climate pollutant mitigation scenarios by considering synergies and trade-offs of combinations of air pollutant measures and low carbon measures towards the level of the 2 °C target in Asia. Environ. Pollut. 2020, 261, 113650. [Google Scholar] [CrossRef]
- Zheng, J.J.; Sun, X.; Zhang, M.Y.; Jiang, P.; Zhu, Y.; Gao, S. Review of Researches on the Synergistic Effect of GHGs Mitigation and Air Pollution Control at Home and Abroad. Ecol. Econ. 2015, 31, 133–137. (In Chinese) [Google Scholar]
- Wang, C.D.; Duan, W.J.; Cheng, S.Y.; Lang, J.L.; Hou, X.S. Synergistic effects and optimal control strategies of air pollutant and carbon emission reduction from mobile sources. J. Clean. Prod. 2024, 478, 143824. [Google Scholar] [CrossRef]
- Li, S.Y.; Wang, S.X.; Wu, Q.R.; Zhao, B.; Jiang, Y.Q. Integrated Benefits of Synergistically Reducing Air Pollutants and Carbon Dioxide in China. Environ. Sci. Technol. 2024, 58, 14193–14202. [Google Scholar] [CrossRef]
- Zeng, Q.G.; He, L.Y. Study on the synergistic effect of air pollution prevention and carbon emission reduction in the context of “dual carbon”: Evidence from China’s transport sector. Energy Policy 2023, 173, 113370. [Google Scholar] [CrossRef]
- Bian, Y.H.; Lin, J.Y.; Han, H.; Lin, S.F.; Li, H.Q.; Chen, X. Mitigation synergy and policy implications in urban transport sector: A case study of Xiamen, China. Environ. Res. Lett. 2023, 18, 084030. [Google Scholar] [CrossRef]
- Jiao, J.D.; Huang, Y.; Liao, C.P. Co-benefits of reducing CO2 and air pollutant emissions in the urban transport sector: A case of Guangzhou. Energy Sustain. Dev. 2020, 59, 131–143. [Google Scholar] [CrossRef]
- Li, Y.Y.; Song, Y.D. Study on the Synergistic Reduction Effect of CO2 and Air Pollutants from Mobile Sources on Beijing Urban Roads under the Carbon Neutrality Goal. Chin. J. Environ. Manag. 2021, 13, 113–120. (In Chinese) [Google Scholar]
- The State Council Deploys Ten Major Actions for Energy Conservation and Carbon Reduction. Available online: https://www.mot.gov.cn/jiaotongyaowen/202405/t20240531_4141801.html (accessed on 31 May 2024).
- Analysis of the Development Statu of China’s Power Industry in 2017. Available online: http://www.nea.gov.cn/2018-01/22/c_136914154.htm (accessed on 22 January 2018).
- Notice on Accepting Application for Technical Identification of Fuel Saving Rate and Maximum Electric Power Ratio of Energy-Saving and New Energy Vehicles. Available online: https://www.docin.com/p-2398249671.html (accessed on 7 May 2020).
- China Automotive Technology Research Center. Energy Conservation and New Energy Automobile Development Report, 3rd ed.; People’s Posts and Telecommunications Press: Shanghai, China, 2017; pp. 6–11. [Google Scholar]
- Che, Z.H. Study on fuel consumption, energy consumption and emission of plug-in hybrid electric city bus. Mech. Electr. Technol. 2013, 36, 32–34+55. (In Chinese) [Google Scholar]
- Baseline Emission Factors for Regional Power Grids in China. Available online: https://www.mee.gov.cn/ywgz/ydqhbh/wsqtkz/201812/W020181220585203933181.pdf (accessed on 8 July 2024).
- Ambient Air Quality Standards. Available online: https://www.mee.gov.cn/ywgz/fgbz/bz/bzwb/dqhjbh/dqhjzlbz/201203/t20120302_224165.shtml (accessed on 29 February 2012).
- The Number of Motor Vehicles in China Has Reached 290 Million. Available online: https://www.gov.cn/xinwen/2017-01/11/content_5158647.htm (accessed on 11 January 2017).
- Development Plan for New Energy Vehicle Industry (2021–2035). Available online: https://www.gov.cn/zhengce/zhengceku/2020-11/02/content_5556716.htm (accessed on 2 November 2020).
- Green Transportation Development Plan for the 14th Five Year Plan. Available online: https://www.gov.cn/zhengce/zhengceku/2022-01/21/content_5669662.htm (accessed on 29 October 2021).
- Statistical and Analysis Report on Urban Rail Transit in 2023. Available online: https://www.camet.org.cn/xytj/tjxx/14894.shtml (accessed on 29 March 2024).
Disclaimer/Publisher’s Note: The statements, opinions and data contained in all publications are solely those of the individual author(s) and contributor(s) and not of MDPI and/or the editor(s). MDPI and/or the editor(s) disclaim responsibility for any injury to people or property resulting from any ideas, methods, instructions or products referred to in the content. |
© 2025 by the authors. Licensee MDPI, Basel, Switzerland. This article is an open access article distributed under the terms and conditions of the Creative Commons Attribution (CC BY) license (https://creativecommons.org/licenses/by/4.0/).