Article

Modeling an All-Copper Redox Flow Battery for Microgrid Applications: Impact of Current and Flow Rate on Capacity Fading and Deposition

1
NVISION, Sabino de Arana 14, 08028 Barcelona, Spain
2
IREC, Jardins de les Dones de Negre 1, 2ª pl, Sant Adrià del Besòs, 08930 Barcelona, Spain
3
Department of Automatic Control, Robotic and Vision, Universitat Politècnica de Catalunya, C. Jordi Girona, 08034 Barcelona, Spain
4
Department of Chemistry and Materials Science, School of Chemical Engineering, Aalto University, 00076 Aalto, Finland
*
Author to whom correspondence should be addressed.
Energies 2025, 18(8), 2084; https://doi.org/10.3390/en18082084
Submission received: 20 February 2025 / Revised: 9 April 2025 / Accepted: 11 April 2025 / Published: 17 April 2025
(This article belongs to the Special Issue Power Quality and Hosting Capacity in the Microgrids)

Abstract

:
The copper redox flow battery (CuRFB) stands out as a promising hybrid redox flow battery technology, offering significant advantages in electrolyte stability. Within the CuBER H-2020 project framework, this study addresses critical phenomena such as electrodeposition at the negative electrode during charging and copper crossover through the membrane, which influence capacity fading. A comprehensive two-dimensional physicochemical model of the CuRFB cell was developed using COMSOL Multiphysics, providing insights into the distribution of electroactive materials over time. The model was validated against experimental cycling data, demonstrating a Root Mean Square Error (RMSE) of 0.0212 in voltage estimation. Least-squares parameter estimation, utilizing Bound Optimization by Quadratic Approximation, was conducted to determine active material diffusivities and electron transfer coefficients. The results indicate that higher current densities and lower flow rates lead to increased copper deposition near the inlet, significantly impacting the battery’s State of Health (SoH). These findings highlight the importance of considering fluid dynamics and ion concentration distribution to improve battery performance and longevity. The study’s insights are crucial for optimizing and scaling up CuRFB operations, guiding potential cell-scale-up strategies into stack-level configurations.

1. Introduction

During the last two centuries, greenhouse gases have increased exponentially as a result of the energy dependence on fossil fuels [1,2]. Is there a way to reverse this trend? The integration of renewables into the electricity grid is one of the recent answers to this problem. However, these new technologies, such as solar panels and wind turbines, generate energy intermittently [3]. They cannot generate energy on demand. Energy storage systems (ESSs) are one of the solutions to this issue [4]. Redox flow batteries (RFBs) are a part of these systems, with the capability to store large amounts of energy efficiently. In these systems, the electrochemical conversion of chemical energy occurs using two liquid electrolytes with distinct redox states. Oxidation and reduction reactions occur during discharge at the anode and cathode, respectively. Electron transfer occurs through an external circuit. During charge, these reactions reverse, and the flow of the electrolytes remains in the same direction [5]. The reversible electrochemical reactions of these redox species enable efficient energy storage and release, offering a scalable and durable solution for grid-level energy storage applications [6,7,8]. Vanadium redox flow batteries (VRFBs) are the most mature and widely installed type of redox flow batteries (RFBs) [5]. However, in recent years, the aqueous All-Copper Redox Flow Battery (CuRFB) has attracted significant attention due to its low cost, high solubility, energy efficiency, ease of electrolyte manufacturing, and rebalancing. CuRFBs are able to use electrolytes that can exceed a 3 M in Cu concentration compared to the typical 1–1.5 M concentrations achievable with VRFBs and Iron Redox Flow Batteries (IRFBs), greatly increasing the energy density of the electrolyte, which typically reduces costs of auxiliary systems such as the pumps, tanks, and containment and reduces the footprint significantly. Additionally, the pH of the CuRFB is typically <1, with this highly acidic electrolyte being highly conductive and effectively reducing the system’s ohmic resistance and thereby reducing inefficiencies. Combined with the high solubility and low pH, the electrolyte used for CuRFB is stable at elevated temperatures compared to that of the VRFB, which may form precipitates at temperatures above 50 °C. However, CuRFB electrolytes are stable at higher temperatures and thus achieving higher efficiency due to the lack of a need for auxiliary cooling systems to maintain the electrolyte temperature. These benefits, together with the future potential of the technology, underlie the need for continued research and optimization of the CuRFB to investigate its suitability as an ESS for the renewable energy transition.
These advantages make CuRFBs a promising option for renewable energy integration, grid stabilization, and off-grid energy storage [9,10,11,12]. Recent improvements in CuRFB performance have been achieved through optimized membranes, electrode modifications, and operational adjustments, significantly reducing the self-discharge rate and extending maintenance-free operation [13,14]. The only modeling contribution for CuRFBs is from Badenhorst et al. [15], who developed a dynamic electrochemical model. This model performs well on short timescales, accurately predicting the State of Health (SoH), but it struggles with accuracy over multiple cycles due to unmodeled electrodeposition and electro-stripping dynamics.
Modeling the physics of these systems is crucial for understanding the limiting phenomena within the battery, which in turn enhances cell design and performance. Numerical modeling has extensively explored RFB performance under various conditions, primarily focusing on VRFBs due to their widespread use. Shah et al. [16] developed a 2D model to study the effects of electrolyte concentration, flow rate, and electrode porosity in VRFBs, later extending it to include hydrogen [17] and oxygen evolution [18]. Other models incorporated Donnan potential [19,20,21,22] and temperature gradients [23], providing valuable insights for optimization. The latest research focused on non-aqueous RFBs as a possibility to leverage the voltage potential [24].
Recent studies on hybrid RFBs have also advanced our understanding. Amini and Pritzker [25] focused on zinc–cerium RFBs, validating their model with experimental data. Xu et al. [26] examined the serpentine flow field’s impact on zinc–bromine RFB efficiency. Chen et al. [27] modeled zinc–iron RFBs to assess the effects of operating conditions on performance.
All these hybrid RFB models provide a solid foundation for addressing the knowledge gap in modeling CuRFBs.
This study aims to develop and validate a comprehensive two-dimensional model of an all-copper RFB. It analyzes species crossover and the effects of different currents on copper deposition and capacity fading, providing a solid foundation for scaling up or better controlling the operation of such batteries. With the ultimate aim of providing an electrochemical model that can be used to effectively simulate a CuRFB in different use cases such as microgrids and enables insights for predictive management by predicting properties such as State of Health (SOH), voltage response, and capacity, and enable deeper integration within microgrids by being able to predict the batteries’ responses to grid needs.

2. Materials and Methods

The small-scale redox flow battery setup is described in earlier works [13], and used retrofitted PermeGear diffusion cells, with the system being operated at 60 [°C], 1 M CuCl and 6 M HCl, and a current density of 20 [mA/cm2], with the data being available in earlier works using an Anion Exchange Membrane (FAP-330, Fumatech, Bietigheim-Bissingen, Germany) as the separator together with carbon electrodes due to their high stability and large overpotential to hydrogen evolution [15].

2.1. Electrochemical Reactions

All-copper-based redox flow batteries present critical chemical processes that come into play. CuRFBs depend on a reversible redox mechanism similar to that in the vanadium redox flow battery (VRFB). During the charging phase at the positive electrode shown in Figure 1, C u + ions undergo oxidation, transforming into C u 2 + ions:
C u + Discharge Charge C u 2 + + e ; E 0 = 0.158 V
In contrast, at the negative electrode, during charging, C u + ions undergo reduction, transitioning into solid C u :
C u + + e Discharge Charge C u ; E 0 = 0.522 V
It is worth noting that the negative carbon electrode is flat. On the other hand, the positive electrode is a carbon felt, occupying the positive channel.

2.2. Side Reactions

A chemical reaction called the comproportionation reaction, Equation (3), may occur during charge [14]. If the C u 2 + crosses the membrane from the positive electrode to the negative, reacting with the solid C u , it will produce 2 C u + at the negative electrode. This means that a capacity fade will occur due to a chemical reaction.
C u 2 + + C u 2 C u +

3. Numerical Modeling

3.1. Assumptions

Figure 1 illustrates the two-dimensional geometry of the All-Copper Redox Flow Battery system used in our study. The diagram highlights the key components, including the negative channel, anion exchange membrane, and positive porous electrode. The system is defined along the thickness of the battery, where the X-axis spans from x = 0 to x = x 3 and the Y-axis represents the flow direction from y = 0 to y = H . The negative channel, located in the region of 0 < x x 1 , serves as the site for copper deposition during charging. The solid copper is deposited between the flat negative electrode, positioned at x = 0 , and the anion exchange membrane, positioned at x = x 1 . The membrane, which lies in the region x 1 x x 2 , plays a critical role in separating the negative and positive electrodes, ensuring the efficient ion transfer during the electrochemical reactions. The positive porous electrode extends from x 2 x x 3 and allows for the copper to be reduced and stored. In this configuration, the flow occurs along the Y-axis from y = 0 to y = H , representing the direction of fluid flow through the system. This two-dimensional model simplifies the complex geometry of the flow battery while capturing the essential features that govern its electrochemical performance. The assumptions considered in this model are as follows.
1.
Both electrolytes are incompressible and have constant fluid flows.
2.
The dilute solution theory is applied to both electrolytes.
3.
The anion exchange membrane is permeable to all species. Indeed, the crossover of other ions is taken into account.
4.
Effects of gravity are not considered.
5.
The battery operates under isothermal conditions.
6.
Chemical reactions occur at the negative electrode and are considered for the first time in this work.
7.
The evolution of hydrogen and oxygen is neglected since the battery operates inside the water window potential.
8.
The tertiary current distribution is applied to all three battery domains: the electrodes and the membrane.
9.
Ion activities are taken into account

3.2. Transport in Negative Channel, Positive Electrode, and Membrane

The transport of species in the electrolyte of a CuRFB, which is a mixture of liquids that includes charged species, can be numerically simulated considering the equations of species, mass, momentum, and electrochemical reactions. These equations are based on a set of continuity equations (microscopic mass conservation) for each chemical species i = C u + , C u 2 + , H + , C l , along with the electroneutrality condition. The mass conservation equation for each species in CuRFB can be expressed as
ϵ c i t + N k = S i
where c i is the concentration of the species, ϵ is the porosity of the medium (which is one in the negative channel), N i is the molar flux of the species, and S i is the source term due to electrochemical reaction taking place on the electrode (which is zero for the membrane and negative channel because no reaction occurs there).
The molar flux of each species is calculated using the Nernst–Planck equation. This equation accounts for transport by convection, migration, and diffusion, starting from the right side and moving to the left.
N i = D i eff ( c i + c i l n f i ) c i U i eff ϕ + v c i
where D i eff is the effective diffusion coefficient, ϕ is the electrolyte potential, U i eff is the ionic mobility, and v is the electrolyte velocity (which is zero in the membrane). The activity coefficient f i of species (i) adjusts for non-ideal behavior in the solution. It modifies the concentration to reflect the effective concentration of the species, taking into account interactions with other ions or molecules in the solution. The effective diffusion coefficient D i eff of the species can be calculated using the Bruggemann equation. In the negative channel, D i eff = D i since no porous medium is present
D i eff = ϵ 1.5 D i
According to the dilute solution approximation, the ionic mobility U i eff can be calculated using the Nernst–Einstein equation:
U i eff = F z i R T D i eff
where z i is the ionic charge of the chemical species, F is the Faraday’s constant, T is the temperature, and R is the ideal gas constant.
The electroneutrality condition is imposed on the concentrations of the species within the electrolyte. The system consists of N = 4 equations, which are supplemented by the electroneutrality condition. This condition ensures that the total charge of all species at any given point in space is zero. Consequently, the system of N + 1 equations (comprising N mass balance equations and the electroneutrality condition) fully characterizes the transport process. This allows for the determination of N concentration profiles, c i , and the electric potential profile, ϕ , within the electrolyte.
i = 1 N z i c i = 0
The membrane is permeable to all the ions present in the two electrodes. The crossover of C l maintains the electroneutrality of both electrolytes as the electrode reactions occur. The membrane contains a certain concentration c m = 2.8 [M] of fixed fluorinated sites with a positive charge of z f = + 1 . This concentration generates a fixed charge ρ f i x taken into the electroneutrality Equation (9).
ρ f i x + F k , j z k , j c k , j = 0
ρ f i x = F c m

3.3. Electrochemical Kinetics

Chemical reactions occur at the interface between the solid particles of the porous electrodes and the electrolyte. The kinetics of these electrode reactions, represented by Equations (1) and (2), are governed by the Butler–Volmer equation.
i pos = a i pos , 0 f C u + c Cu + , s c Cu + exp α pos F R T η pos f C u 2 + c Cu 2 + , s c Cu 2 + exp ( 1 α pos ) F R T η pos
i n e g = a i n e g , 0 c Cu , s c Cu exp α n e g F R T η n e g f C u + c Cu + , s c Cu + exp ( 1 α n e g ) F R T η n e g
In Equations (11) and (12), a represents the specific surface area of the porous electrodes. The terms i n e g , 0 and i pos , 0 denote the reference exchange current densities. The concentrations of active species on the solid porous electrode are given by c i , s . Additionally, α stands for the charge transfer coefficient, and η indicates the overpotential at the electrodes:
η = ( ϕ s ϕ e ) E e q
where ( ϕ s ϕ e ) represents the potential difference between the solid and electrolyte phases, reflecting the actual potential in the real cell environment. The term E eq (V) denotes the equilibrium potential, which is calculated using the Nernst equation:
E e q = E 0 R T n F ln c i , r e d c i , o x
where E 0 (approximately 0.68 V) is the standard reduction potential, and n represents the number of electrons participating in the reaction.

3.4. Negative Electrode Deposition

During the charging, the C u will deposit on the negative electrode ( x = 0 ,   y = L ). The C u surface concentration can be calculated with the following equation:
c s , k t = m v j , m i m n m F
where m serves as an index representing a redox reaction, and v j , m denotes the stoichiometric coefficient of species j in the reaction m when expressed in the reduction direction. The i m is the local current density. The total deposited thickness is calculated by
s tot = m M k ρ k c s , k
where M k is the molar mass of copper and ρ k is the density of copper.

3.5. Tanks

Each electrode in the cell is equipped with an inflow and outflow system that circulates the aqueous solution to and from separate containers serving as reservoirs. The battery charges or discharges as the reactant concentrations in these reservoirs change. As previously noted, the capacity of the RFB is directly linked to the volume and concentration of these external reservoirs. In this model, the reservoirs are represented as perfectly mixed tanks, which are described by the corresponding mass balance equations:
V e c k i n t = i n , n e g c k n · u o u t , n e g c k i n n · u
where V e is the tank volume, c k i n is the species concentration in the tank, n is the normal vector at the boundary, and i n , n e g and o u t , n e g are the inlet and outlet boundaries of the battery, respectively.

3.6. Side Reactions

The redox reaction (3), a comproportionation reaction, occurs on the negative electrode. The reaction rate R is expressed as
R = k disp [ C u + ] 2 cof [ C u ] [ C u 2 + ] K disp
where [ C u + ] is the concentration of C u + in mol / m 3 , [ C u 2 + ] is the concentration of C u 2 + in mol / m 3 , and [ C u ] is the concentration of the depositing/dissolving species C u in mol / m 2 . The rate constant k disp is in 1 / ( M · s ) , and K disp is the equilibrium constant (dimensionless). The scaling factor cof is given by
cof = ρ G max · M W
where ρ is the density, G max is the maximum surface concentration in mol / m 2 , and M W is the molecular weight of copper in g / mol .
The term [ C u + ] 2 cof represents the forward reaction rate, where C u + is produced. The term [ C u ] [ C u 2 + ] K disp represents the reverse reaction rate, where C u and C u 2 + recombine. The difference between these two terms gives the net reaction rate R.

3.7. Other Boundary Conditions

The inlet of each half-cell has a constant fluid velocity. The diffusion flux of each species is zero at the outlet of each half-cell. Furthermore, the Donnan effect is taken into account at the membrane/electrolyte interfaces in the positive and negative compartments, which calculates the potential shift over the boundary based on the membrane charge-carrying species concentration. Moreover, the continuity equation is assumed at the boundary, where each current that passes through the electrolyte must also pass through the membrane.
The battery is operated galvanostatically, with the negative electrode grounded and the current density at each electrode set to the applied current density.

4. Simulation Setup and Parameter Optimization

Table 1 provides information about the battery’s operating conditions, as well as transport and electrochemical properties. The compositions and initial concentrations mentioned in Table 2 match the conditions used in our experiments. In the positive and negative electrolytes, the initial concentration is 1 [M] of C u + with no C u 2 + ions in the positive electrolyte. To prevent division by zero during the initial time step when solving the model equations, the initial C u 2 + concentration is set to a very small value of 0.001 [M].
Species concentrations and electric fields are calculated using the model and parameters from Table 1 and Table 2. The battery cell voltage is then determined by the difference between the potentials at the positive and negative electrodes:
V cell = ϕ s , pos ϕ e , pos ϕ s , neg ϕ e , neg
The State of Charge (SoC) and SoH are calculated as defined in a previous article [15]. SoC is defined as the percentage of C u 2 + in the positive tank compared to the sum of C u + and C u 2 + in the positive tank:
SoC = c C u 2 + , pos i n c C u + , pos i n + c C u 2 + , pos i n × 100 %
SoH is defined as the percentage of C u + in the positive tank relative to the concentration of C u 2 + in the negative tank. This parameter depicts the capacity fading of the battery, mainly due to the crossover of the copper species:
SoH = c C u + , pos i n c C u + , neg i n × 100 %
The governing equations and boundary conditions, along with the specified model parameters, were solved utilizing the finite-element method through the COMSOL Multi-Physics 6.2 software package. A mesh comprising approximately 1000 quad elements was applied to the entire geometry, determined through mesh refinement assessments that compared cell voltage and concentration across various refined meshes.
The simulation was conducted with a relative tolerance of 10 3 and an absolute tolerance of 10 4 . Figure 2 shows three fitted charge–discharge voltage profiles of an all-copper-based RFB operating at 20 [mA/cm2] and 60 [°C] with an average charge duration of 3.5 h. A total of 19.5 h was spent on charges and discharges. The computational time to simulate three charge/discharge cycles amounted to approximately 20 [min], on hardware featuring an Intel64 Family 6 Model 165 Stepping 2, equipped with six cores and 31.87 [GB] of RAM.
The model was fit to the experimental data acquired from the galvanostatic charge/discharge cycles of the battery (Figure 2). A least-squares parameter estimation with Bound Optimization by Quadratic Approximation [28] was performed in a 10 h simulation using twelve adjustable parameters, as shown in Table 3. The simulation optimized the objective function to estimate the optimal parameters.
The estimated parameters are the diffusion coefficients of all the species through the membrane and the ion activities: D C u + , m , D C u 2 + , m , D H + , m , D C l , m , f C u 2 + , f C u + , f C l , and f H + . Moreover, other parameters estimated include the negative exchange current density, i n e g , 0 , positive exchange current density, i p o s , 0 , negative electron transfer coefficient, α n e g , and positive electron transfer coefficient, α p o s .
The Root Mean Square Error (RMSE) for voltage values is calculated to measure the accuracy of the model using the following equation:
RMSE = 1 n i = 1 n ( V cell i V ^ cell i ) 2
where n is the number of observations, V cell i is the actual voltage value at time i, and V ^ cell i is the predicted voltage value at time i. The summation is performed over all observations.
Finally, a simulation of the 3 cycles was conducted, resulting in an RMSE of 0.0219 volts.

5. Results and Discussion

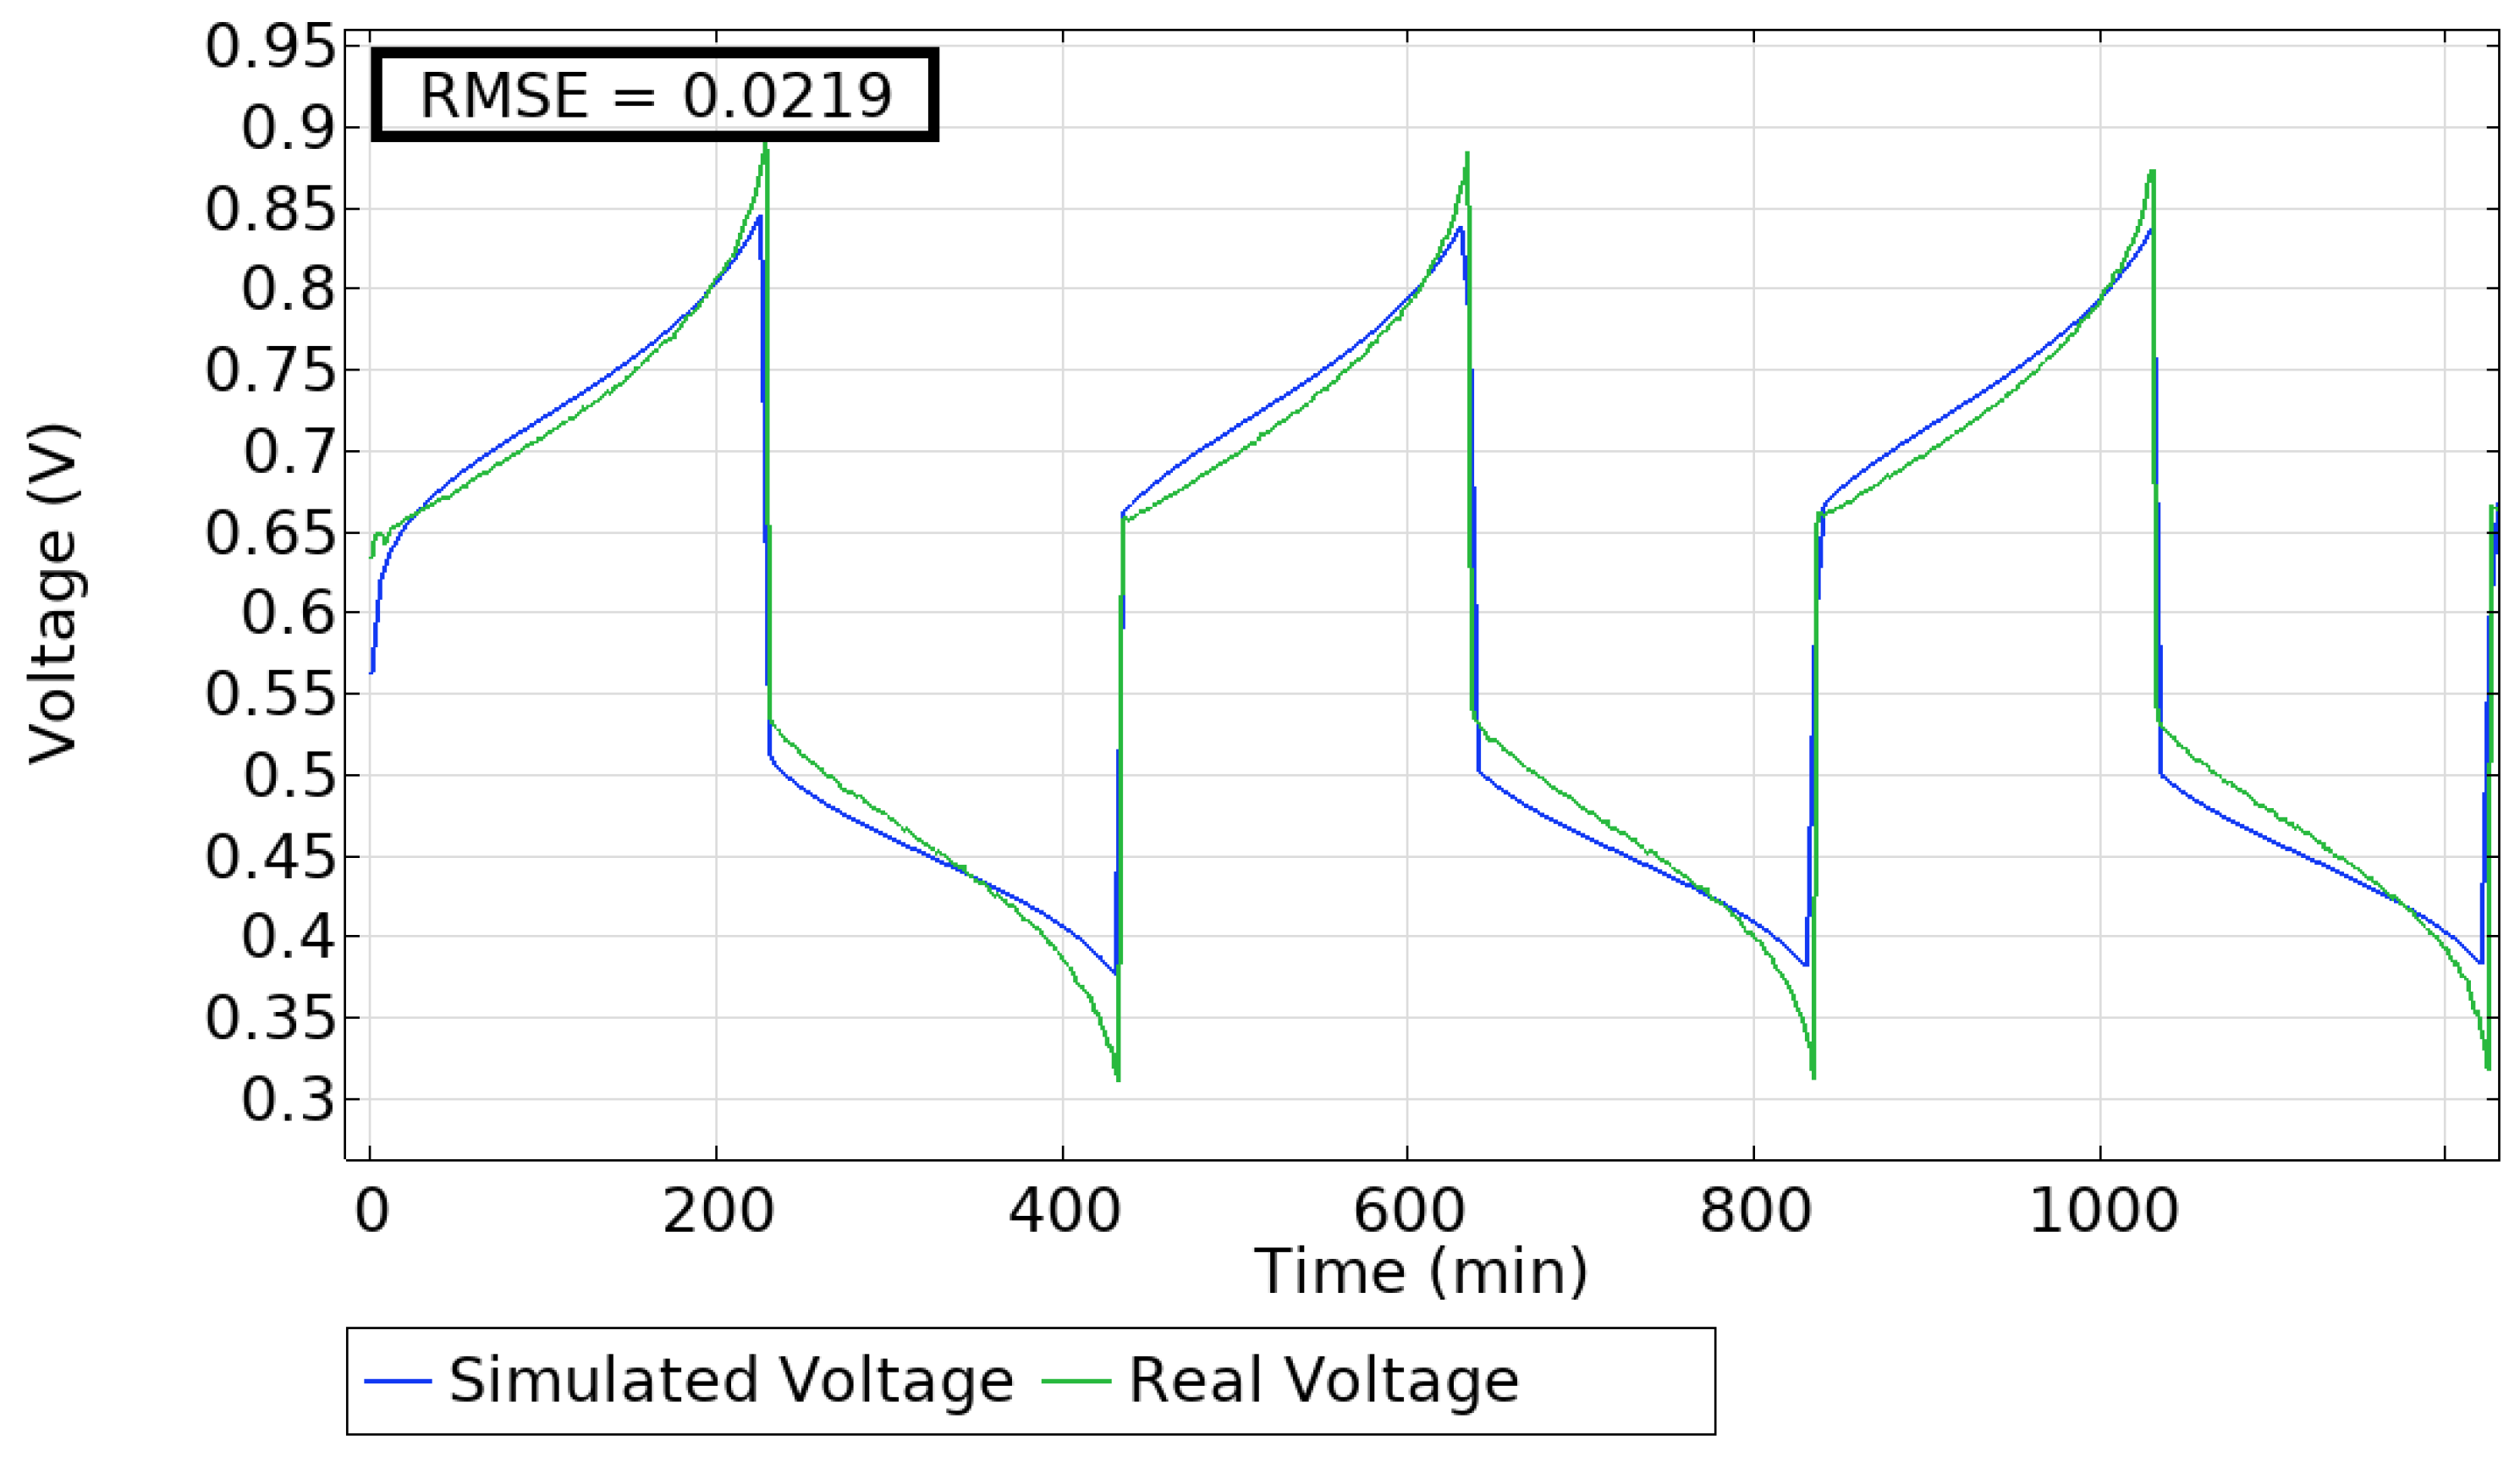
5.1. Model Validation

After estimating the parameters (Table 3), the model was tested for 17 charge and discharge battery cycles. The input parameters are the same as those shown in Table 1, Table 2 and Table 3, except for the applied current density, which varies over time according to the laboratory data.
Figure 3 depicts the comparison between the real voltage V cell and the simulated voltage V ^ cell . The RMSE voltage across all cycles is 0.0212 [V]. The model fails to predict the voltage at high and low copper concentrations for various reasons. The model does not take into account active copper material losses. For example, in the negative electrode, copper deposits might break due to fluid flow pressure.

5.2. Tank Concentrations

The active material concentration variations in each tank are taken into account. Figure 4a shows its variation over time. It is striking how C u + in the positive tank decreases after 10 cycles. This phenomenon affects the SoH. The reduction in concentration is due to C u + and C u 2 + crossover from the positive to the negative electrode.
Figure 4b illustrates the variation in concentration of C u 2 + in the negative tank. This variable is the difference between the C u 2 + that crossed the membrane and the C u 2 + that reacted with C u in the comproportionation reaction (3) happening at the negative electrode. The product of Reaction (3) is 2 C u + , which can be considered analogous to discharging the battery. This is because the higher the concentration of C u + in the negative tank, the less C u is available to participate in the electrochemical Reaction (2). The concentration variations are crucial to determine the SoC and SoH. Moreover, they directly influence the drop in voltage due to voltage polarization, as shown by the Butler–Volmer Equation (11).

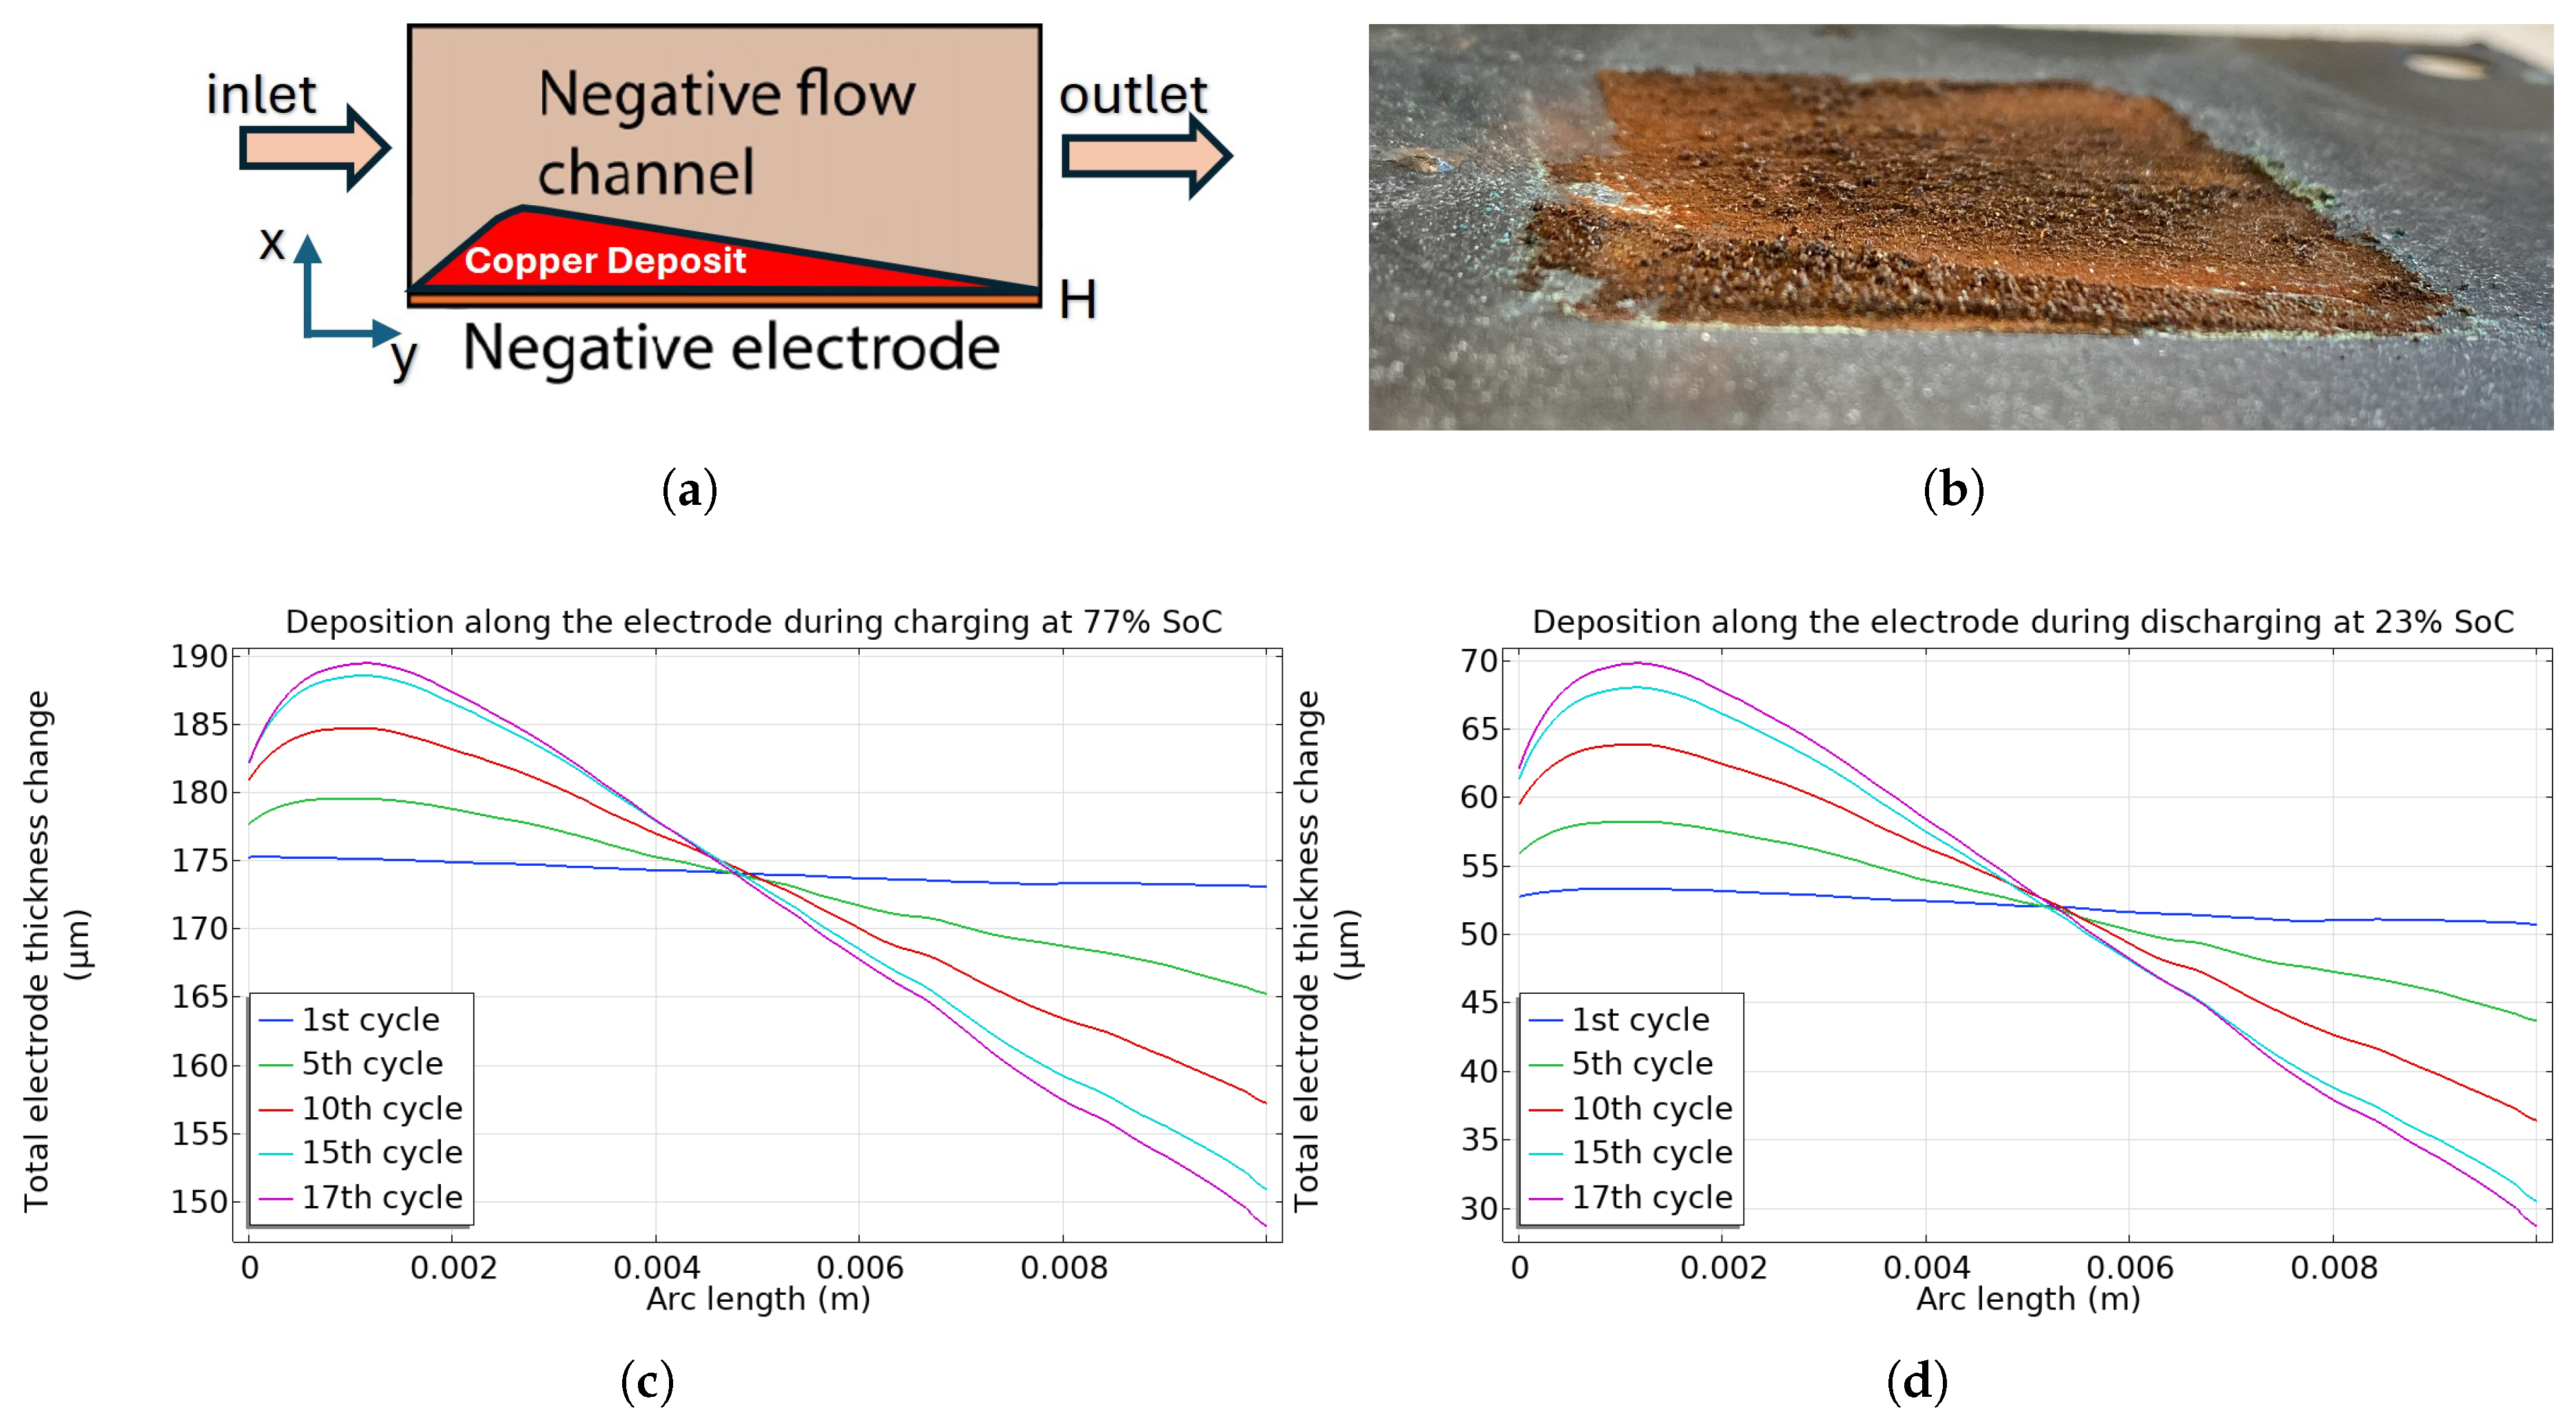
5.3. Copper Deposition

Besides active concentrations, copper deposition ( C u ) also plays a vital role in the operation of the battery. In the electrochemical Reaction 2, during charging, solid copper deposits on the negative electrode, as depicted in Figure 5a. The x-axis represents the negative electrode. The fluid flows from left to right, with the inlet at x = 0 [m] and the outlet at x = 0.001 [m]. The y-axis represents the changes in electrode thickness. Figure 5c,d illustrate the copper deposition along different cycles at 77% SoC and 23% SoC, respectively. The choice of 23% and 77% SoC for deposition estimation is guided by the need for consistency in comparison. Figure 6a shows the State of Charge (SoC) of the laboratory cycles, with 23% and 77% being the lowest and highest SoC values common to all cycles. It is crucial to compare copper deposition at these specific SoC values because the amount of deposited C u ( s ) directly correlates with the SoC. Measuring deposition at 23% and 77% enables consistent comparisons across cycles and allows for the analysis of copper deposition behavior at similar stages within the charge–discharge process, thus ensuring robust and reliable results. At higher SoC, we observe a peak of about 175–190 μm shifting towards the outlet after each cycle (Figure 5c). At a lower SoC, the peak reduces to 53–70 μm, increasing and shifting towards the outlet over time (Figure 5d). The peaks do not touch or perforate the membrane placed at 2000 μm. However, the deposition itself can affect the fluid dynamics, which is not considered or calculated in this model, assuming a constant flow.
These deposit patterns have not been validated. On the other hand, laboratory electrodes show a similar deposit trend, with a peak close to the inlet during the first cycles (Figure 5b).

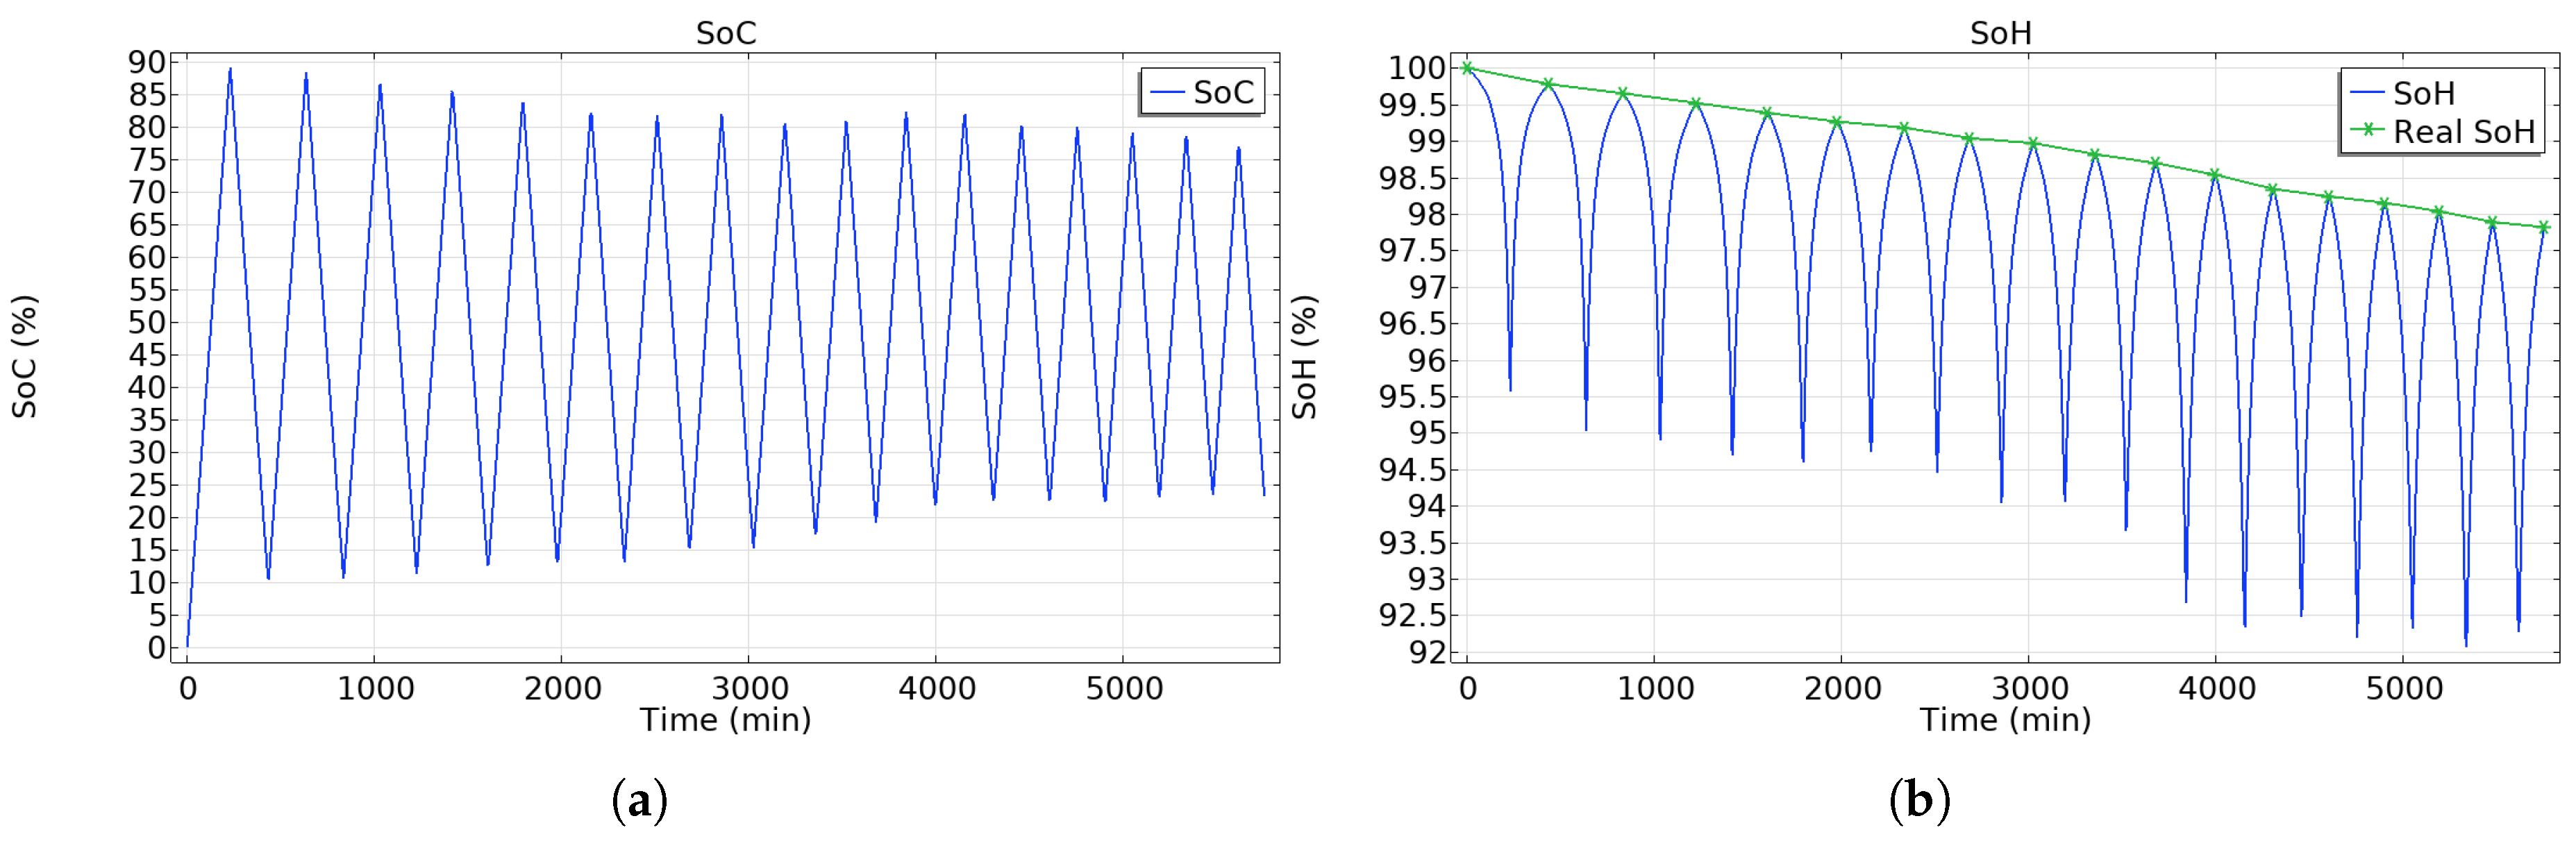
5.4. SoC and SoH Estimations

State of Charge follows Equation (21). Figure 6a illustrates the SoC along the 17 cycles. Figure 6b shows the SoH along the 17 cycles following Equation (22). The SoH reaches 98%. This parameter takes into account only the capacity fading due to crossover. The SoH decreases during charging and increases during discharging due to the transport of C u 2 + and C u + ions between the two electrodes. This movement is driven by three primary transport mechanisms: migration (in response to the electric field), convection (induced by fluid flow), and diffusion (driven by concentration gradients). The combination of these transport phenomena results in the redistribution of copper ions across the membrane, influencing the SoH [13].
Figure 6. (a) State-of-Charge; (b) capacity fading and State of Health.
Energies 18 02084 g006

5.5. Effect of Current

This study shows the effect of applying different current densities on deposition and SoH after 4.5 cycles (Figure 7). The current densities applied are 10, 15, and 20 mA/cm2. Figure 7a,b illustrate the deposition trends during charging at 84% SoC and discharging at 11% SoC, respectively. The choice of 84% SoC during charging and 11% SoC during discharging for deposition estimation is based on the need for consistency in comparison. These values represent the highest and lowest SoC common to all cycles. Since copper deposition correlates with SoC, measuring deposition at these points ensures consistent comparisons across cycles and allows for reliable analysis of copper deposition behavior at different charge–discharge stages. The C u deposits are thickest at the inlet of the cell, as determined using electrochemical analysis methods and scanning electron microscopy (SEM) [29,30,31]. This is due to the fresh electrolyte entering the cell, which contains the highest concentration of C u + . As the electro-active species are rapidly reduced to C u ( s ) , the concentration of C u + decreases downstream, leading to thinner deposits. The thicker deposits near the inlet can increase pressure and reduce flow, which, in turn, diminishes the battery’s performance. Figure 7c shows the effect of the current densities on the capacity fading. The higher the current densities, the lower the SoH. Electromigration may facilitate the passage of more C u 2 + through the membrane, which contributes to the observed behavior. However, other phenomena are involved, such as the side reaction (3), which can chemically self-discharge the battery.

5.6. Effect of Flow Rate

This study shows the effect of applying different flow rates on deposition and SoH after 4.5 cycles (Figure 8). The flow rates applied are 25, 30, and 35 mL/min. Figure 8a,b illustrate the deposition trends during charging at 84% SoC and discharging at 11% SoC, respectively. It is evident that the lower the flow rate, the higher the deposit peak in both scenarios. Indeed, the deposit is thicker close to the inlet. This is due to the fresh electrolyte entering the cell, which contains the highest concentration of C u + . As the electro-active species are rapidly reduced to C u ( s ) , the concentration of C u + decreases downstream, leading to thinner deposits. The lower flow rate generates a slow and non-uniform flow. The electrolyte will have difficulty reaching the outlet. Moreover, the thicker deposits near the inlet can increase pressure and reduce flow, growing the thicker deposit. Figure 8c shows the effect of the flow rate on the capacity fading. The SoH variation with flow rate was not statistically significant, and future work will include statistical analysis to investigate it further.

6. Conclusions

This study successfully developed and validated a comprehensive two-dimensional model of an All-Copper Redox Flow Battery (CuRFB) with a voltage error of 0.0212 RMSE. By analyzing species crossover and the effects of different currents and flow rates on copper deposition and capacity fading, the model provides valuable insights for optimizing and scaling up CuRFB operations.
The results demonstrate that higher current densities and lower flow rates lead to increased copper deposition, particularly near the inlet, which can significantly impact the battery’s State of Health (SoH). Additionally, the study highlights the importance of considering fluid dynamics and ion concentration distribution to improve battery performance and longevity.
Future work should focus on further refining the model to account for unmodeled phenomena such as fluid dynamics and electro-stripping dynamics over multiple cycles. Additionally, experimental validation of the model’s predictions will be crucial for enhancing its accuracy and reliability.
Overall, this study provides a solid foundation for understanding the limiting phenomena within CuRFBs, paving the way for improved cell design and performance in real-world applications. It also enables the integration of this model in future work concerning microgrids and their use of BESS such as the CuRFB.

Author Contributions

Conceptualization, W.B.; methodology, M.D. (Mirko D’Adamo); software, M.D. (Mirko D’Adamo) and W.B.; validation, M.D. (Mirko D’Adamo) and W.B.; data curation, M.D. (Mirko D’Adamo) and W.B.; writing—original draft preparation, M.D. (Mirko D’Adamo) and W.B.; writing—review and editing, L.M., P.C., M.D. (Mohamed Derbeli), L.T. and J.A.S.-Z.; supervision, L.M., P.C., M.D. (Mohamed Derbeli), L.T. and J.A.S.-Z.; funding acquisition, M.D. (Mirko D’Adamo) and L.M. All authors have read and agreed to the published version of the manuscript.

Funding

The research leading to these results has been performed within the CuBER project and received funding from the European Community’s Horizon 2020 Programme (H2020/2014-2020) under grant agreement #875605. This study has been financed also by the support of Pla de Doctorats Industrials de la Secretaria d’Universitats i Recerca del Departament d’Empresa i Coneixement de la Generalitat de Catalunya (https://doctoratsindustrials.gencat.cat, accessed on 16 April 2025).

Data Availability Statement

Data are available in previous works [13,15]. Further inquiries can be directed to the corresponding author.

Conflicts of Interest

Authors Mirko D’Adamo, Paula Cordoba, Mohammed Derbeli, and Jose A. Saez-Zamora were employed by the company NVISION.

References

  1. Gikunoo, E.K.; Han, D.; Vinothkannan, M.; Shanmugam, S. Synthesis and characterization of highly durable hydrocarbon-based composite membrane for zinc-bromine redox flow battery. J. Power Sources 2023, 563, 232821. [Google Scholar] [CrossRef]
  2. Gür, T.M. Review of electrical energy storage technologies, materials and systems: Challenges and prospects for large-scale grid storage. Energy Environ. Sci. 2018, 11, 2696–2767. [Google Scholar] [CrossRef]
  3. Rahman, M.; Oni, A.O.; Gemechu, E.D.; Kumar, A. Assessment of energy storage technologies: A review. Energy Convers. Manag. 2020, 223, 113295. [Google Scholar] [CrossRef]
  4. Braff, W.A.; Mueller, J.M.; Trancik, J.E. Value of storage technologies for wind and solar energy. Nat. Clim. Chang. 2016, 6, 964–969. [Google Scholar] [CrossRef]
  5. Sanchez-Diez, E.; Ventosa, E.; Guarnieri, M.; Trovò, A.; Flox, C.; Marcilla, R.; Soavi, F.; Mazúr, P.; Aranzabe, E.; Ferret, R. Redox flow batteries: Status and perspective towards sustainable stationary energy storage. J. Power Sources 2021, 481, 228804. [Google Scholar] [CrossRef]
  6. Zhang, H.; Li, X.; Zhang, J. Redox Flow Batteries: Fundamentals and Applications; CRC Press: Boca Raton, FL, USA, 2017. [Google Scholar]
  7. Ye, R.; Henkensmeier, D.; Yoon, S.J.; Huang, Z.; Kim, D.K.; Chang, Z.; Kim, S.; Chen, R. Redox flow batteries for energy storage: A technology review. J. Electrochem. Energy Convers. Storage 2018, 15, 010801. [Google Scholar] [CrossRef]
  8. Aluko, A.; Knight, A. A Review on Vanadium Redox Flow Battery Storage Systems for Large-Scale Power Systems Application. IEEE Access 2023, 11, 13773–13793. [Google Scholar] [CrossRef]
  9. Sanz, L.; Badenhorst, W.D.; Lacarbonara, G.; Faggiano, L.; Lloyd, D.; Kauranen, P.; Arbizzani, C.; Murtomäki, L. All-copper Flow Batteries. In Flow Batteries; John Wiley & Sons, Ltd.: Hoboken, NJ, USA, 2023; Chapter 38; pp. 855–873. [Google Scholar]
  10. Faggiano, L.; Lacarbonara, G.; Badenhorst, W.; Murtomäki, L.; Sanz, L.; Arbizzani, C. Short thermal treatment of carbon felts for copper-based redox flow batteries. J. Power Sources 2022, 520, 230846. [Google Scholar] [CrossRef]
  11. Sanz, L.; Lloyd, D.; Magdalena, E.; Palma, J.; Kontturi, K. Description and performance of a novel aqueous All-Copper Redox Flow Battery. J. Power Sources 2014, 268, 121–128. [Google Scholar] [CrossRef]
  12. Zanzola, E.; Gentil, S.; Gschwend, G.; Reynard, D.; Smirnov, E.; Dennison, C.; Girault, H.H.; Peljo, P. Solid electrochemical energy storage for aqueous redox flow batteries: The case of copper hexacyanoferrate. Electrochim. Acta 2019, 321, 134704. [Google Scholar] [CrossRef]
  13. Badenhorst, W.D.; Sanz, L.; Arbizzani, C.; Murtomäki, L. Performance improvements for the All-Copper Redox Flow Battery: Membranes, electrodes, and electrolytes. Energy Rep. 2022, 8, 8690–8700. [Google Scholar] [CrossRef]
  14. Lloyd, D.; Magdalena, E.; Sanz, L.; Murtomäki, L.; Kontturi, K. Preparation of a cost-effective, scalable and energy efficient All-Copper Redox Flow Battery. J. Power Sources 2015, 292, 87–94. [Google Scholar] [CrossRef]
  15. Badenhorst, W.; Jensen, C.M.; Jakobsen, U.; Esfahani, Z.; Murtomäki, L. Control-Oriented Electrochemical Model and Parameter Estimation for an All-Copper Redox Flow Battery. Batteries 2023, 9, 272. [Google Scholar] [CrossRef]
  16. Shah, A.A.; Watt-Smith, M.J.; Walsh, F.C. A dynamic performance model for redox-flow batteries involving soluble species. Electrochim. Acta 2008, 53, 8087–8100. [Google Scholar] [CrossRef]
  17. Shah, A.A.; Al-Fetlawi, H.; Walsh, F.C. Dynamic modelling of hydrogen evolution effects in the all-vanadium redox flow battery. Electrochim. Acta 2010, 55, 1125–1139. [Google Scholar] [CrossRef]
  18. Al-Fetlawi, H.; Shah, A.A.; Walsh, F.C. Modelling the effects of oxygen evolution in the all-vanadium redox flow battery. Electrochim. Acta 2010, 55, 3192–3205. [Google Scholar] [CrossRef]
  19. Hao, L.; Wang, Y.; He, Y. Modeling of ion crossover in an all-vanadium redox flow battery with the interfacial effect at membrane/electrode interfaces. J. Electrochem. Soc. 2019, 166, A1310–A1322. [Google Scholar] [CrossRef]
  20. Won, S.; Oh, K.; Ju, H. Numerical Analysis of Vanadium Crossover Effects in All-vanadium Redox Flow Batteries. Electrochim. Acta 2015, 177, 310–320. [Google Scholar] [CrossRef]
  21. Knehr, K.W.; Agar, E.; Dennison, C.R.; Kalidindi, A.R.; Kumbur, E.C. A transient vanadium flow battery model incorporating vanadium crossover and water transport through the membrane. J. Electrochem. Soc. 2012, 159, A1446–A1459. [Google Scholar] [CrossRef]
  22. Lei, Y.; Zhang, B.W.; Bai, B.F.; Zhao, T.S. A transient electrochemical model incorporating the Donnan effect for all-vanadium redox flow batteries. J. Power Sources 2015, 299, 202–211. [Google Scholar] [CrossRef]
  23. Oh, K.; Yoo, H.; Ko, J.; Won, S.; Ju, H. Three-dimensional, transient, nonisothermal model of all-vanadium redox flow batteries. Energy 2015, 81, 3–14. [Google Scholar] [CrossRef]
  24. D’Adamo, M.; Daub, N.; Trilla, L.; Saez-Zamora, J.A.; Paz-Garcia, J.M. Modeling of a Non-Aqueous Redox Flow Battery for Performance and Capacity Fade Analysis. Batteries 2025, 11, 8. [Google Scholar] [CrossRef]
  25. Amini, K.; Pritzker, M.D. A two-dimensional transient model for a zinc-cerium redox flow battery validated by extensive experimental data. J. Power Sources 2021, 506, 230237. [Google Scholar] [CrossRef]
  26. Xu, Z.; Wang, J.; Yan, S.C.; Fan, Q.; Lund, P.D. Modeling of zinc bromine redox flow battery with application to channel design. J. Power Sources 2020, 450, 227436. [Google Scholar] [CrossRef]
  27. Chen, Z.; Yu, W.; Liu, Y.; Zeng, Y.; He, Q.; Tan, P.; Ni, M. Mathematical modeling and numerical analysis of alkaline zinc-iron flow batteries for energy storage applications. J. Power Sources 2021, 506, 230237. [Google Scholar] [CrossRef]
  28. Powell, M. The BOBYQA Algorithm for Bound Constrained Optimization Without Derivatives; Technical Report; Department of Applied Mathematics and Theoretical Physics: Cambridge, UK, 2009. [Google Scholar]
  29. Nikolić, N.; Pavlović, L.; Pavlović, M.G.; Popov, K. Effect of temperature on the electrodeposition of disperse copper deposits. J. Serbian Chem. Soc. 2007, 72, 1369–1381. [Google Scholar] [CrossRef]
  30. Rashkov, S.; Stoichev, D.S.; Tomov, I. Influence of current density and temperature on the morphology and preferred orientation of electrodeposited copper coatings. Electrochim. Acta 1972, 17, 1955–1964. [Google Scholar] [CrossRef]
  31. Banthia, S.; Sengupta, S.; Mallik, M.; Das, S. Substrate effect on electrodeposited copper morphology and crystal shapes. Surface Eng. 2017, 34, 485–492. [Google Scholar] [CrossRef]
Figure 1. Schematic of a two-dimensional model of an All-Copper Redox Flow Battery, with the negative electrode at x = 0 , spanning the thickness of the battery ( 0 < x x 3 ). The anion exchange membrane is between x 1 and x 2 , and the positive porous electrode is from x 2 to x 3 . The flow occurs from y = 0 to y = H .
Energies 18 02084 g001
Figure 2. Simulated voltages and measured cell voltages in the CuRFB cell over 3 cycles.
Energies 18 02084 g002
Figure 3. Simulated voltages and measured cell voltages in CuRFB cell over 17 cycles.
Energies 18 02084 g003
Figure 4. (a) Active species estimation; (b) C u 2 + estimation in the negative tank State of Charge.
Energies 18 02084 g004
Figure 5. (a) Schematic of deposition through the negative channel; (b) copper deposit trend; (c) deposition during charging at 77% State of Charge; (d) deposition during discharging 23% State of Charge.
Energies 18 02084 g005
Figure 7. (a) Effect of current on deposition during charging at 84% State of Charge; (b) effect of current on deposition during discharging 11% State of Charge; (c) effect of current on State of Health.
Energies 18 02084 g007
Figure 8. (a) Effect of flow rate on deposition during charging at 84% State of Charge; (b) effect of flow rate on deposition during discharging 11% State of Charge; (c) effect of flow rate on State-of-Health.
Energies 18 02084 g008
Table 1. Geometrical and operational parameters.
ParameterValueUnitsDescription
a3.5 × 105[m2/m3]Specific surface area
ϵ m 0.2[-]Porosity of the membrane
ϵ 0.93[-]Porosity of the positive porous electrodes
H1[cm]Height of the cell
L e 1[cm]Length of the cell
W e 2000[μm]Thickness of the electrodes
W s 30[μm]Thickness of the membrane
Q30[mL/min]Flow rate circulated through each electrode
V e 3[mL]Volume of circulated solution in each electrode
i app 20[mA/cm2]Applied current density
T60°CTemperature
k disp 2.5 × 10⁻⁷[1/(M·s)]Rate constant
K disp 2.2 × 10⁻⁶[-]Equilibrium constant
G max 7 × 10⁻¹⁰[mol/m2]Maximum surface concentration
Table 2. Diffusion coefficients and initial concentrations.
ParameterValueUnitsParameterValueUnits
D H + 9 × 10 9 [m2/s] c H + , 0 6[M]
D C l 2 × 10 9 [m2/s] c C l , 0 7[M]
D C u + 6 × 10 10 [m2/s] c C u + , 0 1[M]
D C u 2 + 6 × 10 10 [m2/s] c C u 2 + , 0 0.001[M]
c C u , 0 0.001[M]
Table 3. Estimated parameters.
ParameterValueUnitsDescription
D C u + , m 2.52 × 10 12 [m2/s]Membrane Diffusion coefficient of C u +
D C u 2 + , m 3.146 × 10 12 [m2/s]Membrane Diffusion coefficient of C u 2 +
D H + , m 2.287 × 10 9 [m2/s]Membrane Diffusion coefficient of H +
D C l , m 3.29 × 10 10 [m2/s]Membrane Diffusion coefficient of C l
α n e g 0.17[-]Anodic charge transfer coefficient negative electrode
α p o s 0.8[-]Anodic charge transfer coefficient positive electrode
i n e g , 0 61.483[A/m2]Reference exchange current density negative electrode
i pos , 0 245.33[A/m2]Reference exchange current density positive electrode
f C u 2 + 0.4[-] C u 2 + ion activity
f C u + 1[-] C u + ion activity
f C l 0.9[-] C l ion activity
f H + 0.9[-] H + ion activity
Disclaimer/Publisher’s Note: The statements, opinions and data contained in all publications are solely those of the individual author(s) and contributor(s) and not of MDPI and/or the editor(s). MDPI and/or the editor(s) disclaim responsibility for any injury to people or property resulting from any ideas, methods, instructions or products referred to in the content.

