
Molecular and Microstructural Engineering Strategies for High-Performance Polypropylene Insulation Materials

 , , , and
Abstract
1. Introduction
2. Platform and Principle
2.1. Polypropylene Base Material Performance Testing Principles and Platforms
2.1.1. Principles of Microstructure Characterization Methods
- (1)
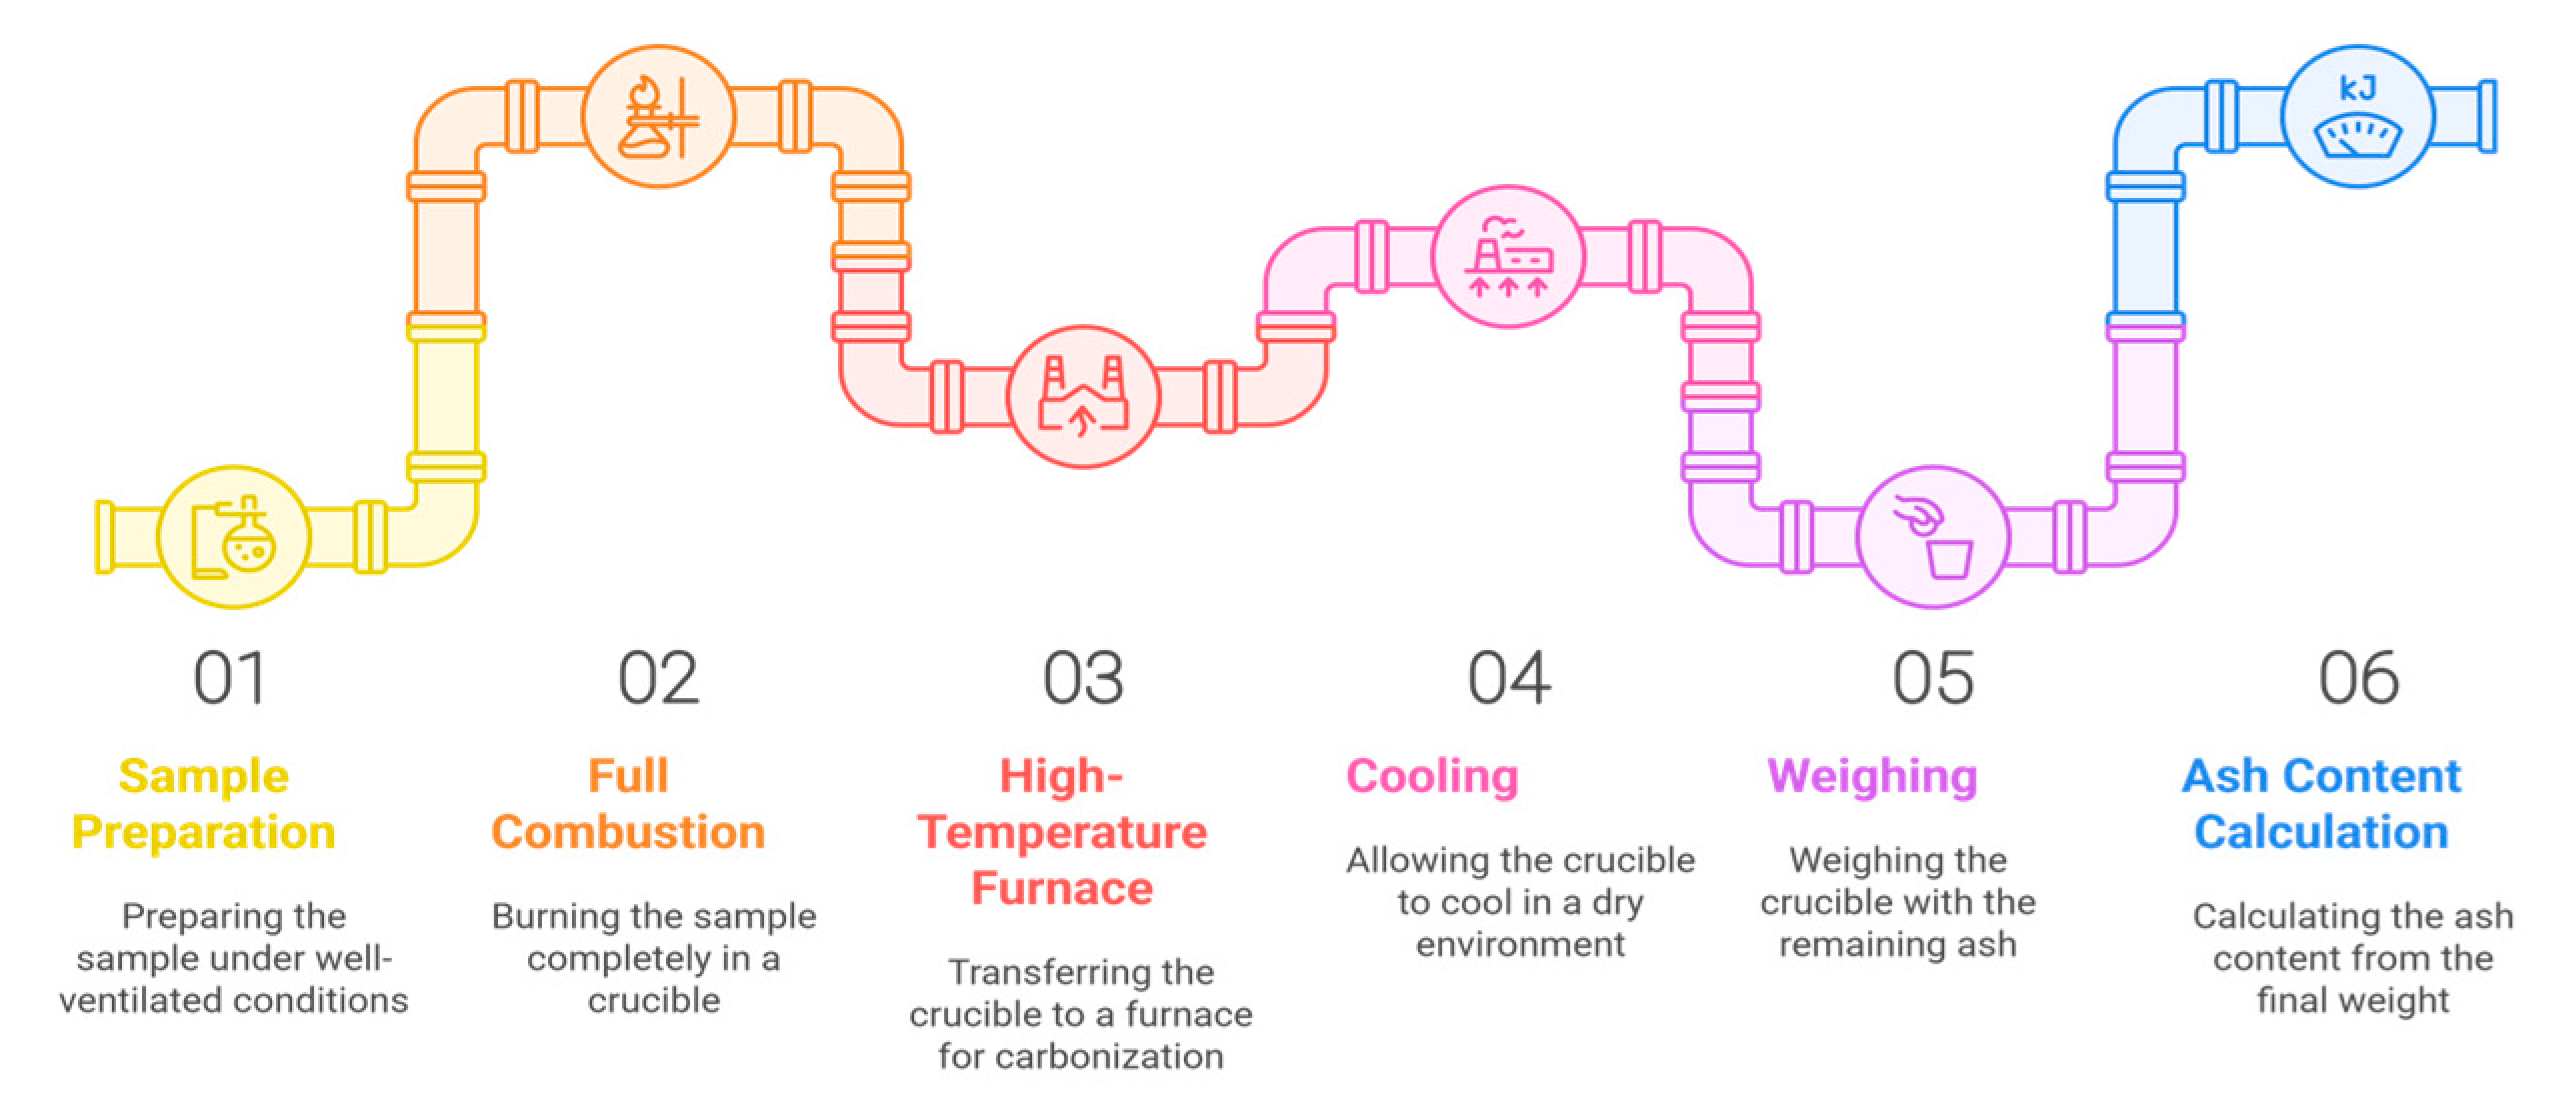
- Ash content
- (2)
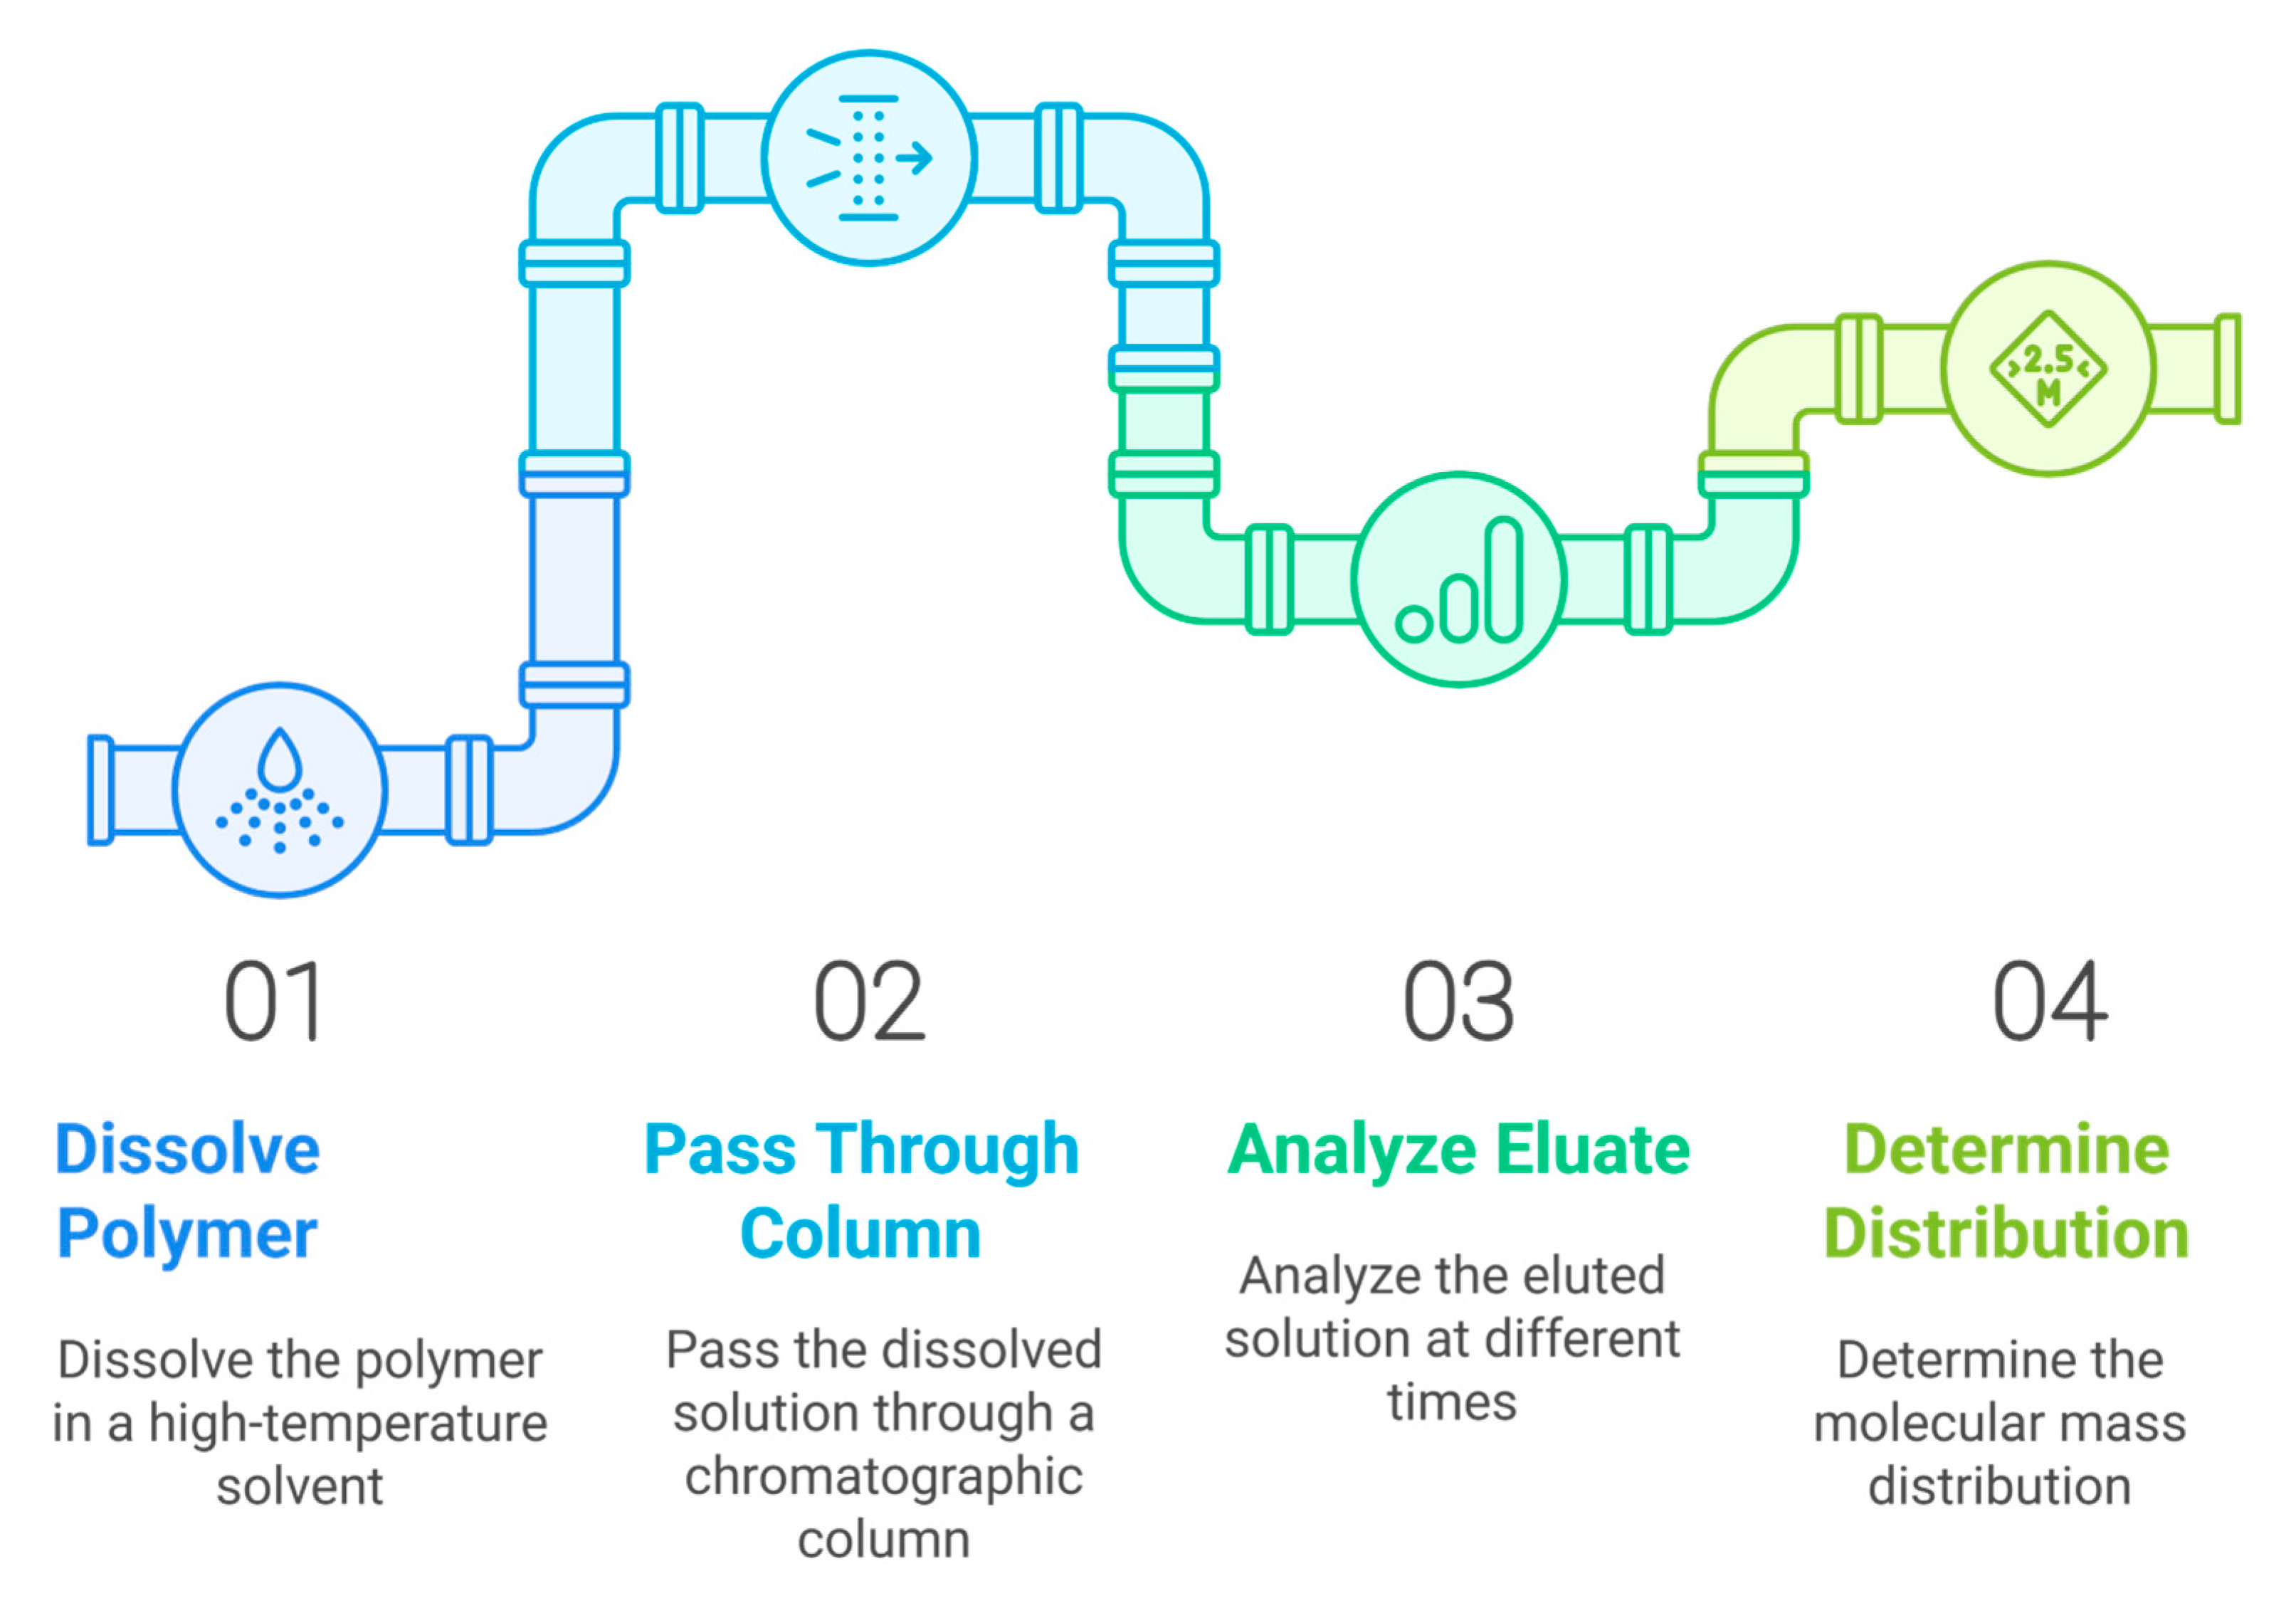
- Molecular weight distribution
- (3)
- Functional group structure
2.1.2. Principles of Macrostructural Characterization Methods
- (1)
- Crystallization properties
- (2)
- Dielectric property
- (3)
- Breakdown characteristics
2.2. Platform for the Preparation of Polypropylene-Based Materials
2.2.1. Preparation Principle
2.2.2. Preparation Platform
2.3. Experimental Samples and Pre-Treatment
3. Polypropylene Base Material Performance Testing
3.1. Microstructure Testing of Polypropylene Base Materials
3.1.1. Ash Content
3.1.2. Molecular Mass
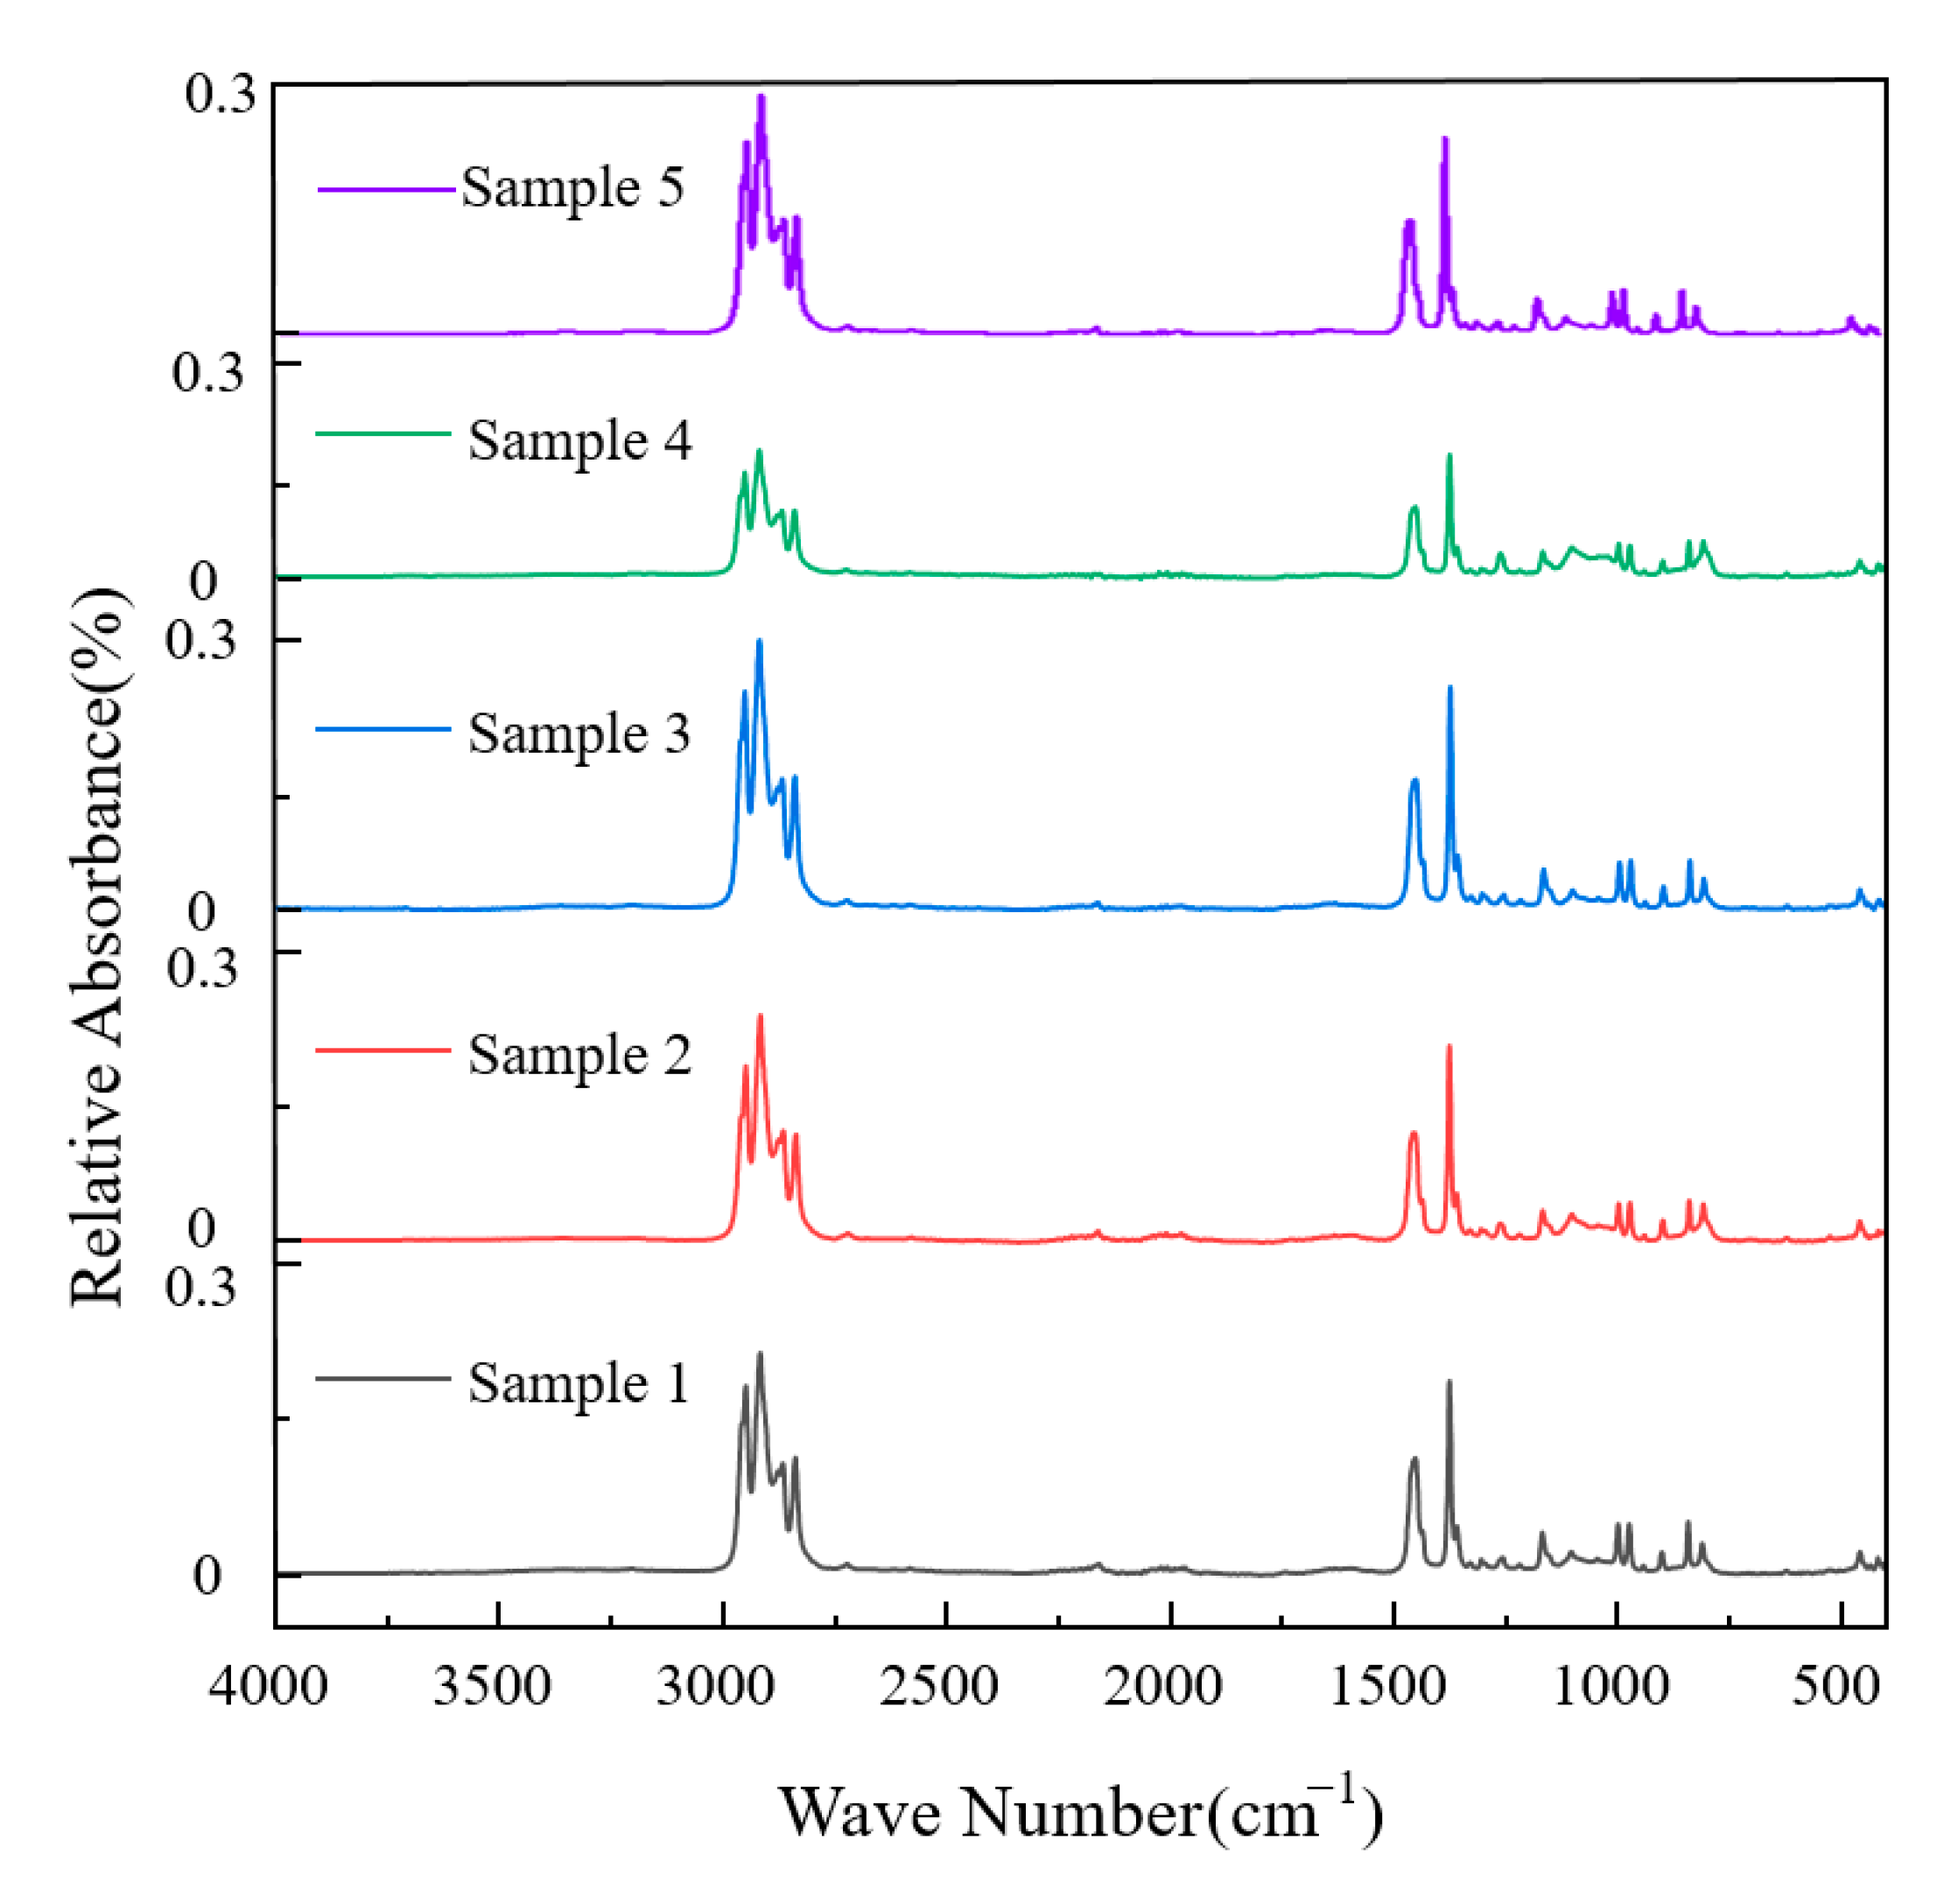
3.1.3. Functional Group Structure
3.2. Macro-Property Testing of Polypropylene Base Materials
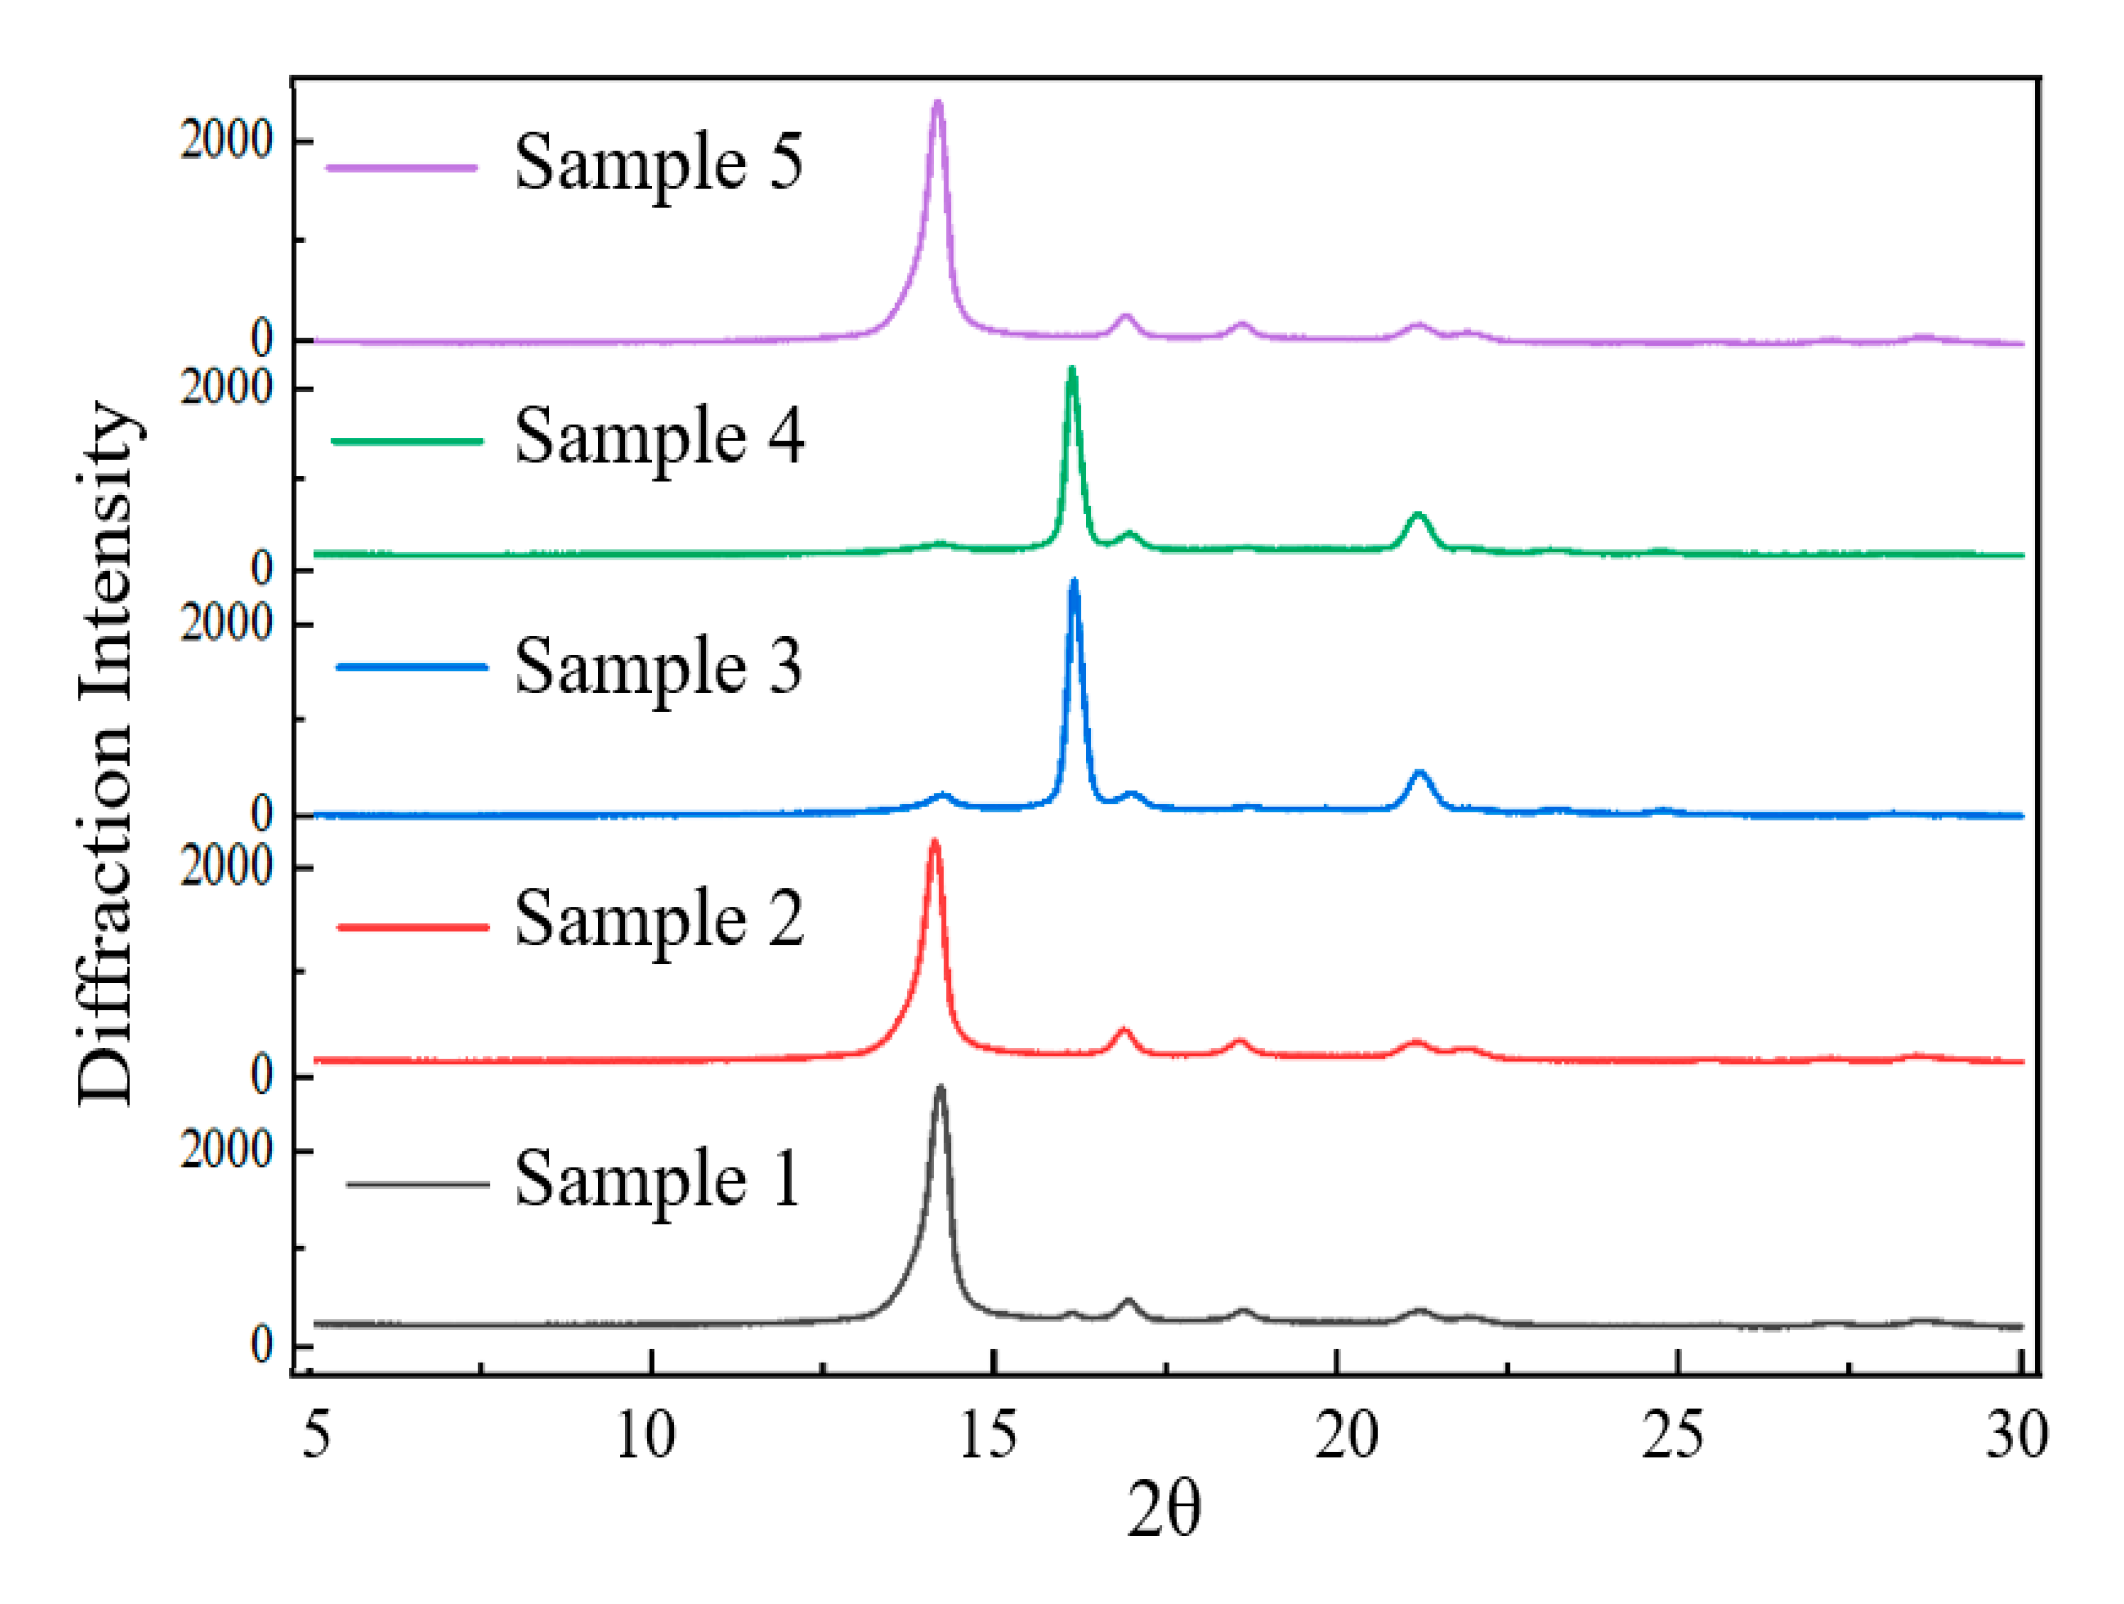
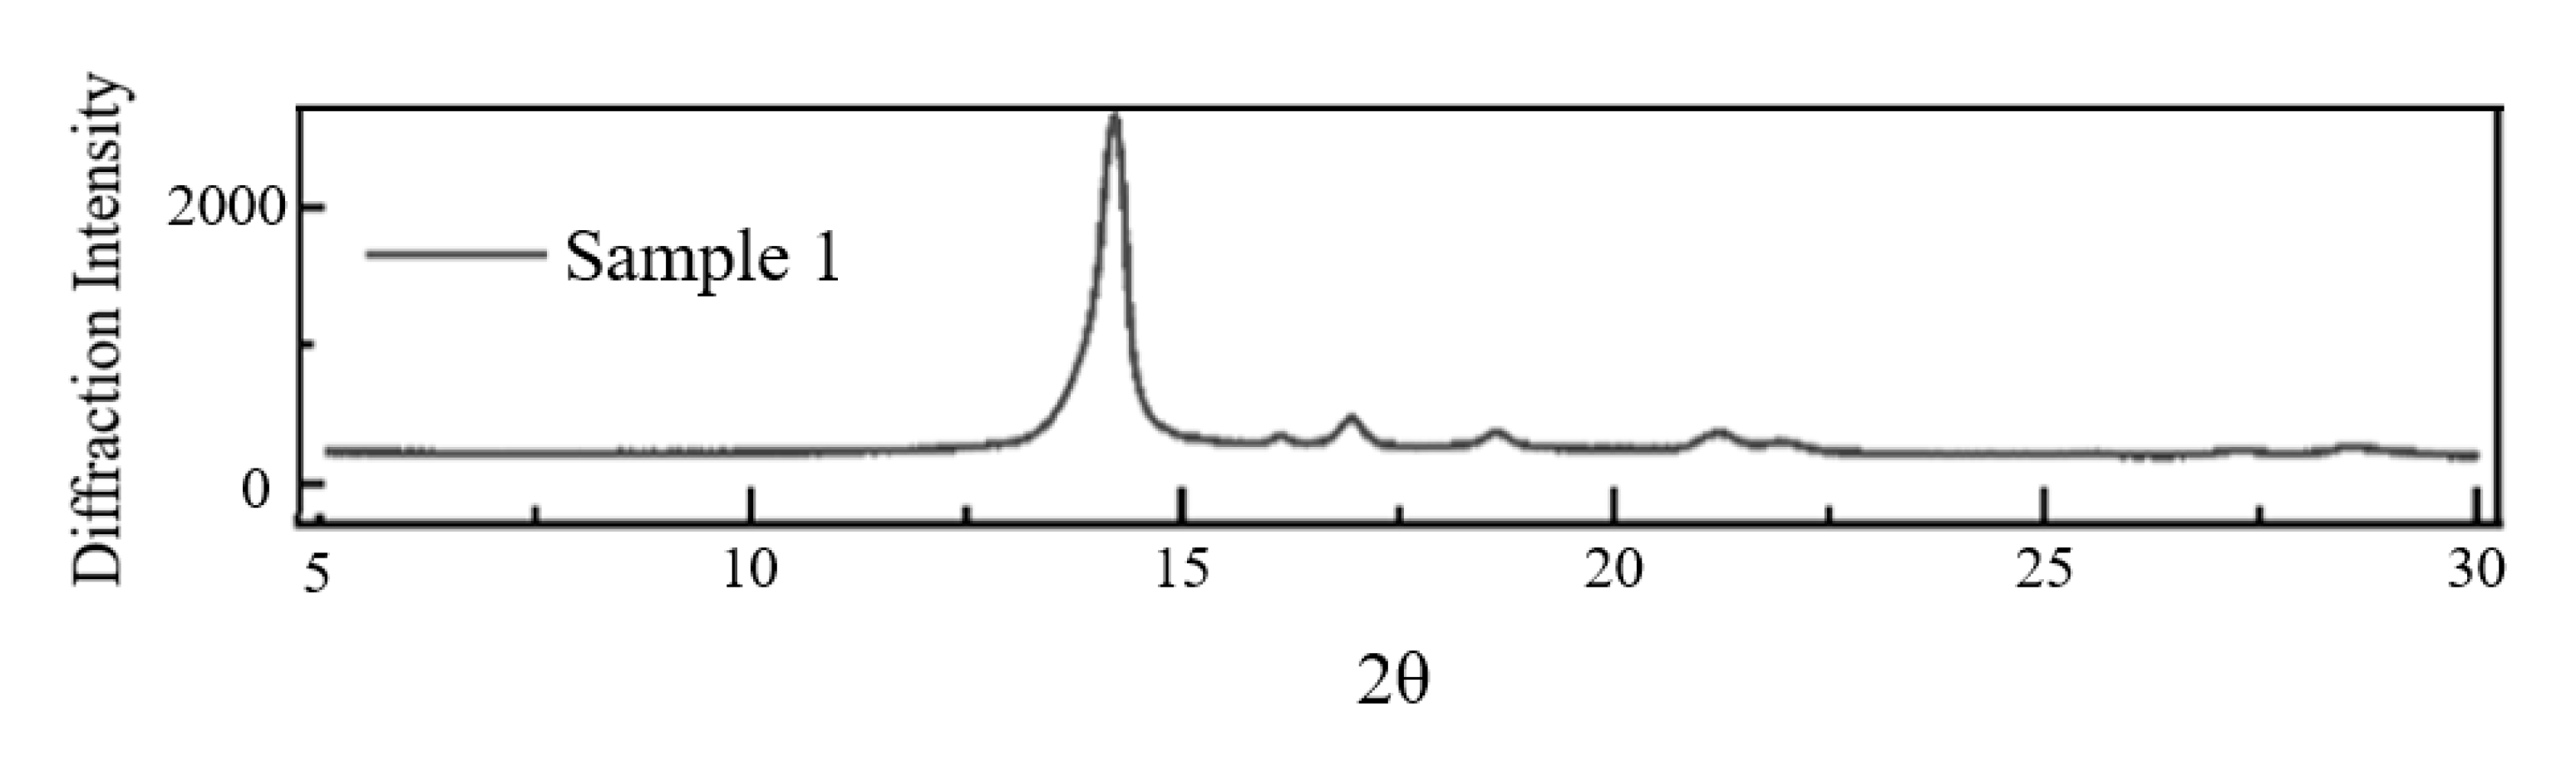
3.2.1. Crystallization Properties
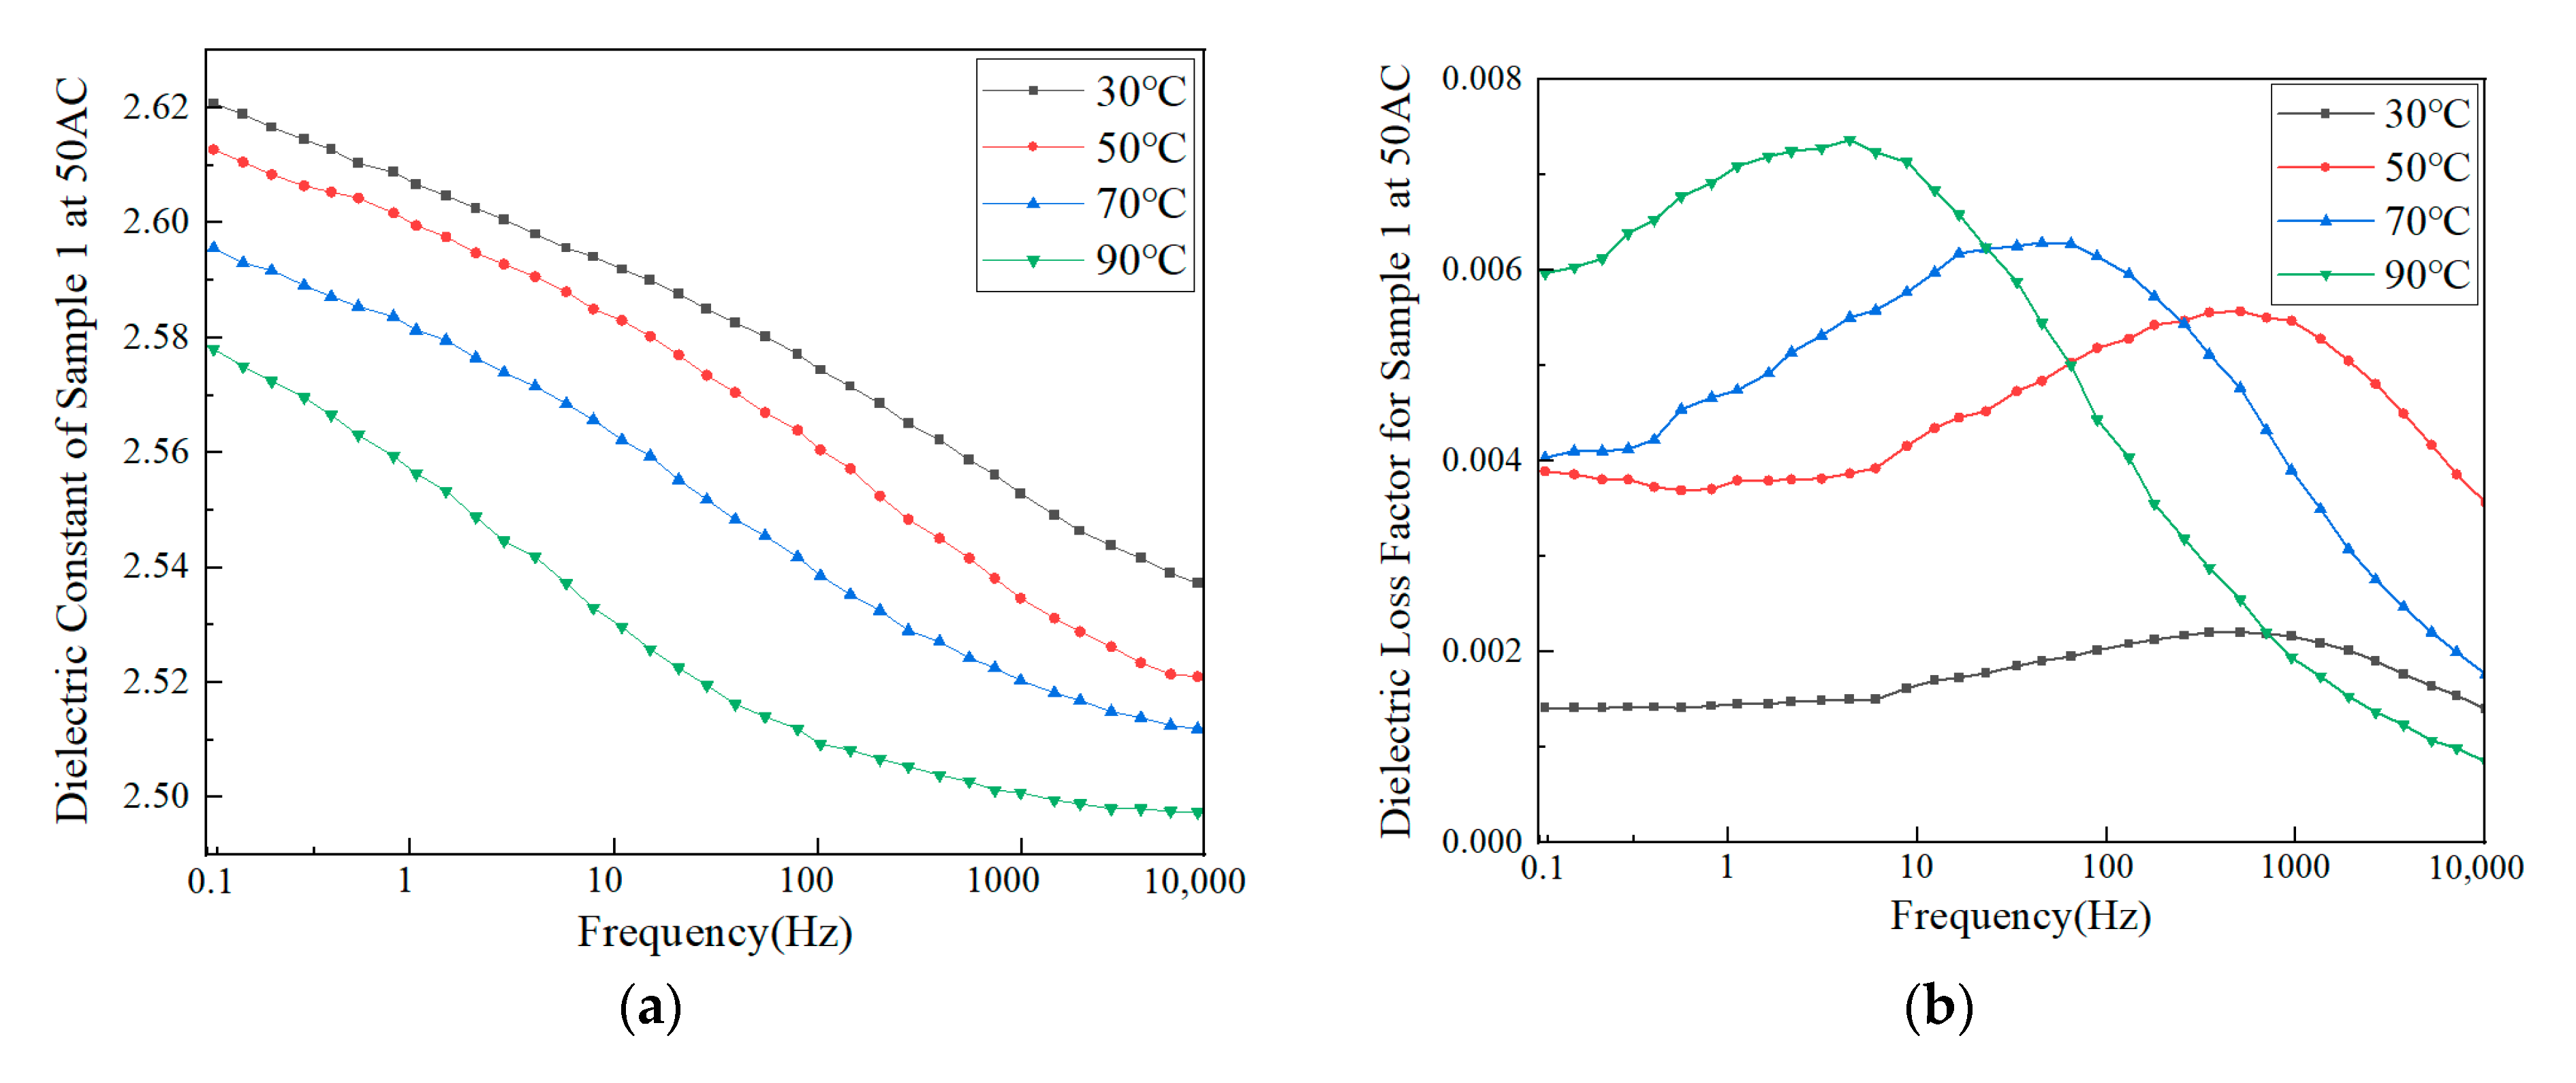
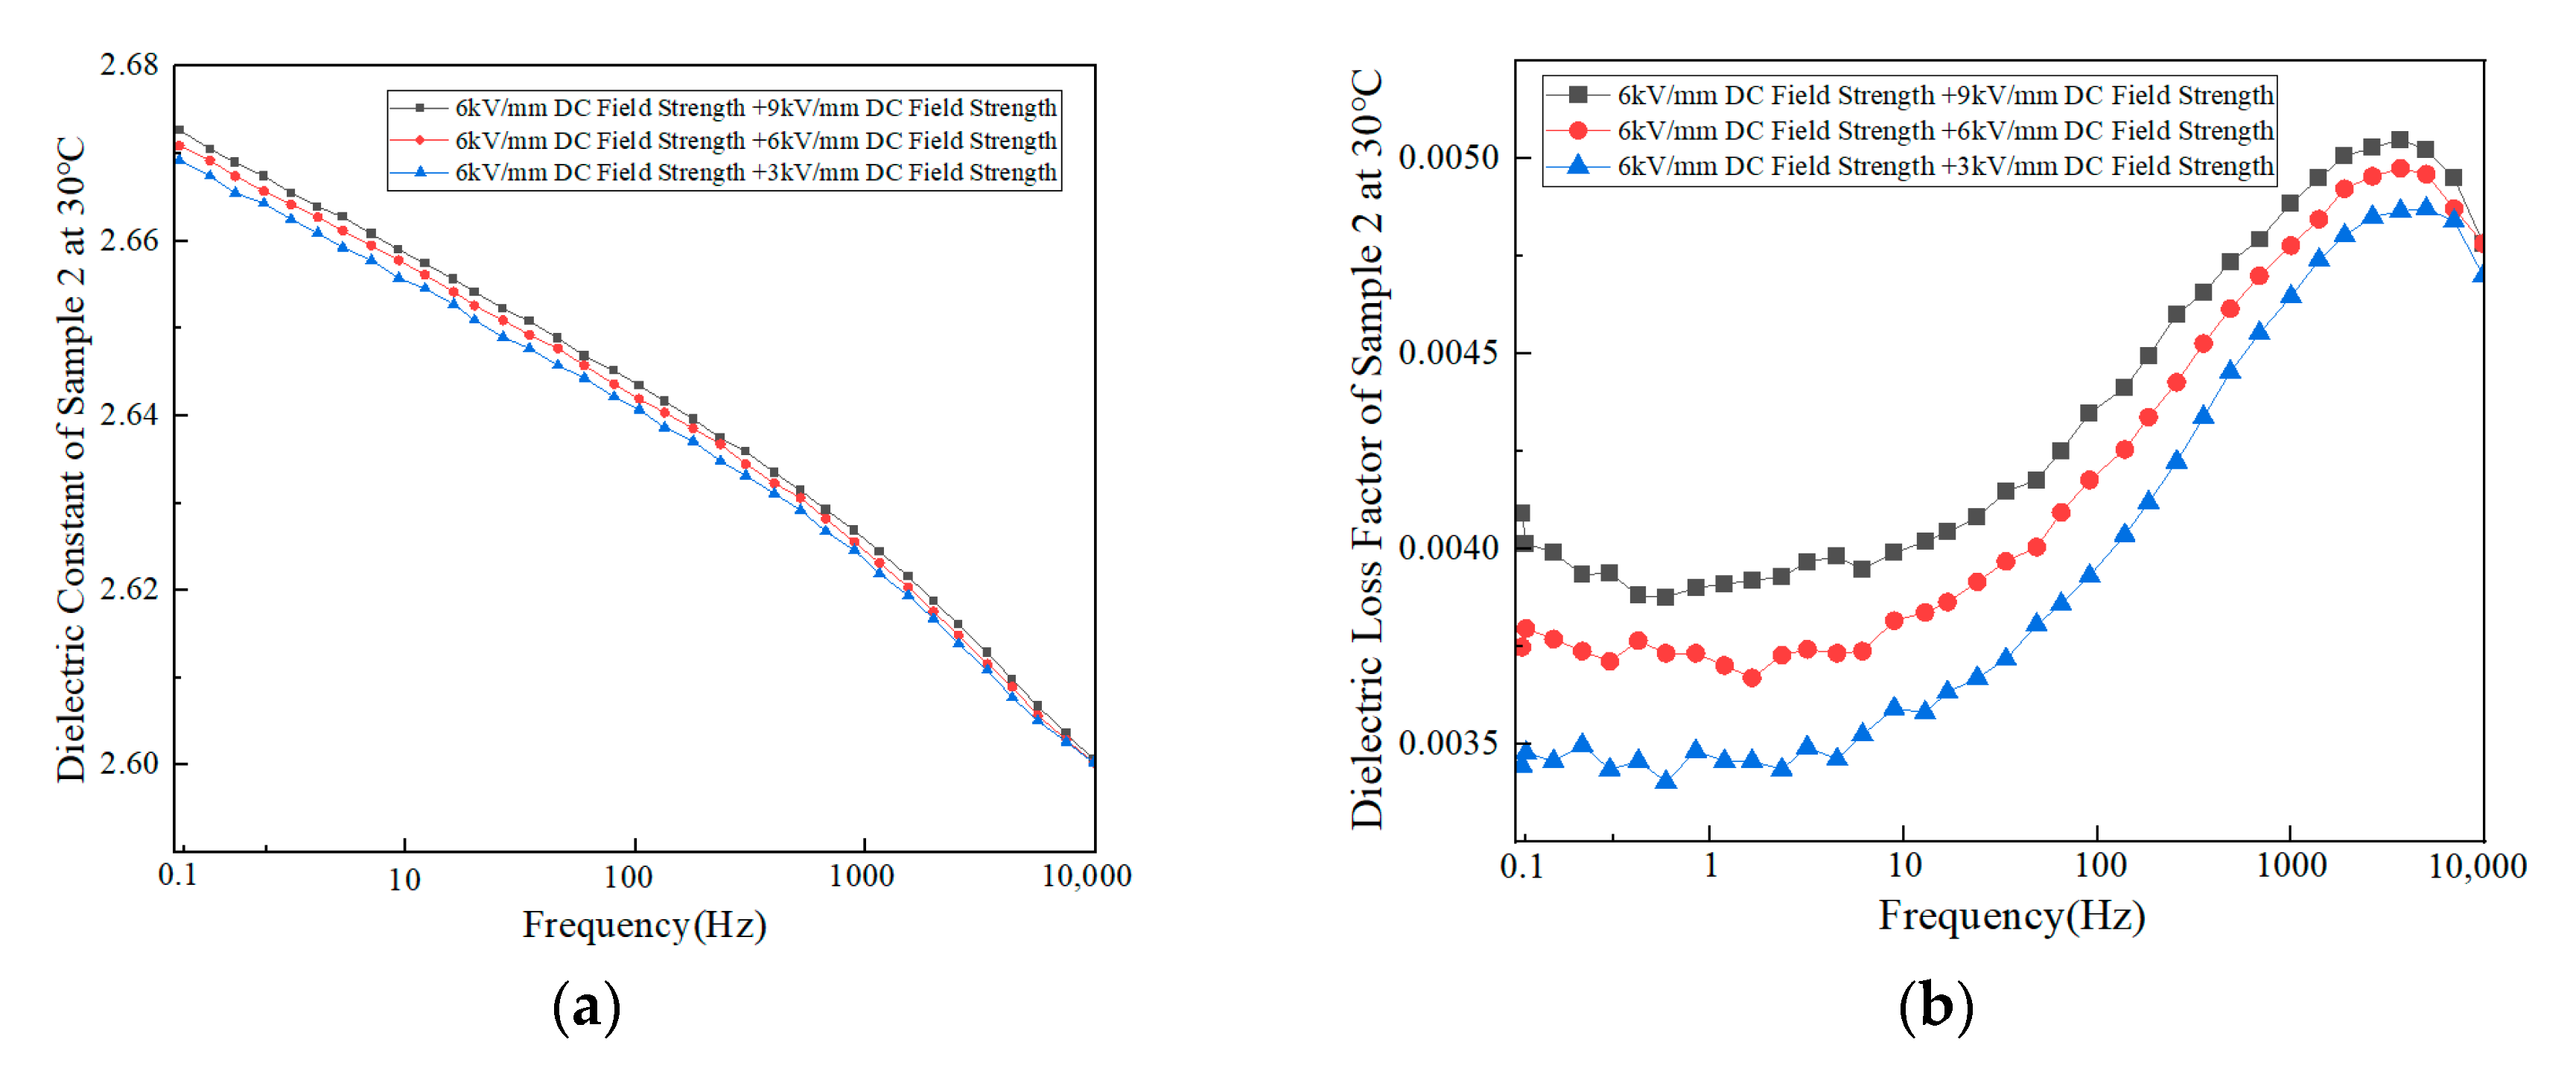
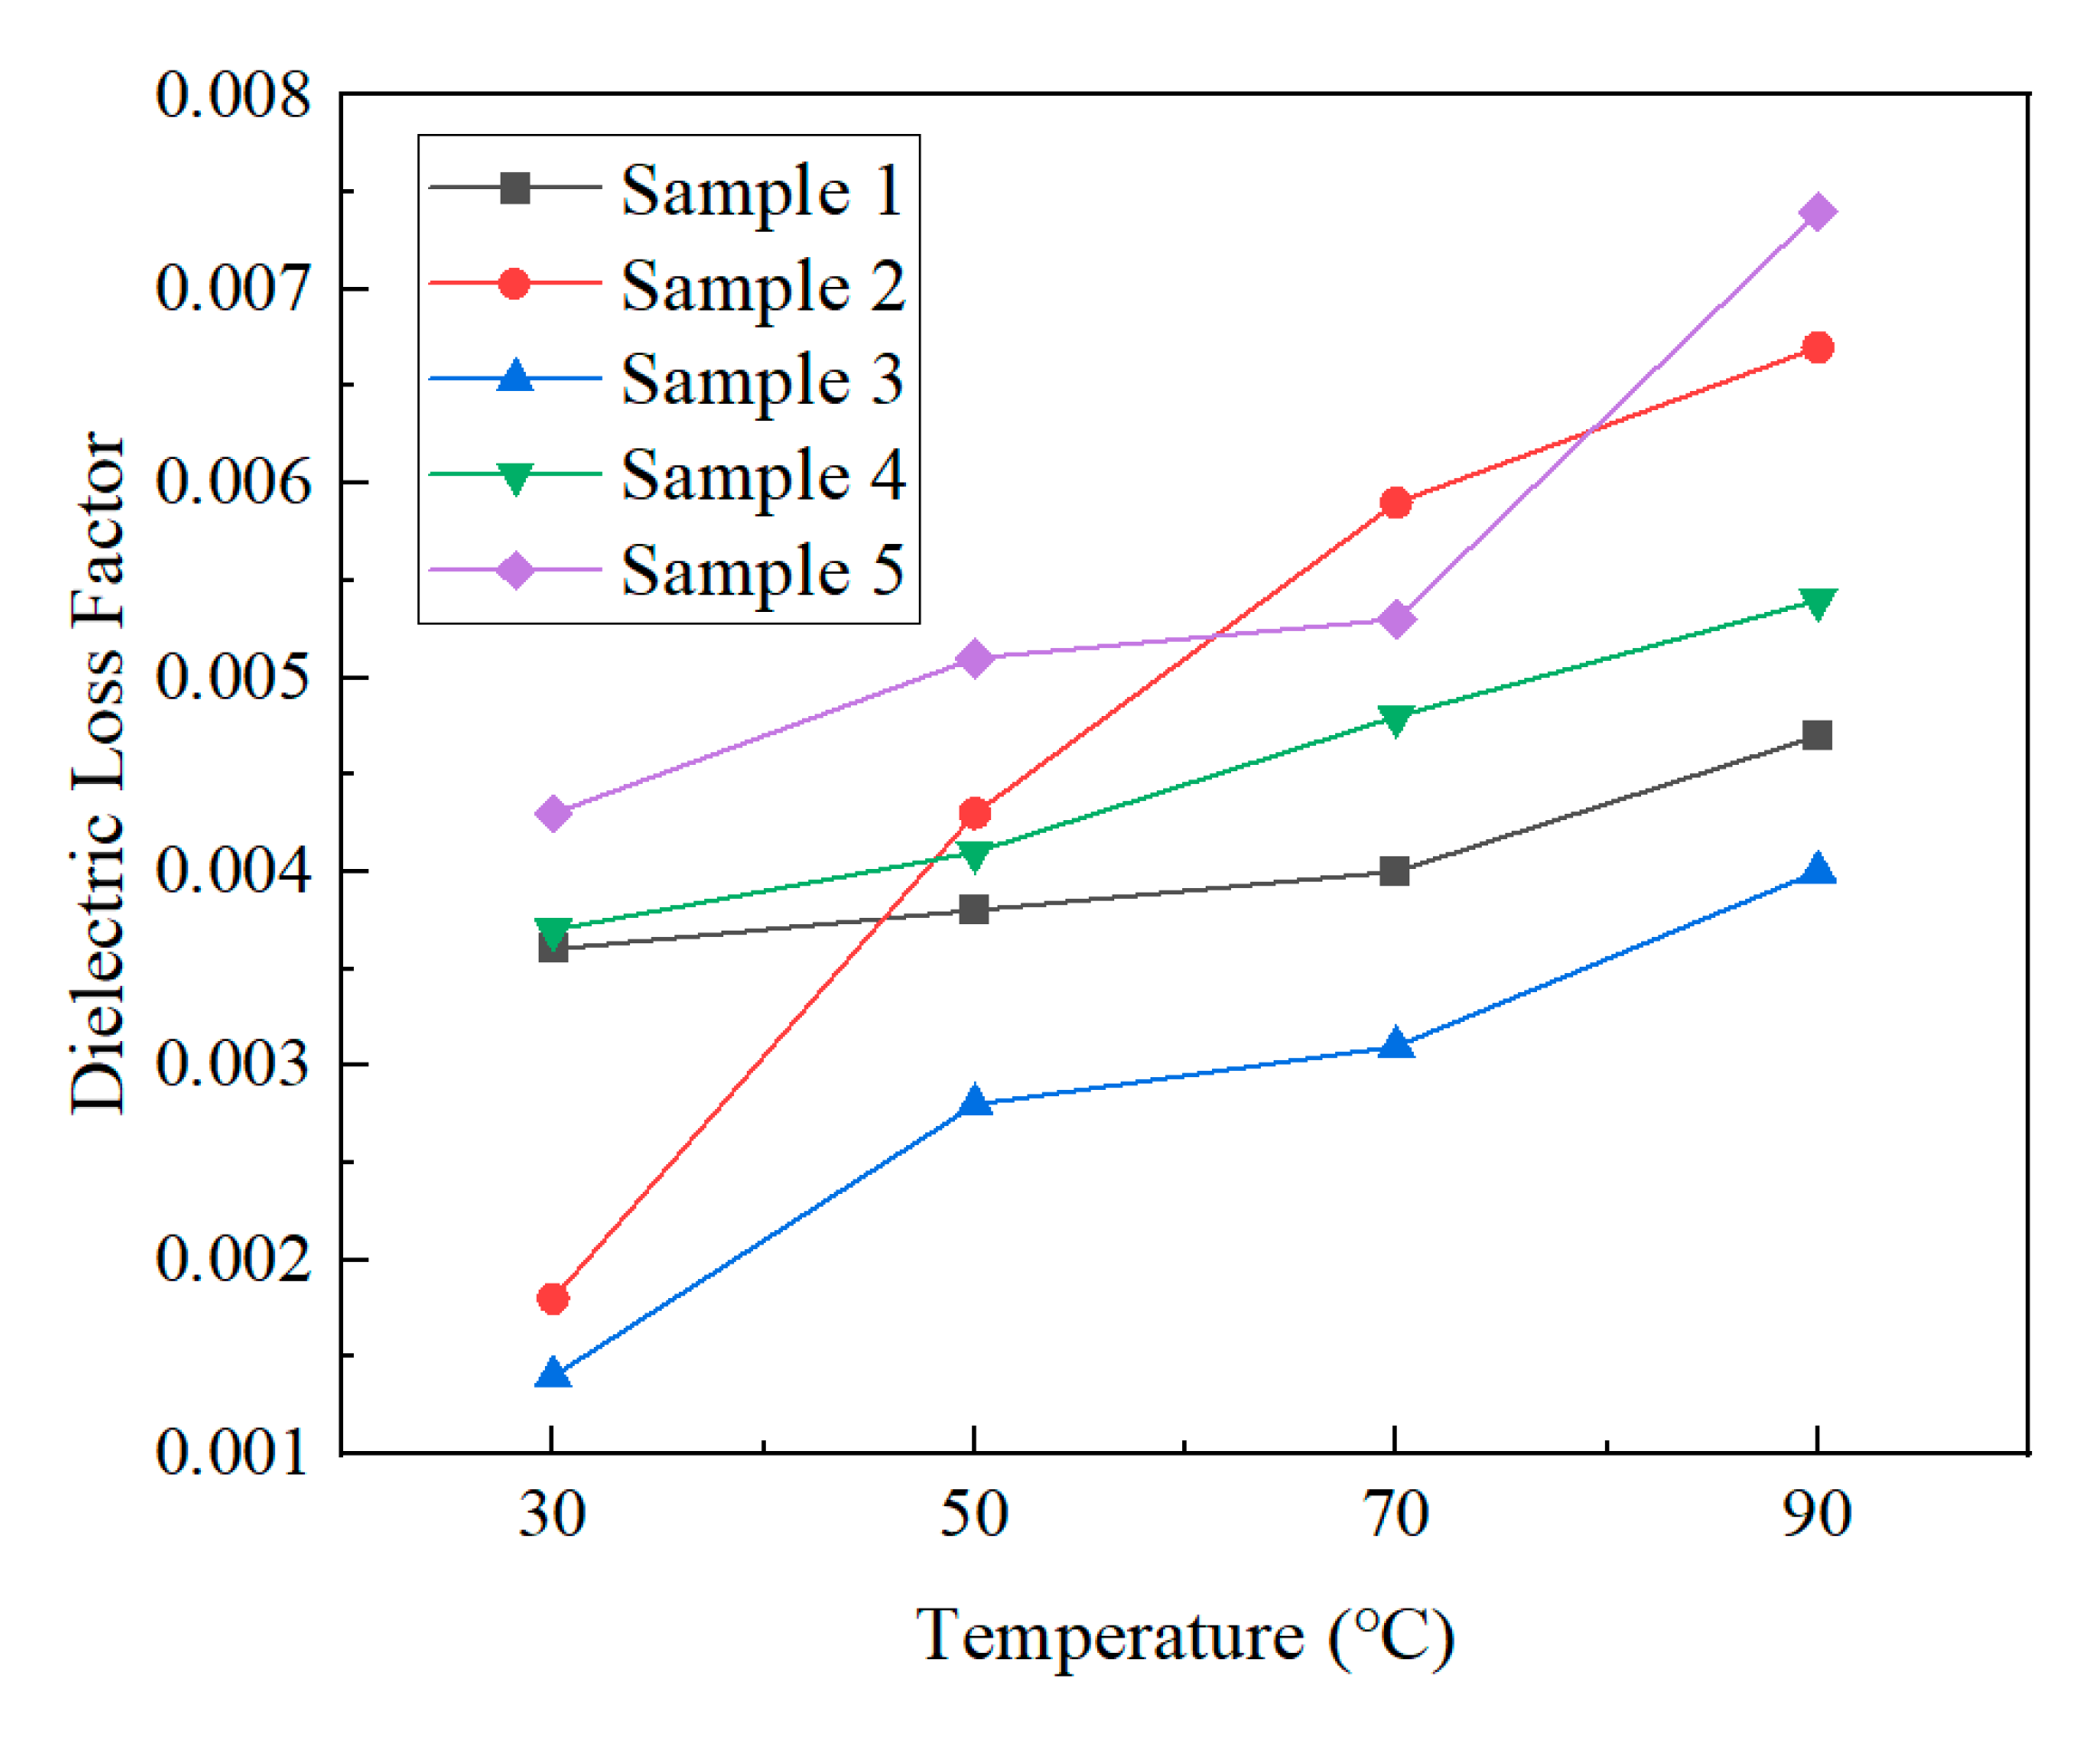
3.2.2. Dielectric Properties
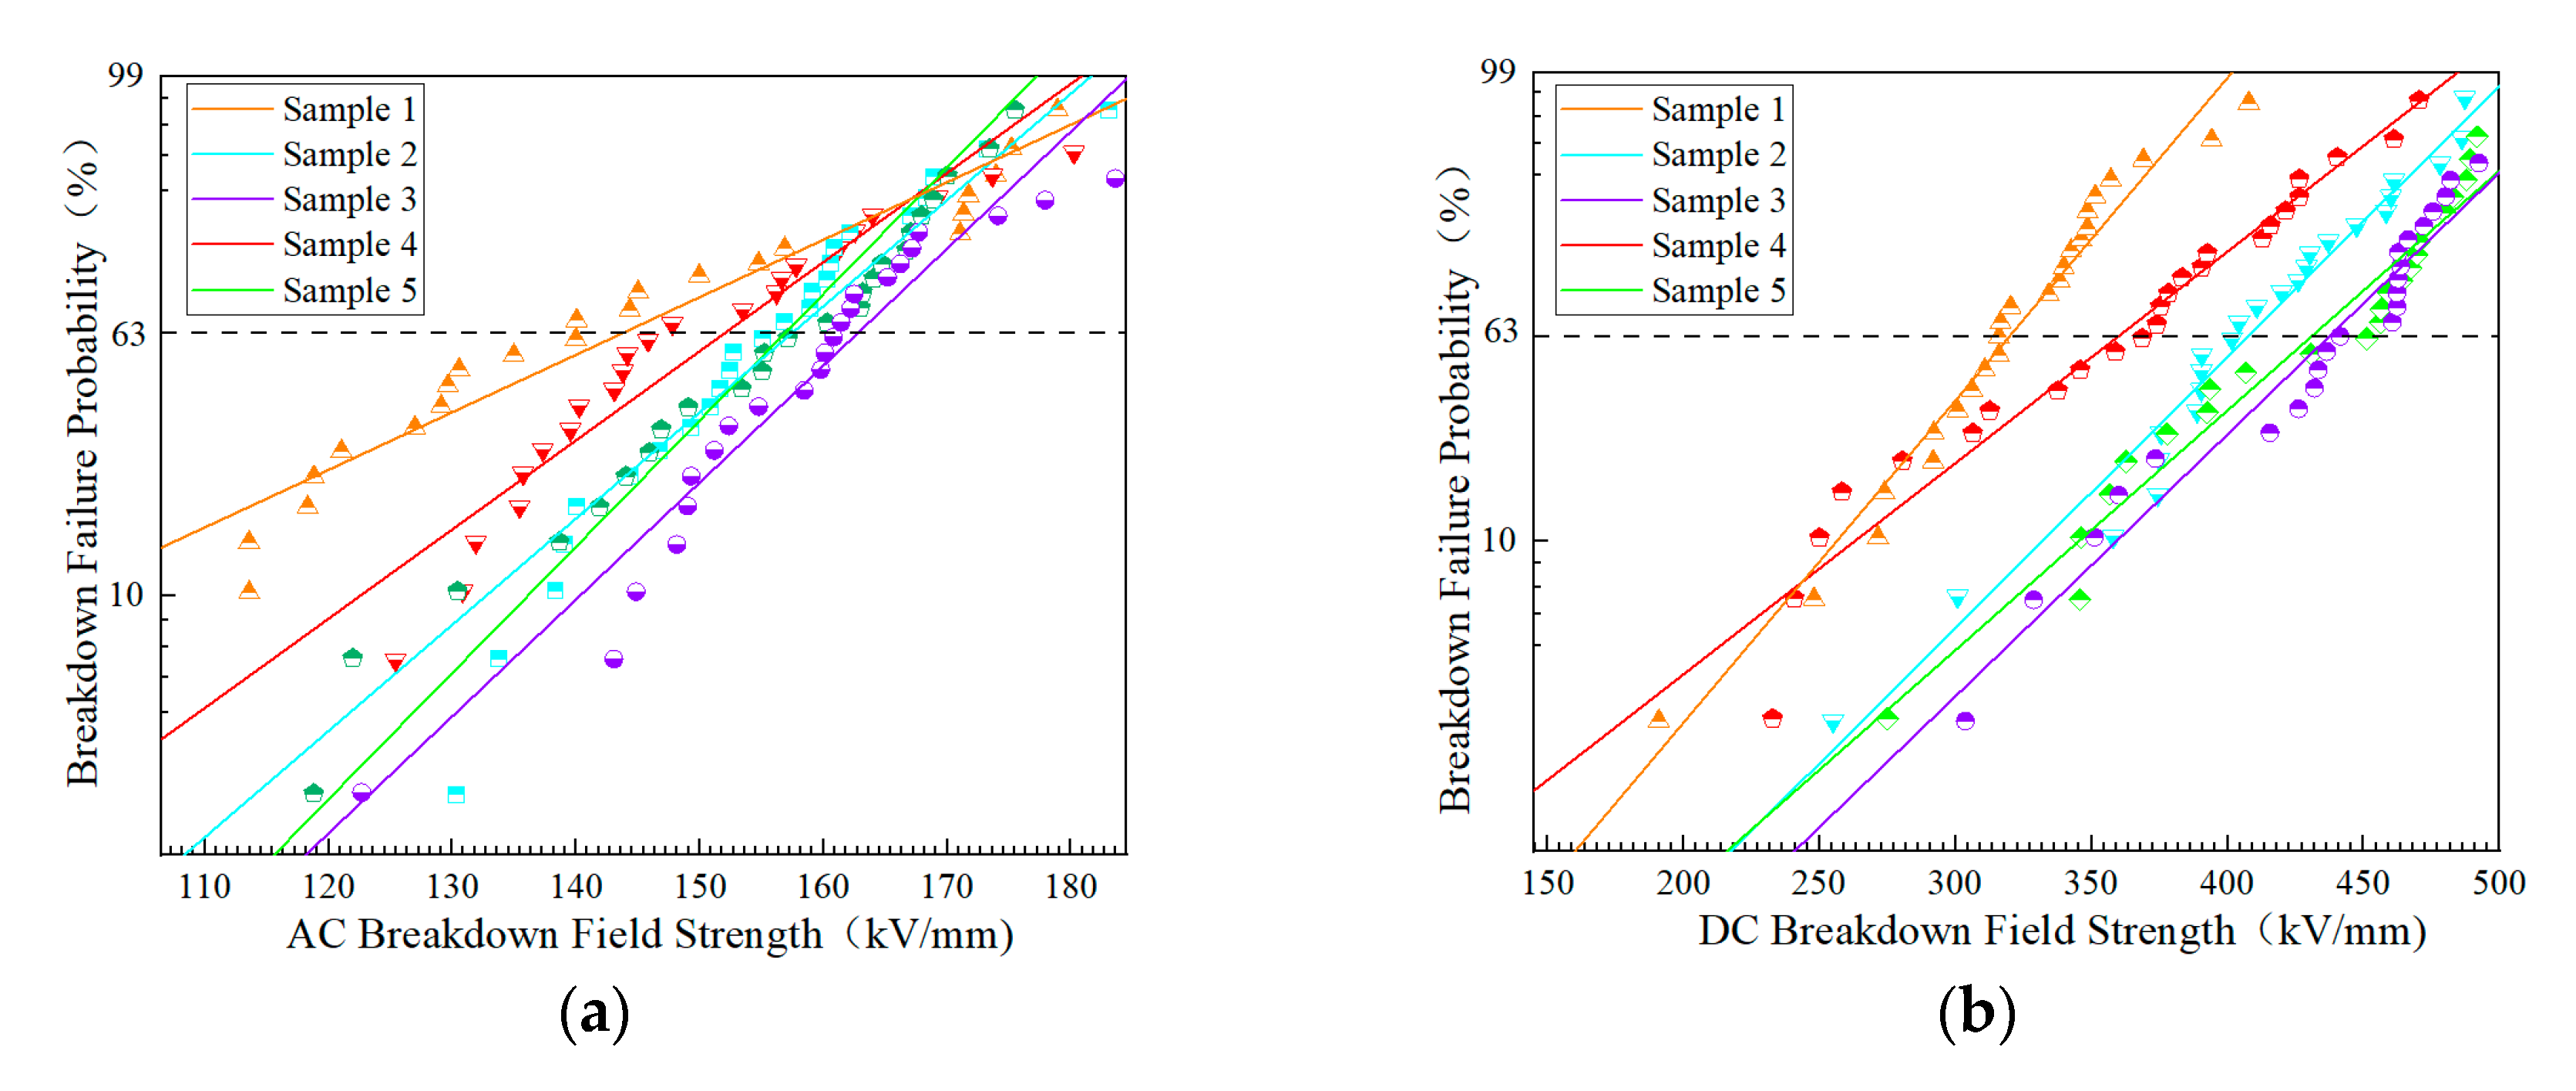
3.2.3. Breakdown Characteristic
4. Analysis and Discussion
4.1. Influence of Microstructure on the Insulating Properties of Polypropylene
4.2. Influence of Macrostructure on the Insulating Properties of Polypropylene
4.3. Preparation and Performance Testing of High-Performance Polypropylene Base Materials
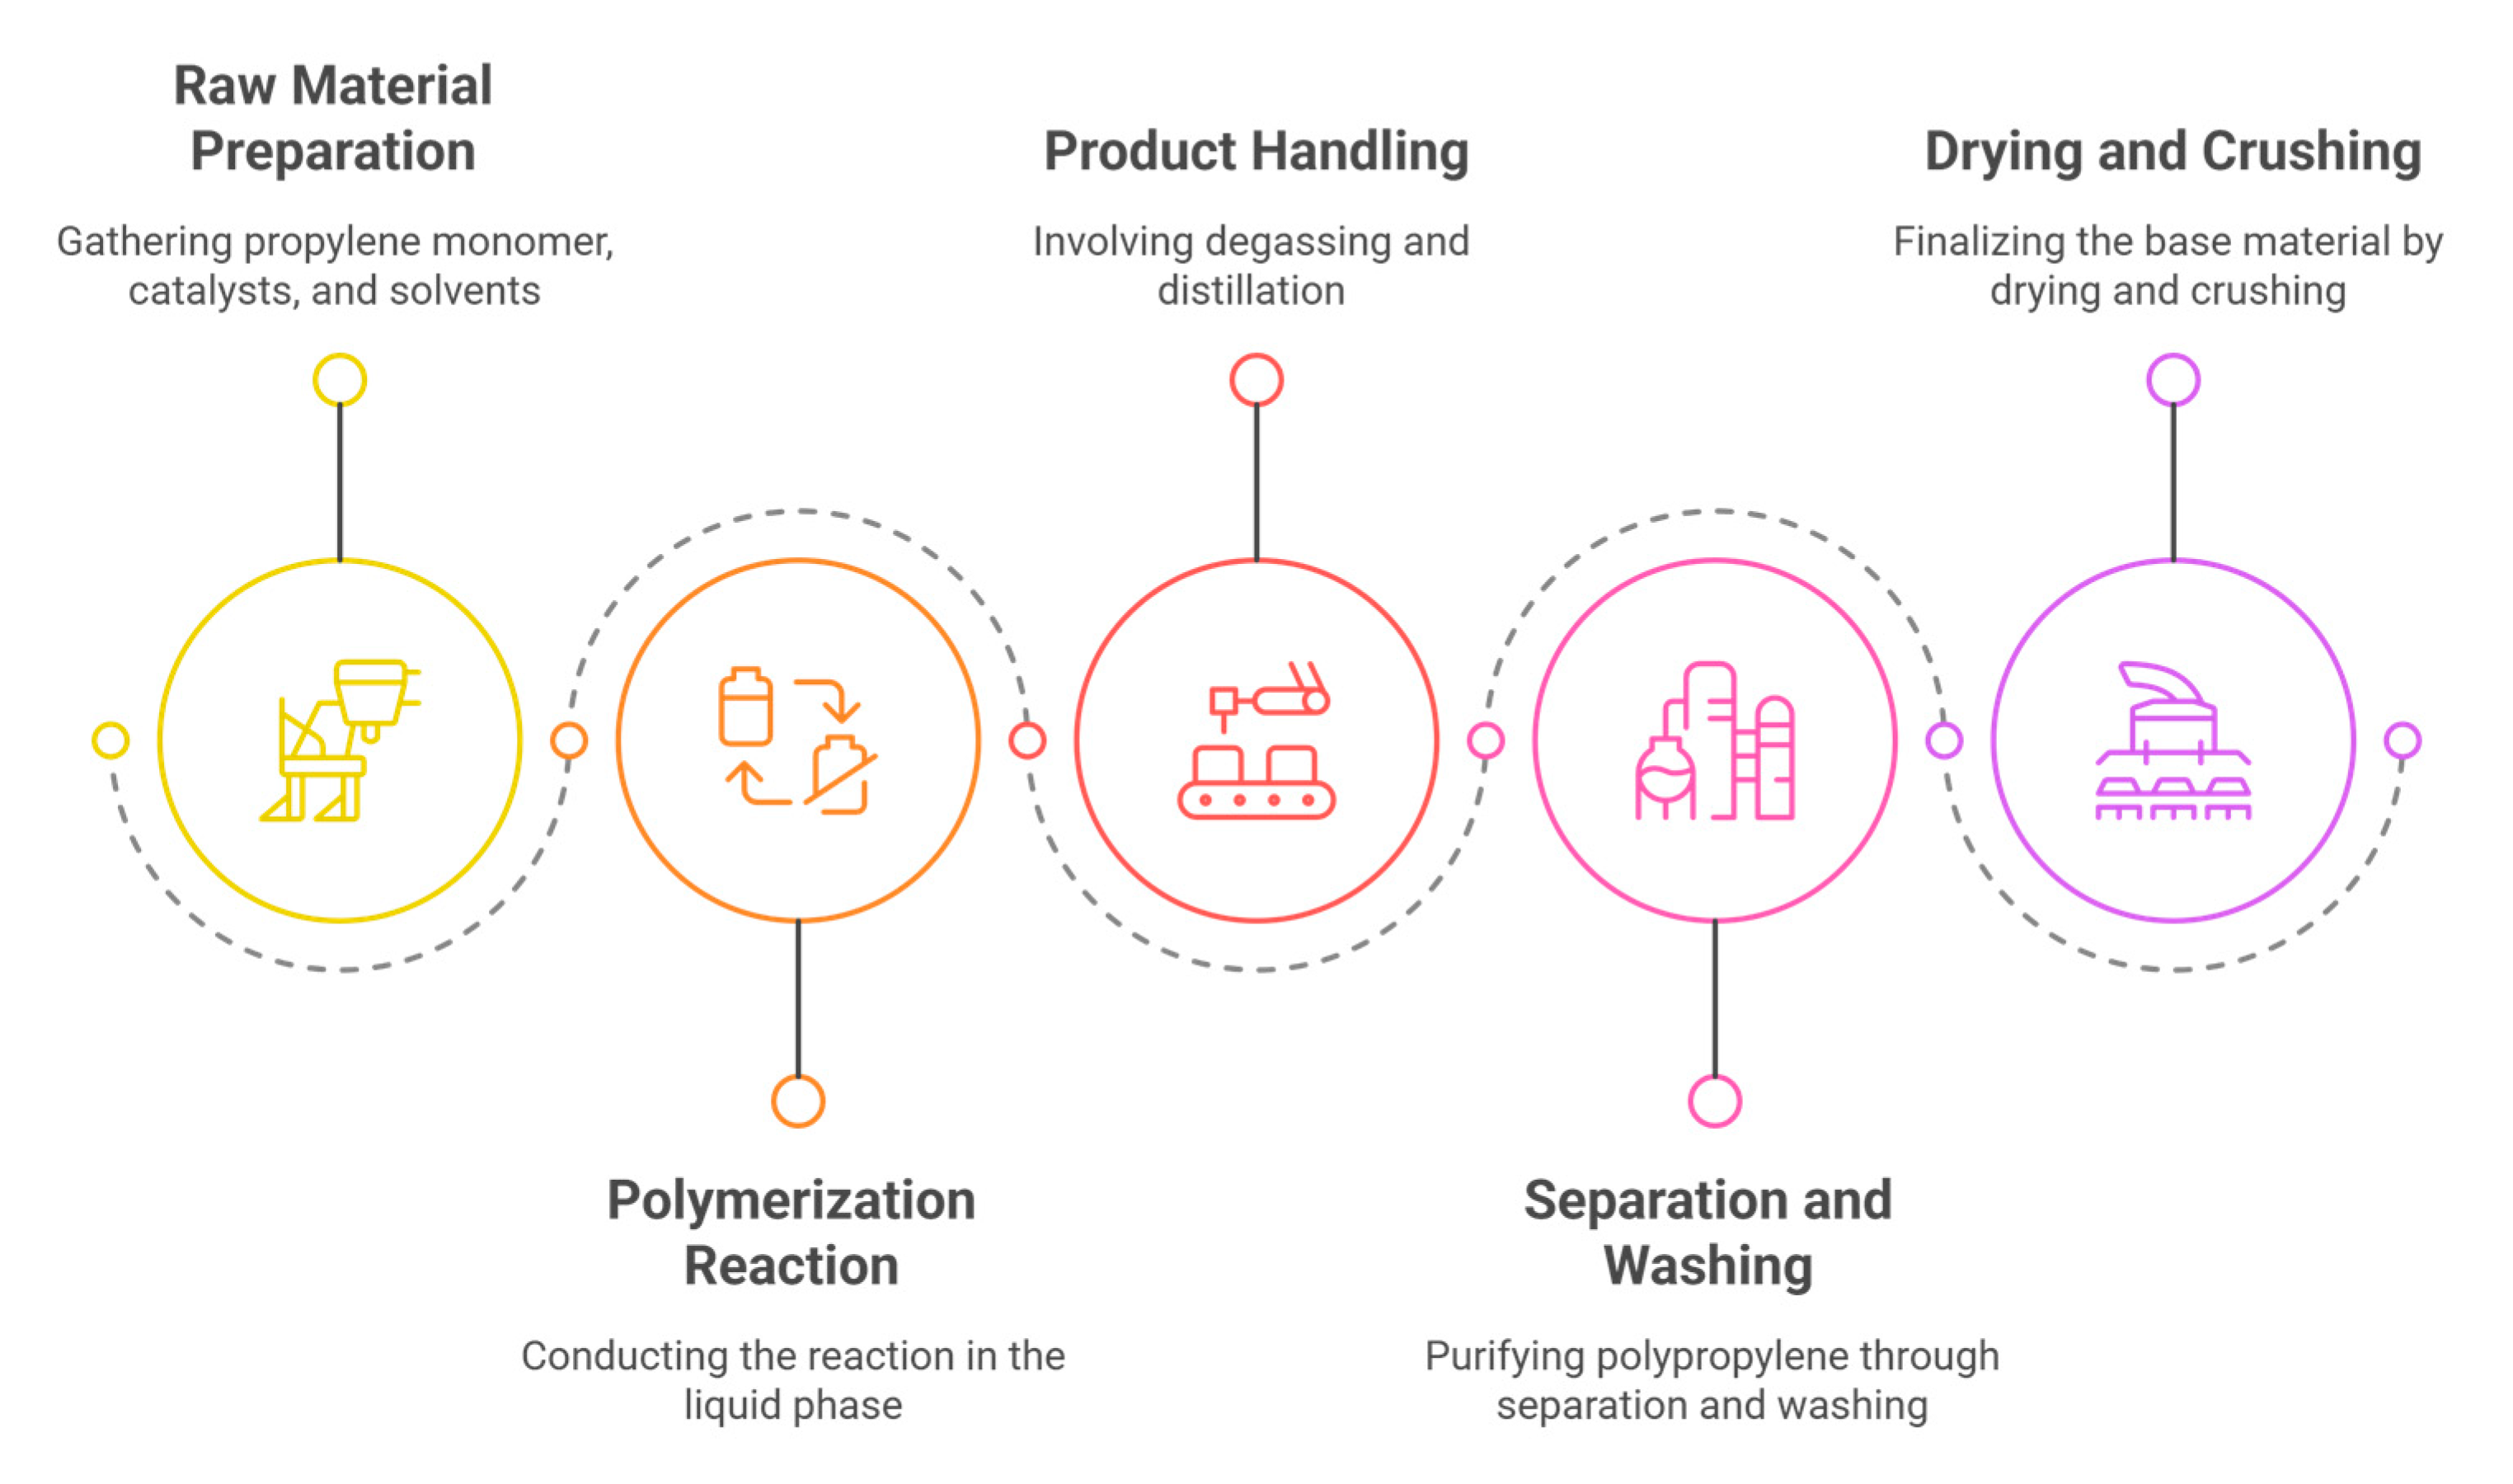
4.3.1. Preparation Process
4.3.2. Catalyst Selection
4.3.3. Performance Testing of Polypropylene Substrates Optimized with Efficient Catalysts
5. Conclusions
- (1)
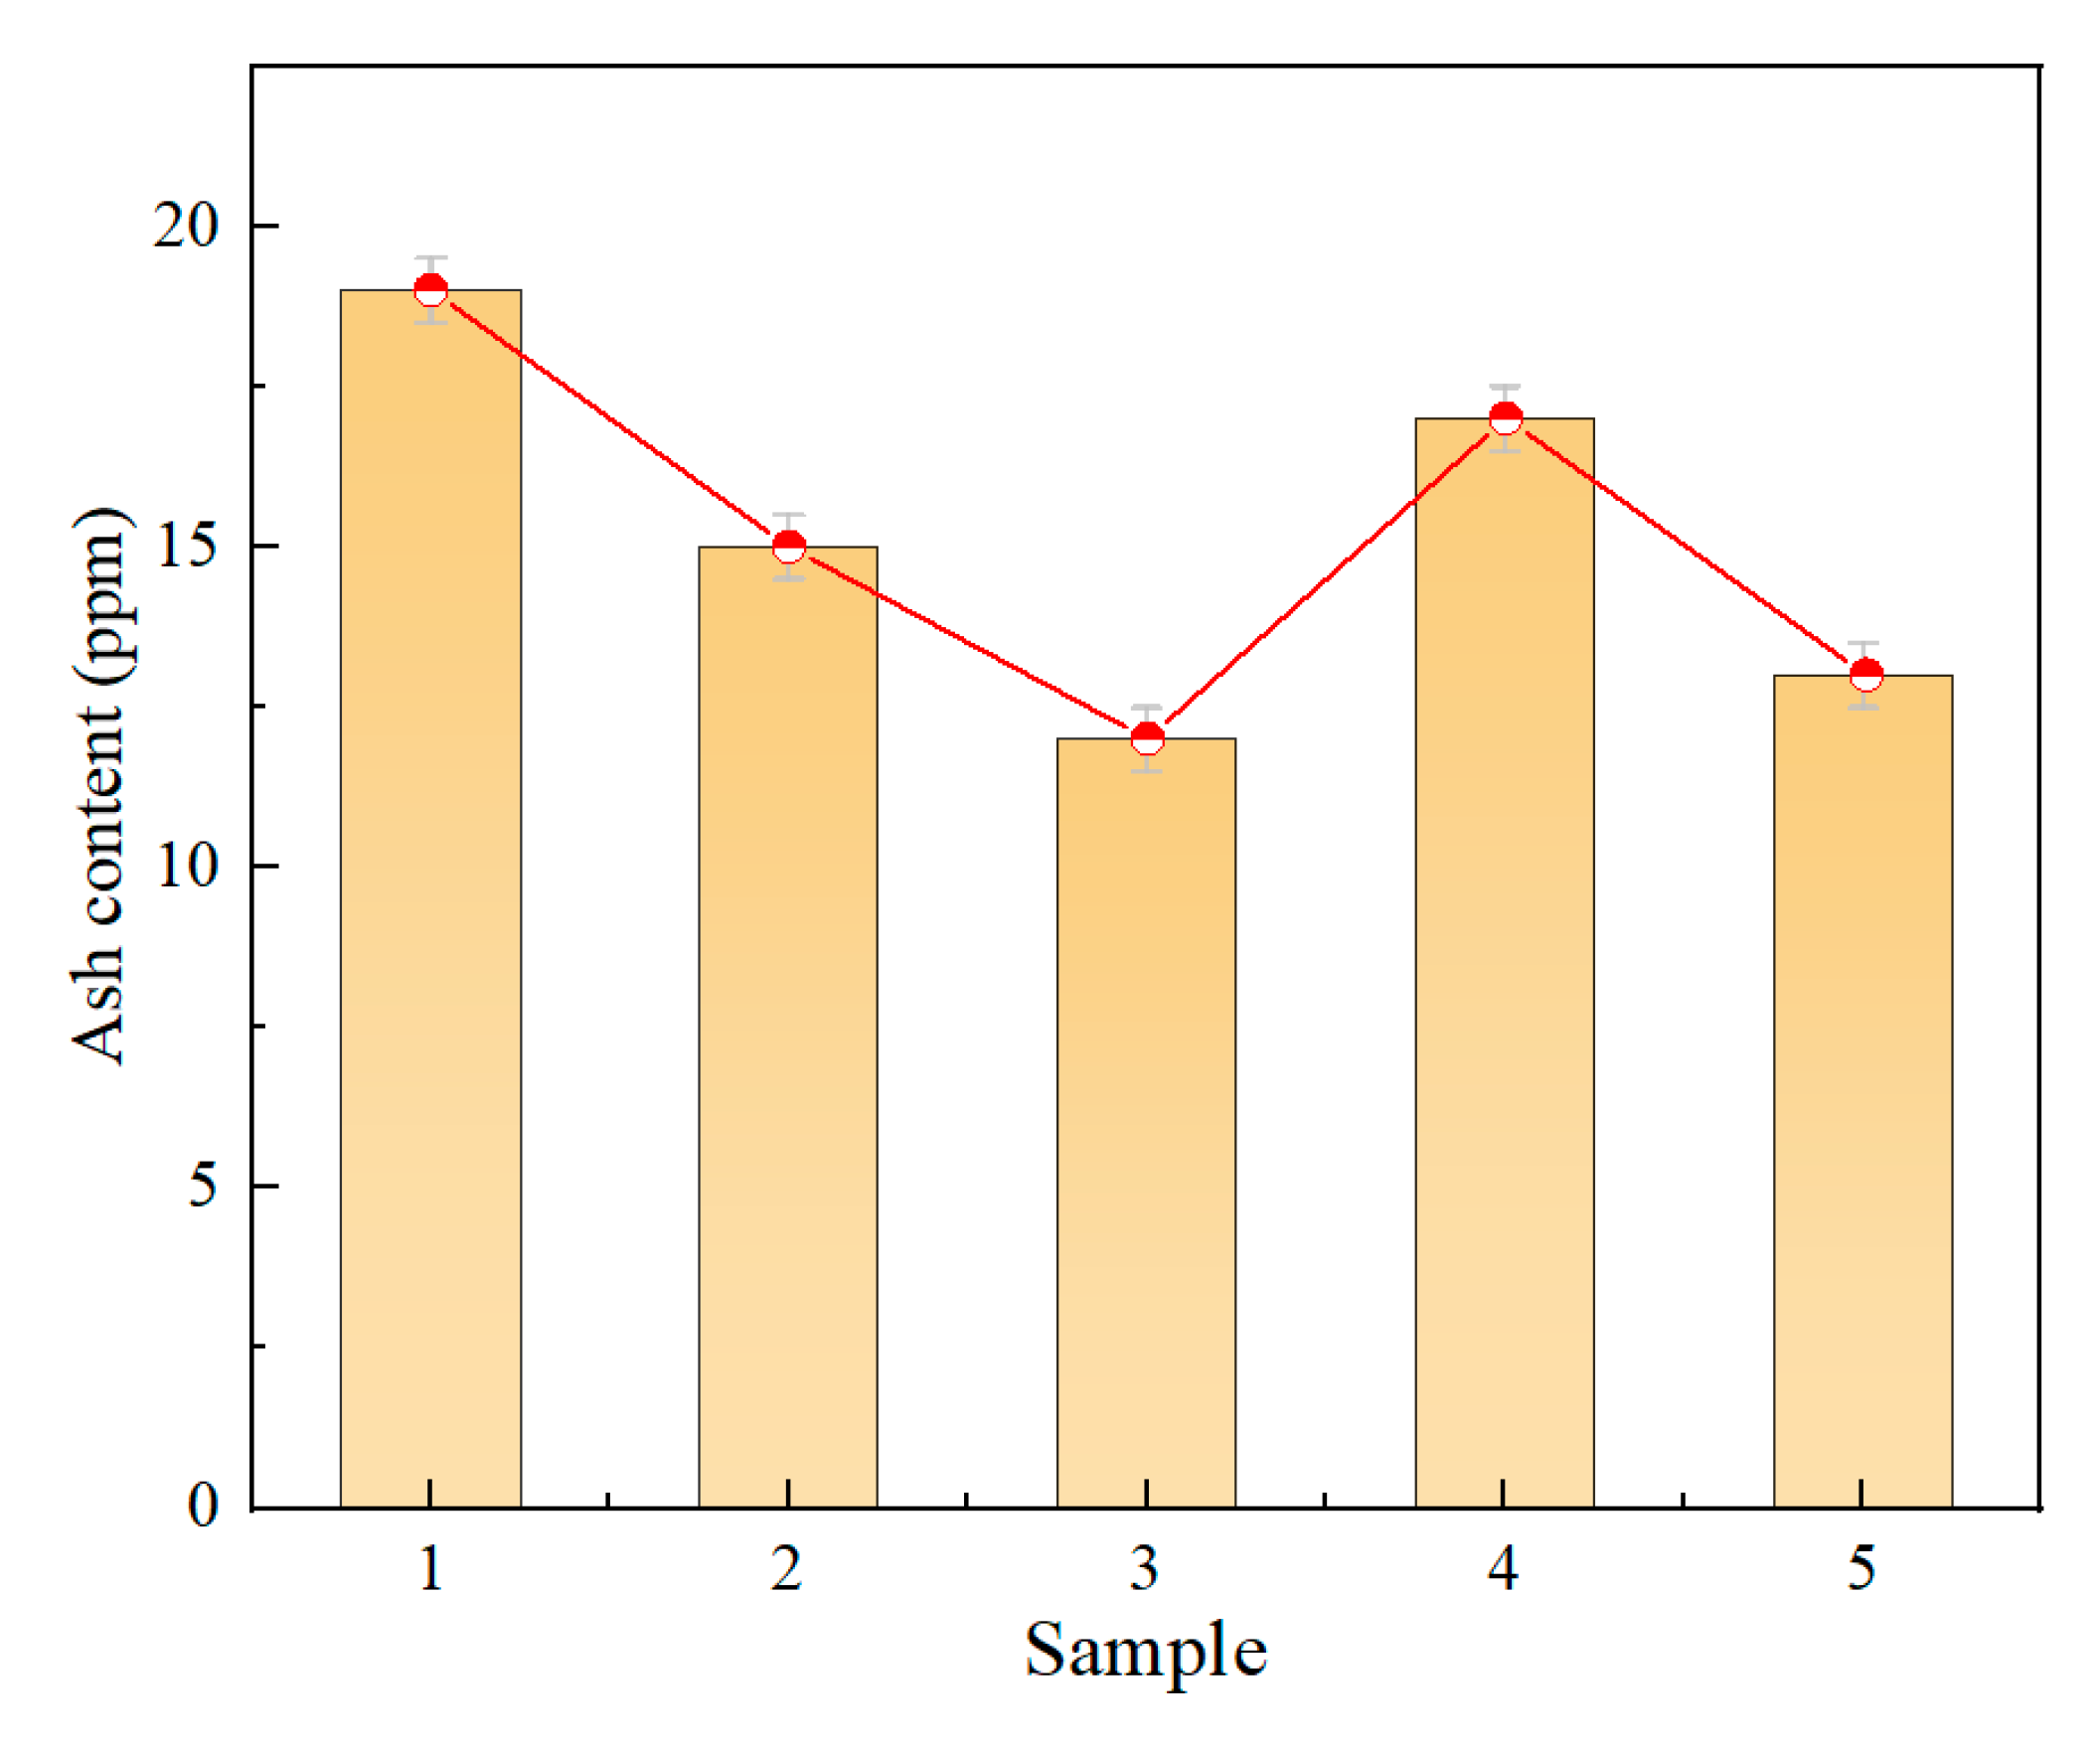
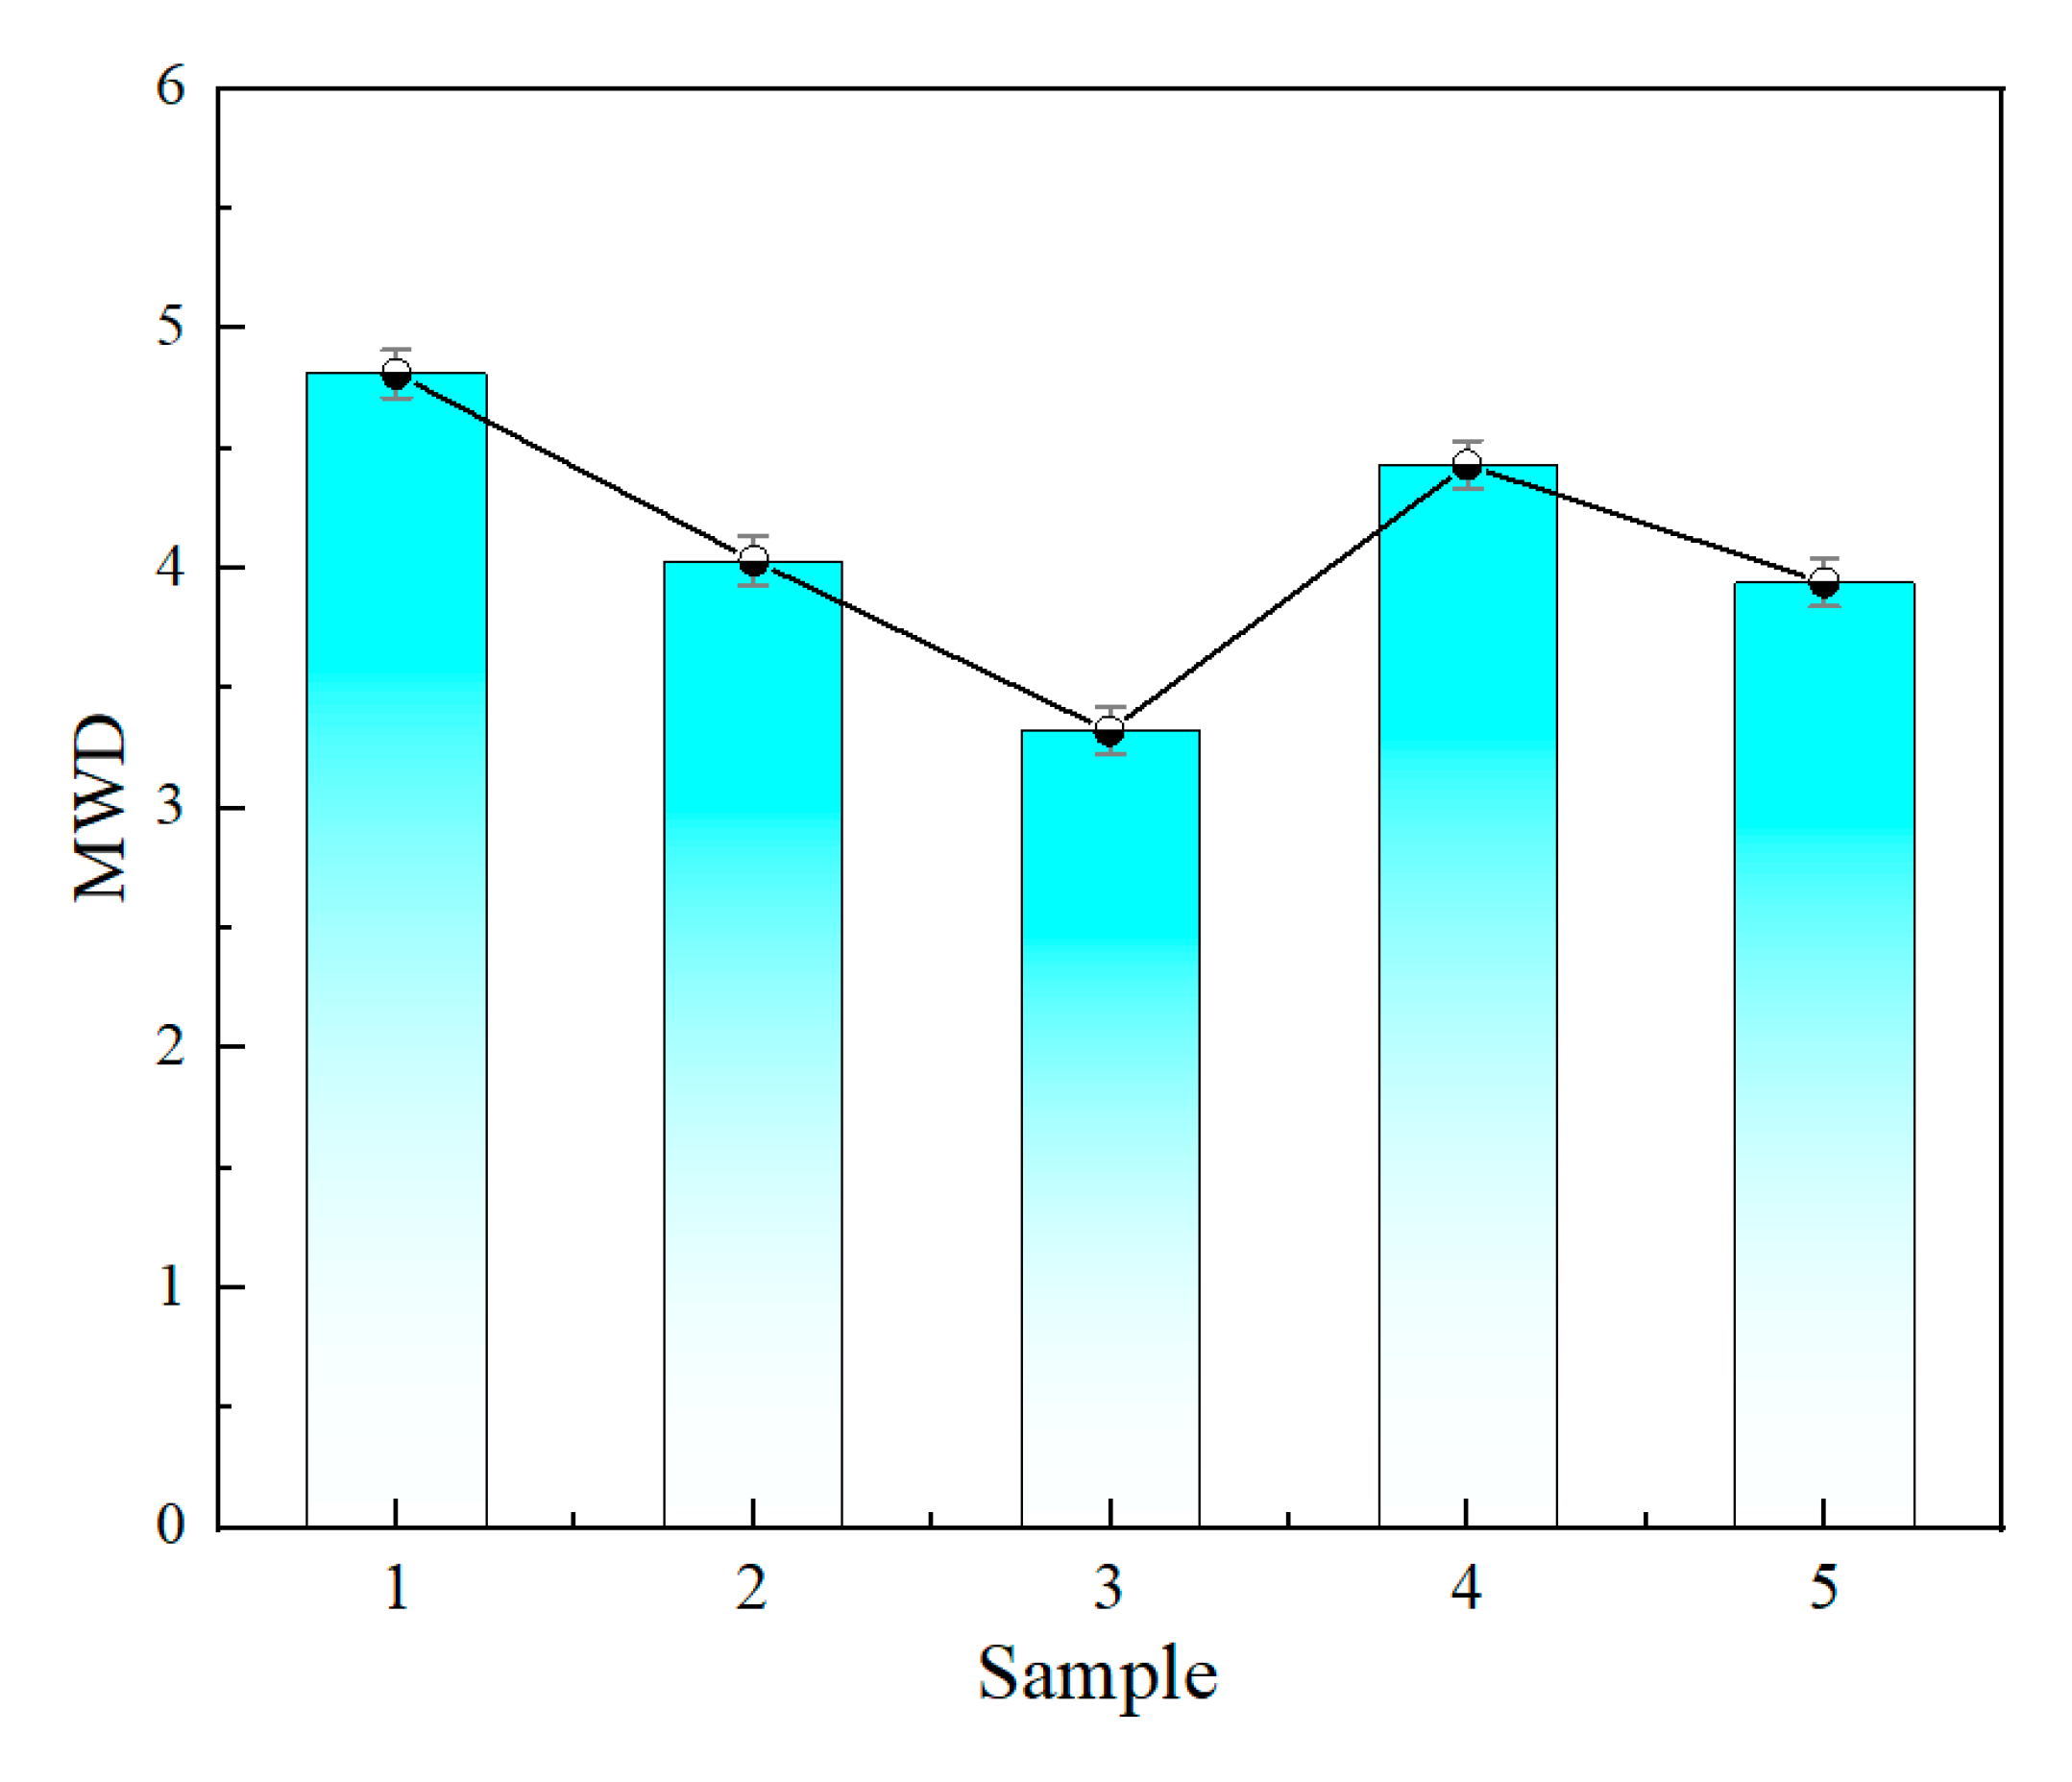
- Microstructural testing of the polypropylene substrates showed that the ash content of the five groups of samples ranged from 12 to 20 ppm, and the ash content was negatively correlated with the insulating properties of the materials. The insulating properties were positively correlated with the molecular weight, and the narrower the molecular weight distribution, the better the performance, with the optimal sample having a molecular weight distribution index as low as 3.32. Infrared spectroscopy analysis showed that all the polypropylene samples had the same functional group structure, which mainly consisted of -CH, -CH2, and -CH3 groups, and no significant structural differences were found.
- (2)
- Macroscopic property tests showed that there were significant differences in molecular weight distribution and crystalline morphology among the samples. Samples 1, 2, and 6 were predominantly α-crystalline, while samples 3 and 4 contained a small amount of β-crystalline. Sample 3 has the lowest weight average molecular weight (333,450) but the highest crystallinity (54.13%), confirming the correlation between molecular structure and mechanical properties. The dielectric properties showed that the temperature increase at constant pressure resulted in a decrease in the dielectric constant and a frequency shift of the dielectric loss peak. Meanwhile, increasing the field strength at constant temperature enhances the dielectric parameter, while increasing frequency triggers a decrease in dielectric constant, and the trend of dielectric loss increasing and then decreasing. The crystallinity is positively correlated with the DC breakdown field strength, and the breakdown field strength of the No. 3 sample is up to 443.31 kV/mm.
- (3)
- Catalysts with different internal electron donors and titanium concentrations exhibited varying polymerization activities in high-performance polypropylene substrate preparation. The catalyst with endo-donor 3 and 5.5% titanium concentration achieved the highest activity of 47.7 kg PP/g cat·h. Optimization by adding 20 mL TEA and adjusting the Al/Ti ratio further increased activity to 51.9 kg PP/g cat·h. The resulting polypropylene showed significant improvements: ash content reduced by 42.1%, molecular weight distribution index dropped to 3.29, and crystallinity increased by 8.74%, demonstrating enhanced properties.
Author Contributions
Funding
Data Availability Statement
Conflicts of Interest
References
- Zhang, Y.; Li, W.; Yin, H.; Wang, C.; Deng, J.; Zhang, G. 3D Printing and Flashover Voltage Test of Polypropylene-based Dielectric Functionally Graded Insulator. In Proceedings of the 2021 International Conference on Advanced Electrical Equipment and Reliable Operation (AEERO), Beijing, China, 15–17 October 2021; pp. 1–5. [Google Scholar]
- Zhao, S.; Li, Z.; Yin, Y.; Du, B. Effect of Functional Grafting on Breakdown Strength and DC Conductivity of Polypropylene Blend Insulation. In Proceedings of the 2024 IEEE 5th International Conference on Dielectrics (ICD), Toulouse, France, 30 June–4 July 2024; pp. 1–4. [Google Scholar]
- Du, B.; Zhang, J.; Xiao, M.; Liu, H.; Ran, Z. Dielectric Breakdown Performance of Deashed Polypropylene for HVDC Film Capacitors. IEEE Trans. Dielectr. Electr. Insul. 2022, 29, 2209–2217. [Google Scholar] [CrossRef]
- Hu, S.; Zhang, W.; Wang, W.; Li, J.; Shao, Q.; Zhang, Y.; Zhang, Q.; Huang, S.; Hu, J.; Li, Q.; et al. Comprehensive Comparisons of Grafting-Modified Different Polypropylene as HVDC Cable Insulation Material. IEEE Trans. Dielectr. Electr. Insul. 2022, 29, 1865–1872. [Google Scholar] [CrossRef]
- Bajpai, A.; Sharma, N.; Dwivedi, P.K.; Sharma, R. Rapid Fabrication of Graphene Layers Over Polymeric Substrates Using Atmospheric Pressure Plasma Jet. IEEE Trans. Plasma Sci. 2023, 51, 726–732. [Google Scholar] [CrossRef]
- Zhou, Y.; Hu, S.; Yuan, C.; Hu, J.; Li, Q.; He, J. Recyclable Polypropylene-Based Insulation Materials for HVDC Cables: Progress and Perspective. CSEE J. Power Energy Syst. 2024, 10, 2208–2220. [Google Scholar]
- Xing, Z.; Guo, S.; Hao, J.; Qi, B.; Xiao, M. Effect of Stretching Ratio on Dielectric Properties of Polypropylene Film for Capacitor in SMES. IEEE Trans. Appl. Supercond. 2024, 34, 5702804. [Google Scholar] [CrossRef]
- Azmi, A.; Lau, K.Y.; Ahmad, N.A.; Abdul-Malek, Z.; Tan, C.W.; Ching, K.Y.; Vaughan, A.S. Structure-Dielectric Property Relationship in Polypropylene/Multi-Element Oxide Nanocomposites. IEEE Trans. Nanotechnol. 2021, 20, 377–385. [Google Scholar] [CrossRef]
- Yang, K.; Ren, Y.; Jing, Z.; Zhang, Z.; Dong, J.-Y.; Wu, K.; Li, J. Enhancement in Electrical Properties of Impact Polypropylene Copolymer for Cable Insulation Induced by Rapid Cooling. IEEE Trans. Dielectr. Electr. Insul. 2023, 30, 247–254. [Google Scholar] [CrossRef]
- Wang, W.; Jiang, W.; Yan, L.; Yang, D.; Ma, F. Polypropylene’s Crystallization Morphology During the Non-Isothermal Crystallization Process and Its Electrical Properties. IEEE Access 2024, 12, 145118–145129. [Google Scholar] [CrossRef]
- Hou, Z.; Du, B.; Li, Z.; Li, J. Effects of radical scavenger on space charge accumulation of PP/ULDPE composites for HVDC cable insulation. IEEE Trans. Dielectr. Electr. Insul. 2020, 27, 989–997. [Google Scholar] [CrossRef]
- Xing, Z.; Zhang, C.; Fan, M.; Wu, P.; Chen, X.; Li, Z. Trap Level Characteristics and DC Breakdown Performance of Isotactic/Syndiotactic/Atactic Polypropylene Blend Insulation. IEEE Access 2020, 8, 220840–220847. [Google Scholar] [CrossRef]
- Chang, T.; Zhang, X.; Guo, Q.; Li, Y.; Liu, L.; Cui, H.-L. Terahertz Dielectric Spectroscopy Based Thermal Aging Analysis of Polypropylene. IEEE Trans. Terahertz Sci. Technol. 2020, 10, 363–369. [Google Scholar] [CrossRef]
- Liu, H.; Du, B.X.; Xiao, M.; Ran, Z.Y. Improved Breakdown Strength of Polypropylene Capacitor Film Based on Surface Grafting. In Proceedings of the 2022 IEEE 4th International Conference on Dielectrics (ICD), Palermo, Italy, 3–7 July 2022; pp. 659–663. [Google Scholar]
- Zhu, W.; Wang, H.; Luo, Y.; Xu, R.; Du, B.; Zhou, M. Development of a polypropylene insulation material for medium voltage AC and DC cables. In Proceedings of the 2024 IEEE International Conference on High Voltage Engineering and Applications (ICHVE), Berlin, Germany, 18–22 August 2024; pp. 1–4. [Google Scholar]
- Wu, Z.; Wang, Z.; Liu, J.; Zhong, S.; Wang, J. Huang. Study on the Structure–Function Relationship Between Metallized Layer and Self-Healing Morphology in Metallized Film. IEEE Trans. Plasma Sci. 2024, 52, 5366–5375. [Google Scholar] [CrossRef]
- Cao, J.; Li, K.; Xing, Y.; Du, B.; Fan, Z. Electrical Properties and Thermo-Oxygen Stability of Polypropylene Modified by Polydopamine. IEEE Trans. Appl. Supercond. 2024, 34, 7700804. [Google Scholar] [CrossRef]
- Lin, X.; Lin, C.; Siew, W.H.; Liggat, J.; Given, M.; He, J. The Influence of Octaphenyl POSS Addition on the Electro-aging Characteristics of Polypropylene. In Proceedings of the 2022 IEEE International Conference on High Voltage Engineering and Applications (ICHVE), Chongqing, China, 25–29 September 2022; pp. 1–4. [Google Scholar]
- Xing, Z.; Guo, S.; Zhang, M.; Xiao, M.; Du, B.; Zhang, C.; Cui, H.; Dai, X.; Li, F. Improvement of Breakdown Performance of Long-chain Branched Polypropylene for Film Capacitors Based on Crystallization Control. In Proceedings of the 2022 IEEE Conference on Electrical Insulation and Dielectric Phenomena (CEIDP), Denver, CO, USA, 30 October–2 November 2022; pp. 183–186. [Google Scholar]
- Wang, X.; An, Z.; Zhuo, M. Energy Storage Performance and Dielectric Properties of Surface Fluorinated BOPP Films. IEEE Trans. Dielectr. Electr. Insul. 2023, 30, 1950–1957. [Google Scholar] [CrossRef]
- IEC 60674-3-1:2021; Plastic Films for Electrical Purposes–Part 3: Specifications for Individual Materials–Sheet 1: Biaxially Oriented Polypropylene (PP) Films for Capacitors. International Electrotechnical Commission: Geneva, Switzerland, 2021.
- Chi, Q.; Wang, T.; Zhang, C.; Yu, H.; Zhao, X. Significantly improved high-temperature energy storage performance of commercial BOPP films by utilizing ultraviolet grafting modification. iEnergy 2022, 1, 374–382. [Google Scholar] [CrossRef]


| Parameters | Clarification |
|---|---|
| Wavelength range | 7800 cm−1–350 cm−1 |
| Resolution | 0.4–1.0 |
| SNR | ≥45,000:1 |
| Performance Indicators | Parameter Range |
|---|---|
| Frequency | 3 μHz–20 MHz |
| Temperature | −160 °C–400 °C |
| Voltage | 0–2000 V(DC) |
| Sample | AC | DC |
|---|---|---|
| 1 | 6.33 | 7.34 |
| 2 | 11.45 | 6.84 |
| 3 | 12.43 | 5.15 |
| 4 | 7.64 | 6.8 |
| 5 | 10.14 | 6.77 |
| Absorption Peak Wave Number/cm−1 | Corresponding Wave Number Range/cm−1 | Corresponding Vibration Mode |
|---|---|---|
| 2950.24 | 3000~2700 | Saturated C-H stretching vibration |
| 2917.48 | 3000~2700 | Saturated C-H stretching vibration |
| 2868.07 | 3000~2700 | Saturated C-H stretching vibration |
| 2838.43 | 3000~2700 | Saturated C-H stretching vibration |
| 1454.02 | 1500~1350 | Bending vibrations in saturated C-H surfaces |
| 1375.09 | 1500~1350 | Bending vibrations in saturated C-H surfaces |
| Sample | Crystallization |
|---|---|
| 1 | α |
| 2 | α |
| 3 | α, β |
| 4 | α, β |
| 5 | α |
| Sample | AC Breakdown Field Strength (kV/mm) | Shape Parameter | DC Breakdown Field Strength (kV/mm) | Shape Parameter |
|---|---|---|---|---|
| 1 | 140.80 | 6.33 | 316.62 | 7.34 |
| 2 | 157.33 | 11.45 | 398.45 | 6.80 |
| 3 | 165.39 | 10.14 | 441.31 | 6.84 |
| 4 | 154.58 | 7.64 | 362.33 | 5.15 |
| 5 | 157.99 | 12.43 | 433.26 | 6.77 |
| Catalyst | Internal Electron Donor | Ti (wt%) | Polymerization Activity (kg PP/g cat·h) |
|---|---|---|---|
| 1 (Cat 1) | 1 | 3.1 | 26.7 |
| 2 (Cat 2) | 2 | 5.5 | 19.4 |
| 3 (Cat 3) | 3 | 5.5 | 47.7 |
| Number | TEA (wt% = 10%)/mL | Al/Ti (mol/mol) | Activity (kg PP/g cat·h) | Polymer (MFR/g/10 min) |
|---|---|---|---|---|
| 1 | 5 | 82.6 | 0 | - |
| 2 | 10 | 165.2 | 23.7 | 3.2 |
| 3 | 15 | 247.8 | 44.9 | 1.3 |
| 4 | 20 | 330.4 | 48.9 | 1.4 |
| Sample | Ash Content (ppm) | MWD | Crystallinity (%) |
|---|---|---|---|
| 1 | 19 | 4.81 | 51.54 |
| 2 | 15 | 4.03 | 52.97 |
| 3 | 12 | 3.32 | 54.28 |
| 4 | 17 | 4.43 | 52.73 |
| 5 | 13 | 3.94 | 53.47 |
| 6 | 11 | 3.29 | 56.15 |
Disclaimer/Publisher’s Note: The statements, opinions and data contained in all publications are solely those of the individual author(s) and contributor(s) and not of MDPI and/or the editor(s). MDPI and/or the editor(s) disclaim responsibility for any injury to people or property resulting from any ideas, methods, instructions or products referred to in the content. |
© 2025 by the authors. Licensee MDPI, Basel, Switzerland. This article is an open access article distributed under the terms and conditions of the Creative Commons Attribution (CC BY) license (https://creativecommons.org/licenses/by/4.0/).
Share and Cite
Xing, Z.; Ge, H.; Li, D.; Guo, S.; Yang, B.; Gao, C.; Qi, B.; Hao, J. Molecular and Microstructural Engineering Strategies for High-Performance Polypropylene Insulation Materials. Energies 2025, 18, 2136. https://doi.org/10.3390/en18082136
Xing Z, Ge H, Li D, Guo S, Yang B, Gao C, Qi B, Hao J. Molecular and Microstructural Engineering Strategies for High-Performance Polypropylene Insulation Materials. Energies. 2025; 18(8):2136. https://doi.org/10.3390/en18082136
Chicago/Turabian StyleXing, Zhaoliang, Hao Ge, Deshen Li, Shaowei Guo, Bo Yang, Chunjia Gao, Bo Qi, and Jianhong Hao. 2025. "Molecular and Microstructural Engineering Strategies for High-Performance Polypropylene Insulation Materials" Energies 18, no. 8: 2136. https://doi.org/10.3390/en18082136
APA StyleXing, Z., Ge, H., Li, D., Guo, S., Yang, B., Gao, C., Qi, B., & Hao, J. (2025). Molecular and Microstructural Engineering Strategies for High-Performance Polypropylene Insulation Materials. Energies, 18(8), 2136. https://doi.org/10.3390/en18082136