Abstract
Lightweight aggregate concretes (LWAC) are versatile and interesting materials for projects that require greater structural efficiency. Due to the difference that exists between the densities of the materials used in these types of concrete, during transport and mainly compaction, their aggregates tend to separate from the mortar matrix, floating towards the surface, a phenomenon called segregation. Segregation in LWAC can affect its durability properties, its density, and directly affect its structural efficiency. In this work, different concrete densities (1700 kg/m3 and 1900 kg/m3) manufactured with different dosages (two different lightweight aggregates) and compaction methods (one or two layers) were analyzed to verify the impact of segregation on its structural efficiency. For this purpose, the segregation index of the LWAC was obtained by means of the image analysis technique. In addition, to obtain their structural efficiency, the density and compressive strength were obtained at different heights of the tested specimens. The results show the vibration of the samples in two layers leads to a more efficient elimination of trapped air, a reduction in the risk of segregation, and better structural efficiency.
1. Introduction
The ability of a concrete mixture to maintain the homogeneous distribution of all its components is key to success in the application of concrete [1]. The segregation of concrete components is a complex phenomenon and its cause can come from different reasons [2,3]. Concrete compacted with the same level of energy showed different levels of segregation depending on how the compaction was performed [4]. The results of Navarrete and Lopez [5] indicate that the size and shape of the aggregates are other factors that can affect the occurrence of segregation. Previous studies of Solak et al. [6] showed that the combined effect of reducing the concrete density and consistency contributed to the segregation-resistance of the concrete.
The segregation and bleeding of fresh mixture has a dramatic negative impact on the mechanical properties [7,8,9] of hardened concrete as wells as on its durability properties [10]. Traditionally, researches that involve the segregation of concrete were based on visual observation. However, recent research shows that is not always as clear [2,11]. The heterogeneity of concrete can be usually reflected by the volume fraction variation of coarse aggregates along depth and it often arises from gravity [12] induced particle migration.
The inclusion of lightweight aggregates (LWA) in concrete in certain situations can affect its mechanical properties [13], its capillary absorption [14], its oxygen permeability [15], its porosity, and its fluid transport properties [16]. According to studies published by Bogas and Gomes [17], the influence of LWA on LWAC strength increases when LWAs density decreases, when mortar resistance increases and when concrete ages. Some studies have highlighted the importance of analyzing the volume fraction of lightweight aggregates in LWAC considering that variations in dosage can lead to important variations in the LWAC mechanical properties [18,19]. In normal weight concrete, the aggregate strength is not a factor affecting concrete strength because the aggregate is much stronger than the matrix and the transition zone [20]. However, in LWAC, the constituent LWA may have a lower strength and elastic modulus than the mortar matrix, and thus the properties of the LWA are the most important determinants of the properties of the resulting concrete [21] and usually the failure of concrete then is controlled by aggregate fracture [19].
Structural efficiency can be defined in many ways [22] but is usually the value of the load supported by material to its weight. Several researches have used this term for analyzing the performance of different materials [23,24]. Considering that one of the most interesting characteristics of LWAC is its reduced weight, a possible natural tendency for a designer when using this material would be to seek the best density- strength ratio and, as described by Bogas et al. [13], the ratio between compressive strength (fc) and density (ρ) of material enables an analysis of its structural efficiency. To what extent should concrete segregation be predicted in an analysis like this? Would this be a phenomenon that would eventually be disregarded in the project, and could it possibly settle differences between the projected material and the material used in construction?
This paper aims to verify the impact of the segregation phenomenon caused by excessive vibration in lightweight aggregate concrete samples on the density, mechanical strength, and structural efficiency of this material. Different types of lightweight aggregate concrete were manufactured and vibrated during their compaction, considering different levels of vibration.
2. Materials
Four different LWAC were produced using the Fanjul Method [25], with target densities of 1700 kg/m3 (LWAC1 and LWAC3) and 1900 kg/m3 (LWAC2 and LWAC4). The method proposed by Fanjul [25] allows the dosage of the aggregates in a concrete composition whose reference is the density of the concrete previously set. Given its pragmatism and efficiency, the method is a powerful working tool, respecting always the weight-volume binomial. The Fanjul method [25] deals with the mixing of the aggregates in the concrete composition. The dosage in cement and water according to the needs of docility, resistance, etc., are considered as known data, either imposed or deducted by other procedures.
Table 1 includes the mix proportions of the concretes produced and presents their manufacturing characteristics. Twenty units of each concrete were manufactured at the same time. Different types of LWA from Arlita Leca (HS and M types), different modes of vibration (one or two layers: LWAC1 and LWAC2 were vibrated in two layers and LWAC3 and LWAC4 were vibrated in one layer) and different theoretical densities were considered. The same water to cement ratio (w/c) of 0.6, was used for all mixtures, resulting in 350 kg/m3 of cement and 210 kg/m3 of water to produce 1 m3 of concrete. CEM I 52.5 R white cement with an absolute density of 3176 kg/m3 was used for all the concretes; 2 types of expanded clay were used as coarse lightweight aggregate—its physical properties are listed in Table 2.

Table 1.
Manufacturing characteristics and mix proportions to produce 1 m3 of concrete. Adapted table from [26].
Table 2.
Characteristics of aggregates and the methods/standards used for testing. Adapted table from [26].
The bulk density of the LWAs was obtained according to the procedure described in the standard UNE EN 1097-3 [28]. Particle size of the aggregates was determined according to the UNE EN 933-1 [29]. In addition, the particle density and water absorption were determined by the methodology proposed by Fernández-Fanjul et al. in [27]. According this method, the determination of the particle density was obtained using glycerin to avoid the surface absorption in the aggregates. According this method, the value of the water absorption obtained in the aggregates was more accurate than the values usually obtained according the UNE EN 1097-6 standard [30]. Natural fine limestone aggregate was used as fine aggregate.
Before mixing, and to avoid the loss of water from kneading by absorption, the LWAs were pre-saturated (reducing the uncertainty of lightweight aggregate water absorption during mixing [31]). During the mixing, the water content of the LWA and the surface water content were determined, to make the appropriate corrections and maintain a constant effective w/c ratio of 0.6.
3. Methodology
The flowchart represented in Figure 1 shows the process followed in the research.
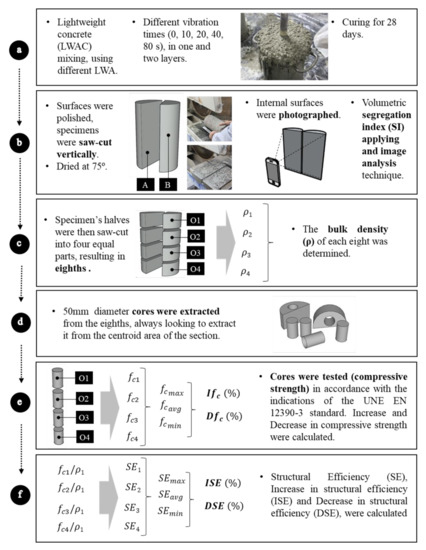
Figure 1.
Methodology applied in this study. (a) Concrete production. (b) Samples were saw-cut, photographed and the segregation index was estimated. (c) Halves were saw-cut, densities were determined. (d) 50 mm cores were extracted. (e) Compressive strength tests were performed. (f) Structural Efficiency was determined.
3.1. Manufacturing and Preparation of the Concrete Specimens
In the present study, the cylindrical samples (150 mm of diameter and 300 mm height) were compacted using an electric needle vibrator (AVMU, Enarco, Zaragoza, Spain) of 18,000 rpm/min and a 25 mm of diameter (Figure 1a). The specimens were vibrated with 5 different times (0, 10, 20, 40, 80 s), in one and two layers (Table 1). For each combination, four specimens were manufactured (20 specimens for each concrete mixture).
After being made and cured in the water at a temperature of 20 ± 1 °C for 28 days, the specimens were saw-cut through its longitudinal axis and their sections (identified as A and B) were photographed for image analysis (Figure 1b).
3.2. Photographing and Image Analyses Phase
The two halves of each cylinder were photographed at the same time. The images of the sections were used to calculate the volumetric segregation index (SI) according Solak et al. [32] applying and image analysis technique. ImageJ, a freeware software, was used to process the images and to determine the black and white matrices. Adopting a point-counting technique, the data from these matrices was used to determine the volumetric fraction of aggregates (Global Aggregate Index - GAI) of each section (Figure 2b). Also, following the instructions of [32], each matrix was horizontally divided into 701 subsections, from which the local volumetric fractions of aggregate and mortar were obtained. The results of the local analyses were used to calculate the local absolute difference (LAD) coefficients (Figure 2d). The average of LADs resulted in the local distribution coefficient (LDC). Finally, the segregation index of Solak was calculated according to Equation (1).
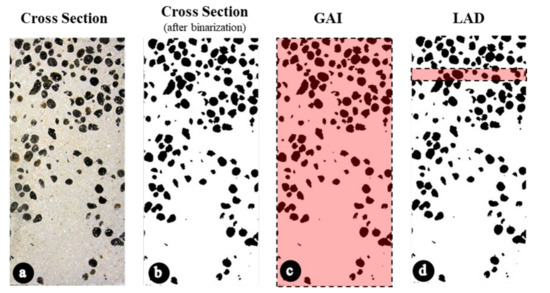
Figure 2.
Information used to calculate the segregation index for each sample. (a) Cross section of sample. (b) Cross section of sample after binarization. (c) Data considered to calculate the volumetric fraction of aggregates (GAI) of each section. (d) Data considered to calculate the Local Absolute Difference (LAD) coefficients of each subsection (calculated at 701 subsections).
The range of values of the SI varies from 0% (totally homogenous specimen) to 100% (totally segregated concrete where the aggregates are concentrated in the top of the specimen).
3.3. Compressive Strength Test
Subsequently the specimen’s halves were then saw-cut into four equal parts, resulting in eighths (identified as O1, O2, O3, and O4). To evaluate the variations caused by the segregation in the density (ρ) along the height of the specimens, the specimen’s halves were then saw-cut into four equal parts, resulting in eighths, which had their bulk densities (ρ) determined (Figure 1c).
To evaluate the variations caused by the segregation in the compressive strength (fc) along the height of the specimens, 50-mm diameter cores were extracted from the eighths always looking to extract it from the centroid area of the section (Figure 1d). Considering that the eighths have a transversal section with semi-circular geometry, the extraction of cores with circular section seemed more coherent.
The tests of compressive strength were carried out in accordance with the indications of the UNE EN 12390-3 standard [33], with attention to the specific indications of Annex B, where the procedure is recommended to test specimens with dimensions that do not meet the tolerances of the dimensions standardized in the UNE EN 12390-1 [34]. The cores extracted from the eighths have been tested in a compression testing machine of 20 kN, with loading speed of 0.25 MPa/s.
3.4. Compressive Strength Evaluation
To evaluate the influence of segregation on the compressive strength of concrete two indexes were established (Figure 1e):
Increase in compressive strength (, calculated by Equation (2), and which represents the variation in compressive strength of one half of the sample, comparing the maximum strength found among the eighths of a half and the average strength of the eighths of the same half (. Decrease in compressive strength (, calculated by Equation (3), which represents the variation in compressive strength of one half of the sample, comparing the minimum strength found between the eighths of a half ( and the average strength of the eighths of the same half (.
3.5. Structural Efficiency Evaluation
Other indexes, which indicates the structural efficiency of the material (Figure 1f) were also established:
Structural efficiency , calculated by Equation (4), and which represents the proportion between the strength of a sample eighth in MPa and its density (ρi), in kg/m3.
Increase in structural efficiency (, calculated by Equation (5), and which represents the variation in structural efficiency of one half of the sample, comparing the maximum structural efficiency found between the eighths of a half and the average structural efficiency of the eighths of the same half ).
Decrease in structural efficiency (, calculated by Equation (6), which represents the variation in structural efficiency of one half of the sample, comparing the minimum structural efficiency found between the eighths of a half and the average structural efficiency of the eighths of the same half ).
4. Results and Discussion
4.1. Compressive Strength
To analyze if the segregation of concrete directly affects the compressive strength, an ANOVA analysis complemented by the Tukey’s test (Honestly-significant-difference—HSD) has been carried out qualitatively evaluating this parameter. The segregation index, whose values are between 12% and 49%, were contrasted with the values of average compressive strength—average between the four cores extracted from each half ()—of each sample. To analyze qualitatively, the data were grouped into categories: 10% ≥ SI > 20%; 20% ≥ SI >30%; 30% ≥ SI > 40% and 40% ≥ SI > 50%. In total 160 observations were made (two halves of 80 samples).
Given the R2, 10% of the variability of the dependent variable is explained by the explanatory variable (SI). Given the p-value of the F statistic computed in the ANOVA table (Table 3), and given the significance level of 5%, the information brought by the explanatory variable (SI) is significantly better than what a basic mean would bring, indicating that parameter SI affects the average compressive strength.
Table 3.
Results of ANOVA. DF (degrees of freedom), F (F ratio) and Pr (p-value).
The Tukey’s test results have classified the four categories into two groups (A and B), indicating the existence of significant differences between them. As seen in Table 4, the behavior of the average compressive strength as a function of segregation seems to follow two different patterns, one for values below the category 20% to 30% and another to values above the category 20% to 30%.
Table 4.
Tukey’s test results. LS (Least-squares).
Figure 3. exemplifies two situations where a series of LWAC was vibrated in two layers (Figure 3a) and in one layer (Figure 3b). The graphics of all the series (16 in total) were included in the Supplementary Data.
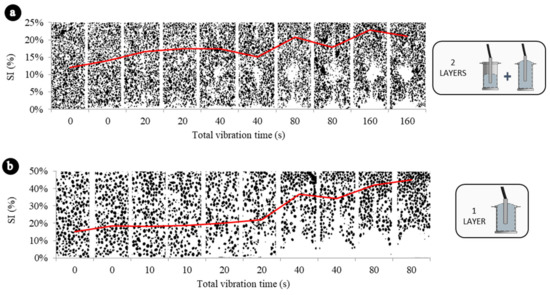
Figure 3.
Examples of the evolution of segregation for two LWAC series. (a) Vibrated in two layers. (b) Vibrated in a single layer.
Figure 4a represents the variation of as function of the segregation index. Results are consistent with the results of the ANOVA and the Tukey’s test. Concretes that have segregation indexes lower than 30% do not present any correlation between and SI. However, starting at 30%, as SI increases, increases. It probably occurs because at high values of SI the samples are clearly divided in two phases (mortar in the bottom and aggregates in the top), resulting in higher compressive strengths in those sections with mortar concentration. This analysis becomes more evident when the data are represented by concrete type (Figure 5a) and it is verified that the correlations of LWAC1 and LWAC2, which has presented SI lower than 30%, are not good: 0.07 and 0.034, respectively.
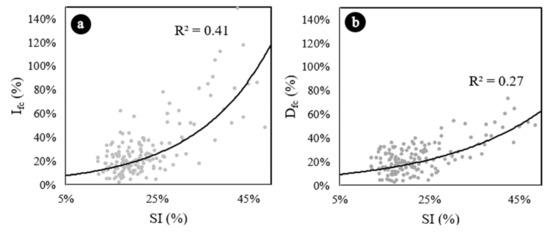
Figure 4.
Exponential trend curves representing vs SI and vs SI. (a) Increase in compressive strength due segregation. (b) Decrease in compressive strength due segregation. Exponential trend estimations.
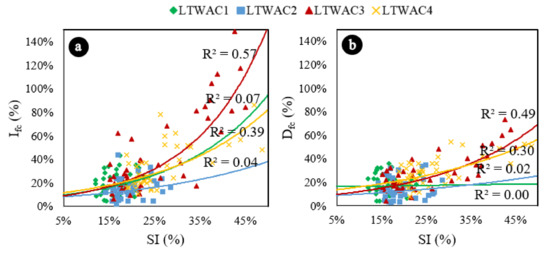
Figure 5.
(a) Increase in compressive strength due segregation represented by concrete type. (b) Decrease in compressive strength due segregation represented by concrete type. Exponential trend estimations.
Concretes vibrated in two layers (LWAC1 and LWAC2) have presented less segregation, for vibration times even higher than the concretes vibrated in one layer, and because of their better homogeneity presented minor variations in the compressive strength of its sections. These results were also discussed in previous works [26].
From a safety point of view, the decrease in strength (sections that would contain an excessive amount of aggregates due to segregation) is more relevant than the increase in strength (sections that would contain an excessive amount of mortar), once those are mostly the areas where the concrete failure begins [35]. Figure 4b represents the variation of as function of the SI.
The results are also consistent with ANOVA and Tukey’s test results. Concretes with SI lower than 25% do not present any correlation between and SI. However, starting at 25%, as SI increases, increases, probably because at high values of SI, the samples are clearly divided in two phases (mortar in the bottom and aggregates in the top), resulting in lower compressive strengths in those sections with aggregate concentration. In the same way, this analysis becomes more evident when the data are represented by concrete type (Figure 5b) and it is verified that the correlations of LWAC1 and LWAC2, which has presented SIs lower than 25%, are very poor: 0.00 and 0.02, respectively. The volumetric fraction of aggregates—related to the theoretical densities in this paper—also affected the reduction of compressive strength due segregation. Concretes manufactured in one layer, and with density of 1700 kg/m3 presented higher reductions of compressive strength due segregation than concretes with theoretical densities of 1900 kg/m3 (one layer).
4.2. Position of the Critical Section
Figure 6 shows the position of the critical section (eighth with ) as a function of the vibration time. Figure 6b shows the frequency of the critical section in each eighth, for each vibration time, for the concrete manufactured in two layers. With the increase in vibration energy, the critical section became more frequent in the middle and upper eighths, until at the maximum vibration energy (t = 160 s), when no cases of critical sections were found in the lower eighth (red).
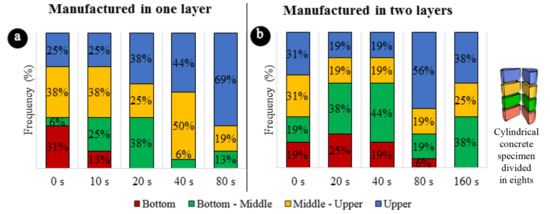
Figure 6.
Frequency of the critical section in each eighth. (a) Concretes manufactured in one layer. (b) Concretes manufactured in two layers.
In concretes vibrated in one layer, the displacement of the critical section towards the upper eighths is even more evident. In Figure 6a it is observed that, in short vibration times, the frequency of the critical section is well distributed in the eighths, and with the increase of the vibration time, the upper eighth (blue) gradually registered more cases of critical section, until in the maximum time (t=80s), in 69% of the cases the critical section is in the upper eighth.
4.3. Structural Efficiency
In general, the compaction in two layers led to a reduction in the overall density of the samples, most likely because the trapped air was removed more effectively in these cases. This can be seen when comparing the graphs in Figure 7a, Figure 8a.
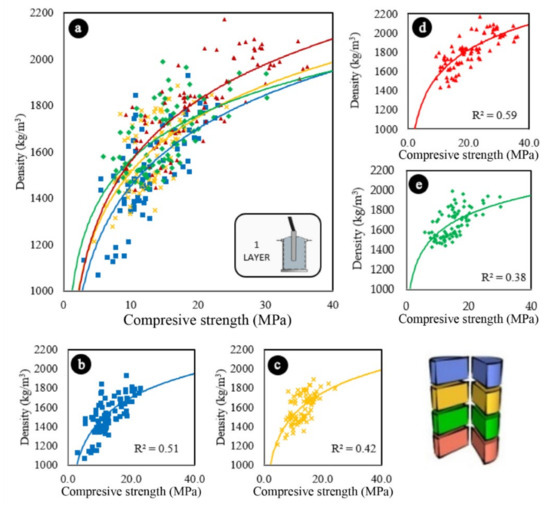
Figure 7.
Variations in the compressive strength of samples vibrated in one layer according to their densities (a) All sections. (b) Upper sections. (c) Middle-upper sections. (d) Bottom sections. (e) Bottom-middle sections. Logarithmic trend estimations.
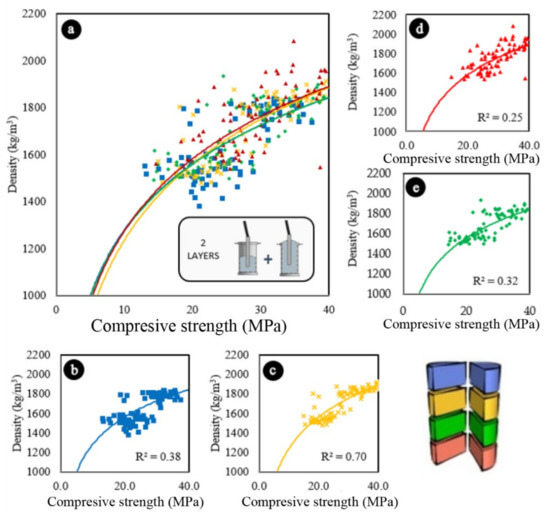
Figure 8.
Variations in the compressive strength of samples vibrated in two layers according to their densities. (a) All sections. (b) Upper sections. (c) Middle-upper sections. (d) Bottom sections. (e) Bottom-middle sections. Logarithmic trend estimations.
Two-layer compaction also affected the compressive strength results. When comparing the graph in Figure 7a (vibration in one layer) with the graph in Figure 8a (vibration in two layers), it can be seen that all the curves moved to the right, so that the concretes vibrated in two layers presented superior compressive strength results.
Although the trends and the results of R2 vary depending on the position of each eighth within the samples, in both one-layer and two-layer vibrating concretes, it can be seen through Figure 7 and Figure 8 that the denser, the greater in terms of compressive strength.
Concretes compacted in one layer have been shown to be more sensitive to vibration than concretes vibrated in two layers, especially in the upper region of the samples. When comparing Figure 7b with Figure 8b, and Figure 7c with Figure 8c, it can be seen that the curves of Figure 7b,c show more vertical trends than the curves of 8b and 8c, indicating that the concretes vibrated in one layer showed a greater loss of resistance of its upper sections due to the increase in the concentration of lightweight aggregates due to segregation, which resulted in a consequent reduction in density.
To analyze if the segregation of concrete directly affects structural efficiency, the data were also analyzed using an ANOVA complemented by a Tukey test (HSD). The segregation results were contrasted with the values of average structural efficiency—average between the results of four cores extracted from each half (—of each sample. In the same way that the compressive strength analysis was performed, the data were grouped into categories: 10% ≥ S > 20%; 20% ≥ SI > 30%; 30% ≥ SI > 40% and 40% ≥ SI > 50%. In total, 160 observations were made (two halves of 80 samples).
Given the R2, 10% of the variability of the dependent variable is explained by the explanatory variable (SI). Given the p-value of the F statistic computed in the ANOVA table (Table 5), and given the significance level of 5%, the information brought by the explanatory variable (SI) is significantly better than what a basic mean would bring, indicating that parameter SI average structural efficiency.
Table 5.
Results of ANOVA. DF (degrees of freedom), F (F ratio) and Pr (p-value).
The Tukey’s test results have also classified the four categories into two groups (A and B), indicating the existence of significant differences between them. As seen in Table 6, the behavior of the average structural efficiency as a function of segregation seems to follow two different patterns, one for values below the category 20% to 30% and another to values above the category 20% to 30%.
Table 6.
Tukey’s test results. LS (Least-squares).
Figure 9a represents the variation of as function of the segregation index. Results are consistent with the results of the ANOVA and the Tukey’s test. Concretes that have segregation indexes lower than 30% do not present any correlation between and SI. However, starting at 30%, as SI increases, increases. This analysis becomes more evident when the data are represented by concrete type (Figure 10a) and it is verified that the correlations of LWAC1 and LWAC2, which has presented SI lower than 30%, are not good: 0.01 and 0.00, respectively.
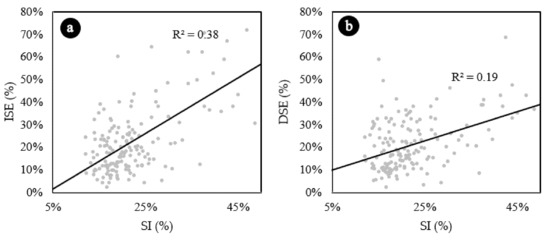
Figure 9.
(a) Increase in structural efficiency (ISE) due segregation. (b) Decrease in structural efficiency (DSE) due segregation. Linear trend estimations.
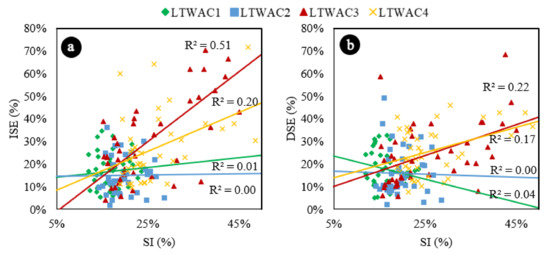
Figure 10.
(a) Increase in structural efficiency due segregation represented by concrete type. (b) Decrease in structural efficiency due segregation represented by concrete type. Linear trend estimations.
Like the results obtained by Solak et al. [26], concretes vibrated in two layers (LWAC1 and LWAC2) have presented less segregation, for vibration times even higher than the concretes vibrated in one layer, and because of their better homogeneity presented minor variations in the compressive strength, density, and as result, minor variations of structural efficiency on its sections.
Figure 9b represents the variation of as function of the SI. Concretes with SI lower than 30% do not present any correlation between and SI. However, starting at 30%, as SI increases, increases. Similar to the previously analyzed parameter, this analysis becomes more evident when the data are represented by concrete type (Figure 10b) and it is verified that the correlations of LWAC1 and LWAC2, which presented SIs lower than 30%, are very poor: 0.0006 and 0.0404, respectively.
For all structural efficiency parameters analysed (, and ), the concretes that were vibrated in two layers (LWAC 1 and LWAC2, green and blue in the Figure 11), presented higher values when compared to the concretes that were vibrated in one layer (LWAC 3 and LWAC 4, yellow and red in the Figure 11). It is not possible to state that the segregation caused significant impacts on the structural efficiency of the materials, since no clear trends were found for the four studied concretes. This is verified through the linear and approximately horizontal aspects of the data distributions, as well as through the low values of R2.
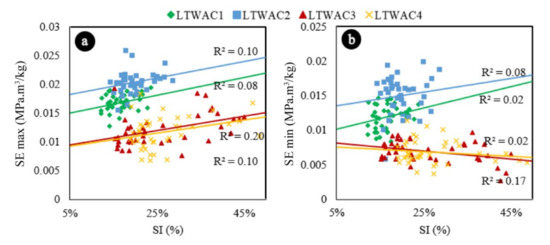
Figure 11.
(a) Maximum structural efficiency () versus segregation, represented by concrete type. (b) Minimum structural efficiency () versus segregation, represented by concrete type. Linear trend estimations.
5. Conclusions
This paper presents an experimental study on lightweight aggregate concretes (LWAC) with an analysis of variations in the density, compressive strength, and structural efficiency of samples affected by segregation caused by excessive vibration. From the results presented in this study, the following conclusions are drawn:
- The manufacturing of the samples in two layers ensured a homogeneity of the mixture inside of the samples and consequently avoided an excessive reduction of compressive strength.
- The decrease in the compressive strength was observed with more evidence from segregation indexes above 25%. Other compressive strength tests considering specimens with standard dimensions instead of the cores extracted from the samples could explain this phenomenon more precisely.
- Concretes manufactured in one layer presented higher reductions of compressive strength due to segregation than concretes manufactured in two layers.
- For all structural efficiency parameters analysed (, and ), the concretes that were vibrated in two layers presented higher values when compared to the concretes that were vibrated in one layer.
Although several parameters that affect segregation in LWAC have been evaluated in this article, other factors still need to be studied in future research. This article could be complemented with compression strength tests using conventional size samples, LWA with other sizes, and concretes with other dosages.
Supplementary Materials
The following are available online at https://www.mdpi.com/1996-1944/13/24/5754/s1, Figure S1: Segregation index for each sample according to the vibration time applied. LWAC1; Figure S2: Density of the eighths of sample, according to the time of vibration applied. LWAC1; Figure S3: Segregation index for each sample according to the vibration time applied. LWAC2; Figure S4: Density of the eighths of sample, according to the time of vibration applied. LWAC2; Figure S5: Segregation index for each sample according to the vibration time applied. LWAC3; Figure S6: Density of the eighths of sample, according to the time of vibration applied. LWAC3; Figure S7: Segregation index for each sample according to the vibration time applied. LWAC4; Figure S8: Density of the eighths of sample, according to the time of vibration applied. LWAC4.
Author Contributions
Conceptualization, A.M.S. and A.J.T.-A.; Data curation, A.M.S.; Formal analysis, A.M.S.; Funding acquisition, A.J.T.-A.; Investigation, A.M.S., A.J.T.-A. and V.E.G.-V.; Methodology, A.M.S.; Project administration, A.J.T.-A.; Resources, A.J.T.-A; Supervision, A.J.T.-A.; Validation, A.M.S. and V.E.G.-V.; Writing—original draft, A.M.S.; Writing—review & editing, A.J.T.-A. and V.E.G.-V. All authors have read and agreed to the published version of the manuscript.
Funding
This research was funded by the University of Alicante ((GRE13-03) and (VIGROB-256)).
Acknowledgments
The authors wish to express their gratitude to Ph.D. program in Materials, Structures and Soil Engineering of the University of Alicante.
Conflicts of Interest
The authors declare no conflict of interest.
References
- Yan, W.; Cui, W.; Qi, L. Effect of aggregate gradation and mortar rheology on static segregation of self-compacting concrete. Constr. Build. Mater. 2020, 259, 119816. [Google Scholar] [CrossRef]
- Peng, Y.; Jacobsen, S. Influence of water/cement ratio, admixtures and filler on sedimentation and bleeding of cement paste. Cem. Concr. Res. 2013, 54, 133–142. [Google Scholar] [CrossRef]
- Peng, Y.; Lauten, R.A.; Reknes, K.; Jacobsen, S. Bleeding and sedimentation of cement paste measured by hydrostatic pressure and Turbiscan. Cem. Concr. Compos. 2017, 76, 25–38. [Google Scholar] [CrossRef]
- Solak, A.M.; Tenza-Abril, A.J. Compressive Strength Variations in Lightweight Aggregate Concrete Samples Affected by Segregation Caused by Excessive Vibration. Key Eng. Mater. 2019, 821, 493–499. [Google Scholar] [CrossRef]
- Navarrete, I.; Lopez, M. Understanding the relationship between the segregation of concrete and coarse aggregate density and size. Constr. Build. Mater. 2017, 149, 741–748. [Google Scholar] [CrossRef]
- Solak, A.; Tenza-Abril, A.; Saval, J.; García-Vera, V. Effects of Multiple Supplementary Cementitious Materials on Workability and Segregation Resistance of Lightweight Aggregate Concrete. Sustainability 2018, 10, 4304. [Google Scholar] [CrossRef]
- Zhu, W.; Gibbs, J.C.; Bartos, P.J.M. Uniformity of in situ properties of self-compacting concrete in full-scale structural elements. Cem. Concr. Compos. 2001, 23, 57–64. [Google Scholar] [CrossRef]
- Tenza-Abril, A.J.; Benavente, D.; Pla, C.; Baeza-Brotons, F.; Valdes-Abellan, J.; Solak, A.M. Statistical and experimental study for determining the influence of the segregation phenomenon on physical and mechanical properties of lightweight concrete. Constr. Build. Mater. 2020, 238, 117642. [Google Scholar] [CrossRef]
- Tenza-Abril, A.J.; Villacampa, Y.; Solak, A.M.; Baeza-Brotons, F. Prediction and sensitivity analysis of compressive strength in segregated lightweight concrete based on artificial neural network using ultrasonic pulse velocity. Constr. Build. Mater. 2018, 189, 1173–1183. [Google Scholar] [CrossRef]
- Panesar, D.K.K.; Shindman, B. The effect of segregation on transport and durability properties of self consolidating concrete. Cem. Concr. Res. 2012, 42, 252–264. [Google Scholar] [CrossRef]
- Peng, Y.; Jacobsen, S.; De Weerdt, K.; Pedersen, B. Model and Test Methods for Stability of Fresh Cement Paste. Adv. Civ. Eng. Mater. 2014, 3, 1–24. [Google Scholar] [CrossRef]
- Spangenberg, J.; Roussel, N.; Hattel, J.H.; Sarmiento, E.V.; Zirgulis, G.; Geiker, M.R. Patterns of gravity induced aggregate migration during casting of fluid concretes. Cem. Concr. Res. 2012, 42, 1571–1578. [Google Scholar] [CrossRef]
- Bogas, J.A.; de Brito, J.; Figueiredo, J.M. Mechanical characterization of concrete produced with recycled lightweight expanded clay aggregate concrete. J. Clean. Prod. 2015, 89, 187–195. [Google Scholar] [CrossRef]
- Bogas, J.A.; Gomes, M.G.; Real, S. Capillary absorption of structural lightweight aggregate concrete. Mater. Struct. 2015, 48, 2869–2883. [Google Scholar] [CrossRef]
- Real, S.; Bogas, J.A. Oxygen permeability of structural lightweight aggregate concrete. Constr. Build. Mater. 2017, 137, 21–34. [Google Scholar] [CrossRef]
- Pla, C.; Tenza-Abril, A.J.; Valdes-Abellan, J.; Benavente, D. Influence of microstructure on fluid transport and mechanical properties in structural concrete produced with lightweight clay aggregates. Constr. Build. Mater. 2018, 171, 388–396. [Google Scholar] [CrossRef]
- Bogas, J.A.; Gomes, A. Compressive behavior and failure modes of structural lightweight aggregate concrete—Characterization and strength prediction. Mater. Des. 2013, 46, 832–841. [Google Scholar] [CrossRef]
- Ke, Y.; Beaucour, A.L.L.; Ortola, S.; Dumontet, H.; Cabrillac, R. Influence of volume fraction and characteristics of lightweight aggregates on the mechanical properties of concrete. Constr. Build. Mater. 2009, 23, 2821–2828. [Google Scholar] [CrossRef]
- Yang, C.-C.; Huang, R. Approximate Strength of Lightweight Aggregate Using Micromechanics Method. Adv. Cem. Based Mater. 1998, 7, 133–138. [Google Scholar] [CrossRef]
- Mehta, P.K.; Monteiro, P.J.M. CONCRETE: Microstructure, Properties and Materials; Prentice Hall: Upper Saddle River, NJ, USA, 1993. [Google Scholar]
- Zhang, M.-H.; Gjørv, O.E. Microstructure of the interfacial zone between lightweight aggregate and cement paste. Cem. Concr. Res. 1990, 20, 610–618. [Google Scholar] [CrossRef]
- Mena, Q. Towards a structural efficiency classification system. Structures 2020, 26, 298–310. [Google Scholar] [CrossRef]
- Peyvandi, A.; Soroushian, P.; Jahangirnejad, S. Enhancement of the structural efficiency and performance of concrete pipes through fiber reinforcement. Constr. Build. Mater. 2013, 45, 36–44. [Google Scholar] [CrossRef]
- Akinyele, J.O.; Igba, U.T.; Ayorinde, T.O.; Jimoh, P.O. Structural efficiency of burnt clay bricks containing waste crushed glass and polypropylene granules. Case Stud. Constr. Mater. 2020, 13, e00404. [Google Scholar] [CrossRef]
- Fernández-Fanjul, A.; Tenza-Abril, A.J. Méthode FANJUL: Dosage pondéral des bétons légers et lourds. Ann. Du Bâtiment Des. Trav. Publics 2012, 5, 32–50. [Google Scholar]
- Solak, A.M.; Tenza-Abril, A.J.; Baeza-Brotons, F.; García-Vera, V.E.; Lanzón, M. New insights on the segregation due to manufacture conditions of Lightweight Aggregate Concretes. In Proceedings of the SynerCrete’18: Interdisciplinary Approaches for Cement-Based Materials and Structural Concrete: Synergizing Expertise and Bridging Scales of Space and Time; Azenha, M., Schlicke, D., Benboudjema, F., Jędrzejewska, A., Eds.; RILEM Publications S.A.R.L.: Funchal, Portugal, 2018; pp. 273–278. [Google Scholar]
- Fernández-Fanjul, A.; Tenza-Abril, A.J.; Baeza-Brotons, F. A new methodology for determining particle density and absorption of lightweight, normal-weight and heavy weight aggregates in aqueous medium. Constr. Build. Mater. 2017, 146, 630–643. [Google Scholar] [CrossRef]
- AENOR. UNE-EN 1097-3. Ensayos para Determinar las Propiedades Mecánicas y Físicas de los áridos. Parte 3: Determinación de la Densidad Aparente y la Porosidad; Normas UNE; AENOR: Madrid, Spain, 1999. [Google Scholar]
- AENOR. UNE-EN 933-1. Ensayos para Determinar las Propiedades Geométricas de los áridos. Parte 1: Determinación de la Granulometría de las Partículas. Método del Tamizado; AENOR: Madrid, Spain, 2012. [Google Scholar]
- AENOR. UNE-EN 1097-6. Ensayos para Determinar las Propiedades Mecánicas y Físicas de los áridos. Parte 6: Determinación de la Densidad de Partículas y la Absorción de agua; Normas UNE; AENOR: Madrid, Spain, 2014. [Google Scholar]
- Fernández-Fanjul, A.; Tenza-Abril, A.J.; Baeza-Brotons, F. A new methodology for determining water absorption of lightweight, normal-weight and heavyweight aggregates in a viscous medium. Constr. Build. Mater. 2018, 165, 596–607. [Google Scholar] [CrossRef]
- Solak, A.M.; Tenza-Abril, A.J.; Baeza-Brotons, F.; Benavente, D. Proposing a New Method Based on Image Analysis to Estimate the Segregation Index of Lightweight Aggregate Concretes. Materials 2019, 12, 3642. [Google Scholar] [CrossRef]
- AENOR. UNE-EN 12390-3—Ensayos de Hormigón Endurecido. Parte 3: Determinación de la Resistencia a Compresión de Probetas; Normas UNE; AENOR: Madrid, Spain, 2009. [Google Scholar]
- AENOR. UNE-EN 12390-1—Ensayos de Hormigón Endurecido. Parte 1: Forma, Medidas y otras Características de las Probetas y Moldes; Normas UNE; AENOR: Madrid, Spain, 2001. [Google Scholar]
- Juradin, S.; Baloevi, G.; Harapin, A. Impact of vibrations on the final characteristics of normal and self-compacting concrete. Mater. Res. 2014, 17, 178–185. [Google Scholar] [CrossRef]


Publisher’s Note: MDPI stays neutral with regard to jurisdictional claims in published maps and institutional affiliations. |
© 2020 by the authors. Licensee MDPI, Basel, Switzerland. This article is an open access article distributed under the terms and conditions of the Creative Commons Attribution (CC BY) license (http://creativecommons.org/licenses/by/4.0/).