Article

Synthesis Optimization of BaGdF5:x%Tb3+ Nanophosphors for Tunable Particle Size

by
Vladimir Polyakov
*,
Zaira Gadzhimagomedova
,
Daria Kirsanova
and
Alexander Soldatov
The Smart Materials Research Institute, Southern Federal University, 344090 Rostov-on-Don, Russia
*
Author to whom correspondence should be addressed.
Materials 2022, 15(23), 8559; https://doi.org/10.3390/ma15238559
Submission received: 28 October 2022 / Revised: 24 November 2022 / Accepted: 28 November 2022 / Published: 1 December 2022
(This article belongs to the Special Issue Advanced Nanomaterials: Synthesis, Characterization and Applications)

Abstract

:
X-ray photodynamic therapy (XPDT) is aimed at the treatment of deep-located malignant tumors thanks to the high penetration depth of X-rays. In XPDT therapy, it is necessary to use materials that effectively absorb X-rays and convert them into visible radiation-nanophosphors. Rare-earth elements, fluorides, in particular, doped BaGdF5, are known to serve as efficient nanophosphor. On the other hand, the particle size of nanophosphors has a crucial impact on biodistribution, cell uptake, and cytotoxicity. In this work, we investigated various Tb:Gd ratios in the range from 0.1 to 0.5 and optimized the terbium content to achieve the maximum luminescence under X-ray excitation. The effect of temperature, composition of the ethylene glycol/water solvent, and the synthesis technique (solvothermal and microwave) on the size of the nanophosphors was explored. It was found that the synthesis techniques and the solvent composition had the greatest influence on the averaged particle size. By varying these two parameters, it is possible to tune the size of the nanophosphor particles, which make them suitable for biomedical applications.

1. Introduction

In terms of the number of deaths, malignant tumors rank second among all diseases and are one of the most difficult problems in health care [1,2,3]. Currently, there is no universal way to cure them without causing severe damage to the body. Existing methods of radiotherapy and chemotherapy, in addition to destroying malignant cells, also destroy healthy cells. Thus, the need to develop alternative and more safety treatment methods is still an important issue. One of these new non-invasive and low-toxicity methods is photodynamic therapy (PDT). The principle action of drugs for PDT is based on the suppression tumor growth by the generation of reactive oxygen species (ROS) [4,5] upon irradiation of a photosensitive substance (photosensitizer) [6,7,8]. However, the low penetrating power (<1 cm) of near-IR- or UV-radiation imposes significant restrictions on the use of PDT. Tumors that grow deep in the body remain inaccessible. X-rays can be used to increase the depth of penetration, which is a crucial benefit of X-ray photodynamic therapy (XPDT) [9,10]. However, it is necessary to introduce an additional component into the “photosensitizer-ROS” system, which would absorb X-rays and re-emit them into UV–Visible luminescence [11]. One of the most promising and studied are X-ray phosphors based on NaGdF4 and BaGdF5 doped with Eu3+, Tb3+, or other lanthanides [12,13,14,15,16,17,18]. Its advantages include high chemical stability, resistance to X-ray, and photochemical degradation as well as the ability to fine-tune multicolor luminescence by varying the type and concentration of the dopant ions [19,20,21,22,23,24,25,26,27,28]. Furthermore, materials based on BaGdF5 have been relatively poorly studied, and therefore are of greater interest to researchers. On the other hand, the replacement of Na by heavy Ba in the structure leads to an increase in the content of heavy metal atoms per formula unit without a significant increase in toxicity, which improves the X-ray attenuation capability, thus making it more suitable for X-ray micro-CT.
To obtain the maximum luminescence yield, it is necessary to correctly select the concentration of the dopant. Weak luminescence can be caused either by a too low dopant concentration or by the process of quenching the luminescence at a high concentration [29,30,31,32]. Another important criterion for the applicability of composites is their high biocompatibility.
The particle size plays an important role. Too small particles can be quickly filtered out by the body’s defense systems without accumulating in the tumor. On the other hand, too large particles are not able to penetrate the biomembranes and accumulate only at the site of their introduction without subsequent penetration into the cells. Nanoparticles (NPs) with a particle size in the range of 50–200 nm are considered optimal for biomedical applications [33]. However, the size of smaller particles (10–15 nm) can be increased by coating them with biocompatible shells such as silica [34,35,36,37]. In this case, the porous structure of silica makes it possible to adsorb the photosensitizer molecules.
The size of the resulting nanoparticles can be controlled by varying synthesis parameters such as precursor concentration [38,39], temperature [40,41], choice of solvent [42], reaction time [20], and synthesis method. Temperature variations can affect the rate of reactions and consequently the rate of crystallite growth. The choice of solvent also plays an important role. Recently, the synthesis of nanoparticles in organic solvents, for example, polyols, has become increasingly popular [42,43]. The most optimal solvent in BaGdF5 synthesis is ethylene glycol (EG). Ethylene glycol acts not only as a solvent, but also as a surfactant. Being adsorbed on the surface, it is able to block the growth of the particles as well as prevent their agglomeration. The addition of water to ethylene glycol can strongly influence the growth of crystallites. This occurs due to the competition of solvents in the coordination sphere of metal ions. Water molecules are a more preferable ligand; therefore, they actively influence the adsorption of ethylene glycol on the surface of the formed particles [44,45]. Techniques for obtaining BaGdF5 nanoparticles of various sizes using ionic liquids (IL) as structure-driven agents are also known [20,38]. An ionic liquid is a salt in a liquid state. Ionic liquids are environmentally friendly solvents, but they can also act as reagents. For example, IL based on tetrafluoroborates [BF4] can themselves be a source of fluoride ions, which makes it possible to simplify the synthesis process.
To obtain BaGdF5, solvothermal synthesis is usually used. This technique is well-studied and has good reproducibility. However, the long synthesis time (24 h) is its drawback. We have developed a microwave synthesis technique, which makes it possible to reduce the synthesis time by 10 times [46]. Another important advantage of microwave synthesis over hydrothermal synthesis is not only the reaction rate, but also the uniformity of the reaction volume heating. This allows for the homogenization of the direction of the chemical reactions throughout the volume.
Previously, we studied BaGdF5 nanoparticles doped with Eu3+, obtained by microwave synthesis, coated with silica, and impregnated with methylene blue as a photosensitizer [37]. In this paper, we optimized the Tb3+ content to obtain the maximum luminescence yield. We also studied how microwave and hydrothermal techniques, temperature, and various ratios of EG/water affect the particle sizes of the synthesized nanophosphors.

2. Materials and Methods

2.1. Materials

GdCl3, TbCl3 ∙ 6H2O, BaCl2 ∙ 2H2O, ethylene glycol, polyethylene glycol (PEG, M = 1500 g/mol), and NH4F were purchased from Sigma-Aldrich Co. (St Louis, MO, USA).

2.2. Methods

Samples were prepared using a high-temperature autoclave as well as in a microwave CEM Mars6 reactor (CEM Corporation, Matthews, NC, USA). X-ray powder diffraction (XRD) was measured by means of Bruker D2 PHASER using Cu Kα radiation (λ = 1.5406 Å) at 30 kV, 10 mA, and the following parameters: 2θ range from 5 to 90, step size of 0.01. An FEI Tecnai G2 Spirit BioTWIN was used to perform TEM for imaging of the obtained samples. An accelerating voltage of 80 kV was used. The elemental composition was analyzed using micro-X-ray fluorescence spectrometer M4 TORNADO (Bruker, Billerica, MA, USA). The X-ray excited optical luminescence (XEOL) signal was detected by using an Agilent Cary Eclipse fluorescence spectrophotometer with the emission slit set to 10 nm and the following parameters of the X-ray tube: voltage 35 kV and current 1.6 mA. Powder samples were deposited on the thin film, which was fixed in a way that results in an angle of 45° between the sample surface and both the X-ray beam and fluorescence detector window.

2.3. Synthesis

2.3.1. Terbium Content Optimization

To optimize the terbium content, microwave synthesis developed by our scientific group was used. According to the procedure [46], samples were prepared with a terbium content of 5, 10, 25, and 50%. Briefly, a 20 mL solution of a barium, gadolinium, and terbium chloride mixture in ethylene glycol (EG) was prepared using sonication (see Table 1). Then, 1.5 g of polyethylene glycol (PEG-1500) was added to the solution and again sonicated until complete dissolution. After that, 10 mL of ammonium fluoride solution in ethylene glycol was added to the chloride solution.
The resulting mixture was transferred into Teflon ampoules and placed in a CEM Mars6 microwave reactor. The synthesis conditions were as follows: temperature—200 °C, heating time—2 h. After that, the mixture was washed by centrifugation (13,000× g rpm for 10 min) three times with water. The resulting solution was dried at 60 °C.

2.3.2. Variation of Synthesis Conditions

The synthesis conditions were varied to obtain particles of the maximum size. Variable parameters included the type of synthesis (microwave MW or solvothermal ST), solvent composition (ethylene glycol/water), and temperature. The detailed synthesis conditions are presented in Table 2.

3. Results and Discussion

3.1. Terbium Content Optimization

3.1.1. X-Ray Diffraction of BaGdF5: x%Tb3+

The profile analysis was carried out using the Jana2006 program package (version 25/10/2015) [47]. In our previous work [16], it was stated that all synthesized samples crystallized in the single cubic space group Fm-3m (225) (JCPDS card no. 24-0098 [48]). The XRD patterns are shown in Figure 1.
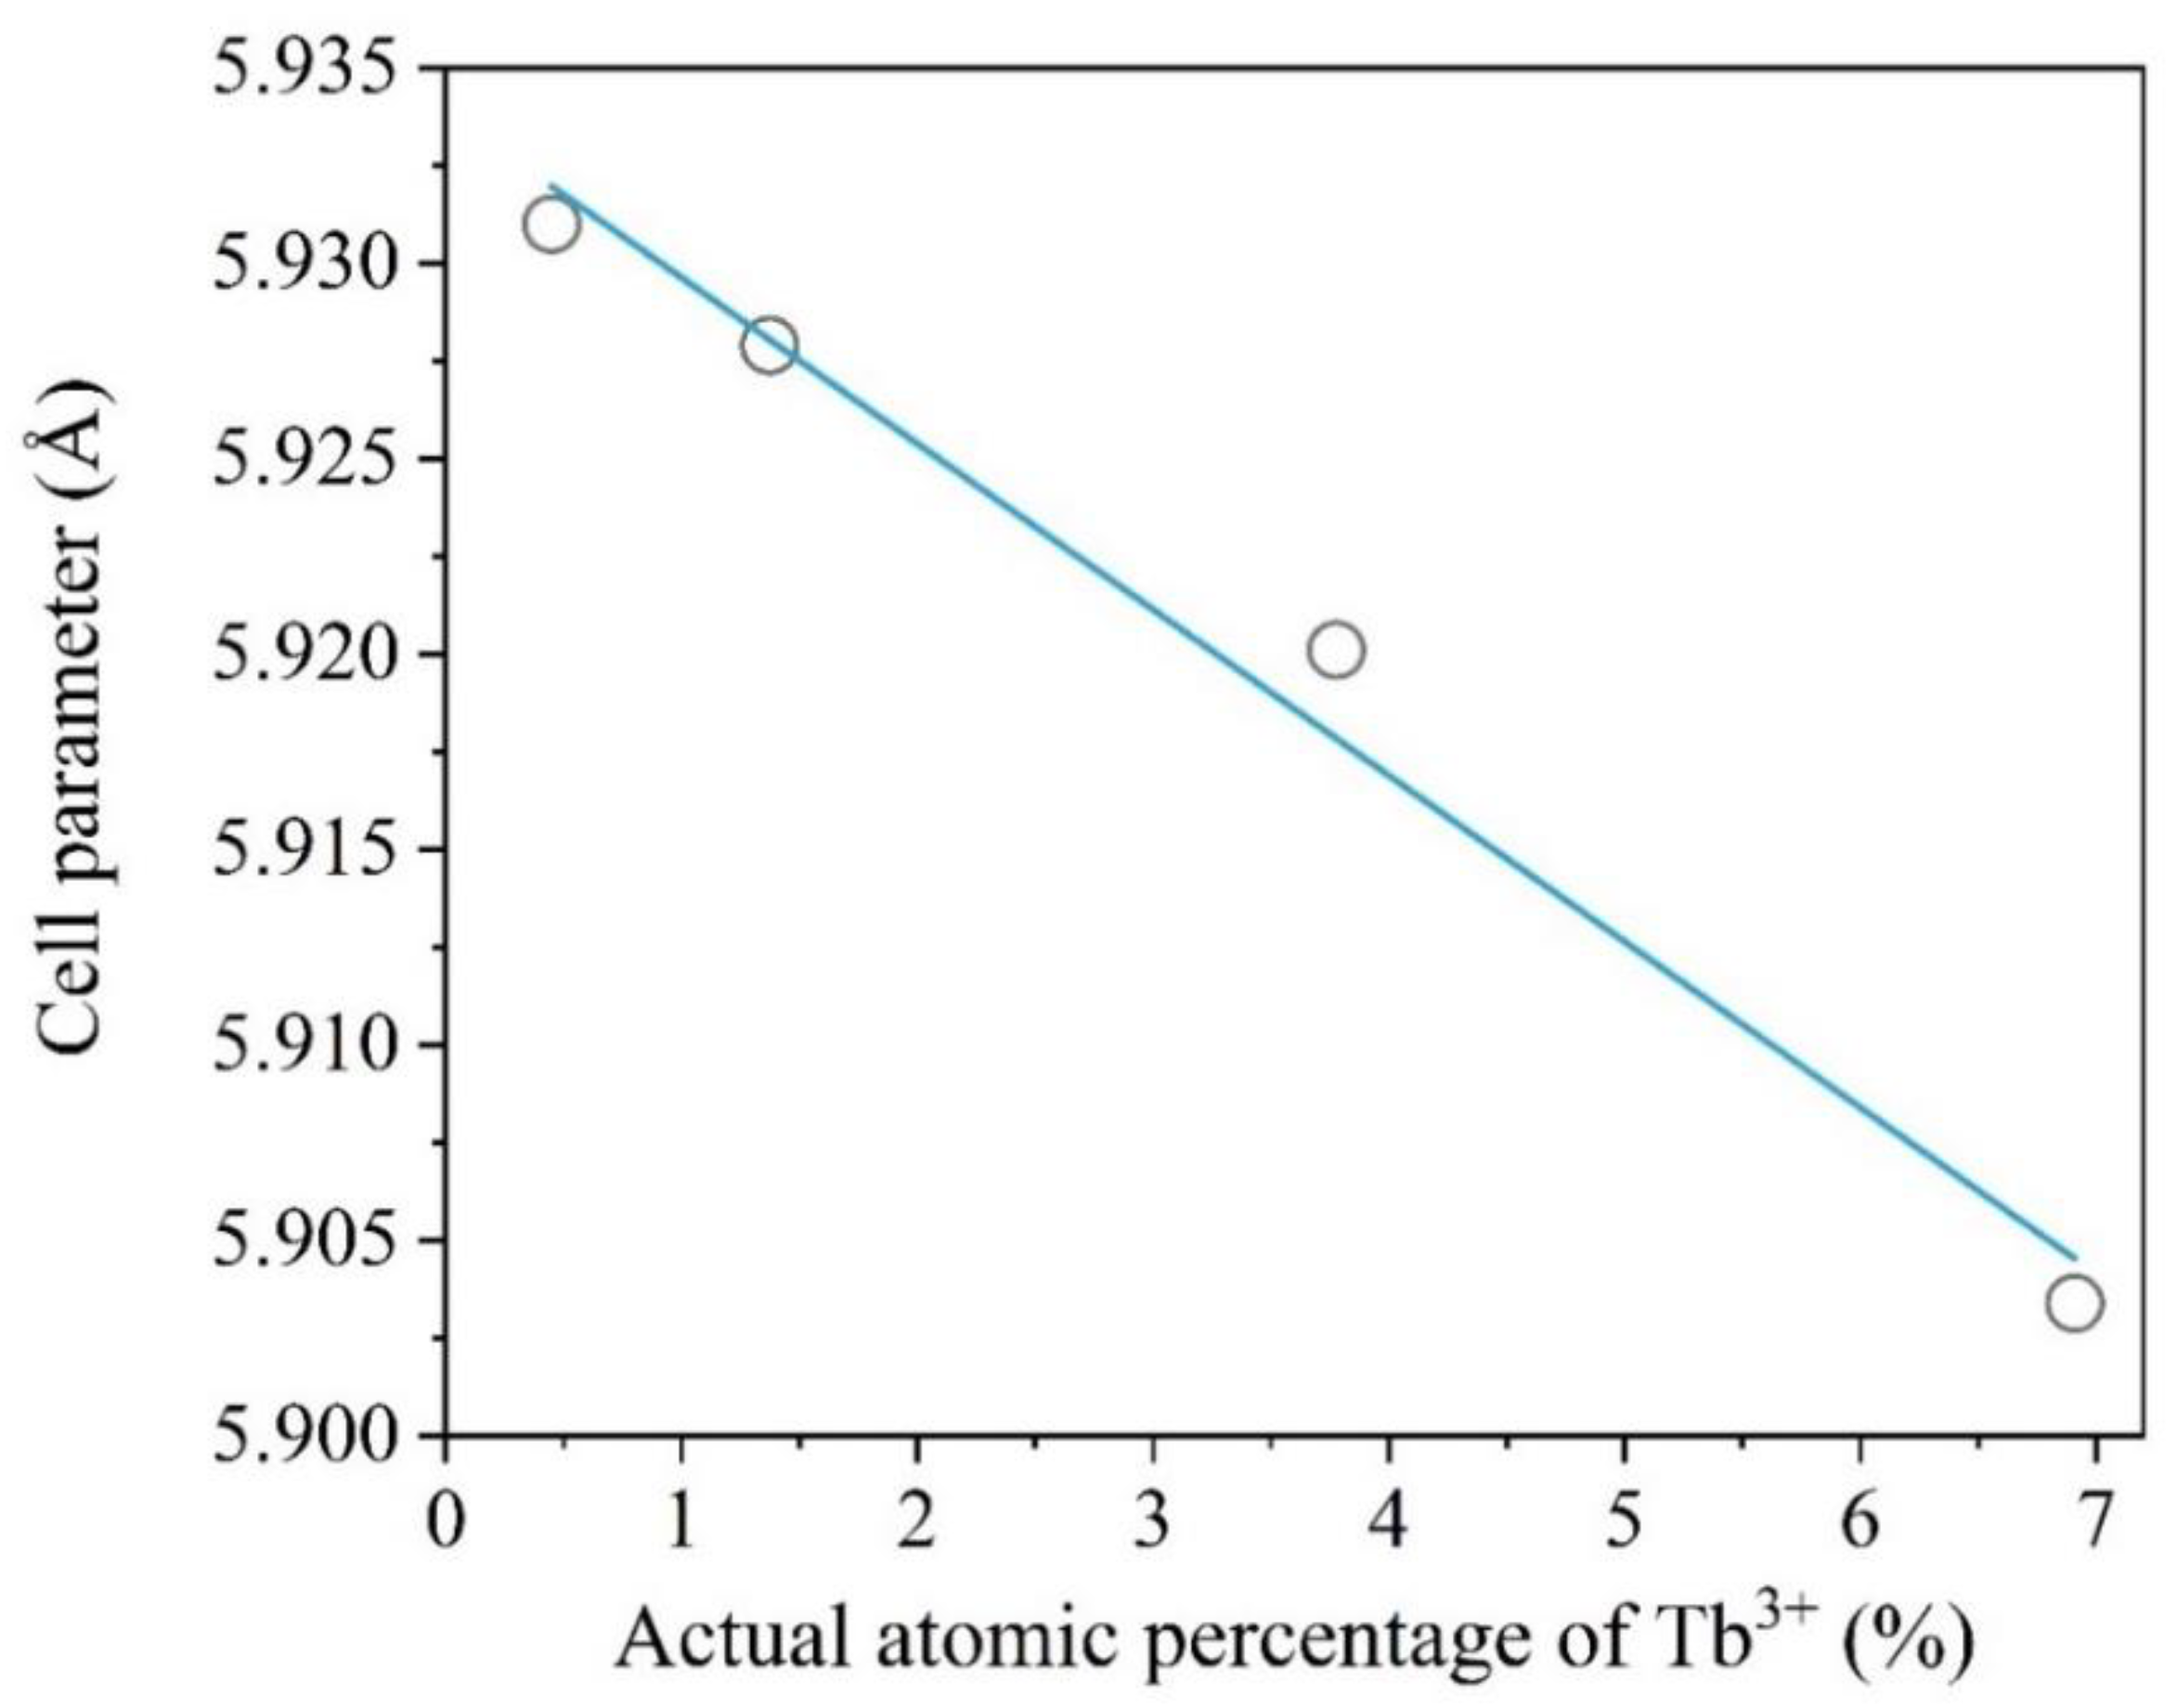
The refined (Figures S1 and S2) value of the cell parameters and cell volumes are presented in Table 3 and Figure 2. The profile parameters were refined using the pseudo-Voigt function.
According to the refined values, it can be observed that the doping of the BaGdF5 crystal structure with Tb3+ ions led to the decrease in the cell parameters. This fact can be explained by the analysis of the ionic radius of the doping element. The ionic radii of the hexacoordinated Gd3+ and Tb3+ were 1.078 and 1.063 Å, respectively [49]. Thus, it can be seen that the Tb3+ ions had a smaller ionic radius and, therefore, the increase in the dopant content led to a decrease in thee cell parameters (Figure 2). The observed trend confirmed that Tb3+ substitutes Gd3+ in their lattice positions. The presence of possible side-phases was excluded based on the XRD and XRF data.
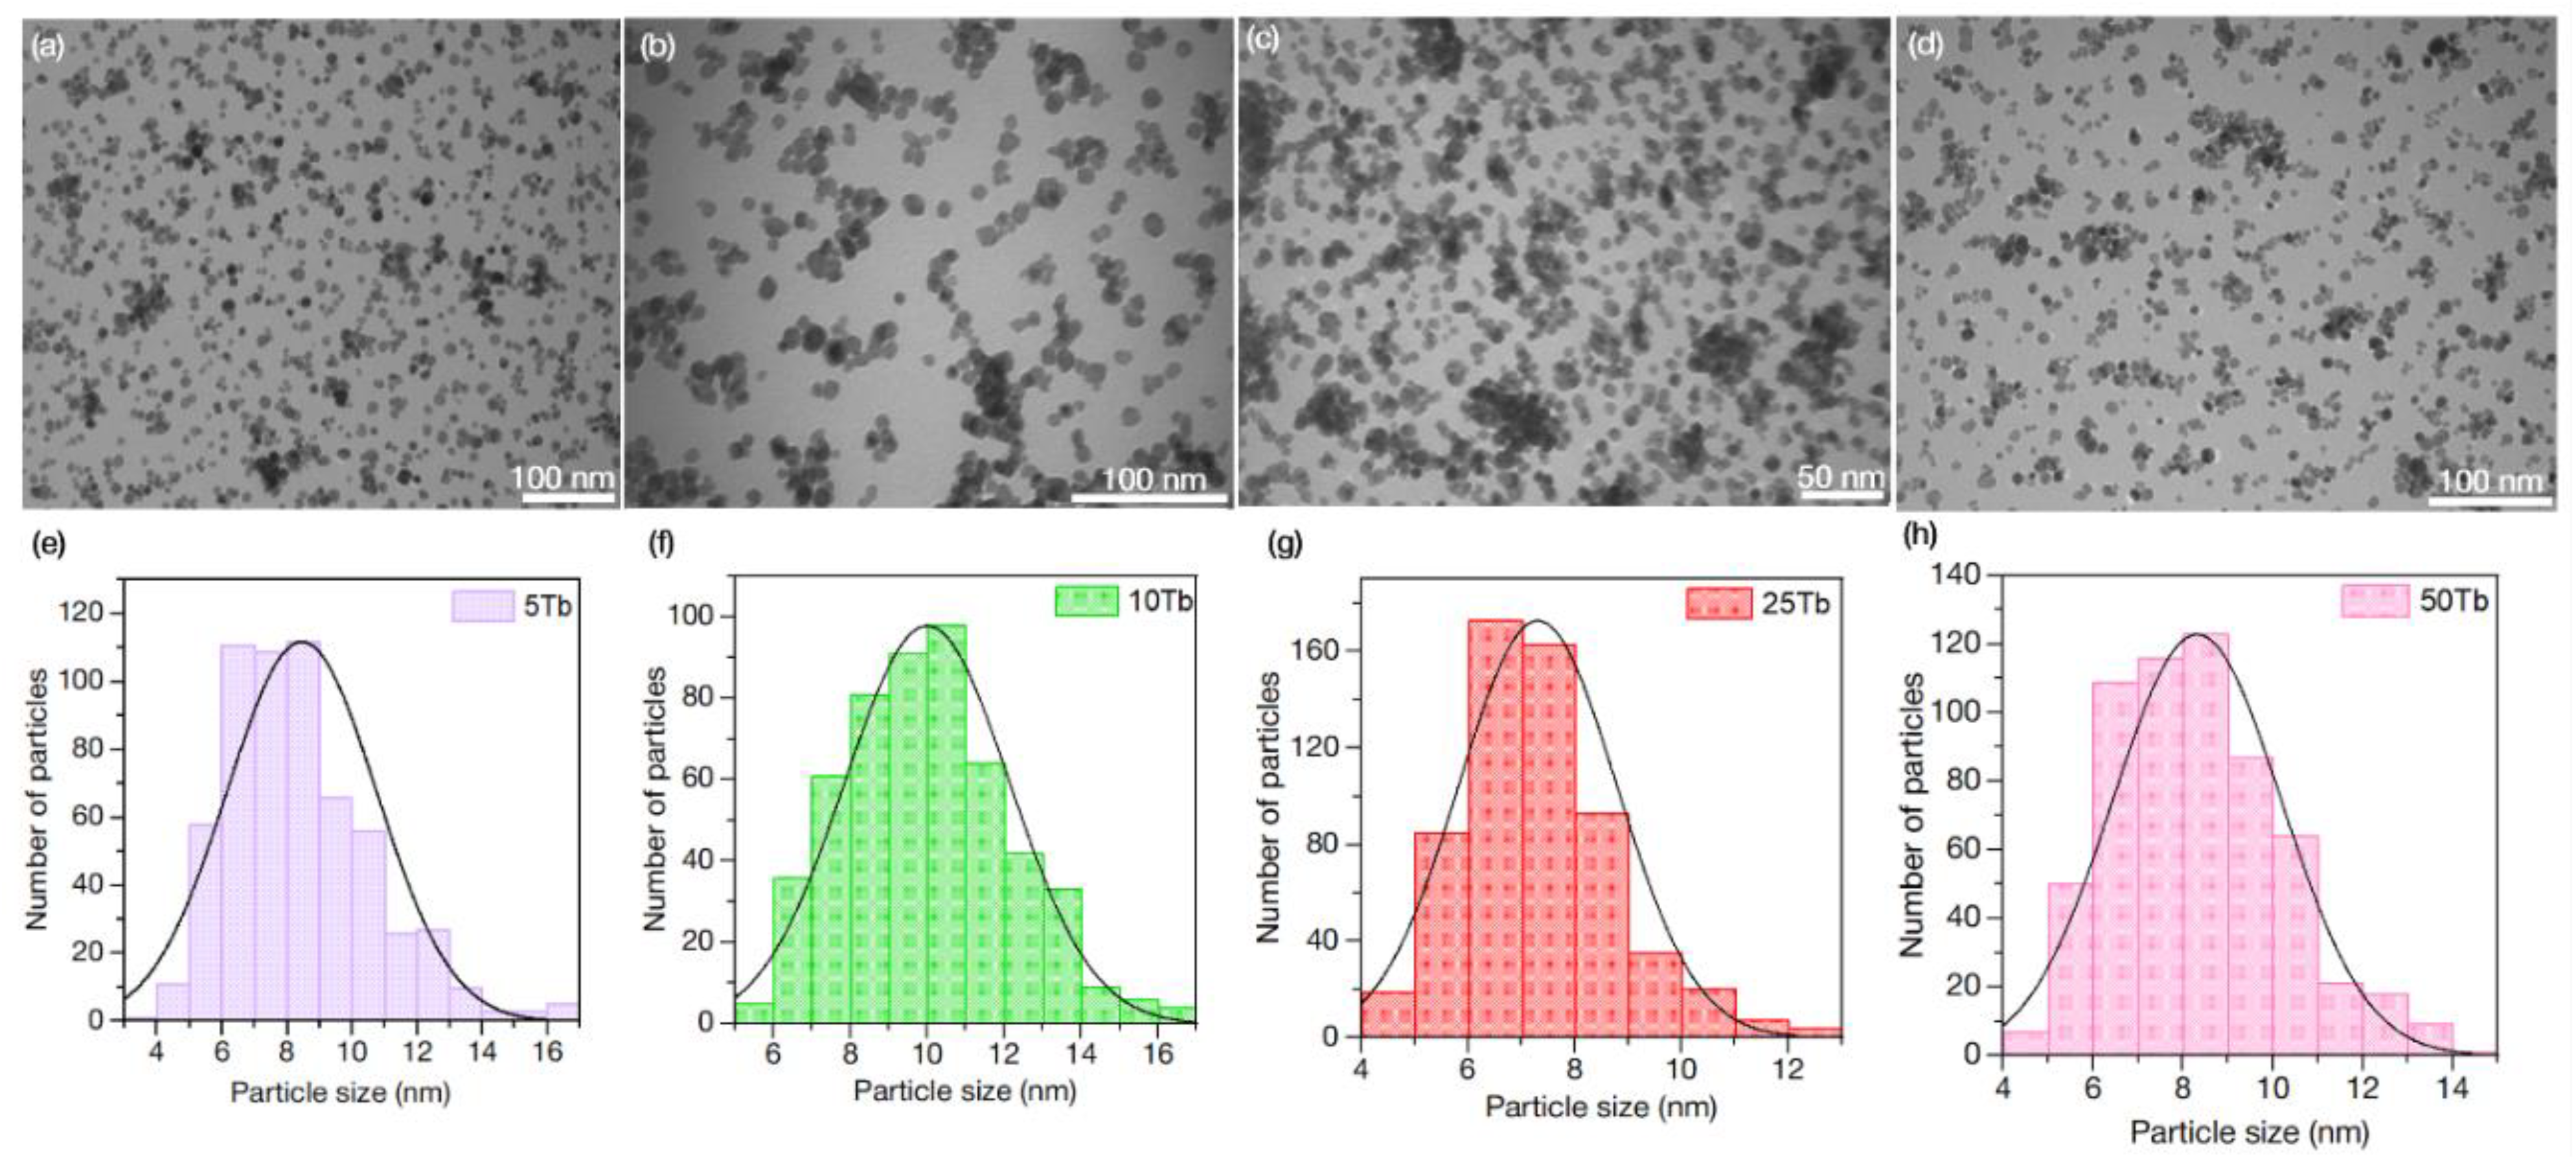
Moreover, the Scherrer equation was used for the estimation of the average crystalline size. In this case, shape factor k was chosen for spherical particles (k = 0.9) because according to the TEM data, synthesized nanoparticles are close to spherical shape (see Section 3.1.3). The analysis of the full width at half-maximum (FWHM) of the XRD lines showed that for the synthesized 5Tb MW, 10Tb MW, 25Tb MW, and 50Tb MW nanoparticles, the averaged sizes were equal to 8.5, 8.9, 7.7, and 10.3 nm, respectively. The obtained results were in good correspondence to thee averaged particle size evaluated explicitly from the TEM images.

3.1.2. X-Ray Fluorescence Measurements of BaGdF5: x%Tb3+

The elemental composition of the BaGdF5 doped with different initial concentrations (x = 5, 10, 25, 50%) of Tb3+ was estimated using X-ray fluorescence (XRF) data. The actual and expected elemental composition percentage of the Ba, Gd, Tb, and F elements for each sample were calculated and reported in Table S1. The obtained results demonstrate that the Tb3+ precursor almost entirely reacted during the synthesis involved in the formation of NPs and that BaGd1–xF5Tbx stoichiometry is well-established. Some of the notable deviations between the predicted and actual Tb3+ content observed for the lowest Tb3+ loading were likely due to the presence of a tiny amount of the nonreacted Tb3+ precursor as well as an XRF experimental error in determination at a low-concentration level.

3.1.3. Transmission Electron Microscopy (TEM) of BaGdF5: x%Tb3+

The size distribution of the nanoparticles was estimated using the ImageJ program [50] by analyzing the TEM images (Figure 3). The total numbers of the measured nanoparticles were about 600. As a result, it has been shown that for all samples, the nanoparticles were in the range of 5–17 nm. This fact complies with the requirements for nanophosphors as a part of nanocomposites that can be used in XPDT. Moreover, the TEM results are in good agreement with the crystalline size according to the Scherrer analysis (see Section 3.1.1).

3.1.4. X-Ray Excited Optical Luminescence

It is widely known that rare-earth metal ions such as Tb3+ doped into a wide range of materials exhibit optical luminescence upon UV–Vis and X-ray radiation [14,28,51,52]. The latter makes it possible to convert ionizing radiation into visible light as part of the XPDT system.
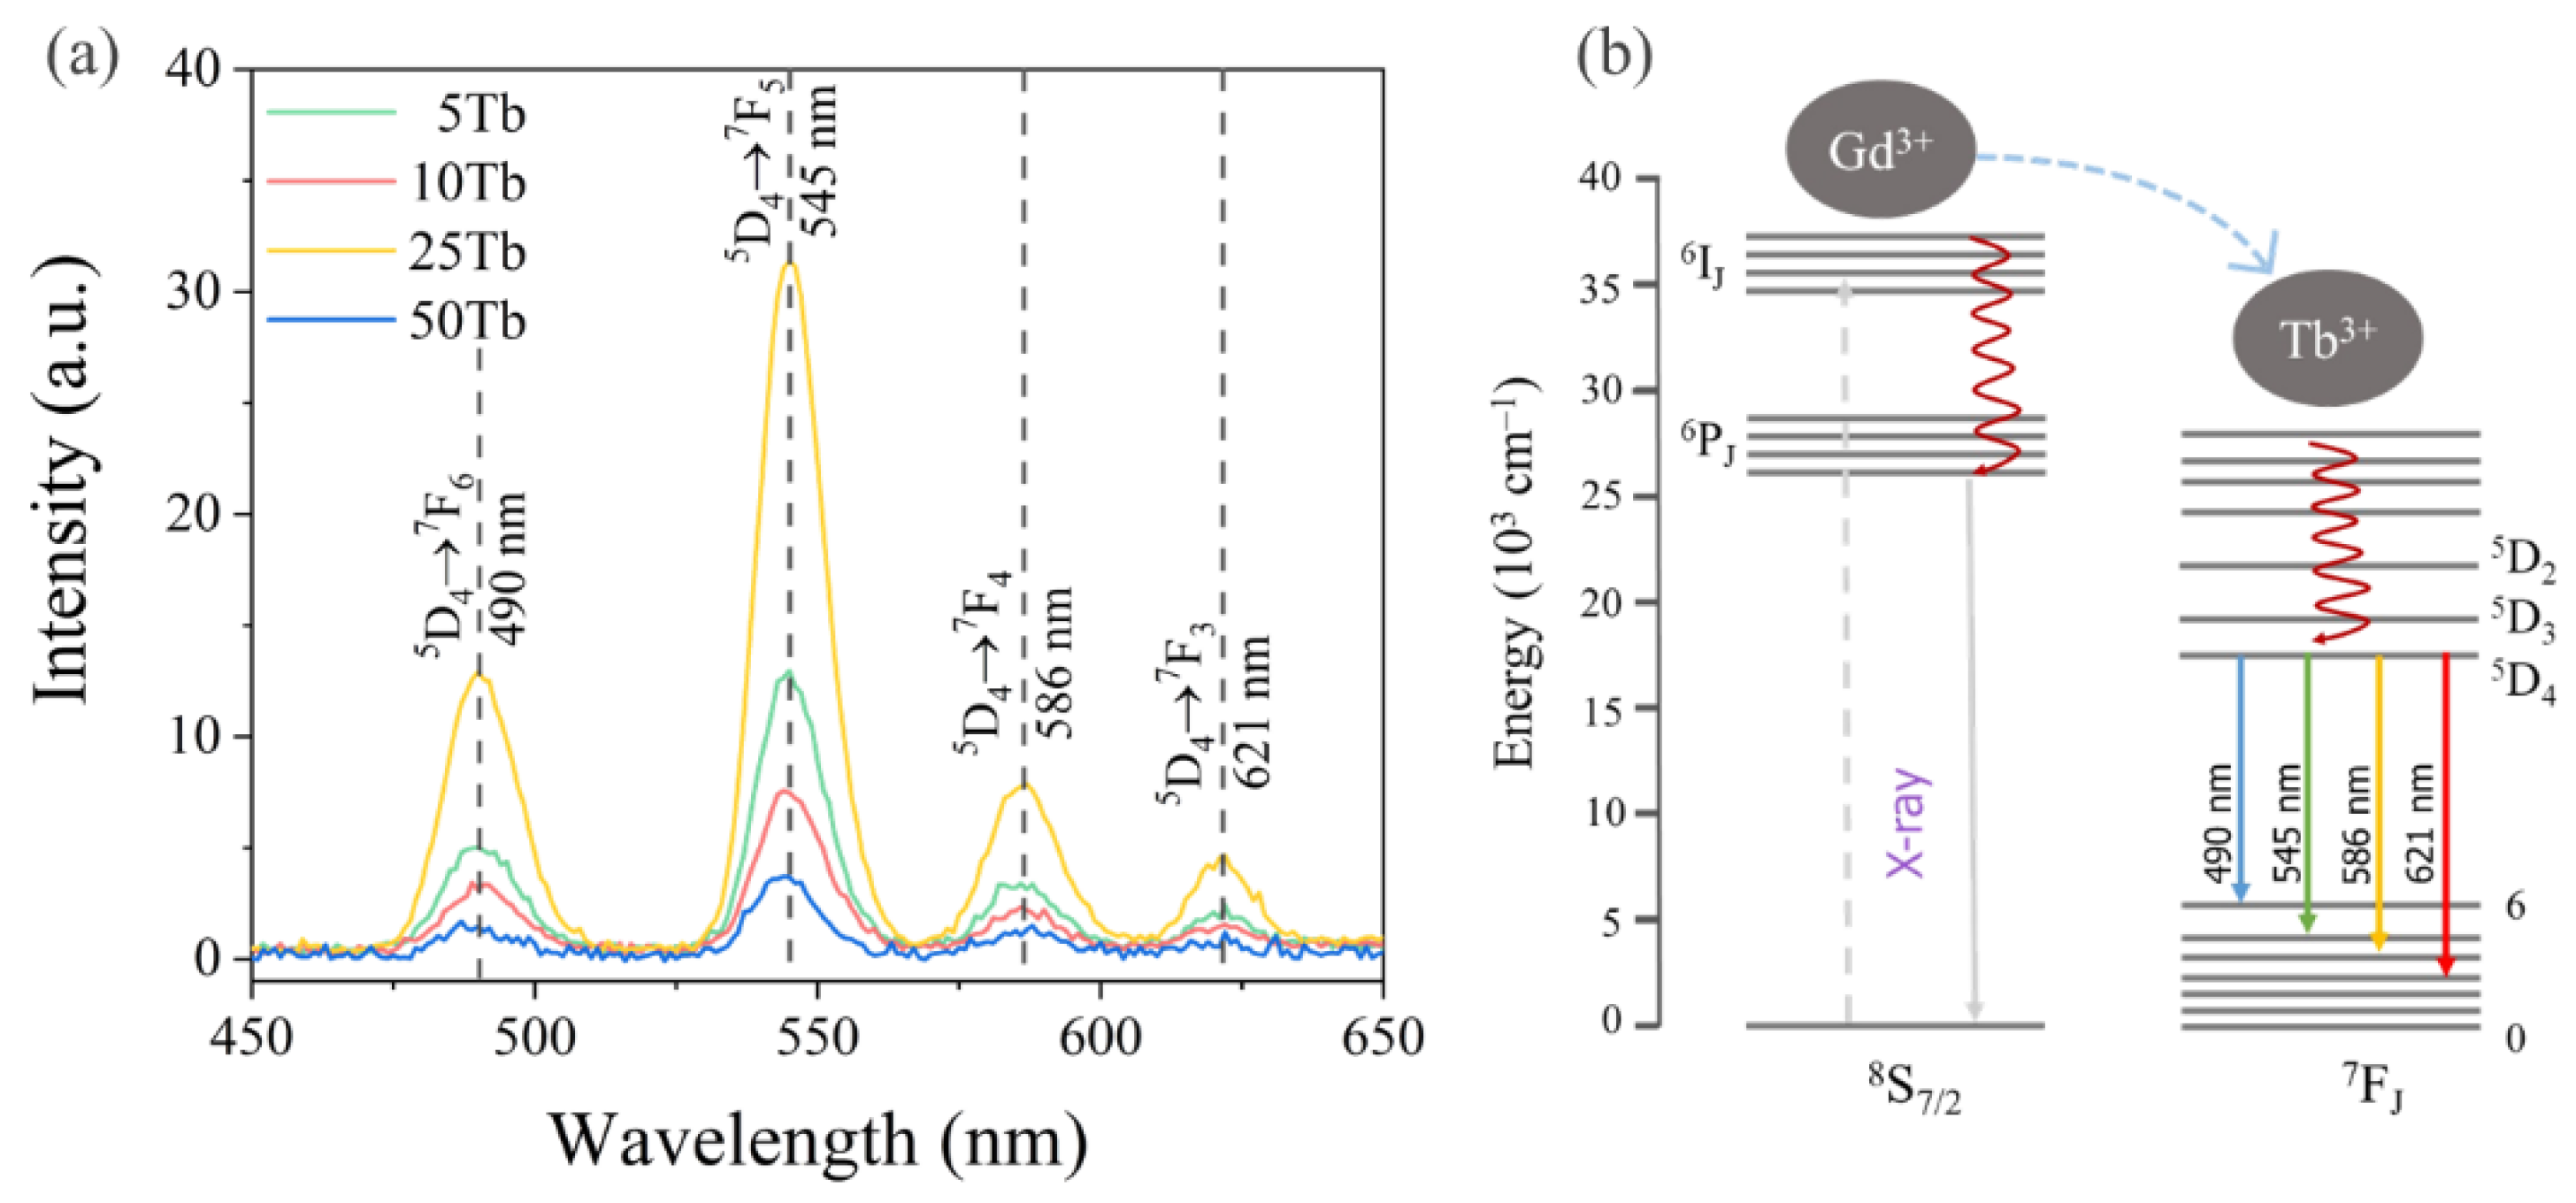
The XEOL spectrum (Figure 4) of samples doped with x%Tb showed a spectral shape typical for Tb3+-ions doped into the BaGdF5 structure [14,28]. According to the emission spectrum of x%Tb3+, four strong narrow bands at 490, 545, 586, and 621 nm were ascribed to the electronic transitions from the excited state of 5D4 to the ground states of 7FJ (J = 6–3) [53], as shown in Figure 4b: 5D47F6 for λ = 490 nm, 5D47F5 for λ = 545 nm, 5D47F4 for λ = 586 nm, and 5D37F3 for λ = 621 nm. The dominant peak was the green emission of 544 nm, which is a magnetic dipole transition with ΔJ = 1, and was more intense than the other transitions [52,53,54]. As shown in Figure 4a, we may declare that the optimal actual content of doped Tb3+ was equal to 3.78 at. % (i.e., 25Tb). Thus, the 25Tb structure was chosen for further synthesis improvements.

3.2. Tuning Size of BaGdF5: 25Tb3+ Nanoparticles by Various Synthesis Conditions

3.2.1. X-Ray Diffraction of BaGdF5: 25Tb3+ Obtained by the MW and ST Techniques

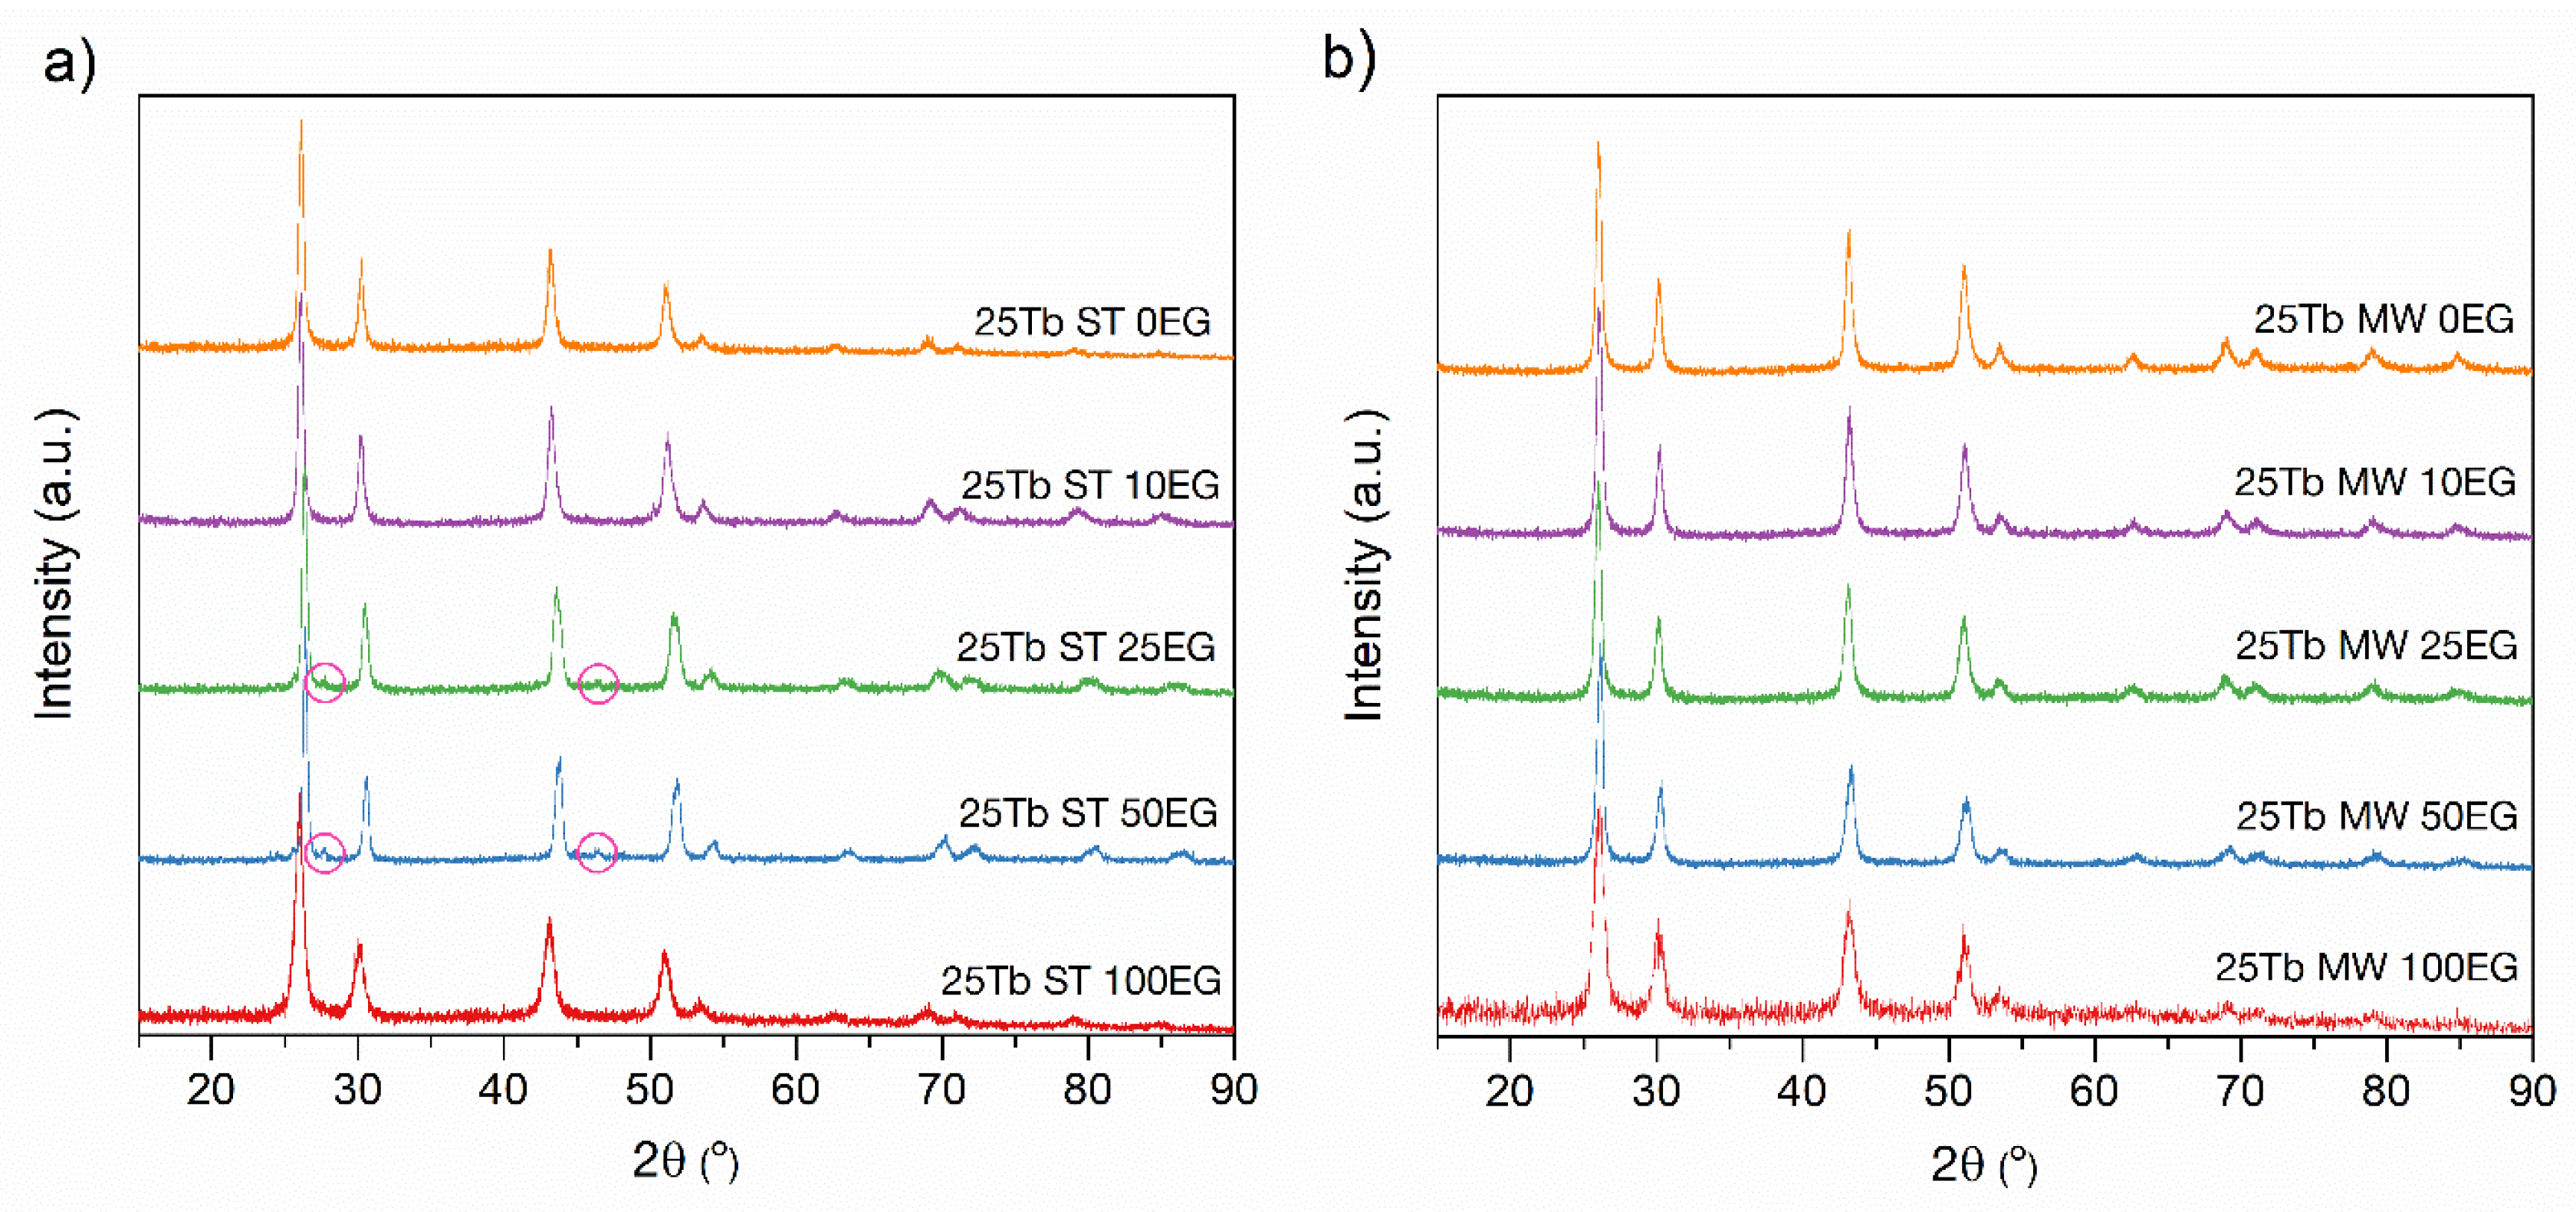
The XRD patterns of all MW and ST samples are presented in Figure 5. It can be seen that for solvothermal synthesis in a system containing only ethylene glycol (25Tb ST 100EG) as a solvent, the rate of crystal nucleation was low due to the high viscosity and slow diffusion of the reagents. The system had enough time to heat up before the formation of the crystals started, thus the pure BaGdF5 phase was formed.
However, the viscosity of the solution dropped, and the reaction rate increased with the addition of water to the system (25Tb ST 25EG and 25Tb ST 50EG). Since there were many more Ba2+ and Gd3+ ions in the system than Tb3+ ions, the statistical probability of the predominant formation of BaF2, BaGdF5, and GdF3 in the first stage was higher than that of their terbium analogues. Then, after the formation of the BaGdF5 and GdF3 particles, gadolinium was replaced by terbium. Moreover, based on the standard dissociation energies of the Gd–F bonds (590 kJ/mol [55] and Tb-F (561 kJ/mol [55]), it can be seen that the process of replacing Gd3+ with Tb3+ ions is endothermic and therefore proceeds at an elevated temperature. It can be assumed that in the case of hydrothermal synthesis, the heating of the reaction mixture occurs unevenly. These factors, in combination with the slow diffusion of reagents, in particular terbium ions, lead to the fact that the substitution process proceeds more actively in the solvent layer located near the hot walls of the ampoule than in the deep layers. As a result, the small impurities of the GdF3 phase [56] in the diffraction profiles of these samples can be seen (marked with pink circle at Figure 5a).
In addition, an excess of water in the system (25Tb ST 0EG and 25Tb ST 10EG) led to an even greater drop in the viscosity and facilitated the diffusion of reagents. On the other hand, the thermal conductivity of the solution increased from 0.249 W/m·K for pure ethylene glycol [57] to 0.569 W/m·K for pure water [57]. These factors caused a more uniform reaction over the volume. As a result, the pure BaGdF5 phase was observed from the XRD (Figure 5a,b).

3.2.2. Transmission Electron Microscopy Measurements of BaGdF5:25Tb3+ Obtained by MW and ST Techniques

The shape, morphology, and size were also studied using transmission electron microscopy (TEM) for the nanoparticles synthesized by two different methods, MW and ST, in two ways: variation in the temperature and EG amount. As seen from the TEM images (Figure 6a,Figure 7a,Figure 8a,Figure 9a) and from the particle size distribution analysis (Figure 6b,Figure 7b,Figure 8b,Figure 9b), all of the 25Tb samples were characterized by the spherical shape of the particles.
The obtained averaged size of the particles (as estimated from TEM) is suitable for medical application. Indeed, such small nanoparticles are known to readily overcome biological barriers [33]. Small capillaries have a diameter of about 3 micrometers, and nanoparticles with a size less than 200 nm can be freely transported through the circulatory system and carry pharmaceutically active substances.

3.2.3. Microwave Synthesis at Different Temperature and Different Percentage of EG

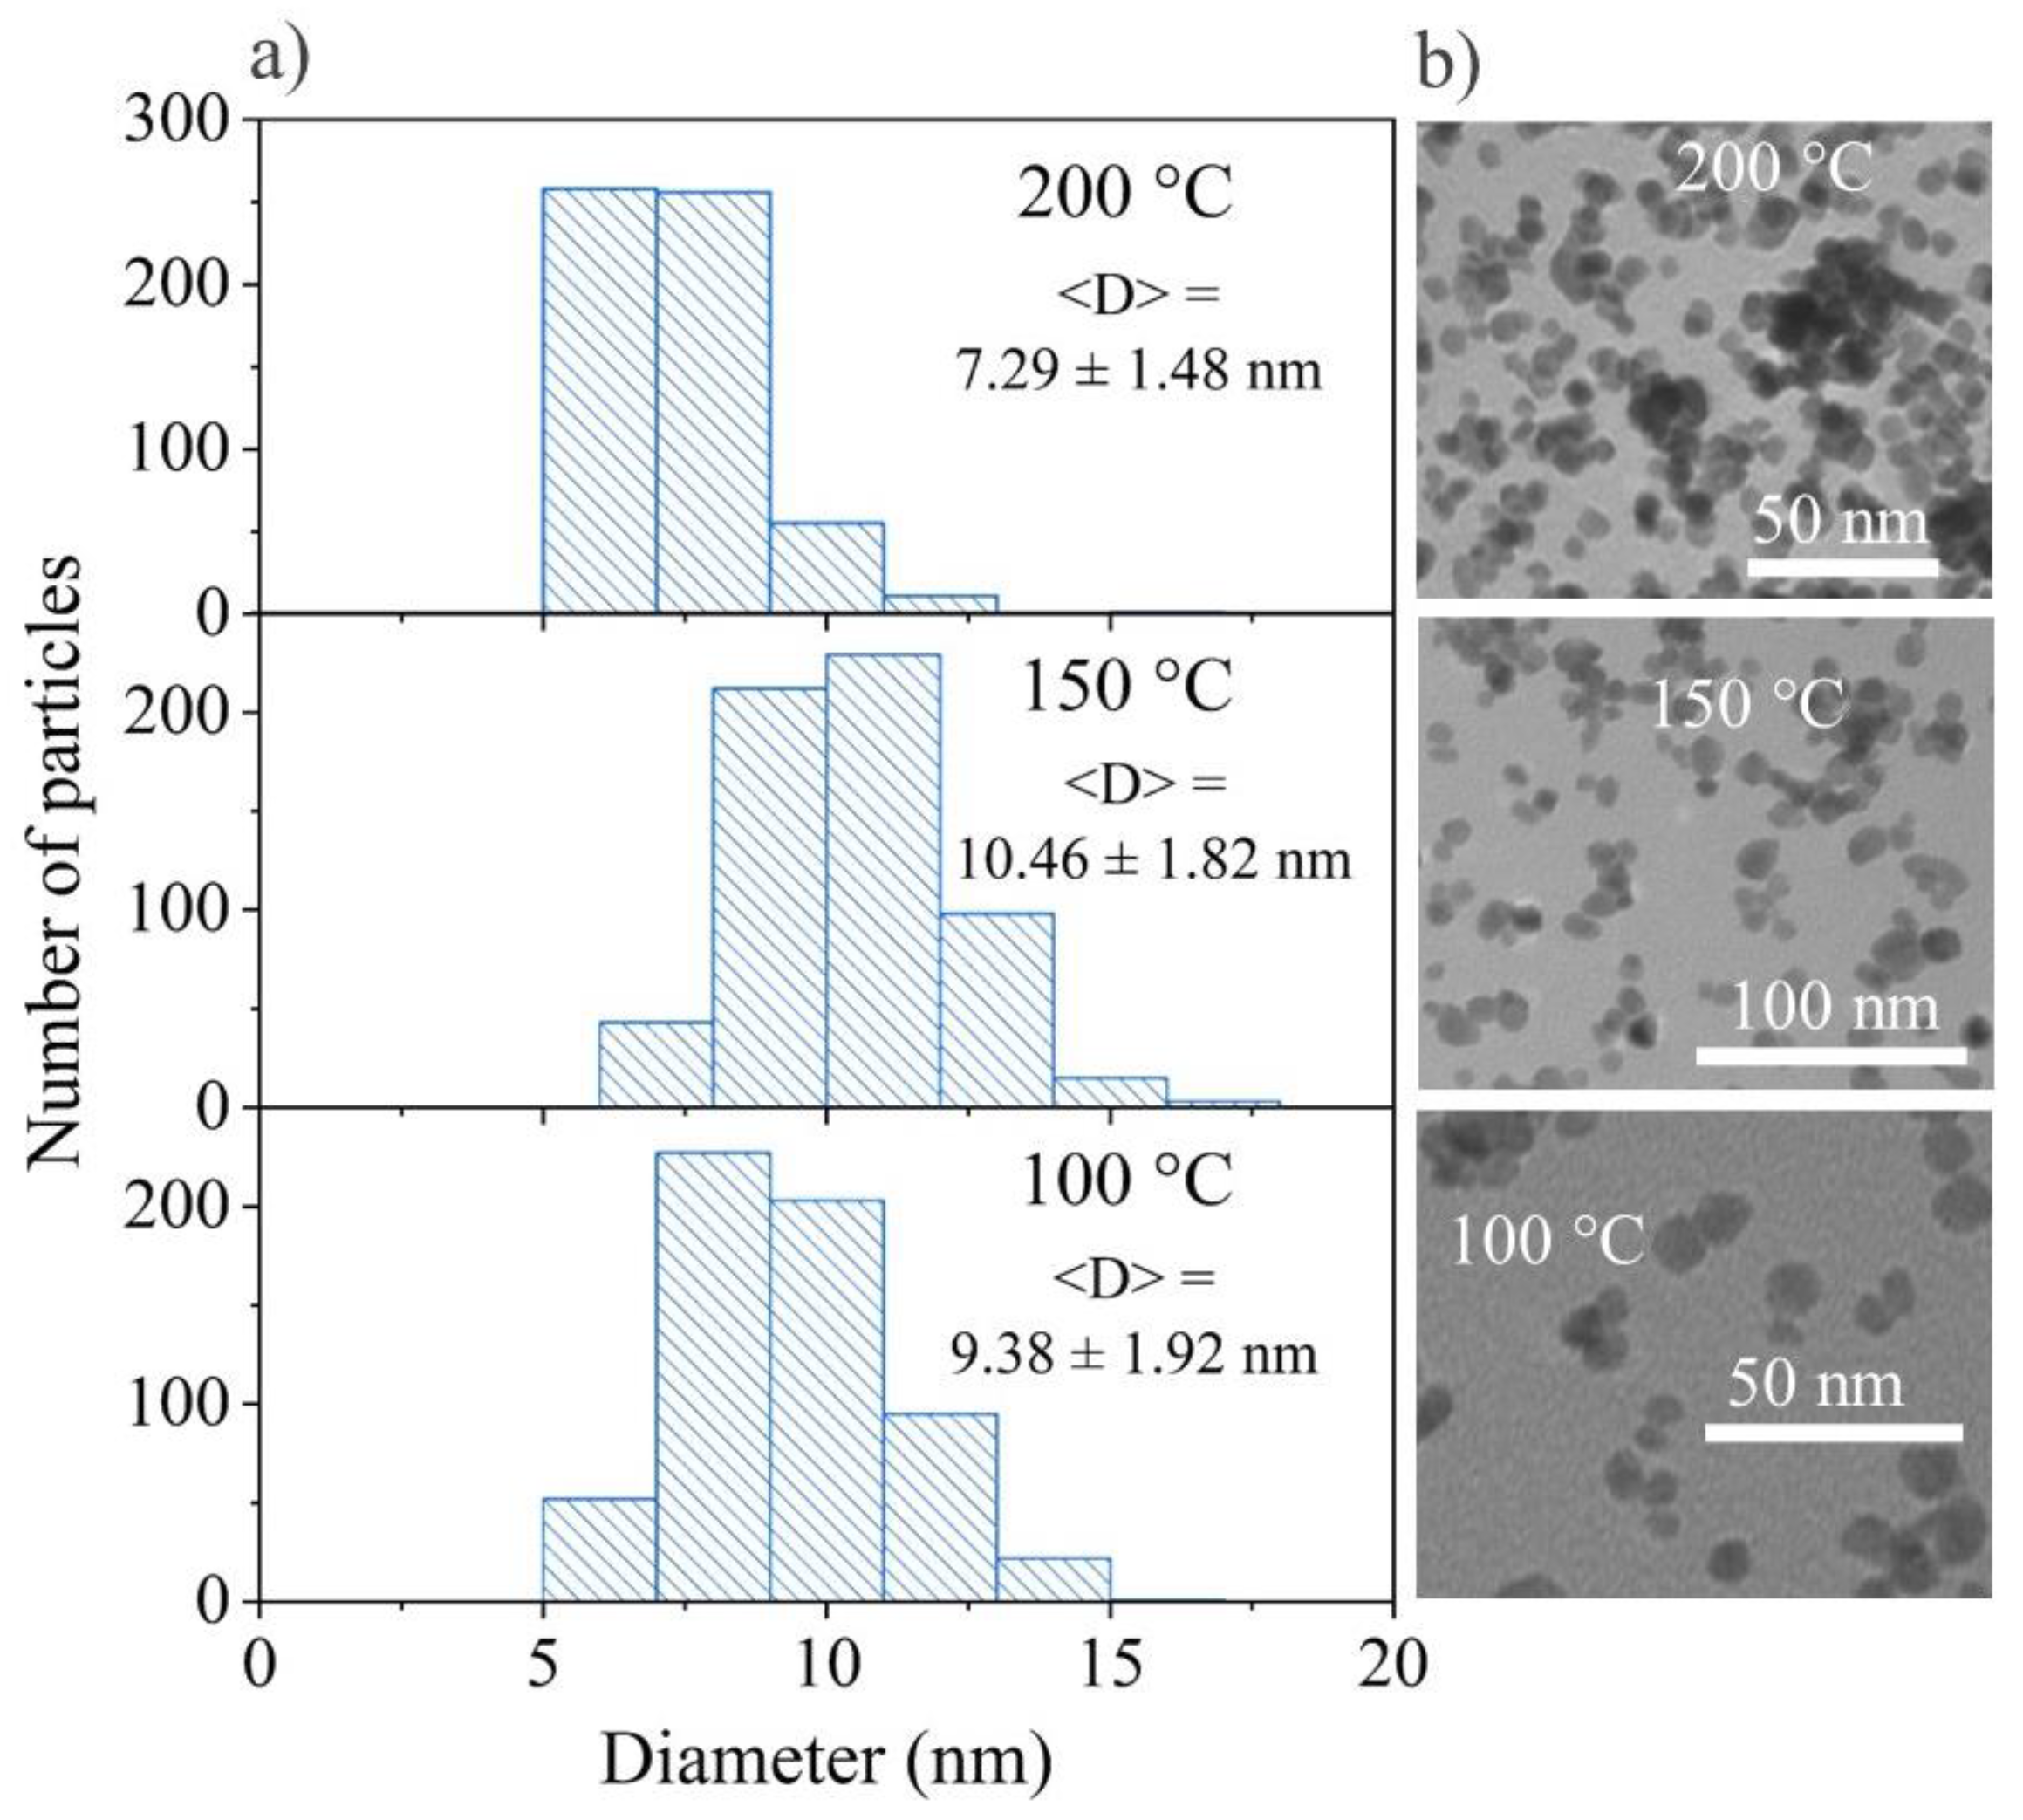
According to the particle size distribution, the sample synthesized at 200 °C had the most monodisperse character. This once again confirms that the standard procedure developed earlier provided the best result. Another two samples synthesized at 100 °C and 150 °C showed broader peaks and with increasing temperature, the peak shifted toward larger sizes. However, at 200 °C, we observed a peak shift to the small sizes. The average size of the sample synthesized at 100 °C was 8–9 nm, at 150 °C—10–11 nm, and at 200 °C—6–7 nm (Figure 6).
According to the particle size distribution of the sample synthesized with various shares of EG (Figure 7), almost no change was observed for 25Tb with 0, 10, 25, and 50% EG and the average size for these samples was 20–25 nm. In the case of adding 100% EG, the size of the nanoparticles sharply decreased to 6–8 nm. Similar results were obtained by the team of A. Opalinska for ZnO nanoparticles synthesized by microwave solvothermal synthesis with EG/water solvent [58]. Based on this research, the obtained NPs were characterized by a homogeneous morphology and a narrow distribution of particle sizes.

3.2.4. Solvothermal Synthesis at Different Temperature and Different Percentage of EG

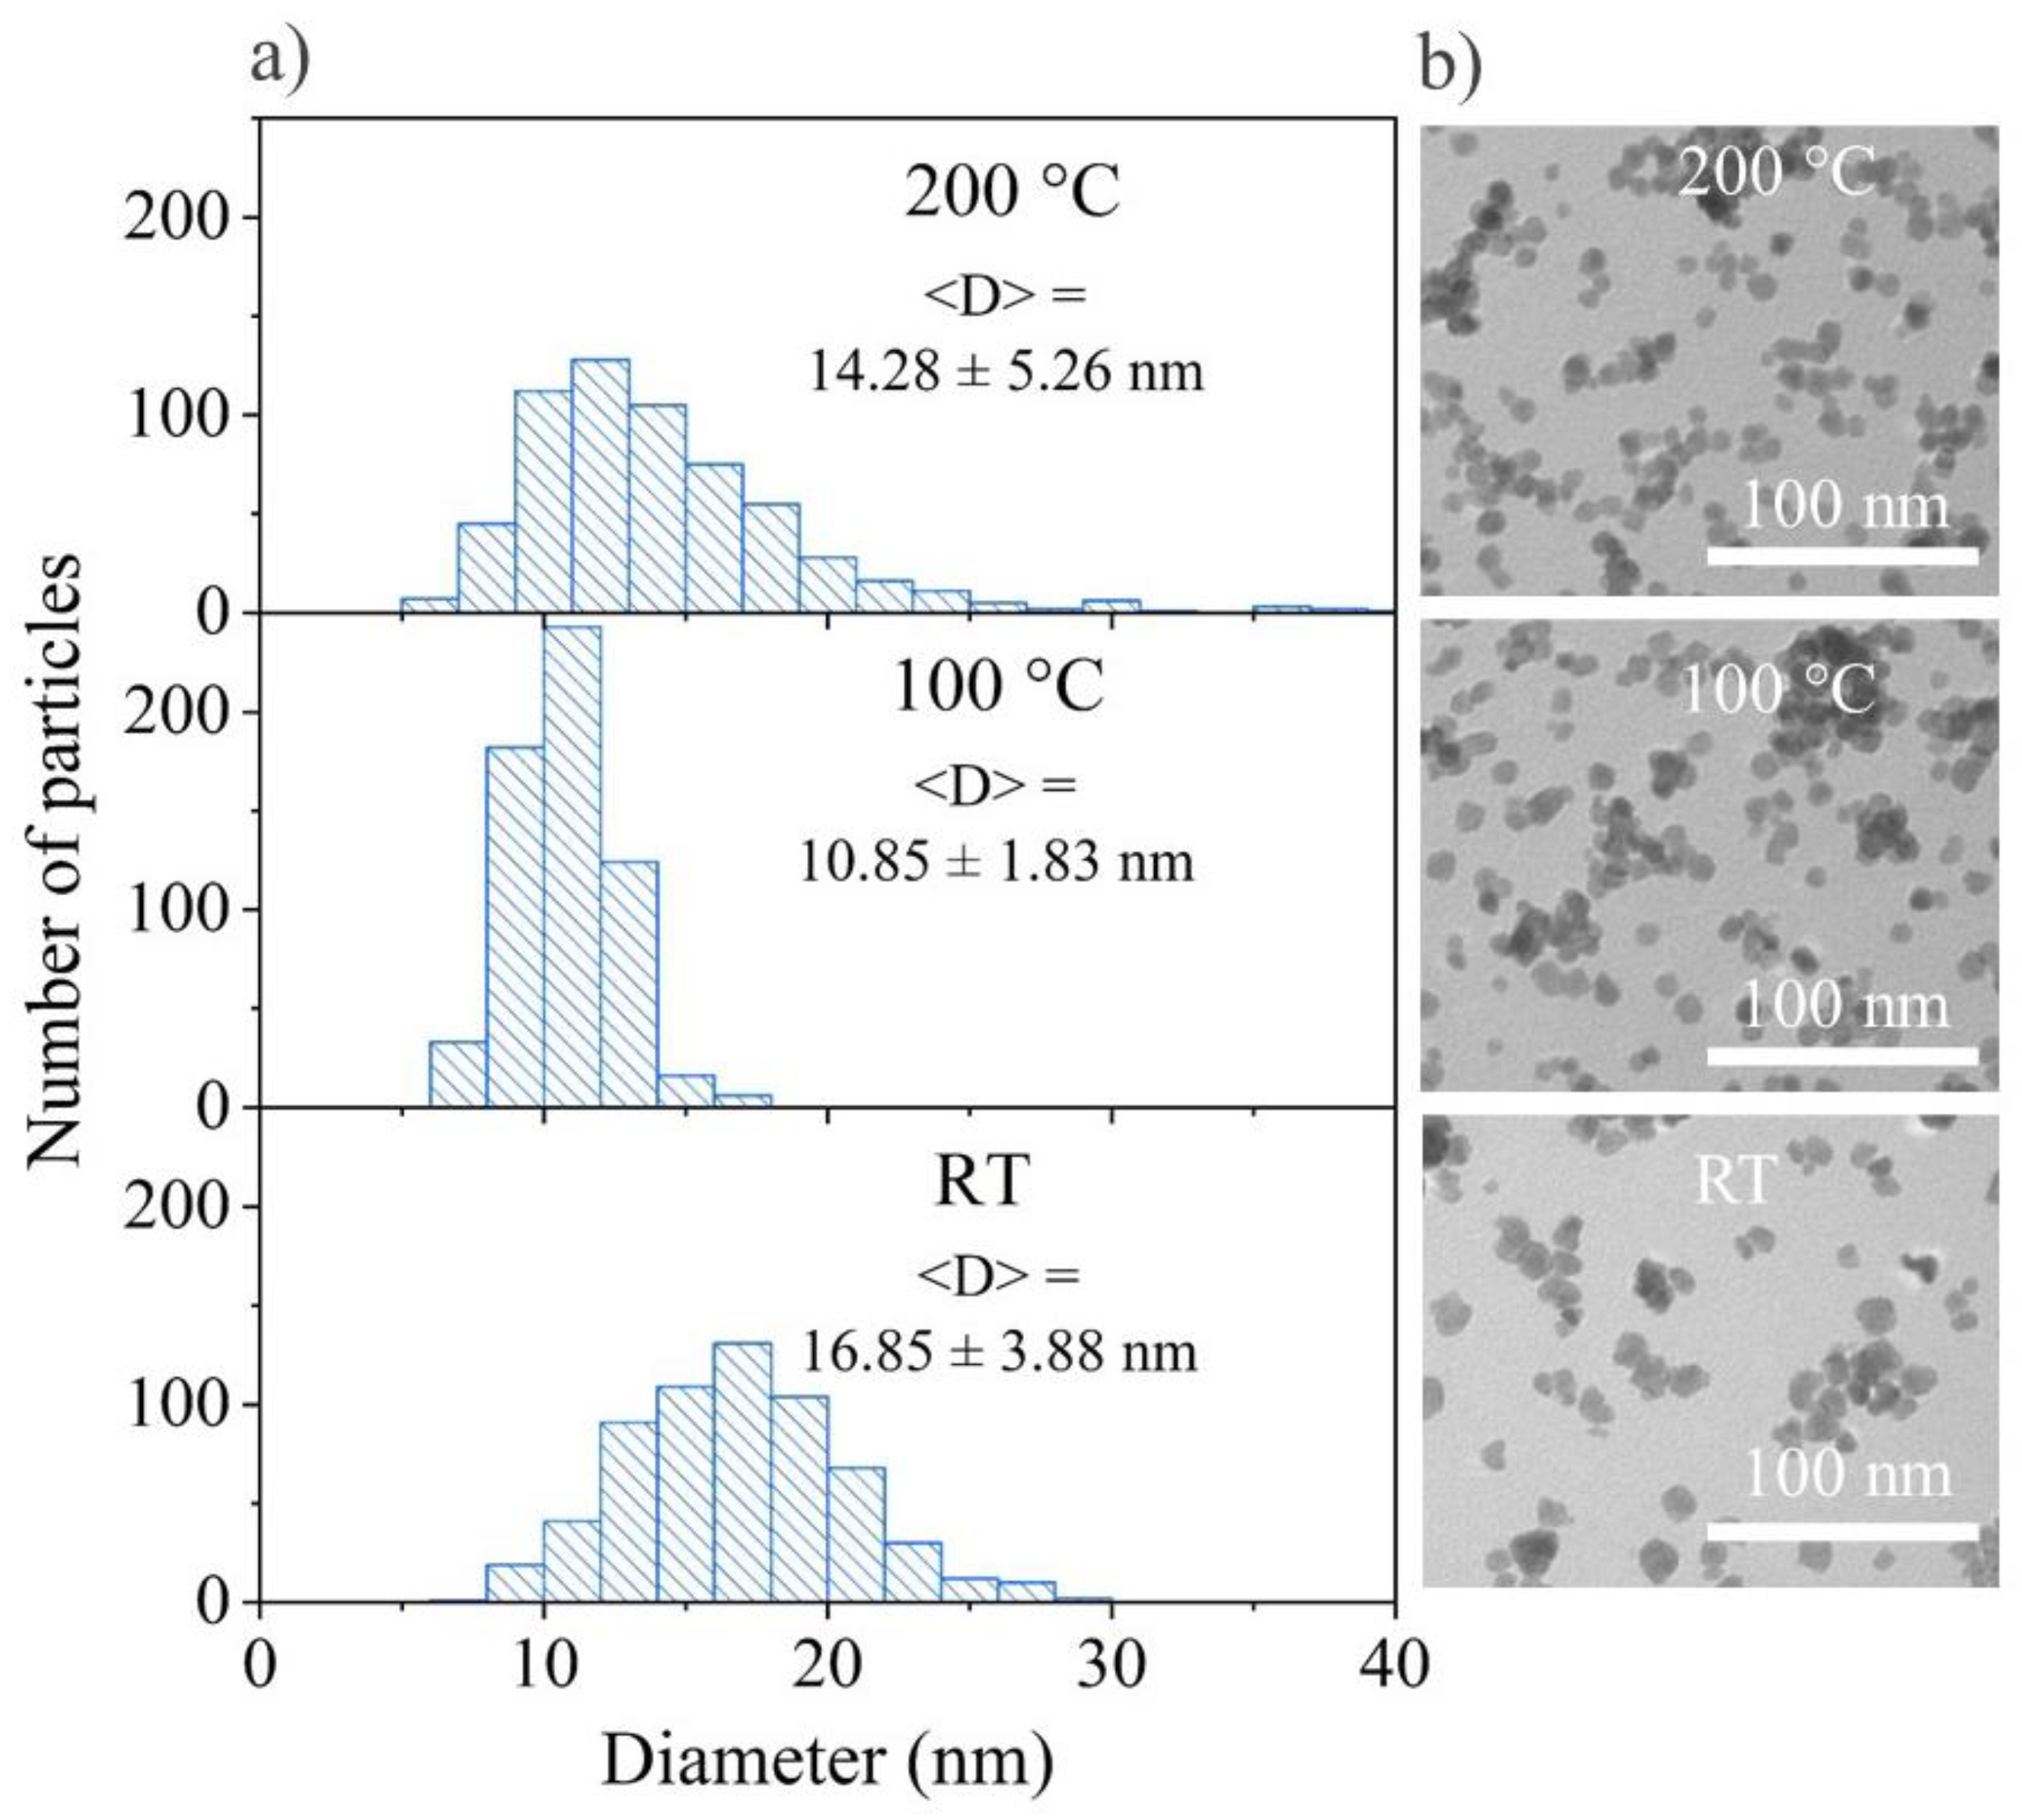
As evident from the particle size distribution, the samples synthesized at room temperature (RT) had an average size of 16–18 nm, at 100 °C it was 10–12 nm, and at 200 °C it was 11–13 nm (Figure 8).
It is easy to see from the particle size distribution of the samples synthesized with x% EG that the 0% EG particles had an average size of 22–25 nm, 10% EG—22–25 nm, 25% EG—34–43 nm, 50% EG—40–58 nm, and 100% EG—9–12 nm (Figure 9). As in the case of microwave syntheses, we observed a sharp decrease in the size of 100% EG nanoparticles as well as a narrower distribution of nanoparticles (i.e., a more monodisperse structure). On this basis, we can conclude that not only the type of heating affects a noticeable shift in the distribution, but also the type of solvent. The wider particle size distribution in the case of 25% EG and 50% EG may correspond to different rates of crystal nucleation and growth in different parts of the reaction space of the autoclave with a simultaneously high solution viscosity and an increase in the reaction rate upon the addition of water. An increase in the water content leads to a decrease in the viscosity and reaction rate. As a result, the difference in the rates of nucleation and the growth of crystallites decreases. Therefore, we could observe a decrease in the proportion of a large fraction of particles in 10% EG and 0% EG samples.

4. Conclusions

The BaGdF5 nanophosphors with different Tb:Gd ratios ranging from 0.1 to 0.5 were synthesized. Pure BaGdF5 phases were obtained. According to the XEOL analysis, the sample with the Tb:Gd ratio of 0.25 demonstrated the largest luminescence yield, being an optimal choice for converting X-rays into optical radiation.
Based on the optimal nanophosphor composition, the effect of temperature, the composition of EG/water solvent, and synthesis technique on the size of the obtained particles was next investigated for the samples with 25% of Tb ions. The microwave synthesis at all EG/water compositions makes it possible to obtain smaller particles with a narrower size distribution (7.29 ± 1.48 nm in 100%EG) compared to the solvothermal (13.3 ± 2.96 nm in 100% EG). This was due to the high heating rate and uniform mixture heating. The addition of 50% of water to ethylene glycol led to a sharp increase in the size of the resulting nanoparticles in both the MW and ST methods. Moreover, a further increase in the water content for MW synthesis had practically no effect on the size and width of the distribution of nanoparticles, but differences were noticeable in the case of solvothermal synthesis. For the sample synthesized in a mixture containing 50% EG, the largest nanoparticles with a wide size distribution (49.4 ± 13.3 nm) were observed, which was attributed to the different rates of nucleation and the growth of crystallites in different regions of the reaction volume. Increasing the water content led to a decrease in the nanoparticles’ size and a narrower distribution (24.3 ± 6.11 nm in 10%EG). This was due to an increase in the heating rate of the system due to an increase in the thermal conductivity of the solution and a decrease in its viscosity. Temperature variation in both the microwave and solvothermal syntheses did not lead to a noticeable change in the particle size.
Overall, as expected, MW heating produced smaller particles for all of the tested temperatures in comparison with the solvothermal synthesis. Thus, by varying the solvent composition as well as the method of system heating, we can achieve fine-tuning of the BaGdF5 nanoparticle sizes.

Supplementary Materials

The following supporting information can be downloaded at: https://www.mdpi.com/article/10.3390/ma15238559/s1, Table S1: Calculated initial elemental composition of the BaGdF5:x%Tb3+ samples and the actual elemental composition from the X-ray fluorescence measurements; Figure S1: The diffraction profile and calculated line (upper pattern) and difference curve (lower pattern) of 10Tb (GOF = 1.12); Figure S2: The diffraction profile and calculated line (upper pattern) and difference curve (lower pattern) of 50Tb (GOF = 0.99).

Author Contributions

Conceptualization, methodology, V.P.; Validation, V.P., Z.G. and D.K.; Formal analysis, Z.G. and D.K.; Investigation, V.P., Z.G. and D.K.; Writing—original draft preparation, V.P.; Writing—review and editing, Z.G. and D.K.; Visualization, Z.G. and D.K.; Supervision, data curation, funding acquisition, project administration, A.S. All authors have read and agreed to the published version of the manuscript.

Funding

This research was funded by the Russian Science Foundation (grant no. 19-15-00305-П).

Institutional Review Board Statement

Not applicable.

Informed Consent Statement

Informed consent was obtained from all subjects involved in the study.

Data Availability Statement

All of the data are contained in the manuscript and its Supplementary Materials.

Acknowledgments

The authors team would like to thank Ilya Pankin for his help in measuring XEOL spectra and language editing.

Conflicts of Interest

The authors declare no conflict of interest.

References

  1. Ferlay, J.; Colombet, M.; Soerjomataram, I.; Mathers, C.; Parkin, D.M.; Piñeros, M.; Znaor, A.; Bray, F. Estimating the global cancer incidence and mortality in 2018: GLOBOCAN sources and methods. Int. J. Cancer 2019, 144, 1941–1953. [Google Scholar] [CrossRef] [PubMed] [Green Version]
  2. Malvezzi, M.; Carioli, G.; Bertuccio, P.; Boffetta, P.; Levi, F.; La Vecchia, C.; Negri, E. European cancer mortality predictions for the year 2019 with focus on breast cancer. Ann. Oncol. 2019, 30, 781–787. [Google Scholar] [CrossRef] [PubMed] [Green Version]
  3. Li, H.; Liu, G.; Wang, J.; Dong, X.; Yu, W. Dual-mode, tunable color, enhanced upconversion luminescence and magnetism of multifunctional BaGdF5:Ln3+ (Ln = Yb/Er/Eu) nanophosphors. Phys. Chem. Chem. Phys. 2016, 18, 21518–21526. [Google Scholar] [CrossRef] [PubMed]
  4. Yang, Y.; Bazhin, A.V.; Werner, J.; Karakhanova, S. Reactive Oxygen Species in the Immune System. Int. Rev. Immunol. 2013, 32, 249–270. [Google Scholar] [CrossRef] [PubMed]
  5. Yang, Y.; Karakhanova, S.; Werner, J.; Bazhin, A.V. Reactive Oxygen Species in Cancer Biology and Anticancer Therapy. Curr. Med. Chem. 2013, 20, 3677–3692. [Google Scholar] [CrossRef]
  6. Li, X.; Kwon, N.; Guo, T.; Liu, Z.; Yoon, J. Innovative Strategies for Hypoxic-Tumor Photodynamic Therapy. Angew. Chem. Int. Ed. 2018, 57, 11522–11531. [Google Scholar] [CrossRef]
  7. Li, X.; Lee, S.; Yoon, J. Supramolecular photosensitizers rejuvenate photodynamic therapy. Chem. Soc. Rev. 2018, 47, 1174–1188. [Google Scholar] [CrossRef]
  8. Pham, T.C.; Nguyen, V.-N.; Choi, Y.; Lee, S.; Yoon, J. Recent Strategies to Develop Innovative Photosensitizers for Enhanced Photodynamic Therapy. Chem. Rev. 2021, 121, 13454–13619. [Google Scholar] [CrossRef]
  9. Bulin, A.-L.; Truillet, C.; Chouikrat, R.; Lux, F.; Frochot, C.; Amans, D.; Ledoux, G.; Tillement, O.; Perriat, P.; Barberi-Heyob, M.; et al. X-ray-Induced Singlet Oxygen Activation with Nanoscintillator-Coupled Porphyrins. J. Phys. Chem. C 2013, 117, 21583–21589. [Google Scholar] [CrossRef]
  10. Larue, L.; Ben Mihoub, A.; Youssef, Z.; Colombeau, L.; Acherar, S.; André, J.C.; Arnoux, P.; Baros, F.; Vermandel, M.; Frochot, C. Using X-rays in photodynamic therapy: An overview. Photochem. Photobiol. Sci. 2018, 17, 1612–1650. [Google Scholar] [CrossRef]
  11. Gadzhimagomedova, Z.; Zolotukhin, P.; Kit, O.; Kirsanova, D.; Soldatov, A. Nanocomposites for X-Ray Photodynamic Therapy. Int. J. Mol. Sci. 2020, 21, 4004. [Google Scholar] [CrossRef] [PubMed]
  12. Cui, F.-Z.; Liu, J.-H.; Liu, Y.; Yuan, B.-Y.; Gong, X.; Yuan, Q.-H.; Gong, T.-T.; Wang, L. Synthesis of PEGylated BaGdF5 Nanoparticles as Efficient CT/MRI Dual-modal Contrast Agents for Gastrointestinal Tract Imaging. Chin. J. Anal. Chem. 2020, 48, 1004–1011. [Google Scholar] [CrossRef]
  13. Wang, T.; Jia, G.; Cheng, C.; Wang, Q.; Li, X.; Liu, Y.; He, C.; Chen, L.; Sun, G.; Zuo, C. Active targeted dual-modal CT/MR imaging of VX2 tumors using PEGylated BaGdF5 nanoparticles conjugated with RGD. New J. Chem. 2018, 42, 11565–11572. [Google Scholar] [CrossRef]
  14. Li, H.; Liu, G.; Wang, J.; Dong, X.; Yu, W. Eu3+ /Tb3+ doped cubic BaGdF 5 multifunctional nanophosphors: Multicolor tunable luminescence, energy transfer and magnetic properties. J. Lumin 2017, 186, 6–15. [Google Scholar] [CrossRef]
  15. Grzyb, T.; Mrówczyńska, L.; Szczeszak, A.; Śniadecki, Z.; Runowski, M.; Idzikowski, B.; Lis, S. Synthesis, characterization, and cytotoxicity in human erythrocytes of multifunctional, magnetic, and luminescent nanocrystalline rare earth fluorides. J. Nanoparticle Res. 2015, 17, 1–18. [Google Scholar] [CrossRef] [PubMed] [Green Version]
  16. Kirsanova, D.; Polyakov, V.; Butova, V.; Zolotukhin, P.; Belanova, A.; Gadzhimagomedova, Z.; Soldatov, M.; Pankin, I.; Soldatov, A. The Rare-Earth Elements Doping of BaGdF5 Nanophosphors for X-ray Photodynamic Therapy. Nanomaterials 2021, 11, 3212. [Google Scholar] [CrossRef] [PubMed]
  17. Liu, Y.; Tu, D.; Zhu, H.; Li, R.; Luo, W.; Chen, X. A Strategy to Achieve Efficient Dual-Mode Luminescence of Eu3+ in Lanthanides Doped Multifunctional NaGdF4 Nanocrystals. Adv. Mater. 2010, 22, 3266–3271. [Google Scholar] [CrossRef]
  18. Chen, G.; Liu, S.; Law, W.-C.; Wu, F.; Swihart, M.T.; Ågren, H.; Prasad, P.N. Core/Shell NaGdF4:Nd3þ/NaGdF4 Nanocrystals with Efficient Near-Infrared to Near-Infrared Downconversion Photoluminescence for Bioimaging Applications. ACS Nano 2012, 6, 2969–2977. [Google Scholar] [CrossRef] [Green Version]
  19. Chouryal, Y.N.; Sharma, R.K.; Ivanovskikh, K.V.; Ishchenko, A.V.; Shi, Q.; Ivanov, V.Y.; Nigam, S.; Pandey, A.; Ghosh, P. Temperature dependent quantum cutting in cubic BaGdF5:Eu3+ nanophosphors. New J. Chem. 2020, 45, 1463–1473. [Google Scholar] [CrossRef]
  20. Liu, W.; Sun, Q.; Zou, H.; Zhang, X.; Xiao, X.; Shi, Z.; Song, Y. Ionic liquid/H2O two-phase synthesis and luminescence properties of BaGdF5:RE3+ (RE = Ce/Dy/Eu/Yb/Er) octahedra. New J. Chem. 2020, 45, 742–750. [Google Scholar] [CrossRef]
  21. Sengar, M.; Narula, A.K. Luminescence sensitization of Ln3+ impurity ions in BaGdF5 host matrix: Structural investigation, color tunable luminescence and energy transfer. Opt. Mater. 2020, 110. [Google Scholar] [CrossRef]
  22. Lee, G.; Struebing, C.; Wagner, B.; Summers, C.; Ding, Y.; Bryant, A.; Thadhani, N.; Shedlock, D.; Star-Lack, J.; Kang, Z. Synthesis and characterization of a BaGdF5:Tb glass ceramic as a nanocomposite scintillator for x-ray imaging. Nanotechnology 2016, 27, 205203. [Google Scholar] [CrossRef] [PubMed]
  23. Guan, H.; Sheng, Y.; Song, Y.; Zheng, K.; Xu, C.; Xie, X.; Dai, Y.; Zou, H. White light-emitting, tunable color luminescence, energy transfer and paramagnetic properties of terbium and samarium doped BaGdF5 multifunctional nanomaterials. RSC Adv. 2016, 6, 73160–73169. [Google Scholar] [CrossRef]
  24. Cao, C.-Y.; Xie, A.; Yu, X.-G. Controlled synthesis and optical properties of Ce3+/Tb3+ co-doped BaGdF5 nanocrystals. Rare Met. 2014, 34, 673–678. [Google Scholar] [CrossRef]
  25. Yanes, A.; Del-Castillo, J.; Ortiz, E. Energy transfer and tunable emission in BaGdF5: RE3+ (RE= Ce, Tb, Eu) nano-glass-ceramics. J. Alloy. Compd. 2019, 773, 1099–1107. [Google Scholar] [CrossRef]
  26. Huang, X.; Jiang, L.; Li, X.; He, A. Manipulating upconversion emission of cubic BaGdF5:Ce3+/Er3+/Yb3+ nanocrystals through controlling Ce3+ doping. J. Alloy. Compd. 2017, 721, 374–382. [Google Scholar] [CrossRef]
  27. He, F.; Li, C.; Zhang, X.; Chen, Y.; Deng, X.; Liu, B.; Hou, Z.; Huang, S.; Jin, D.; Lin, J. Optimization of upconversion luminescence of Nd3+-sensitized BaGdF5-based nanostructures and their application in dual-modality imaging and drug delivery. Dalton Trans. 2015, 45, 1708–1716. [Google Scholar] [CrossRef]
  28. Guan, H.; Song, Y.; Zheng, K.; Sheng, Y.; Zou, H. BaGdF5:Dy3+,Tb3+,Eu3+ multifunctional nanospheres: Paramagnetic, luminescence, energy transfer, and tunable color. Phys. Chem. Chem. Phys. 2016, 18, 13861–13873. [Google Scholar] [CrossRef]
  29. Huignard, A.; Buissette, V.; Franville, A.-C.; Gacoin, T.; Boilot, J.-P. Emission Processes in YVO4:Eu Nanoparticles. J. Phys. Chem. B 2003, 107, 6754–6759. [Google Scholar] [CrossRef]
  30. Jorma, H.; Eija, K. Crystal Fields in REOF:Eu3+ (RE=La, Gd and Y). J. Chem. Soc. Faraday Trans. 1995, 91, 1503–1509. [Google Scholar]
  31. King, A.; Singh, R.; Nayak, B.B. Phase and photoluminescence analysis of dual-color emissive Eu3+-doped ZrO2 nanoparticles for advanced security features in anti-counterfeiting. Colloids Surfaces A Physicochem. Eng. Asp. 2021, 631, 127715. [Google Scholar] [CrossRef]
  32. Rezende, M.; Montes, P.J.; Valerio, M.; Jackson, R.A. The optical properties of Eu3+ doped BaAl2O4: A computational and spectroscopic study. Opt. Mater. 2012, 34, 1434–1439. [Google Scholar] [CrossRef]
  33. Teleanu, D.M.; Chircov, C.; Grumezescu, A.M.; Teleanu, R.I. Neuronanomedicine: An Up-to-Date Overview. Pharmaceutics 2019, 11, 101. [Google Scholar] [CrossRef] [PubMed] [Green Version]
  34. Elmenoufy, A.H.; Tang, Y.; Hu, J.; Xu, H.; Yang, X. A novel deep photodynamic therapy modality combined with CT imaging established via X-ray stimulated silica-modified lanthanide scintillating nanoparticles. Chem. Commun. 2015, 51, 12247–12250. [Google Scholar] [CrossRef] [PubMed] [Green Version]
  35. Hsu, C.-C.; Lin, S.-L.; Chang, C.A. Lanthanide-Doped Core–Shell–Shell Nanocomposite for Dual Photodynamic Therapy and Luminescence Imaging by a Single X-ray Excitation Source. ACS Appl. Mater. Interfaces 2018, 10, 7859–7870. [Google Scholar] [CrossRef] [PubMed]
  36. Chen, H.; Wang, G.D.; Chuang, Y.-J.; Zhen, Z.; Chen, X.; Biddinger, P.; Hao, Z.; Liu, F.; Shen, B.; Pan, Z.; et al. Nanoscintillator-Mediated X-ray Inducible Photodynamic Therapy for In Vivo Cancer Treatment. Nano Lett. 2015, 15, 2249–2256. [Google Scholar] [CrossRef] [Green Version]
  37. Gadzhimagomedova, Z.; Polyakov, V.; Pankin, I.; Butova, V.; Kirsanova, D.; Soldatov, M.; Khodakova, D.; Goncharova, A.; Mukhanova, E.; Belanova, A.; et al. BaGdF5 Nanophosphors Doped with Different Concentrations of Eu3+ for Application in X-ray Photodynamic Therapy. Int. J. Mol. Sci. 2021, 22, 13040. [Google Scholar] [CrossRef]
  38. Becerro, A.I.; González-Mancebo, D.; Cantelar, E.; Cussó, F.; Stepien, G.; de la Fuente, J.M.; Ocaña, M. Ligand-Free Synthesis of Tunable Size Ln:BaGdF5 (Ln = Eu3+ and Nd3+) Nanoparticles: Luminescence, Magnetic Properties, and Biocompatibility. Langmuir 2016, 32, 411–420. [Google Scholar] [CrossRef] [Green Version]
  39. Kvítek, L.; Prucek, R.; Panáček, A.; Novotný, R.; Hrbáč, J.; Zbořil, R. The influence of complexing agent concentration on particle size in the process of SERS active silver colloid synthesis. J. Mater. Chem. 2005, 15, 1099–1105. [Google Scholar] [CrossRef]
  40. Guo, X.; Yan, H.; Zhao, S.; Li, Z.; Li, Y.; Liang, X. Effect of calcining temperature on particle size of hydroxyapatite synthesized by solid-state reaction at room temperature. Adv. Powder Technol. 2013, 24, 1034–1038. [Google Scholar] [CrossRef]
  41. Shi, A.-M.; Li, D.; Wang, L.-J.; Li, B.-Z.; Adhikari, B. Preparation of starch-based nanoparticles through high-pressure homogenization and miniemulsion cross-linking: Influence of various process parameters on particle size and stability. Carbohydr. Polym. 2011, 83, 1604–1610. [Google Scholar] [CrossRef]
  42. Niederberger, M.; Pinna, N. Metal Oxide Nanoparticles in Organic Solvents Synthesis, Formation, Assembly and Application; Springer: London, UK, 2009. [Google Scholar]
  43. Lai, J.; Niu, W.; Luque, R.; Xu, G. Solvothermal synthesis of metal nanocrystals and their applications. Nano Today 2015, 10, 240–267. [Google Scholar] [CrossRef]
  44. Wang, H.; Xie, C.; Zeng, D. Controlled growth of ZnO by adding H2O. J. Cryst. Growth 2005, 277, 372–377. [Google Scholar] [CrossRef]
  45. Lian, J.; Liang, Y.; Kwong, F.-L.; Ding, Z.; Ng, D.H. Template-free solvothermal synthesis of ZnO nanoparticles with controllable size and their size-dependent optical properties. Mater. Lett. 2012, 66, 318–320. [Google Scholar] [CrossRef]
  46. Kirsanova, D.Y.; Butova, V.V.; Polyakov, V.A.; Zolotukhin, P.V.; Belanova, A.A.; Legostaev, V.M.; Kuchma, E.A.; Gadzhimagomedova, Z.M.; Soldatov, A.V. X-Ray nanophosphors based on BaGdF5 for x-ray photodynamic therapy in oncology. Nanotechnologies Russ. 2020, 15, 105–111. [Google Scholar] [CrossRef]
  47. Petříček, V.; Dušek, M.; Palatinus, L. Crystallographic Computing System JANA2006: General features. Z. Für Krist.-Cryst. Mater. 2014, 229, 345–352. [Google Scholar] [CrossRef]
  48. Gates-Rector, S.; Blanton, T. The Powder Diffraction File: A quality materials characterization database. Powder Diffr. 2019, 34, 352–360. [Google Scholar] [CrossRef] [Green Version]
  49. Shannon, R.D. Revised Effective Ionic Radii and Systematic Studies of Interatomie Distances in Halides and Chaleogenides. Acta Cryst. 1976, 32, 751–767. [Google Scholar] [CrossRef]
  50. Rueden, C.T.; Schindelin, J.; Hiner, M.C.; Dezonia, B.E.; Walter, A.E.; Arena, E.T.; Eliceiri, K.W. ImageJ2: ImageJ for the next generation of scientific image data. BMC Bioinform. 2017, 18, 529. [Google Scholar] [CrossRef] [Green Version]
  51. Yang, D.; Kang, X.; Shang, M.; Li, G.; Peng, C.; Li, C.; Lin, J. Size and shape controllable synthesis and luminescent properties of BaGdF5:Ce3+/Ln3+ (Ln = Sm, Dy, Eu, Tb) nano/submicrocrystals by a facile hydrothermal process. Nanoscale 2011, 3, 2589–2595. [Google Scholar] [CrossRef] [PubMed]
  52. Xu, S.; Li, P.; Wang, Z.; Li, T.; Bai, Q.; Sun, J.; Yang, Z. Luminescence and energy transfer of Eu2+/Tb3+/Eu3+ in LiBaBO3 phosphors with tunable-color emission. J. Mater. Chem. C 2015, 3, 9112–9121. [Google Scholar] [CrossRef]
  53. Lee, T.; Luo, L.-Y.; Diau, E.W.-G.; Chen, T.-M.; Cheng, B.M.; Tung, C.-Y. Visible quantum cutting through downconversion in green-emitting K2GdF5:Tb3+ phosphors. Appl. Phys. Lett. 2006, 89, 131121. [Google Scholar] [CrossRef] [Green Version]
  54. Cheng, S.D.; Kam, C.H.; Buddhudu, S. Enhancement of green emission from Tb3+:GdOBr phosphors with Ce3+ ion co-doping. Mater. Res. Bull. 2001, 31, 1131–1137. [Google Scholar] [CrossRef]
  55. Luo, Y.-R. Comprehensive Handbook of Chemical Bond Energies; CRC Press: Boca Raton, FL, USA, 2007. [Google Scholar]
  56. Zhao, Q.; Lü, W.; Guo, N.; Jia, Y.; Lv, W.; Shao, B.; Jiao, M.; You, H. Inorganic-salt-induced morphological transformation and luminescent performance of GdF3 nanostructures. Dalton Trans. 2013, 42, 6902–6908. [Google Scholar] [CrossRef]
  57. Bohne, D.; Fischer, S.; Obermeier, E. Thermal, Conductivity, Density, Viscosity, and Prandtl-Numbers of Ethylene Glycol-Water Mixtures. Ber. Der Bunsenges. Für Phys. Chem. 1984, 88, 739–742. [Google Scholar] [CrossRef]
  58. Wojnarowicz, J.; Opalińska, A.; Chudoba, T.; Gierlotka, S.; Mukhovskyi, R.; Pietrzykowska, E.; Sobczak, K.; Lojkowski, W. Effect of Water Content in Ethylene Glycol Solvent on the Size of ZnO Nanoparticles Prepared Using Microwave Solvothermal Synthesis. J. Nanomater. 2016, 2016, 2789871. [Google Scholar] [CrossRef]
Figure 1. XRD patterns of the BaGdF5: x%Tb3+ samples synthesized by the MW method (where x reported the legend).
Materials 15 08559 g001
Figure 2. Correlation between the actual percentage of doping Tb3+ ions and the refined lattice parameter.
Materials 15 08559 g002
Figure 3. TEM images of (a) 5Tb MW, (b) 10Tb MW, (c) 25Tb MW, and (d) 50Tb MW; Particle size distribution of (e) 5Tb MW, (f) 10Tb MW, (g) 25Tb MW, and (h) 50Tb MW according to the TEM analysis.
Materials 15 08559 g003
Figure 4. (a) X-ray-excited (U = 35 kV, I = 1.6 mA) optical luminescence spectra measured for x% of Tb3+; (b) schematic energy-level diagram showing the processes occurring in BaGdF5:Tb3+.
Materials 15 08559 g004
Figure 5. XRD patterns of the BaGdF5: 25%Tb3+ prepared with (a) ST and (b) MW synthesis. The impurities of the GdF3 phase marked with pink circles.
Materials 15 08559 g005
Figure 6. (a) Particle size distribution and <D> with the mean size ± standard deviation; (b) TEM images of 25Tb MW at 100 °C, 150 °C, and 200 °C.
Materials 15 08559 g006
Figure 7. (a) Particle size distribution and <D> with the mean size ± standard deviation; (b) TEM images of 25Tb MW with different contents of EG 0, 10, 25, and 50%.
Materials 15 08559 g007
Figure 8. (a) Particle size distribution and <D> with the mean size ± standard deviation; (b) TEM images of 25Tb ST at room temperature, 100 °C, and 200 °C.
Materials 15 08559 g008
Figure 9. (a) Particle size distribution and <D> with the mean size ± standard deviation; (b) TEM images of 25Tb ST with different contents of EG 0, 10, 25, and 50%.
Materials 15 08559 g009
Table 1. Amount of precursors used in the synthesis process.
SampleBaCl2 ∙ 2H2OGdCl3TbCl3 ∙ 6H2ONH4F
mgmmolmgmmolmgmmolmgmmol
5Tb MW244.31250.40.9513.30.05203.75.5
10Tb MW210.90.926.50.1
25Tb MW197.70.7566.30.25
50Tb MW131.80.5132.60.5
Table 2. The synthesis conditions.
Type of SynthesisSample% EGTemperature, °C
Microwave (MW)25Tb MW 100EG 200T100200
25Tb MW 50EG50
25Tb MW 25EG25
25Tb MW 10EG10
25Tb MW 0EG0
25Tb MW 100EG 150T100150
25Tb MW 100EG 100T100100
Solvothermal (ST)25Tb ST 100EG 200T100200
25Tb ST 50EG50
25Tb ST 25EG25
25Tb ST 10EG10
25Tb ST 0EG0
25Tb ST 100EG 100T100100
25Tb ST 100EG RT100RT
Table 3. Cell parameters of the BaGdF5: x%Tb3+ samples calculated from the full profile analysis in the Jana2006 software and crystal size calculated using the Scherrer equation.
SampleExpected Tb Content, at. %Actual Tb Content, at. %Cell Parameters. ÅCell Volume. Å3Goodness of Fit (GOF)R-FactorCrystal Size. nm
5Tb MW0.710.455.9310(12)208.64(7)1.030.12828.53
10Tb MW1.431.375.9279(14)208.30(8)1.120.11208.87
25Tb MW3.573.785.9201(16)207.49(3)1.040.15467.67
50Tb MW7.146.915.9034(9)205.73(5)0.990.114110.25
Publisher’s Note: MDPI stays neutral with regard to jurisdictional claims in published maps and institutional affiliations.