
Structural Characteristics and Microstructure Analysis of Soft Soil Stabilised with Fine Ground Tile Waste
 , ,
, ,
Abstract
:1. Introduction
2. Materials and Methods
2.1. Materials
2.1.1. Soil
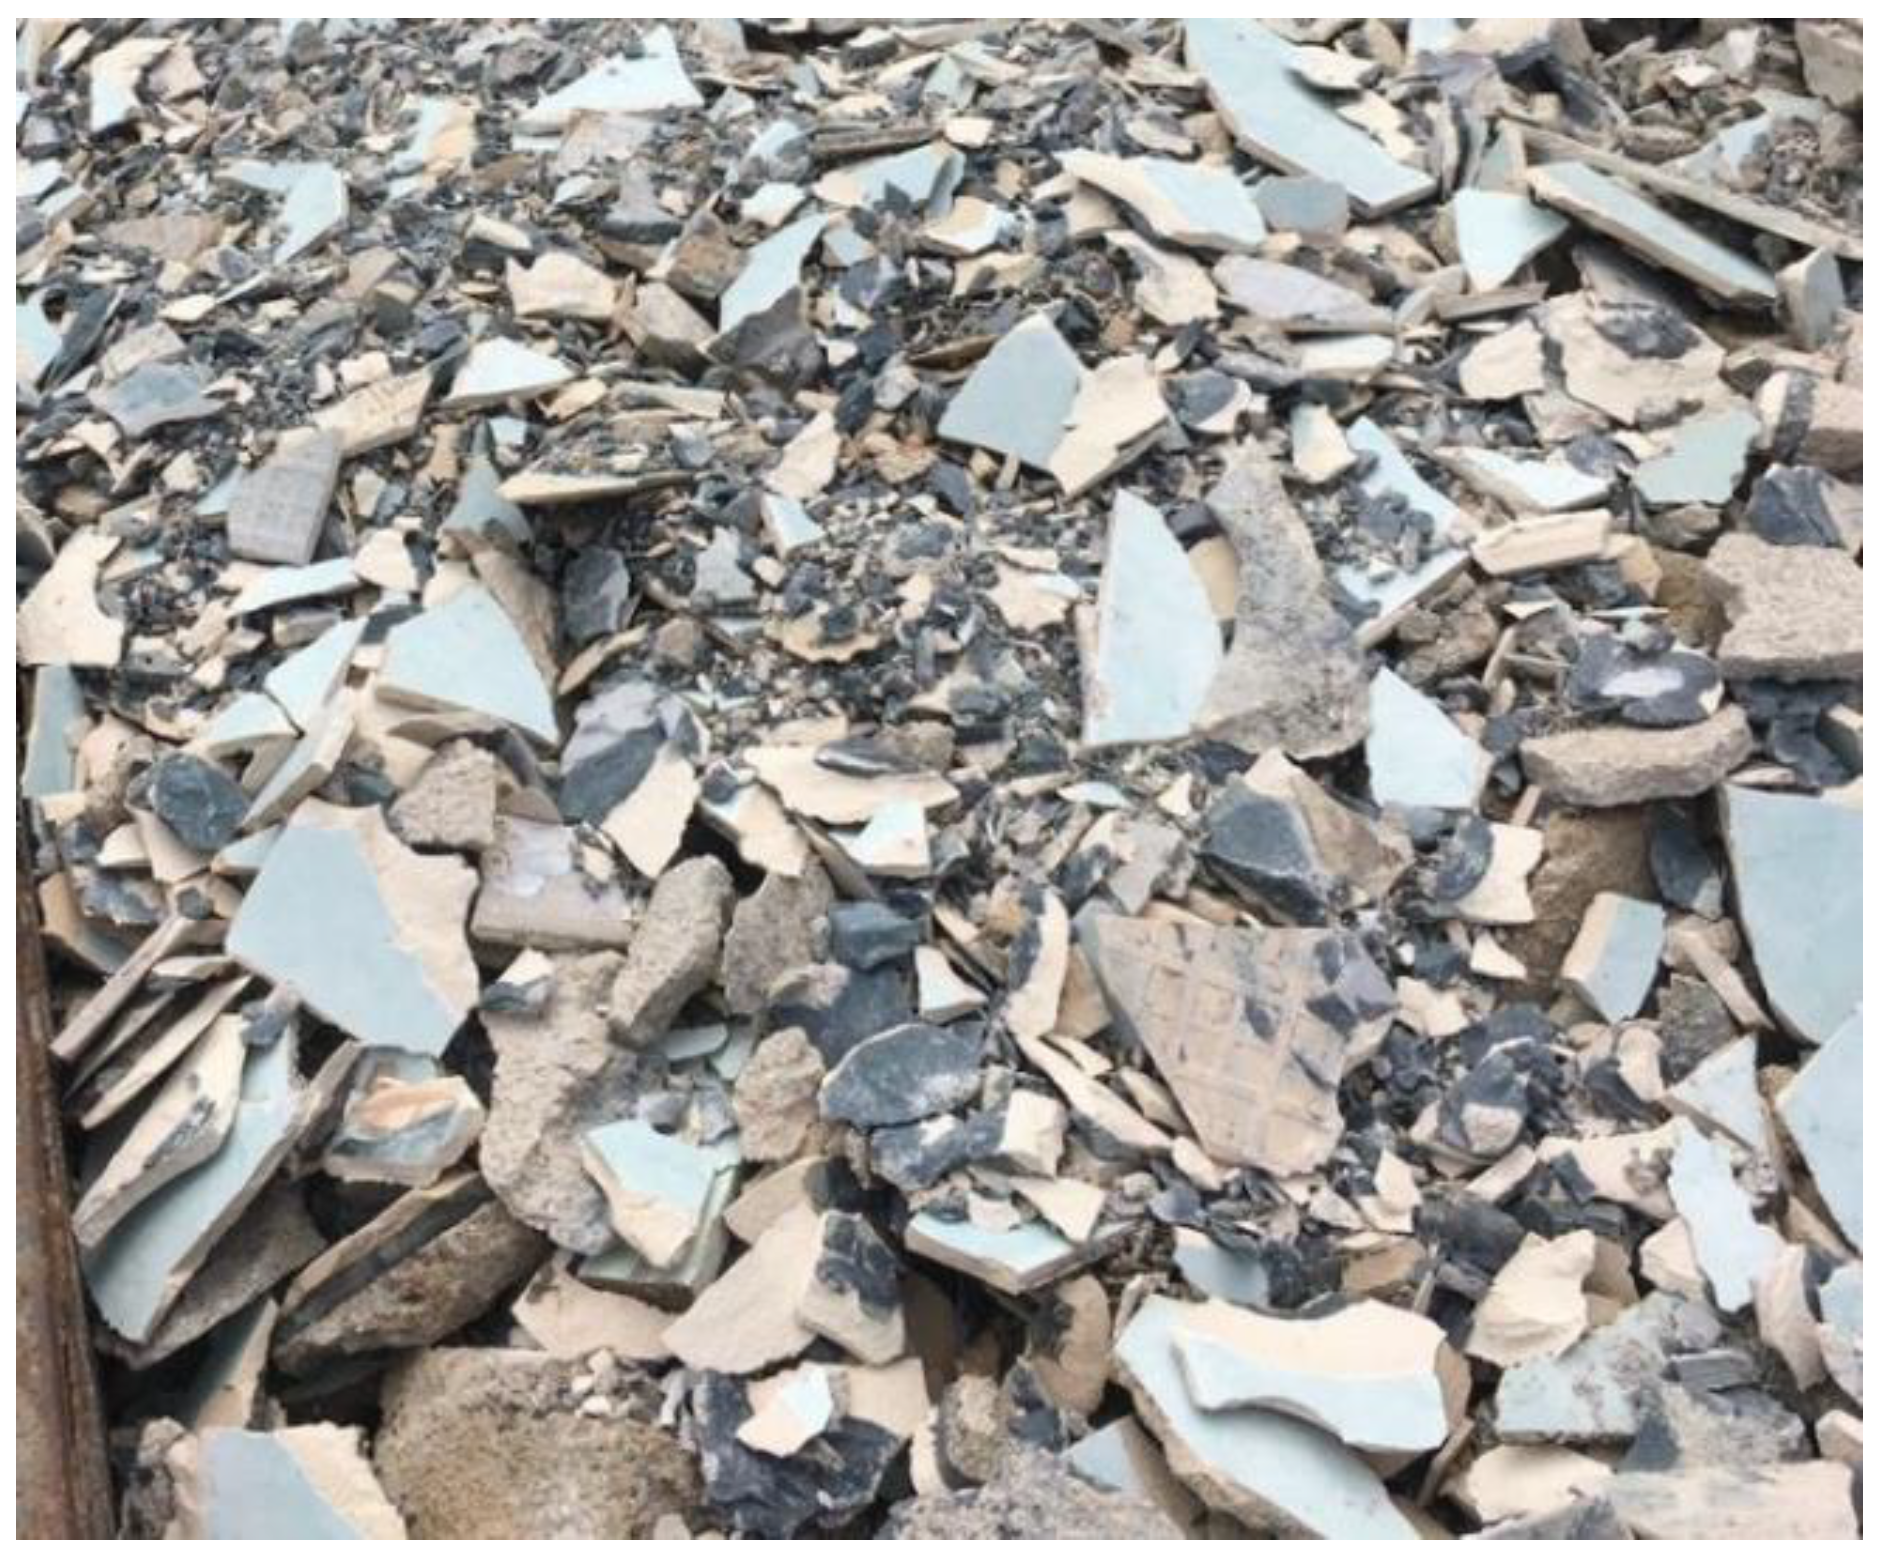
2.1.2. Tile Waste
2.2. Laboratory Works and Testing
2.2.1. Sample Preparation
2.2.2. Atterberg Limits Test
2.2.3. Compaction Test
2.2.4. Unconfined Compression Test
2.2.5. Indirect Tensile Strength Test
2.2.6. Flexural Strength Test
2.2.7. Microstructure and Mineralogy Analysis
3. Results
3.1. Plasticity
3.2. Compaction Test
3.3. Effect on the Unconfined Compression Strength (UCS)
3.4. Effect on the Indirect Tensile Strength Test (ITS)
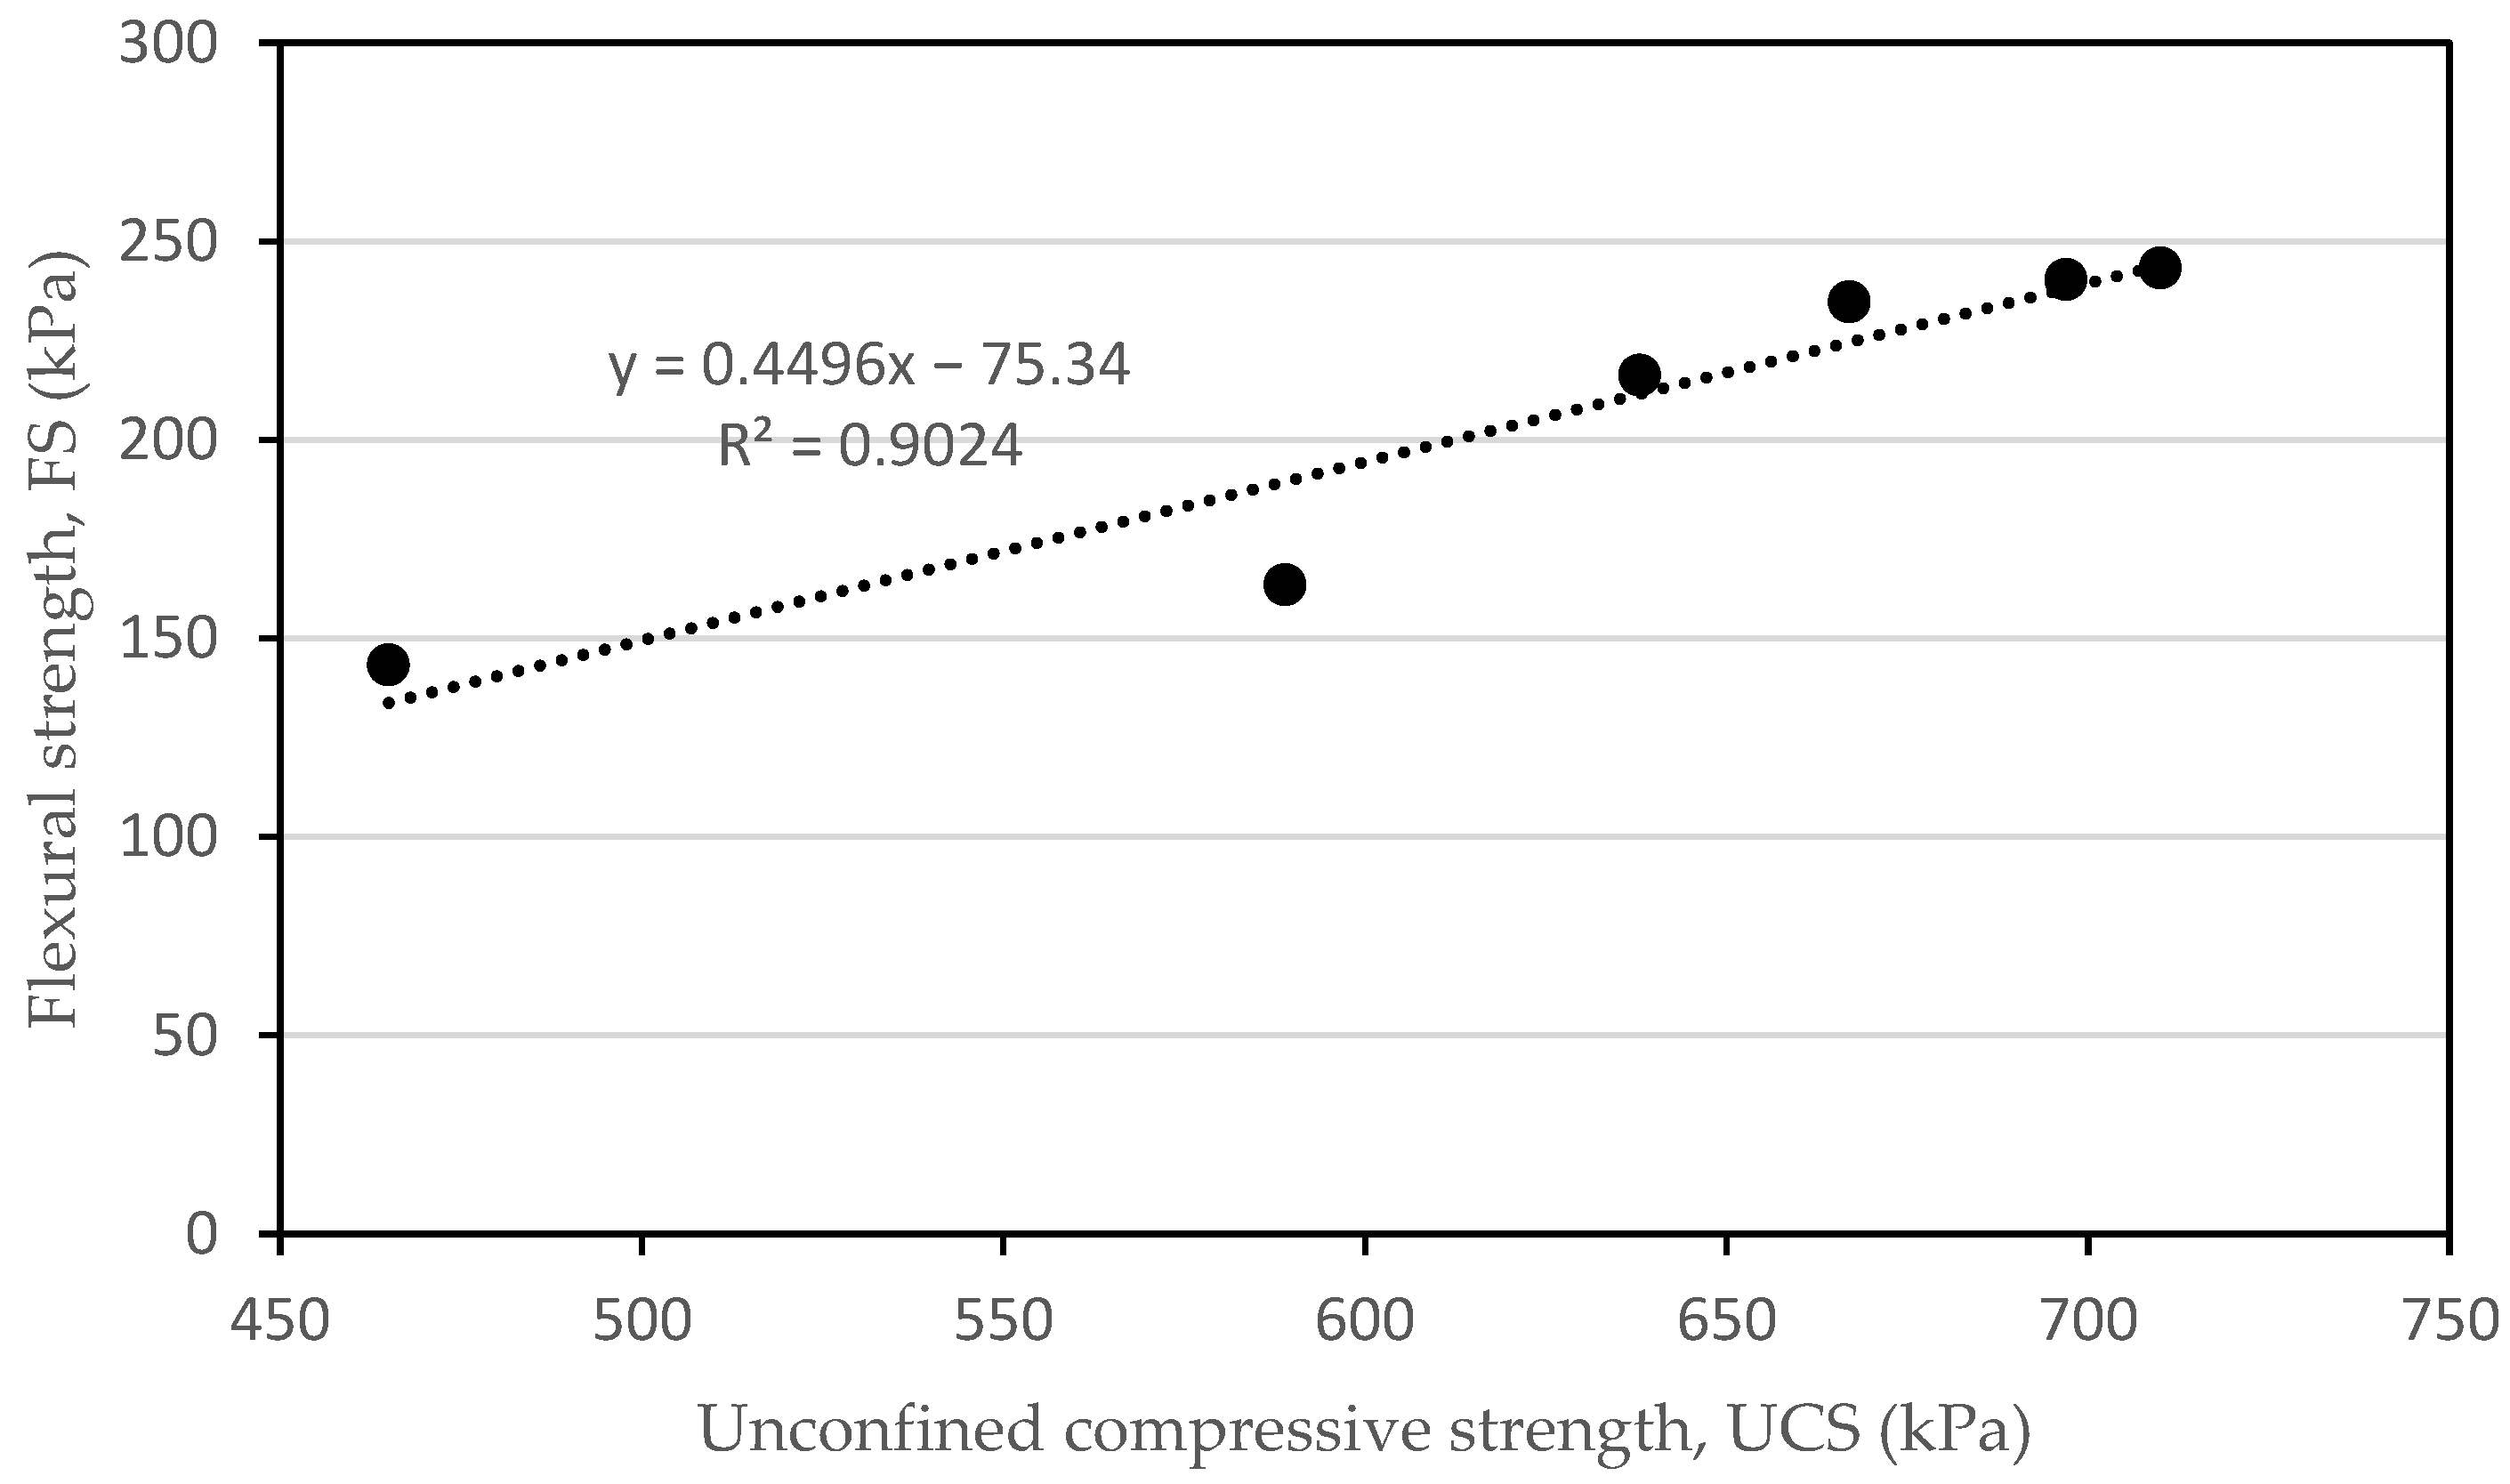
3.5. Effect on the Flexural Strength Test (FS)
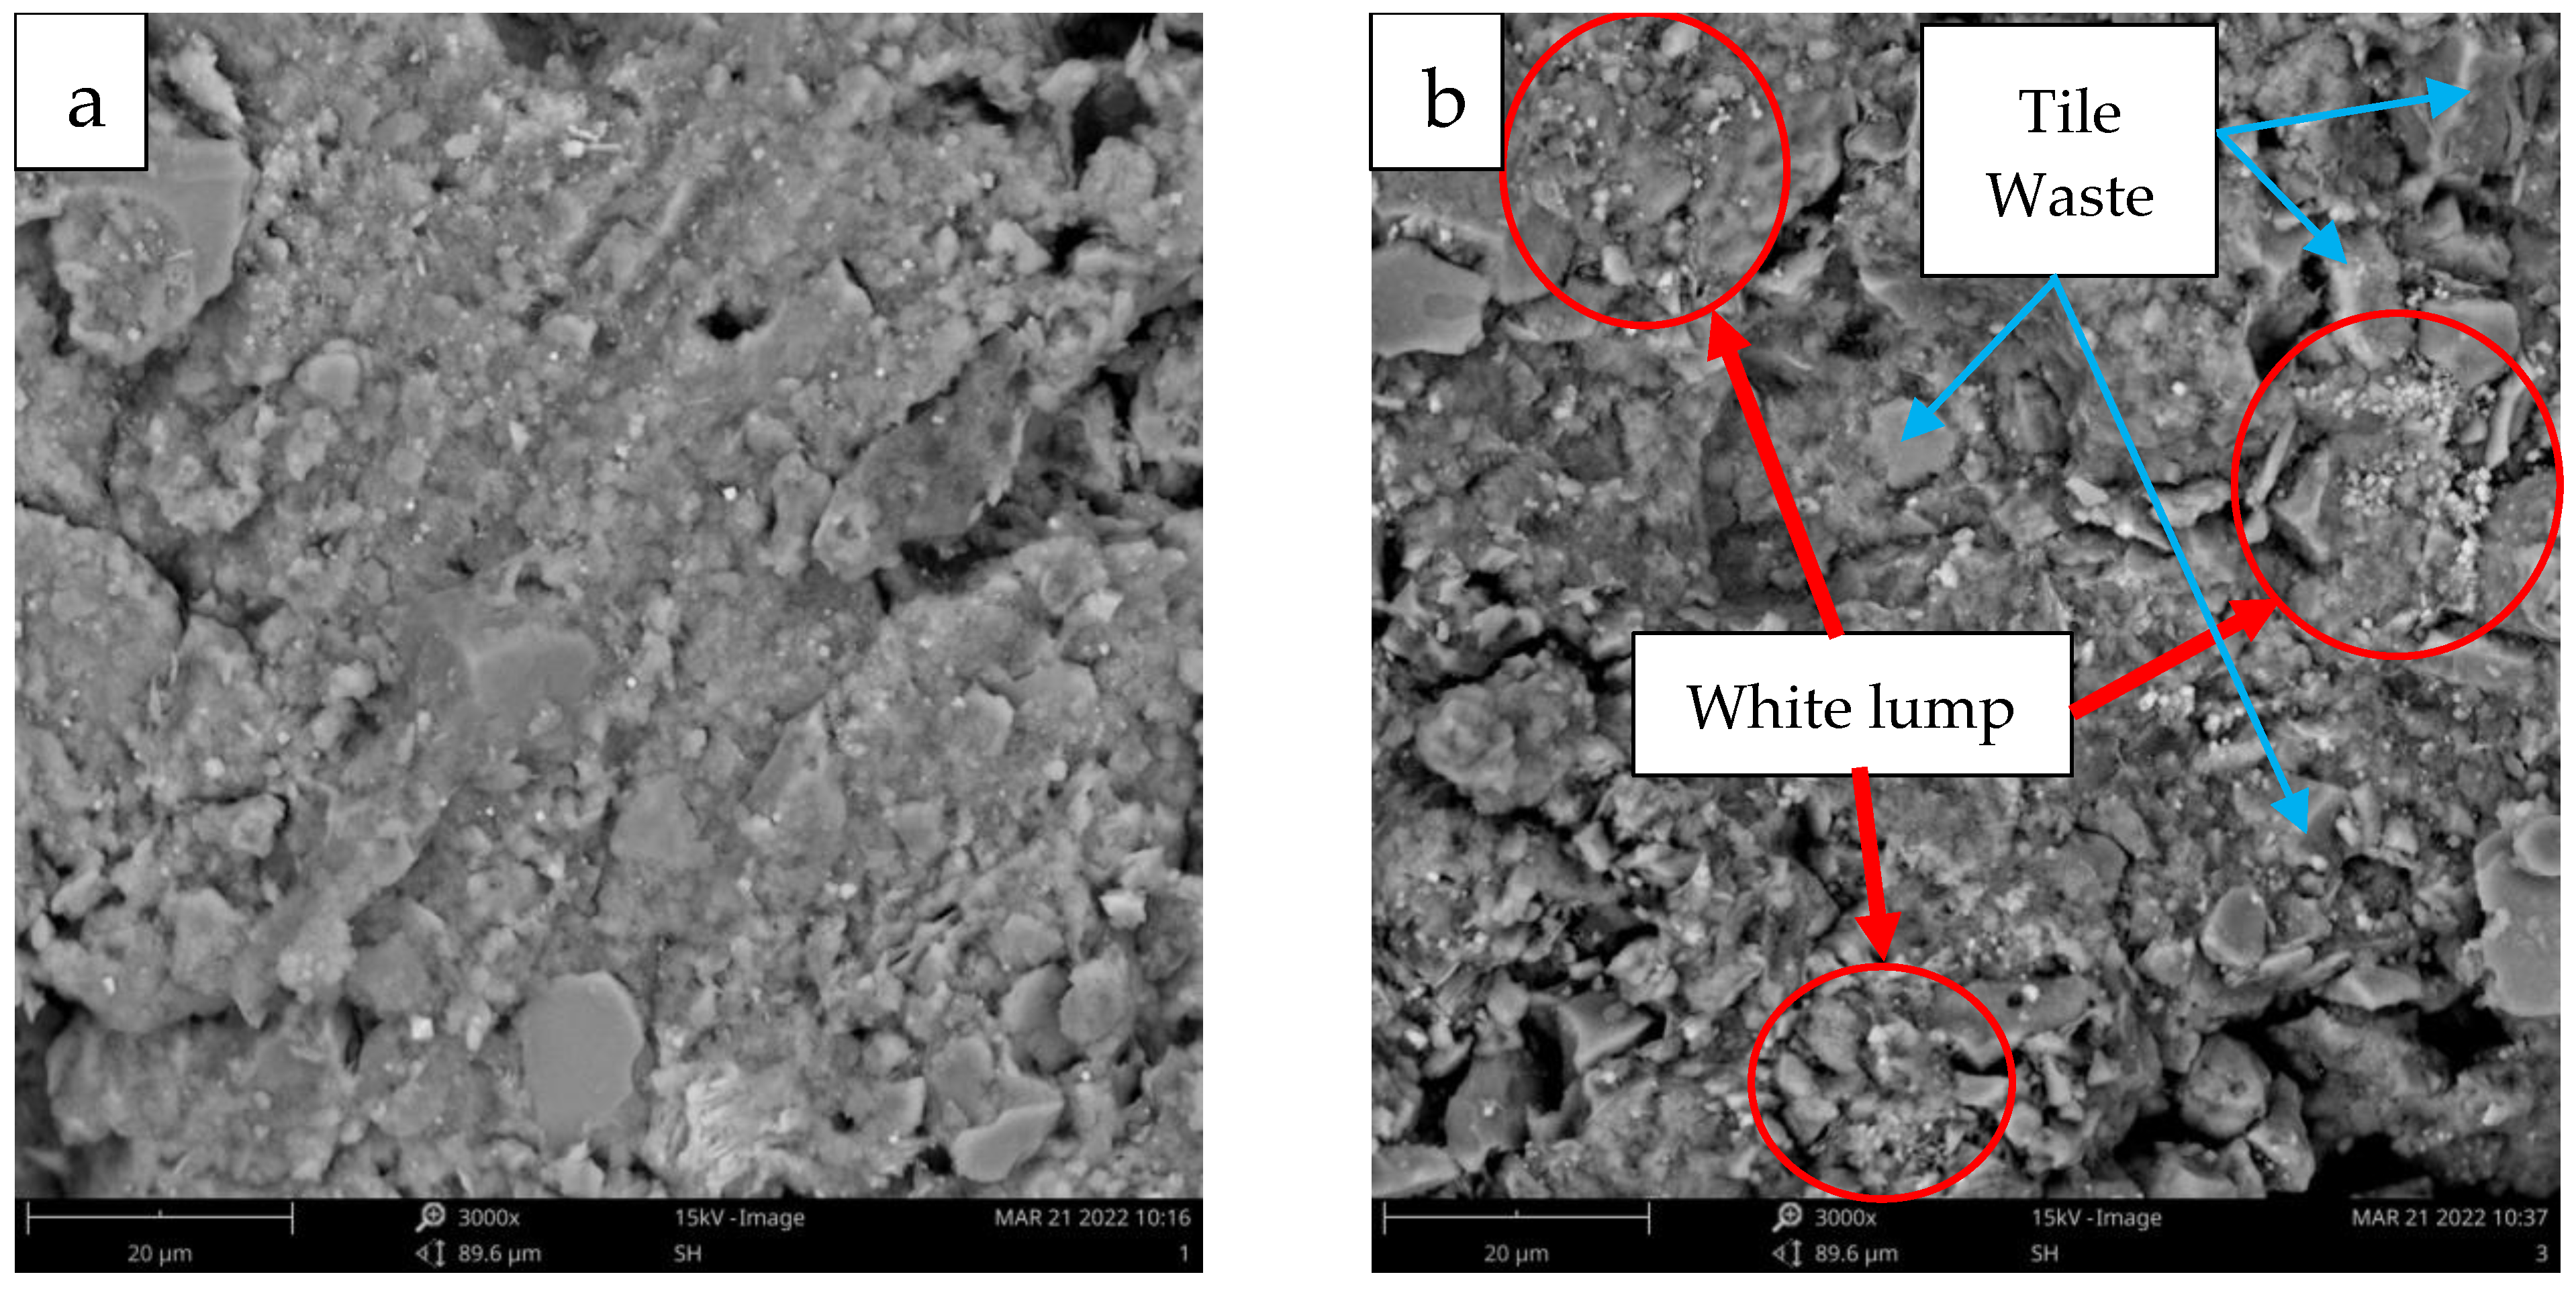
3.6. Effect on Microstructures
3.7. Effect on Mineralogy
4. Conclusions
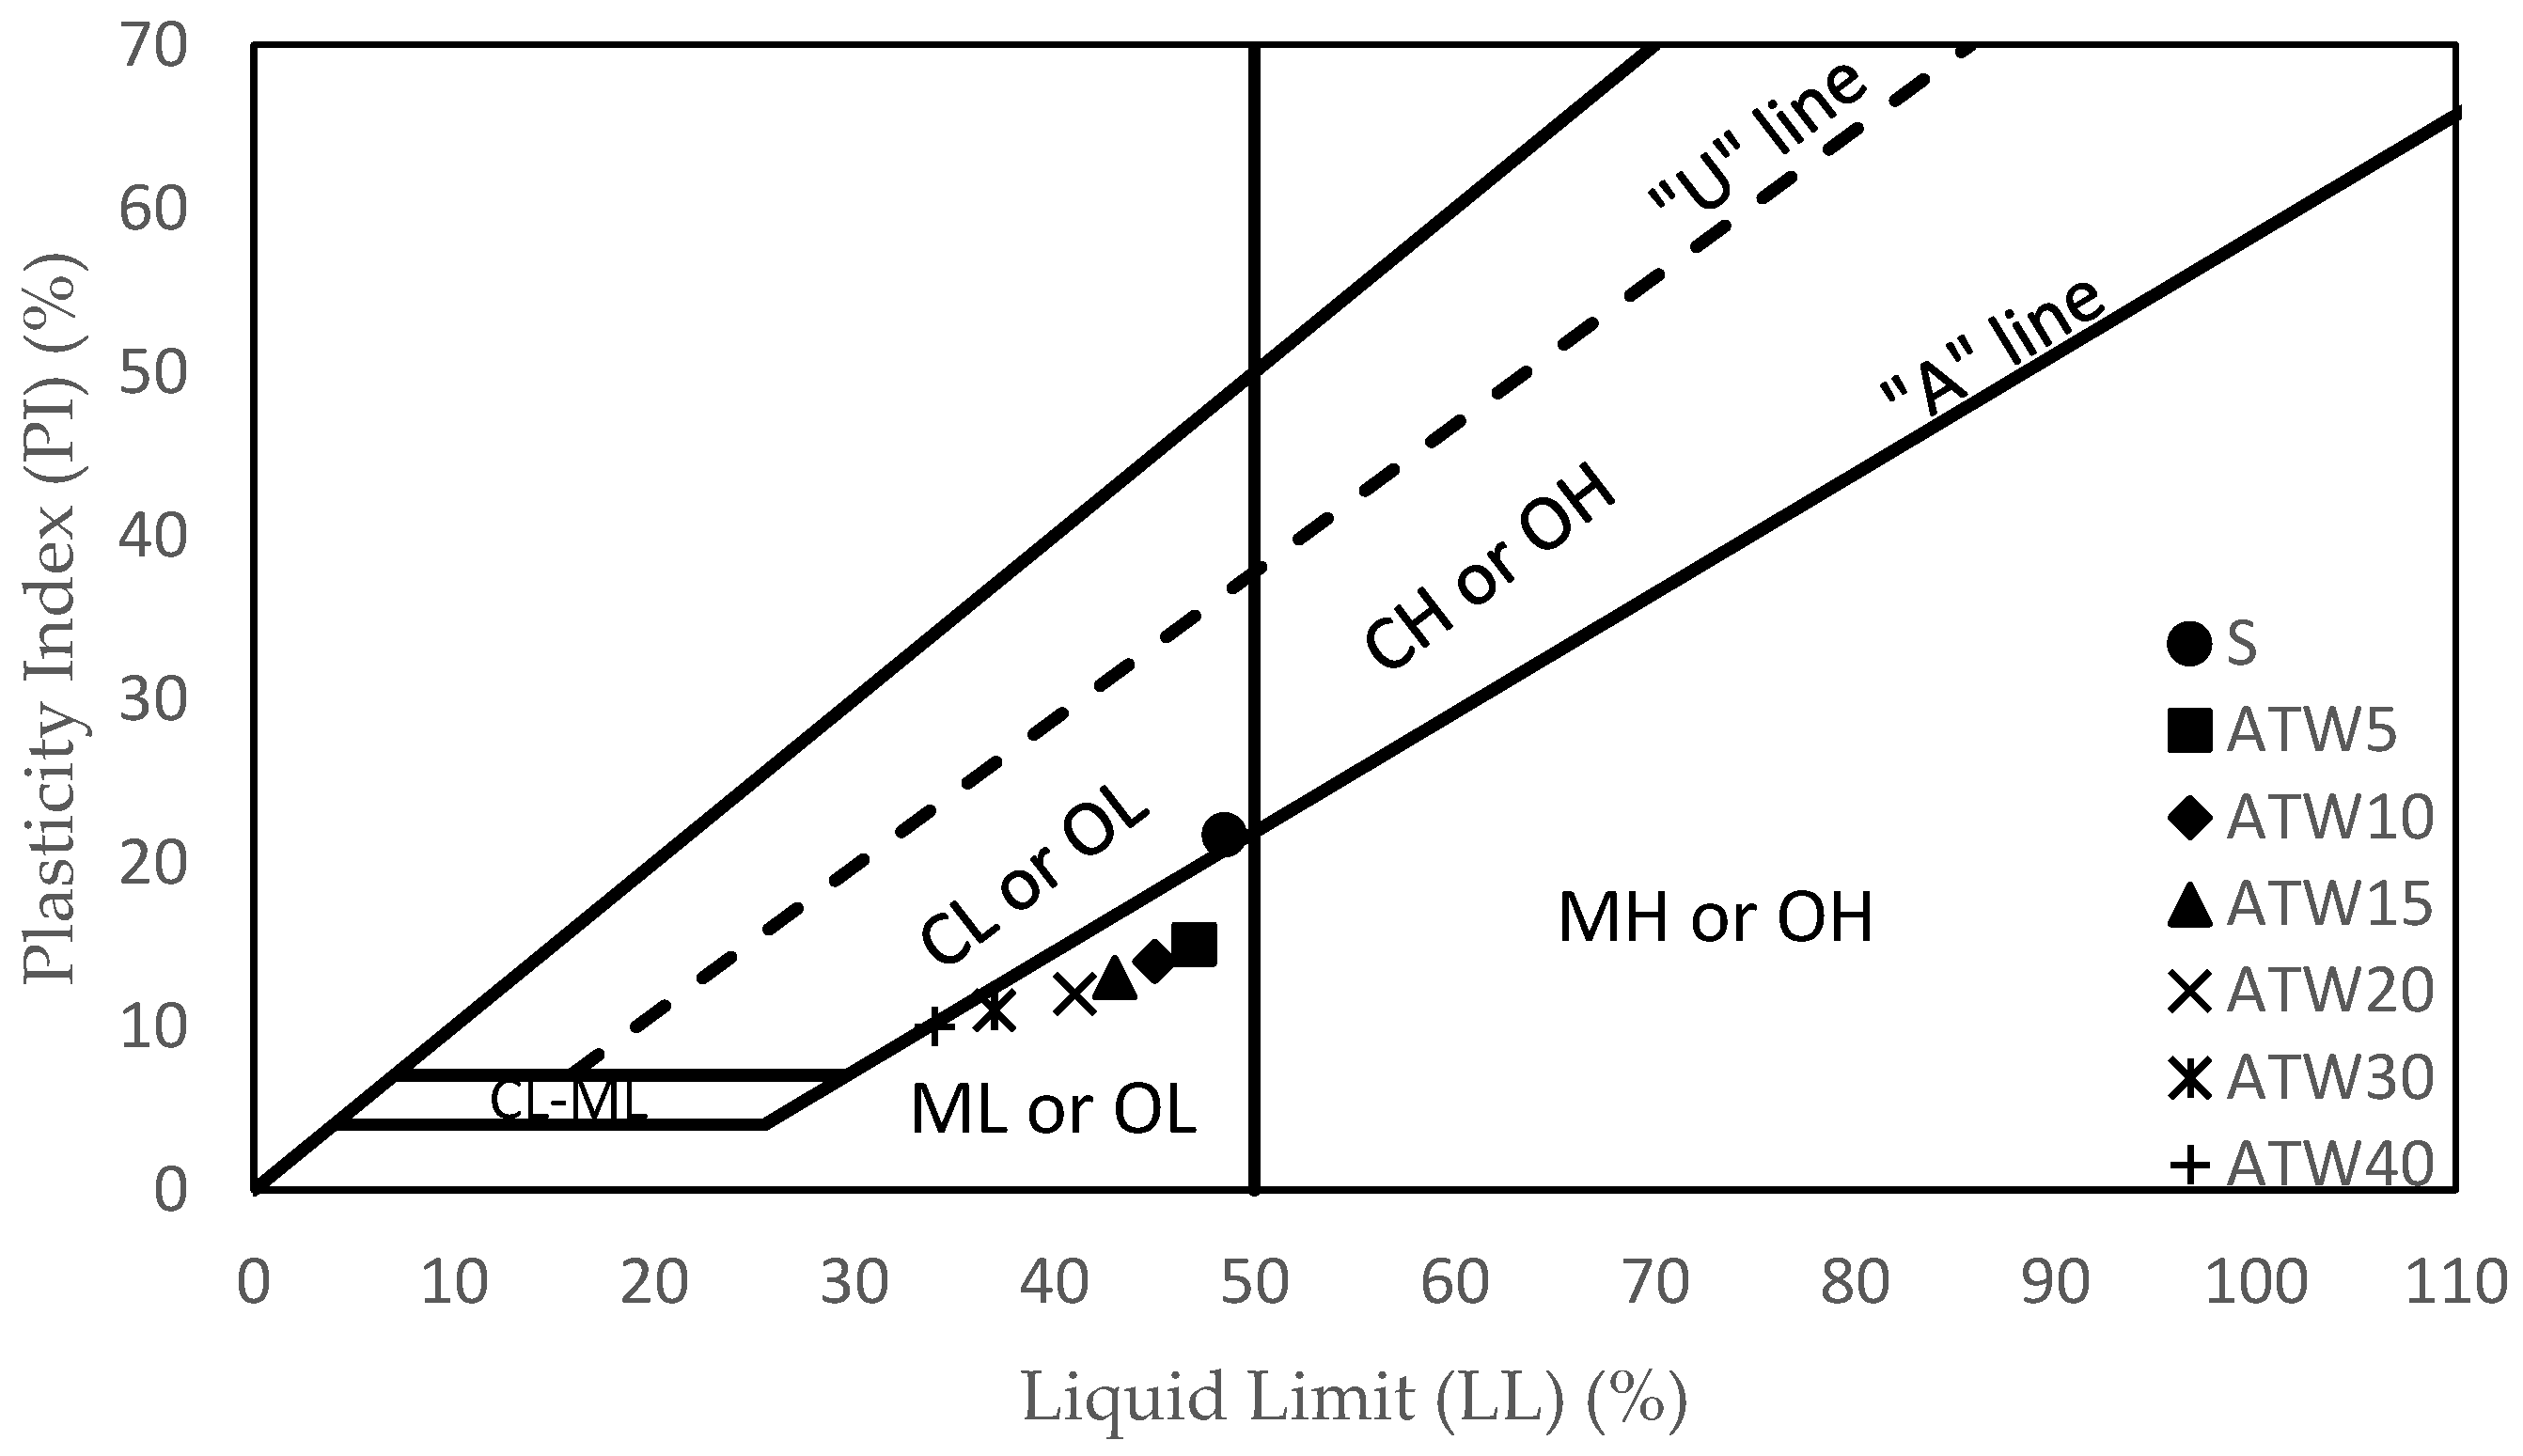
- The changes in the liquid limits, plastic limits, and plasticity index were due to the addition of tile waste to the soil. The results revealed that as the percentage of tile waste increased, the liquid limit and plasticity index decreased. Adding 5% of the tile waste to the original soil was found to increase the plasticity limit. However, the plasticity limit value was decreased by incrementing 10% tile waste content until 40% tile waste content was added. The plastic limit values indicated an improvement in soil stability as they increased. The presence of tile waste reduced the water content required for the soil to transition from plastic to a semi-solid state. As supported by previous studies, the decrease in the plasticity index was attributed to clay particle agglomeration induced by the tile waste addition. Referring to the USCS chart, the soil group changed from CL to ML with the presence of tile waste in the soil sample.
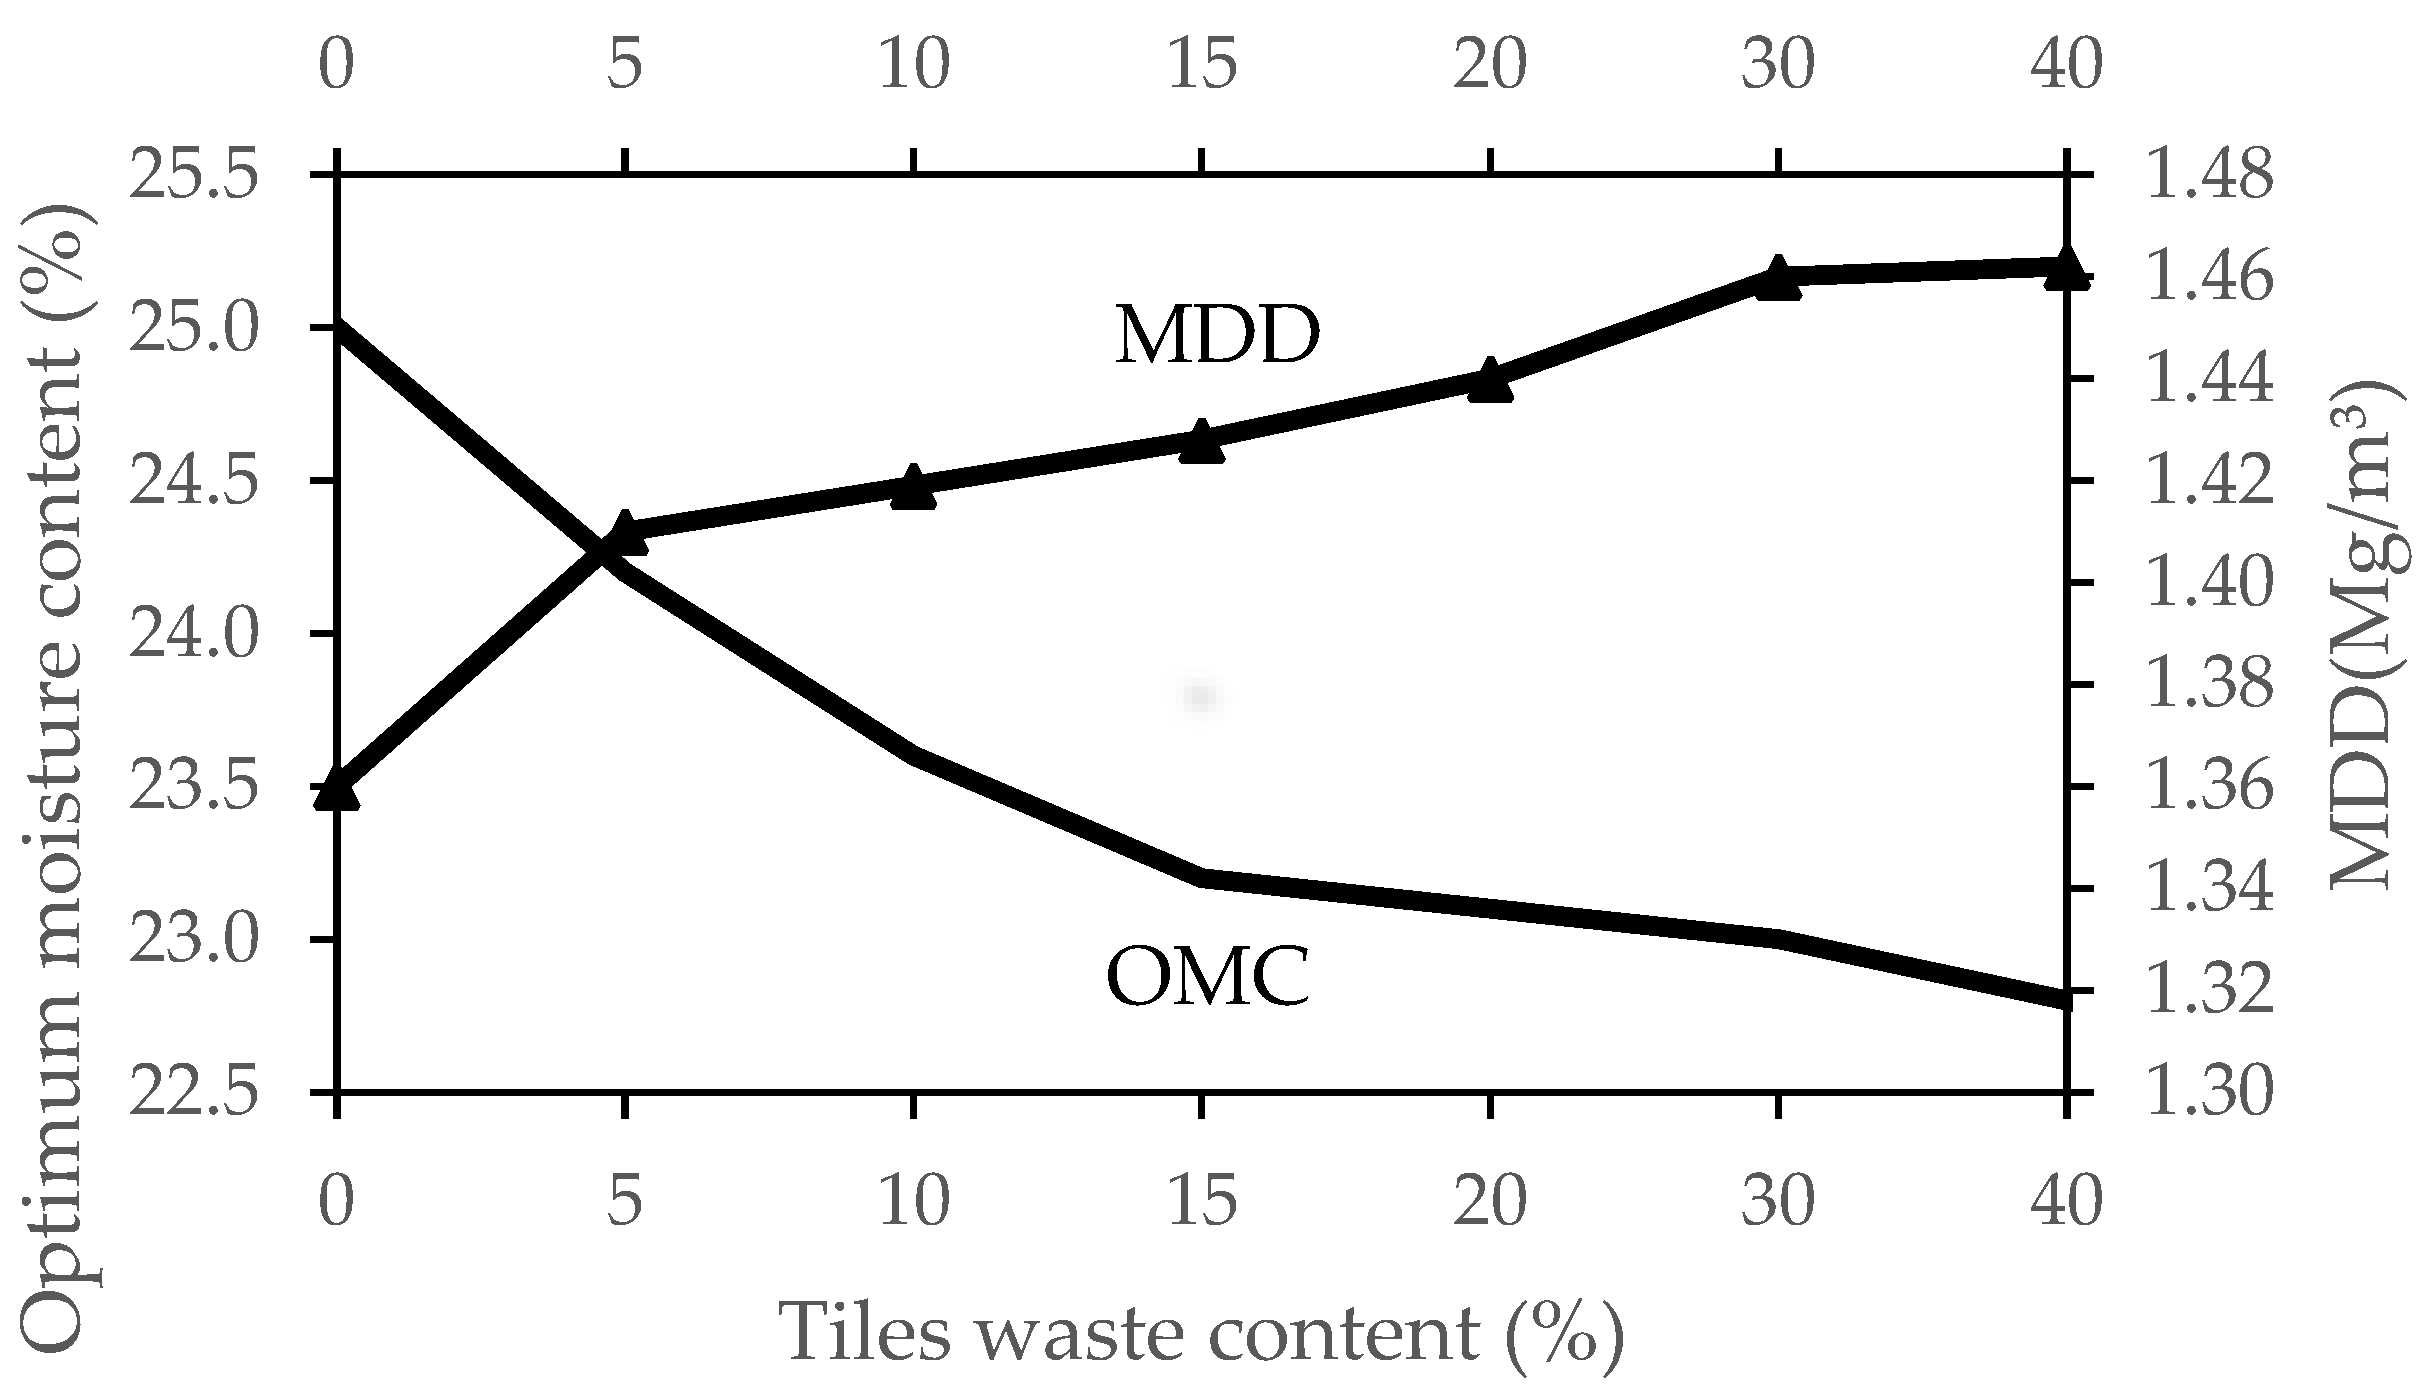
- With the addition of tile waste, the water-holding capacity inside the stabilised soil particles decreased, resulting in a decrement in OMC, with a significant decrement occurring in between 0% and 15% of the tile waste content. This trend continued until the 40% tile waste addition. Conversely, the increment in the tile waste percentage led to increasing MDD, indicating an increment in the sample density. The combination of tile waste grains with higher specific gravity and soil grains with lower specific gravity contributed to the higher MDD values. A uniform gradation of particles in the soil was created with tile waste in the mixture. This will decrease the void ratio and make the soil more compact.
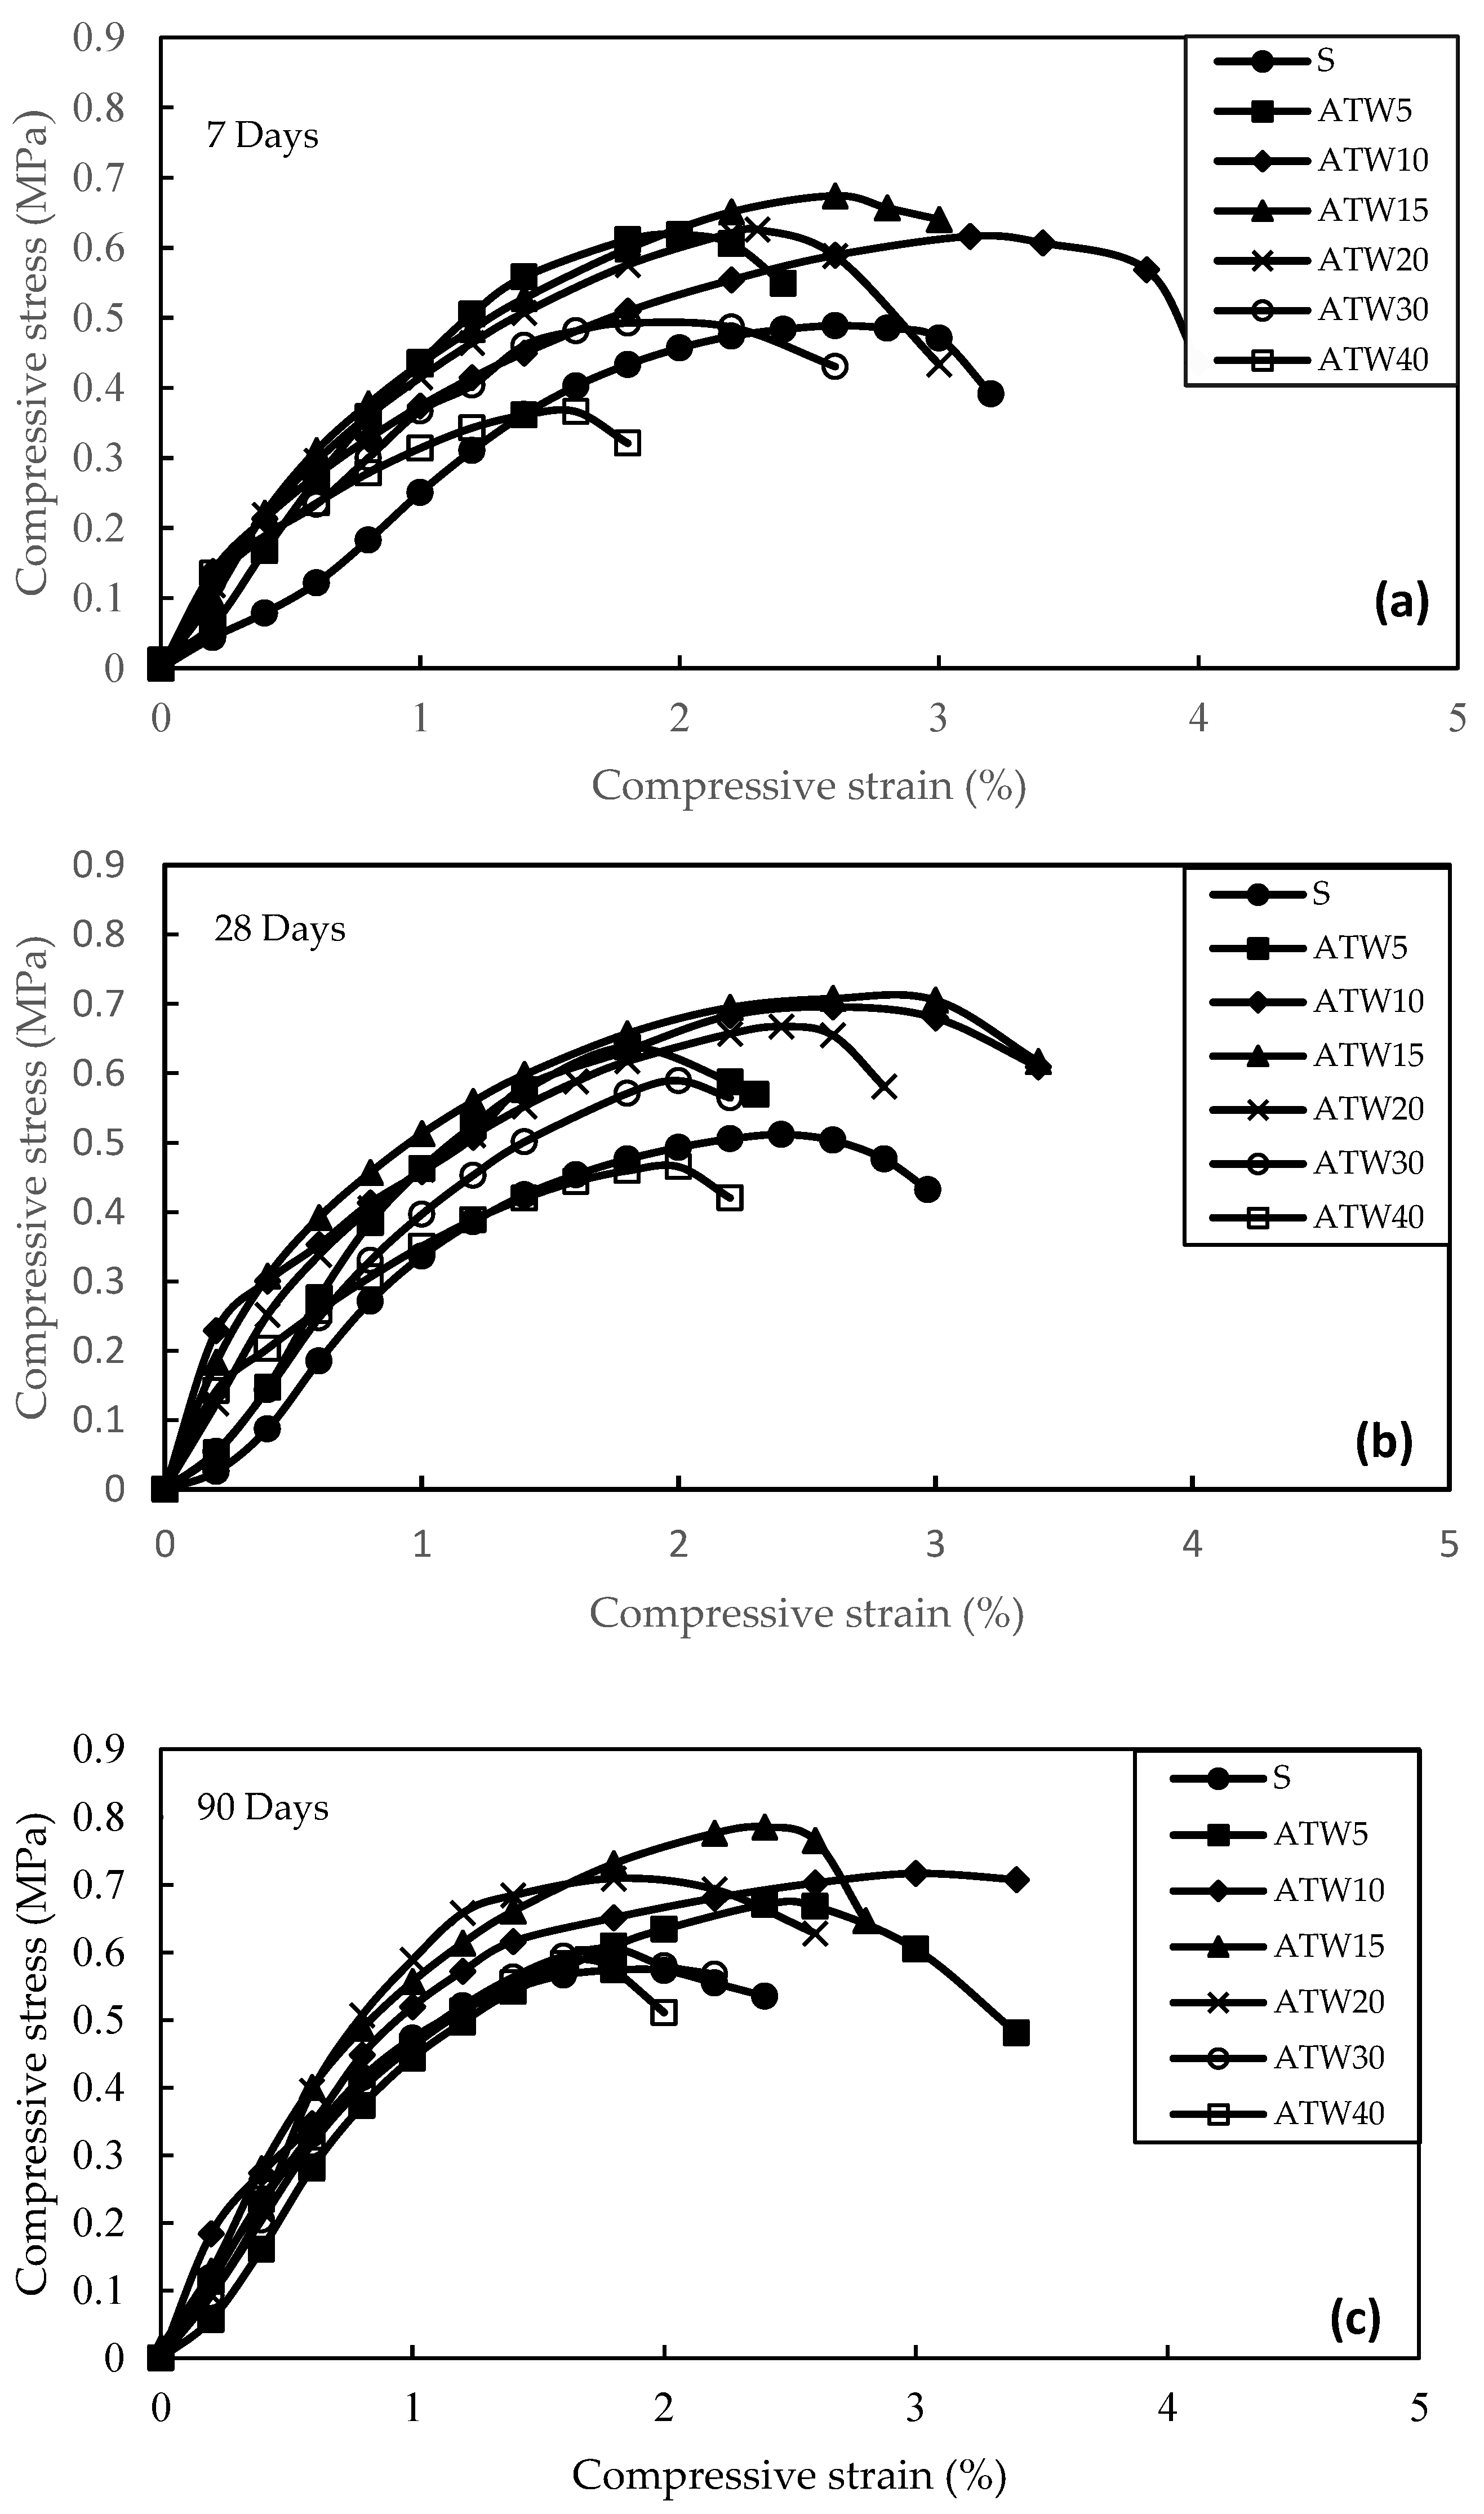
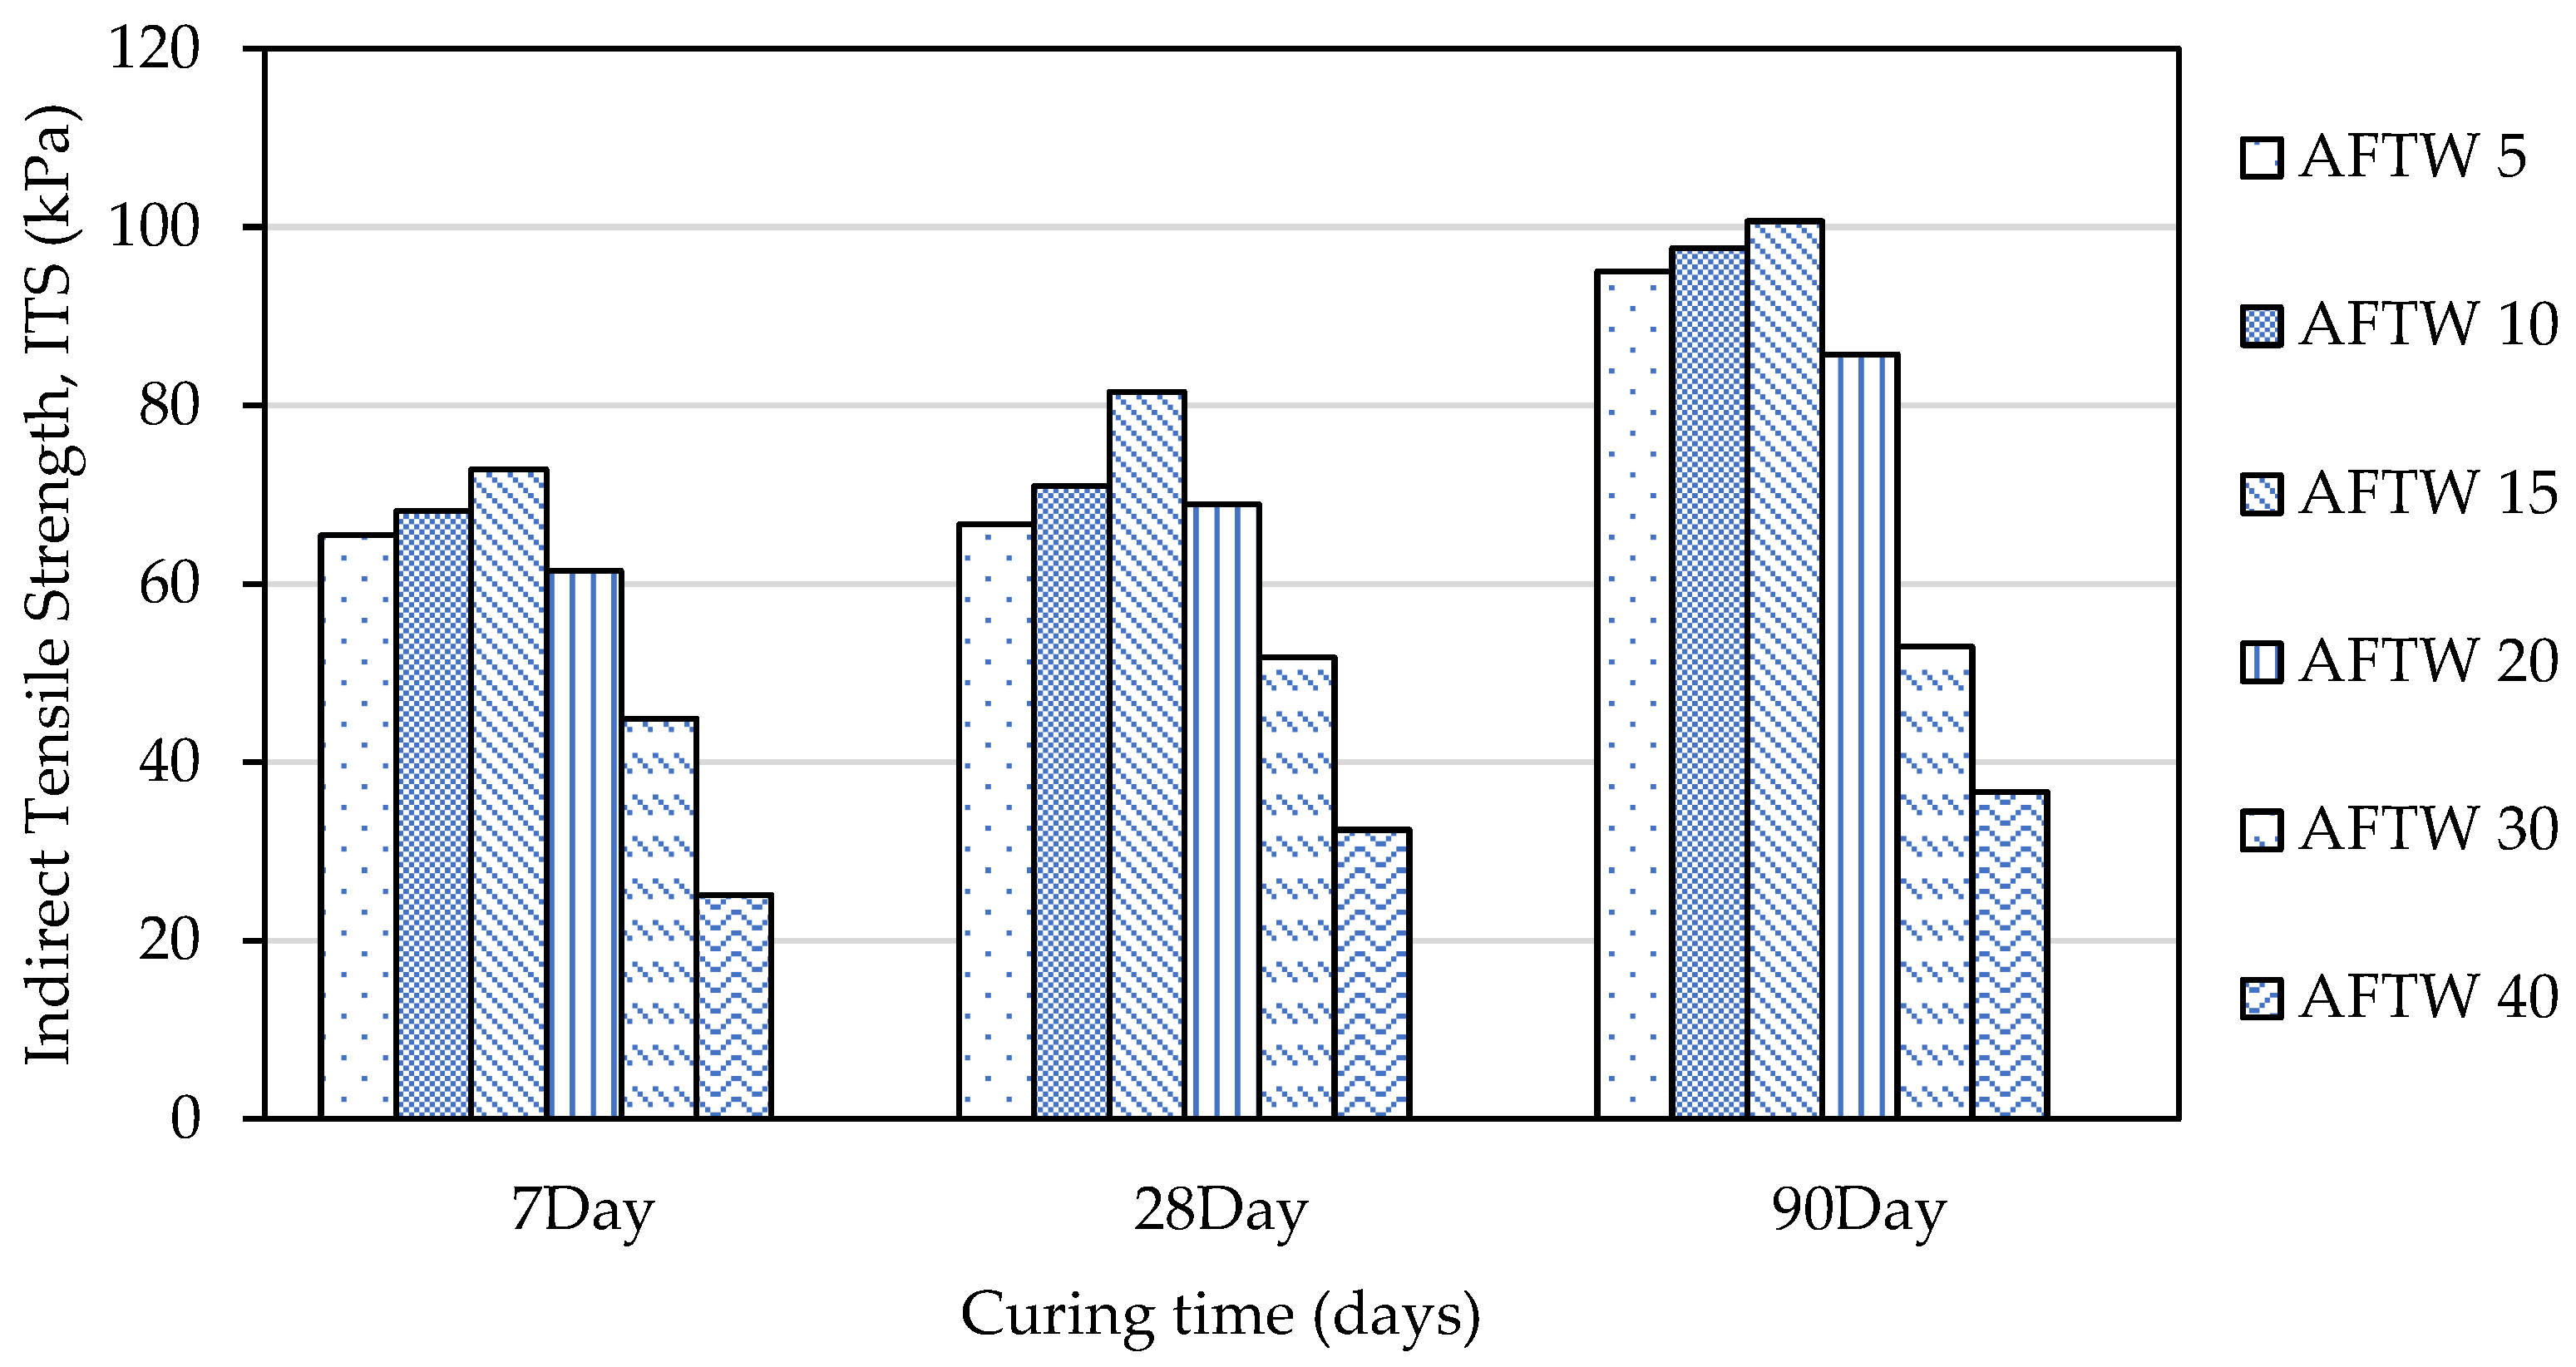
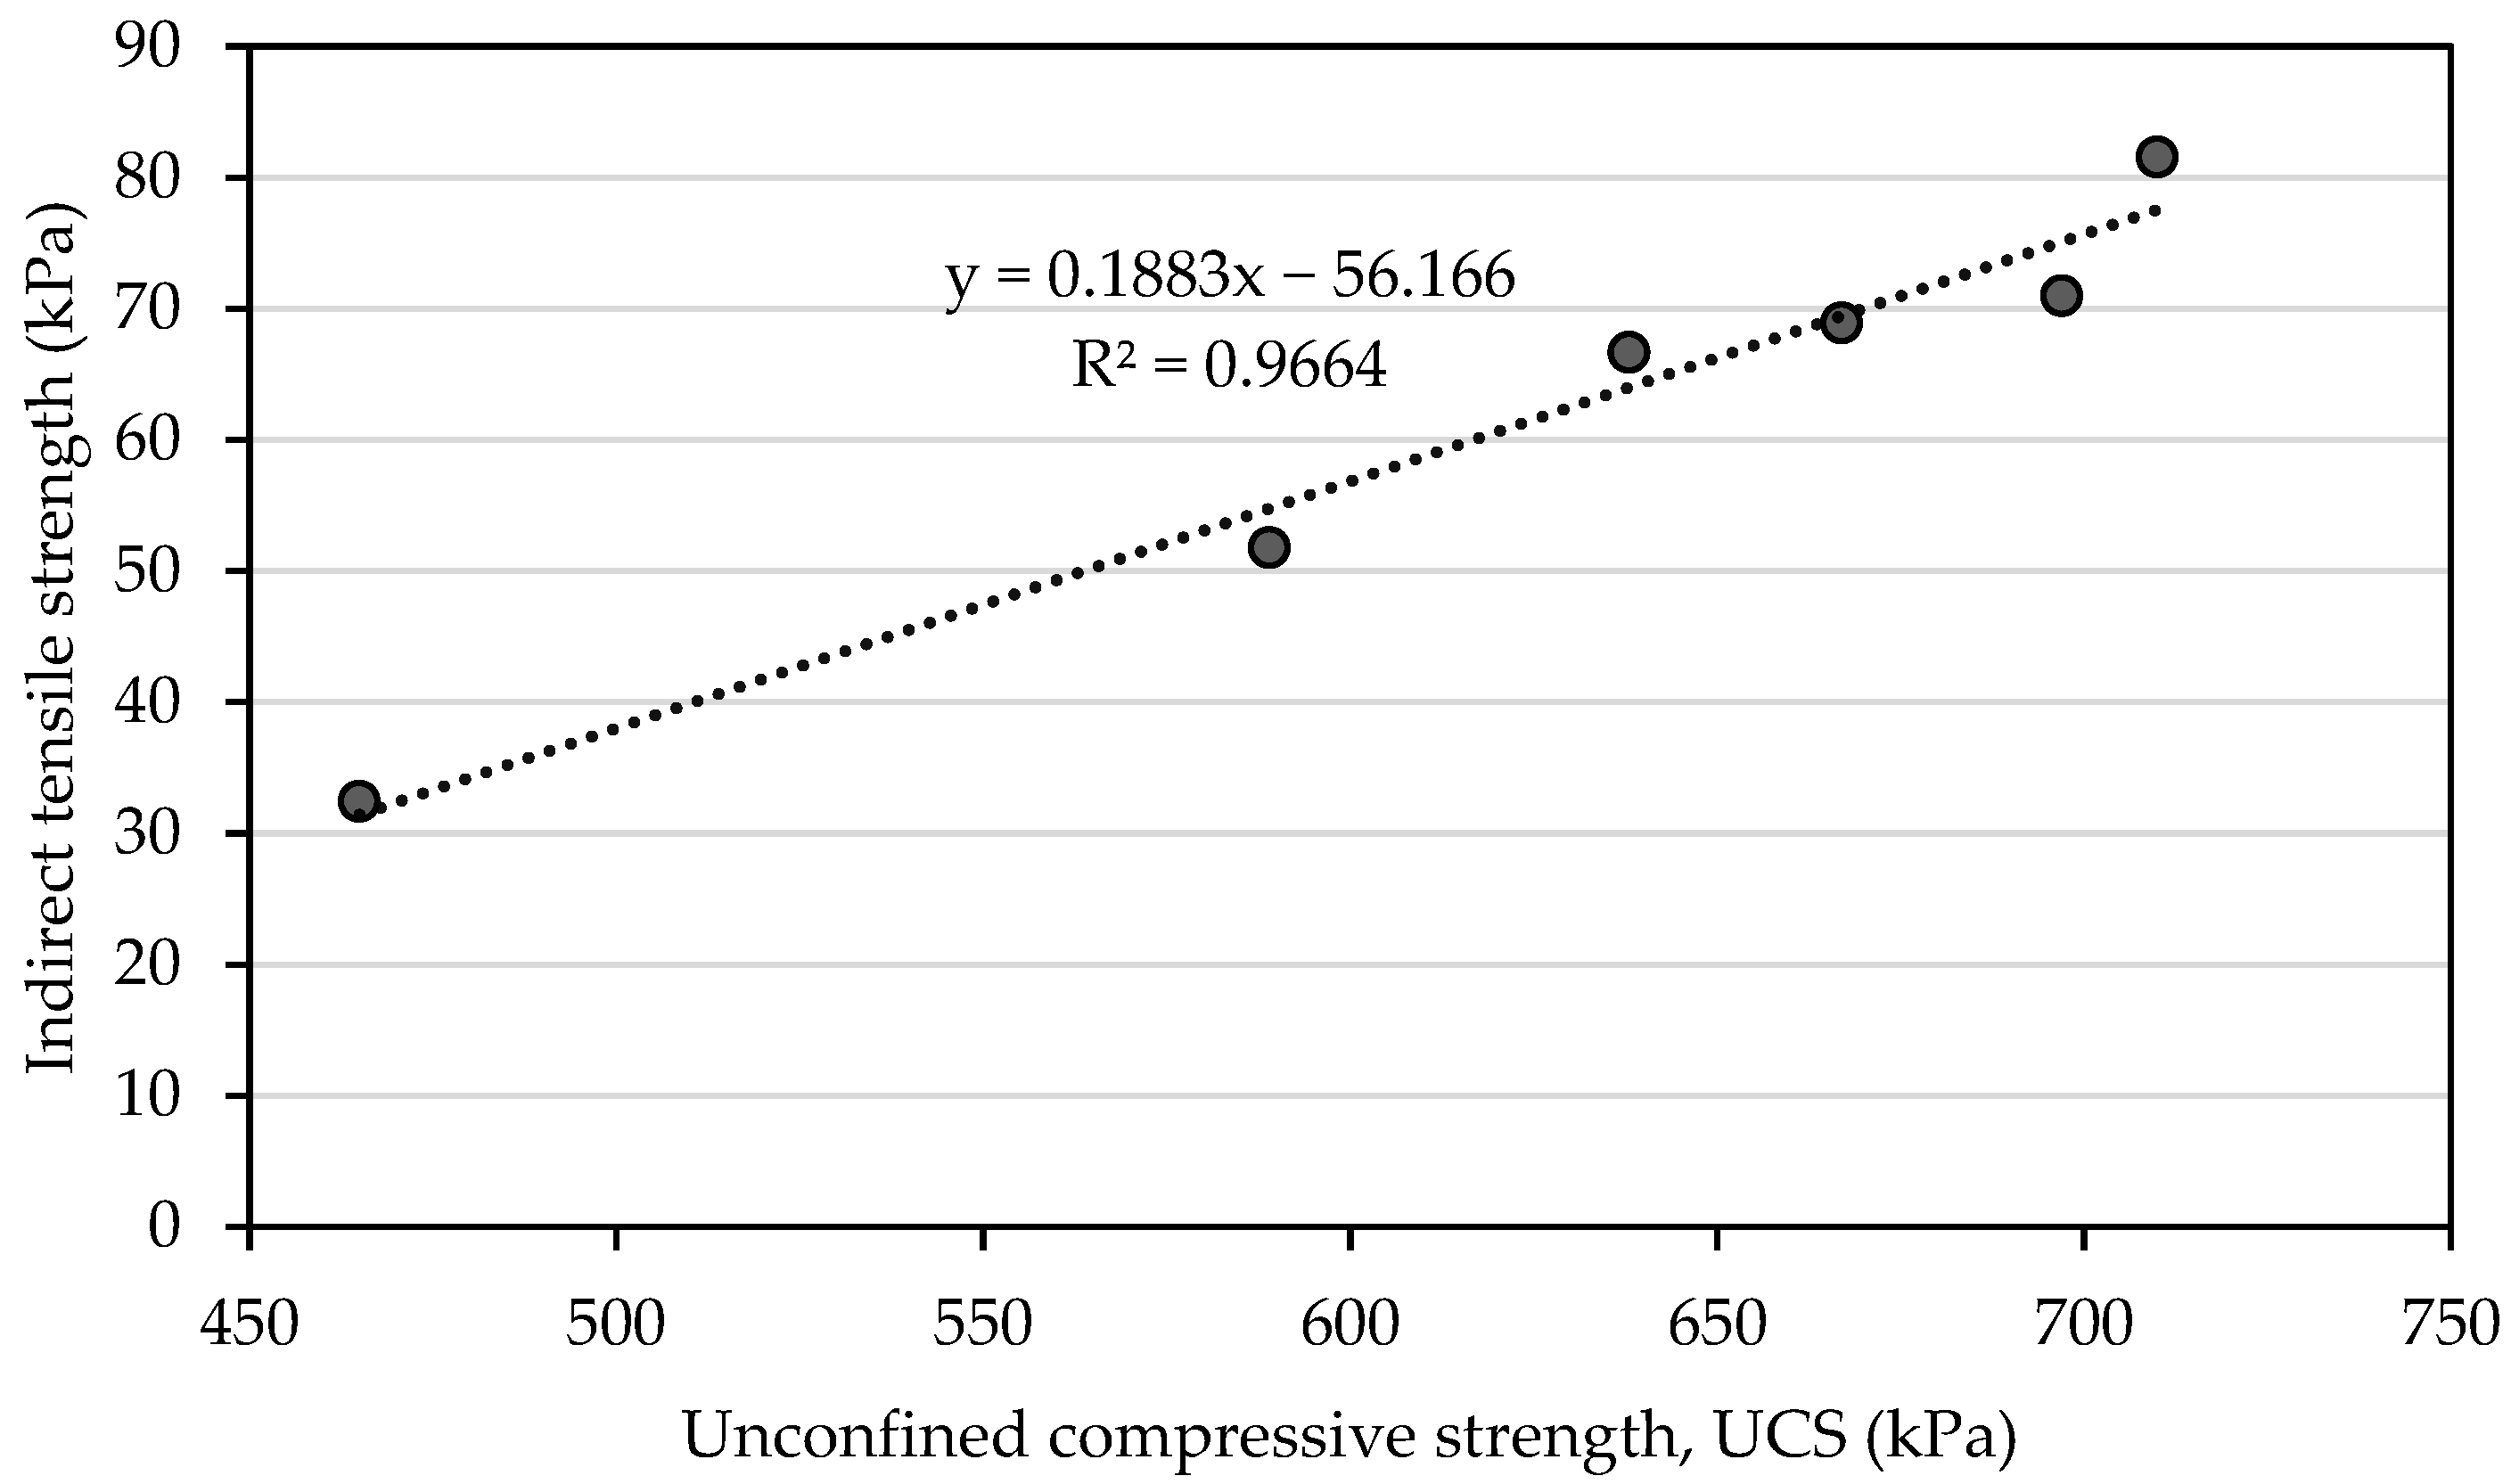
- The mechanical strength for UCS, ITS, and FS improved when the optimum percentage of tile waste (15%) was added. The addition of 15% tile waste indicated the highest UCS values and strength improvements of 27.45%, 27.89%, and 26.97% at 7, 28, and 90 days of curing time, respectively. Meanwhile, the ITS and FS values also increased with the addition of the optimum percentage of tile waste. Any addition beyond the optimum tile waste content indicated a decrement in strength due to excessive tile waste content in the soil samples without a pozzolanic reaction.
- The SEM and XRD data analysis for ATW15 showed that a crystalline compound (Brucite and Bavenite) had formed on the soil sample’s surface, which played a crucial role in mechanical strength development. The similarities between tile waste and granular soils can significantly impact the internal friction angle of the original soil, treating it as a filler and binder that chemically reacts with soil components. The physical interaction between soil, tile waste particles, and crystallised compounds plays a vital role in this improvement. These interactions create cohesive structures and affect the strength of the soil through the interfacial zone.
Author Contributions
Funding
Institutional Review Board Statement
Informed Consent Statement
Data Availability Statement
Conflicts of Interest
References
- Zhou, S.; Wang, B.; Shan, Y. Review of research on high-speed railway subgrade settlement in soft soil area. Railw. Eng. Sci. 2020, 28, 129–145. [Google Scholar] [CrossRef]
- Gue, S.S.; Gue, C.S. Geotechnical Challenges on Soft Ground. JCEST 2022, 13, 84–96. [Google Scholar] [CrossRef]
- Wanyan, Y.; Abdallah, I.; Nazarian, S.; Puppala, A.J. Expert System for Design of Low-Volume Roads over Expansive Soils. Transp. Res. Rec. J. Transp. Res. Board 2010, 2154, 81–90. [Google Scholar] [CrossRef]
- Hasan, M.; Zaini, M.S.I.; Yie, L.S.; Masri, K.A.; Putra Jaya, R.; Hyodo, M.; Winter, M.J. Effect of optimum utilisation of silica fume and eggshell ash to the engineering properties of expansive soil. J. Mater. Res. Technol. 2021, 14, 1401–1418. [Google Scholar] [CrossRef]
- Wilson dos Santos Ferreira, J.; Casagrande, M.; Teixeira, R. Sample dimension effect on cement-stabilized sandy soil mechanical behaviour. Soils Rocks 2022, 45, 1–10. [Google Scholar] [CrossRef]
- Hillary, E.; Pakir, F.; Ab Aziz, N.A.; Madun, A. The Effectiveness of Demolished Tile Material for Soil Improvement: A Review. IOP Conf. Ser. Mater. Sci. Eng. 2021, 1144, 012071. [Google Scholar] [CrossRef]
- Bell, F.G. Lime stabilization of clay minerals and soils. Eng. Geol. 1996, 42, 223–237. [Google Scholar] [CrossRef]
- Bassani, M.; Tefa, L.; Russo, A.; Palmero, P. Alkali-activation of recycled construction and demolition waste aggregate with no added binder. Constr. Build. Mater. 2019, 205, 398–413. [Google Scholar] [CrossRef]
- Ezreig, A.M.A.; Mohamad Ismail, M.A.; Ehwailat, K.I.A. Hydrophobic Effect of Soil Stabilization for a Sustainable Subgrade Soil Improvement. Materials 2022, 15, 3087. [Google Scholar] [CrossRef]
- Chen, J.A.; Idusuyi, F.O. Effect of waste ceramic dust (WCD) on index and engineering properties of shrink-swell soils. Int. J. Eng. Mod. Technol. 2015, 1, 1–11. [Google Scholar]
- Debrah, J.K.; Vidal, D.G.; Dinis, M.A.P. Raising Awareness on Solid Waste Management through Formal Education for Sustainability: A Developing Countries Evidence Review. Recycling 2021, 6, 6. [Google Scholar] [CrossRef]
- Wu, W.; Xie, L.; Hao, J.L. An integrated trading platform for construction and demolition waste recovery in a circular economy. Sustain. Chem. Pharm. 2022, 25, 100597. [Google Scholar] [CrossRef]
- Vargas, M.; Alfaro, M.; Karstegl, N.; Fuertes, G.; Gracia, M.D.; Mar-Ortiz, J.; Sabattin, J.; Duran, C.; Leal, N. Reverse Logistics for Solid Waste from the Construction Industry. Adv. Civ. Eng. 2021, 2021, 6654718. [Google Scholar] [CrossRef]
- Agil, R.; Kumar, A. Experimental Study on Replacement of Cement with Ceramic Tile Powder in Concrete. Int. J. Res. Appl. Sci. Eng. Technol. 2017, 5, 1814–1818. [Google Scholar] [CrossRef]
- Daniyal, M.; Ahmad, S. Application of Waste Ceramic Tile Aggregates in Concrete. Int. J. Innov. Res. Sci. Eng. Technol. 2015, 4, 12808–12815. [Google Scholar]
- Alzhanova, G.Z.; Aibuldinov, Y.K.; Iskakova, Z.B.; Khabidolda, S.M.; Abdiyussupov, G.G.; Omirzak, M.T.; Murali, G.; Vatin, N.I. Development of Environmentally Clean Construction Materials Using Industrial Waste. Materials 2022, 15, 5726. [Google Scholar] [CrossRef] [PubMed]
- Anting, N.; Din, M.F.M.; Ponraj, M.; Jungan, K.; Taib, S.M.; Iwao, K.; Chelliapan, S.; Ubukata, N. Physical and chemical characterization of wasted tiles as coating materials for pavement surface temperature reduction. Malays. J. Civ. Eng. 2014, 26, 446–455. [Google Scholar]
- Yang, J.; Jiang, P.; Nassar, R.-U.-D.; Suhail, S.A.; Sufian, M.; Deifalla, A.F. Experimental investigation and AI prediction modelling of ceramic waste powder concrete–An approach towards sustainable construction. J. Mater. Res. Technol. 2023, 23, 3676–3696. [Google Scholar] [CrossRef]
- Ray, S.; Rahman, M.M.; Haque, M.; Hasan, M.W.; Alam, M.M. Performance evaluation of SVM and GBM in predicting compressive and splitting tensile strength of concrete prepared with ceramic waste and nylon fiber. J. King Saud Univ.-Eng. Sci. 2023, 35, 92–100. [Google Scholar] [CrossRef]
- Abduli, M.A. Industrial waste management in Tehran. Environ. Int. 1996, 22, 335–341. [Google Scholar] [CrossRef]
- Mohammed Babalghaith, A.; Koting, S.; Ramli Sulong, N.H.; Karim, M.R.; Mohammed AlMashjary, B. Performance evaluation of stone mastic asphalt (SMA) mixtures with palm oil clinker (POC) as fine aggregate replacement. Constr. Build. Mater. 2020, 262, 120546. [Google Scholar] [CrossRef]
- James, J.; Pandian, P.K. Industrial Wastes as Auxiliary Additives to Cement/Lime Stabilization of Soils. Adv. Civ. Eng. 2016, 2016, 1267391. [Google Scholar] [CrossRef]
- Trinh, L.T.K.; Hu, A.H.; Pham Phu, S.T. Situation, Challenges, and Solutions of Policy Implementation on Municipal Waste Management in Vietnam toward Sustainability. Sustainability 2021, 13, 3517. [Google Scholar] [CrossRef]
- Onakunle, O.; Omole, D.O.; Ogbiye, A.S. Stabilization of lateritic soil from Agbara Nigeria with ceramic waste dust. Cogent Eng. 2019, 6, 1710087. [Google Scholar] [CrossRef]
- Al-Bared, M.A.M.; Marto, A.; Latifi, N.; Horpibulsuk, S. Sustainable Improvement of Marine Clay Using Recycled Blended Tiles. Geotech. Geol. Eng. 2018, 36, 3135–3147. [Google Scholar] [CrossRef]
- Al-Bared, M.; Harahap, I.; Marto, A. Sustainable strength improvement of soft clay stabilized with two sizes of recycled additive. Int. J. GEOMATE 2018, 15, 39–46. [Google Scholar] [CrossRef]
- Sumayya, K.P.; Rafeequedheen, M.; Sameer, V.T.; Firoz Khais, P.T.; Jithin, K. Stabilization of expansive soil treated with tile waste. Int. J. Civ. Eng. 2016, 3, 67–75. [Google Scholar] [CrossRef]
- Cabalar, A.F.; Hassan, D.I.; Abdulnafaa, M.D. Use of waste ceramic tiles for road pavement subgrade. Road Mater. Pavement Des. 2016, 18, 882–896. [Google Scholar] [CrossRef]
- Rani, T.G.; Shivanarayana, C.; Prasad, D.D.; Raju, P. Strength Behaviour of Expansive Soil Treated with Tile Waste. Int. J. Res. Dev. 2014, 10, 52–57. [Google Scholar]
- Sabat, A. Stabilization of expansive soil using waste ceramic dust. Electron. J. Geotech. Eng. 2012, 17, 3915–3926. [Google Scholar]
- Al-Bared, M.A.M.; Marto, A.; Latifi, N. Utilization of Recycled Tiles and Tyres in Stabilization of Soils and Production of Construction Materials–A State-of-the-Art Review. KSCE J. Civ. Eng. 2018, 22, 3860–3874. [Google Scholar] [CrossRef]
- ASTM C 618; Standard Specification for Coal Fly Ash and Raw or Calcined Natural Pozzolan for Use as a Mineral Admixture in Concrete, Annual Book of ASTM Standards, Vol.04.02. American Society for Testing and Materials: Philadelphia, PA, USA, 2004.
- Safiuddin, M.; Moshiur, R.; Salam, M.; Hafizan, M.I.; Jumaat, Z. Properties of Self-Consolidating Palm Oil Fuel Ash Concrete. Adv. Sci. Lett. 2012, 17, 312–319. [Google Scholar] [CrossRef]
- ASTM D 4318-17e1; Standard Test Methods for Liquid Limit, Plastic Limit, and Plasticity Index of Soils. ASTM International: West Conshohocken, PA, USA, 2017.
- Sridharan, A.; Puvvadi, S. Mini Compaction Test Apparatus for Fine Grained Soils. Geotech. Test. J. 2005, 28, 240–246. [Google Scholar] [CrossRef]
- Loi, S.J.; Anandan, S.; Tan, Y.S.; Raghunandan, M.E. Compaction Characteristics of Kaolin Reinforced with Raw and Rubberized Oil Palm Shell. Minerals 2020, 10, 863. [Google Scholar] [CrossRef]
- ASTM D2166-13; Standard Test Method for Unconfined Compressive Strength of Cohesive Soil. American Society for Testing and Materials Standards: West Conshohocken, PA, USA, 2016.
- Dexter, A.R.; Kroesbergen, B. Methodology for determination of tensile strength of soil aggregates. J. Agric. Eng. Res. 1985, 31, 139–147. [Google Scholar] [CrossRef]
- Anggraini, V. Reinforcement Effects of Nano-Modified Coir Fibres on Lime-Treated Marine Clay. Ph.D. Thesis, Universiti Putra Malaysia, Serdang, Malaysia, 2015. [Google Scholar]
- ASTM D 1635; Standard Test Method for Flexural Strength of Soil-Cement Using Simple Beam with Third-Point Loading. American Society for Testing Materials Standards: West Conshohocken, PA, USA, 2012.
- Rathor, A.P.P.S.; Pathak, D.; Saini, R. Stabilization of Expansive Soil Using Waste Ceramic Tile Dust. ECS Trans. 2022, 107, 19011–19018. [Google Scholar] [CrossRef]
- Elsawy, M.B. Performance of sand dunes in stabilizing highly expansive soil. J. GeoEng. 2021, 16, 023–034. [Google Scholar]
- Kollaros, G.; Athanasopoulou, A. SAND AS A SOIL STABILIZER. Bull. Geol. Soc. Greece 2017, 50, 770. [Google Scholar] [CrossRef]
- Solanki, P.; Zaman, M. Behavior of Stabilized Subgrade Soils under Indirect Tension and Flexure. J. Mater. Civ. Eng. 2014, 26, 833–844. [Google Scholar] [CrossRef]
- Suksun, H. Strength and Microstructure of Cement Stabilized Clay. In Scanning Electron Microscopy; Viacheslav, K., Ed.; IntechOpen: Rijeka, Croatia, 2012; pp. 439–460. [Google Scholar]
- Mehta, A.; Siddique, R. Sustainable geopolymer concrete using ground granulated blast furnace slag and rice husk ash: Strength and permeability properties. J. Clean. Prod. 2018, 205, 49–57. [Google Scholar] [CrossRef]
- Mutitu, D.; Muthengia, J.; Mwirichia, R.; Thiong’o, J.; Munyao, O.; Genson, M. Microbial Effect on Water sorptivity and Sulphate ingress by Bacillus megaterium on mortars prepared using Portland Pozzolana cement. J. Appl. Microbiol. 2020, 131, 528–542. [Google Scholar] [CrossRef] [PubMed]
- Moretti, L.; Natali, S.; Tiberi, A.; D’Andrea, A. Proposal for a Methodology Based on XRD and SEM-EDS to Monitor Effects of Lime-Treatment on Clayey Soils. Appl. Sci. 2020, 10, 2569. [Google Scholar] [CrossRef]
- Unluer, C.; Al-Tabbaa, A. The role of brucite, ground granulated blastfurnace slag, and magnesium silicates in the carbonation and performance of MgO cements. Constr. Build. Mater. 2015, 94, 629–643. [Google Scholar] [CrossRef]
- Garbev, K.; Stemmermann, P.; Black, L.; Breen, C.; Yarwood, J.; Gasharova, B. Structural features of C–S–H (I) and its carbonation in air—A Raman spectroscopic study. Part I: Fresh phases. J. Am. Ceram. Soc. 2007, 90, 900–907. [Google Scholar] [CrossRef]


| Properties | Values |
|---|---|
| Specific gravity, Gs | 2.50 |
| Atterberg limits | |
| Liquid limit, LL (%) | 52 |
| Plastic limit, PL (%) | 22 |
| Plasticity index, PI (%) | 30 |
| Mechanical properties | |
| Optimum moisture content, OMC (%) | 26 |
| Maximum dry density, MDD (Mg/m3) | 1.46 |
| Unconfined compressive strength, UCS (kPa) | 557 |
| Chemical Composition | Content (%) | |
|---|---|---|
| Soil | Tile Waste | |
| SiO2 | 64.70 | 71.68 |
| CaO | 0.02 | 1.10 |
| Fe2O3 | 6.91 | 2.38 |
| Al2O3 | 17.83 | 17.00 |
| Na2O | 0.13 | 3.45 |
| SO3 | 6.85 | 0.03 |
| MgO | 0.72 | 1.00 |
| K2O | 1.34 | 2.28 |
| TiO2 | 1.10 | 0.38 |
| LOI (loss on ignition) | 10.8 | 1.33 |
| Group Series | Sample Code | Samples | Curing Days |
|---|---|---|---|
| S | S | Natural Soil | 7, 28, & 90 |
| ATW | ATW5 | soil + 5% Tile Waste | 7, 28, & 90 |
| ATW10 | soil + 10% Tile Waste | 7, 28, & 90 | |
| ATW15 | soil + 15% Tile Waste | 7, 28, & 90 | |
| ATW20 | soil + 20% Tile Waste | 7, 28, & 90 | |
| ATW30 | soil + 30% Tile Waste | 7, 28, & 90 | |
| ATW40 | soil + 40% Tile Waste | 7, 28, & 90 |
| Mixture | UCS Value at the Curing Time, kPa | ||
|---|---|---|---|
| 7 Days | 28 Days | 90 Days | |
| S (untreated soil) | 489 | 512 | 574 |
| ATW5 | 616 | 638 | 671 |
| ATW10 | 632 | 697 | 717 |
| ATW15 (optimum) | 674 | 710 | 786 |
| ATW20 | 626 | 667 | 710 |
| ATW30 | 492 | 589 | 606 |
| ATW40 | 366 | 465 | 572 |
| Mixture | Compound | Formula/Elements | S-Q (%) |
|---|---|---|---|
| S (untreated soil) | Quartz | Si3.00O6.00 | 45 |
| Illite | K2.00Al4.00Si8.00O24.00 | 48 | |
| Kaolinite | Al8.00Si8.00O36.00 | 7 | |
| ATW15 (optimum) | Quartz | Si3.00O6.00 | 29 |
| Brucite | Mg1.00O2.00H2.00 | 3 | |
| Bavenite | Ca16.00Si36.00Be12.00Al4.00O112.00H12.00 | 67 |
Disclaimer/Publisher’s Note: The statements, opinions and data contained in all publications are solely those of the individual author(s) and contributor(s) and not of MDPI and/or the editor(s). MDPI and/or the editor(s) disclaim responsibility for any injury to people or property resulting from any ideas, methods, instructions or products referred to in the content. |
© 2023 by the authors. Licensee MDPI, Basel, Switzerland. This article is an open access article distributed under the terms and conditions of the Creative Commons Attribution (CC BY) license (https://creativecommons.org/licenses/by/4.0/).
Share and Cite
Md Isa, M.H.; Koting, S.; Hashim, H.; Aziz, S.A.; Mohammed, S.A. Structural Characteristics and Microstructure Analysis of Soft Soil Stabilised with Fine Ground Tile Waste. Materials 2023, 16, 5261. https://doi.org/10.3390/ma16155261
Md Isa MH, Koting S, Hashim H, Aziz SA, Mohammed SA. Structural Characteristics and Microstructure Analysis of Soft Soil Stabilised with Fine Ground Tile Waste. Materials. 2023; 16(15):5261. https://doi.org/10.3390/ma16155261
Chicago/Turabian StyleMd Isa, Mohd Hafizan, Suhana Koting, Huzaifa Hashim, Salsabila Ab Aziz, and Syakirah Afiza Mohammed. 2023. "Structural Characteristics and Microstructure Analysis of Soft Soil Stabilised with Fine Ground Tile Waste" Materials 16, no. 15: 5261. https://doi.org/10.3390/ma16155261